Article

Validation of a Microstructure-Based Model for Predicting the High Strain Rate Flow Properties of Various Forms of Additively Manufactured Ti6Al4V(ELI) Alloy

1
Department of Mechanical and Mechatronics Engineering, Central University of Technology, Free State, Bloemfontein 9301, South Africa
2
Centre for Rapid Prototyping and Manufacturing, Faculty of Engineering, Built Environment and Information Technology, Central University of Technology, Free State, Bloemfontein 9301, South Africa
*
Author to whom correspondence should be addressed.
Metals 2021, 11(10), 1628; https://doi.org/10.3390/met11101628
Submission received: 7 September 2021 / Revised: 30 September 2021 / Accepted: 7 October 2021 / Published: 13 October 2021
(This article belongs to the Special Issue Computational Methods in Metal Manufacturing Processes)

Abstract

:
To increase the acceptance of direct metal laser sintered Ti6Al4V(Extra Low Interstitial—ELI) in industry, analytical models that can quantitatively describe the interrelationships between the microstructural features, field variables, such as temperature and strain rate, and the mechanical properties are necessary. In the present study, a physical model that articulates the critical microstructural features of grain sizes and dislocation densities for use in predicting the mechanical properties of additively manufactured Ti6Al4V(ELI) was developed. The flow stress curves of different microstructures of the alloy were used to obtain and refine the parameters of the physical model. The average grain size of a microstructure was shown to influence the athermal part of yield stress, while the initial dislocation density in a microstructure was seen to affect the shape of the flow stress curve. The viscous drag effect was also shown to play a critical role in explaining the upturn of flow stress at high strain rates. The microstructure-based constitutive model developed and validated in this article using experimental data showed good capacity to predict the high strain rate flow properties of additively manufactured Ti6Al4V(ELI) alloy.

1. Introduction

Over the past few years, additive manufacturing (AM) technology has matured from initial usage in production of prototypes to production of full functional components for use in biomedical and aerospace industries [1,2]. The use of AM in the medical industry is highly motivated by the ability of the technology to fabricate highly demanded, sophisticated, and customized biomedical implants for use in patients with certain special needs [3]. Besides the ability of the technology to produce complex and topology optimised parts for use in the aircraft, it also improves the buy-to-fly ratio. This is generally the ratio between the mass of raw material needed for production of a given component to the final mass of the manufactured part. The use of traditional manufacturing processes such as machining and forging in manufacturing of large aircraft parts could result to a buy-to-fly ratio in the range of 12:1–25:1, while for AM it is 2:1 [4,5]. Therefore, the use of AM results in comparatively much higher efficiency in the utilization of material that saves the overall cost of production. A wide range of materials are currently being produced by different AM technologies such as metals and their alloys, polymers, ceramics, and composites [3].
Ti6Al4V is the most widely used alloy of titanium in aerospace industry and big players in this industry such as Boeing, General Electrics, Airbus, and Roll Royce have shifted focus towards manufacturing of parts made from this alloy using various AM technologies [1]. The mechanical properties of as-built Ti6Al4V(Extra Low Interstitial—ELI) produced by the direct metal laser sintered (DMLS) process, one of the AM technologies, are not sufficient for use in aircraft structures. For instance, the impact toughness of the as-built DMLS Ti6Al4V(ELI) parts is approximately 48% lower than the value specified in America Society of Metals for use in aircraft structures [6,7]. The as-built DMLS Ti6Al4V(ELI) is essentially almost free from pores with densification measuring approximately 100% [8]. This high densification suggests the lack of a need to subject the DMLS parts to hot isostatic pressing treatment. The DMLS process also results in relatively rough surfaces, like that of sand casting, which is typically in the range Ra ≈ 9–12 μm [9]. Consequently, the rough surfaces of these parts act as sites for initiation of microcracks, thus lowering the fracture strength of parts [9,10]. Acid etching, surface polishing, and machining can all be used to effectively improve the surface roughness and, therefore, the fracture strength of these AM parts.
The microstructure of the as-built DMLS Ti6Al4V(ELI) normally comprises columnar prior β grains with their interior filled with needle shaped α’-martensitic microstructure. This microstructure is formed during rapid solidification and a high cooling rate, resulting from steep thermal gradients associated with the DMLS process. The steep thermal gradients also induce residual stresses in as-built parts, which negatively affects the toughness of the parts or even leads to geometric distortions and failure at low loads. Due to the high residual stresses and α’-martensitic microstructure, the as-built DMLS Ti6Al4V(ELI) parts are characterised by high yield strength, low ductility, poor fracture toughness, and low impact toughness [11,12]. To improve the mechanical properties, and therefore the reliability of the DMLS parts, there is a need to expose them to post process heat treatment to remove the residual stresses and achieve desirable microstructures with suitable mechanical properties.
Generally, the microstructure of Ti6Al4V(ELI) is greatly affected by heat treatment, and various heat treatment cycles will result in various forms of the alloy with distinct mechanical properties [13,14]. Either of these microstructures also contains multiple variables, which compete and/or synergistically enhance the mechanical properties of the alloy [15]. For instance, according to the Hall–Petch relationship [16], decreasing the grain size will increase the yield strength of a material if other variables are not a design consideration; however, this comes at a cost of decrease in ductility and toughness. A review of literature has shown that the average grain size and dislocation density of any given microstructure of Ti6Al4V play a critical role in determining the point of yield and plastic flow of the alloy [17,18]. There are other external factors such as prevailing level of strain rate and temperature that affect the yield stress and subsequent plastic flow of metals and alloys. High strain rate increases the generation and interaction of dislocations causing a higher instantaneous strain hardening and increased subsequent flow stress [17,19]. On the other hand, at elevated temperatures, the generation of dislocations is countered by their annihilation, a phenomenon commonly referred to as thermal softening, leading to a decrease of flow stress [17,18,19].
There is a need to fast track the acceptance and increase the utility of DMLS Ti6Al4V(ELI) for use as a structural material in aircraft turbo engines and landing gear beams. To this end, constitutive models can be used to predict the mechanical properties of various microstructures resulting from different heat treatment strategies applied to this alloy. Such material models could also be useful in modelling and simulation tests, for instance, those of landing gear dynamics and fan blade-off containment. This is very important since simulation is the cornerstone of all aircraft load analysis. In the present study, an advanced constitutive relationship is developed to provide a macroscopic description of the flow properties of various microstructures of DMLS Ti6Al4V(ELI) at varying levels of strain rate and temperature. The formulated constitutive model is sensitive to the microstructure in that the effects of the average grain size and initial dislocation density on the deformation behaviour of DMLS Ti6Al4V(ELI) are explicitly articulated. The model is validated using the experimental flow stress curves of various forms of DMLS Ti6Al4V(ELI) from the authors’ previous work published in [20].

2. Materials and Methods

To verify and validate microstructural-based constitutive laws that can accurately predict the yield strength and subsequent flow stress of DMLS Ti6Al4V(ELI) over a wide range of field variables, some experimental tests were designed and based on the tests analysed and published in [20,21]. Generally, the tests were subdivided into three main areas that include the following:
Production of test samples and generation of various microstructures of the alloys by heat treatment.
Microstructural characterization quantifying critical microstructural features.
Design of mechanical tests that were used to generate stress–strain curves for a wide range of the field-state variables of strain rate and temperature.

2.1. Production and Heat Treatment of Test Specimens

All the test specimens were produced using gas-atomised spherical Ti6Al4V(ELI) (ASTM grade 23) alloy powder, through the DMLS process. The alloy powder was supplied by TLS Technik GmbH (Bitterfeld-Wolfen, Germany) with the chemical composition (wt.%) determined in [22] as the following: Al 6.34, V 3.944, Fe 0.25, O 0.082, C 0.006, N 0.006, H 0.00, and the balance Ti. The alloy powder had an average diameter of <40 µm (D10, D50, D90). The EOSINT M 280 DMLS machine (EOS GmbH, Munich, Germany), with process parameters set as shown in Table 1, was used to fabricate samples for this study.
A total of 24 cylindrical rods, each with a diameter and length of 6 mm and 80 mm, respectively, were fabricated for use in the present research. All the manufactured samples were first stress relieved in a vacuum chamber at 650 °C, with a residence time of 3 h, and then furnace cooled to room temperature. They were later subdivided into three groups designated as samples C, D, and E for exposure to different heat treatment cycles in a SuperSeriesTM vacuum furnace system Model SS12-24/13MX (T-M Vacuum Products, Inc., Cinnaminson, NJ, USA) with a horizontal vacuum chamber. Samples designated C were heat treated at 800 °C for 2.5 h and then furnace-cooled to room temperature. Samples designated D were duplex annealed at 940 °C for 2 h then furnace cooled, followed by heat treatment at 750 °C for 2 h, and then finally furnace cooling. Samples designated E were heat treated above the β-transformation temperature at 1020 °C for 2.5 h and then furnace cooled to room temperature. The criteria for selection of these heat treatment cycles and the microstructure obtained can be found in [21].

2.2. Microstructural Characterisation and Quantification of Critical Microstructure Features

The critical microstructural features of the heat-treated DMLS Ti6Al4V(ELI) samples, which influence the flow properties of the alloy, were determined. These included the average α-lath thickness and the density of dislocations in microstructures obtained from every heat treatment cycle. Optical and scanning electron microscope were used to determine the average thicknesses of α-laths, while the dislocation densities in these microstructures were obtained by way of X-ray diffraction (XRD). The results obtained this way can be found in [21].

2.3. Experimental Tests to Obtain Stress-Strain Curves at Various Strain Rates and Temperatures

The compression Split Hopkinson Pressure Bar (SHPB) test was used to obtain the flow stress curves of various forms of DMLS Ti6Al4V(ELI) for a wide range of strain rates and temperatures. The SHPB compression test specimens were cut from heat-treated samples C, D, and E. The specimens were cylindrical in geometry with a diameter and a height of 6 mm. The tests were conducted at three different strain rates of 750 s−1, 1500 s−1, and 2450 s−1. The tests at each strain rate were conducted at three different temperatures of 25 °C, 200 °C, and 500 °C. At least three sets of specimens were loaded at each strain rate and temperature. The flow stress curves obtained from these tests were reported in [20].

3. A Constitutive Model for DMLS Ti6Al4V(ELI)

A good constitutive model to account for microstructural variables should be of such a nature as to provide a bridge between sub-microscale phenomena and macroscale continuum mechanics. The model should connect the morphological aspects of microstructure to the stress–strain relationships of the material as a function of the prevailing magnitudes of field variables (strain, strain rate, and temperature). The logical flow of such a model is shown in Figure 1.
The envisaged microstructural variable-based model can be classified into three parts for the following: (a) prediction of yield strength, (b) subsequent prediction of strain hardening, and (c) prediction of viscous drag stress at high strain rate. The total stress is then obtained from the summation of these three components of stress.

3.1. Prediction of the Yield Stress

The Hall–Petch equation [16] was used to determine the yield stress ( σ y ) of the various forms of DMLS Ti6Al4V(ELI) as a function of grain size based on Equation (1):
σ y = σ i + K H P / d = σ i + σ a
where the symbol σ i stands for the lattice friction stress or critical resolved shear stress to initiate slip along slip planes in grains/phases. The second term of Equation (1) is independent of temperature and strain rate and is an athermal component of stress ( σ a ). The symbol K H P is a material constant and d is the average grain size of the α-phase, which is the average width across grains for equiaxed grains and the average thickness of the α-laths in case of lamellar microstructure.
It is important to note that the strength of the α-phase is higher in comparison to that of the β-phase [23]. Taking the α/β lamellar microstructure as an example, the β-phase fills in the small gaps between α-lamellae. Consequently, during plastic deformation, these interfaces (β-phase) usually act as barriers to the motion of dislocations causing a pile-up of dislocations and creation of stress concentration. In other words, plastic deformation will initiate in the α-grains, and with subsequent strain hardening, plastic flow starts on the adjacent α-grains upon transference of slip across the β-phase (interphase) [24,25]. Thus, the characteristic Hall–Petch mechanisms are likely to occur in the α-phase rather than the β-phase [25], and it may be speculated that the α/β interface and β layers themselves are analogous to grain boundaries in a single-phase material. Therefore, the Hall–Petch mechanism was assumed here to be controlled by the properties and thickness of the α-laths/platelets, and the contribution of the β-phase to the Hall–Petch mechanism was ignored [26].
The component σ i in Equation (1) is sensitive to temperature and strain rate. In other words, energy must be provided to initiate slip and for dislocations to overcome the barriers (short-range obstacles) they encounter during slip [27]. The lattice friction stress ( σ i ) decreases with increase in temperature up to a critical temperature ( T c ), above which there is enough thermal energy to overcome barriers by thermal activation alone. Furthermore, a rise in applied strain rate will increase the yield stress and shift the critical temperature ( T c ) to higher temperatures [28]. Therefore, the yield stress is dependent on strain rate and temperature through the lattice friction stress and can be expressed as [29]:
σ y ( ε ˙ , T ) = σ a + ( S σ i ) μ ( T ) μ o
where the symbol S is the temperature and strain rate-dependent scaling factor of the yield stress, μ(T) is the shear modulus dependence on temperature, and μ o is the shear modulus at absolute zero temperature (0 K). The thermal stress ( σ i ), which is part of the yield stress, can be expressed by combination of the existing relation between free energy and the mechanical threshold stress (MTS) and the Arrhenius-type equation as follows [30,31]:
σ i = σ o ( 1 ( ( k b T Δ G ) l n   ε ˙ o ε ˙ ) 1 q ) 1 p = σ o ( 1 ( ( k b T g 0 i μ b 3 ) l n   ε ˙ o ε ˙ ) 1 q ) 1 p
where the symbol σ o is the MTS, or value of the thermal stress at 0 K, Δ G is the activation energy for deformation, k b is the Boltzmann’s constant (1.38 × 10⁻²³ J/K), b is the Burgers vector (taken as 2.95 × 10⁻¹⁰ m for Ti6Al4V) [14], and p , q , and ε ˙ o are the fitting constants, respectively. The term g o i in the equation is a material constant of proportionality for Δ G   μ b 3 and is reported in [28], and it is generally the normalised activation energy for dislocations to overcome the intrinsic barrier(s) or to unpin dislocations from impurities or solutes [19]. From Equations (2) and (3), the strain rate–temperature scaling factor ( S ) can be expressed as follows [28,29,30].
S = ( 1 ( k b T g 0 i μ b 3 l n ε ˙ o ε ˙ ) 1 q ) 1 p
Thus, from Equations (1), (2), and (4), the function of yield stress dependent on strain rate and temperature can be expressed as:
σ y = ( μ ( T ) μ 0 ) σ o ( 1 ( ( k b T g 0 i μ ( T ) b 3 ) l n   ε ˙ o ε ˙ ) 1 q ) 1 p + K H P d  

3.2. Strain Hardening and Prediction of Flow Stress

The proposed model for work hardening and flow stress starts from the point that the flow stress is a function of the average dislocation density as expressed in the Taylor model [32]. Inelastic deformation is controlled by shear stresses. The Taylor factor M , is used to relate the shear flow stress τ of a single crystal to the uniaxial flow stress σ of a polycrystal; thus, the uniaxial form of the Taylor equation can be written as [33]:
σ = α μ ( T ) b M ρ
where the symbols α is a dimensionless parameter of magnitude ranging from 0.2 to 0.4 for different materials [18]. The symbol μ stands for the shear modulus, which is dependent on temperature (T), and ρ is the average dislocation density. At the onset of plastic flow and for subsequent work hardening, the rate of strain hardening, d σ / d ε p , for polycrystalline material can be derived by differentiating Equation (6) and can be written as [30]:
d σ d ε p = α μ ( T ) b M   d d ε p ρ
Thus, determination of the strain-hardening rate requires an expression for the term   d ρ / d ε p . During deformation of materials, the accumulation of dislocations is countered by their annihilation or what is commonly known as dynamic recovery. The annihilation of dislocations leads to a decrease in their density as part of what is termed as thermal softening. At the saturation limit of flow stress, the accumulation and recovery terms are assumed to be equal. The flow stress starts decreasing when the term for dynamic recovery becomes greater than the term for accumulation (i.e.,   d ρ r e c o v e r y > d ρ a c c u m u l a t i o n ). Annihilation is mainly a thermally activated process. However, during gliding of dislocations at low temperature, dislocations annihilate mutually with dislocations of opposite sign approaching on closely neighbouring glide planes [34].
From Equation (7), the following single differential equation with separate terms for the generation (k1 factor) and annihilation (k2 factor) of dislocations can be used to define the evolution of dislocation density with plastic strain, ε p , as proposed in [30]:
d ρ d ε p = ( k 1 ρ k 2 ρ )
The expression of the flow stress with plastic strain, as represented by Equation (6), requires an expression of the average dislocation-density rate, which is obtained from the integration of Equation (8). The assumption in the present study is that the accumulation of dislocations (strain-hardening rate) in Ti6Al4V alloy is mildly dependent on temperature and strain rate, while the rate of annihilation of dislocations is strongly dependent on both [35]. In other words, the term for production of dislocations, k 1 ρ in Equation (8), is associated with the athermal storage of moving dislocations, which are known to become immobilised after having moved a length proportional to the mean spacing between the dislocations. The length travelled by these dislocations is known as the mean free path of dislocations ( L ).
Further assumptions are made here that the mean free path of dislocation is the space between impenetrable obstacles (sinks of dislocation) such as grain boundaries. Thus, one may reasonably argue that the mean free path of dislocations, L, is proportional to a characteristic length, such as the average grain size for a material. Consequently, the term describing the rate of accumulation of dislocations becomes constant, thus allowing Equation (8) to be rewritten as [36,37]:
d ρ d ε p = ( h k 2 ρ )
where the constant   h = k 1 ρ stands for the athermal work-hardening coefficient, while the parameter k 2 specifies the rate of annihilation of dislocations at a given temperature and strain rate. The increase of dislocation density in a material with plastic strain requires evaluation of the integral for Equation (9), which allows for the increase/decrease of flow stress with plastic strain to be evaluated from Equation (6). Details of the integration of Equation (9) are presented in Appendix A [38], which culminates in the following equation for the increase in flow stress with plastic strain:
σ f = α μ ( T ) b M ( h k 2   ( 1 exp ( k 2 ε p   ) ) + ρ o exp ( k 2 ε p ) ) 1 2
where the term ρ o stands for the initial dislocation density of a given microstructure.

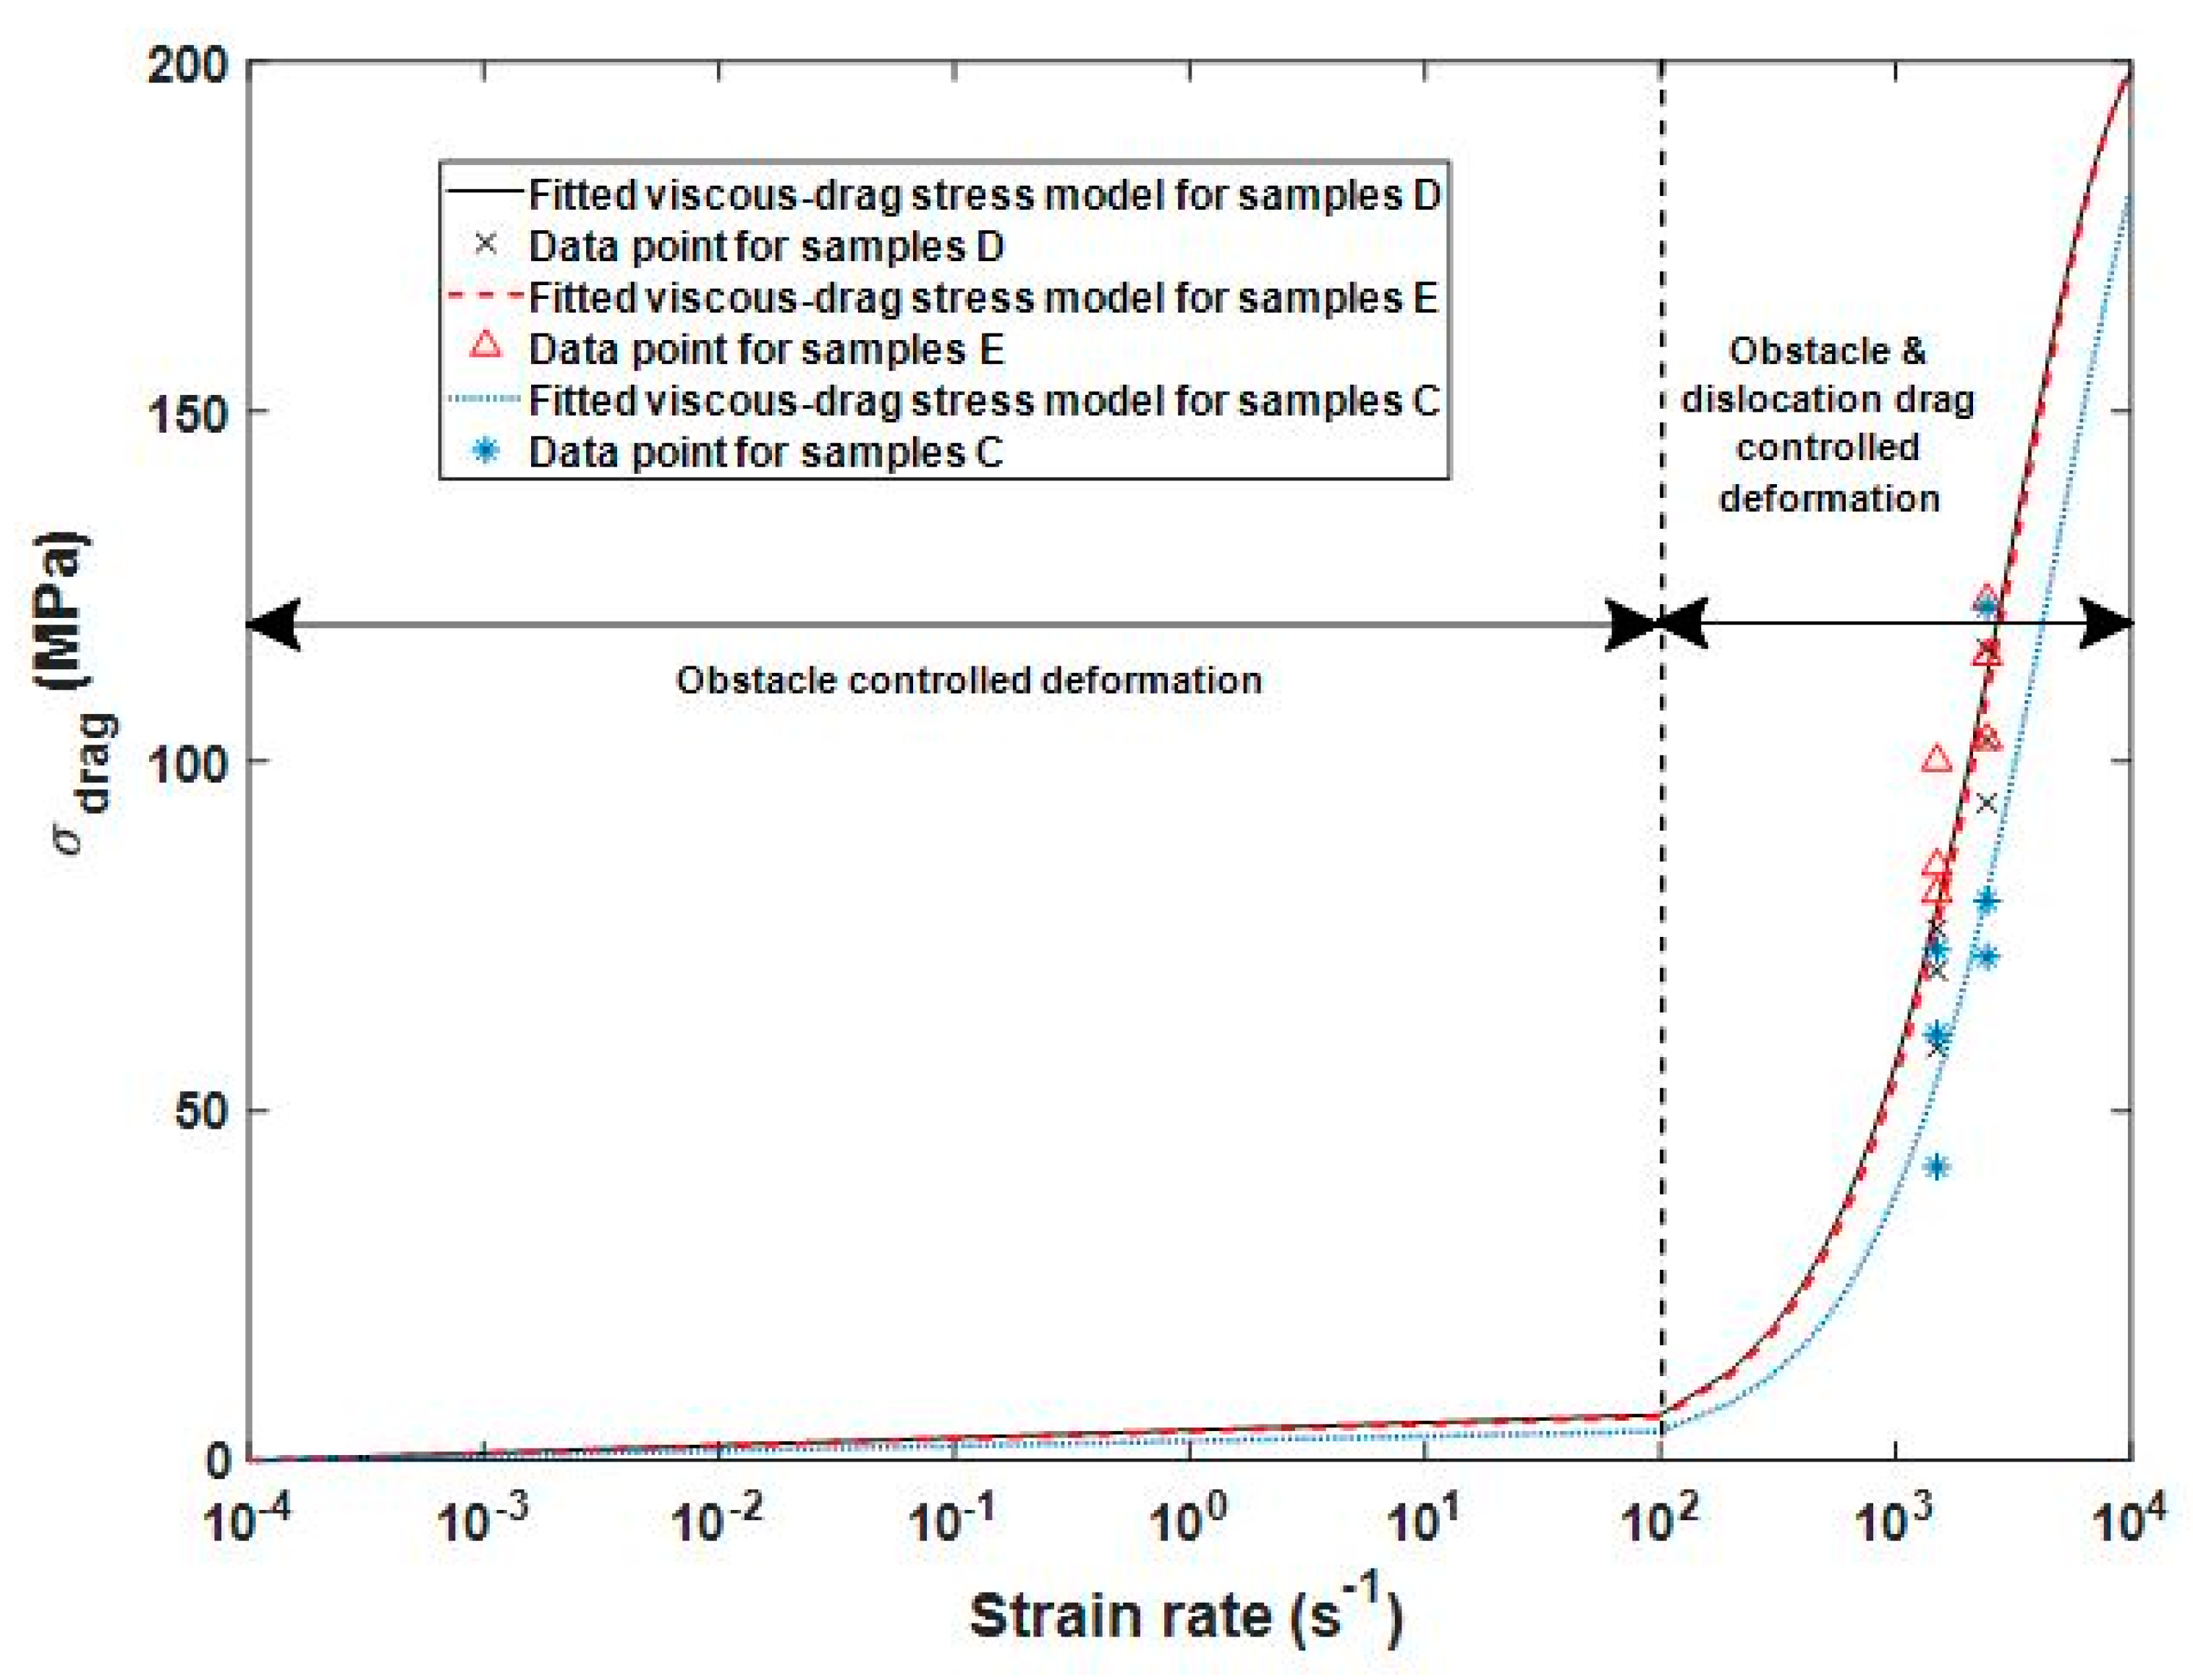
3.3. Prediction of Viscous Drag Stress

To increase the predictive capability of the model developed in this research, a viscous drag component of stress is incorporated in the model to predict the deformation process of Ti6Al4V(ELI) at high strain rates. This component is assumed to be additive to the athermal component of yield stress since the viscous drag effect resists the flow of dislocations and, therefore, increases the yield stress and subsequent flow stress. Generally, dislocation drag springs from electrons and phonons in materials and has a retarding effect on the moving dislocations as a Newtonian drag force [39,40]. Because of viscous drag, the kinetic energy of dislocations is reduced, which otherwise would help overcome obstacles, and more external force is thus required to keep the dislocations in motion. Therefore, by the introduction of a viscous drag component to the model, the physical mechanism behind the upturn of yield and flow stress at high strain rates can be accommodated. Other studies have investigated the effects of viscous drag on the motion of dislocations in closed packed structures and found that it has a profound influence [40,41,42].
The viscous drag stress as a function of strain rate can be expressed as [41,42]:
σ d r a g ( ε ˙ p ) = ζ . ( 1 e x p ( χ . ε ˙ p ) )
χ = ( M 2 . μ d ρ m . b 2 . σ a )
where the symbol χ represents the effective damping coefficient influencing the motion of dislocations, while ζ is a material constant, both used as viscous drag curve-fitting parameters. The symbols M , σ a ,   μ d , b ,   ρ m   represent the Taylor factor, athermal stress, the drag coefficient, Burgers vector, and mobile dislocation density, respectively.

4. Results and Discussion

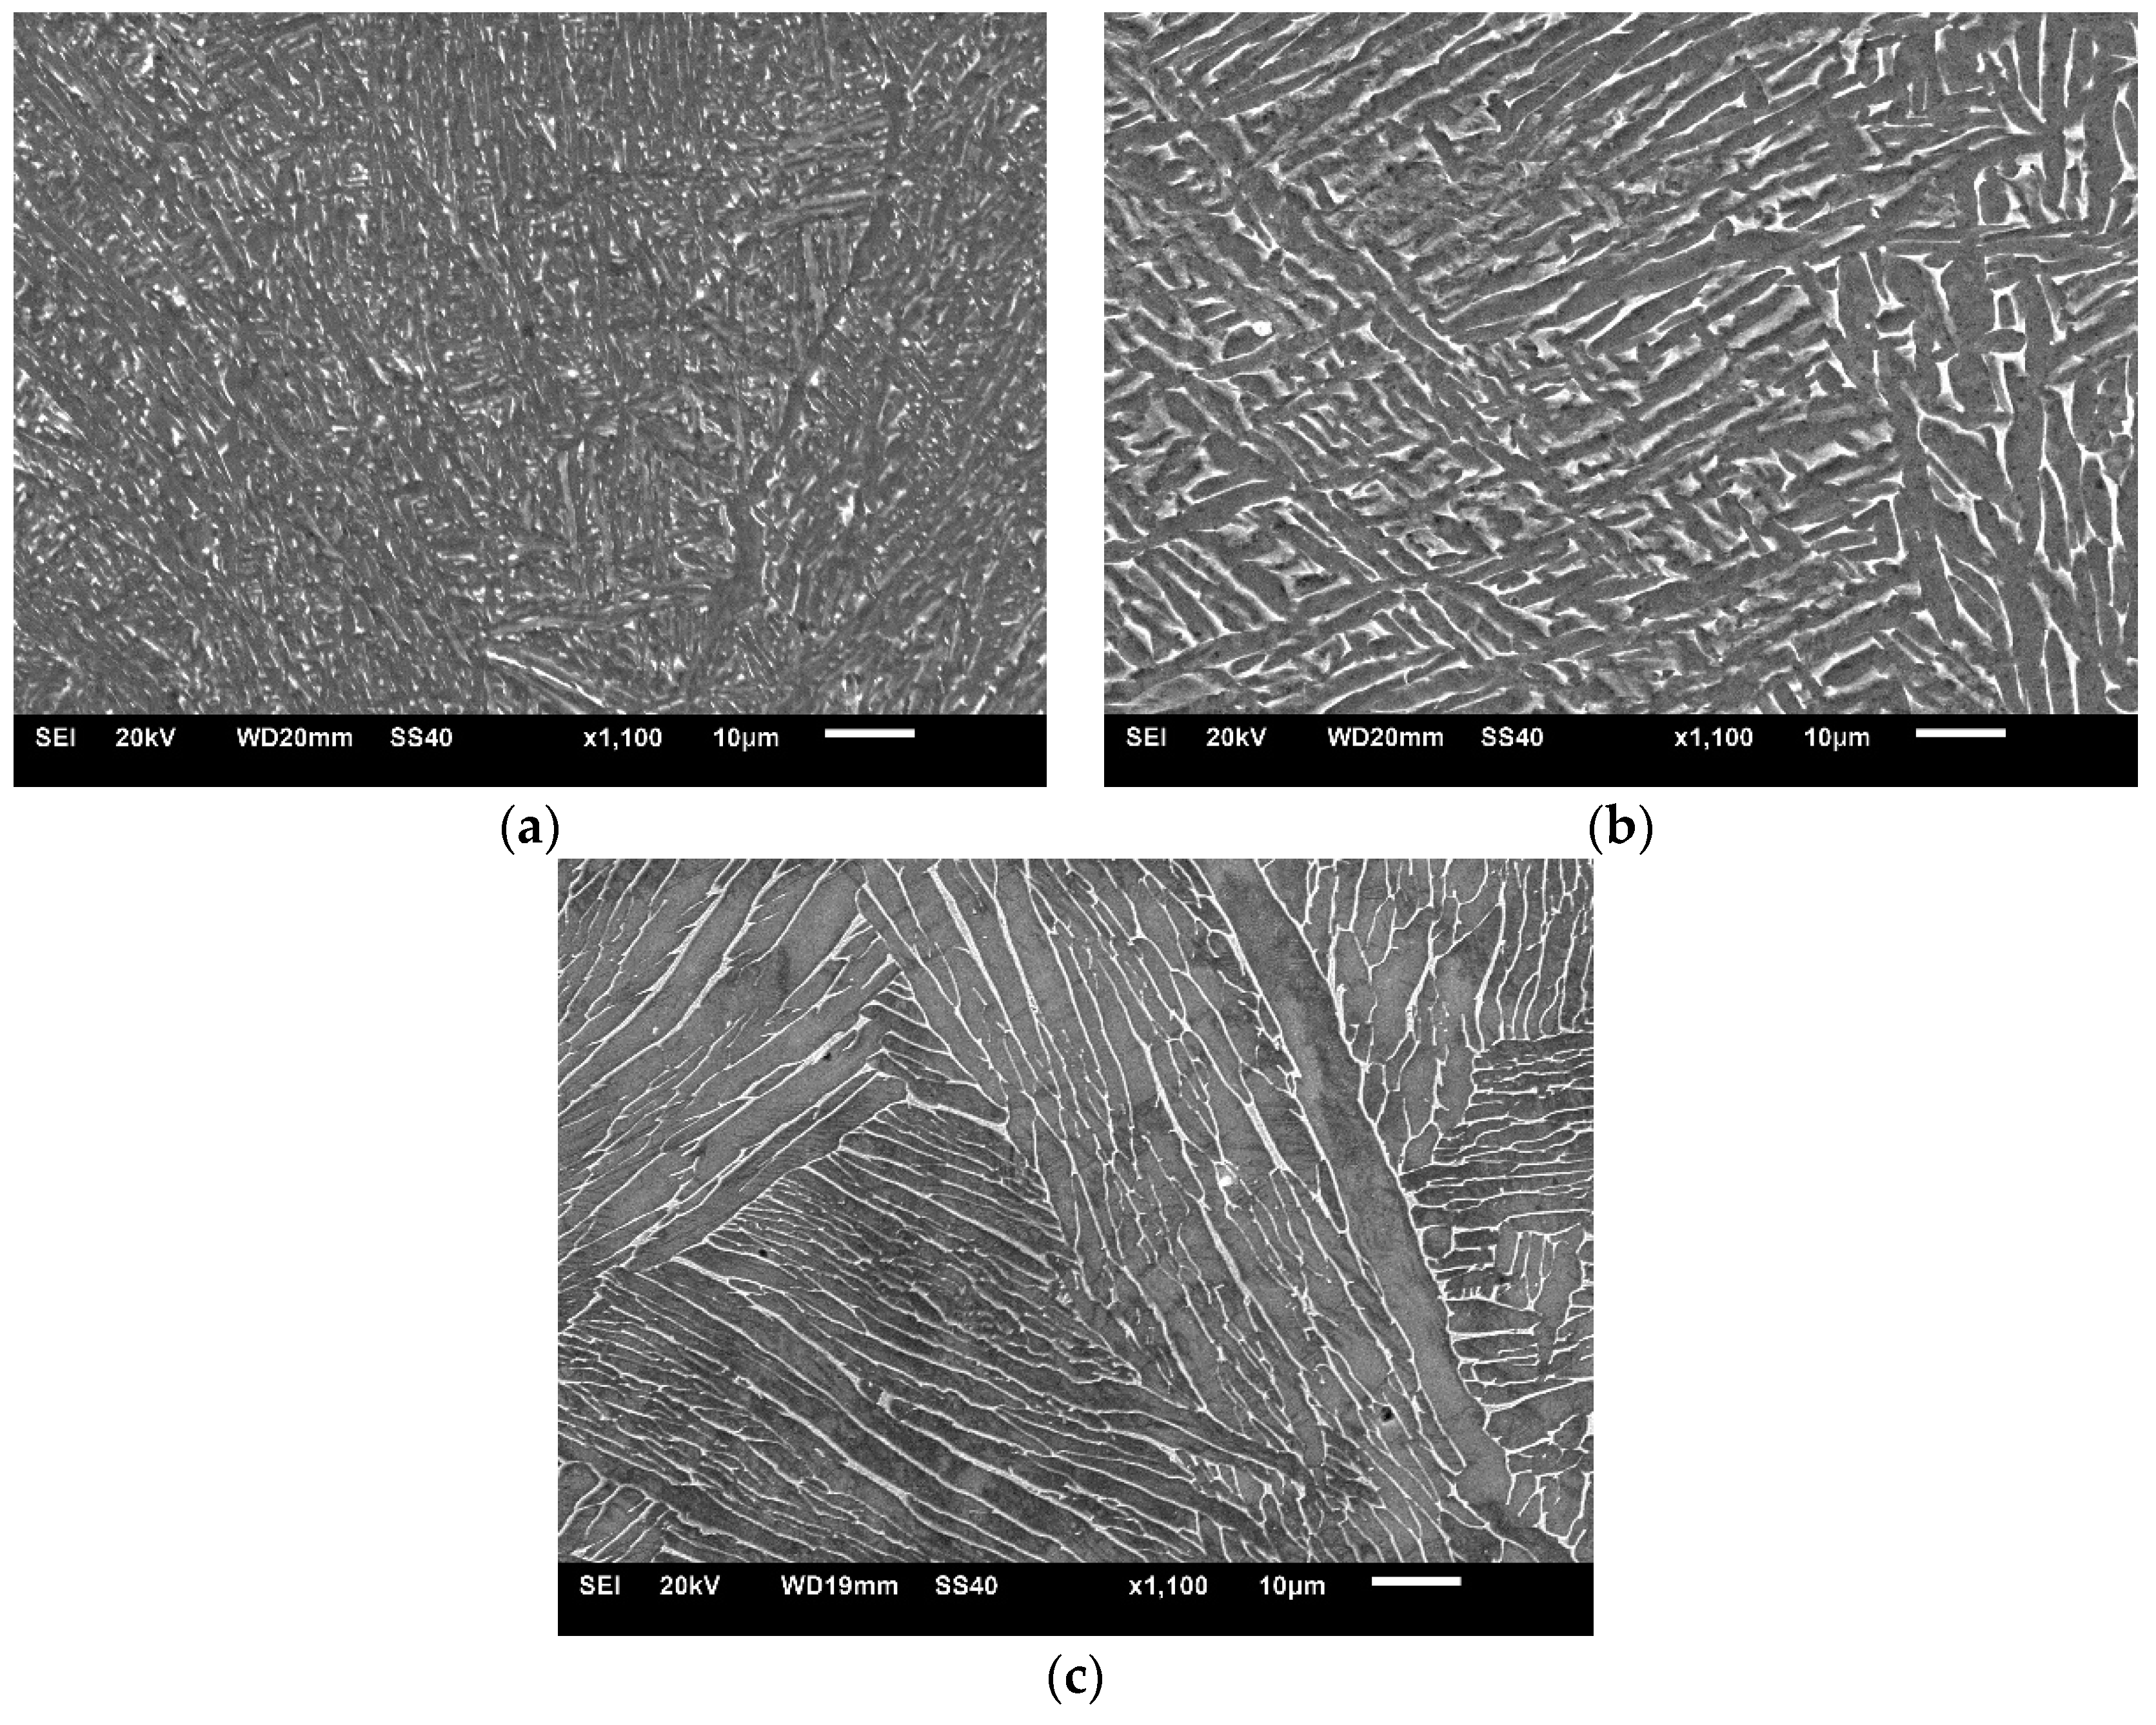
4.1. The Microstructures of Various Forms DMLS Ti6Al4V(ELI) Alloy

Figure 2 shows the microstructures of DMLS Ti6Al4V(ELI) alloy after being exposed to different heat treatment cycles described in Section 2.1. The β-phase is seen in the micrographs in Figure 2 as brighter regions that are rich in vanadium, while regions that are low in vanadium content (α-phase) appear darker. The contrast of the α- and β-phases in the secondary electron image (SEI) is associated with different crystallographic orientations of these phases (hexagonal closed packed (hcp) structure for α-phase and body centred crystal (bcc) structure for β-phase). The β-phase in the particle and lamellar-like morphology in sample C, seen in Figure 2a, is uniformly distributed in the α-matrix. The α-laths for sample C have an average width of about 2.5 µm. The shape of the α/β-grains for sample D seen in Figure 2b is more lamellae-like compared to partial particle like morphology in sample C. The α-laths in sample D have an average thickness of about 6 µm. Sample E, seen in Figure 2c, is characterised by typical Widmanstätten structure with large α colonies. The thickness of the α-laths within these colonies ranged between 7 and 15 µm, while the average thickness of these laths was determined through the line-intercept method as 9 µm. The volume fraction of β-phase in samples C, D, and E was determined as 3.6%, 6.4%, and 6.6%, respectively, by the method of X-ray diffraction [21]. Further details of these microstructures presented in Figure 2 can be found in the authors’ previous work in [20,21,43].

4.2. Calibration and Refinement of the Model Parameters

This section presents the results of refinement and validation of the microstructural variable-based constitutive model developed here, using the flow stress curves of DMLS Ti6Al4V(ELI) at given strain rate and temperature reported in [20]. The total flow stress for various forms of DMLS Ti6Al4V(ELI) for a wide range of strain rate and temperature is the sum of yield stress and the stress due to strain hardening and viscous drag effects, thus:
σ = ( μ ( T ) μ 0 ) σ o ( 1 ( ( k b T g 0 i μ ( T ) b 3 ) l n   ε ˙ o ε ˙ ) 1 q ) 1 p + ζ . ( 1 e x p ( χ   . ε ˙ p ) ) + K H P d + α μ ( T ) b M ( h k 2   ( 1 e x p ( k 2 ε p   ) ) + ρ o e x p ( k 2 ε p ) ) 1 2
This physical description of flow stress contains many adjustable parameters that can easily be tuned to fit experimental curves. Some of the parameters are categorized as “prescribed’’ and others as “fitted”. Among the prescribed parameters are those that were obtained from metallographic analysis of samples C, D, and E, such as the average grain size found in [20,21] and dislocation density found in [21], while others were obtained from the literature.

4.2.1. Effects of the Average Grain Size

The grain size d   determines the maximum distance that dislocations travel before encountering an obstacle, defined by the thickness of α laths of Ti6A4V. The Hall–Petch equation for Ti6Al4V(ELI) for a wide range of grain sizes, taking K H P as 0.328 MPa.m1/2 [26], is shown in Figure 3. Owing to the low volume fraction of β-phase recorded in the three different sample types, C (3.6%), D (6.4%), and E (6.6%), of the DMLS Ti6Al4V(ELI) [21], the contribution of the β-phase to athermal stress in this study was ignored. As noted in Section 3.1, it was assumed that the β layers themselves act like typical grain boundaries in a single-phase material. The average thicknesses of the α-laths of samples C, D, and E, as seen in Figure 2 and reported in [20,21], are 2.5 μm, 6.0 μm, and 9.0 μm, respectively. As seen in the insert labels in Figure 3, the contribution of the athermal stress to the yield strength for the three different microstructures of DMLS Ti6Al4V(ELI) is 207.45 MPa, 133.91 MPa, and 109.33 MPa for samples C, D, and E, respectively.

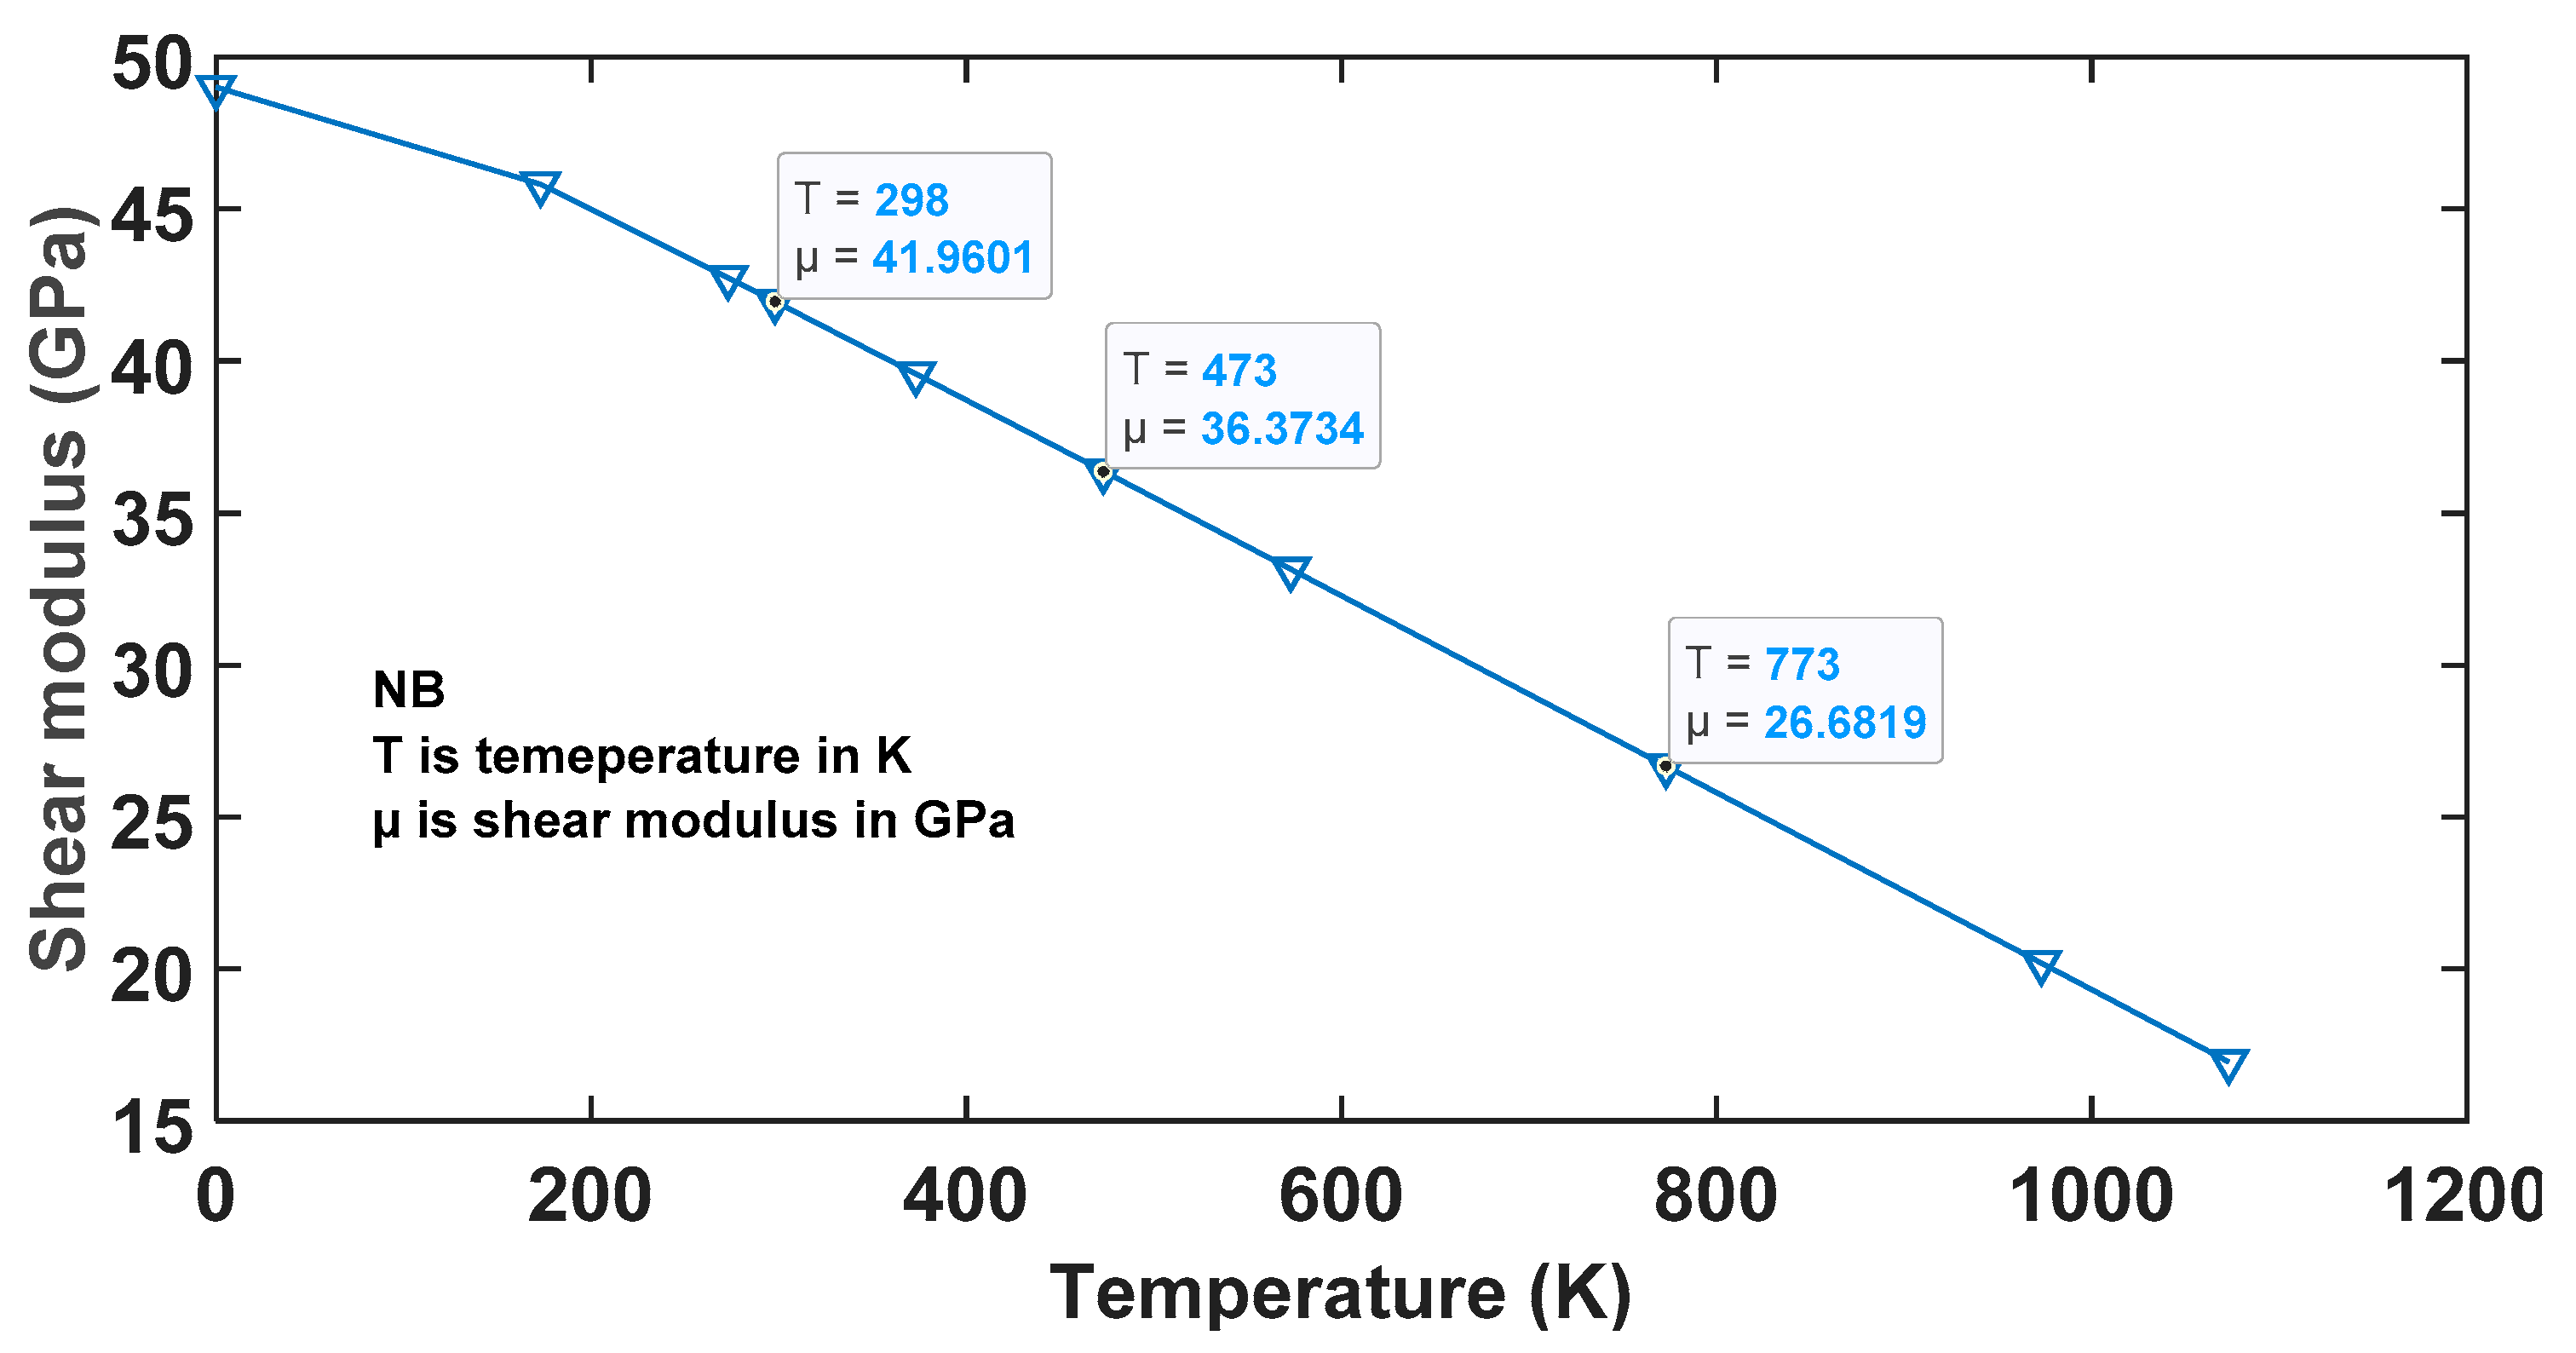
4.2.2. Temperature-Dependent Shear Modulus

The empirical temperature-dependent shear modulus of materials is often of the form [17,19]:
μ ( T ) = μ o D e x p ( T 0 T ) 1 ( G P a )
where μ o is the shear modulus at 0   K , and T o and D are material constants. For Ti6Al4V, these parameters have values of 49.02 GPa, 181 K, and 5.821, respectively [30]. From the fact that the Ti6Al4V (grade 5) and Ti6Al4V(ELI) (grade 23) do not show a significant difference in elastic properties [44], the constants used in Picu and Majorell [19] were adopted in the present research. Thus, the formulation for the shear modulus of Ti6Al4V(ELI) becomes:
μ ( t ) = 49.02 5.821 e x p ( 181 T ) 1   ( G P a )
Figure 4 shows the shear modulus of Ti6Al4V(ELI) as a function of temperature.
The values of shear moduli of this alloy on the curve in this figure, at the test temperatures of 25 °C, 200 °C, and 500 °C, are shown in the insert labels of the figure.

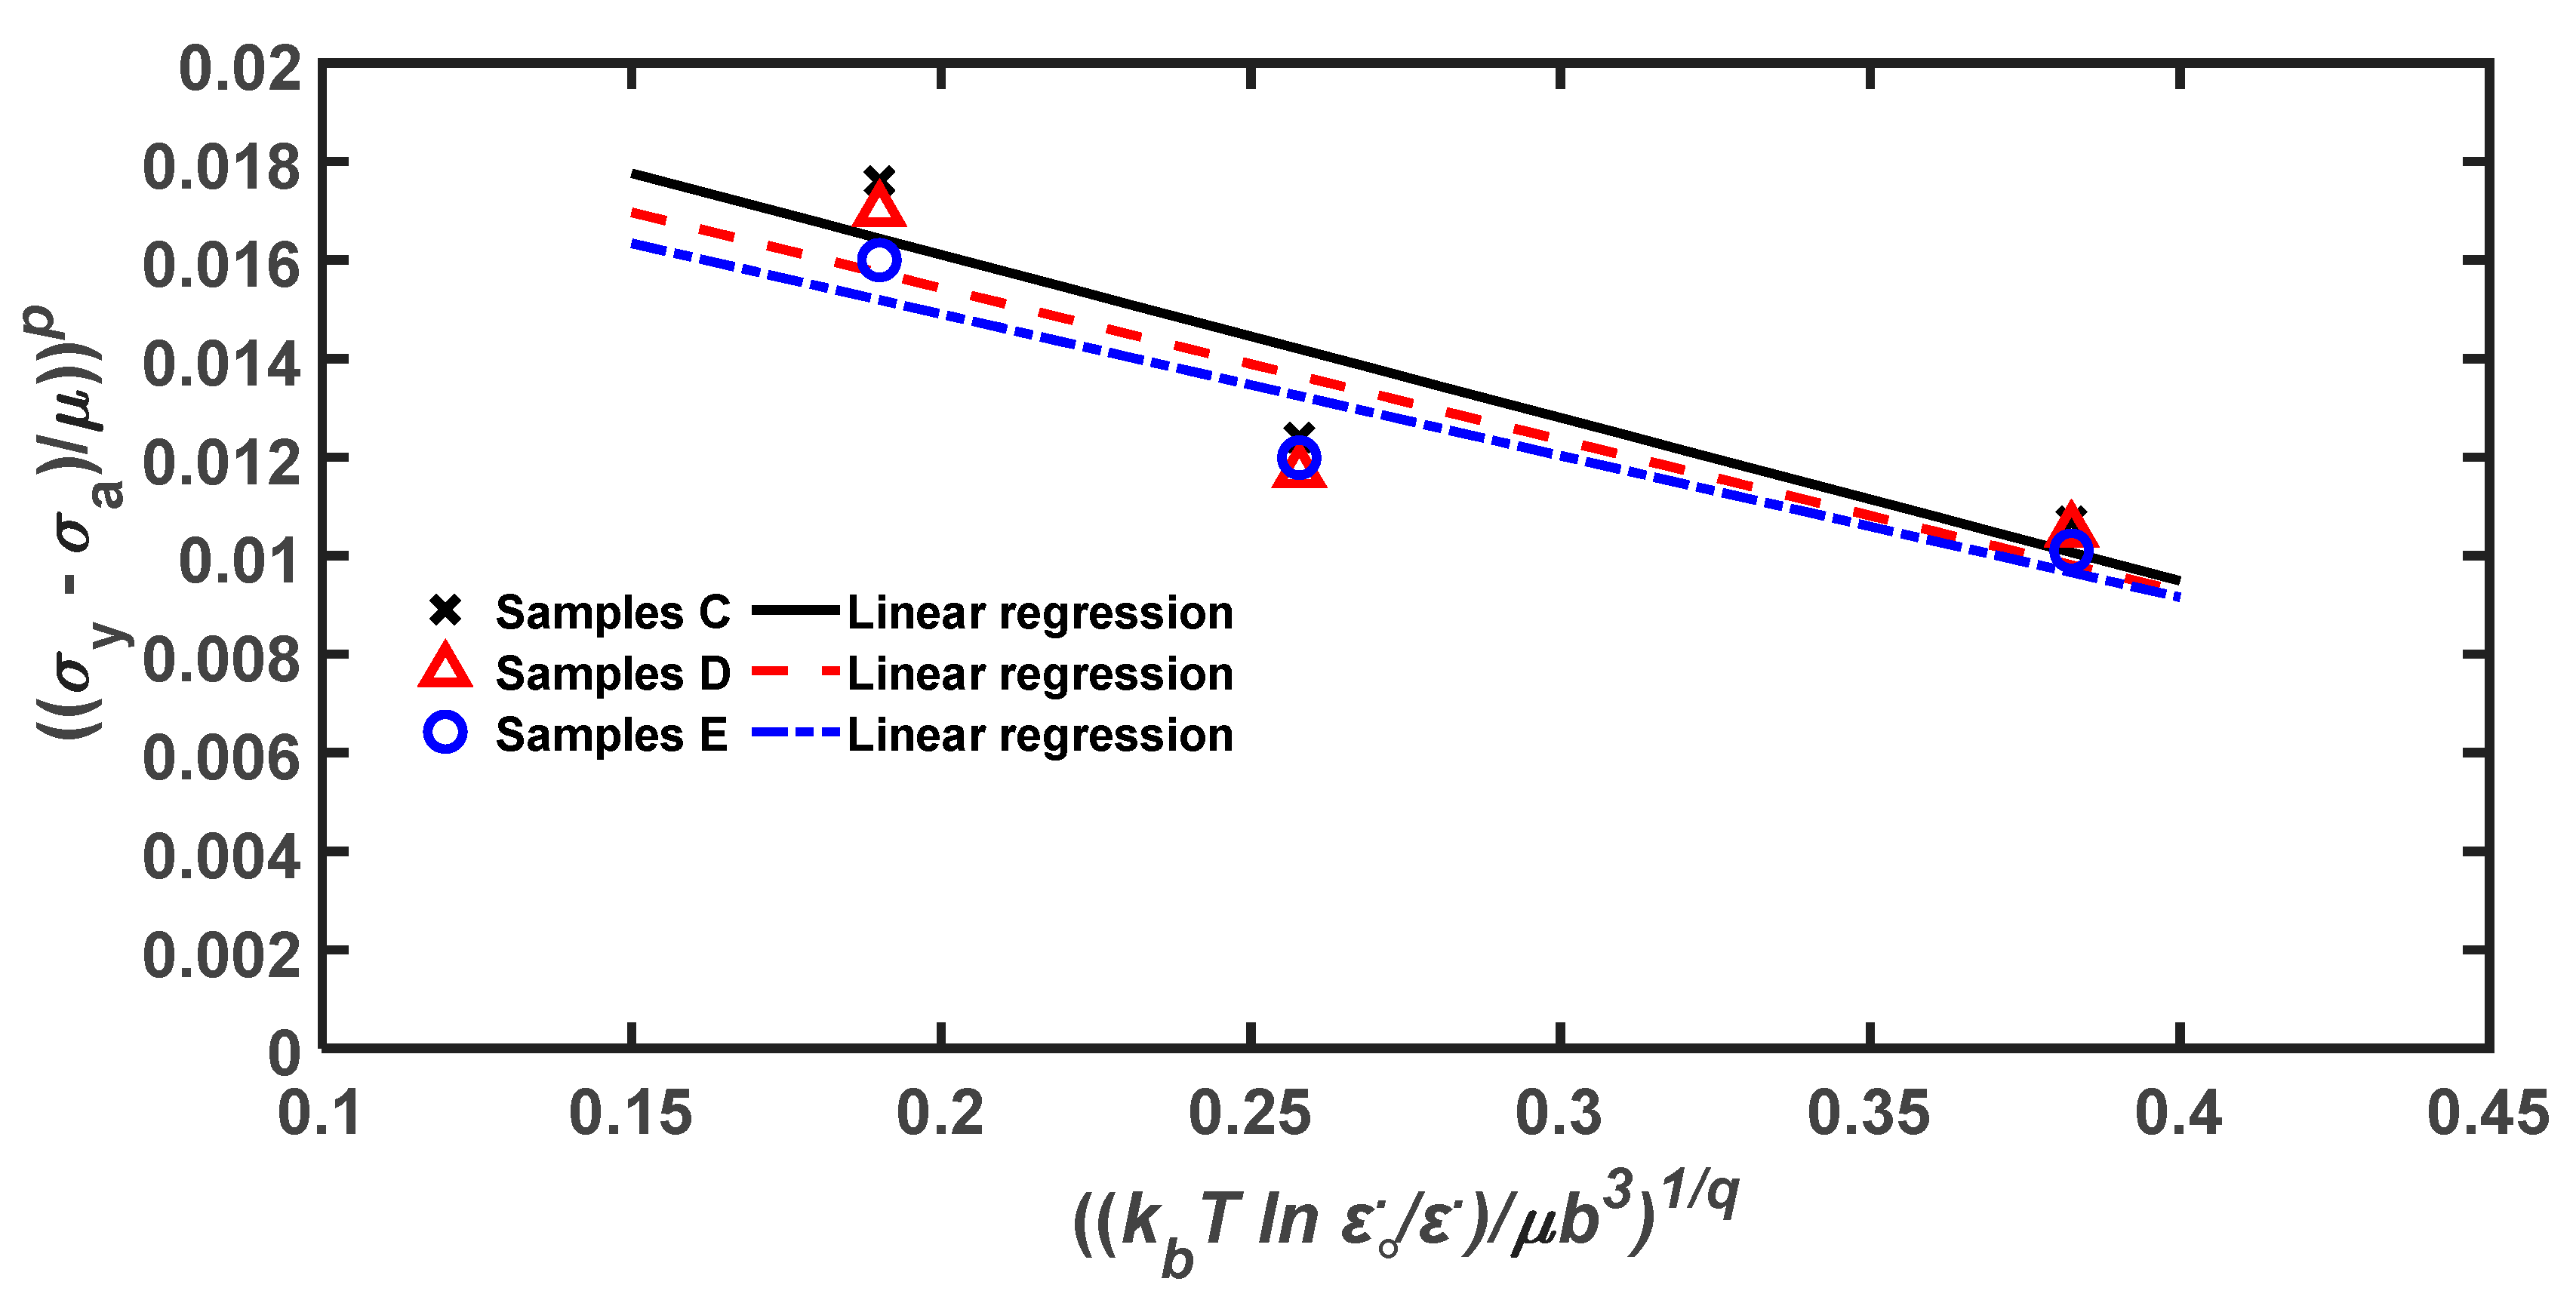
4.2.3. Thermal Part of the Yield Stress

The thermal part of the yield stress can be expanded to a linear form from Equation (5) as:
( σ y σ a μ ) p = ( σ o μ o ) p ( σ o μ o ) p .   ( 1 g o i ) 1 q ( k b T μ b 3 ( l n ε ˙ o ε ˙ ) ) 1 q
In this equation, the constant parameters ε ˙ o , p , and q for Ti6Al4V were determined as 10 7 s 1 , 1, and 2, respectively, in [19,27,42]. The constant parameters involving the Boltzmann constant ( k b ) and Burgers vector ( b ) for Ti6Al4V are k b = 1.38 × 10⁻²³ J/K [30] and   b = 2.95 × 10⁻¹⁰ m [34], respectively, giving rise to the ratio k b / b 3 as 0.5375 MPa/K.
It is of interest to note that, in this formulation, the viscous drag effect at high strain rate discussed in Section 3.3 is not captured and its introduction in Equation (16) would further lower the term ( σ y σ a ) / μ . The viscous drag effects become significant for the high strain rates above 103 s−1 [39,40] and is therefore assumed to be insignificant at a strain rate of 750 s−1. With this assumption, the variation of the normalised thermal-activated part of yield stress   ( ( σ y σ a ) / μ ) p with the coupled effect of the strain rate and temperature term ( ( k b T / μ b 3 ) . l n ( ε ˙ o / ε ˙ ) ) q for samples C, D, and E, was plotted at a strain rate of 750 s−1, giving rise to the graphs shown in Figure 5.
The mechanical threshold stress ( σ o ), which is the thermal-activated component of yield stress at 0   K , and the average value of normalised activation energy ( g o i ) are given by the y-intercept and the gradient of the linear fitting curves shown in Figure 5, respectively. The values of these model-fitting parameters for samples C, D, and E, obtained from Figure 5, are presented in Table 2.
In the present research, Peierls barriers and short-range obstacles in the material are overcome by the motion of dislocations in a thermally activated manner during plastic deformation. Peierls stress is related to the temperature sensitivity of the yield stress of a material by the fact that temperature weakens the atomic bond strength of a unit cell and therefore lowers the stress required to move a dislocation within the plane of atoms in a unit cell.
Short-range obstacles to the motion of dislocations for Ti6Al4V(ELI) include aluminium and vanadium atoms and the clusters of low-percentage interstitial elements [19]. The β-phase in samples C, D, and E is limited in quantity [21], and thus can be assumed to play a minor role during deformation. The effect of vanadium atoms on dislocations can therefore be ignored. Thus, the total thermally activated stress can be expressed as a superposition of three components: (a) due to activation of dislocations over Peierls barriers, (b) the interaction of dislocations with aluminium, and lastly, (c) the interaction of dislocations with interstitial elements. The three different alloys of DMLS Ti6Al4V(ELI) tested here are of the same chemical composition [20,21] and only differ in microstructure. Following the reasoning in this paragraph, it can be assumed that both the mechanical threshold stress ( σ o ) and the normalised activation energy ( g o i ) for the three types of samples could be the same. Therefore, the average values of 1063.2 ± 22.8 MPa and 0.25 ± 0.0015 for σ o and g o i , respectively, obtained from Table 2 will be used to predict the flow stress of the DMLS Ti6Al4V(ELI) alloy.

4.2.4. Calibration and Refinement of Strain Hardening

At high strain rates, Ti6Al4V(ELI) experiences instantaneous strain hardening, which increases the yield stress of the material. The movement and storage of the dislocations during strain hardening is related to different loading states of strain rate and temperature. The model adopted in the present research assumes that the flow stress σ f , due to the motion of dislocations, is dependent on temperature, plastic strain ( ε p ) , and the initial density of dislocations ( ρ o ) and is in the form shown in Equation (10). In this equation, the dimensionless parameter   α is taken as 0.2 [17]. The shear modulus μ varies with temperature, as seen in Figure 4. For polycrystalline materials, the Taylor factor, M , varies from grain to grain due to differences in texture with reference to the loading axis. For the case where all grains of relatively random textured material undergo the same deformation as the overall deformation, and based on the use of the von Mises compatibility conditions, Taylor [32] obtained the average value for   M as 3 for hcp crystal structures. This is the value adopted in the present studies from the assumption that all grains undergo deformation. This is further supported by the relatively random texture of the α-phase in samples C, D, and E reported in [43].
The effects of temperature on strain hardening of Ti6Al4V were first investigated using Equations (10) and (15) at temperatures ranging from −273 °C to 800 °C at a constant initial dislocation density ( ρ o ) and constant calibration parameters h and   k 2 , as seen in Figure 6.
The curves in this figure show that increase of temperature gives rise to a drop in the flow stress. This is consistent with the physical reality that dictates an increase in the recovery rate with increasing temperature. It is necessary to note that formulation of flow stress in Equation (10) does not incorporate the failure criterion or damage growth of the alloy. Thus, the decrease in ductility that is expected to occur as the temperature decreases is not evident in Figure 6.
The effect of the initial dislocation density on the shape of the flow stress curve was also investigated at constant temperature and calibration parameters h and   k 2 , as seen in Figure 7. The shape of the flow curves in this figure for very high initial dislocation densities in the material is a pronounced peak followed by a drop in the flow stress or strain softening of the material.
The peak stress decreases with the decrease in the initial dislocation density, through to a case where no strain hardening occurs and cases where strain hardening occurs. Obviously, a high density of dislocations in a material is known to cause an increase of its yield strength (peak stress). In fact, dislocations in such materials will rapidly pile up at barriers such as precipitates, grain boundaries, or even sessile dislocations. The leading dislocation in the pile-up is acted on, not only by applied shear stress, but also by the interaction stress with other dislocations in the pile-up. High stresses initiate yielding on the other side of the barrier and can initiate cracks at the barriers [45], which could cause a decrease of the stress with strain softening at the onset of plastic flow, as seen in Figure 7.
For dislocation densities below 8 × 10¹⁴ m−2, the flow curves are characterised by the familiar strain hardening that decreases in magnitude with increasing plastic strain. This is the common scenario for the Ti6Al4V(ELI) alloy, as previously reported in [20], and is the characteristic for metals and metal alloys. Further decrease in the initial dislocation density, according to the model, decreases the rate of instantaneous strain hardening and therefore the material has significant post-yielding strain hardening before forming a plateau. This is consistent with the physical reality where materials with large grain sizes and therefore low dislocation densities have significant post-yielding strain hardening [46].
The initial dislocation densities of the three different heat-treated microstructures of DMLS Ti6Al4V(ELI) tested under a high strain rate, which were determined via the XRD peak broadening analysis, are reported in [21] as shown in Table 3. It is evident that all the values in this table are lower than the threshold of 8 × 10¹⁴ m−2 mentioned in the preceding paragraph. Therefore, the three microstructures should all lead to stress flow curves with strain hardening, beyond the yield.
The constants h and k 2 in Equation (10) are model calibration parameters that stand for the athermal work-hardening coefficient and rate of annihilation of dislocations, respectively, at given temperatures and strain rates. These parameters are determined from the experimental flow curves. These are the only unknown parameters in the equation and were determined for Ti6Al4V(ELI) specimens by a process of adjustment to fit the model to experimental curves of true stress versus true strain for samples C, D, and E.
Figure 8 shows the flow stress curves of the three DMLS Ti6Al4V(ELI) specimen types and those predicted by the model from fine-tuning the model parameters h and k 2 to obtain the best fits values of 8.3 × 10¹⁵ m−2 and 10, respectively. One common observation made in Figure 8, for all three categories of samples, is that the deviation of the experimental curves from the ones predicted by the model increases with increasing strain rates. This suggests that it is critical to include the effects of viscous drag stress to the model to accurately describe the upturn of flow stress at high strain rates. As was explained in Section 3.3, the resistance to the flow of dislocations due to the drag mechanism at high strain rates does explain the upturn of the yield and flow stresses.

4.2.5. Calibration of the Viscous Drag Stress Component of Flow Stress

A systematic approach was adopted to determine the viscous drag stress fitting parameters ζ and   χ in Equation (11). In this approach, the difference between the experimental flow stress and the one predicted by the model (without the viscous drag stress) at a strain of 0.1 and at any given strain rate was first determined. This difference was then taken as a viscous drag component of stress and, together with the corresponding strain rate, was then used in conjunction with Equation (11) to evaluate the material constants ζ and   χ .
Figure 9 shows the evolution of the viscous drag stress as a function of strain rate and at different values of the curve-fitting parameters ζ and χ . It is evident in this figure that, at low and moderate strain rates ( ε ˙   100   s   1 ), the viscous drag component is small and negligible at all values of ζ and χ   . In such cases, the material strain rate sensitivity and deformation are mainly controlled by obstacles. As the strain rate increases ( ε ˙ > 100   s   1 ), the viscous drag becomes relevant and quickly rises with the deformation rate, as seen in Figure 9.
The increase in the strain rate and the two curve-fitting parameters ζ and χ all lead to an increase in viscous drag stress, though the effect of strain rate is clearly seen in this figure to be more predominant. Equations (11) and (12) were then used together with experimental data for samples C, D, and E to evaluate the values of the curve-fitting parameters ζ and χ , as shown in Figure 10, with the results shown in Table 4.

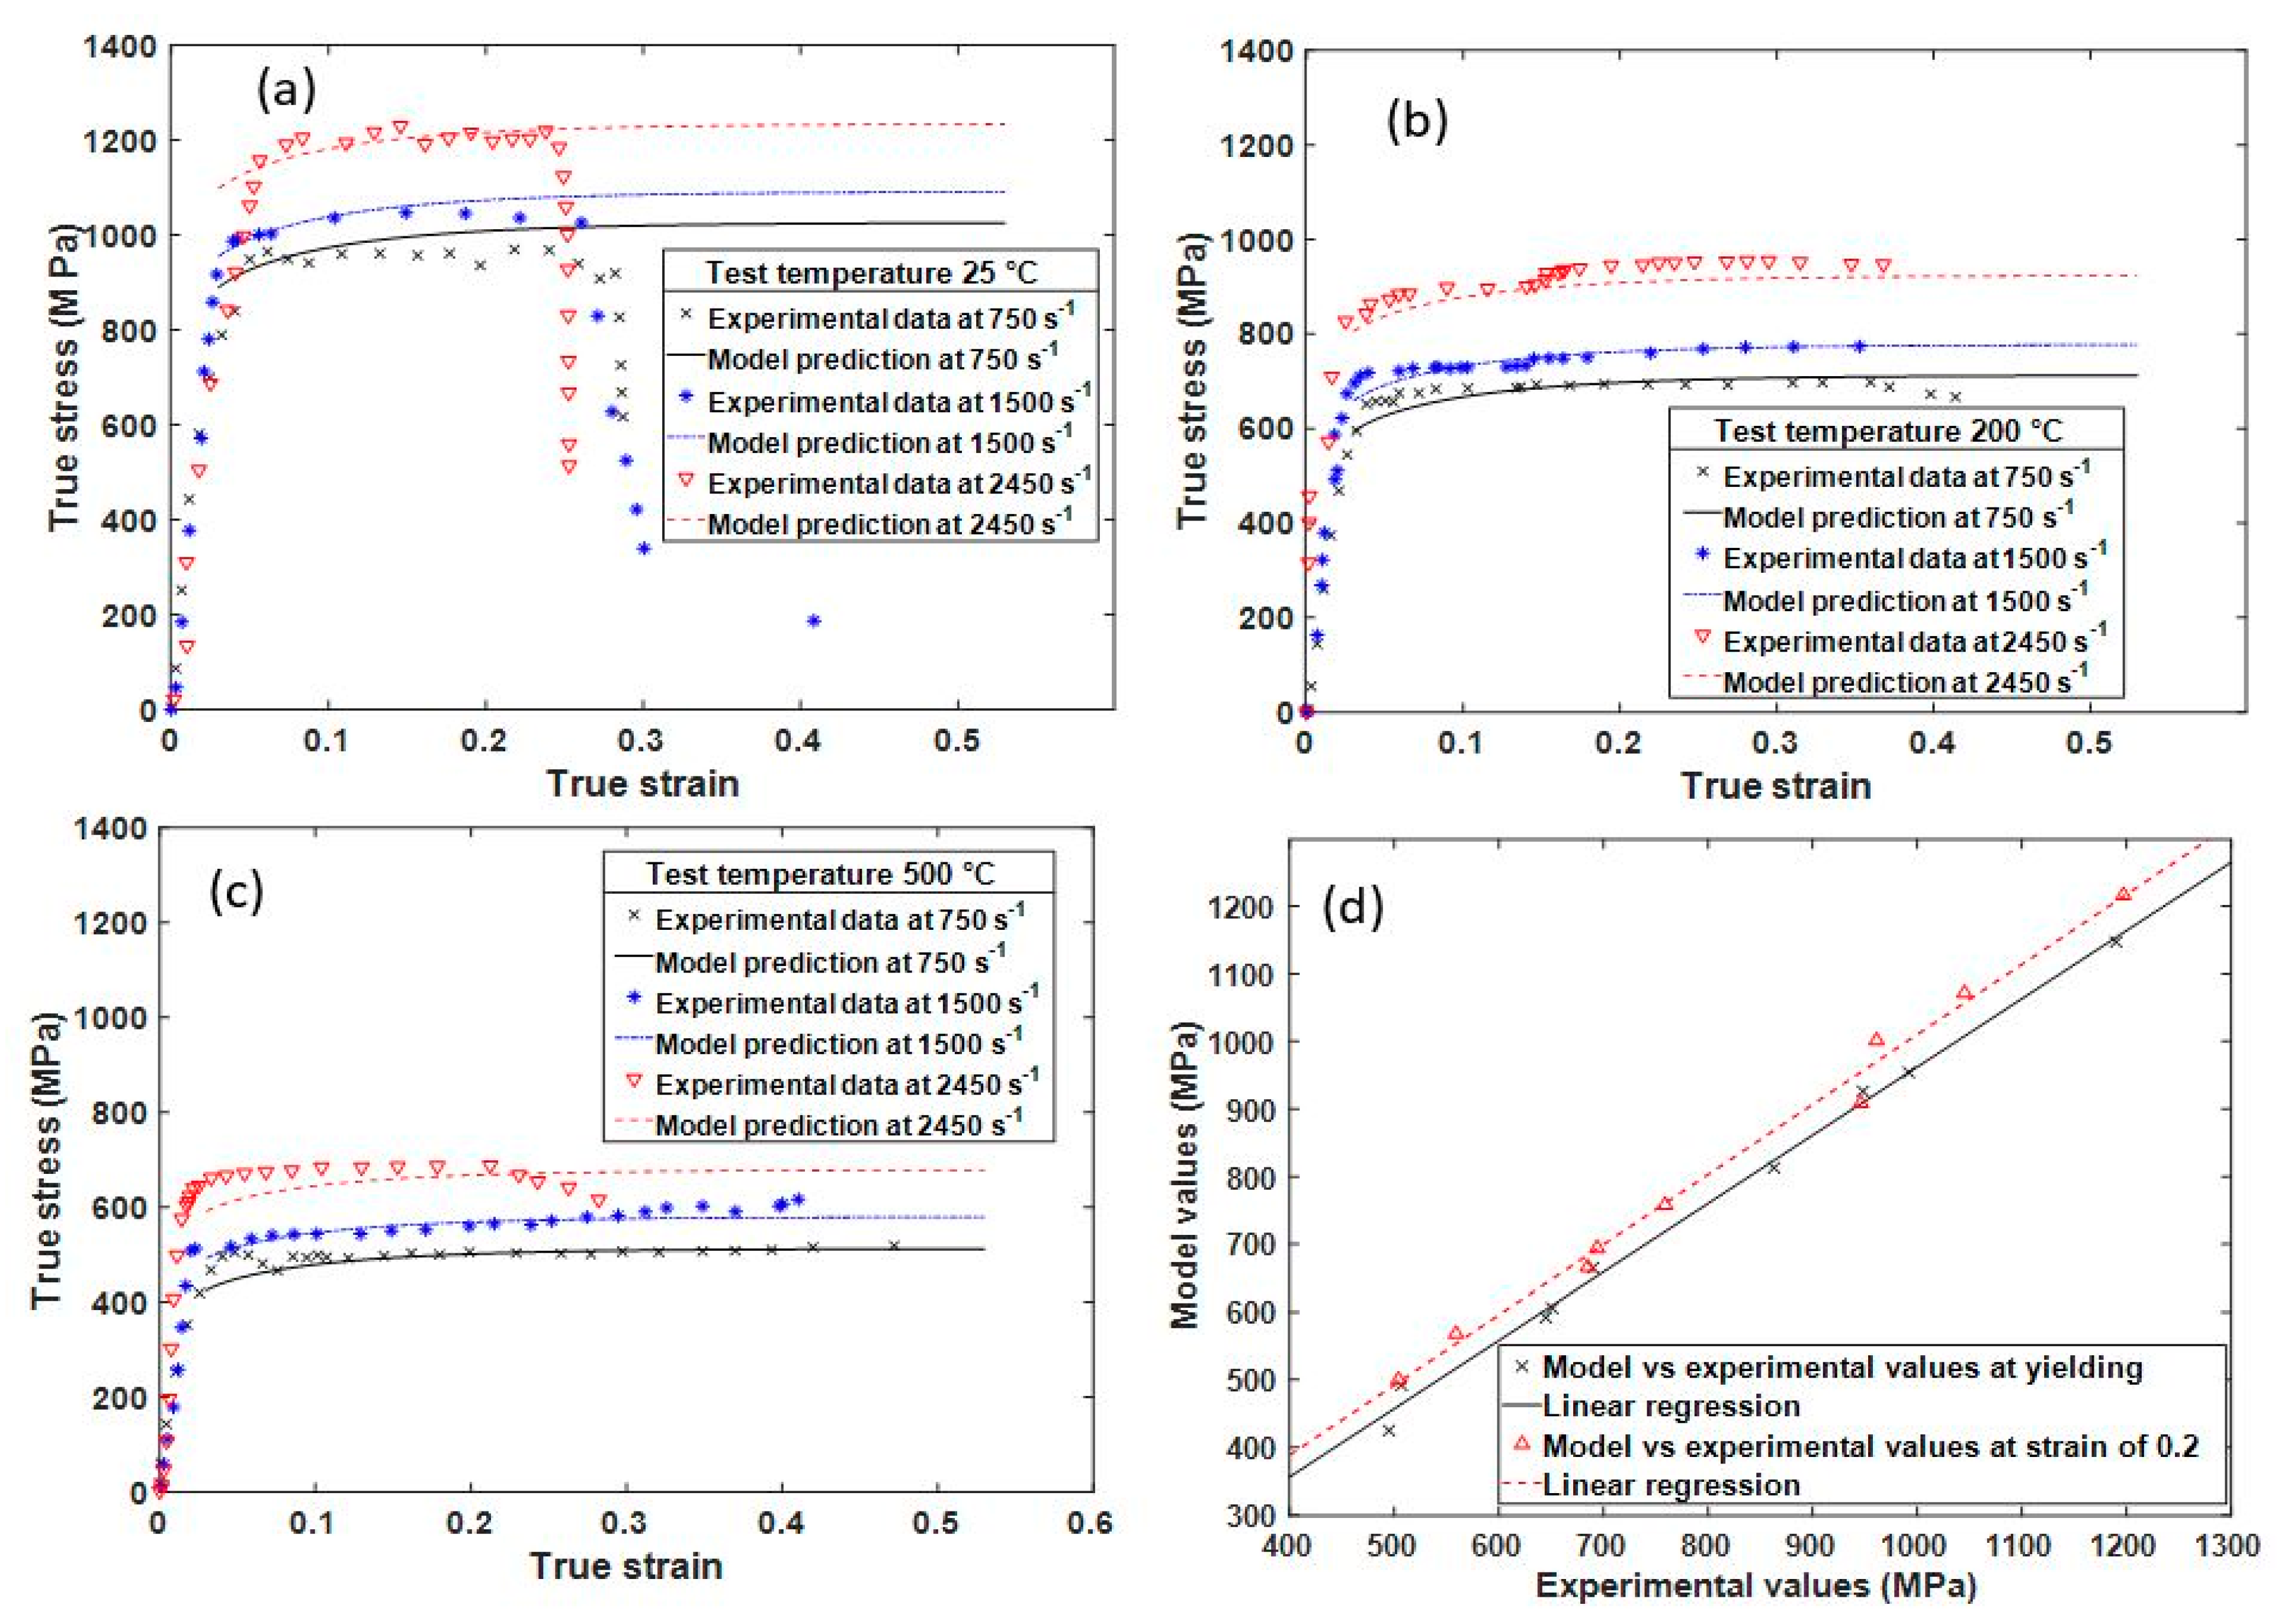
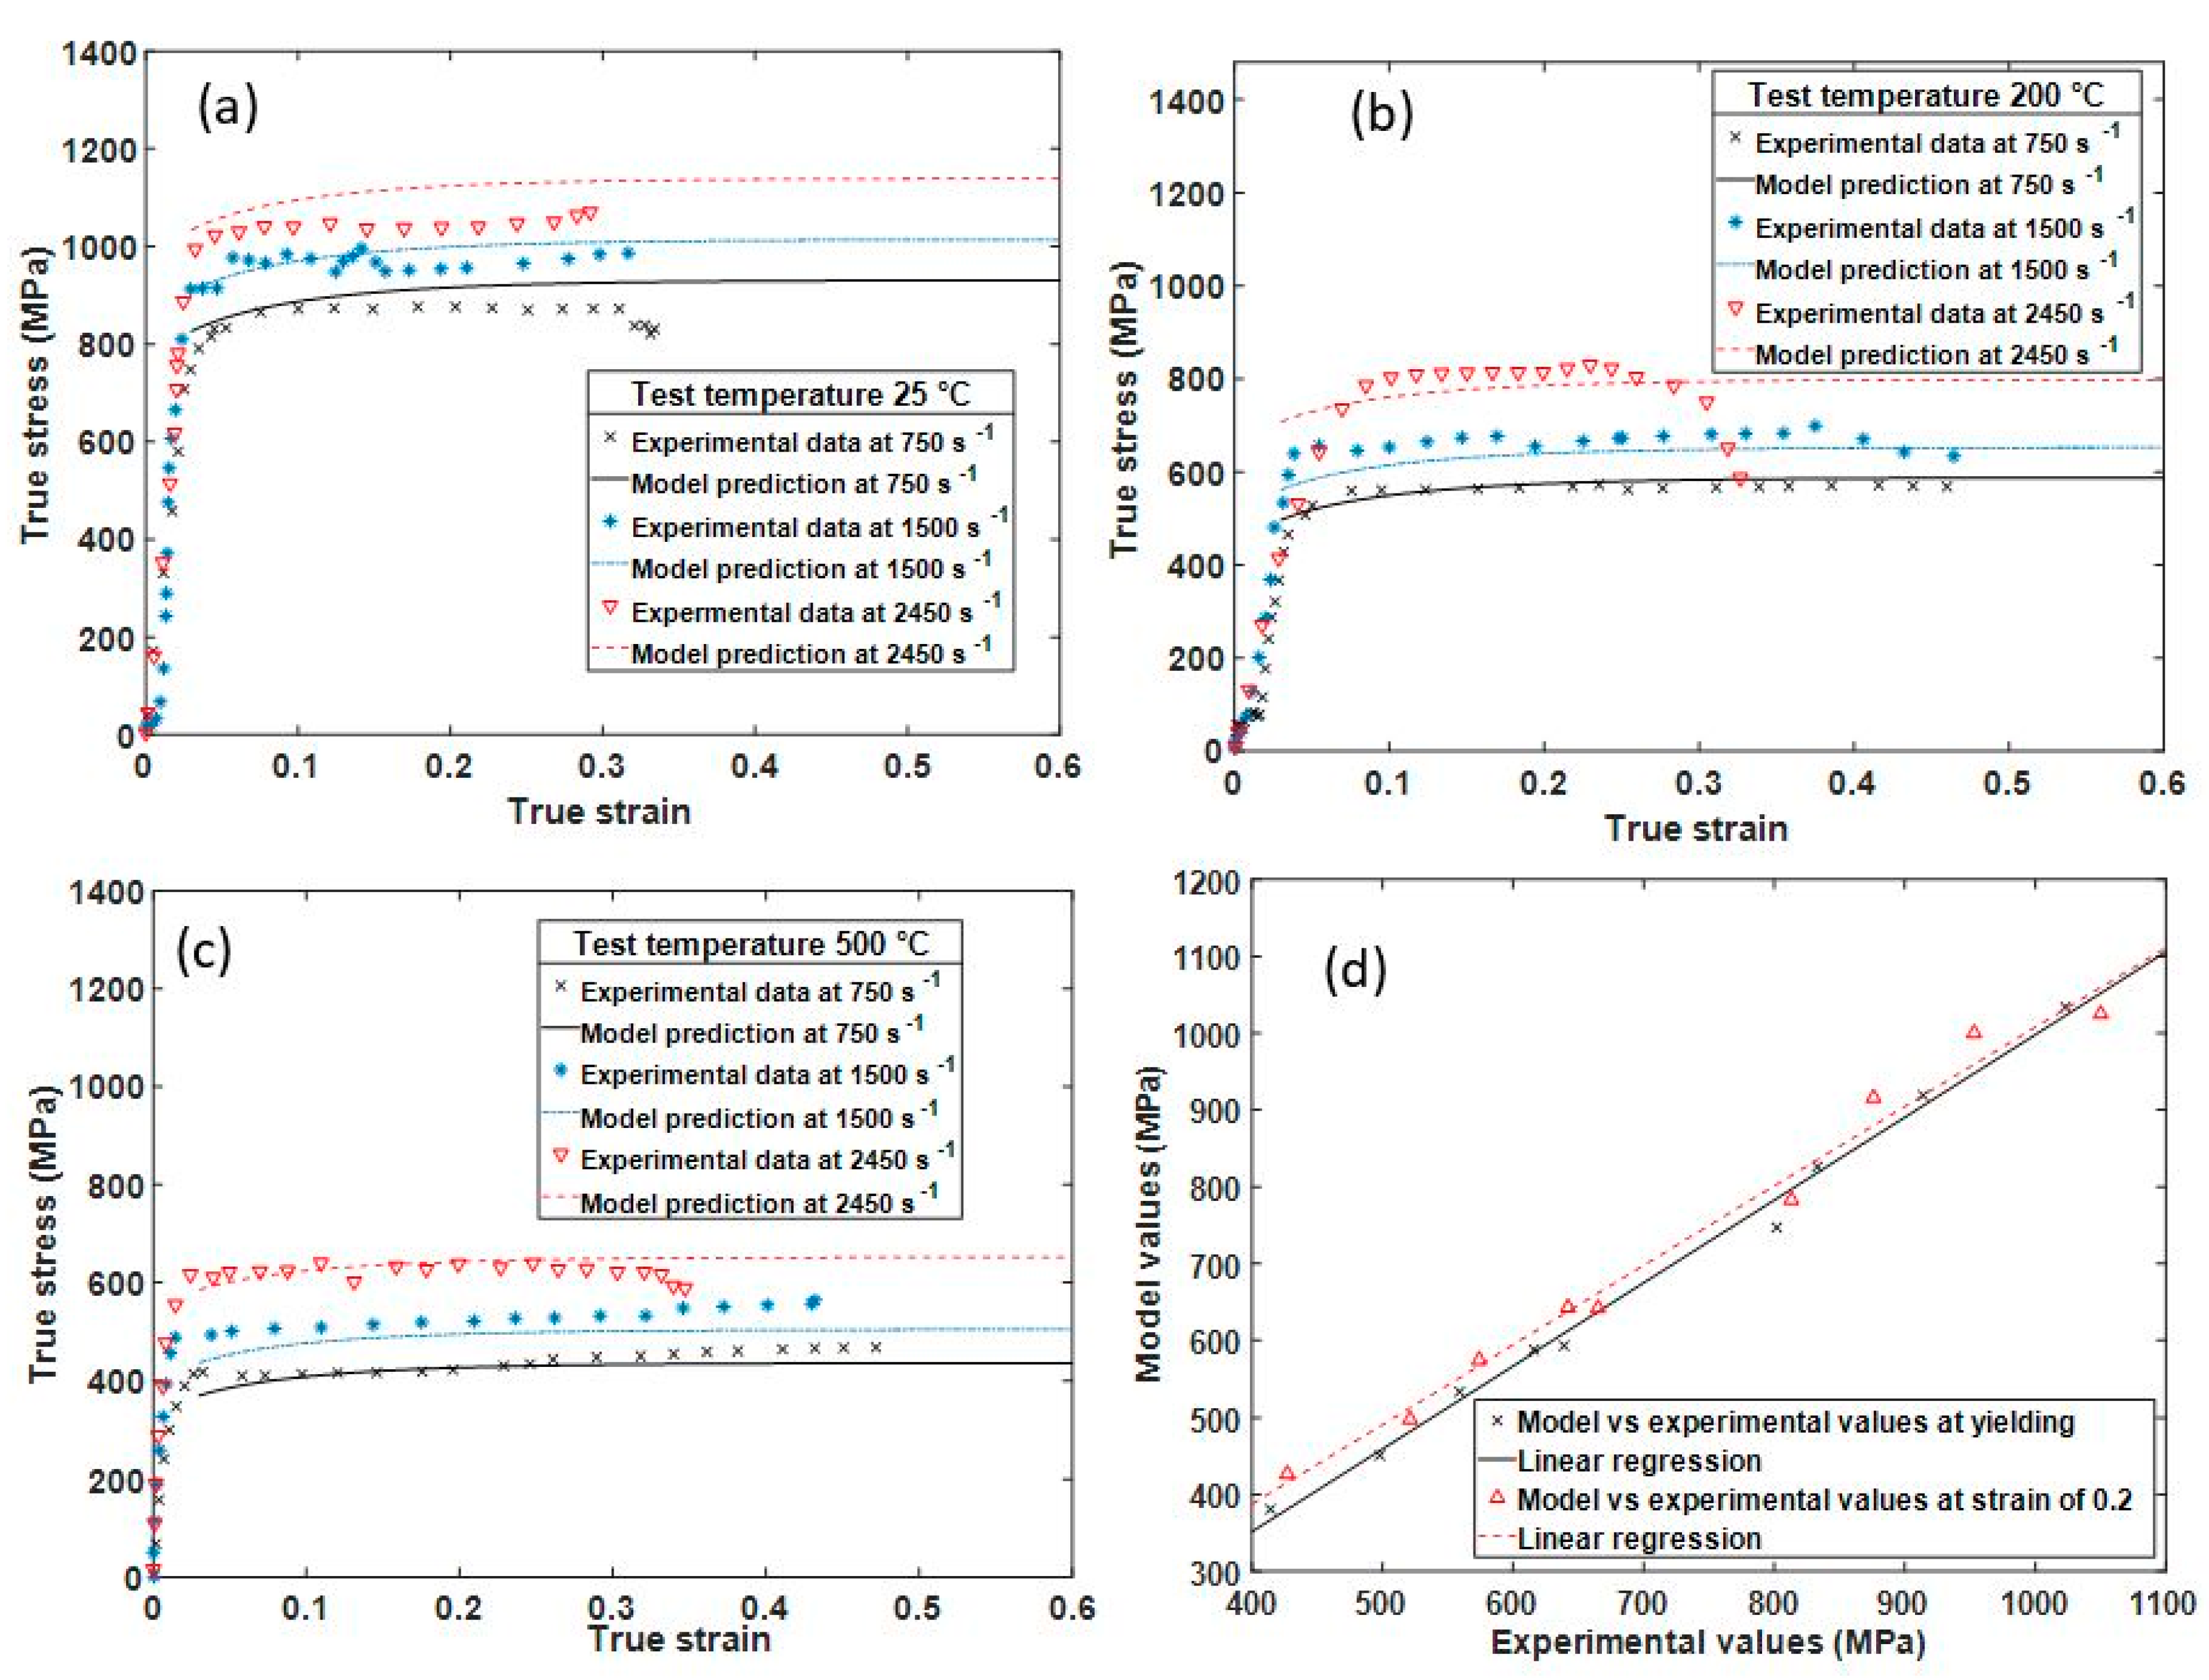
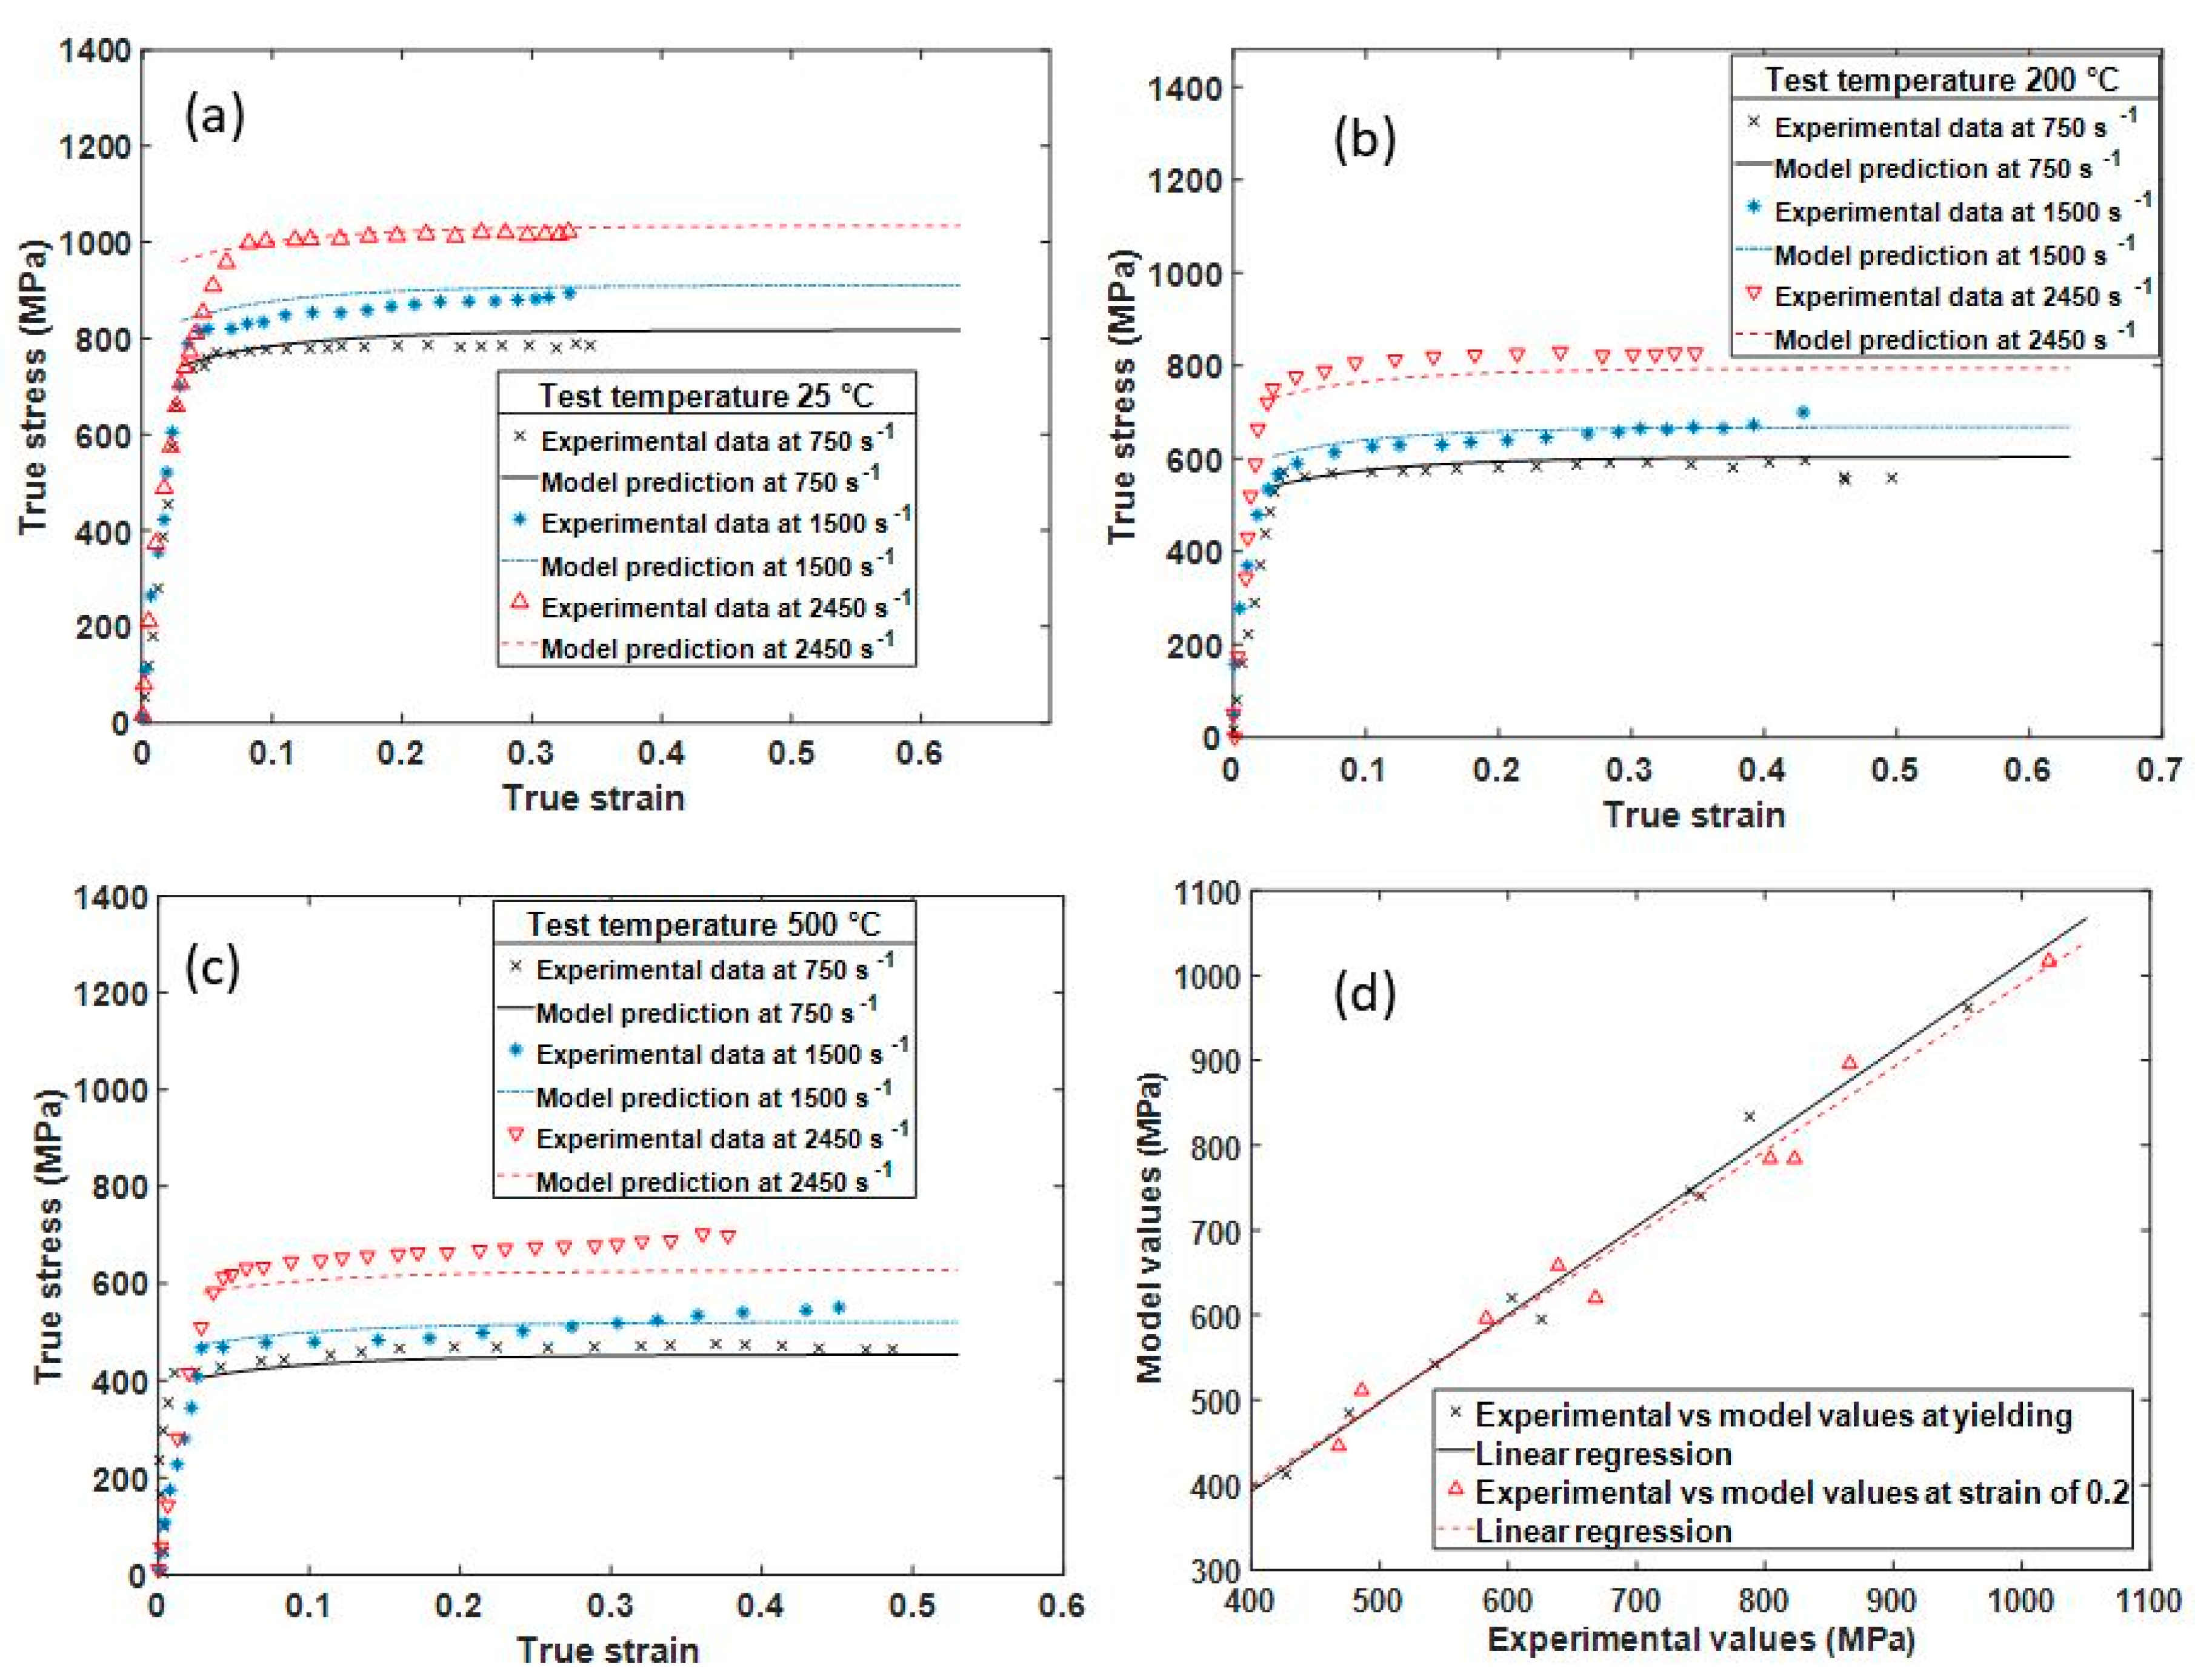
4.3. Validation of Microstructural Variable-Based Constitutive Model

The physical constants, microstructural parameters, and fitting parameters of the model developed from the literature, experimental data, and analytical modelling presented in Section 4.2 are summarized in Table 5. The experimental and predicted flow stress curves for various samples with the viscous drag effect included are presented in Figure 11, Figure 12 and Figure 13.
To evaluate the overall capability of the model to predict the yield stress, the statistical measures of correction coefficient (R2) and the absolute average error (δ) were obtained. This was done for the graphs comparing the experimental and predicted values from the modified model in Figure 11d, Figure 12d, and Figure 13d. The correlation coefficient (R2) in this case provides details on the strength of the linear relationship between the experimental and predicted values. It is important to note that R2 may not necessarily show better performance of the model, due to a tendency of the linear fit to be biased towards lower or higher values. This suggests that R2 can be misleading if outlier values are present. The absolute average error, on the other hand, is calculated through a term-by-term comparison of the relative error and is thus an unbiased statistical parameter for measuring the predictability of the model. These standard statistical performance measures, the correlation coefficients (R2), and absolute average error (δ) are expressed by the following respective equations:
R 2 = i = 1 N ( E i E ¯ ) 2   ( P i P ¯ ) 2 i = 1 N ( E i E ¯ ) 2   i = 1 N ( P i P ¯ ) 2
δ = 1 N i = 1 N | E i P i E i |
where the symbol   N stands for the total number of data points employed in the analysis, E i   and P i   represent the experimental and predicted yield/flow stress values, and E ¯ and P ¯ are the mean values of E i and P i at the line of fit, respectively. Generally, when the R 2 value is close to 1 and the δ value is close to 0, the model has the desired capacity to yield values close to the experimental values. Table 6 shows the statistical measures obtained from Figure 11d, Figure 12d, and Figure 13d.
The values of correction coefficient (R2) are high and very close to 1, as seen in Table 6. It is also evident in the table that the absolute percentage errors between the predicted values of the proposed model and experimental values are all less than 6.0%, which is an acceptable range. This is a good indication that the microstructural variable-based constitutive model developed in the present study is reasonably good for use in predicting the high strain rate mechanical flow stress properties of the additively manufactured Ti6Al4V(ELI) alloy.

5. Conclusions

The development, calibration, and validation of a constitutive model that is sensitive to microstructure was presented in this paper, for use in predicting the flow stress of various forms of DMLS Ti6Al4V(ELI) at different strain rates and temperatures. The following conclusions can be drawn from this work:
  • The athermal part of yield stress for DMLS Ti6Al4V(ELI) is greatly affect by the thicknesses of α-laths. The contribution of the athermal stress to the yield strength for the three different microstructures of DMLS Ti6Al4V(ELI) with average thicknesses of α-laths of 2.5 μm (sample C), 6.0 μm (sample D), and 9.0 μm (sample E) was 207.45 MPa, 133.91 MPa, and 109.33 MPa, respectively.
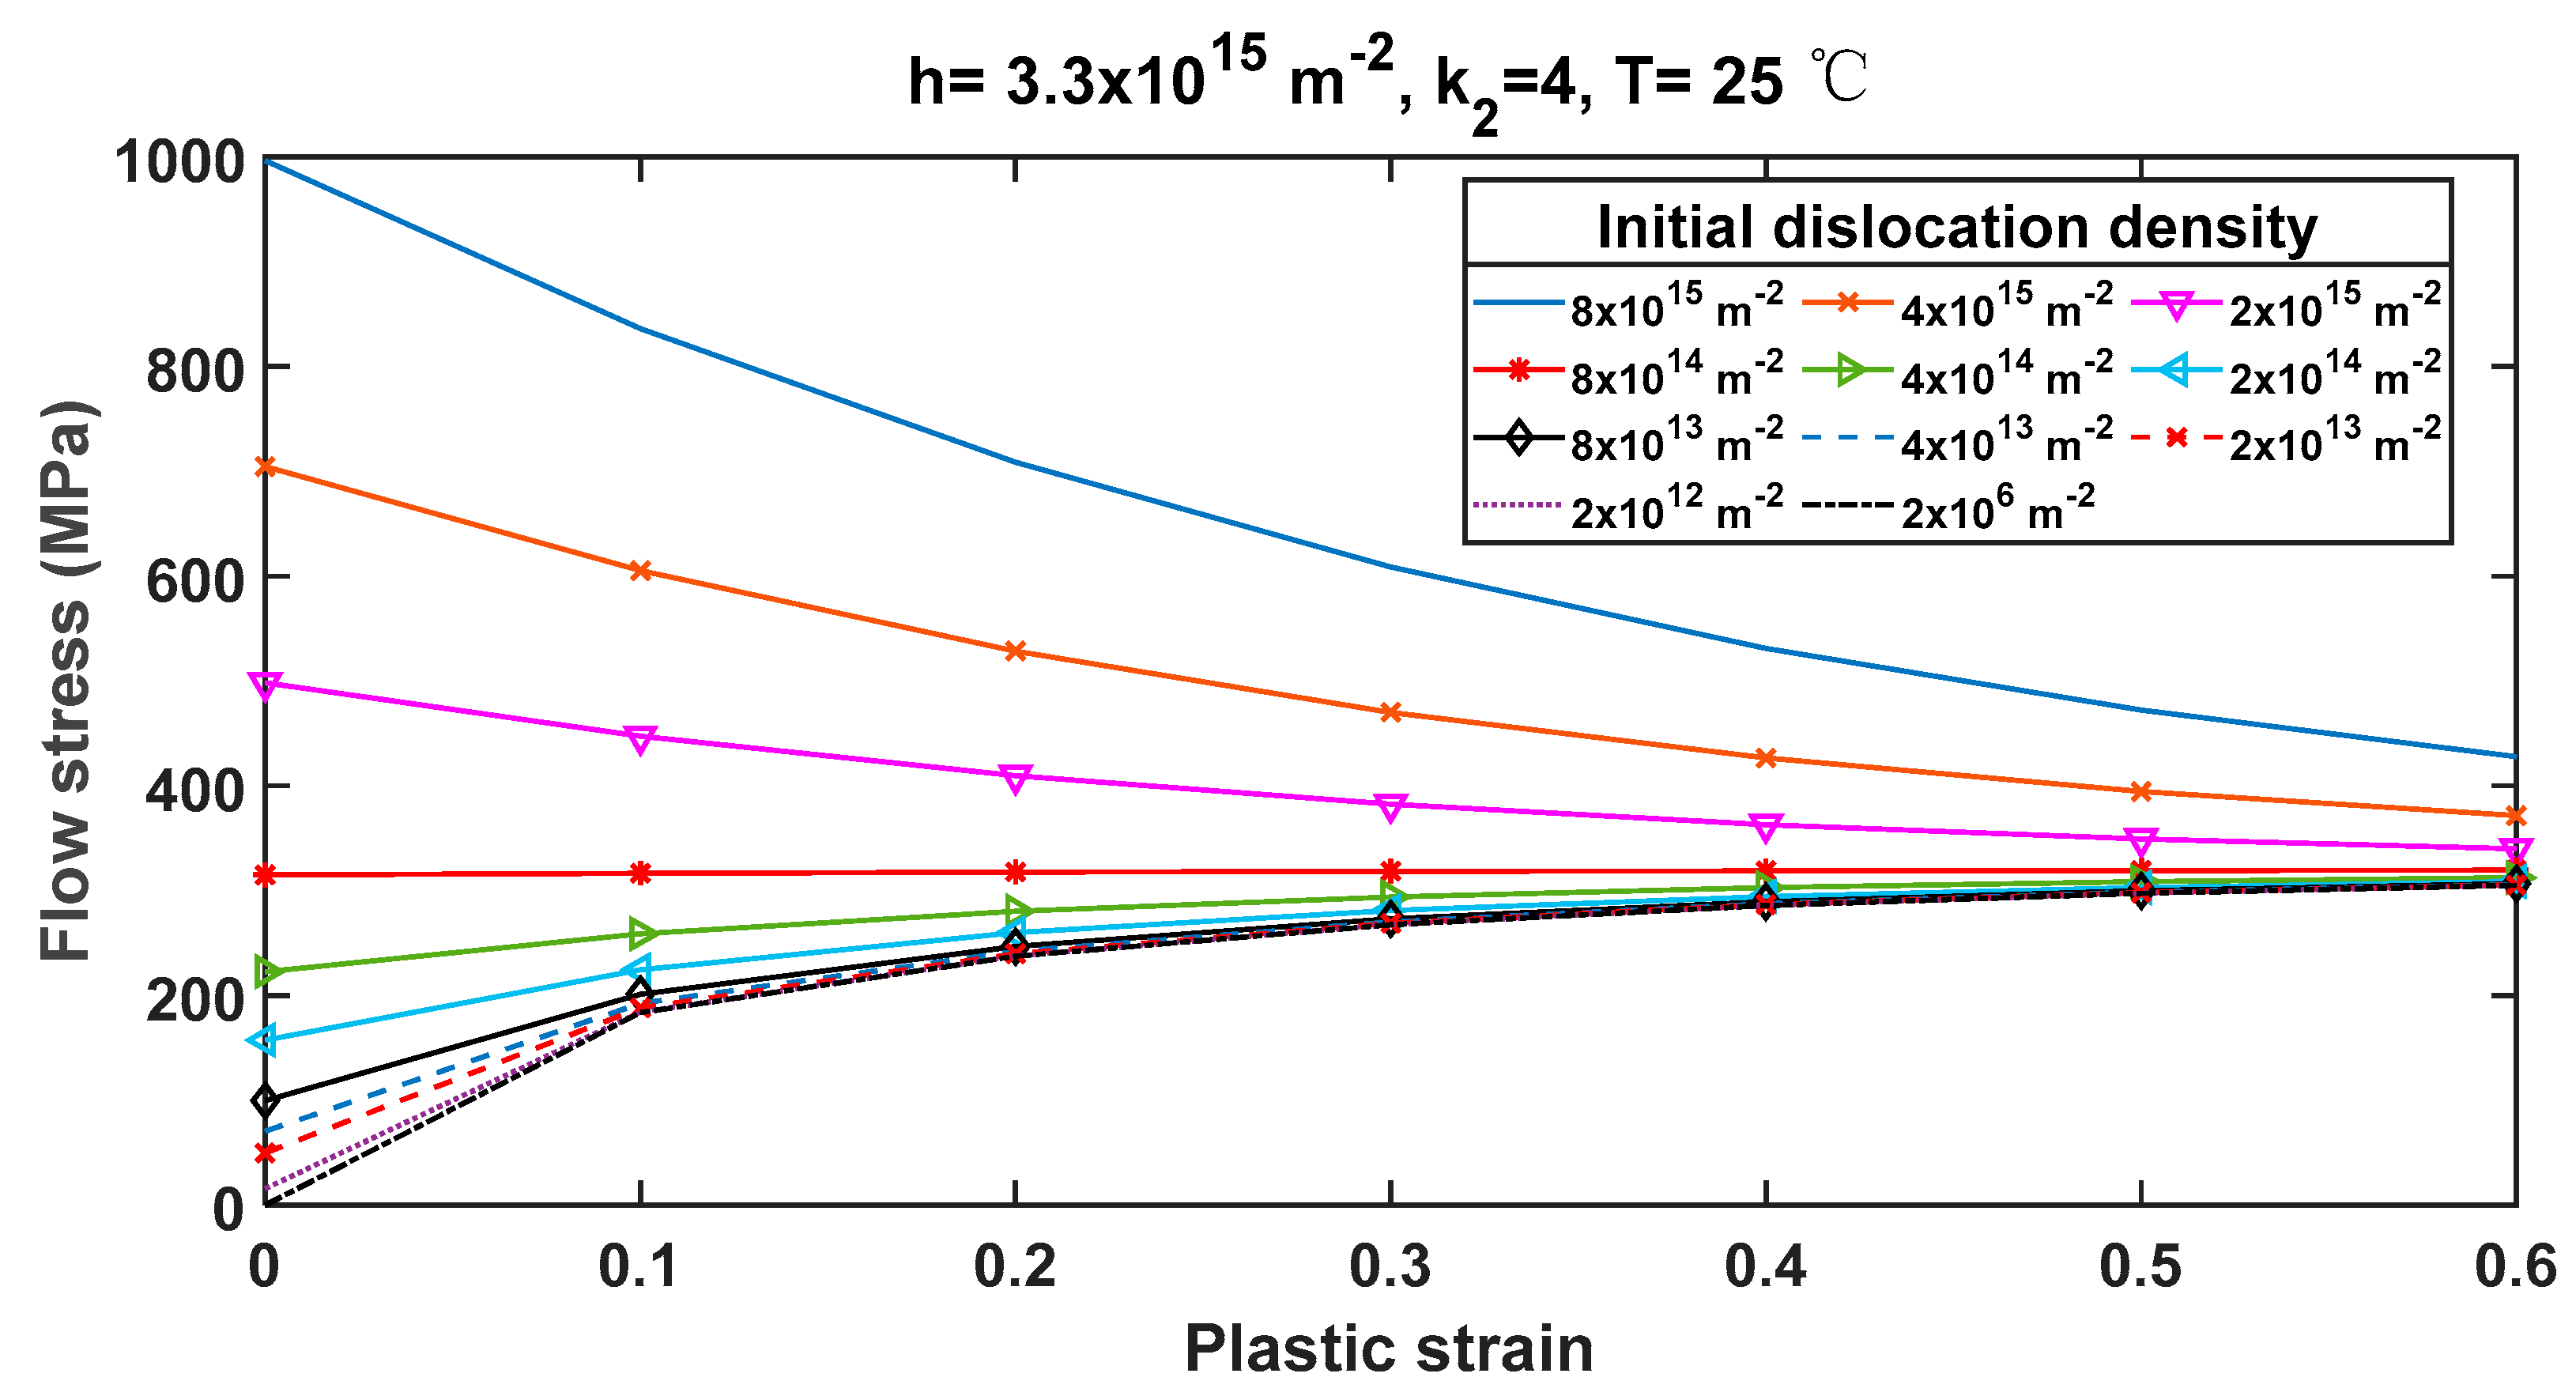
  • The initial dislocation density in a microstructure was shown to influence the shape of the flow stress curve. For very high initial dislocation densities, the shape of flow stress curve was shown to be that of a pronounced peak and subsequent strain softening. Low initial dislocation densities were shown to result in strain hardening post yielding.
  • To explain the upsurge of flow stress at high strain rates and, therefore, enhance the predictive capacity of the model, it is critical to include the viscous drag stress that is usually not captured in MTS formulation.
  • The standard statistical performance measures of correlation coefficients (R2) and absolute average errors (δ) obtained for the model and experimental values were approximately 1 and less than 6%, which are a good indication of high accuracy of the model to predict the high strain rate mechanical properties of DMLS Ti6Al4V(ELI).
  • Future research should aim at implementing the microstructure-based model for DMLS Ti6Al4V(ELI) as a material subroutine in finite element modelling (FEM) software such as ABAQUS. This will be important in simulating dynamic processes in aircraft industry where Ti6Al4V is used primarily to provide the required static and dynamic strength.
  • Future research should aim at extending the utility of the constitutive relations developed in this study to other forms of DMLS Ti6Al4V(ELI) and other metals and alloys, such as steel and aluminium, which show wide ranges of microstructure for varying heat treatment cycles.

Author Contributions

Conceptualization, A.M., M.M. and W.d.P.; methodology, A.M.; validation, A.M.; formal analysis, A.M.; writing—original draft preparation, A.M.; writing—review and editing, A.M., M.M. and W.d.P.; supervision, M.M. and W.d.P.; funding acquisition, W.d.P. All authors have read and agreed to the published version of the manuscript.

Funding

This research was funded by the South African Department of Science and Innovation (DSI) through the Council for Scientific and Industrial Research (CSIR), for the Collaborative Program in Additive Manufacturing, Contract No.: CSIR -NLC-CPAM-18-MOA-CUT-01.

Institutional Review Board Statement

Not applicable.

Informed Consent Statement

Not applicable.

Acknowledgments

The Centre for Rapid Prototyping and Manufacturing (CRPM) of the Central University of Technology, Free State (CUT) is acknowledged for production of Ti6Al4V(ELI) specimens used in this study. The authors also acknowledge the Armaments Corporation of South Africa SOC Ltd (ARMSCOR) where the SHPB experiments were conducted.

Conflicts of Interest

The authors declare no conflict of interest.

Appendix A

The rate of increase of dislocations with plastic strain can be expressed as:
d ρ d ε p = ( h k 2 ρ )
The change in plastic strain ε p can be expressed from Equation (A1) as:
d ε p = ( d ρ h k 2 ρ )
The plastic strain at an instance therefore can be expressed as:
ε p = d ρ ( h k 2 ρ ) = 1 k 2 l n ( h k 2 ρ ) + C
Equation (A3) can further be simplified as:
k 2 ( ε p   C ) = l n ( h k 2 ρ )
exp ( k 2 ε p   + A ) = h k 2 ρ
ρ = h k 2 C 1 k 2 e x p ( k 2 ε p   )
where C is integral constant, A is the product of k 2 and C , and C 1 is the solution for e x p   C . At yielding condition, ε p   = 0 and the   ρ = ρ o , where ρ o is the material initial dislocation density. Thus, C 1 can be expressed as   h ρ o k 2 . Equation (A4c) then becomes:
ρ = h k 2 ( h ρ o k 2 ) k 2 exp ( k 2 ε p   ) = h k 2   ( 1 exp ( k 2 ε p   ) ) + ρ o e x p ( k 2 ε p )
The flow stress Equation (6) now becomes:
σ = α μ ( T ) b M ( h k 2   ( 1 exp ( k 2 ε p   ) ) + ρ o exp ( k 2 ε p ) ) 1 2
The important feature of this expression is that only two constant parameters ( h and k 2 ) are required to adequately describe the evolution of dislocations.

References

  1. Annamaria, G.; Kazarian, M.; Martina, F.; Mehrpouya, M. Metal additive manufacturing in the commercial aviation industry: A review. J. Manuf. Syst. 2019, 53, 124–149. [Google Scholar] [CrossRef]
  2. Sunpreet, S.; Ramakrishna, S. Biomedical applications of additive manufacturing: Present and future. Curr. Opin. Biomed. Eng. 2017, 2, 105–115. [Google Scholar] [CrossRef]
  3. Tuan, D.N.; Alireza, K.; Imbalzano, G.; Nguyen, T.Q.; Hui, D. Additive manufacturing (3D printing): A review of materials, methods applications, and challenges. Compos. Parts B-Eng. 2018, 143, 172–196. [Google Scholar] [CrossRef]
  4. Gibson, I.; Rosen, D.; Stucker, B. Additive Manufacturing Technologies. In Rapid Prototyping to Direct Digital Manufacturing; Springer: Berlin/Heidelberg, Germany; New York, NY, USA, 2010; p. 8. [Google Scholar]
  5. Hendrixson, S. Lower Buy-to-Fly Ratios with Near-Net Additive Manufacturing. Available online: https://www.mmsonline.com/blog/post/lower-buy-to-fly-ratios-with-near-net-additive-manufacturing (accessed on 15 June 2019).
  6. ASM. Aerospace Specification Metals Inc. Available online: http://asm.matweb.com/search/SpecificMaterial.asp?bassnum=MTP643 (accessed on 2 December 2018).
  7. Muiruri, A.M.; Maringa, M.; du Preez, W.B.; Masu, L.M. Variation of impact toughness of as built dmls Ti6Al4V(ELI) specimens with temperature. SAJIE 2018, 29, 284–298. [Google Scholar] [CrossRef]
  8. Muiruri, A.; Maina, M.; du Preez, W.B.; Masu, L. Effects of stress relieving heat treatment on impact toughness of direct metal laser sintering (DMLS) produced Ti6Al4V (ELI) parts. JOM 2020, 72, 1175–1185. [Google Scholar] [CrossRef]
  9. EOS Material Data Sheet. 2008. Available online: http://www.crpm.co.za/wpcontent/uploads/2017/07/M280-Titanium_Material_data_sheet_10-11_en.pdf (accessed on 12 June 2018).
  10. Sun, Y.Y.; Gulizia, S.; Fraser, M. The influence of as-built surface conditions on mechanical properties of Ti6Al4V additively manufactured by selective electron beam melting. JOM 2016, 68, 791–798. [Google Scholar] [CrossRef]
  11. Muiruri, A.M.; Maringa, M.; du Preez, W.B.; Masu, L. Effect of stress relieving heat treatment on high strain rate tensile properties of direct melting laser sintered (DMLS) parts. In Proceedings of the 7th International Conference on Competitive Manufacturing (COMA)-19), Wallenberg Center (STIAS), Stellenbosch, South Africa, 30 January–1 February 2019. [Google Scholar]
  12. Kasperovich, G.; Hausmann, J. Improvement of fatigue resistance and ductility of TiAl6V4 processed by selective laser melting. J. Mater. Process. Tech. 2015, 220, 202–214. [Google Scholar] [CrossRef]
  13. Vilaro, T.; Colin, C.; Bartout, J.D. As fabricated and heat-treated microstructures of the Ti6Al4V alloy processed by selective laser melting. Metall. Mater. Trans. A. 2011, 42, 3190–3199. [Google Scholar] [CrossRef]
  14. Lütjering, G.; Williams, J.C. Titanium: Engineering Materials and Processes Series; Springer: Berlin/Heidelberg, Germany, 2007; pp. 125–258. [Google Scholar]
  15. Sun, Y.; Weidong, Z.; Yuanfei, H.; Xiong, M.; Yongqing, Z.; Ping, G.; Wang, G.; Dargusch, S. Determination of the influence of processing parameter on the mechanical properties of the Ti6Al4V alloy using an artificial neural network. Comput. Mater. Sci. 2012, 60, 239–244. [Google Scholar] [CrossRef]
  16. Hall, E.O. The deformation and ageing of mild steel: Discussion of results. Proc. Phys. Soc. B 1951, 64, 747. [Google Scholar] [CrossRef]
  17. Park, C.H.; Son, Y.I.; Lee, C.S. Constitutive analysis of compressive deformation behaviour of ELI-grade Ti6Al4V with different microstructures. J. Mater. Sci. 2012, 47, 3115–3124. [Google Scholar] [CrossRef]
  18. Galindo, M.A.; Mumtaz, K.; Rivera, P.E.; Galindo-Nava, J.E.; Ghadbeigi, H. A microstructure sensitive model for deformation of Ti6Al4V describing cast-and-wrought and additive manufacturing morphologies. Mater. Des. 2018, 160, 350–362. [Google Scholar] [CrossRef]
  19. Picu, P.C.; Majorell, A. Mechanical behaviour of Ti6Al4V at high and moderate temperatures—Part II: Constitutive modelling. Mater. Sci. Eng. A 2002, 326, 306–316. [Google Scholar] [CrossRef]
  20. Muiruri, A.; Maringa, M.; du Preez, W. High Strain Rate Properties of Various Forms of Ti6Al4V(ELI) Produced by Direct Metal Laser Sintering. Appl. Sci. 2021, 11, 8005. [Google Scholar] [CrossRef]
  21. Muiruri, A.; Maringa, M.; du Preez, W.B. Evaluation of dislocation densities in various microstructures of additively manufactured Ti6Al4V (ELI) by method of X-ray diffraction. Materials 2020, 13, 5355. [Google Scholar] [CrossRef] [PubMed]
  22. Thejane, K.; Chikosha, S.; du Preez, W.B. Characterisation and monitoring of Ti6Al4V(ELI) powder used in different selective laser melting systems. SAJIE 2017, 28, 161–171. [Google Scholar] [CrossRef] [Green Version]
  23. Semiatin, S.L.; Bieler, T.T. The effect of alpha platelet thickness on plastic flow during hot working of Ti6Al4V with a transformed microstructure. Acta Mater. 2001, 49, 3565–3573. [Google Scholar] [CrossRef]
  24. Semiatin, S.L.; Knisley, S.L.; Fagin, P.N.; Barker, D.R.; Zhang, F. Microstructure evolution during alpha-beta heat treatment of Ti-6Al-4V. Metall. Mater. Trans. A 2003, 34, 2377–2386. [Google Scholar] [CrossRef]
  25. Zheng, Z.; Waheed, S.; Balint, D.; Dunne, F. Slip transfer across phase boundaries in dual phase titanium alloys and effect on strain rate sensitivity. Int. J. Plast. 2018, 104, 23–38. [Google Scholar] [CrossRef]
  26. Kohn, D.H.; Ducheyne, P. Tensile and fatigue strength of hydrogen-treated Ti6Al4V alloy. J. Mater. Sci. 1991, 26, 328–334. [Google Scholar] [CrossRef] [Green Version]
  27. Nemat-Nasser, S.; Wei-Guo, G.; Vitali, F.; Yai-Bei, G. Dynamic response of conventional and hot isostatically pressed Ti6Al4V alloys: Experiments and Modelling. Mech. Mater. 2001, 3, 425–439. [Google Scholar] [CrossRef]
  28. Kocks, U. Laws for work-hardening and low-temperature creep. J. Eng. Mater. Technol. 1976, 98, 76–85. [Google Scholar] [CrossRef]
  29. Follansbee, P.S.; Kocks, U.F. A constitutive description of the deformation of copper based on the use of the mechanical threshold stress as an internal state variable. Acta Metall. 1988, 36, 81–93. [Google Scholar] [CrossRef] [Green Version]
  30. Mecking, H.; Kocks, U. Kinetics of flow and strain-hardening. Acta Metall. 1981, 29, 1865–1875. [Google Scholar] [CrossRef]
  31. Rusinek, A.; Rodrıguez-Martınez, J.A.; Arias, A. A thermo-viscoelastic constitutive model for FCC metals with application to OFHC copper. Int. J. Mech. Sci. 2010, 52, 120–135. [Google Scholar] [CrossRef] [Green Version]
  32. Taylor, G.I. The mechanism of plastic deformation of crystals. Part I.—Theoretical. Proc. R. Soc. London. Ser. A Math. Phys. Sci. 1934, 145, 362–387. [Google Scholar] [CrossRef]
  33. Kassner, M.E. Taylor hardening in five-power-law creep of metals and class M alloys. Acta Mater. 2003, 52, 1–9. [Google Scholar] [CrossRef]
  34. Hull, D.; Bacon, D.J. Introduction to Dislocations, 5th ed.; Elsevier Boulevard: Oxford, UK, 2011; pp. 205–217. [Google Scholar]
  35. Kocks, U.F. Realistic constitutive relations for metal plasticity. Mater. Sci. Eng. A 2001, 317, 181–187. [Google Scholar] [CrossRef] [Green Version]
  36. Kocks, U.F.; Mecking, H. Physics and phenomenology of strain hardening: The FCC case. Prog. Mater. Sci. 2003, 48, 171–273. [Google Scholar] [CrossRef]
  37. Davoudi, K.M.; Vlassak, J.J. Dislocation evolution during plastic deformation: Equations vs. discrete dislocation dynamics study. J. Appl. Phys. 2018, 123, 085302. [Google Scholar] [CrossRef]
  38. Jonas, J.J.; Quelennec, X.; Jiang, L.; Étienne, M. The Avrami kinetics of dynamic recrystallization. Acta Mater. 2009, 57, 2748–2756. [Google Scholar] [CrossRef]
  39. Kumar, A.; Hauser, F.E.; Dorn, J.E. Viscous drag on dislocations in aluminium at high strain rates. Acta Metall. 1968, 16, 1189–1197. [Google Scholar] [CrossRef]
  40. Frost, H.J.; Ashby, M.F. Deformation-mechanism maps. In The Plasticity and Creep of Metals and Ceramics; Pergamon Press: Oxford, UK, 1982; pp. 134–147. [Google Scholar]
  41. Kaapor, R.; Nemat-Nasser, S. Comparison between high and low strain-rate deformation of tantalum. Metall. Mater. Trans. A 2000, 31, 815–823. [Google Scholar] [CrossRef]
  42. Lesuer, D.R.; Kay, G.; LeBlanc, M. Modelling large-strain, high-rate deformation in metals. In Proceedings of the Third Biennial Tri-Laboratory Engineering Conference on Modelling and Simulation, Pleasanton, CA, USA, 20 July 2001. [Google Scholar]
  43. Muiruri, A.; Maringa, M.; du Preez, W. Crystallographic texture analysis of as built and heat-treated Ti6Al4V (ELI) produced by direct metal laser sintering. Crystals 2020, 10, 699. [Google Scholar] [CrossRef]
  44. AZO Materials; Titanium Alloys—Ti6Al4V Grade 5. Available online: https://www.azom.com/article.aspx?ArticleID=1547 (accessed on 7 November 2020).
  45. Shi, J.; Zirky, M.A. Grain-boundary interactions and orientation effects on crack behavior in polycrystalline aggregates. Int. J. Solids Struct. 2009, 46, 3914–3925. [Google Scholar] [CrossRef] [Green Version]
  46. Xu, D.M.; Wan, X.L.; Yu, J.X.; Xu, G.; Li, G.Q. Effect of grain refinement on strain hardening and fracture in austenitic stainless steel. Mater. Sci. Technol. 2018, 34, 1344–1352. [Google Scholar] [CrossRef]
Figure 1. Microstructural variable-based constitutive model flow diagram for yield strength and flow stress.
Metals 11 01628 g001
Figure 2. Secondary electron images (SEI) of heat-treated samples (a) C, (b) D, and (c) E of DMLS Ti6Al4V(ELI).
Metals 11 01628 g002
Figure 3. Graphical description of the Hall–Petch relationship for DMLS Ti6Al4V(ELI).
Metals 11 01628 g003
Figure 4. The shear modulus of Ti6Al4V(ELI) as a function of absolute temperature.
Metals 11 01628 g004
Figure 5. The normalised thermal-activated part of yield stress against the effects of temperature at a strain rate of 750 s−1.
Metals 11 01628 g005
Figure 6. Flow stress curves at different temperatures and constant parameters   h and k 2 and fixed initial dislocation density ( ρ o ).
Metals 11 01628 g006
Figure 7. Effects of the initial dislocation density on the flow stress for fixed values of parameters   h and   k as well as temperature.
Metals 11 01628 g007
Figure 8. Experimental flow stress curves and those predicted by the model (without the viscous drag effect) at a test temperature of 25 °C and different strain rates for samples (a) C, (b) D, and (c) E.
Metals 11 01628 g008
Figure 9. The viscous drag stress component against strain rate at various values of the curve-fitting parameters ζ and χ .
Metals 11 01628 g009
Figure 10. Evolution of the viscous drag stress as a function of strain rate for samples C, D, and E.
Metals 11 01628 g010
Figure 11. Comparison of the modified model prediction and experimental results for sample C at three high strain rates and at test temperatures of (a) 25 °C, (b) 200 °C, and (c) 500 °C, and (d) the correlation between the predicted values and those obtained from experimentation at yielding and at a strain of 0.2.
Metals 11 01628 g011
Figure 12. Comparison of the modified model prediction and experimental results for sample D at three high strain rates and at test temperatures of (a) 25 °C, (b) 200 °C, and (c) 500 °C, and (d) the correlation between the predicted values and those obtained from experimentation at yielding and at a strain of 0.2.
Metals 11 01628 g012
Figure 13. Comparison of the modified model prediction and experimental results for sample E at three high strain rates and at test temperatures of (a) 25 °C, (b) 200 °C, and (c) 500 °C, and (d) the correlation between the predicted values and those obtained from experimentation at yielding and at a strain of 0.2.
Metals 11 01628 g013
Table 1. EOSINT M280 DMLS processing parameters.
Processing VariableValue
Laser diameter80 µm
Layer thickness30 µm
Hatch spacing100 µm
Scanning speed1400 m/s
Laser power setting175 W
Table 2. Evaluated model-fitting parameters describing the thermal part of the yield stress of samples C, D, and E.
Samples Mechanical   Threshold   Stress   ( σ o ) Normalised   Activation   Energy   ( g o i )
C1085.47 MPa0.253
D1064.39 MPa0.251
E1039.75 MPa0.254
Table 3. The initial density of dislocations for different microstructures of DMLS Ti6Al4V(ELI) [21].
Samples TypeDislocation Density (m−2)
C5.73 × 1014
D5.09 × 1014
E7.00 × 1014
Table 4. Calibrated curve-fitting parameters for the viscous drag component of yield and flow stress for DMLS Ti6Al4V(ELI) samples.
SamplesViscous Drag Stress Fitting Parameters
ζ (MPa)X
C2070.00020
D2100.00032
E2100.00030
Table 5. A summary of constitutive flow stress model parameters for DMLS Ti6Al4V(ELI).
Prescribed ParametersValue and UnitsFitted ParametersValues and Units
Boltzmann constant ( k b )1.38 × 10⁻²³ m2·kg·s−2. K−1 σ o 1063.2 MPa
Shear modulus ( μ ) 49.02 5.821 e 181 T 1   GPa g 0 i 0.25
Burgers vector (b) 2.95   ×   10 10   m h 8.3 × 10¹⁵ m−2
Reference strain rate ( ε ˙ o )107 s−1 k 2 10
Grain sizes (d)Measured valueζ
Sample C2.5 µmSamples C207 MPa
Sample D6.0 µmSamples D210 MPa
Sample E9.0 µmSamples E210 MPa
Initial dislocation densityMeasured values in (m2)χ
Sample C5.73 × 1014Samples C0.00032
Sample D5.09 × 1014Samples D0.00030
Sample E7.00 × 1014Samples E0.00020
Hall Petch constant ( K H P )0.328 MPa.m1/2
P1
Q2
Taylor factor ( M )3
α 0.2
Table 6. Absolute error (δ) and correlation coefficient (R2) for the correlation of experimental and predicted values of yield stress for various forms of DMLS Ti6Al4V(ELI).
Samples TypeR2δ
At YieldingAt Strain of 0.2At YieldingAt Strain of 0.2
C0.99490.99180.05710.0195
D0.99370.98430.04770.0264
E0.98620.97620.02360.0370
Publisher’s Note: MDPI stays neutral with regard to jurisdictional claims in published maps and institutional affiliations.

