
A Novel Specimen Produced by Additive Manufacturing for Pure Plane Strain Fatigue Crack Growth Studies
by
 , , , and
Joel de Jesus
1 ,
,
Micael Borges
1,
Fernando Antunes
1,*,
José Ferreira
1,
Luis Reis
2 and
and
Carlos Capela
3 1
Centre for Mechanical Engineering, Materials and Processes (CEMMPRE), Department of Mechanical Engineering, Univ Coimbra, 3030-788 Coimbra, Portugal
2
IDMEC, Instituto Superior Técnico, Av. Rovisco Pais 1, 1049-001 Lisbon, Portugal
3
Department of Mechanical Engineering, ESTG, Instituto Politécnico de Leiria, Morro do Lena—Alto Vieiro, 2400-901 Leiria, Portugal
*
Author to whom correspondence should be addressed.
Metals 2021, 11(3), 433; https://doi.org/10.3390/met11030433
Submission received: 25 January 2021
/
Revised: 16 February 2021
/
Accepted: 1 March 2021
/
Published: 5 March 2021
(This article belongs to the Special Issue New Trends in Fatigue of Metals)
Abstract
:Fatigue crack growth is usually studied using C(T) or M(T) specimens with through-thickness cracks. The objective of the present study is to propose a cylindrical specimen with central crack, produced by additive manufacturing. This geometry allows to have pure plane strain state along the whole crack front, avoiding the complexities associated with corner points, crack shape, and variation of crack closure along crack front. Additionally, this geometry may be used to develop studies in vacuum, avoiding expensive vacuum equipment, since the air is not in contact with the crack front. Cylindrical specimens of Ti6Al4V titanium alloy were produced by Selective Laser Melting and tested at a stress ratio R = 0. Marking with overloads was the solution adopted to measure the length of the internal cracks. The fracture surfaces presented circular crack fronts and the da/dN-ΔK curves showed a great influence of atmosphere on fatigue crack growth. An average difference of 50% was found between the results in air and vacuum. Therefore, this geometry with internal crack is an interesting alternative to through-thickness geometries.
1. Introduction
Fatigue crack growth (FCG) in metals is typically studied using da/dN-ΔK plots obtained experimentally in C(T) or M(T) specimens [1,2]. These geometries have through-thickness cracks, and the crack front may be divided into one interior region, two near-surface regions, and two corner points. The interior region is usually assumed to be under plane strain conditions, while the near surface regions are expected to have plane stress state. The thickness of the specimens is quite variable, ranging typically from 1 mm to 20 mm. Specimens with a thickness lower than 4 mm are usually assumed to be under plane stress state [3,4], while specimens with a thickness higher than 10 mm are considered to have a dominance of plane strain state [5,6]. However, even very thick specimens have surface regions, which may be expected to influence FCG rate. On the other hand, thin specimens still have interior regions. Therefore, the use of specimens with through-thickness cracks does not permit pure stress states and there is a great uncertainty about stress state. Branco et al. [7] proposed the use of lateral notches on through-thickness cracks in order to reduce the extent of surface region and promote plane strain state, but this does not eliminate the corner points and its effect on FCG. Other mode I geometries have also been used, like corner crack specimens [8], single edge notch tension specimen (SENT), and three-point single edge notch bend specimen or tapered double cantilever beam (TDCB), but all of them have corner points.
In fact, the corner points are a source of complexity. The stress singularity at the corner points, λ*, may be different from r−0.5 [9,10], r being the radial distance from crack tip, which invalidates the concept of stress intensity factor, K. The order of singularity depends on Poisson’s ratio of the material and on the intersection angle of the crack with the free surface, β. The increase of β and the decrease of Poisson’s ratio increases λ*. A crack front normal to the free surface under mode I loading has λ* ≈ 0.45 for a Poisson’s ratio of 0.3 [9,10]. Bazant et al. [10] determined a crack/surface angle that deviates from perpendicular in a manner consistent with subsurface crack advance and increases the vertex singularity to 0.5. For ν = 0.3, the critical angle is 100.4° under mode I loading. The extent of surface regions is also difficult to define and is expected to depend on crack angle at the surface. For the stable crack shapes, the critical angle is expected at the corner points with a singularity λ* = 0.5.
FCG produces a fast convergence to iso-K shapes, i.e., to shapes having a constant distribution of ΔK at all points along crack front, assuming that ΔK is the crack driving force. These shapes propagate in a self-similar way, keeping the shape and the iso-ΔK distribution. In fact, there is one order of magnitude between the variations of crack shape and the corresponding variations of ΔK [11], which means that minor variations of crack shape produce major variations of ΔK. The K solutions proposed in standards for the C(T) and M(T) specimens are mean values obtained in 2D analysis considering a straight crack and a plane strain along all crack front. In the experimental determination of da/dN-ΔK curves, the crack length is usually measured optically at the surface, disregarding the crack shape variations. For a parabolic crack front with the maximum (aaver-asurface)/aaverage permitted by the ASTM E399 (American Society for Testing and Materials) [12], which is 15%, the average K is 12.5% lower than the average K for a straight crack [13].
Another main issue in this context is the variation of plasticity-induced crack closure (PICC) along the crack front. There is a great controversy about the relevance of this phenomenon on FCG, however, there is a consensus that crack closure is much more relevant for plane stress state compared with plane strain state. Ewalds and Furnée [14] measured crack closure in a Middle-Tension (MT) specimen made of 2024-T3 aluminium alloy and then removed surface layers at both sides of the specimens. The thickness reduction produced a significant drop of crack opening stress. Matsuoka and Tanaka [15] obtained similar results in a 5083 aluminium alloy. They removed surface layers after an overload, which drastically decreased the retardation of FCG rate. Ray and Grandt [16] used optical interferometry in transparent polymer specimens and observed larger amounts of crack closure at surface. Wei and James [17] studied C(T) specimens with thicknesses of 2 and 10 mm and measured higher closure values for the thinner geometry. Bao and McEvily [18] studied C(T) specimens 0.3 and 6.35 mm thick with similar results. Lateral notches were also considered to obtain a plane strain state in a 4-point bending test specimen [19]. Also, the numerical studies showed lower values of PICC for plane strain state compared with the plane stress state [20,21]. The difference between plane stress and plane strain states is also evident in 3D numerical analysis [22,23]. Besides, there are researchers arguing that PICC does not exist (particularly for plane strain conditions), even suggesting that the plastic wake is responsible for crack opening and not for crack closure [24,25,26]. All these results indicate that along a crack front, crack closure is more relevant near the corner points and less important inside the specimen. The extent of near surface region having a significant level of PICC is also an important issue. Vor et al. [23] observed a thickness of 1 mm near the surface under constant amplitude loading, but the application of overloads produces a significant increase of the surface affected region. Camas et al. [27] showed that the surface region increases with K in C(T) specimens. The reduction of effective ΔK near the surface has a significant effect on crack shape. In order to account for the effect of surface on FCG, some authors proposed the use of constraint factors in 2D studies [28].
In summary, the use of through cracks in the study of FCG involves several issues, namely the complex shape of the cracks, which is greatly affected by crack closure phenomenon. There is a great uncertainty about the dominant stress state, or even of the extent of surface region near corner points. Therefore, it would be interesting to have specimen geometries with pure stress states and well defined geometry of the crack front. The main objective of this paper is to propose a specimen geometry that permits pure plane strain state along the whole crack front. This geometry takes advantage of the novel additive manufacturing technologies, in order to introduce a central crack in a cylindrical geometry. This specimen is an excellent opportunity to finally obtain results for pure plane strain state, which can be compared with results from classical geometries.
Note that the internal cracks are not new in the context of FCG. They have been widely observed in studies with low applied stress levels, leading to very high cycle fatigue conditions [29,30], but can also occur in components with internal production defects. However, in very high cycle fatigue regime (VHCF), the crack’s shape and initiation position are random and typically are not centered relatively to the axis of the cylindrical specimen. The cylindrical specimens produced by additive manufacturing (AM) that are being proposed have a controlled position of the cracks. Juneta et al. [31] proposed a different strategy to produce internal defects. Fatigue specimens designed with controlled internal defects were obtained by diffusion bonding of Ti-6Al-4V sheets. However, the defects were not placed at the center of the specimen.
The novel specimen geometry may also have a second interest. In fact, since the crack is inside the cylindrical specimen, the atmosphere is not accessible to the crack front. The effect of environment is particularly relevant for relatively low values of FCG rate, namely in region I of da/dN-ΔK curves [32]. In fact, the environmental attack is time dependent, competing with cyclic plastic deformation mechanism. Near-threshold, the FCG rate is small, giving time for the environmental attack. The effect of environment is typically studied using vacuum chambers, which eliminates environmental effects at the crack tip. However, this is a complex and expensive equipment that is not available at all laboratories. Therefore, the proposed geometry is also a simple and cheap strategy to develop studies in vacuum.
The validity of the proposed concept was tested in specimens made of Ti6Al4V titanium alloy, having an external diameter of 10 mm.
2. Production of Specimens by Selective Laser Melting (SLM)
Figure 1 presents the geometry proposed for the novel specimen. It is a cylindrical geometry with a larger diameter at the extremities for the fixation in the testing machine. In the working area, the specimen has a diameter of 10 mm. The interior crack is nearly cylindrical, having an initial diameter of 0.5 mm and a thickness of 0.2 mm. The only technical requirement is the existence of an internal defect at the center of the specimen. The size and shape of this defect is not a problem for crack propagation studies. A second geometry that was very similar was defined for crack‘s behavior comparison, as illustrated in Figure 2. In this geometry, a small tunnel was included along the axis of the specimen, with a diameter of 0.4 mm, to provide access of air to the crack front region. The objective is to compare FCG results from both specimens, in order to evaluate the effect of vacuum. The grips of the testing machine do not prevent the passage of the air.
The specimens were synthesized by Lasercusing® (3D Systems, Rock Hill, SC, USA) with layers growing towards the direction of loading application. The samples were processed using a The ProX DMP 320 (3D Systems, Rock Hill, SC, USA) high-performance metal additive manufacturing system, incorporating a 500 W fiber laser. Powders were deposed layer by layer with approximately 60 µm thickness. Metal powder was the Titanium Ti6Al4V Grade 23 alloy. The total number of specimens produced was 8, being 4 with the channel and the other 4 without a channel. The deposition plane was coincident with the plane of the cross section of specimens and were built with layers of 30 µm. After samples production, they were submitted to a heat treatment of residual stress relief that consisted on heating the samples up to 670 °C and kept at this temperature for 5 hours and then cooled at room temperature. After all processes, the specimens were machined and polished for the final dimensions (Rz = 3.17 µm). Faces of the specimen were prepared according to the standard metallographic practice and observed using an optical microscope. Figure 3 presents the microstructure showing an acicular morphology where two phases of material are identified with a martensitic phase α (in the form of black needles) due to the fast solidification and columnar phase β represented by the grey areas. Only a small amount of internal micro pores was observed.
3. Experimental Determination of da/dN-ΔK Curves
The fatigue tests were carried out in a servo hydraulic machine, applying a sinusoidal wave under stress-controlled conditions at R = 0, room temperature, and 15 Hz of frequency. The maximum load was 30 kN, which gives a maximum remote stress of 382 MPa. Marking was made with the application of overloads with an overload ratio of 2. These overloads were applied when the displacement range increased by 0.002 mm. The displacement range was measured using a 12.5-mm gauge length extensometer clamping it directly to the gauge zone of the specimen. The a-N curves were obtained with the recorded number of cycles between overloads and the distance between each overload. The distance between overloads was measured on the fracture surface using an optical microscope. This microscope was also used to photograph the fracture surfaces.
The cracks systematically initiated from the central defect, which indicates that the AM process is adequate to produce artificial defects in components. Figure 4 shows two representative examples of fracture surface. Figure 4a resulted from crack propagation in air while Figure 4b resulted from crack propagation in vacuum. The cracks propagated from the central defect assuming a circular shape in both cases, as can be observed in Figure 4 (white arrows). The red arrows in Figure 4a,b indicate the overload marking and the final fracture. The presence of the air, Figure 4a, led to a more irregular fracture surface and the overload marks are less visible. Mi and Alliabadi [33] numerically studied the propagation of central cracks in cylindrical bars and predicted circular shapes, as obtained here experimentally. Juneta et al. [31] also observed circular shapes using synchrotron tomography in situ testing. The eventual deviation from a circular shape indicates a deviation from axial loading to a mix between bending and tension. This issue was studied by Kim et al. [34] in circular notched bar specimen, where the crack propagates from outside to the center of the specimen.
The resulting a-N curves are presented in Figure 5, and it is possible to perceive that FCG life in vacuum is higher than in air. In other words, for the same crack extension, the number of cycles to achieve the crack extension is higher in vacuum, which means that the FCG rate in vacuum is lower than in air. The idea that the vacuum produces lower crack growth rates was corroborated in past works of Murakami [35] and Ferreira et al. [36]. Mathematical expressions were fitted to the a-N points, as indicated in Figure 5.
FCG rates were obtained from a-N plots. K values were obtained from the following stress intensity factor solution [37]:
where a is the radial crack length, r is the radius of the specimen, and λ = a/r. da/dN was obtained by differentiation of the mathematical equations presented in Figure 5. Figure 6 presents the da/dN vs. ΔK results obtained experimentally. da/dN is lower under vacuum than in air, as was expected considering the results of Figure 5. An average difference of 50% was found between the results in air and vacuum. A comparison was made with results obtained in air in C(T) specimens with a thickness of 6 mm [38]. The material and production process were the same. There is a significant difference between the through-thickness results and those obtained with interior cracks, mainly for higher ΔK. This may be due to the effect of stress state, which is pure plane strain in the central crack and mixed in the through-thickness crack. Note that in the C(T) specimen, the increase of crack length promotes plane stress state, which may explain the increasing difference. There may also exist an influence of the overloads on constant amplitude loading. In fact, the application of overloads is known to delay crack growth rate, but the effect is more relevant near the surface [39]. At the internal cracks, the effect of the overloads is less relevant due to the plane strain state, anyway there is an effect. Finally, the difference may also be due to imprecision in the measurement of crack length. Note that the objective here is just to prove that the proposed geometry works can be used to study FCG of internal cracks. The curves presented in Figure 6 are therefore merely illustrative. The detailed analysis of the effect of stress state and environment on FCG rate is addressed for future work.
Juneta et al. [31] showed with synchrotron X-ray tomography that the internal crack growth rates are lower than those of surface cracks. Yoshinaka et al. [40] also obtained crack growth rates in vacuum smaller than in air. The retarding effect of vacuum compared with air is explained by the high plasticity and high reversibility of slip. These peculiarities in vacuum are attributed to the absence of oxides and adsorbates on a newly-formed slip stage at the crack tip, which prevents dislocation motion. Sub-surface crack is considered to be exposed to the environment almost without oxidation and gas adsorption, i.e., vacuum-like environment. In other words, the effects of oxidation or gas adsorption on crack propagation could be almost ignored in the internal crack propagation processes [41,42]. As a result, remarkably similar fracture surfaces were observed between a surface fracture in vacuum and in an internal fracture, although completely different fracture surfaces were obtained between a surface fracture in vacuum and that in air. Also, Benedetti et al. [42] reported that the fracture surface of the shot peened specimen, which fractured by the internal crack, bore a remarkable resemblance to that of the as-received specimen tested in vacuum. These results indicate that the environment inside the internal cracks is similar to a vacuum and has a crucial effect on internal crack propagation. Yoshinaka et al. [40] also conducted crack propagation tests on Ti–6Al–4V in ultrahigh vacuum focusing on long cracks and clarified that the crack propagation rate da/dN was significantly lower in vacuum than in air. This result suggests that the long fatigue lives of internal fractures can be attributed to such low propagation rates of internal cracks due to a vacuum-like environment. Stanzl-Tschegg and Schönbauer [43] studied FCG 12% chromium steels. Comparison of fracture surfaces of fatigue crack growth specimens tested in vacuum and specimens where fish-eye fractures formed shows similar features in the VHCF range. Thus, fractographic features, which are identified as typical for defined crack growth rates in vacuum, allow estimating the crack growth rates in the different fish-eye areas. The effect of the atmosphere is particularly relevant for small crack growth rates, because the diffusion is a time-dependent mechanism. However, it is questionable if small atoms, like hydrogen, are able or not to move from the surface of the specimen to the interior regions. In addition, the volume of the internal crack is occupied by air, but since the specimens were produced in an inert environment, this is not a problem.
4. Numerical Analysis
A numerical model was developed to quantify the impact of the overloads on fatigue life and its dependence on stress state. This numerical model is described in detail in the work of Ferreira et al. [44]. The numerical simulations of the FCG were performed using the in-house finite element code DD3IMP (University of Coimbra, Coimbra, Portugal), which was originally developed to simulate sheet metal forming processes [45].
The elasto-plastic behaviour of the titanium alloy was modeled by phenomenological constitutive models. The elastic behaviour was considered isotropic and was described by the Hooke’s law. Regarding the plastic response, the isotropy is defined by the von Mises yield criterion while the isotropic hardening behaviour is described by the Swift law, where the flow stress is given by:
where denotes the equivalent plastic strain, while , and n are the isotropic hardening parameters. The kinematic hardening behaviour is described by the Armstrong–Frederick model [27], which can be written as:
where is the deviatoric Cauchy stress tensor, X is the back-stress tensor, and is the equivalent stress. CX and XSat are the kinematic hardening parameters.
The isotropic and kinematic hardening parameters were calibrated using stress–strain curves obtained in low cycle fatigue tests. The parameters calibration was based on the least-squares minimization of the differences between analytically fitted and experimentally measured values of stress. The obtained hardening parameters are listed in Table 1.
Crack tip region was modeled using finite elements with 8 × 8 μm2, as illustrated in Figure 7. Only a single layer of elements was used in the thickness direction, having a thickness of 0.1 mm. The hexahedral finite elements used a selective reduced integration technique to avoid volumetric locking. The contact of the crack flanks was modeled considering a fixed flat (rigid) surface in the symmetry plane, which prevented the overlapping of crack flanks during unloading. The refined element size (in this zone allows the accurate evaluation of the strong stress gradients). Boundary conditions were imposed in order to obtain pure plane stress or pure plane strain states. The remote loading was controlled in order to obtain specific values of ΔK and Kmax.
In the present finite element model, the nodes over the crack path are progressively released, allowing the simulation of crack advance. The FCG criterion is based on accumulated plastic strain, assuming that crack tip deformation is the driving force. The crack tip node is released when the accumulated plastic strain reaches a critical value, which is calibrated using one experimental value of da/dN. Each crack increment has 8 μm, which is the size of finite elements. The arrow in Figure 7 indicates the crack growth direction. Since the equivalent plastic strain is numerically evaluated only at the Gauss points while the crack propagation is defined by nodal release, the plastic strain at the crack tip (node) is required. Hence, it is obtained by an average of the equivalent plastic strain evaluated in the two Gauss points around the crack tip node (immediately behind and ahead). Besides, the release of the node defining the crack tip occurs always at the instant of minimum load. The numerical value of da/dN is obtained dividing the crack increment of 8 μm (element size) by the number of load cycles required to reach the critical value of plastic strain.
The impact of the overloads on fatigue life was studied considering three numerical models. The models contemplated the constant amplitude (CA) case and two values of overload ratio (OLR), equal to 1.25 and 1.75, the OLR being defined as follows:
where FOL is the peak load. The effect of stress state was also taken in consideration by implementing plane strain and plane stress state, giving rise to a total of six numerical models. All models were submitted to the same conditions, the overload being applied at aOL = 16.12 mm, corresponding to a baseline stress intensity factor range, ΔKBL, equal to 18.3 MPa√m.
Figure 8a,b shows the predicted FCG rate versus crack growth, in plane strain and plane stress states, respectively. The overload was applied at a-aOL = 0 mm. The growth of the crack post overload is represented by positive values of a-aOL. As can be seen, some crack propagation is required before the overload to stabilize the cyclic plastic deformation and crack closure, to accurately predict the FCG rate after the overload. This stabilization is particularly important in plane stress state, as shown in Figure 8b. Classical trends are obtained after the application of the single tensile overload. A peak of rate is observed after the overload, followed by a non-instant reduction of rate up to a minimum, showing delayed retardation. After the slowest rate, the advancing of the crack is followed by a progressive increase of rate tending to the rates observed in constant amplitude. In plane stress state (Figure 8b), the fluctuations of rate associated with the transient growth of the crack are more pronounced than in plane strain state (Figure 8a). Indeed, the peak and minimum rates are higher and lower, respectively, in plane stress state, considering the same OLR. Also, the crack growth between the maximum and minimum rates, and the crack growth associated with the transient regimes (marked as small vertical filled lines) are higher in plane stress state. Therefore, although similar trends are obtained independently of stress state, the application of a single tensile overload has more effect on plane stress state.
Figure 9a,b shows the effect of the overload ratio on crack length, in plane strain state and plane stress state, respectively. As shown, the increase of OLR promotes a higher number of delay cycles and crack length in the transient regime, as expected, which can be seen by the separation of the OLR curves relatively to the constant amplitude case. Considering the OLR equal to 1.75 and plane strain state, there is a delay of about 1250 cycles and a crack growth of 0.188 mm (see Figure 9a). However, in plane stress state the delay takes about 5400 cycles and a crack growth of 0.436 mm. Since the central crack specimen has pure plane strain state, the effect of overload on fatigue life is relatively small comparatively to through-crack specimens. Looking to Figure 5, it is possible to see that 1250 cycles have a small effect on the location of experimental points.
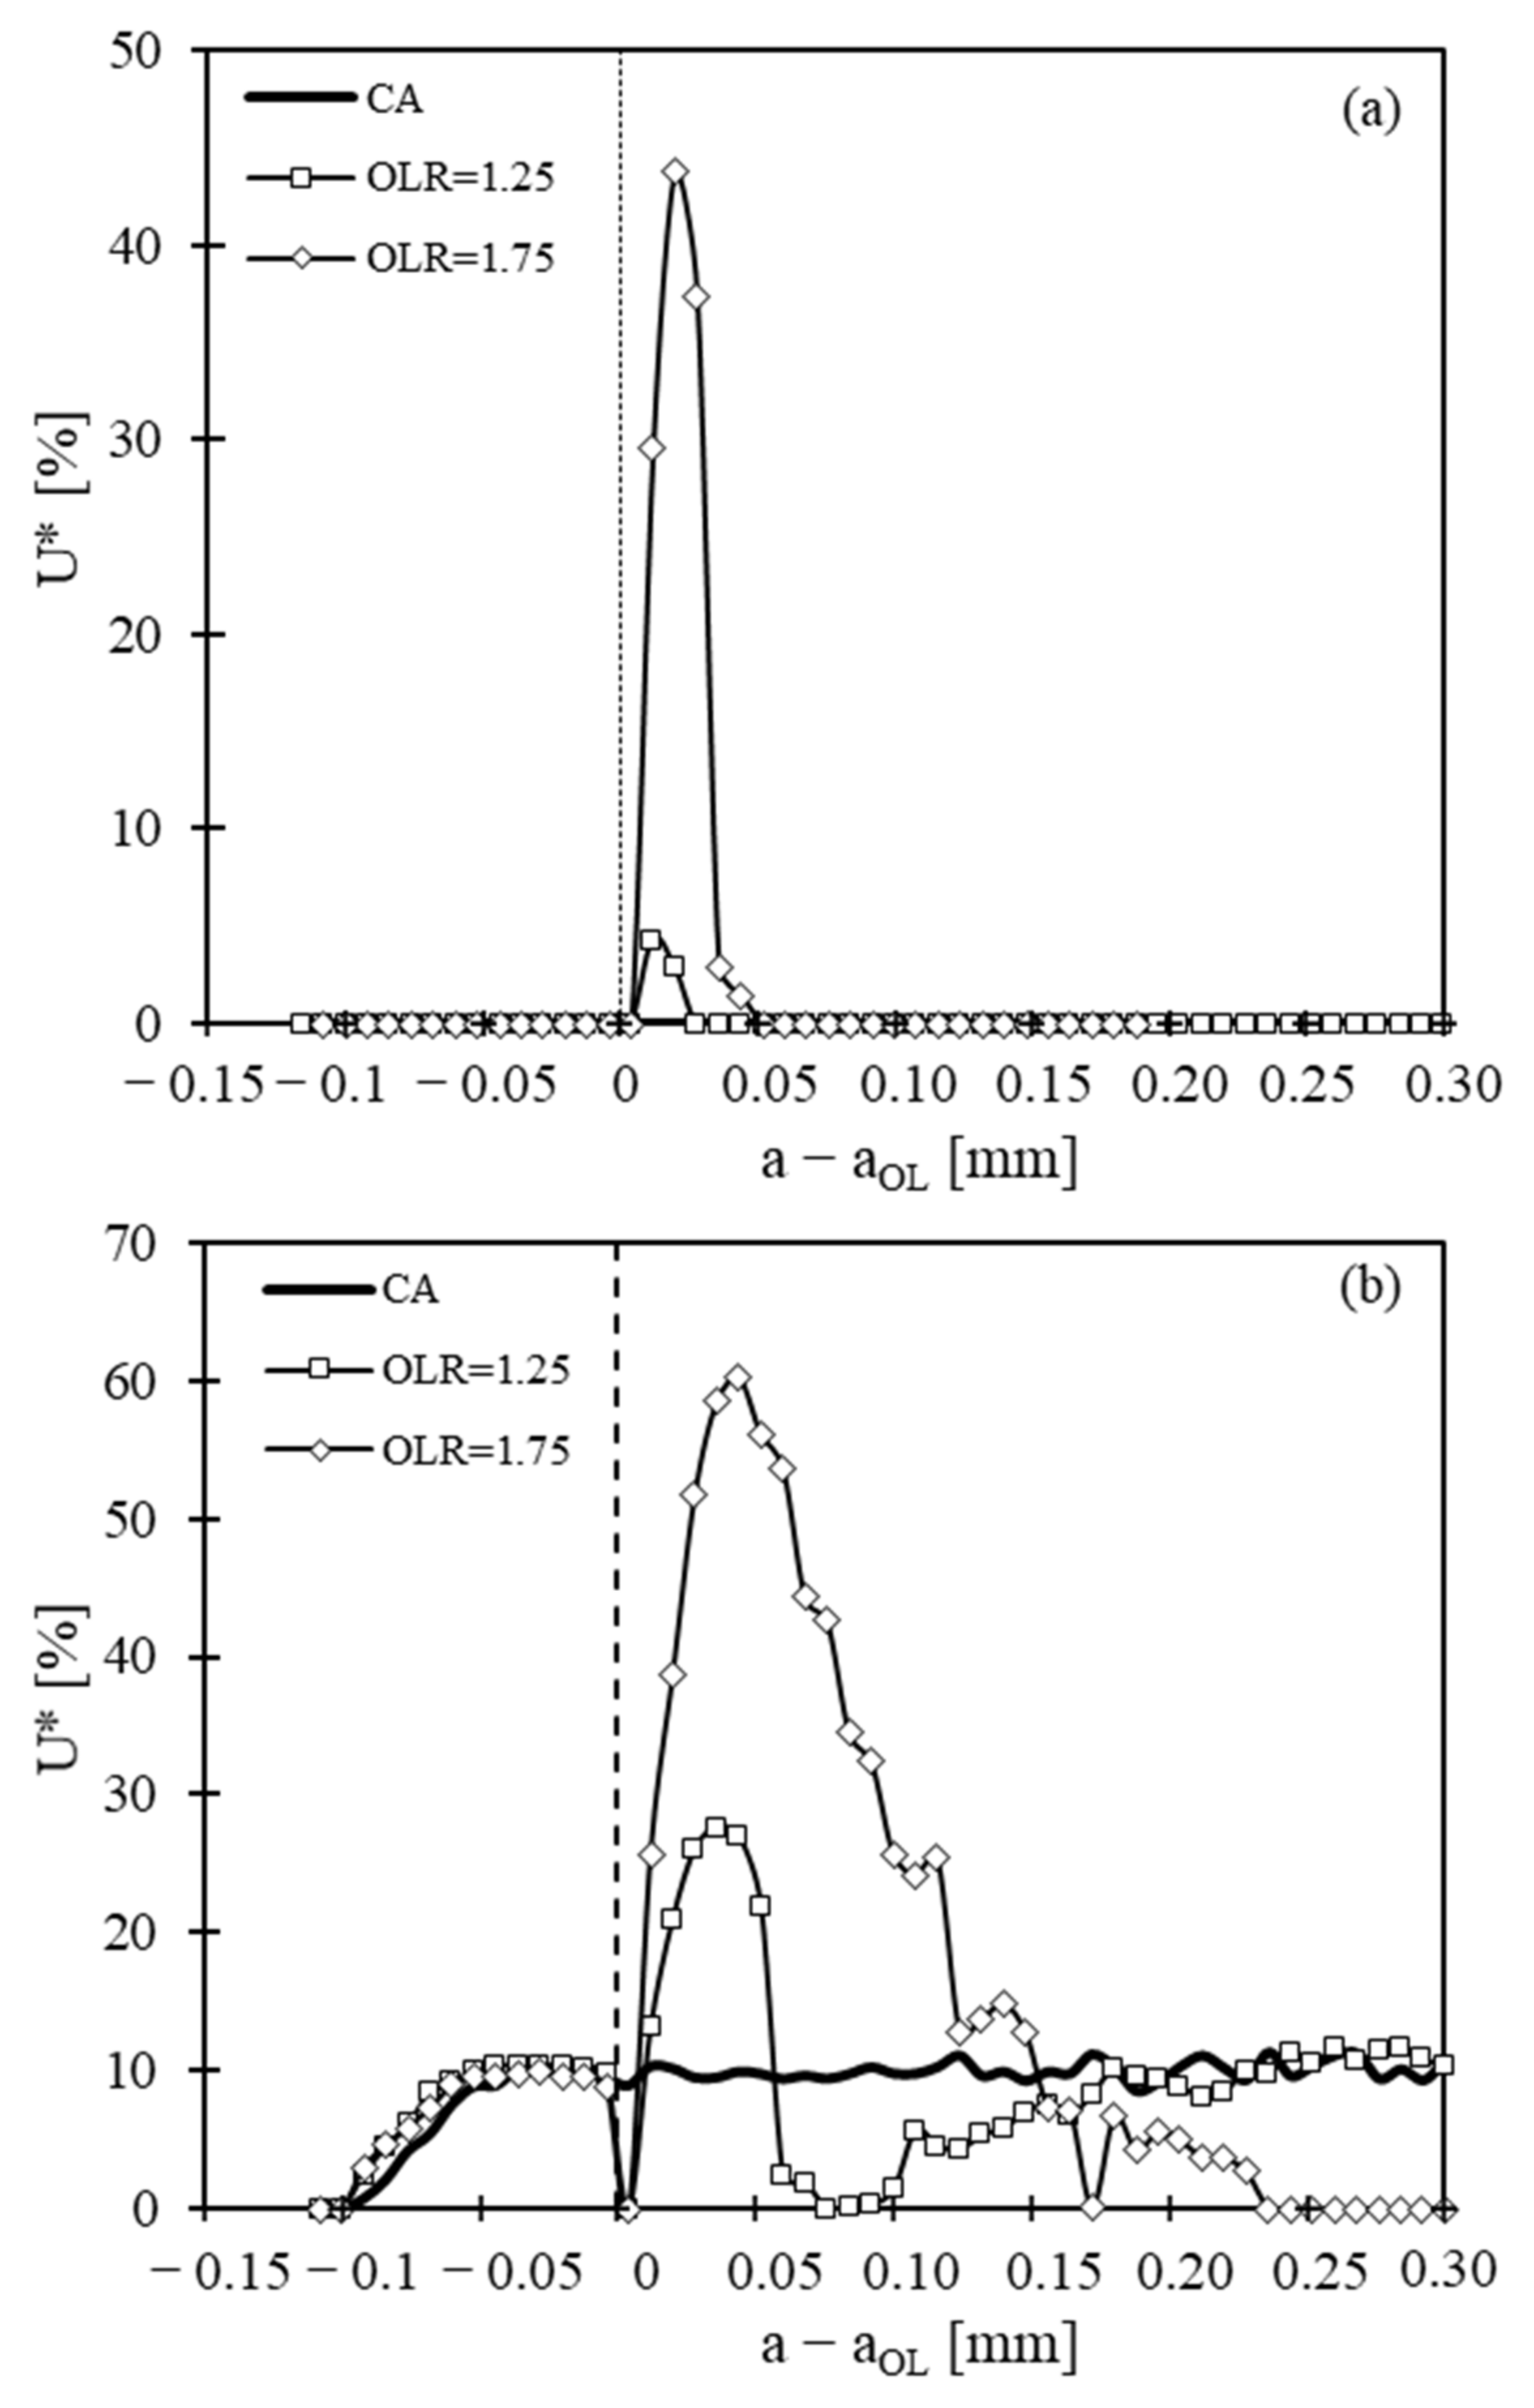
Crack closure level was evaluated at the first node behind the crack tip, i.e., at a distance of 8 μm, by measuring the crack tip opening displacement, CTOD, at this node. In this study, U* quantifies the crack closure level and represents the percentage of load at which the crack is closed, as follows:
where Fopen is the crack opening load.
Figure 10a,b plots U* versus crack growth. Regarding plane strain state, Figure 10a, there is no crack closure in constant amplitude. When a single tensile overload is applied, an increase of U* takes place up to a peak. This maximum value of U* is 4% for OLR = 1.25 and 44% for OLR = 1.75. Although crack closure is significantly higher for OLR = 1.75, the crack growth affected by crack closure is similar to the one found for OLR = 1.25. In plane stress state, Figure 10b, U* reaches levels of 10% before the application of the overload. When the overload is applied, crack closure is suddenly eliminated, due to crack tip blunting, and then rises up to a maximum value, this maximum being equal to 28% for OLR = 1.25 and 60% for OLR = 1.75. The crack growth affected by the overload is much higher in plane stress state.
5. Discussion
The C(T) and M(T) specimens have been extensively used to study different issues of FCG. They are very interesting to develop parametric studies focused on the effect of ΔK, stress ratio, variable amplitude loading, material, and environmental conditions. There are standards defining not only the geometry but also all experimental procedure, which facilitates comparative studies. However, there is always a mixture between plane stress state near corner points and plane strain state at interior positions. As the crack propagates, the area of influence of plane stress state at the surface enlarges [46], which may affect FCG rate. To take a step forward in the understanding of FCG, new concepts are needed to study specific issues of FCG. The specimen geometry proposed here is interesting because it permits a pure plane strain state. In fact, the crack front only has interior points, which are known to have pure plane strain state [47]. Therefore, all the complexities associated with crack shape, corner points, and variation of crack closure along crack front are avoided. Besides, since there is no access of atmosphere to the crack front, the results can be considered obtained in a certain vacuum. Therefore, the specimens may be used to develop comparative studies in air and vacuum, avoiding expensive vacuum chambers. They may also be used to study FCG of internal cracks, which are relevant for low levels of stress in the very high cycle fatigue regime. The main problem of specimens with central crack is the difficulty of measurement of crack length inside the specimen. The crack length is usually measured optically on the surface of C(T) or M(T) specimens, as recommended in standards [1,2]. In internal cracks this is not possible, therefore indirect measurements of crack length are required. This is a challenging task that falls in the field of structural health monitoring, which is a powerful tool of modern industry able to continuously evaluate the fatigue damage of engineering parts. The solution adopted here consisted in the use of an extensometer to detect small variations of compliance and the marking of fracture surfaces with overloads. However, for small crack lengths there is a minor variation of compliance, which is very difficult to detect with the extensometer. Besides, the use of overloads as marker bands has a local effect on FCG, increasing the fatigue life. The plane strain state reduces this negative effect of overload marking, since the application of overloads in through-thickness cracks is felt essentially near the corner points. Anyway, there is some effect on fatigue life. Alternative approaches may be proposed for crack length measurement, namely:
- the use of synchrotron tomography and in situ testing [31]. However, this needs complex equipment that is not easily available. Additionally, it would not be easy to place the mechanical device needed to apply the load, inside the tomography equipment.
- use of vibration analysis to measure crack length. The resonant frequency depends on material properties and geometry. The presence of defects may change the resonant frequency. Macek et al. [48] proposed the use of the changes in the dynamic response, using uniaxial acceleration sensors, enabling the correlation of the stiffness variations with the crack length.
- use of potential drop. A similar problem exists in tests at elevated temperature inside a furnace even using standard specimens [49]. Therefore, crack length was measured using a potential drop. Small wires made of titanium were welded to opposite flanks of the notch, and the crack growth produces an increase of potential drop. A calibration curve was used to obtain crack length from potential drop measurements. Campagnolo et al. [50] studied fatigue crack initiation and propagation phases of cylindrical circumferentially notched specimens characterized by different values of the notch tip radius. Crack length was monitored by the electrical potential drop method, and the calibration curves were derived by means of electrical finite element analyses.
- The variation of compliance is an alternative solution to measure the crack length. This is also proposed in ASTM standard for the measurement of crack length in C(T) and MT specimens.
The specimen with a central crack must be produced and tested following well-defined recommendations, in order to facilitate the preparation of specimens and promote the comparability of results. The rules must include the specimen geometry (diameter and size of defect) and the testing procedure. For the moment, diameters of 10 mm and 0.5 mm seem to be adequate for the specimen and defect, respectively. Further work is necessary to define the procedure for measurement of crack length and to check the validity of K solution.
6. Conclusions
A novel cylindrical specimen with a central crack is proposed in this work to study fatigue crack growth under pure plane strain conditions in both air and vacuum environments. The specimen is produced by additive manufacturing, which permits the positioning of the crack at a central position. Ti6Al4V titanium alloy specimens were produced by SLM with a diameter of 10 mm. The specimens were tested and the crack propagated as expected, producing circular crack shapes. Marking with overloads was used to measure crack length, in order to obtain a-N and da/dN-ΔK curves. This specimen geometry has several advantages namely:
- A pure plane strain state exists along all crack front.
- There is no crack closure level under plane strain state for the titanium alloy studied. Under plane stress state, a crack closure level of 10% was predicted.
- The crack grows, keeping a circular shape, without corner points. This avoids different issues, namely the effect of crack shape on compliance changes. Besides, any departure from pure circular shape is an indication of incorrect loading alignment.
- Delays of 1250 cycles and 5400 cycles were found under plane strain and plane stress states, respectively, for an overload ratio of 1.75. Therefore, under plane stress state there is a much higher effect of overloads on fatigue life. Although there is a plane strain state in the central cracked specimens, overloads can affect the da/dN-ΔK curves. Thus, alternative approaches not involving the application of overloads are recommended for crack length measurement, which will be exploited in the near future.
- Since the atmosphere does not have access to crack front, the specimens are also interesting to develop studies in vacuum. Similar specimens with channels to conduct air to the crack front may be produced for comparative studies of the effect of atmosphere. These comparative studies are more relevant at relatively low crack growth rates because the diffusion is a time-dependent mechanism.
The only disadvantage identified is the difficulty in measuring crack length inside the specimen. Further work is however needed for an accurate measurement of crack length inside the cylindrical specimen. After optimization of the procedure, these specimens can be used for comparative studies with through-thickness studies, in order to understand the effect of stress state on da/dN-ΔK curves, to study the effects of ΔK, stress ratio, and overloads under plane strain conditions, and to clarify the existence or not of crack closure under plane strain state.
Author Contributions
Conceptualization, F.A.; methodology, J.d.J.; software, F.A.; formal analysis, J.d.J.; investigation, M.B. and J.d.J.; resources, C.C.; data curation, J.d.J.; writing—original draft preparation, F.A.; writing—review and editing, L.R., J.F. and F.A.; funding acquisition, J.F. All authors have read and agreed to the published version of the manuscript.
Funding
The authors would like to acknowledge the sponsoring under the project no. 028789, financed by the European Regional Development Fund (FEDER), through the Portugal-2020 program (PT2020), under the Regional Operational Program of the Center (CENTRO-01-0145-FEDER-028789) and the Foundation for Science and Technology IP/MCTES through national funds (PIDDAC), and financial support from FCT—Fundação para Ciência e Tecnologia (Portuguese Foundation for Science and Technology) through the project LAETA/IDMEC, project UIDB/50022/2020. The authors also acknowledge program COMPETE—Programa Operacional Factores de Competitividade—and FCT—Fundação para a Ciência e a Tecnologia –, under the project UIDB/00285/2020.
Conflicts of Interest
The authors declare no conflict of interest.
Nomenclature
| a | Crack length |
| aOL | Crack length at which the overload was applied |
| C(T) | Compact-Tension (specimen) |
| CTOD | Crack Tip Opening Displacement |
| Cx | Material constant of kinematic hardening |
| da/dN | Fatigue crack growth rate |
| K | Stress intensity factor |
| Kmax | Maximum stress intensity factor |
| M(T) | Middle-Tension (specimen) |
| N | Number of load cycles |
| OLR | Overload ratio |
| PICC | Plasticity Induced Crack Closure |
| r | Radius of the specimen with central crack |
| R | Stress ratio |
| SLM | Selective Laser Melting |
| U* | Crack closure level (in percentage) |
| Xsat | Material constant of kinematic hardening |
| Y0 | Initial yield stress |
| β | Angle of crack front with surface at corner point |
| ν | Poisson’s ratio |
| λ | Ratio between the crack length and the radius of the specimen |
| λ* | Order of singularity at the crack tip |
| σ | Remote stress |
| σmax | Maximum remote stress |
| σmin | Minimum remote stress |
| ΔK | Stress intensity factor range |
References
- ASTM. ASTM E 647-11: Standard Test Method for Measurement of Fatigue Crack Growth Rates; American Society for Testing and Materials: West Conshohocken, PA, USA, 2011. [Google Scholar]
- ISO. ISO 12108. Metallic Materials-Fatigue Testing-Fatigue Crack Growth Method; International Organization for Standardization (ISO): Geneva, Switzerland, 2012. [Google Scholar]
- Daneshpour, S.; Koçak, M.; Langlade, S.; Horstmann, M. Effect of overload on fatigue crack retardation of aerospace Al-alloy laser welds using crack-tip plasticity analysis. Int. J. Fatigue 2009, 31, 1603–1612. [Google Scholar] [CrossRef] [Green Version]
- Zheng, S.; Yu, Q.; Gao, Z.; Jiang, Y. Loading history effect on fatigue crack growth of extruded AZ31B mgnesium alloy. Eng. Fract. Mech. 2013, 114, 42–54. [Google Scholar] [CrossRef]
- Shercliff, H.R.; Fleck, N.A. Effect of specimen geometry on fatigue crack growth in plane strain—II overload response. Fatigue Fract. Eng. Mater. Struct. 1990, 13, 297–310. [Google Scholar] [CrossRef]
- Bichler, C.; Pippan, R. Effect of single overloads in ductile metals: A reconsideration. Eng. Fract. Mech. 2007, 74, 1344–1359. [Google Scholar] [CrossRef]
- Branco, R.; Silva, J.M.; Infante, V.; Antunes, F.V.; Ferreira, F. Using a standard specimen for crack propagation under plane strain conditions. Int. J. Struct. Integr. 2010, 1, 332–343. [Google Scholar] [CrossRef]
- Antunes, F.V.; Ferreira, J.A.M.; Branco, C.M.; Byrne, J. Influence of stress state on high temperature fatigue crack growth in Inconel 718. Fatigue Fract. Eng. Mater. Struct. 2001, 24, 127–135. [Google Scholar] [CrossRef]
- Benthem, J.P. State of stress at the vertex of a quarter-infinite crack in a half-space. Int. J. Solids Struct. 1977, 13, 479–492. [Google Scholar] [CrossRef]
- Bažant, Z.P.; Estenssoro, L.F. Surface singularity and crack propagation. Int. J. Solids Struct. 1979, 15, 405–426. [Google Scholar] [CrossRef] [Green Version]
- Branco, R.; Antunes, F.V.; Martins, R.F. Modelling fatigue crack propagation in CT specimens. Fatigue Fract. Eng. Mater. Struct. 2008, 31, 452–465. [Google Scholar] [CrossRef]
- ASTM. ASTM E399-20. Standard Test Method for Linear-Elastic Plane-Strain Fracture Toughness of Metallic Materials; ASTM International: West Conshohocken, PA, USA, 2020. [Google Scholar]
- Towers, O.L.; Smith, A.P. Stress intensity factors for curved crack fronts in compact tension specimens. Int. J. Fracture 1984, 25, R43–R48. [Google Scholar] [CrossRef]
- Ewalds, H.L.; Furnée, R.T. Crack closure measurements along the crack front in center cracked specimens. Int. J. Fract. 1978, 14, R53–R55. [Google Scholar]
- Matsuoka, S.; Tanaka, K. The influence of sheet thickness on delayed retardation phenomena in fatigue crack growth in HT80 steel and A5083 aluminium alloy. Eng. Fract. Mech. 1980, 13, 293–306. [Google Scholar] [CrossRef]
- Ray, S.K.; Grandt, A.F. Comparison of methods for measuring fatigue crack closure in a thick specimen. In Mechanics of fatigue Crack Closure; ASTM STP 982; Newman, J.C., Jr., Elber, W., Eds.; American Society for Testing and Material: West Conshohocken, PA, USA, 1988; pp. 197–213. [Google Scholar]
- Wei, L.-W.; James, M.N. A study of fatigue crack closure in polycarbonate CT specimens. Eng. Fract. Mech. 2000, 66, 223–242. [Google Scholar] [CrossRef]
- Bao, H.; McEvily, A.J. On Plane Stress-Plane Strain Interactions in Fatigue Crack Growth. Int. J. Fatigue 1998, 20, 441–448. [Google Scholar] [CrossRef]
- Josefson, B.L.; Svensson, T.; Ringsberg, J.W.; Gustafsson, T.; de Mare, J. Fatigue life and crack closure in specimens subjected to variable amplitude loads under plane strain conditions. Eng. Fract. Mech. 2000, 66, 587–600. [Google Scholar] [CrossRef]
- Solanki, K.; Daniewicz, S.R.; Newman, J.C., Jr. Finite element modelling of plasticity-induced crack closure with emphasis on geometry and mesh refinement effects. Eng. Fract. Mech. 2003, 70, 1475–1489. [Google Scholar] [CrossRef]
- Zhao, L.G.; Tong, J.; Byrne, J. The evolution of the stress–strain fields near a fatigue crack tip and plasticity induced crack closure revisited. Fatigue Fract. Eng. Mater. Struct. 2004, 27, 19–29. [Google Scholar] [CrossRef]
- Matos, P.F.P.; Nowell, D. The influence of the Poisson’s ratio and corner point singularities in three-dimensional plasticity-induced fatigue crack closure: A numerical study. Int. J. Fatigue 2008, 30, 1930–1943. [Google Scholar]
- Vor, K.; Gardin, C.; Sarrazin-Baudoux, C.; Petit, J. Wake length and loading history effects on crack closure of through-thickness long and short cracks in 304L: Part II—3D numerical simulation. Eng. Fract. Mech. 2013, 99, 306–323. [Google Scholar] [CrossRef]
- Louat, N.; Sadananda, K.; Duesbery, M.; Vasudevan, A.K. A theoretical evaluation of crack closure. Metall. Transact. 1993, 24A, 2225–2232. [Google Scholar] [CrossRef]
- Vasudevan, A.K.; Sadananda, K.; Louat, N. A review of crack closure, fatigue crack threshold and related phenomena. Mater. Sci. Eng. A 1994, A188, 1–22. [Google Scholar] [CrossRef]
- Vasudevan, A.K.; Sadananda, K.; Glinka, G. Critical parameters for fatigue damage. Int. J. Fatigue 2001, 23, 39–53. [Google Scholar] [CrossRef]
- Camas, D.; Garcia-Manrique, J.; Gonzalez-Herrera, A. Numerical study of the thickness transition in bi-dimensional specimen cracks. Int. J. Fatigue 2011, 33, 921–928. [Google Scholar] [CrossRef]
- Newman, J.C. A Crack Opening Stress Equation for Fatigue Crack Growth. Int. J. Fract. 1984, 24, R131–R135. [Google Scholar] [CrossRef]
- Nishijima, S.; Kanazawa, K. Stepwise S–N curve and fish-eye failure in gigacycle fatigue. Fatigue Fract. Eng. Mater. 1999, 22, 601–607. [Google Scholar] [CrossRef]
- Sakai, T. Review and prospects for current studies on very high cycle fatigue of metallic materials for machine structural use. J. Solid Mech. Mater. Eng. 2009, 3, 425–439. [Google Scholar] [CrossRef] [Green Version]
- Juneta, A.; Messager, A.; Boulnat, X.; Weck, A.; Boller, E.; Helfen, L.; Buffiere, J.-Y. Fabrication of artificial defects to study internal fatigue crack propagation in metals. Scripta Materialia 2019, 171, 87–91. [Google Scholar] [CrossRef]
- Sunder, R. Unraveling the Science of Variable Amplitude Fatigue. J. ASTM Int. 2012, 9, 1–32. [Google Scholar] [CrossRef]
- Mi, Y.; Aliabadi, M.H. Three-dimensional crack growth simulation using BEM. Comput. Struct. 1994, 52, 871–878. [Google Scholar] [CrossRef]
- Kim, I.; Zhao, Y.; Choi, B.-H.; Lee, J.M.; Lee, K.-S.; Lee, J.-M. Numerical analysis of asymmetric fatigue crack growth behaviors of circular notched bar specimen resulting from various geometric misalignments. Eng. Fract. Mech. 2013, 108, 50–64. [Google Scholar] [CrossRef]
- Murakami, Y. Metal Fatigue: Effects of Small Defects and Nommetallic Inclusions; Elsevier Science: London, UK, 2002. [Google Scholar]
- Ferreira, N.; Jesus, J.S.; Ferreira, J.A.M.; Capela, C.; Costa, J.M.; Batista, A.C. Effect of bead characteristics on the fatigue life of shot peened Al 7475-T7351 specimens. Int. J. Fatigue 2020, 134, 105521. [Google Scholar] [CrossRef]
- FKM Guideline. Fracture Mechanics Proof of Strength for Engineering Components, 1st ed.; VDMA Publ. House: Frankfurt am Main, Germany, 2001. [Google Scholar]
- Jesus, J.S.; Borrego, L.P.; Ferreira, J.A.M.; Costa, J.D.; Capela, C. Fatigue crack growth behavior in Ti6Al4V alloy specimens produced by selective laser melting. Int. J. Fatigue 2019, 223, 123–133. [Google Scholar]
- Salvati, E.; Zhang, H.; Fong, K.S.; Song, X.; Korsunsky, A.M. Separating plasticity-induced closure and residual stress contributions to fatigue crack retardation following an overload. J. Mech. Phys. Solids 2017, 98, 222–235. [Google Scholar] [CrossRef]
- Yoshinaka, F.; Nakamura, T.; Takaku, K. Effects of vacuum environment on small fatigue crack propagation in Ti–6Al–4V. Int. J. Fatigue 2016, 91, 29–38. [Google Scholar] [CrossRef]
- Nakamura, T.; Oguma, H.; Shinohara, Y. The effect of vacuum-like environment inside sub-surface fatigue crack on the formation of ODA fracture surface in high strength steel. Proc. Eng. 2010, 2, 2121–2129. [Google Scholar] [CrossRef] [Green Version]
- Benedetti, M.; Fontanari, V.; Bandini, M.; Savio, E. High-and very high-cycle plain fatigue resistance of shot peened high-strength aluminum alloys: The role of surface morphology. Int. J. Fatigue 2015, 70, 451–462. [Google Scholar] [CrossRef]
- Stanzl-Tschegg, S.; Schönbauer, B. Near-threshold fatigue crack propagation and internal cracks in steel. Proc. Eng. 2010, 2, 1547–1555. [Google Scholar] [CrossRef] [Green Version]
- Menezes, L.F.; Teodosiu, C. Three-dimensional numerical simulation of the deep-drawing process using solid finite elements. J. Mater. Process. Technol. 2000, 97, 100–106. [Google Scholar] [CrossRef] [Green Version]
- Ferreira, F.F.; Neto, D.M.; Jesus, J.S.; Prates, P.A.; Antunes, F.V. Numerical Prediction of the Fatigue Crack Growth Rate in SLM Ti-6Al-4V Based on Crack Tip Plastic Strain. Metals 2020, 10, 1133. [Google Scholar] [CrossRef]
- Macek, W.; Owsinski, R.; Trembacz, J.; Branco, R. Three-dimensional fractographic analysis of total fracture areas in 6082 aluminium alloy specimens under fatigue bending with controlled damage degree. Mech. Mater. 2020, 147, 103410. [Google Scholar] [CrossRef]
- Werner, K. The fatigue crack growth rate and crack opening displacement in 18G2A-steel. Int. J. Fatigue 2012, 39, 25–31. [Google Scholar] [CrossRef]
- Branco, R.; Antunes, F.V.; Ricardo, L.C.H.; Costa, J.D. Extent of surface regions near corner points of notched cracked bodies subjected to mode-I loading. Finite Elem. Anal. Des. 2012, 50, 147–160. [Google Scholar] [CrossRef]
- Černý, I. The use of DCPD method for measurement of growth of cracks in large components at normal and elevated temperatures. Eng. Fract. Mech. 2004, 71, 837–848. [Google Scholar] [CrossRef]
- Campagnolo, A.; Meneghetti, G.; Berto, F.; Tanaka, K. Crack initiation life in notched steel bars under torsional fatigue: Synthesis based on the averaged strain energy density approach. Int. J. Fatigue 2017, 100, 563–574. [Google Scholar] [CrossRef]
Figure 1.
(a) Cylindrical specimen with internal crack (mm); (b) Real specimen produced by SLM.

Figure 2.
Cylindrical specimen with internal crack and access to external environment (mm).
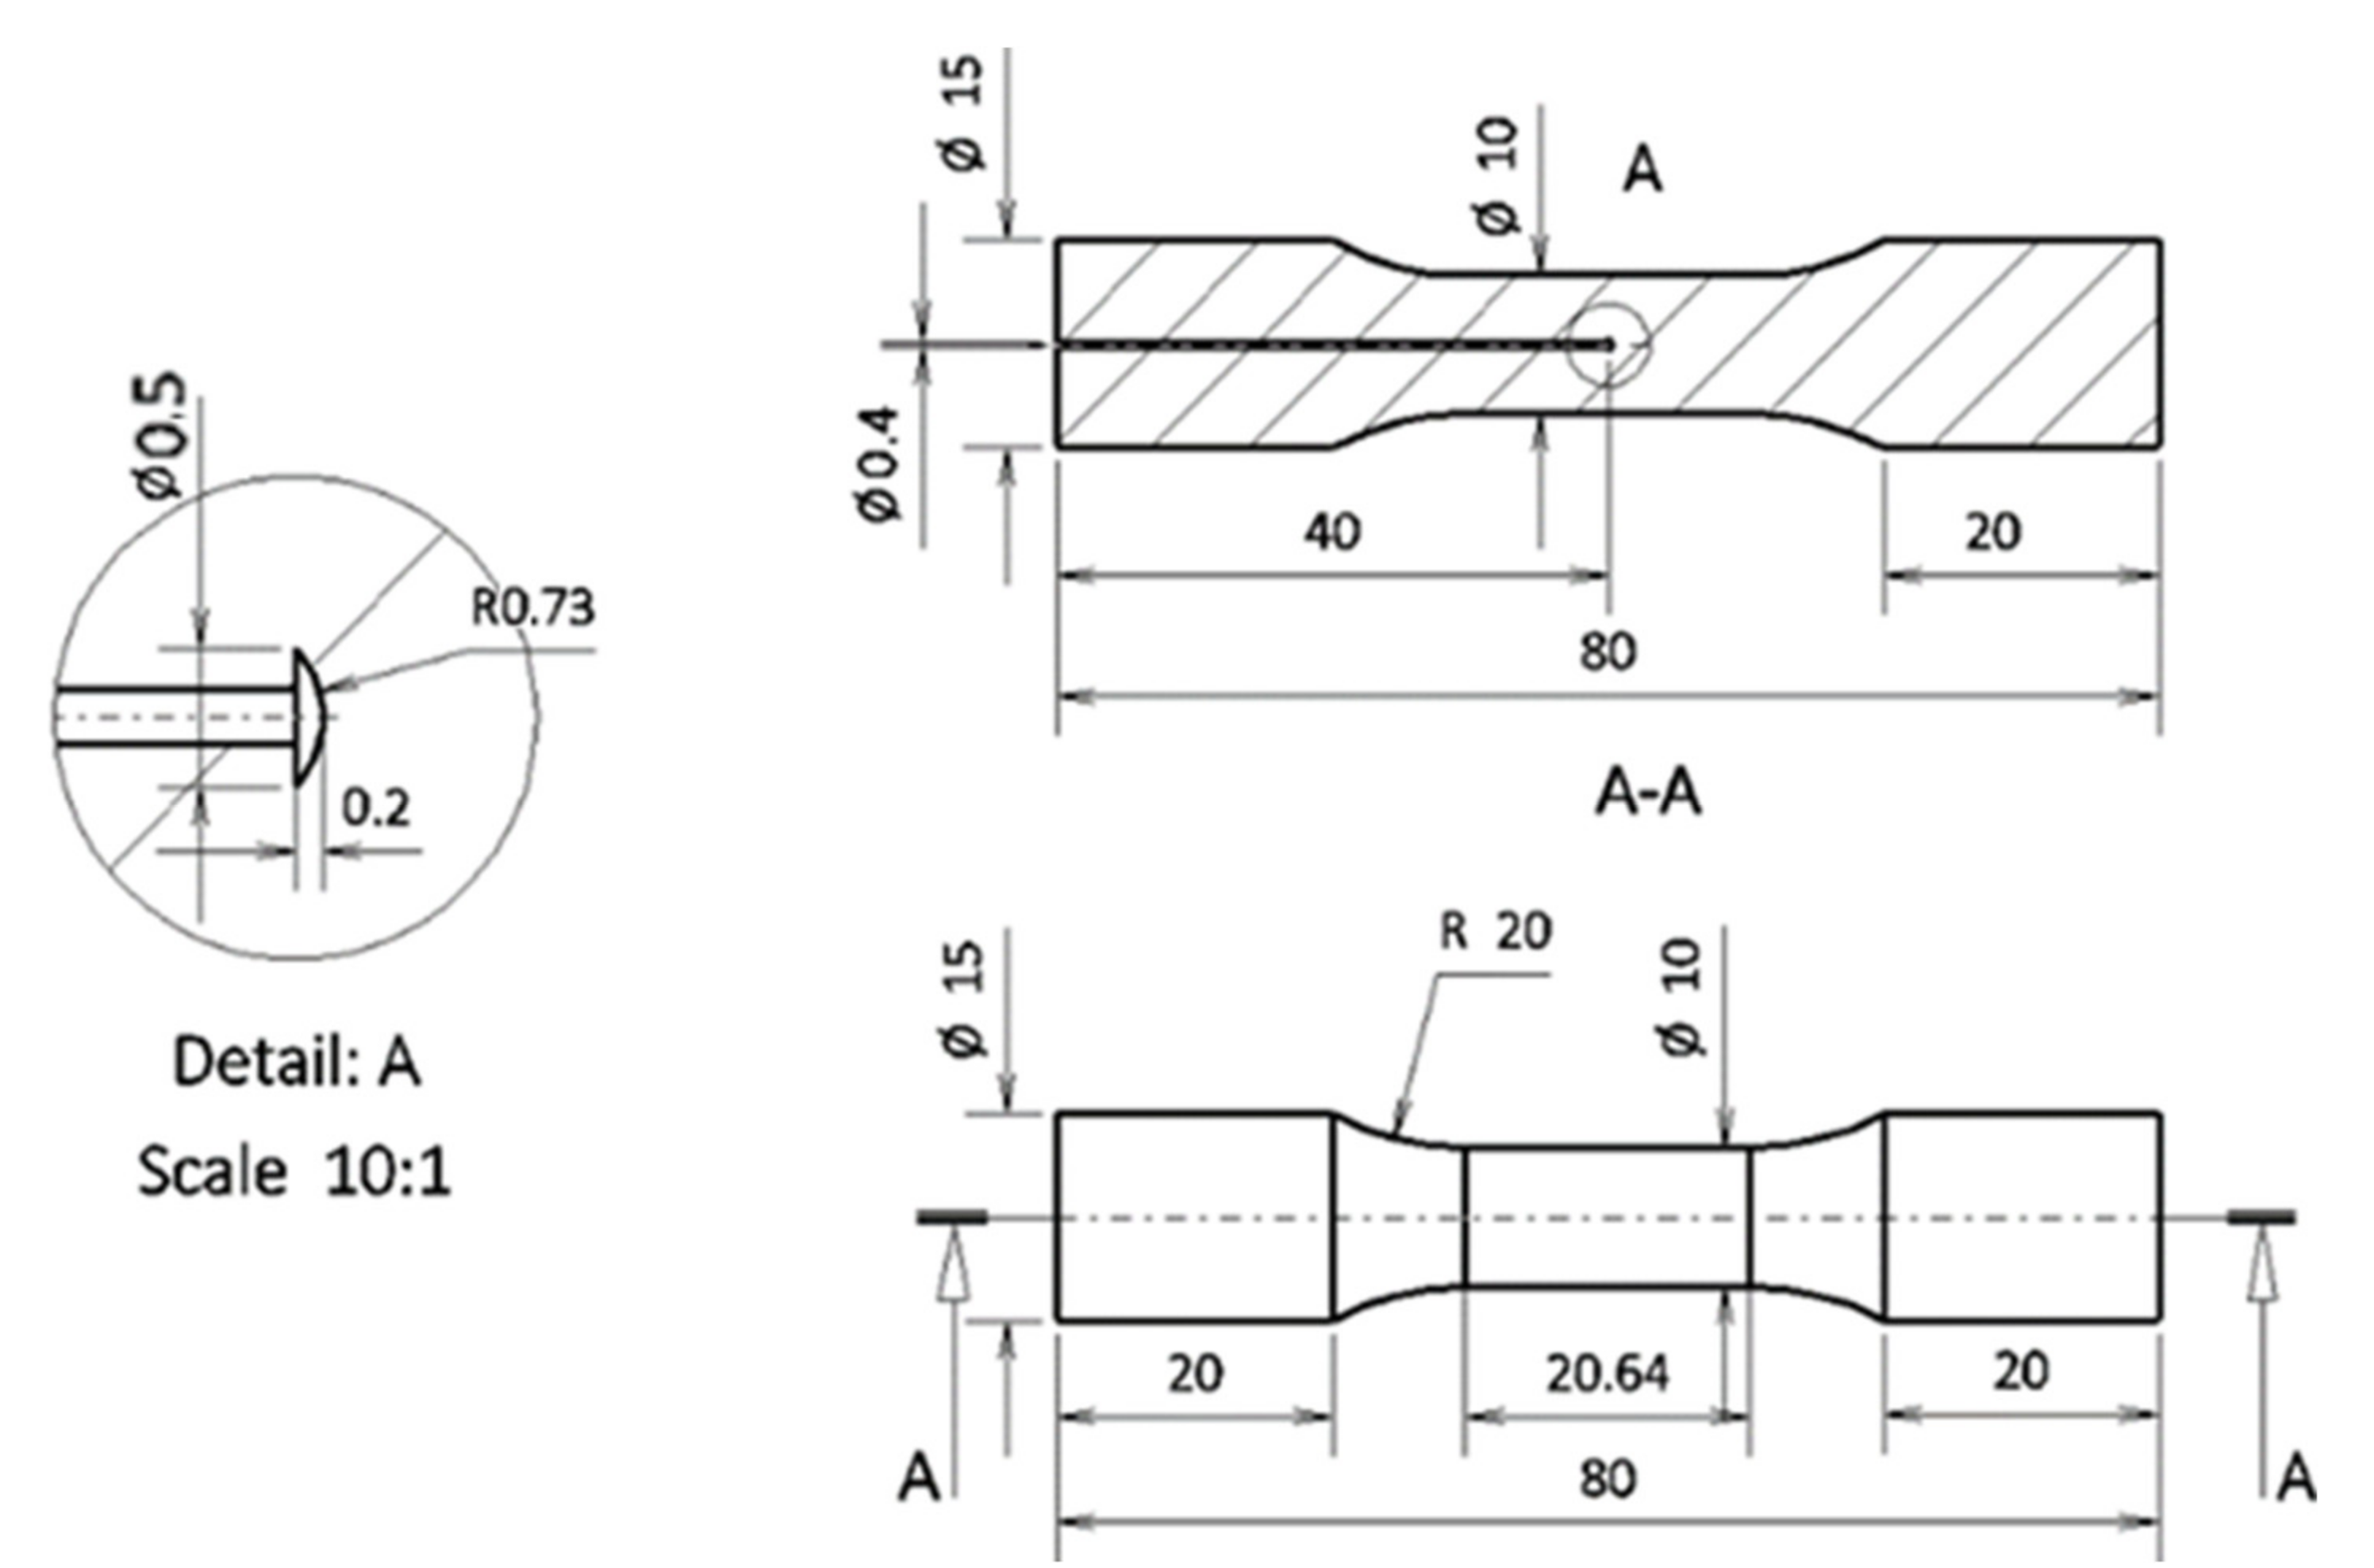
Figure 3.
Microstructure of the Ti6Al4V alloy.

Figure 4.
Fracture surfaces. (a) Crack propagation in air. (b) Crack propagation in vacuum.

Figure 5.
Effect of environment on a-N curves (σmax = 382 MPa, σmin = 0, Ti6Al4V alloy).
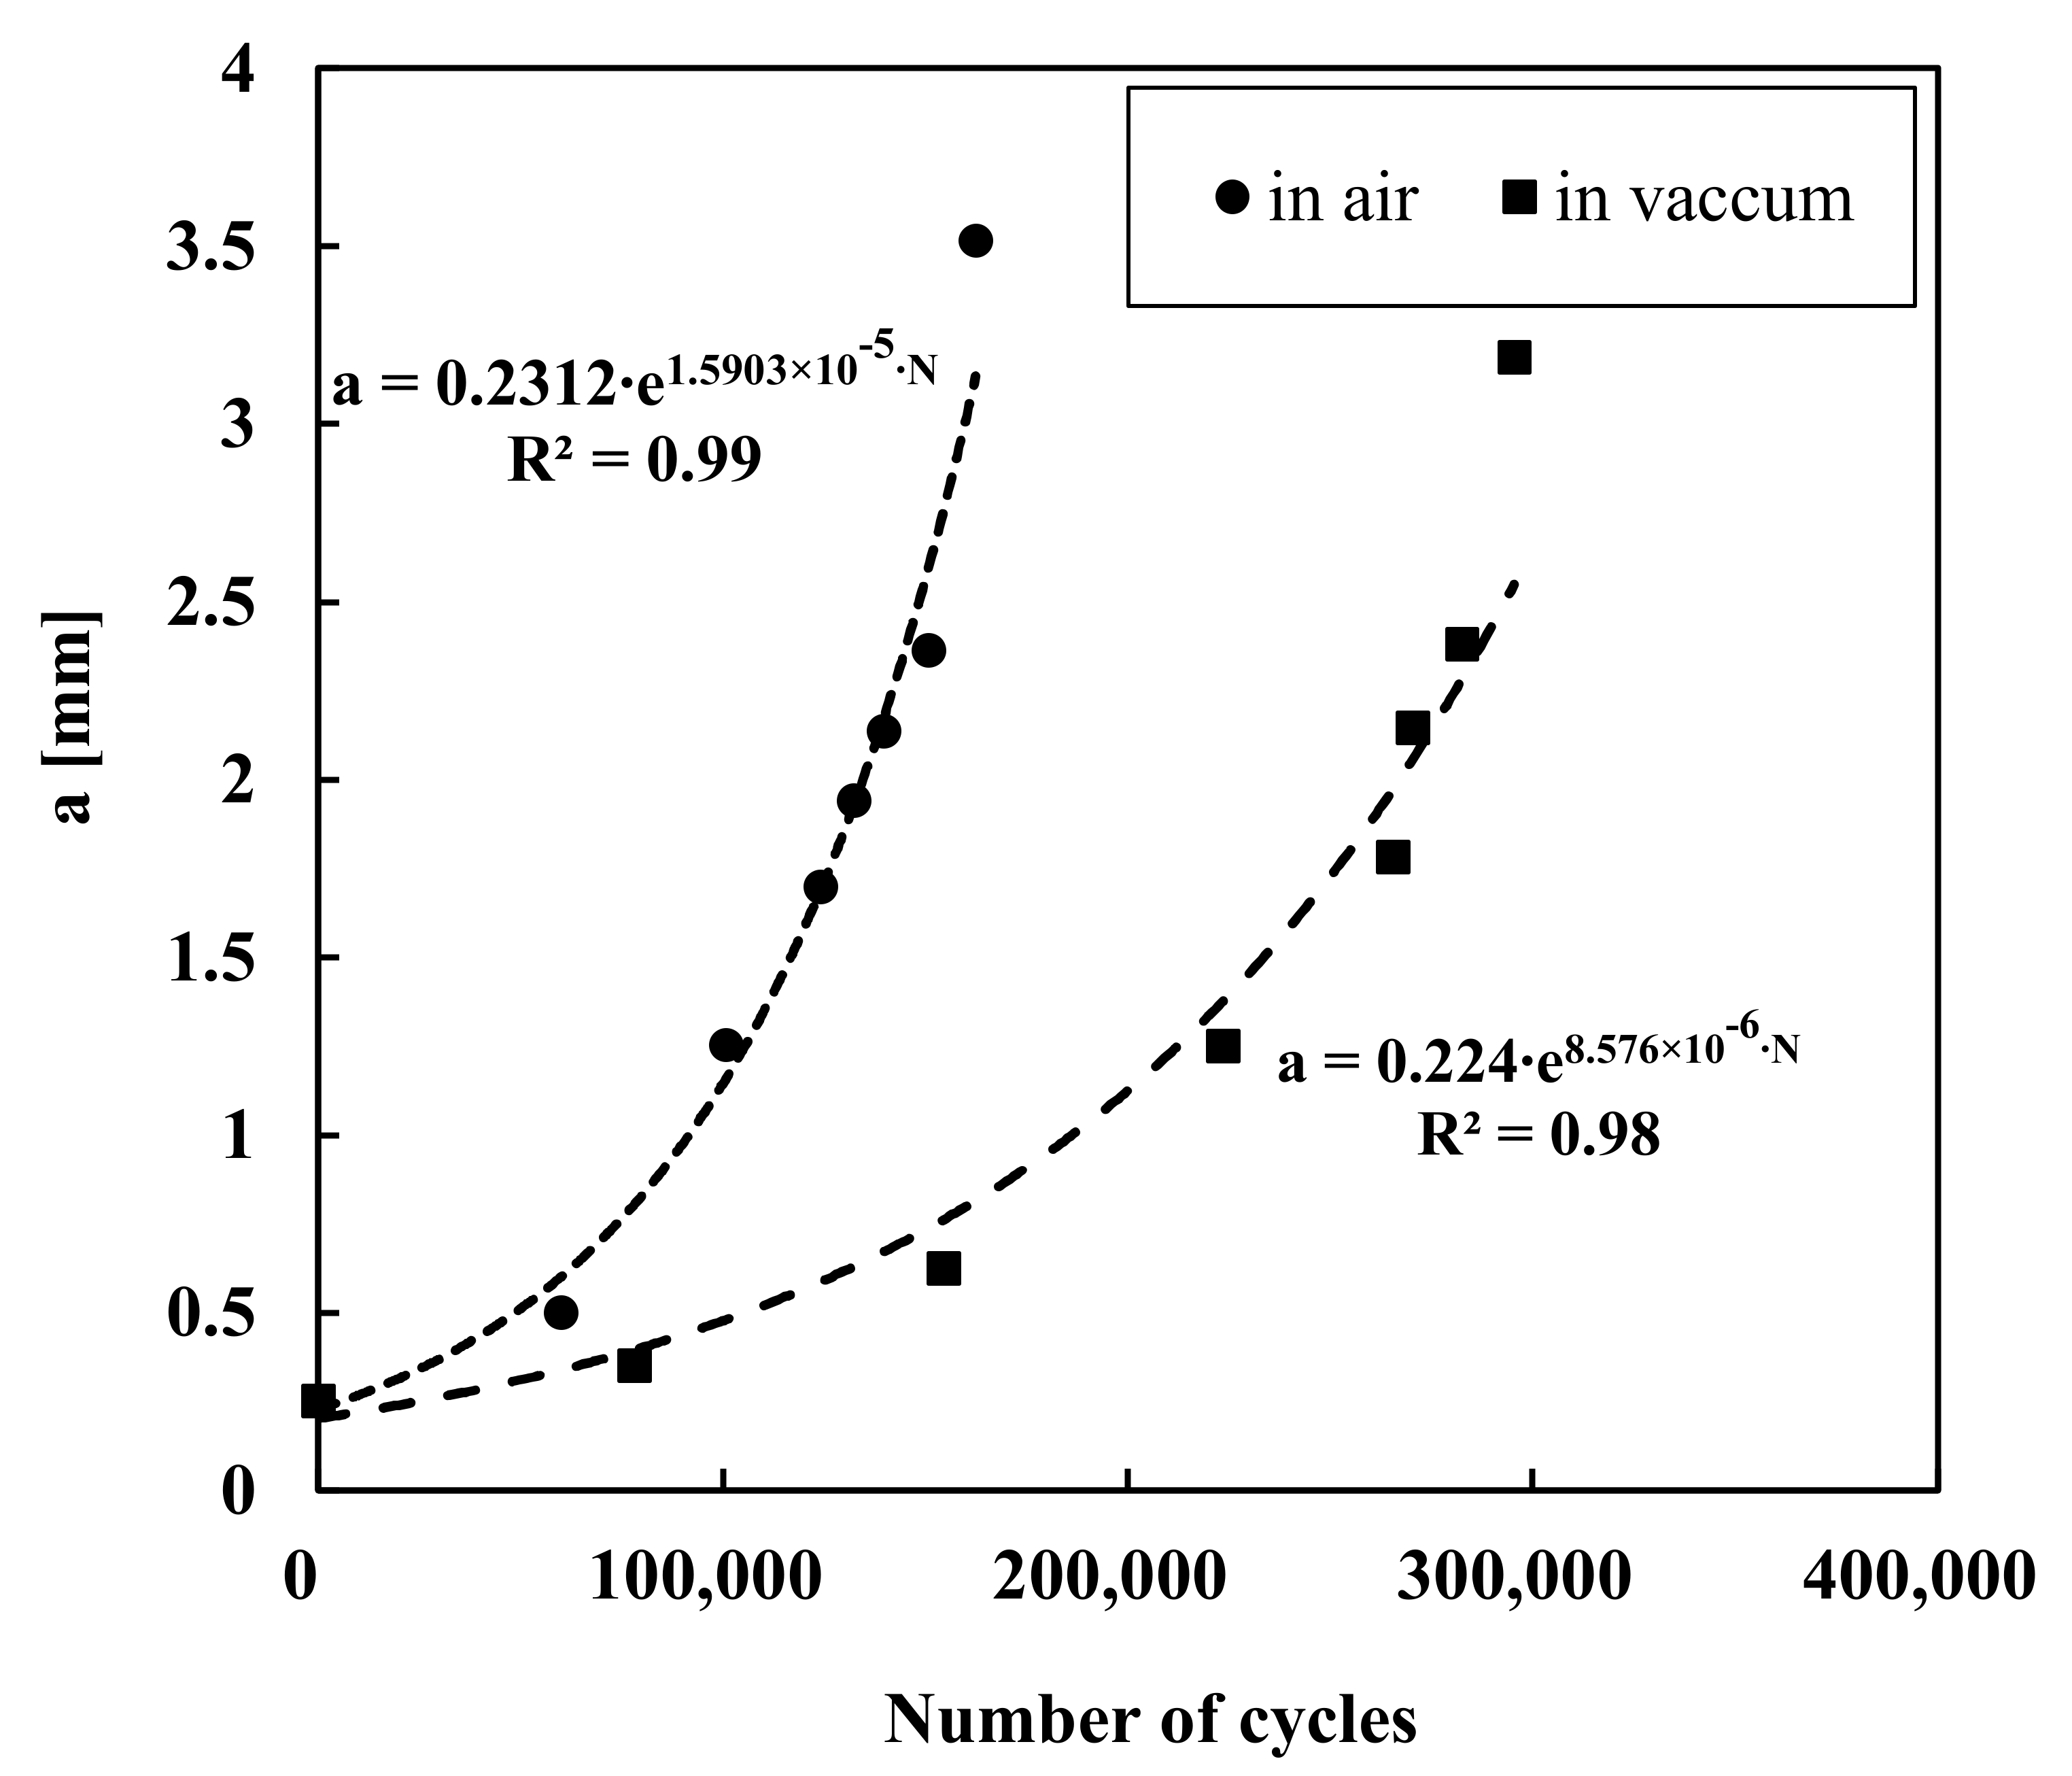
Figure 6.
Central crack specimen versus C(T) specimen: da/dN-ΔK results (Ti6Al4V alloy).
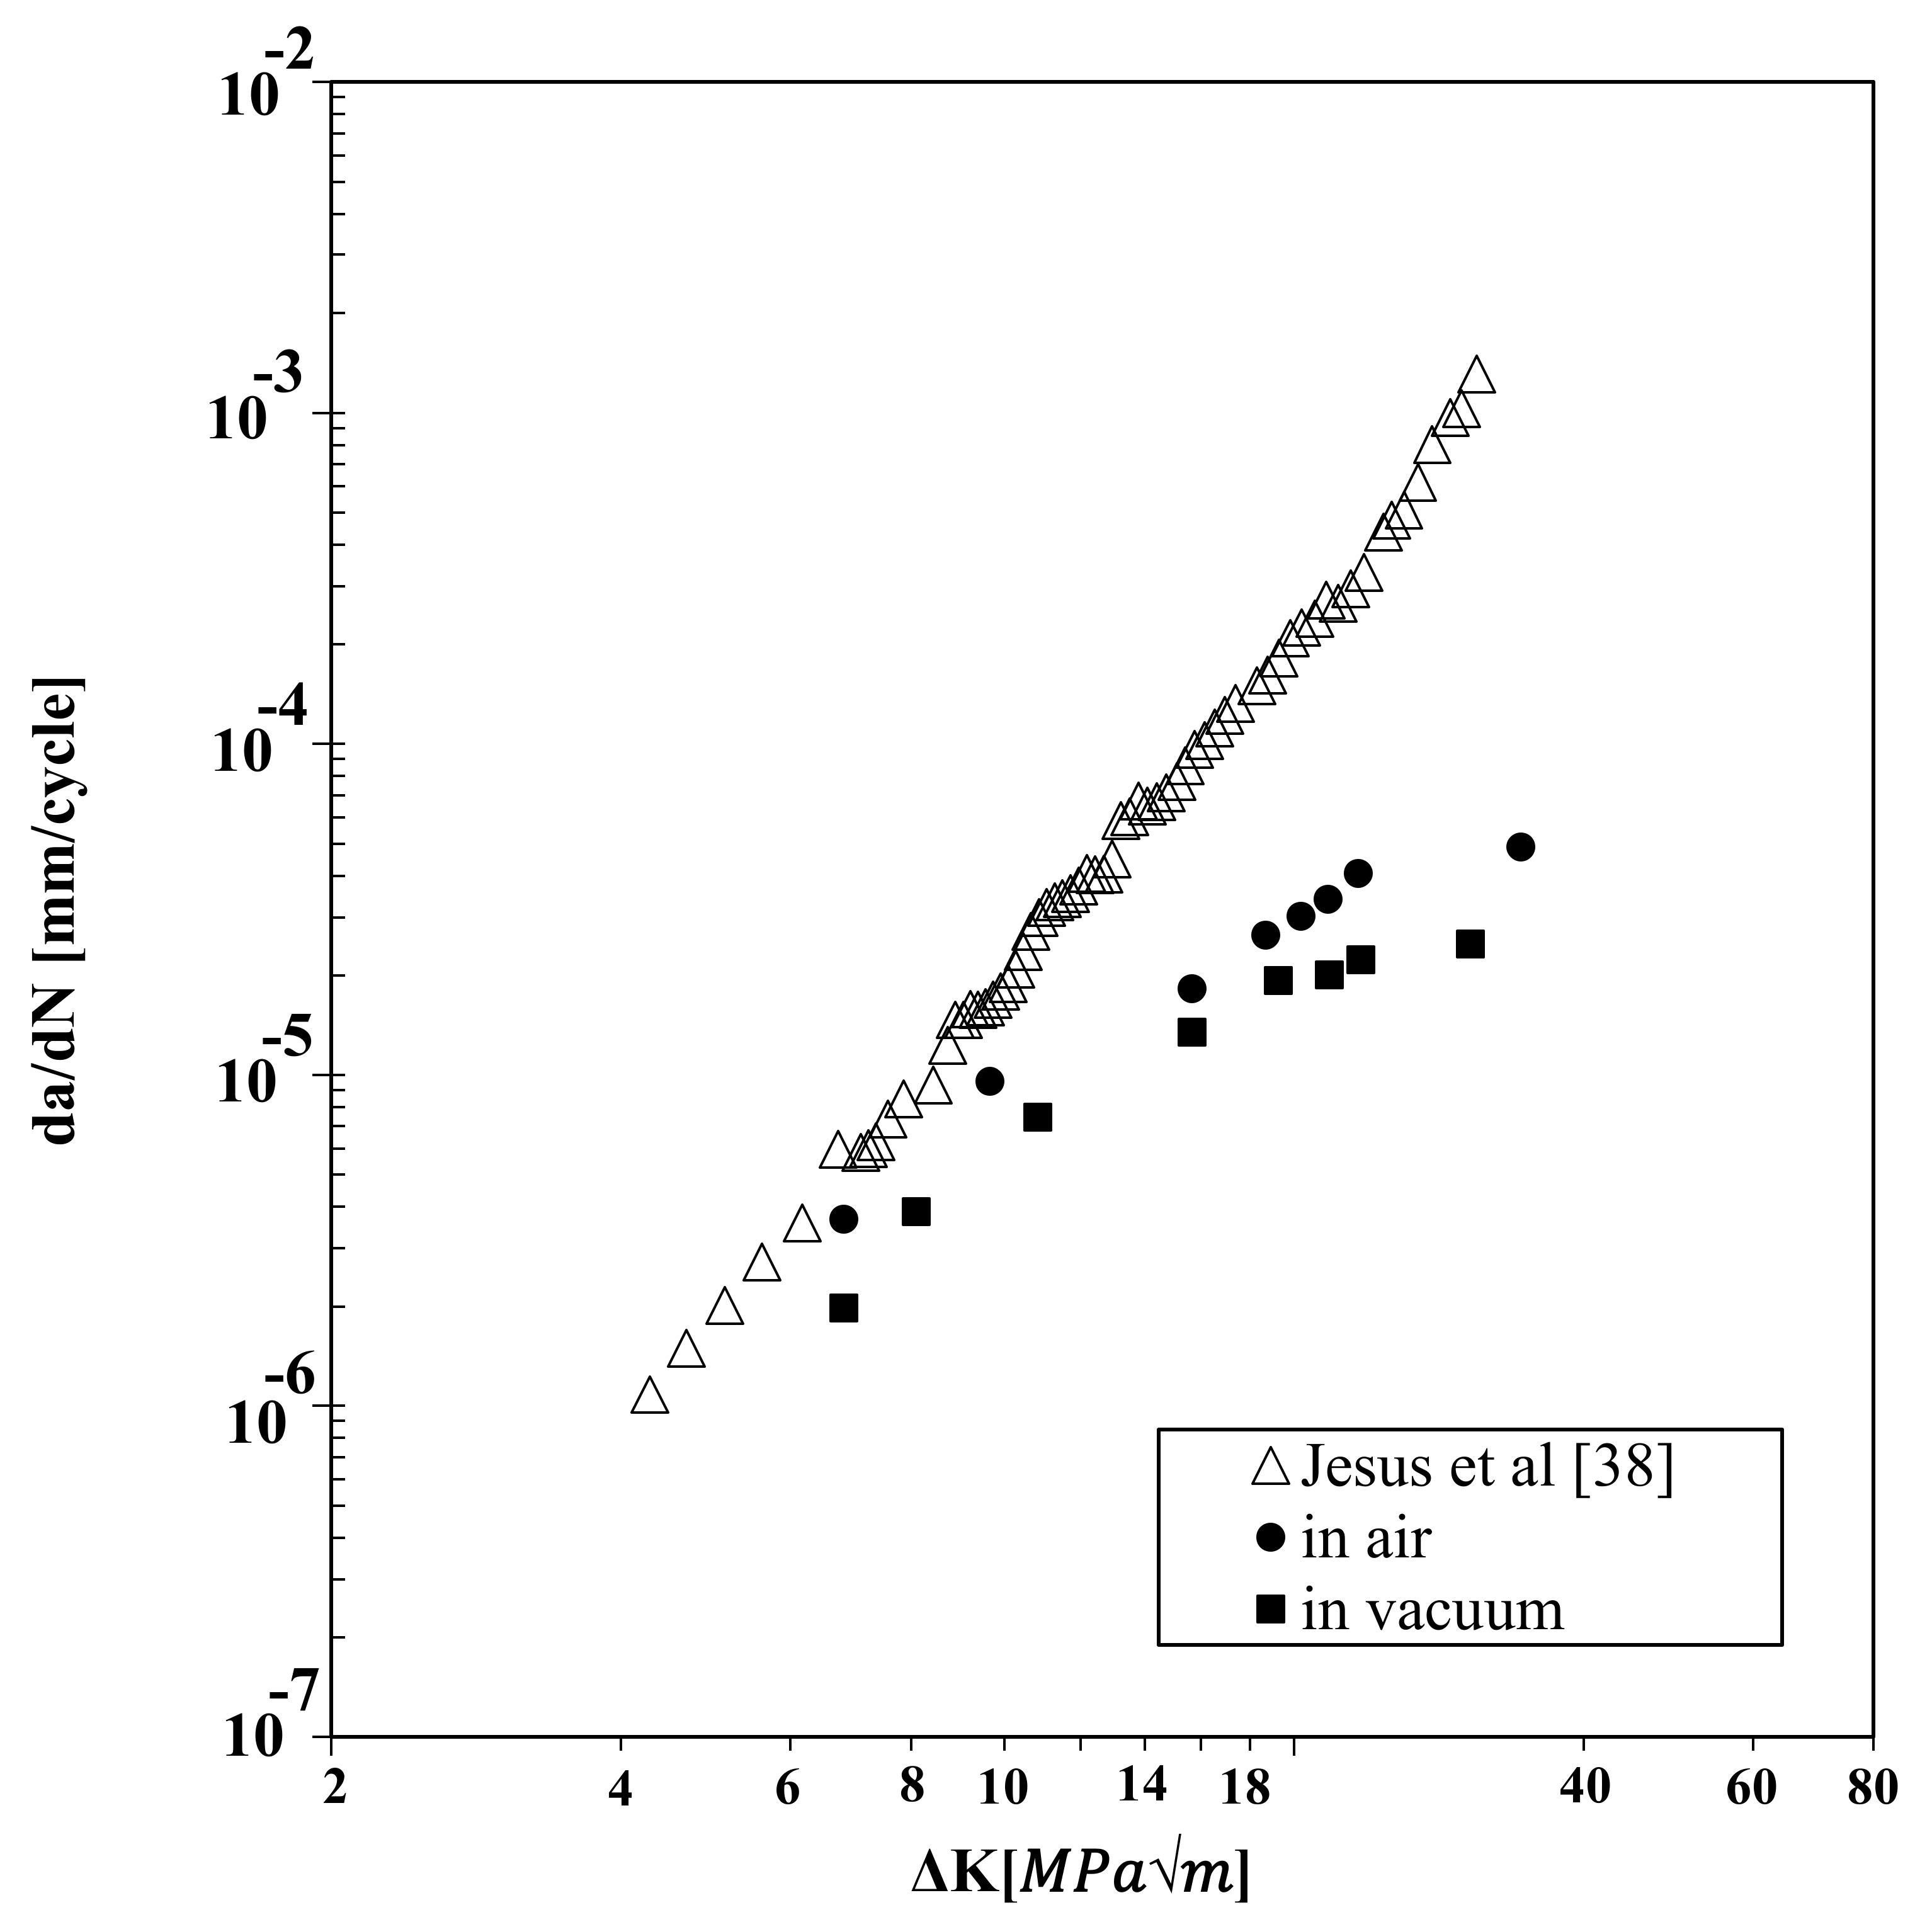
Figure 7.
Finite element mesh near crack tip.

Figure 8.
Numerical prediction of FCG rate with the application of a single tensile overload (aOL = 16.12 mm; ΔKBL = 18.3 MPa√m), applying boundary conditions for: (a) Plane strain state; (b) Plane stress state (CA = Constant Amplitude; OLR = Overload Load Ratio).
Figure 8.
Numerical prediction of FCG rate with the application of a single tensile overload (aOL = 16.12 mm; ΔKBL = 18.3 MPa√m), applying boundary conditions for: (a) Plane strain state; (b) Plane stress state (CA = Constant Amplitude; OLR = Overload Load Ratio).

Figure 9.
Numerical prediction of crack growth with the application of a single tensile overload (aOL = 16.12 mm; ΔKBL = 18.3 MPa√m), applying boundary conditions for: (a) Plane strain state; (b) Plane stress state (CA = Constant Amplitude; OLR = Overload Load Ratio).
Figure 9.
Numerical prediction of crack growth with the application of a single tensile overload (aOL = 16.12 mm; ΔKBL = 18.3 MPa√m), applying boundary conditions for: (a) Plane strain state; (b) Plane stress state (CA = Constant Amplitude; OLR = Overload Load Ratio).

Figure 10.
Numerical prediction of crack closure level with the application of a single tensile overload (aOL = 16.12 mm; ΔKBL = 18.3 MPa√m), applying boundary conditions for: (a) Plane strain state; (b) Plane stress state.
Figure 10.
Numerical prediction of crack closure level with the application of a single tensile overload (aOL = 16.12 mm; ΔKBL = 18.3 MPa√m), applying boundary conditions for: (a) Plane strain state; (b) Plane stress state.

Table 1.
Material parameters used in Swift isotropic hardening law coupled with the Armstrong–Frederick kinematic hardening law to describe the plastic behaviour of each Ti-6Al-4V.
Table 1.
Material parameters used in Swift isotropic hardening law coupled with the Armstrong–Frederick kinematic hardening law to describe the plastic behaviour of each Ti-6Al-4V.
| Material | Y0 [MPa] | K [MPa] | n | CX | XSat [MPa] |
|---|---|---|---|---|---|
| Ti-6Al-4V + HT | 700.0 | 738.6 | −0.013 | 88.1 | 585.2 |
Publisher’s Note: MDPI stays neutral with regard to jurisdictional claims in published maps and institutional affiliations. |
© 2021 by the authors. Licensee MDPI, Basel, Switzerland. This article is an open access article distributed under the terms and conditions of the Creative Commons Attribution (CC BY) license (http://creativecommons.org/licenses/by/4.0/).
Share and Cite
MDPI and ACS Style
Jesus, J.d.; Borges, M.; Antunes, F.; Ferreira, J.; Reis, L.; Capela, C. A Novel Specimen Produced by Additive Manufacturing for Pure Plane Strain Fatigue Crack Growth Studies. Metals 2021, 11, 433. https://doi.org/10.3390/met11030433
AMA Style
Jesus Jd, Borges M, Antunes F, Ferreira J, Reis L, Capela C. A Novel Specimen Produced by Additive Manufacturing for Pure Plane Strain Fatigue Crack Growth Studies. Metals. 2021; 11(3):433. https://doi.org/10.3390/met11030433
Chicago/Turabian StyleJesus, Joel de, Micael Borges, Fernando Antunes, José Ferreira, Luis Reis, and Carlos Capela. 2021. "A Novel Specimen Produced by Additive Manufacturing for Pure Plane Strain Fatigue Crack Growth Studies" Metals 11, no. 3: 433. https://doi.org/10.3390/met11030433
Note that from the first issue of 2016, this journal uses article numbers instead of page numbers. See further details here.