
Monitoring the Damage Evolution in Rolling Contact Fatigue Tests Using Machine Learning and Vibrations

 ,
,  , and
, and
Abstract
:1. Introduction
2. Materials and Methods
2.1. Specimens
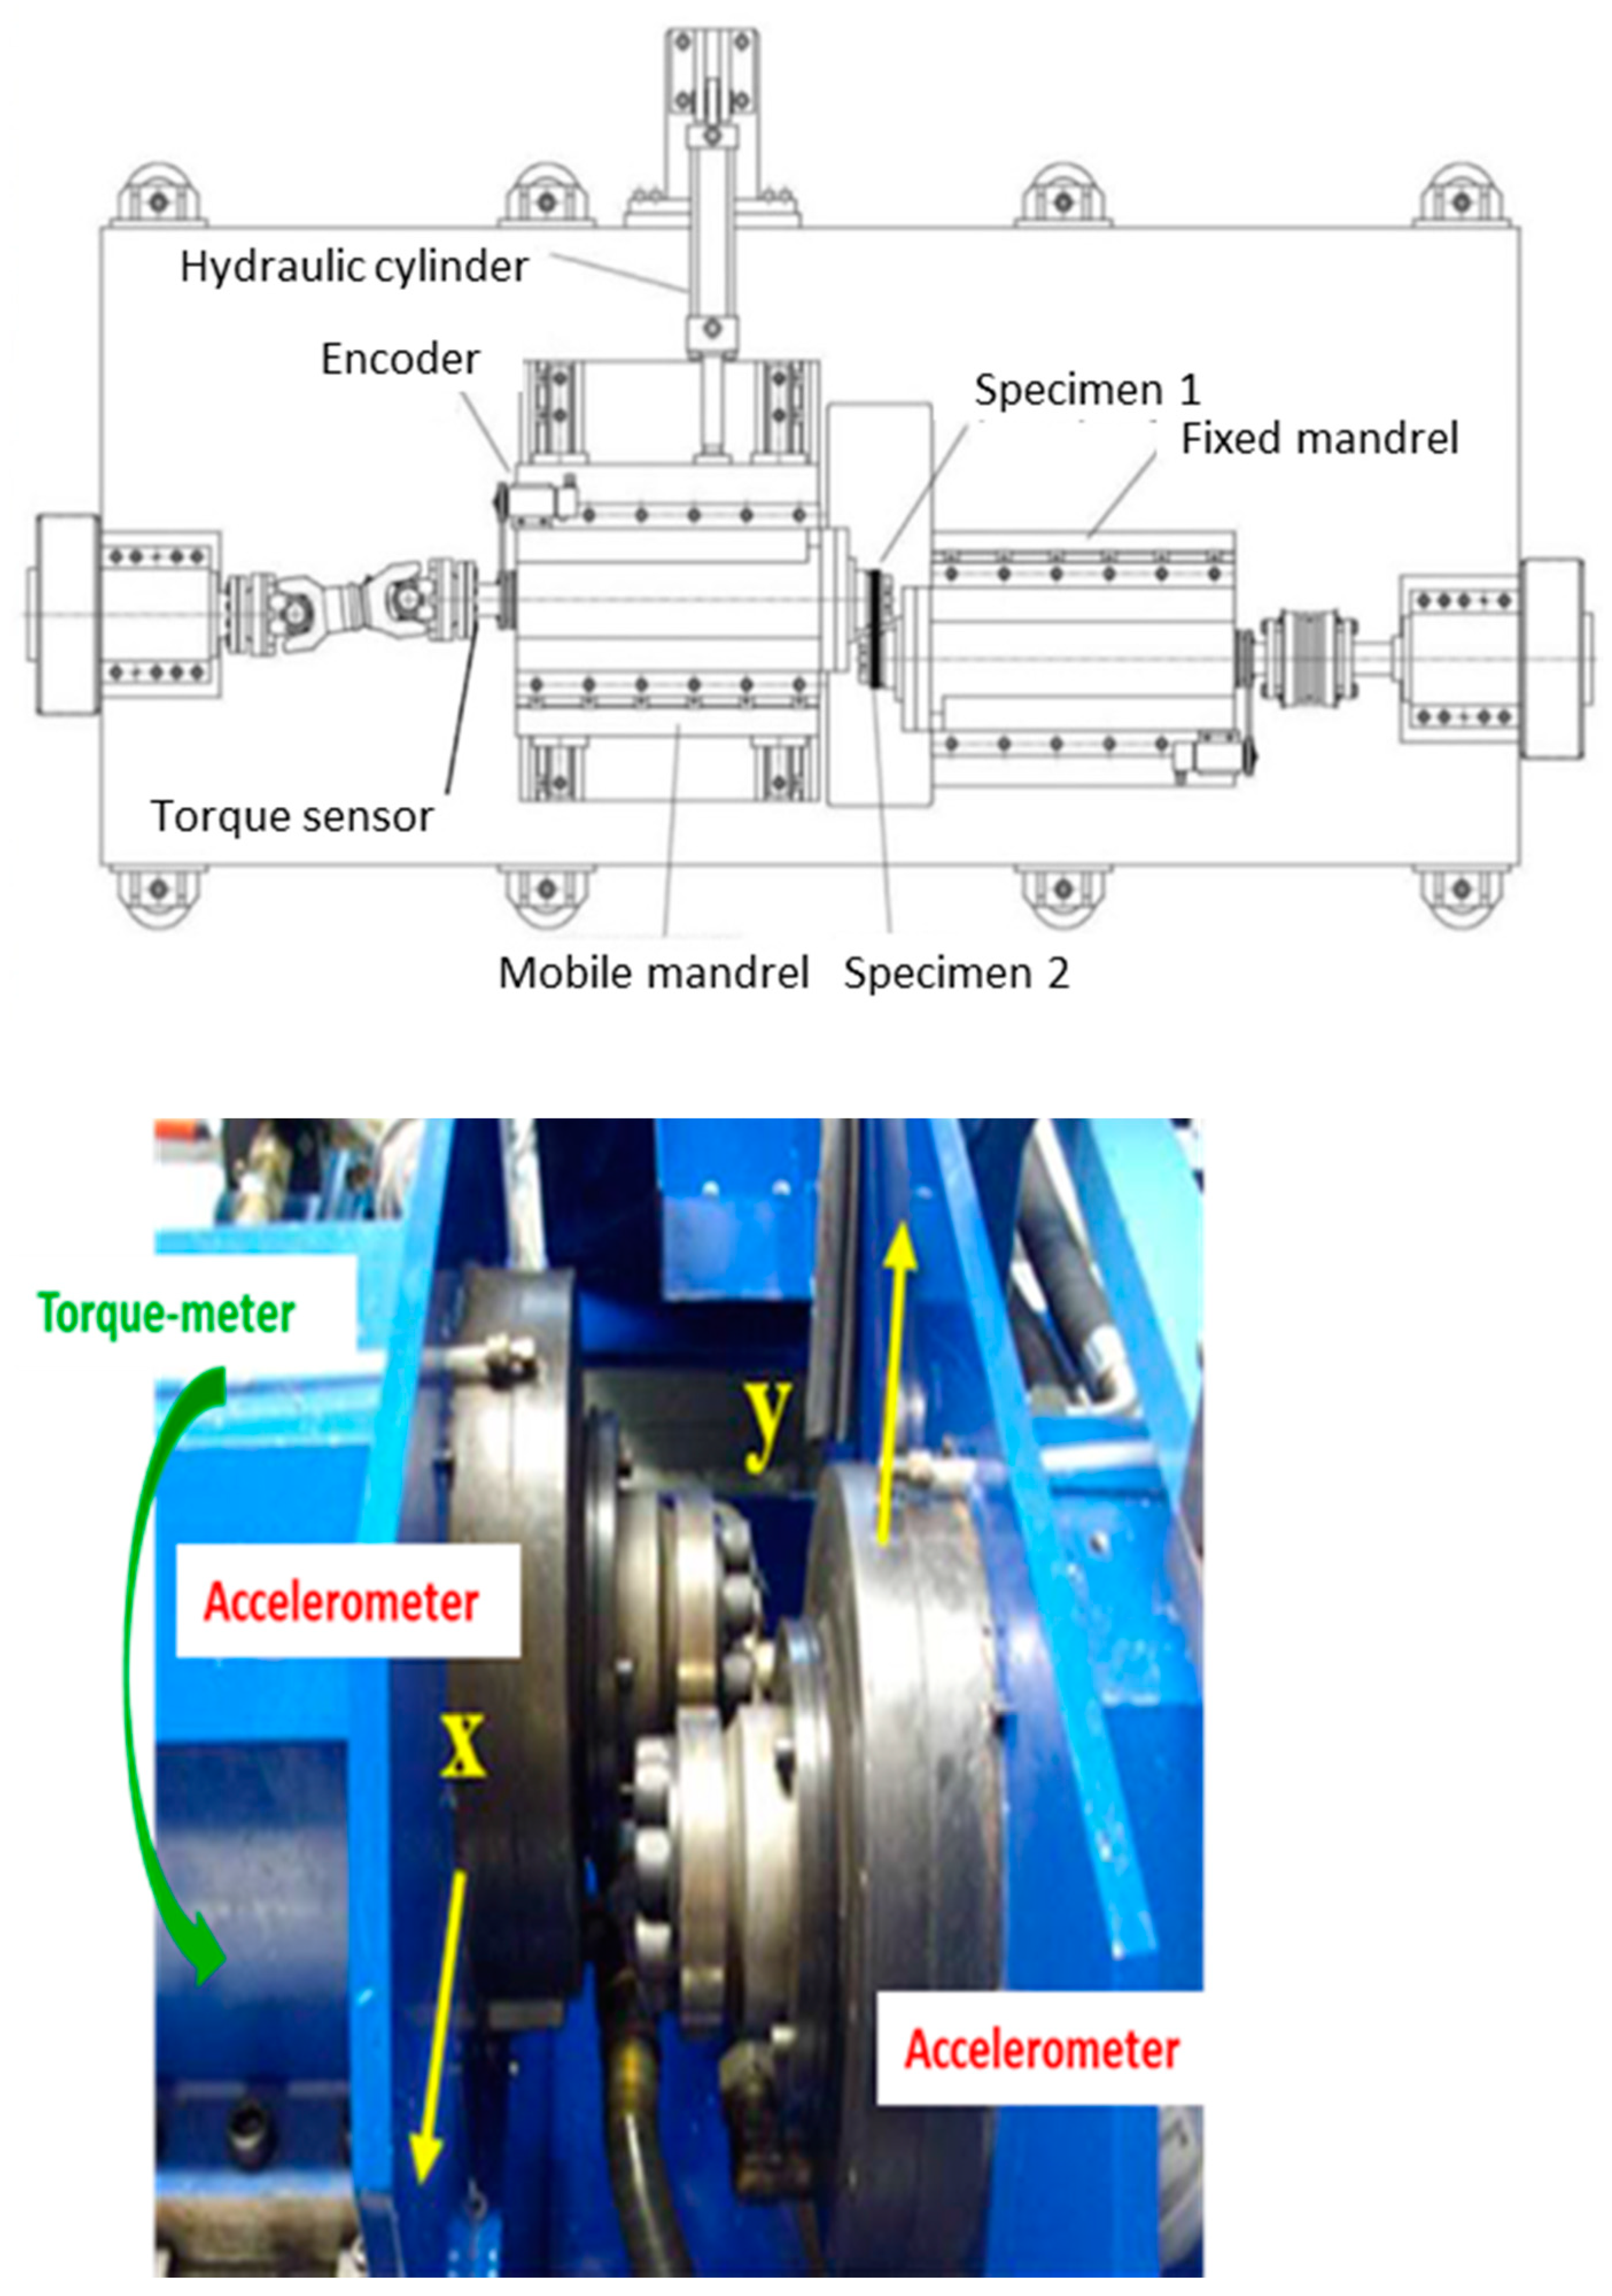
2.2. Instrumentation
2.3. Protocol
2.4. Data Processing
2.5. Validation Approach
3. Experimental Results and Discussion
3.1. Test Performed
3.2. Training Tests
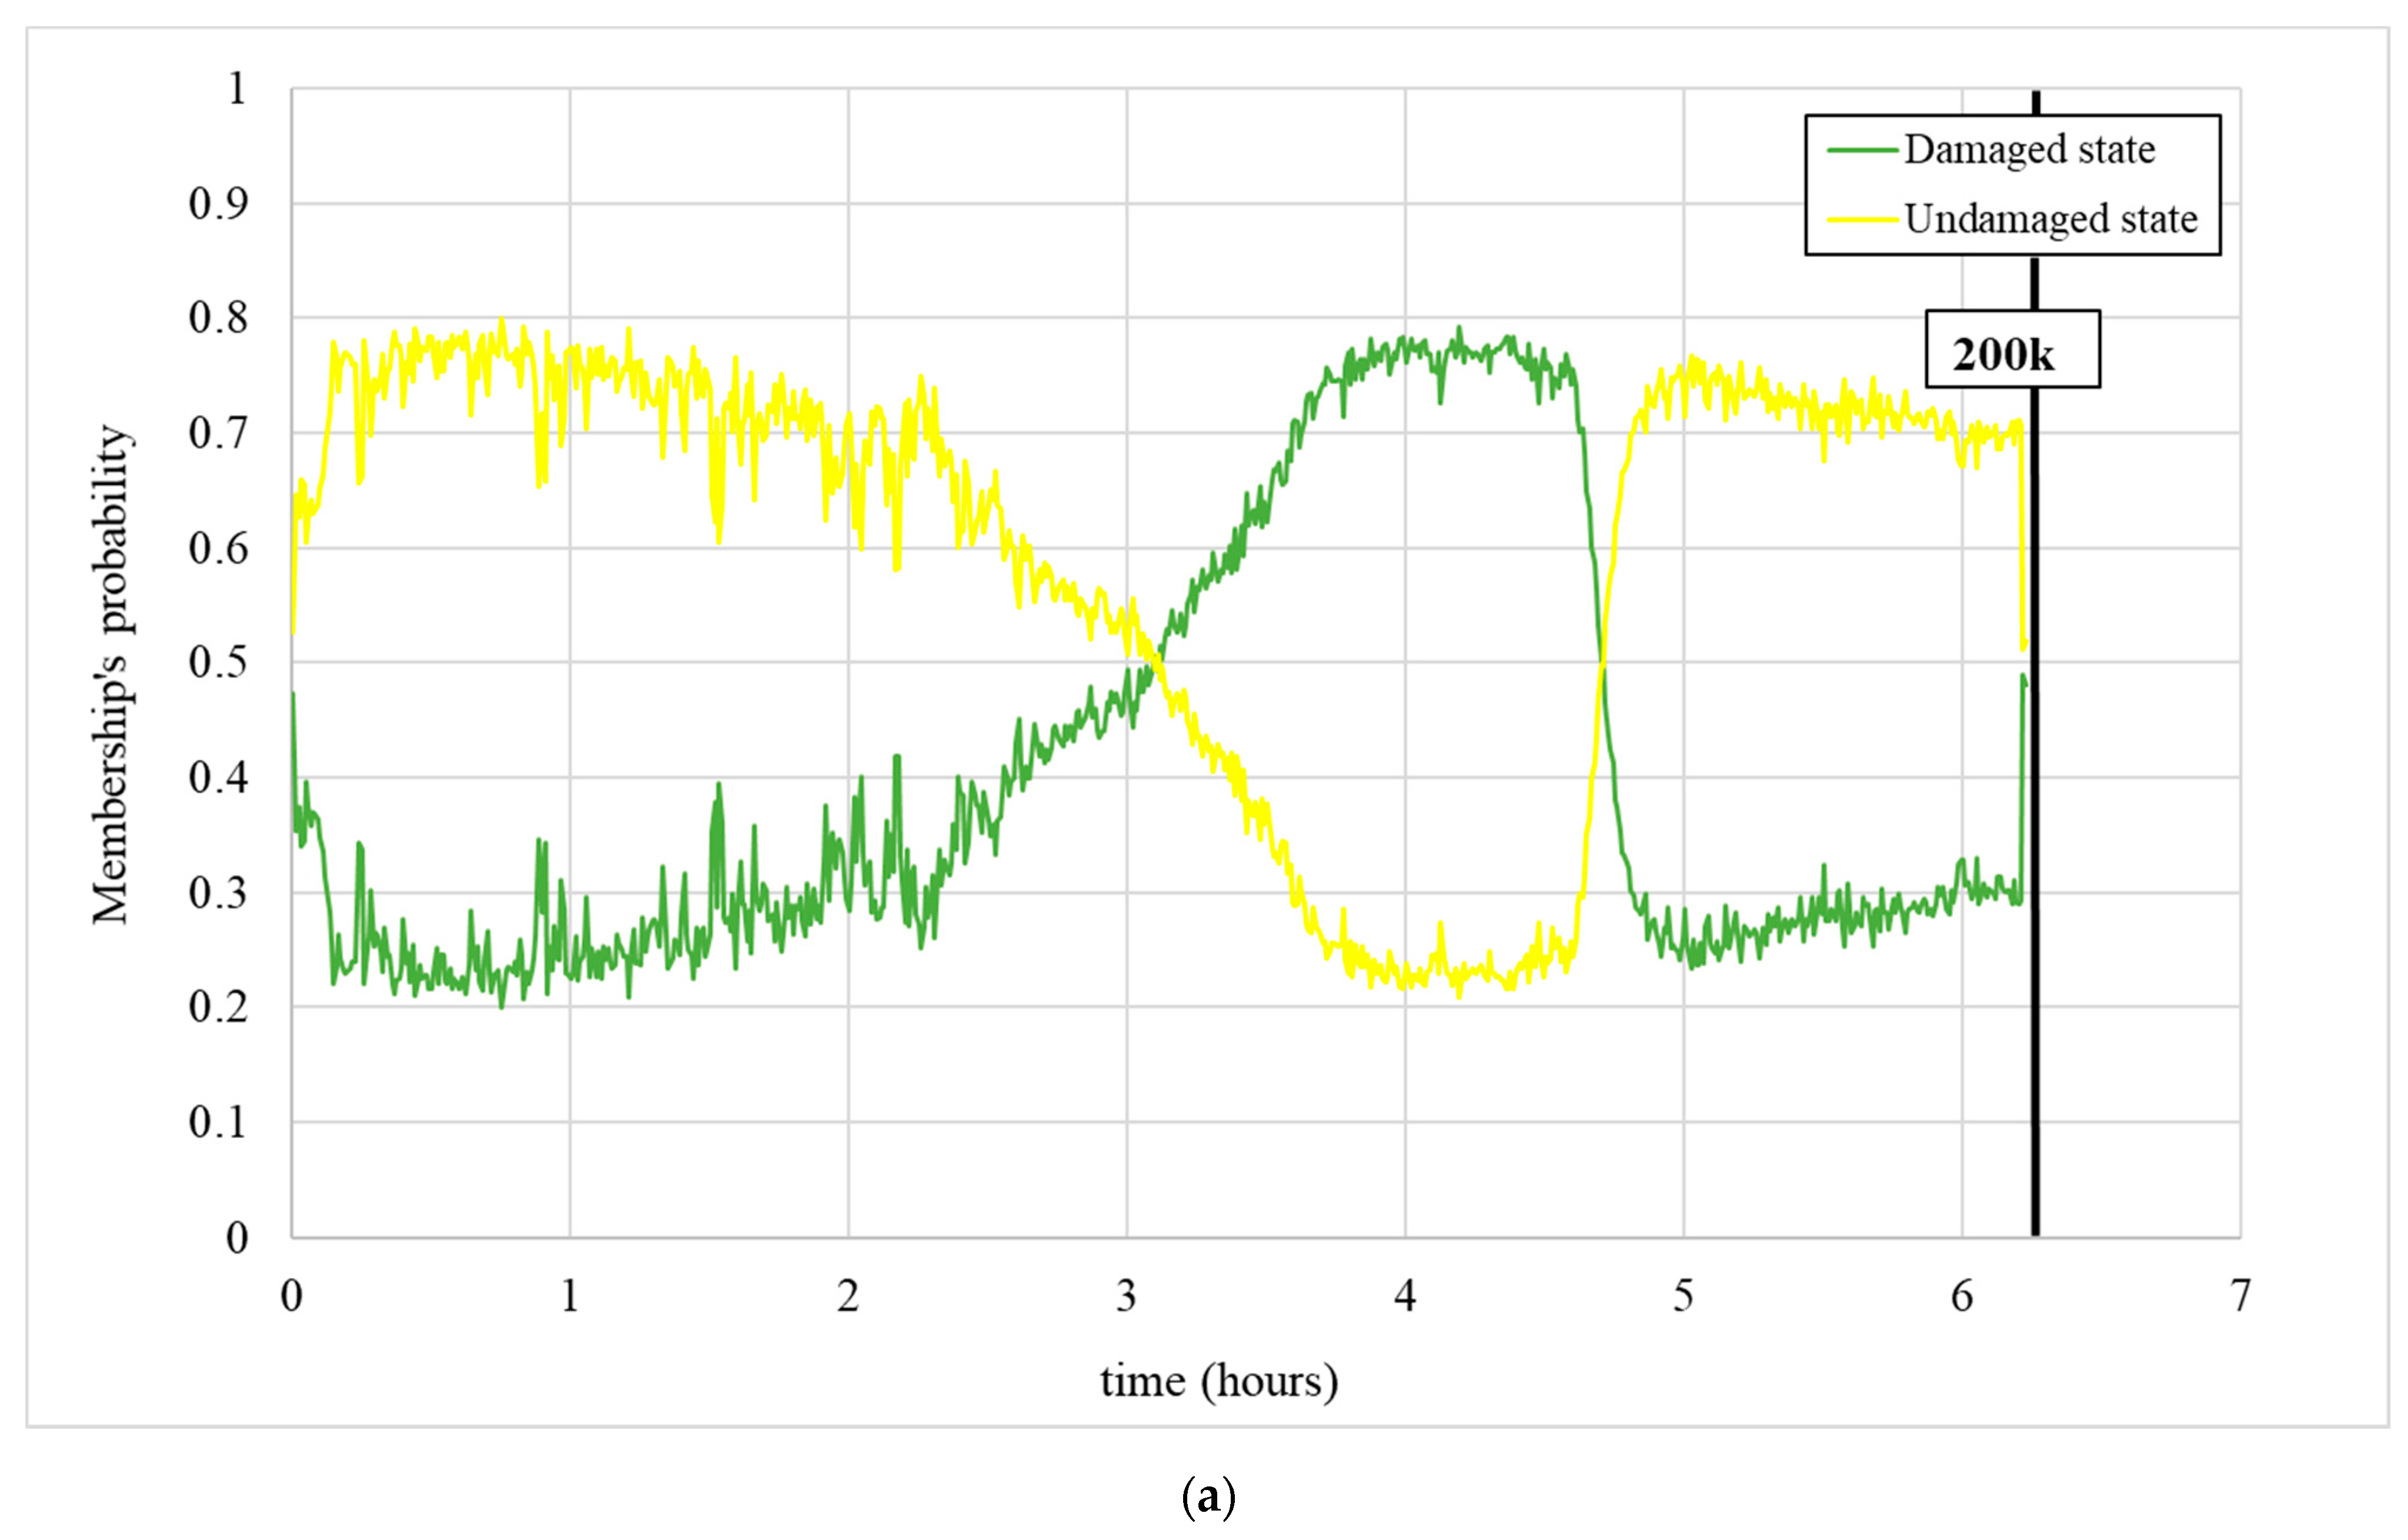
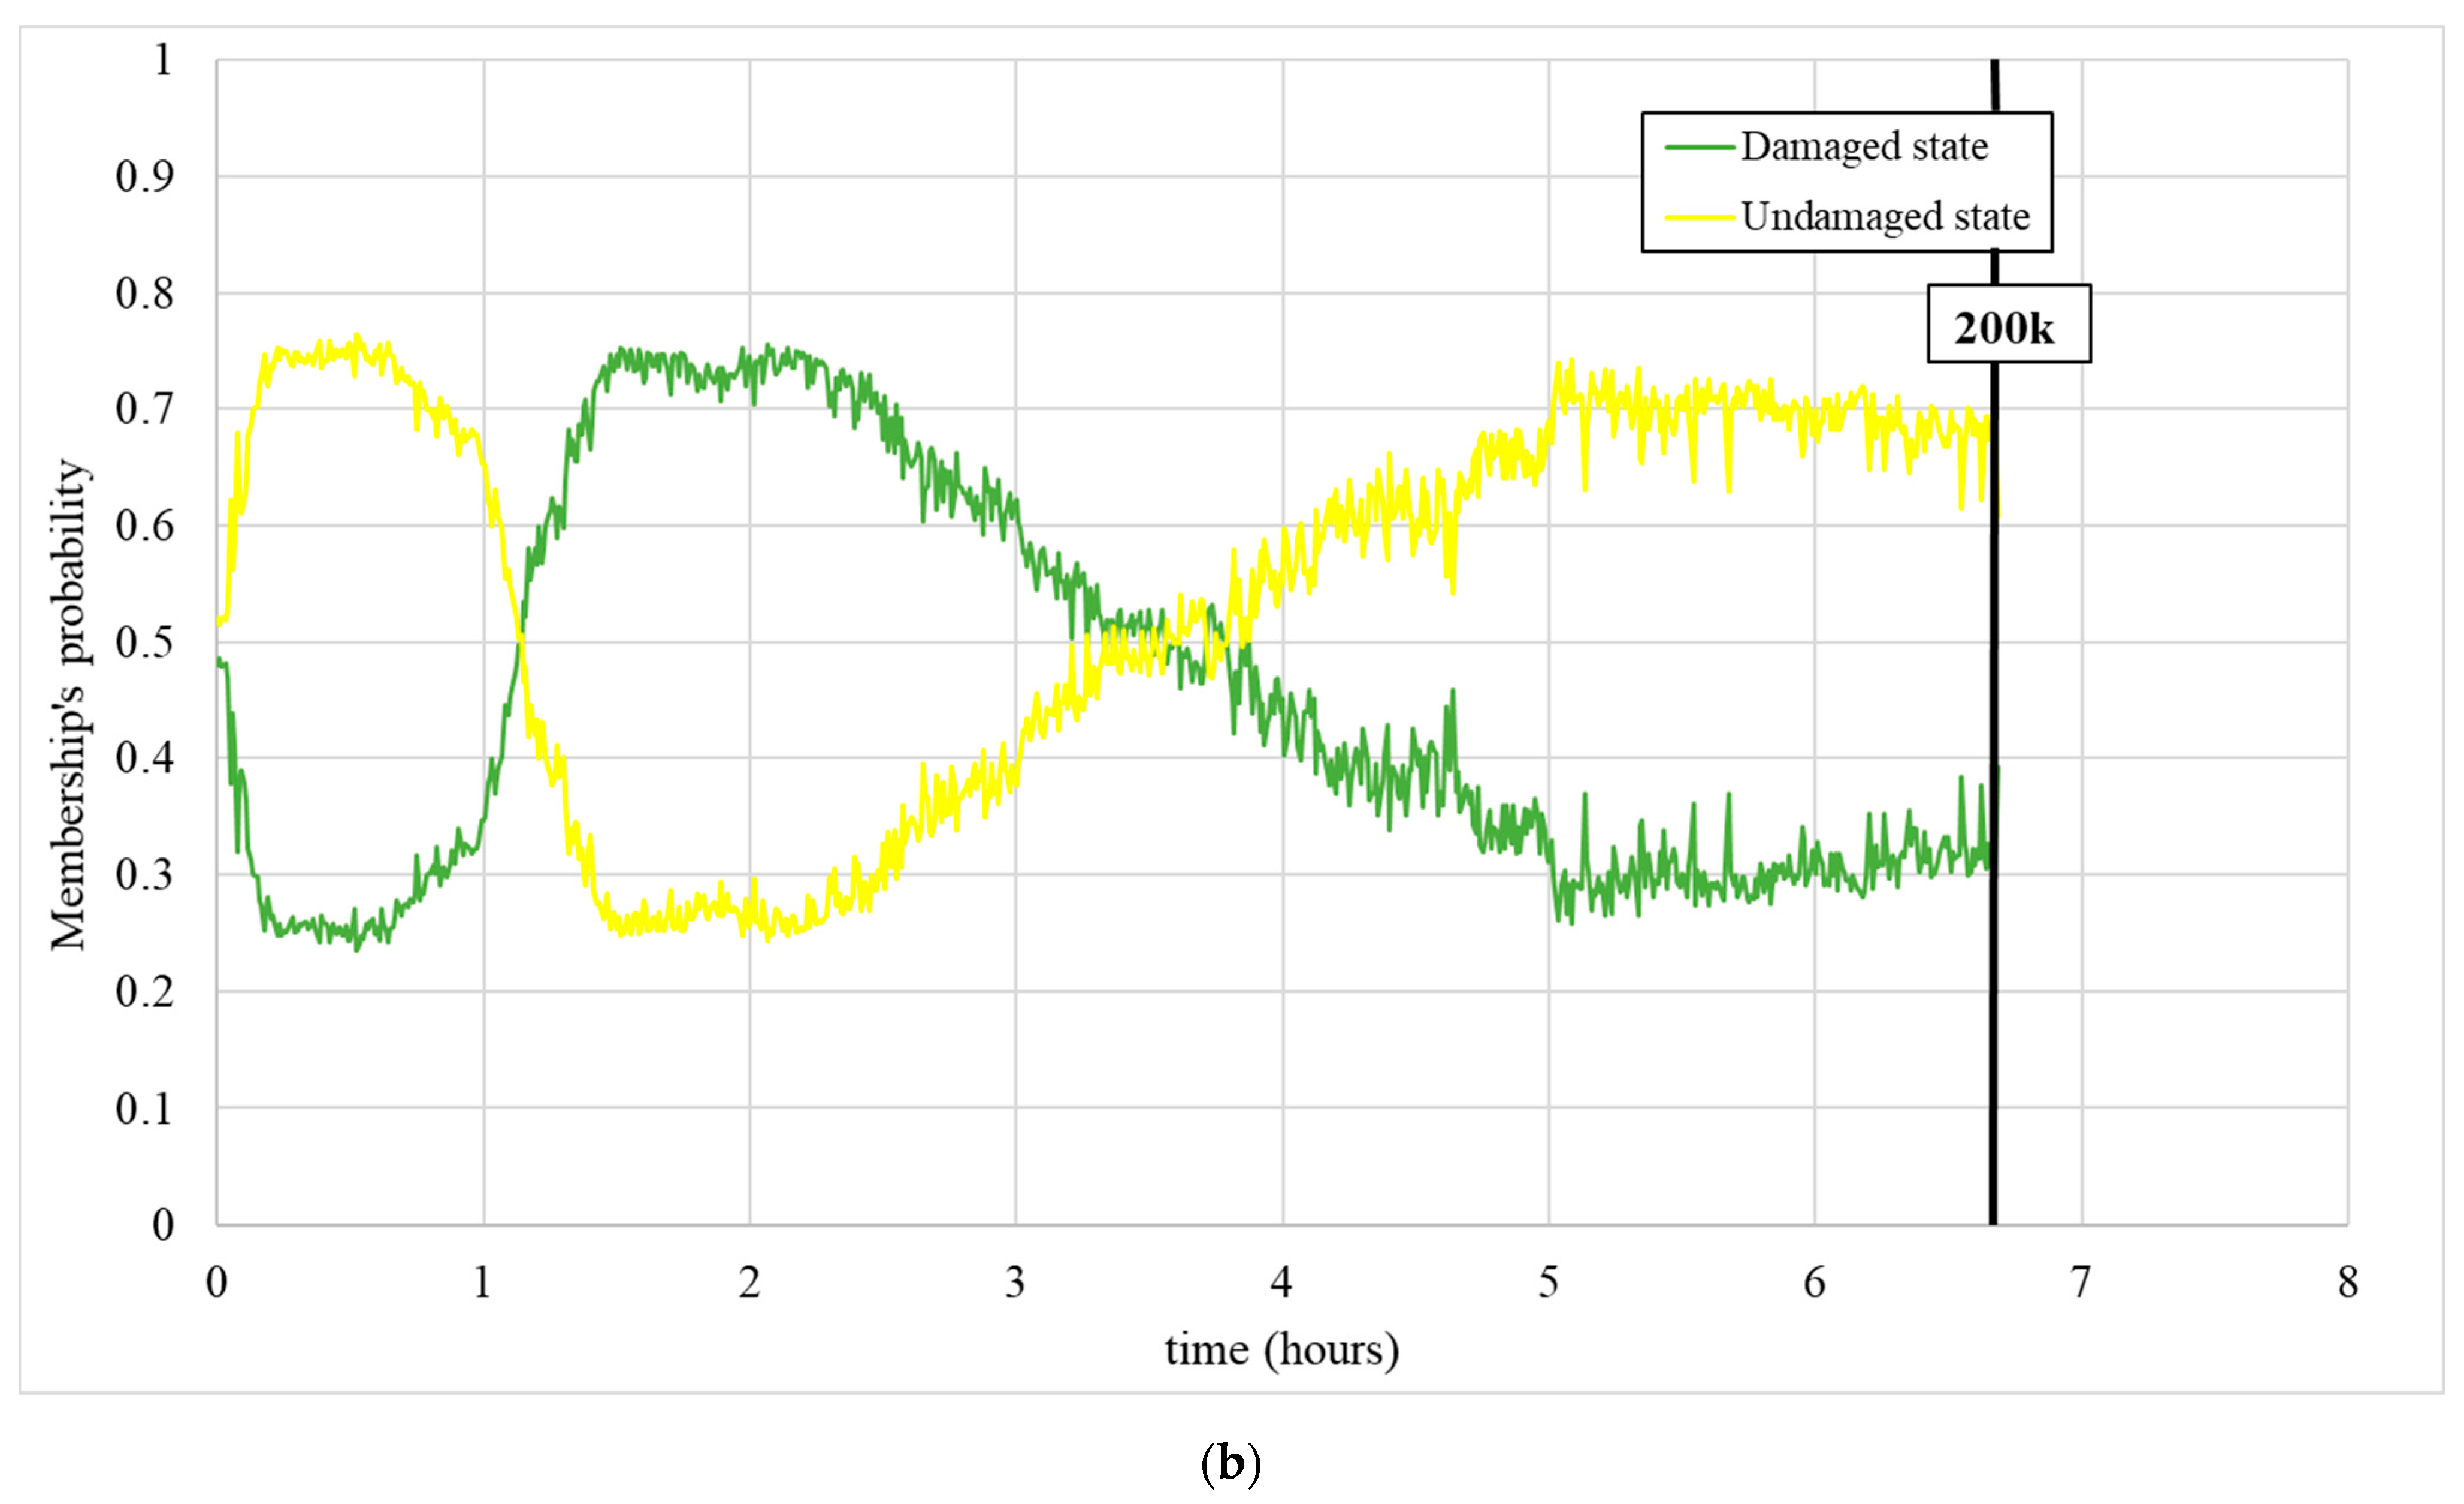
3.3. Validation Tests
4. Conclusions
Author Contributions
Funding
Data Availability Statement
Conflicts of Interest
References
- Mazzù, A.; Petrogalli, C.; Lancini, M.; Ghidini, A.; Faccoli, M. Effect of Wear on Surface Crack Propagation in Rail-Wheel Wet Contact. J. Mater. Eng. Perform. 2018, 27, 630–639. [Google Scholar] [CrossRef]
- Donzella, G.; Faccoli, M.; Ghidini, A.; Mazzù, A.; Roberti, R. The competitive role of wear and RCF in a rail steel. Eng. Fract. Mech. 2005, 72, 287–308. [Google Scholar] [CrossRef]
- Selech, J.; Andrzejczak, K. An aggregate criterion for selecting a distribution for times to failure of components of rail vehicles. Maint. Reliab. 2020, 22, 102–111. [Google Scholar] [CrossRef]
- Vaičiūnas, G.; Bureika, G.; Steišūnas, S. Rail vehicle axle-box bearing damage detection considering the intensity of heating alteration. Maint Reliab. 2020, 22, 724–729. [Google Scholar] [CrossRef]
- Konowrocki, R.; Kalinowski, D.; Szolc, T.; Marczewski, A. Identification of safety hazards and operating conditions of the low-floor tram with independently rotating wheels with various drive control algorithms. Maint. Reliab. 2021, 23, 21–33. [Google Scholar]
- Ekberg, A.; Kabo, E. Fatigue of railway wheels and rails under rolling contact and thermal loading-an overview. Wear 2005, 258, 1288–1300. [Google Scholar] [CrossRef]
- Faccoli, M.; Petrogalli, C.; Lancini, M.; Ghidini, A.; Mazzù, A. Effect of desert sand on wear and rolling contact fatigue behaviour of various railway wheel steels. Wear 2018, 396–397, 146–161. [Google Scholar] [CrossRef]
- Bodini, I.; Sansoni, G.; Lancini, M.; Pasinetti, S.; Docchio, F. A novel optical apparatus for the study of rolling contact wear/fatigue based on a high-speed camera and multiple-source laser illumination. Rev. Sci. Instrum. 2016, 87, 083701. [Google Scholar] [CrossRef] [PubMed] [Green Version]
- Lancini, M.; Bodini, I.; Petrogalli, C.; Provezza, L.; Faccoli, M.; Sansoni, G.; Solazzi, L.; Mazzù, A. Damage phenomena characterization in RCF tests using image analysis and vibration-based machine learning. In Proceedings of the ISMA, Leauven, Belgium, 17–19 September 2018; pp. 3935–3946. [Google Scholar]
- Portugal, I.; Alencar, P.; Cowan, D. The use of machine learning algorithms in recommender systems: A systematic review. Expert Syst. Appl. 2018, 97, 205–227. [Google Scholar] [CrossRef] [Green Version]
- Jain, A.K.; Murty, M.N.; Flynn, P.J. Data clustering: A review. ACM Comput. Surv. 1999, 31, 264–323. [Google Scholar] [CrossRef]
- Jain, A.K.; Duin, P.W.; Mao, J. Statistical pattern recognition: A review. IEEE Trans. Pattern Anal. Mach. Intell. 2000, 22, 4–37. [Google Scholar] [CrossRef] [Green Version]
- Kanungo, S.; Bhatnagar, V.V. Beyond generic models for information system quality: The use of interpretive structural modeling (ISM). Syst. Res. Behav. Sci. 2002, 19, 531–549. [Google Scholar] [CrossRef]
- Boutsidis, C.; Magdon-Ismail, M. Deterministic Feature Selection for K-Means Clustering. IEEE Trans. Inf. Theory 2013, 59, 6099–6110. [Google Scholar] [CrossRef] [Green Version]
- Chiesa, M.B.; Bodini, I.; Petrogalli, C.; Provezza, L.; Faccoli, M.; Mazzù, A.; Solazzi, L.; Sansoni, G.; Lancini, M. K-means clustering approach for damage evolution monitoring in RCF tests. J. Phys. 2018, 1065, 102018. [Google Scholar]
- Elforjani, M. Diagnosis and prognosis of slow speed bearing behavior under grease starvation condition. Struct. Health Monit. 2018, 17, 532–548. [Google Scholar] [CrossRef]
- Janssens, O.; Slavkovikj, V.; Vervisch, B.; Stockman, K.; Loccufier, M.; Verstockt, S.; Van de Walle, R.; Van Hoecke, S. Convolutional Neural Network Based Fault Detection for Rotating Machinery. J. Sound Vib. 2016, 377, 331–345. [Google Scholar] [CrossRef]
- Hayashi, S.; Asakura, T.; Zhang, S. Study of machine fault diagnosis system using neural networks. In Proceedings of the 2002 International Joint Conference on Neural Networks, Honolulu, HI, USA, 12–17 May 2002; pp. 956–961. [Google Scholar]
- Kankar, P.K.; Sharma, S.C.; Harsha, S.P. Fault diagnosis of ball bearings using continuous wavelet transform. Appl. Soft Comput. J. 2011, 11, 2300–2312. [Google Scholar] [CrossRef]
- Prieto, M.D.; Cirrincione, G.; Espinosa, A.G.; Ortega, J.A.; Henao, H. Bearing fault detection by a novel condition-monitoring scheme based on statistical-time features and neural networks. IEEE Trans. Ind. Electron. 2013, 60, 3398–3407. [Google Scholar] [CrossRef]
- Kozłowski, E.; Mazurkiewicz, D.; Zabiński, T.; Prucnal, S.; Sęp, J. Machining sensor data management for operation-level predictive model. Expert Syst. Appl. 2020, 159, 113600. [Google Scholar] [CrossRef]
- Kozłowski, E.; Mazurkiewicz, D.; Zabiński, T.; Prucnal, S.; Sęp, J. Assessment model of cutting tool condition for real-time supervision system. Maint. Reliab. 2019, 21, 679–685. [Google Scholar] [CrossRef]
- Bustillo, A.; Reis, R.; Machado, A.; Pimenov, D. Improving the accuracy of machine-learning models with data from machine test repetitions. J. Intell. Manuf. 2020, 5–8, 1–19. [Google Scholar] [CrossRef]
- Elforjani, M.; Shanbr, S. Prognosis of Bearing Acoustic Emission Signals Using Supervised Machine Learning. IEEE Trans. Ind. Electron. 2018, 65, 5864–5871. [Google Scholar] [CrossRef] [Green Version]
- Shaheryar, A.; Yin, X.-C.; Yousuf, W. Robust Feature Extraction on Vibration Data under Deep-Learning Framework: An Application for Fault Identification in Rotary Machines. Int. J. Comput. Appl. 2017, 167, 37–45. [Google Scholar] [CrossRef]
- Danner, C.; Gov, K.; Xu, S. Condition Monitoring Using Accelerometer Readings. Available online: http://cs229.stanford.edu/proj2015/102_report.pdf (accessed on 20 January 2021).
- Amruthnath, N.; Gupta, T. Fault class prediction in unsupervised learning using model-based clustering approach. In Proceedings of the International Conference on Information and Computer Technologies ICICT 2018, DeKalb, IL, USA, 23–25 March 2018; pp. 5–12. [Google Scholar]
- Jia, F.; Lei, S.; Xing, S.; Lin, J. A method of automatic feature extraction from massive vibration signals of machines. In Proceedings of the 2016 IEEE International Instrumentation and Measurement Technology Conference, Taipei, Taiwan, 23–26 May 2016; pp. 1–6. [Google Scholar]
- Mekaroonkamon, T.; Wongsa, S. A comparative investigation of the robustness of unsupervised clustering techniques for rotating machine fault diagnosis with poorly-separated data. In Proceedings of the 8th International Conference on Advanced Computational Intelligence ICACI 2016, Chiang Mai, Thailand, 14–16 February 2016; pp. 165–172. [Google Scholar]
- Bouguerne, A. K-Means Clustering Based on Vibration Signal for Classification Induction Machine Faults. In Proceedings of the International Conference on Automatic control, Telecommunications and Signals (ICATS15), Annaba, Algeria, 16–18 November 2015; pp. 1–5. [Google Scholar]
- Hidayat, A.Y.; Widodo, A.; Haryadi, G.D. Fault Diagnostic System Bearing Centrifugal Pump Using K-Means Method for Thermography Image and Signal Analysis Vibrations. MATEC Web Conf. 2018, 159, 6. [Google Scholar]
- Lancini, M.; Bodini, I.; Vetturi, D.; Pasinetti, S.; Mazzù, A.; Solazzi, L.; Petrogalli, C.; Faccoli, M. Using Vibration Measurements to Detect High Wear Rates in Rolling ContactFatigue Tests; Acta IMEKO: Prague, Czech Republic, 2015; pp. 66–74. [Google Scholar]
- Bodini, I.; Sansoni, G.; Lancini, M.; Pasinetti, S.; Docchio, F. Feasibility study of a vision system for on-line monitoring of rolling contact fatigue tests. J. Phys. Conf. Ser. 2017, 778, 012007. [Google Scholar] [CrossRef] [Green Version]
- Ghidini, A.; Faccoli, M.; Mazzù, A.; Petrogalli, C. An innovative steel grade family for forged-rolled solid wheels designed for sandy environments. Ing. Ferrov. 2018, 73, 729–742. [Google Scholar]
- Faccoli, M.; Petrogalli, C.; Ghidini, A. On Mechanical Properties of New Railway Wheel Steels for Desert Environments and Sand Caused Wheel Damage Mechanisms. J. Mater. Eng. Perform. 2019, 28, 2946–2953. [Google Scholar] [CrossRef]
- Lewis, R.; Dwyer-Joyce, R.S. Wear mechanisms and transitions in railway wheel steels. Proc. Inst. Mech. Eng. Part J J. Eng. Tribol. 2004, 218, 467–478. [Google Scholar] [CrossRef] [Green Version]
- Mazzù, A.; Solazzi, L.; Lancini, M.; Petrogalli, C.; Ghidini, A.; Faccoli, M. An experimental procedure for surface damage assessment in railway wheel and rail steels. Wear 2015, 342, 22–32. [Google Scholar] [CrossRef]


| Steels | SANDLOS® S | 350 HT | |
|---|---|---|---|
| Chemical Composition (%) | C | 0.72 | 0.72 |
| Mn | 0.80 | 1.04 | |
| Si | 0.87 | 0.30 | |
| S | 0.001 | 0.004 | |
| P | 0.010 | 0.015 | |
| Ultimate tensile stress (MPa) | 1180 | ≥1175 | |
| Monotonic yield stress (MPa) | 750 | - | |
| Elongation (%) | 12 | ≥9 | |
| Hardness HB | 347 | 345 | |
| Feature | X Acceleration | Y Acceleration | Torque |
|---|---|---|---|
| Mean | Used | Used | Not used |
| Variance | Used | Used | Used |
| Root mean square | Used | Used | Used |
| Median | Not used | Used | Not used |
| 75th Percentile | Not used | Used | Not used |
| PSD centroid | Used | Used | Used |
| X Acceleration | Y Acceleration | Torque | |
|---|---|---|---|
| X Acceleration | Frequency Response Function (FRF) centroid | Max Cross Correlation Time delay FRF centroid | |
| FRF 25th percentile | FRF 25th Percentile | ||
| FRF median | FRF Median | ||
| FRF 75th Percentile | FRF 75th Percentile | ||
| Y Acceleration | Max cross correlation Time delay FRF centroid | Max cross correlation Time delay FRF centroid | |
| FRF 25th percentile | FRF 25th percentile | ||
| FRF median | FRF median | ||
| FRF 75th percentile | FRF 75th percentile | ||
| Torque | FRF centroid | FRF centroid | Max cross correlation |
| FRF 25th percentile | FRF 25th percentile | ||
| FRF median | FRF median | ||
| FRF 75th percentile | FRF 75th percentile |
| Test ID | Protocol | Stop Condition | Cycles |
|---|---|---|---|
| T01 | Stepwise | Predefined number of cycles | 200,000 |
| T02 | Stepwise | Predefined number of cycles | 200,000 |
| T03 | Continuous | Predefined number of cycles | 200,000 |
| T04 | Continuous | Predefined number of cycles | 200,000 |
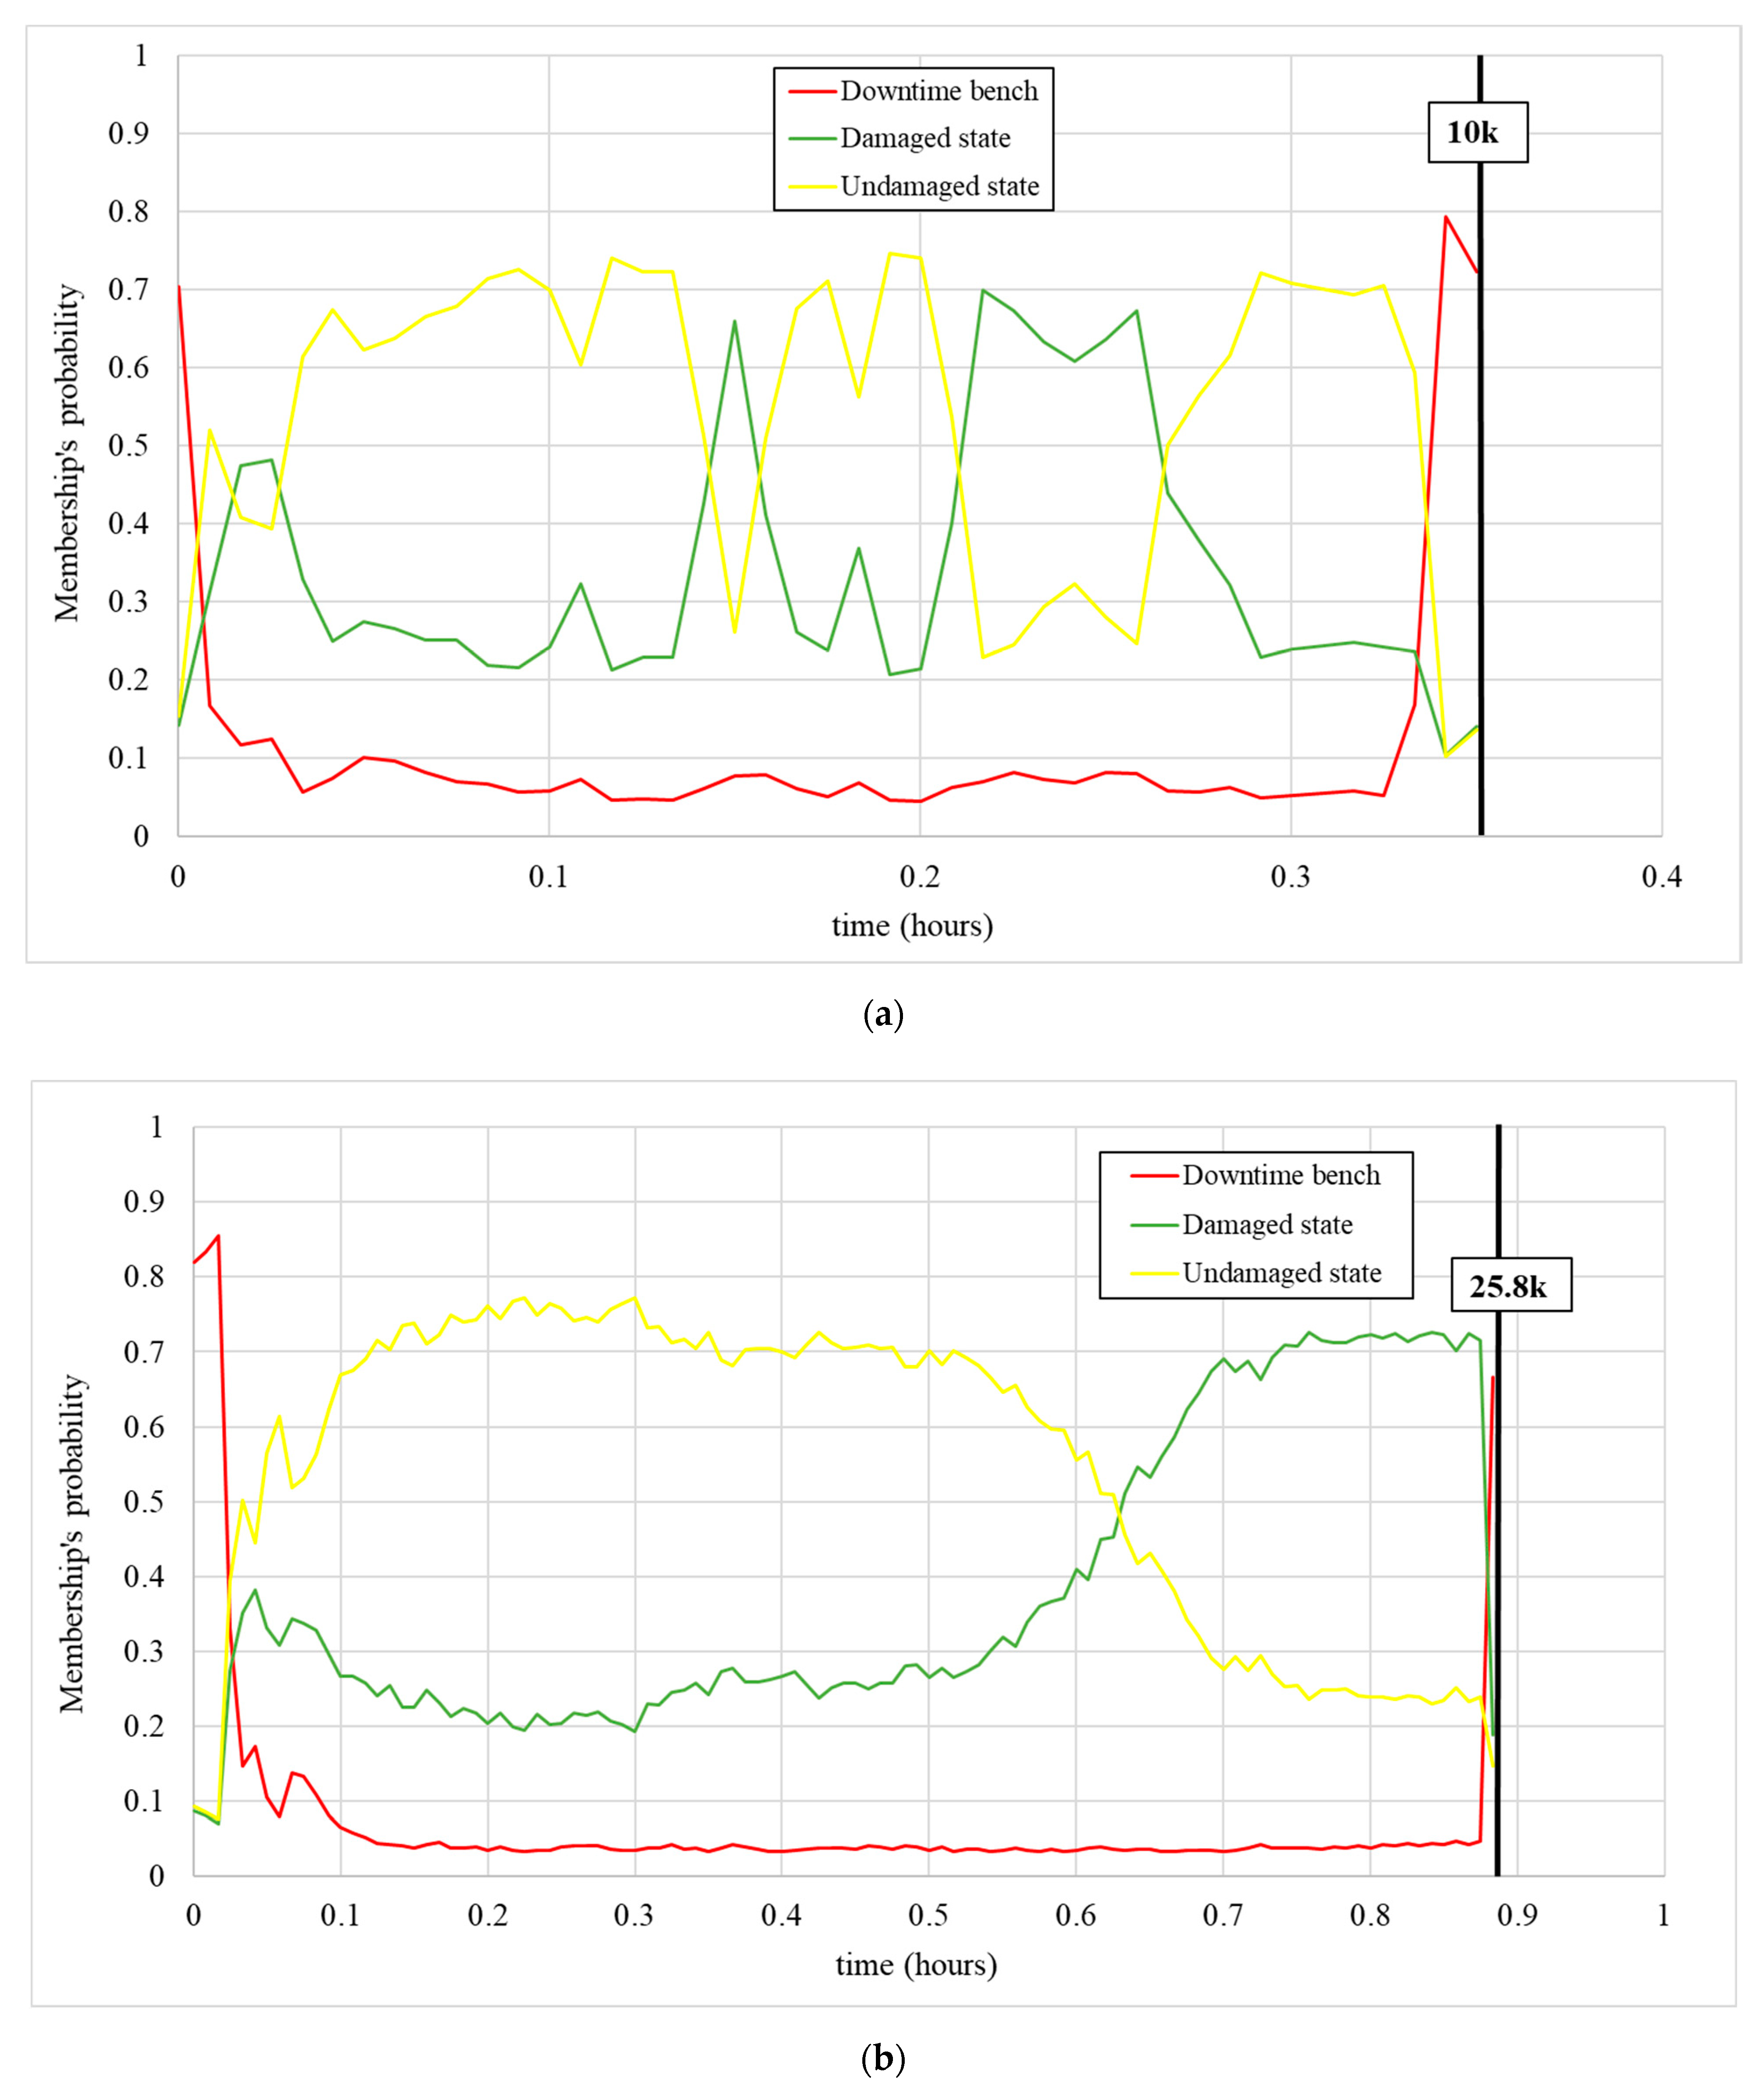
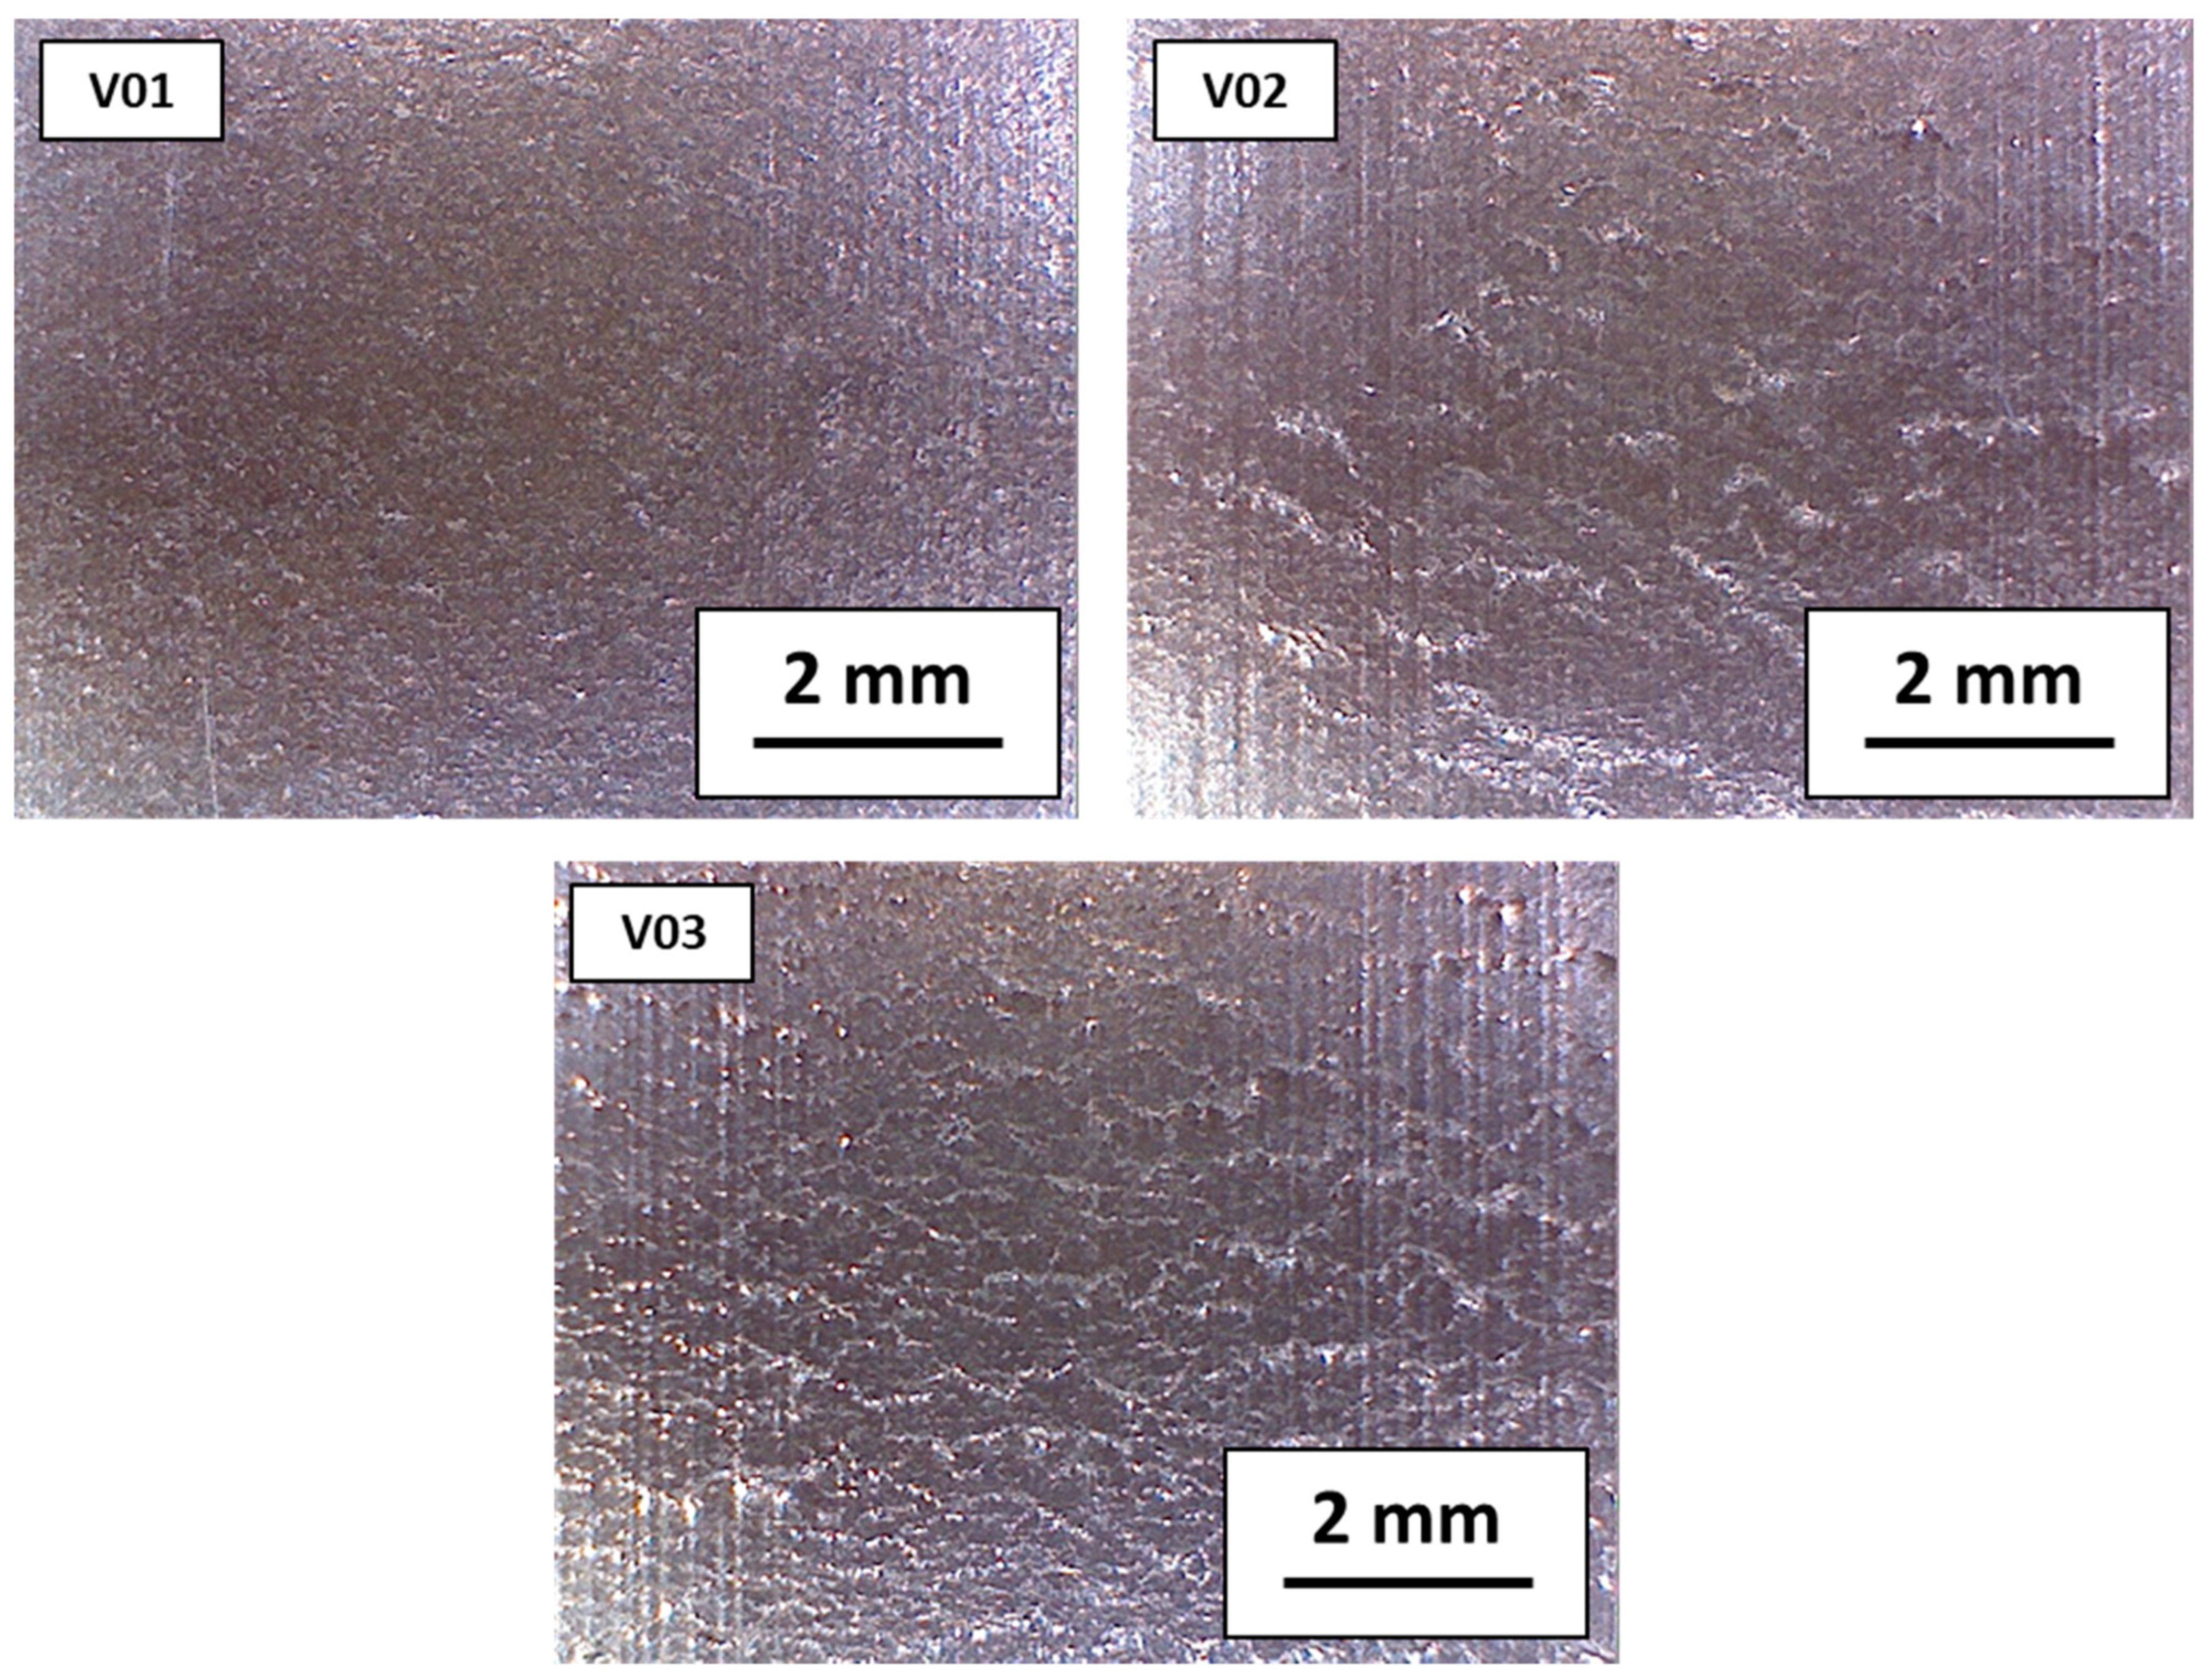
| V01 | Continuous | Controlled by k-means results | 10,000 |
| V02 | Continuous | Controlled by k-means results | 25,858 |
| V03 | Continuous | Controlled by k-means results | 100,000 |
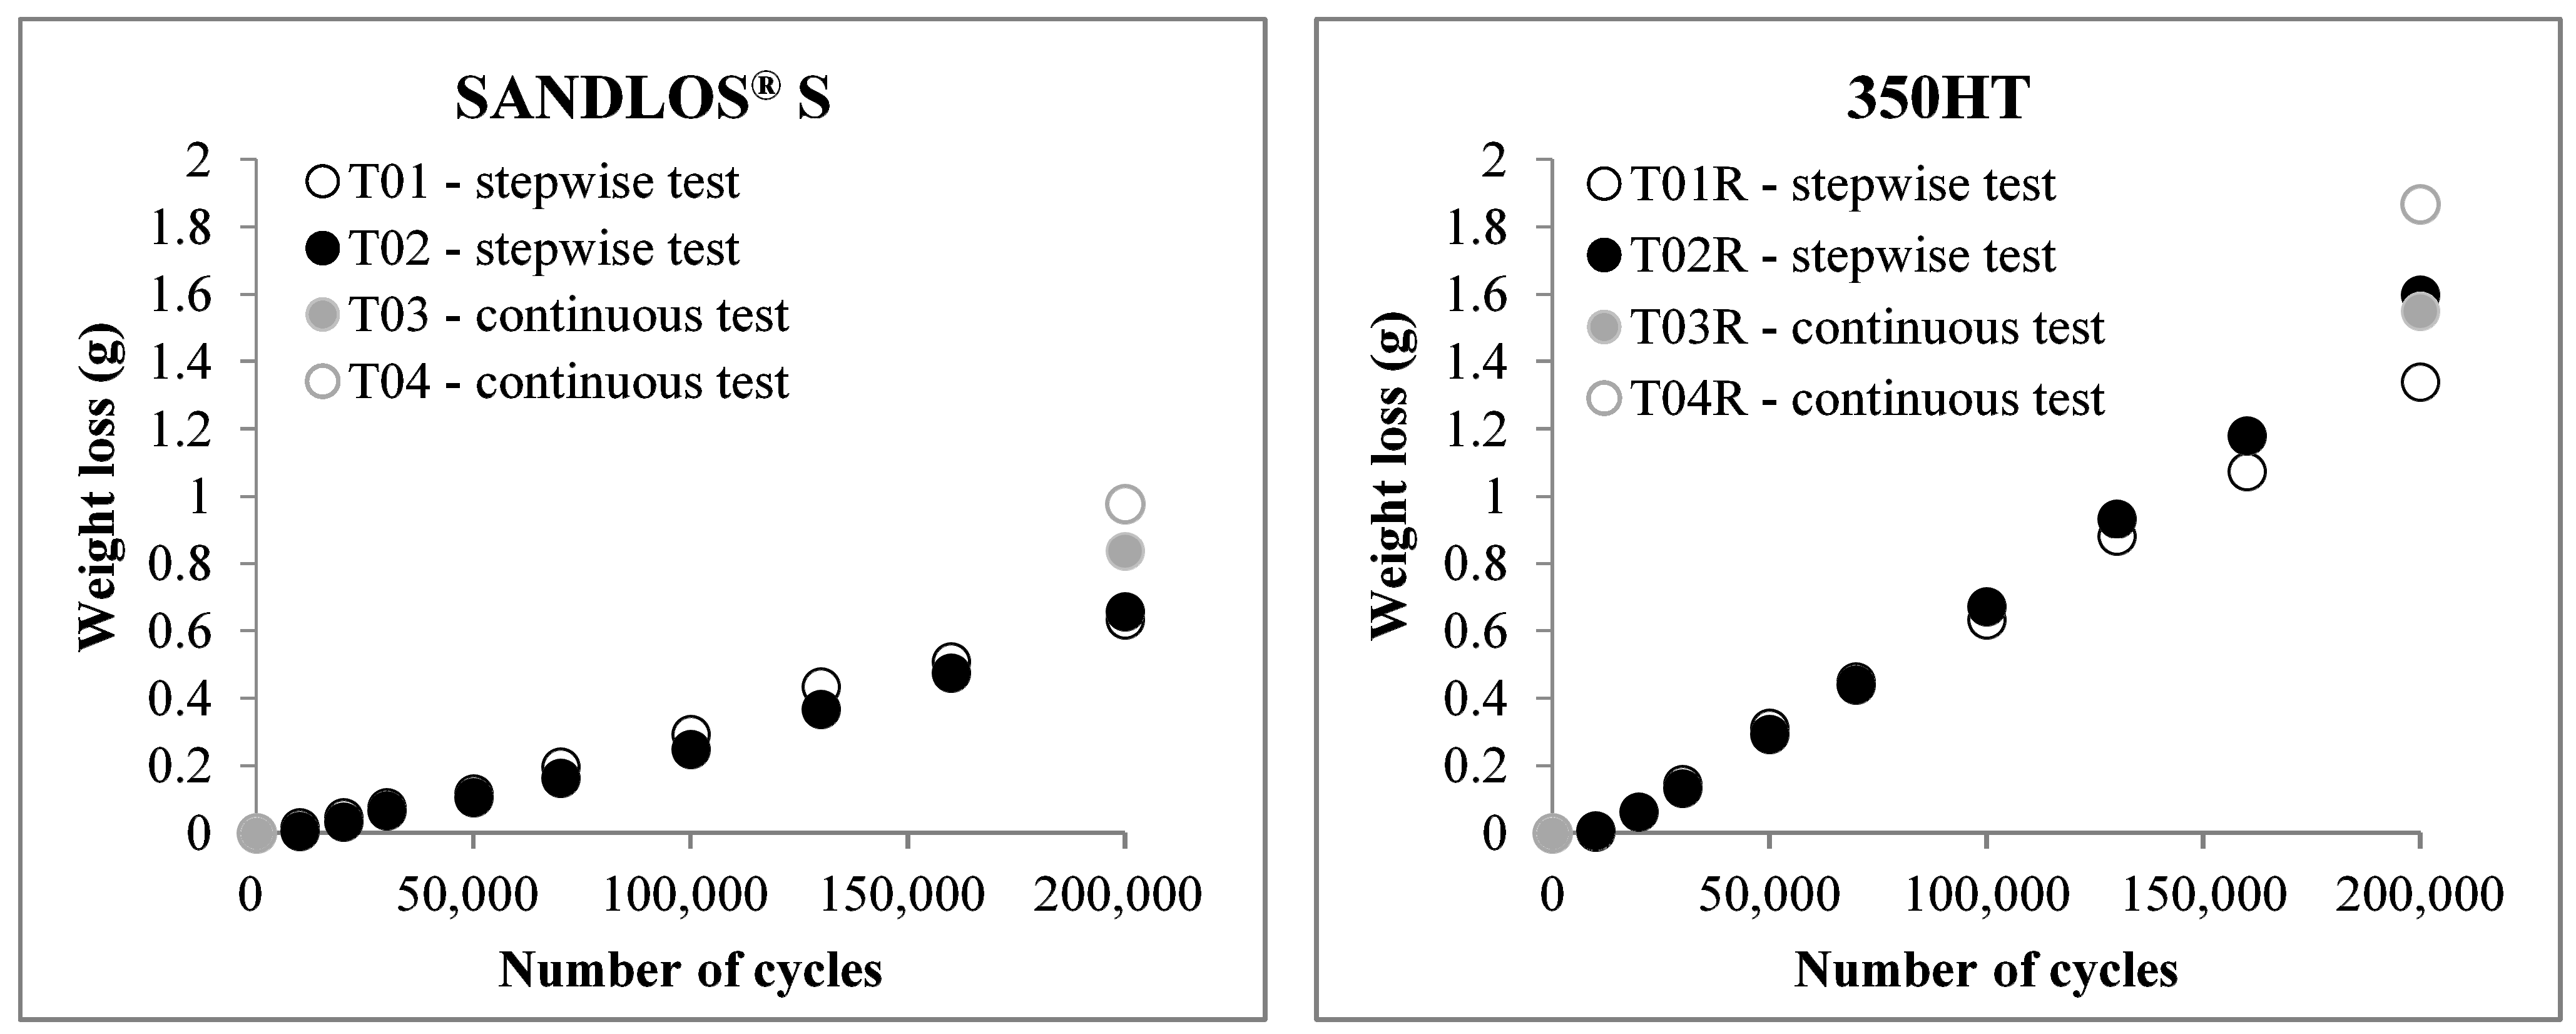
| Steel | Wear Rate (g/Cycle) |
|---|---|
| SANDLOS® S T01 | 3.34 × 10⁻⁶ |
| 350HT T01R | 7.10 × 10⁻⁶ |
| SANDLOS® S T02 | 3.08 × 10⁻⁶ |
| 350HT T02R | 7.90 × 10⁻⁶ |
Publisher’s Note: MDPI stays neutral with regard to jurisdictional claims in published maps and institutional affiliations. |
© 2021 by the authors. Licensee MDPI, Basel, Switzerland. This article is an open access article distributed under the terms and conditions of the Creative Commons Attribution (CC BY) license (http://creativecommons.org/licenses/by/4.0/).
Share and Cite
Provezza, L.; Bodini, I.; Petrogalli, C.; Lancini, M.; Solazzi, L.; Faccoli, M. Monitoring the Damage Evolution in Rolling Contact Fatigue Tests Using Machine Learning and Vibrations. Metals 2021, 11, 283. https://doi.org/10.3390/met11020283
Provezza L, Bodini I, Petrogalli C, Lancini M, Solazzi L, Faccoli M. Monitoring the Damage Evolution in Rolling Contact Fatigue Tests Using Machine Learning and Vibrations. Metals. 2021; 11(2):283. https://doi.org/10.3390/met11020283
Chicago/Turabian StyleProvezza, Luca, Ileana Bodini, Candida Petrogalli, Matteo Lancini, Luigi Solazzi, and Michela Faccoli. 2021. "Monitoring the Damage Evolution in Rolling Contact Fatigue Tests Using Machine Learning and Vibrations" Metals 11, no. 2: 283. https://doi.org/10.3390/met11020283