
The Effects of Shot Distance and Impact Sequence on the Residual Stress Field in Shot Peening Finite Element Model


1
School of Automotive Engineering, Wuhan University of Technology, Wuhan 430070, China
2
Hubei Key Laboratory of Advanced Technology for Automotive Components, Wuhan University of Technology, Wuhan 430070, China
3
Hubei Collaborative Innovation Center for Automotive Components Technology, Wuhan University of Technology, Wuhan 430070, China
4
School of Transportation, Wuhan University of Technology, Wuhan 430063, China
*
Author to whom correspondence should be addressed.
Metals 2021, 11(3), 462; https://doi.org/10.3390/met11030462
Submission received: 13 February 2021
/
Revised: 4 March 2021
/
Accepted: 8 March 2021
/
Published: 11 March 2021
(This article belongs to the Special Issue Finite Element Analysis of Mechanical Behavior of Metallic Materials)
Abstract
:In order to investigate the effect of shot distance and impact sequence on the residual stress distribution of 42CrMo steel in shot peening (SP) finite element (FE) simulation, 3D dynamic models with order dimple pattern and stochastic dimple pattern were established via ABAQUS/Explicit 6.14, and the simulation results were compared with experiments. The results show that shot overlap has a significant effect on the residual stress distribution of peened parts. Meanwhile, there is a threshold (related to SP parameter) for shot distance in the vertical and horizontal directions. When the shot distance is greater than the threshold in this direction, the residual stress distribution after SP tends to be stable. The impact sequence has almost no effect on the impact of a small number of shots, but this effect will appear when the number of shots increases. It is necessary to avoid shot overlap and continuous impact of adjacent dimples when the FE model is established; on this basis, the distance between shots and the number of layers of the shots can be reduced as much as possible without affecting the residual stress distribution. In addition, the comparison of simulation and experimental results shows that the residual stress evaluation area consistent with the experimental measurement is essential to obtain accurate residual stress distribution in the FE simulation process.
1. Introduction
Mechanical processing often introduces tensile stress and micro-cracks on the surface of metal parts, while failures such as fatigue fracture are very sensitive to the surface properties of component materials, so most of the failures occur on the surface of parts [1]. As a mechanical surface treatment, the original purpose of SP is to introduce a compressive residual stress field into the surface of the workpiece via a large number of spherical shots impacting metal parts repeatedly, so as to inhibit the initiation and propagation of fatigue cracks and improve the fatigue life. Subsequently, a large number of studies have shown that SP can also improve the surface quality [2] and the surface hardness [3] of metal parts, and even introduce surface nanocrystallization [4], which are helpful to further improve the fatigue resistance of metal parts. Due to its many advantages, SP is widely used in aerospace [5,6], automobile manufacturing [7], shipping [8,9] and other industrial fields.
With the development of computer and simulation technology, the application of simulation technology in SP process has made great progress in the past forty years. The simulation of SP can effectively save a lot of manpower and material resources consumed in the early stage of the formulation of SP process parameters. At the same time, numerical simulation can further deepen the understanding of the mechanism of residual stress field and size distortion mechanism on the surface of parts induced by shot impact. At present, simulation analysis has become an indispensable research tool for SP. The simulation work of SP was first carried out by Hardy et al. [10], who tried to solve the contact problem of a rigid sphere in elastic-perfectly plastic half-space by a 2D model and statics method. The dimension of shot dimple obtained by simulation was in good agreement with the experimental results, indicating the feasibility of finite element technology in SP. Until now, SP simulation has mainly been divided into three directions: optimization of simulation model [11,12,13], establishment of simulation model using different technologies [14,15,16], and study of the influence of SP parameters on the SP effect by using simulation models [17,18,19].
The SP process involves many process parameters, so it is very important and necessary to simplify and assume some parameters of the model appropriately in the simulation process. In terms of shot material properties, since the hardness of shot is always much higher than that of the workpiece, many scholars [20,21,22,23] set the shot as a rigid body in the SP model in order to reduce the calculation cost without affecting the calculation accuracy. Wu et al. [20] proposed a dynamic SP model and found there was a threshold between shot hardness and workpiece hardness via choosing shots with different hardness impacting on AISI304 stainless steel. When the difference between shot hardness and workpiece hardness was greater than a certain threshold, the shot hardness no longer affected the distribution of the residual stress field induced by SP; the residual stress field obtained by deformable shot is consistent with the residual stress field obtained by rigid shot. Mylonas et al. [23] and Bhuvaraghan et al. [11] simulated the SP process with two different materials and found that the strain rate sensitivity (SRS) of material had a significant effect on the residual stress field. In addition, the cyclic loading behavior [12] and Bauschinger effect [13] caused by the shot flow repeatedly impacting the workpiece were found to have a certain influence on the residual stress distribution. Klemenz et al. [13] proposed a combined isotropic-kinematics constitutive model, which could accurately describe the cyclic deformation behavior and the related Bauschinger effect, and the results obtained were in good agreement with the experimental results.
In terms of impact mode of the SP model, the researchers aimed to establish an SP model to describe the actual SP process via different numerical techniques. Baragetti et al. [24] established a 3D model for the first time and used the dynamic solution method to simulate the process of a single shot impacting the surface of a steel plate. Then Miao et al. [14] combined the Matlab program and an ANSYS preprocessor to establish a 3D random FE model, which was more in line with the actual SP process. Jebahi et al. [15] and Liu et al. [16] established SP models with impact by hundreds of shots by using an FEM-DEM coupling method and SPH technology, respectively, which were also used to simulate a real SP process. In addition, in order to eliminate the effect of the rebound of the stress wave generated by the shot impact in the SP model, non-reflective boundary conditions [25], half-infinite elements [26], material damping introduced artificially [27], and other techniques were applied to the establishment of the SP model. In terms of SP process prediction, scholars have also done a lot of research using FE models to study the effect of SP parameters on SP effects. Schwarzer et al. [28] established a 3D FE model and systematically studied the influence of shot diameter, velocity, coverage, and impact angle on the residual stress distribution. Shivpuri et al. [17] used the modified model to explore the influence of the workpiece hardness and geometry size, and the change of the residual stress field of the workpiece after repeated shot impact. Bagherifard et al. [18] proposed a method to predict the surface nanostructure layer of the workpiece after high-energy shot peening (HESP) by PEEQ value and the prediction results were in good agreement with the experimental data. Huang et al. [19] further discussed the universality of this method, and obtained the ultimate PEEQ value for surface nanocrystallization by considering both workpiece and shot grid density in the SP model.
With the continuous deepening of simulation analysis, not only validation but also calibration of the FE model is an important part of simulation analysis, which directly determines the accuracy and rationality of the simulation results. According to the international standard SAEJ2277:2003 [29], coverage is defined as a percentage of the peened surface in relation to the whole target surface. Hence, in the process of SP simulation, it is a common practice to obtain a coverage rate through a specific dimple pattern [13,20,25,30,31]. However, when it comes to the specific shot impact mode, scholars chose different approaches. Wu et al. [20] and Xie et al. [25] adopt a shot overlapping impact mode with an order dimple pattern. Klemenz et al. [13,30] used different impact modes in his two research reports: random impact mode and ordered impact mode. In the 3D symmetry-cell SP model established by Kim et al. [31], four shots impacted the surface of the workpiece successively. And by comparing the area-averaged solution and the four-node-averaged solution with the experiment solution, they stressed the importance of a suitable residual stress evaluation method for the SP model to predict the residual stress field. However, there was no further research on how to choose the impact mode and the effects of different impact modes on the residual stress field. Eltobgy et al. [32] established a simple SP model to study the effect of the horizontal distance between two impacts on a residual stress field in a multi-shot SP model, but they did not correlate it with the actual coverage. The shot distance was considered in the SP models established by Mylonas et al. [23] and Miao et al. [14], but there was no quantitative discussion on the influence of shot distance on residual stress distribution.
The shots do not overlap at all in reality, which can also be achieved in the shot peening FE model, as long as the distance between the shots is large enough. However, the longer the distance between the last impacted shot and the workpiece, the higher the computational cost of the model. Especially for the impact of dozens or even hundreds of shots, the computational cost will be unbearable. Therefore, the SP model was usually simplified in previous work, and the assumptions of shot overlap and different shot impact modes were adopted [13,14,25,30,31,32] in order to study their influence on residual stress distribution and perform some calibration of the SP model. In this paper, three SP models (including two order dimple pattern models and a stochastic dimple pattern model) were established to study and quantify the effect of shot distance (horizontal direction and vertical direction) and shot impact sequence on the residual stress distribution of peened specimen in an SP model. On this basis, the influence of residual stress assessment area on the residual stress field was further discussed.
2. FE Model Setup
2.1. FE-Geometric-Model Setup
All SP models in this work were developed via commercial FEM software ABAQUS/Explicit 6.14. In order to investigate the influence of different shot impact modes on residual stress distribution, an ordered dimple pattern model and stochastic dimple pattern model were established. The ordered dimple pattern model consisted of 4-shots and 16-shots as shown in Figure 1a,b, which was used to study the influence of shot distance, shot impact sequence and evaluation area on residual stress distribution in the SP model. The stochastic dimple pattern model as shown in Figure 1c was used to study the influence of evaluation area on residual stress distribution and obtain residual stress data to compare with the data obtained via ordered dimple pattern model. Prior to this, a single shot model was established to determine the dimple diameter, which was used to calculate the coverage of the order dimple pattern and stochastic dimple pattern SP models.
The modeling process and the dimension of the workpiece in the order dimple pattern model (including 4-shots and 16-shots) and stochastic dimple pattern model were the same. Figure 1 shows more details about these three SP models. The dimension of the workpiece was 3 mm × 3 mm × 2 mm. The element types of the workpiece and shots were eight-node brick with reduced integration (C3D8R) and four-node tetrahedron (C3D4), respectively. According to the research conducted by Sheng and Wang [33,34], when the size of the workpiece element was about 1/10 of the dimple diameter or even smaller, the distribution of the residual stress was stable. Therefore, the central area of workpiece with a dimension of 1 mm × 1 mm × 2 mm was chosen as a refined mesh region and the element size in this area was 0.02 mm × 0.02 mm × 0.02 mm, whose element size is ranges approximately from 1/16 to 1/25 of the dimple diameter in chosen SP parameters. The element size of the gradient mesh region increased as the distance from the center point increased. All side faces were surrounded by so-called half-infinite elements (CIN3D8) to minimize the reflection of dilatational and shear waves back into the region of interest [26]. The bottom of the workpiece was fixed in all directions. The contact between shot and target workpiece was defined using a ‘Master–Slave’ contact pair with the shot surface as the master and the target workpiece surface as the slave surface. The friction coefficient between shot and target workpiece was 0.4 [35].
2.2. Material Model Setup
The material of workpiece in SP model was 42 CrMo with the chemical composition 0.44 C, 1.21 Cr, 0.22 Mo, 0.28 Si, 0.81 Mn, 0.07 Ni, 0.03 S, 0.03 Al, 0.02 P and balance Fe (all in wt. %). The heat treatment of 42CrMo was austenitization at 850 °C for 20 min, quenching in oil and tempering at 650 °C for 2 h. Since the target material undergoes high strain rate during the SP process, the SRS of the target material, which has been proven to have a considerable influence on the residual stress prediction [36], should be considered. The Johnson-Cook material constitutive model, which is suitable for modeling high-strain-rate deformation of metals, was chosen in the SP model [37]. The Johnson-Cook constitutive model is expressed as follows:
where is the flow stress of material. A, B, C, n, m are related material parameters. , , are equivalent plastic strain, equivalent plastic strain rate and initial equivalent plastic strain rate, respectively. T, , are working temperature, ambient temperature and melting temperature, respectively. Table 1 shows the Johnson-Cook model parameters of 42CrMo steel [38]. Since the hardness of the shots was much higher than that of the target workpiece, the shots were set as rigid body in the SP model [20].
2.3. Coverage Calculation and Residual Stress Evaluation Method
In order to describe the peening coverage ratio of ordered dimple pattern and stochastic dimple pattern, two different coverage description methods were carried out. Order dimple pattern was realized by the method proposed by Wang et al. [39], stochastic dimple pattern was realized via a Python program from our group previous work [40]. Figure 2a,b show 100% peening coverage ratio of order dimple pattern in 4-shots and 16-shots SP models, respectively. Figure 2c shows 100% peening coverage ratio of stochastic dimple pattern after 38 random impact shots. The area in the black circle represents the 100% peening coverage ratio region. In the stochastic dimple pattern model, the number of shots was obtained according to the following empirical formula derived by Kirk et al. [41]:
where C is the coverage ratio, N is the number of shots required to meet the specific coverage ratio, d is the dimple diameter after single shot impact and D is the size of the coverage evaluation area (D = 1 mm in this work). Since it is difficult to discern optically exact 100% coverage, according to the definition of the international standard SAE J2277 [29], when the coverage reaches 98%, it can be considered that the 100% coverage ratio has been met. According to the previous simulation results, the diameter of a single dimple after a shot impacts the workpiece with a velocity of 60 m/s and a diameter of 0.8 mm is about 0.326 mm. Under the above conditions, the number of shots is N = 38 for a 100% coverage ratio.
In order to compare the residual stress results obtained by simulation and X-ray residual stress analyzer (μ-X360s, Pulstec Industrial Co., Ltd. Hamamatsu, Japan), a circular evaluation area was used to calculate the residual stress field in the SP model. In order to obtain the residual stress distribution in depth, a thin layer was removed step by step from the surface via the electrolytic removal method. The correction of residual stress caused by surface removal was conducted on the basis of previous work from Moore and Evans [42]. The circular evaluation area was consistent with the circular spot (spot diameter is 1 mm and the residual stress measured was the average of the spot area) emitted by the X-ray residual stress analyzer, and its size is adjusted by controlling the diameter of the circular evaluation area, as shown in Figure 3. Specifically, in the simulation model, all nodes in the circular area under each layer depth (every 0.02 mm) in the ABAQUS result file were extracted by the Python program, and then the average value under each layer depth was calculated to obtain the distribution of residual stress along the layer depth. The residual stress distributions extracted were all inside the central cuboid with 1 mm × 1 mm × 2 mm, and the center of evaluation area always coincided with the center of the central cuboid.
3. Results and Discussion
3.1. The Effect of Shot Distance on the Residual Stress State in Ordered Dimple Pattern SP Model
In order to describe the specific coverage ratio after SP, the SP model is usually simplified and a specific dimple pattern is chosen. Meanwhile, the certain degree of shot overlap is often set in the specific dimple pattern SP model. In order to study the impact of shot overlap on the residual stress field in the ordered dimple pattern SP model, a 4-shots model (100% coverage) was established as shown in Figure 4a, in which the vertical distance Z between shots changes (Z = 0 means shot complete overlap), to describe the degree of overlap in the shot impact process. Figure 4b shows the impact sequence in the 4-shots model and the numbers on the circle represents the shot impacting sequence. The numbers 1-2-3-4 in the figure represent the sequence of four shots impacting the workpiece counterclockwise.
Figure 5 shows the residual stress depth profiles of five different vertical distance between shots (Z) SP models in the condition of V = 60 m/s, d = 0.8 mm and C = 100%. It can be seen from Figure 5 that shot overlap has remarkable influence on the residual stress field after the SP process. The shot overlapping assumption in the SP model causes the values of maximum compressive residual stress (), the depth of the maximum compressive residual stress () and the depth of compressive residual stress field () to be overestimated and the surface residual stress () to be underestimated. Specifically, in complete overlap condition (Z = 0), the errors between simulated and experimental values of , , and are about 21%, 60%, 75% and 93%, respectively; when the shot diameter is 0.8mm, the shot velocity is 60 m/s and coverage ratio is 100%. The large error between the predicted and actual residual stress field can be attributed to the 4-shot complete overlap assumption in the SP model. In the case of 100% coverage, in order to save calculation time, 4 shots are made to hit the adjacent dimple on the surface of the workpiece at the same time. However, this phenomenon is impossible in real space due to the geometric constraint of shots. The assumption of shot overlapping causes the workpiece material to have no time to rebound and recover after the adjacent shot impact, resulting in a residual stress field that is seriously inconsistent with the actual situation. From Figure 5 it also can be seen that the deviations between simulated and experimental results gradually decrease with the degree of overlap decreasing, which is due to the fact that the material in the peened area can be recovered before the next shot impact. When the vertical distance between shots is greater than 0.05 mm, the distribution of the residual stress field tends to be stable. The residual stress profiles of vertical distance of 0.05 mm, 0.1 mm and 1 mm are almost same. The error of the experimental value and the simulation value of , , and are all within 20%, which indicates that the prediction ability of this SP model is good. The 0.05 mm vertical distance between shots ensures that the workpiece material can recover after shot impact when the SP parameters are 60 m/s in velocity and 0.8 mm in diameter. The stress wave of the previous impact disappears before the next shot impact, and the residual stress field inside the workpiece reaches a stable state. Although there is still overlap between shots when vertical distance is larger than 0.05 mm, this overlap has no effect on the residual stress results. Therefore, the distance between the shots can be shortened artificially, so that the shots have a certain degree of overlap without affecting the final simulation results of the model, so as to achieve a good balance between model accuracy and calculation cost. Especially for the model that requires a large number of shots impacting the workpiece to meet a higher coverage, a certain degree of shot overlap can significantly reduce the computational cost.
With the increase of the mass and velocity of shots, the energy carried by a single shot increases. The time required for the peened material recovery and the residual stress field reaching a stable state after shot impact is longer, which means the vertical distance between the adjacent shots in SP model is larger. Figure 6 shows the residual stress depth profiles of five different vertical distance between shots (Z) SP models in the condition of V = 120 m/s, d = 1.0 mm and C = 100%. It can be seen that when the shot velocity is 120 m/s and the shot diameter is 1mm, the vertical distance between shots must be larger than 0.2 mm to ensure the residual stress field of the workpiece stable. Therefore, it is necessary to avoid the shots hitting the surface of the workpiece at the same time in SP simulation. Meanwhile, there is a threshold for the distance between shots. When the vertical distance is greater than this threshold, the residual stress field will no longer be affected, and the threshold is related to SP parameters (velocity and diameter). In the process of SP model simplification via shot overlapping assumption, there is a balance between the simulation efficiency and the accuracy of residual stress prediction, so the simplification of shot impact mode is premised on the requirements of prediction accuracy.
On the other hand, some previous work from other scholars also shows that the simulated residual stress results are consistent with experimental results when shots impact simultaneously [25]. Therefore, there must be a certain value for horizontal distance between shots, when horizontal distance between shots is greater than this value, the simultaneous impact of shots (Z = 0 mm) will not affect the residual stress field of the workpiece. Therefore, a 4-shots SP model with changing the horizontal distance between shots (W) was proposed with the aim of analyzing the influence of shot overlap on the residual stress field. Figure 7 shows the schematic diagram of horizontal distance between adjacent shots in 100%, 40% and 20% coverage ratio condition. From Figure 7 it can be seen that the horizontal distances between the center points of the two adjacent dimples are about 0.46 mm and 0.66 mm in 40% and 20% coverage ratio conditions and the dimple diameter is about 0.33 mm. The impact sequence of shots is along the counterclockwise direction of 1-2-3-4. Figure 8 shows the residual stress depth profiles of four different vertical distance between shots (Z) SP models in the conditions V = 60 m/s, d = 0.8 mm and C = 40% (W = 0.46 mm) and V = 60 m/s, d = 0.8 mm and C = 20% (W = 0.66 mm).
Compared with residual stress depth profile shown in Figure 5 and Figure 8a, it can be seen that the influence of vertical distance between shots on the residual stress distribution in depth in 40% coverage ratio condition is obviously less than that in 100% coverage ratio condition. Under the condition of 40% coverage ratio, the error between residual stress curves with different Z values is within 10%, except for the residual stress in the depth range of 0.3–0.6 mm. In this range, simultaneous impact (Z = 0 mm) causes a certain deviation in residual stress distribution in depth from that of other non-simultaneous impact conditions. We guess that the stress waves generated by the simultaneous impact of 4 shots interfered with each other during the propagation inside the workpiece and caused this deviation. This may also be one of the reasons the deviation after 4 shots impacting under 100% coverage is greater (the horizontal distance between 4 shots is smaller, which means that the stress waves generated by the simultaneous impact of 4 shots are closer and interference between stress waves is more obvious), especially for the depth of compressive residual field ().As the horizontal distance between the shots increases, this effect will gradually decrease and no longer be significant, as shown in Figure 8b. When the horizontal distance between the center points of the two adjacent dimples is 0.66 mm, the error of residual stress depth profiles in different vertical distance conditions is less than 10%. The overestimation of the values of , and and underestimation of the value of caused by simultaneous impact, which is shown in Figure 5 and Figure 6, will no longer appear. The results in Figure 8a,b show that with the increase of the horizontal distance between adjacent shots, the influence of the vertical distance between adjacent shots (whether the shots overlap or not) on the residual stress field decreases gradually. When the horizontal distance increases to 0.66 mm (twice of dimple diameter), the effect of vertical distance between adjacent shots on residual stress distribution after SP can be ignored.
3.2. The Effect of Impact Sequence on the Residual Stress State in Order Dimple Pattern SP Model
As mentioned in Section 3.1, the shot distance affects the residual stress distribution in the SP model. A reasonable assumption of shot distance should be set according to the specific situation to improve the calculation efficiency and ensure the reliability of the residual stress prediction results. In the ordered dimple pattern SP model, apart from the dimple pattern arrangement, it is also interesting to consider whether the impact sequence will affect the residual stress field. Specifically, for the 100% coverage 4-shots SP model, in addition to the shot impact sequence 1-2-3-4 adopted in Section 3.1 Figure 7, there are several other impact sequences 1-3-2-4 and 1-4-2-3, as shown in Figure 9. For the 16-shot SP model, there are many kinds of shot impact sequences and the four different typical shot impact sequences that were chosen in this work, as shown in Figure 10. Figure 10a is the sequential impact sequence (S1). Figure 10b is the symmetrical impact sequence (S2) [30]. Both Figure 10c,d show the random impact sequence (S3 and S4). The difference between these two random impact sequences is the number of impact layers. The S3 sequence is 9 layers and the S4 sequence is 16 layers. The only constraint of these random impacts is that the shots which produce the adjacent dimple do not impact the workpiece surface at the same time. Figure 10e shows that the 16 shots impact the workpiece surface simultaneously (S5). The number inside the circle represents the impact sequence and the same number means the shots impact the workpiece surface simultaneously. For the 4-shots SP model and the 16-shots SP model, the vertical distance between the shots with adjacent number is 0.1 mm. Figure 11 shows that the residual stress depth profiles after 4 shots and 16 shots impact the workpiece with different impact sequences. Figure 12 shows the contour plots of the residual stress state evaluated in X-direction for five different impact sequences (all the models are shown in a cut view).
From Figure 11a it can be seen that for the 4-shots SP model, impact sequences almost have no effect on the residual stress field after SP treatment. In the prediction of and , the errors between the simulated of three different impact sequences and experimental are about 21%, 24% and 13%. The errors between the simulated of three different impact sequences and experimental are about 18%, 22% and 22%. From Figure 11b it can be seen that for the 16 shots SP model, shot impact sequences show a certain effect on the residual stress field after SP treatment, which is reflected in the value of and . The residual stress depth profiles of S5, in which 16 shots impact the workpiece surface simultaneously, is obviously inconsistent with the experimental residual stress results. Figure 12 shows the contour plots of the residual stress state evaluated in X-direction for five different impact sequences in the 16-shots model. From Figure 12e it also can be seen that simultaneous impact causes a large value of , which corresponds with the S5 curve in Figure 11b. The sequential impact sequence (S1) causes an underestimation of . This phenomenon occurs because the distance between the two shots, which continuously impacts the workpiece surface, is too close. The small distance between adjacent shots has little effect on residual stress distribution when the number of shots is small. However, when the number of shots increases, the accumulated plastic deformation in the same region still has an impact on the distribution of residual stress, resulting in the underestimation of . The symmetrical impact sequence (S2) causes a little overestimation of . Both of the random impact sequences, S3 and S4, can predict the residual stress distribution well. Specifically, the simulated values of and in S3 are −466 MPa and −880 MPa and the errors with experimental values are 14% and 1% respectively. The simulated values of and in S4 are −422 MPa and −919 MPa, respectively, and the errors with experimental values are 3% and 6%, respectively. Compared with the S4 impact sequence (16 layers), the number of shot layers in the S3 impact sequence (9 layers) is less, which means that as long as the shots are arranged in a reasonable space, the number of shot layers can be reduced to reduce the calculation time. Compared with the 4-shots SP model in Figure 11a, the 16-shots SP model is more accurate in predicting the residual stress distribution after SP treatment, which is mainly reflected in the prediction accuracy of . The simulated error of in the 4-shots SP model is about 18% while the simulated error of in the 16-shots model is about 6%.
3.3. The Effect of Evaluation Area on the Residual Stress State in SP Model
The comparison between the simulated and experimental residual stress distribution is a direct criterion for the predictive ability of the SP model. In the post-processing of SP simulation, due to fact that the workpiece established in the model is very small compared to the actual parts, the averaging effect of the experimental residual stress measurement cannot be ignored. The different residual stress distributions were often obtained via the same SP model due to different residual stress evaluation areas [31]. In order to study the influence of the residual stress evaluation area on the residual stress value, an order dimple pattern SP model (16-shots) and a stochastic dimple pattern SP model (38-shots) with 100% coverage ratio were established. In the ordered dimple pattern SP model, the 16 shots impact the surface of workpiece with the S3 sequence shown in Figure 10c and S4 sequence shown in Figure 10d. Both are ordered dimple patterns and stochastic impact sequences. In the stochastic dimple pattern SP model, the 38 shots impact the surface of workpiece randomly. The variation of the residual stress evaluation area was achieved by changing the diameter shown in Figure 3. Figure 13, Figure 14 and Figure 15 show the residual stress depth profile with different sizes of evaluation areas after impacting the workpiece with ordered dimple pattern and stochastic impact order (S3 and S4) and stochastic dimple pattern. The experimental residual stress used for comparison with the simulated residual stress was obtained by μ-X360s residual stress analyzer with a spot diameter of 1 mm.
From Figure 13 it can be seen that with S3 stochastic impact order, the residual stress depth profile obtained via different evaluation areas are quite different, especially for the values of and . Specifically, when the residual stress evaluation area is small ( < 0.7 mm), the simulated residual stress depth profile is quite different from the experimental value. In particular, the maximum compressive residual stress is overestimated, while the surface residual stress is underestimated. The deviation between simulated and experimental results decreases as the evaluation area increases. When the diameter of the evaluated area is 1 mm ( = 1 mm), the errors between simulated and experimental and are only about 14% and 1%, which shows that the simulated accuracy is dependent on the evaluation area. In the SP model, the closer the residual stress evaluation area is to the spot area in X-ray residual stress analysis, the more accurate the simulated residual stress result is. From Figure 14 it can be seen that with S4 stochastic impact order, different evaluation areas show great differences in predicting the residual stress distribution, just like S3. When the evaluation area is small, such as = 0.1 mm, the error between simulated (−63 MPa) and experimental (−409 MPa) is about 85%. When the diameter of evaluation area is 1 mm ( = 1 mm), the error between simulated and (−422 MPa) and experimental (−409 MPa) is only about 3%. Compared with the surface residual stress value, the size of evaluation area has no significant effect on the residual stress value in deeper regions. For instance, in terms of the value, the simulated residual stresses in = 0.1 mm and = 1 mm conditions are about −841 MPa and −919 MPa, respectively. The errors between these two simulated residual stresses and the experimental value (−871 MPa) are about 3% and 6%. In terms of stochastic dimple pattern SP model, the evaluation area also has an effect on the simulated residual stress field. Figure 15 is the residual stress depth profile with a different evaluation area in the stochastic dimple pattern SP model. Due to the randomness of the space position of shots in the stochastic dimple pattern SP model, more shots (N = 38) are required to meet a 100% coverage ratio, which leads to the inevitable repeated shot impact on certain areas of the workpiece surface. Therefore, the distribution of residual stress may be uneven in some areas near the surface region. In addition, the material in this area undergoes a cyclic loading during SP process, but the Johnson-Cook constitutive model does not consider the effect of cyclic loading, which is the probable reason for overestimation of the residual stress in the near surface region shown in Figure 15. When the evaluation area is small ( = 0.1 mm), the degree of overestimation of residual stress in the near surface region is larger. The simulated value of and are −704 MPa and −977 MPa and the experimental values of and are −409 MPa and −871 MPa. The simulated errors of and are 72% and 12%. When the depth is greater than the value of , the error between the simulated residual stress and the experimental residual stress decreases. When the diameter of evaluation area is 1 mm ( = 1 mm), the simulated values of and are −527 MPa and −867 MPa and the simulated errors are 29% and 0.5%. Compared with the evaluation area of other sizes, the error is the smallest when the diameter of the evaluation area is 1 mm ( = 1 mm). In summary, whether the ordered dimple pattern or stochastic dimple pattern were chosen in the SP model, the closer the residual stress evaluation area is to the spot diameter in X-ray residual stress analysis, the smaller the error between simulated and experimental results.
4. Conclusions
In order to study the effect of shot distance and impact sequence on the residual stress field in a finite element SP model, two ordered dimple pattern SP models (4-shots and 16-shots) and a stochastic dimple pattern SP model (38-shots) were established in this paper. The effect of the residual stress evaluation area on the prediction accuracy of the residual stress distribution was also discussed. The following conclusions have been reached:
(1) There is a threshold value for the shot distance in vertical and horizontal directions, which is related to SP parameters (velocity, shot diameter and coverage). For a certain SP parameter, when the horizontal (or vertical) distance between shots is greater than this threshold value, the effect of shot distance on the residual stress distribution can be eliminated in SP models. In the process of simplifying the SP model, a certain degree of overlap between the shots can be set according to the threshold.
(2) For the ordered dimple pattern SP model, the impact sequences have almost no effect on the residual stress distribution when the number of shots is small. However, when the number of shots increases, the effect of impact sequences on the residual stress distribution appears, resulting in the underestimation of . In order to ensure the accuracy of residual stress prediction, the shots that produce adjacent dimples should not impact the workpiece surface continuously in the SP model. Under this constraint, impact sequences have little effect on the residual stress distribution and the number of shot layers can be reduced to improve the calculation efficiency.
(3) Both ordered dimple pattern and stochastic dimple pattern SP model can be used to predict the residual stress field after SP treatment when the size of the residual stress evaluation area in simulation is consistent with the actual measurement area in the experiment. The evaluation area that does not match the actual measurement area will lead to a large deviation in the prediction of the residual stress field after SP treatment.
Author Contributions
M.S. and Z.W. conceived and designed the experiments; M.S. and X.R. performed the experiments; M.S., Z.W., J.G. and X.W. analyzed the data; Z.W. and J.G. provided mentorship and guidance on the experiment; M.S. and Z.W. wrote the paper, X.W. and Y.Y. provided editorial expertise. All authors have read and agreed to the published version of the manuscript.
Funding
This research was funded by the National Natural Science Foundation of China (NSFC) (No. 51879208); the Fundamental Research Funds for the Central Universities (WUT: 2018IVA061); 111 Project (B17034) and Innovative Research Team Development Program of Ministry of Education of China (IRT_17R83).
Institutional Review Board Statement
Not applicable.
Informed Consent Statement
Not applicable.
Data Availability Statement
The data presented in this study are available in the current article.
Acknowledgments
Shot peening experiment was carried out via the XN-9065P pneumatic SP machine at Hubei Key Laboratory of Advanced Technology for Automotive Components of Wuhan University of Technology (Wuhan, China). The authors gratefully acknowledge Z.G. in helping the residual stress detection and electrolytic removal expriments.
Conflicts of Interest
The authors declare no conflict of interest.
References
- Ganesh, B.; Sha, W.; Ramanaiah, N.; Krishnaiah, A. Effect of shotpeening on sliding wear and tensile behavior of titanium implant alloys. Mater. Des. 2014, 56, 480–486. [Google Scholar] [CrossRef]
- AlMangour, B.; Yang, J.-M. Improving the surface quality and mechanical properties by shot-peening of 17-4 stainless steel fabricated by additive manufacturing. Mater. Des. 2016, 110, 914–924. [Google Scholar] [CrossRef]
- Li, H.; Liu, Y.; Li, M.; Liu, H. The gradient crystalline structure and microhardness in the treated layer of TC17 via high energy shot peening. Appl. Surf. Sci. 2015, 357, 197–203. [Google Scholar] [CrossRef]
- Hassani-Gangaraj, S.; Cho, K.; Voigt, H.-J.; Guagliano, M.; Schuh, C. Experimental assessment and simulation of surface nanocrystallization by severe shot peening. Acta Mater. 2015, 97, 105–115. [Google Scholar] [CrossRef]
- Zhang, S.B.; Bu, Z.Y. Finite element simulation on residual stress field of 2024 aluminum alloy after shot peening with a number of random projectiles. Mater. Mech. Eng. 2016, 40, 87–90. [Google Scholar]
- Nam, Y.-S.; Jeon, U.; Yoon, H.-K.; Shin, B.-C.; Byun, J.-H. Use of response surface methodology for shot peening process optimization of an aircraft structural part. Int. J. Adv. Manuf. Technol. 2016, 87, 2967–2981. [Google Scholar] [CrossRef]
- Scuracchio, B.G.; Lima, N.B.; Schön, C.G. Role of residual stresses induced by double peening on fatigue durability of auto-motive leaf springs. Mater. Des. 2013, 47, 672–676. [Google Scholar] [CrossRef]
- Kirkhope, K.; Bell, R.; Caron, L.; Basu, R.; Ma, K.-T. Weld detail fatigue life improvement techniques. Part 2: Application to ship structures. Mar. Struct. 1999, 12, 477–496. [Google Scholar] [CrossRef]
- Deguchi, T.; Mouri, M.; Hara, J.; Kano, D.; Shimoda, T.; Inamura, F.; Fukuoka, T.; Koshio, K. Fatigue strength improvement for ship structures by Ultrasonic Peening. J. Mar. Sci. Technol. 2012, 17, 360–369. [Google Scholar] [CrossRef]
- Hardy, C.; Baronet, C.N.; Tordion, G.V. The elasto-plastic indentation of a half-space by a rigid sphere. Int. J. Numer. Methods Eng. 1971, 3, 451–462. [Google Scholar] [CrossRef]
- Bhuvaraghan, B.; Srinivasan, S.M.; Maffeo, B. Numerical simulation of Almen strip response due to random impacts with strain-rate effects. Int. J. Mech. Sci. 2011, 53, 417–424. [Google Scholar] [CrossRef]
- Sanjurjo, P.; Rodríguez, C.; Peñuelas, I.; García, T.E.; Belzunce, F.J. Influence of the target material constitutive model on the numerical simulation of a shot peening process. Surf. Coat. Technol. 2014, 258, 822–831. [Google Scholar] [CrossRef]
- Klemenz, M.; Schulze, V.; Vöhringer, O.; Löhe, D. Finite Element Simulation of the Residual Stress States after Shot Peening. Mater. Sci. Forum 2006, 524, 349–354. [Google Scholar] [CrossRef]
- Miao, H.; Larose, S.; Perron, C.; Lévesque, M. On the potential applications of a 3D random finite element model for the simulation of shot peening. Adv. Eng. Softw. 2009, 40, 1023–1038. [Google Scholar] [CrossRef]
- Jebahi, M.; Gakwaya, A.; Lévesque, J.; Mechri, O.; Ba, K. Robust methodology to simulate real shot peening process using dis-crete-continuum coupling method. Int. J. Mech. Sci. 2016, 107, 21–33. [Google Scholar] [CrossRef] [Green Version]
- Liu, Z.; Xiu, L.; Wu, J.; Lv, G.; Ma, J. Numerical simulation on residual stress eliminated by shot peening using SPH method. Fusion Eng. Des. 2019, 147, 111231. [Google Scholar] [CrossRef]
- Shivpuri, R.; Cheng, X.; Mao, Y. Elasto-plastic pseudo-dynamic numerical model for the design of shot peening process parameters. Mater. Des. 2009, 30, 3112–3120. [Google Scholar] [CrossRef]
- Bagherifard, S.; Ghelichi, R.; Guagliano, M. A numerical model of severe shot peening (SSP) to predict the generation of a nanostructured surface layer of material. Surf. Coat. Technol. 2010, 204, 4081–4090. [Google Scholar] [CrossRef]
- Huang, H.; Wang, Z.; Gan, J.; Yang, Y.; Wang, X.; He, J.; Gan, X. The study of universality of a method for predicting surface nanocrystallization after high energy shot peening based on finite element analysis. Surf. Coat. Technol. 2019, 358, 617–627. [Google Scholar] [CrossRef]
- Wu, G.; Wang, Z.; Gan, J.; Yang, Y.; Meng, Q.; Wei, S.; Huang, H. FE analysis of shot-peening-induced residual stresses of AISI 304 stainless steel by considering mesh density and friction coefficient. Surf. Eng. 2019, 35, 242–254. [Google Scholar] [CrossRef]
- Meguid, S.; Shagal, G.; Stranart, J. Finite element modelling of shot-peening residual stresses. J. Mater. Process. Technol. 1999, 92-93, 401–404. [Google Scholar] [CrossRef]
- Hong, T.; Ooi, J.; Shaw, B. A numerical simulation to relate the shot peening parameters to the induced residual stresses. Eng. Fail. Anal. 2008, 15, 1097–1110. [Google Scholar] [CrossRef]
- Mylonas, G.; Labeas, G. Numerical modelling of shot peening process and corresponding products: Residual stress, surface roughness and cold work prediction. Surf. Coat. Technol. 2011, 205, 4480–4494. [Google Scholar] [CrossRef]
- Baragetti, S. Shot peening optimisation by means of ‘DOE’: Numerical simulation and choice of treatment parameters. Int. J. Mater. Prod. Tech. 1997, 12, 83–109. [Google Scholar]
- Xie, L.; Wang, C.; Wang, L.; Wang, Z.; Jiang, C.; Lu, W.; Ji, V. Numerical analysis and experimental validation on residual stress distribution of titanium matrix composite after shot peening treatment. Mech. Mater. 2016, 99, 2–8. [Google Scholar] [CrossRef] [Green Version]
- Yang, C.; Hodgson, P.D.; Liu, Q.; Ye, L. Geometrical effects on residual stresses in 7050-T7451 aluminum alloy rods subject to laser shock peening. J. Mater. Process. Technol. 2008, 201, 303–309. [Google Scholar] [CrossRef]
- Meguid, S.; Shagal, G.; Stranart, J. 3D FE analysis of peening of strain-rate sensitive materials using multiple impingement model. Int. J. Impact Eng. 2002, 27, 119–134. [Google Scholar] [CrossRef]
- Schwarzer, J.; Schulze, V.; Vöhringer, O. Evaluation of the Influence of Shot Peening Parameters on Residual Stress Profiles Using Finite Element Simulation. Mater. Sci. Forum 2003, 426-432, 3951–3956. [Google Scholar] [CrossRef]
- Society of Automotive Engineers. Shot Peening Coverage. Surface Vehicle Recommended Practice; SAE Standard J2277:2013; Society of Automotive Engineers: Warrendale, PA, USA, 2013. [Google Scholar]
- Klemenz, M.; Schulze, V.; Rohr, I.; Löhe, D. Application of the FEM for the prediction of the surface layer characteristics after shot peening. J. Mater. Process. Technol. 2009, 209, 4093–4102. [Google Scholar] [CrossRef]
- Kim, T.; Lee, J.H.; Lee, H.; Cheong, S.-K. An area-average approach to peening residual stress under multi-impacts using a three-dimensional symmetry-cell finite element model with plastic shots. Mater. Des. 2010, 31, 50–59. [Google Scholar] [CrossRef]
- ElTobgy, M.S.; A Elbestawi, M.; Ng, E. Three-dimensional elastoplastic finite element model for residual stresses in the shot peening process. Proc. Inst. Mech. Eng. Part. B J. Eng. Manuf. 2004, 218, 1471–1481. [Google Scholar] [CrossRef]
- Sheng, X.F. Research on Shot Peening Strengthening Mechanism of Civil Aircraft Structural Parts with Corrosion Damage. Ph.D. Thesis, South China University of Technology, Guang Zhou, China, 2014. [Google Scholar]
- Wang, C. Study of Shot Peening Simulation and Fatigue Crack Growth Behavior. Ph.D. Thesis, Zhejiang University of Technology, Hang Zhou, China, 2016. [Google Scholar]
- Kim, T.; Lee, H.; Hyun, H.C.; Jung, S. Effects of Rayleigh damping, friction and rate-dependency on 3D residual stress simulation of angled shot peening. Mater. Des. 2013, 46, 26–37. [Google Scholar] [CrossRef]
- Chen, J.S.; A Desai, D.; Heyns, S.P.; Pietra, F. Literature review of numerical simulation and optimisation of the shot peening process. Adv. Mech. Eng. 2019, 11, 1–19. [Google Scholar] [CrossRef]
- Salahi, A.A.A.; Othman, R. Constitutive equations of yield stress sensitivity to strain rate of metals: A comparative study. J. Eng. 2016, 2016. [Google Scholar] [CrossRef] [Green Version]
- Huang, H.M. Research on FEM in High Energy Shot Peening Surface Nanocrystallization and Parameters Optimization of 42CrMo Steel for Automobile Shafts. Master’s Thesis, Wuhan University of Technology, Wuhan, China, 2019. [Google Scholar]
- Wang, X.; Wang, Z.; Wu, G.; Gan, J.; Yang, Y.; Huang, H.; He, J.; Zhong, H. Combining the finite element method and response surface methodology for optimization of shot peening parameters. Int. J. Fatigue 2019, 129, 105231. [Google Scholar] [CrossRef]
- He, J.; Wang, Z.; Gan, J.; Yang, Y.; Wang, X.; Shi, M.; Ren, X. Numerical simulation research on surface integrity of 42CrMo steel after double shot peening. Surf. Technol. 2020, 49, 216–223. [Google Scholar] [CrossRef]
- Kirk, D.; Abyaneh, M.Y. Theoretical basis of shot peening coverage control. In Proceedings of the 5th International Conference on Shot Peening, Linköping, Sweden, 16–18 June 1993; pp. 183–190. [Google Scholar]
- Moore, M.G.; Evans, W.P. Mathematical correction for stress in removed layers in X-ray diffraction RS analysis. SAE Trans. 1958, 66, 340–345. [Google Scholar]
Figure 1.
Schematic diagram of SP models: (a) The ordered dimple pattern model consisted of 4-shots; (b) The ordered dimple pattern model consisted of 16-shots; (c) The stochastic dimple pattern model consisted of 38-shots.
Figure 1.
Schematic diagram of SP models: (a) The ordered dimple pattern model consisted of 4-shots; (b) The ordered dimple pattern model consisted of 16-shots; (c) The stochastic dimple pattern model consisted of 38-shots.
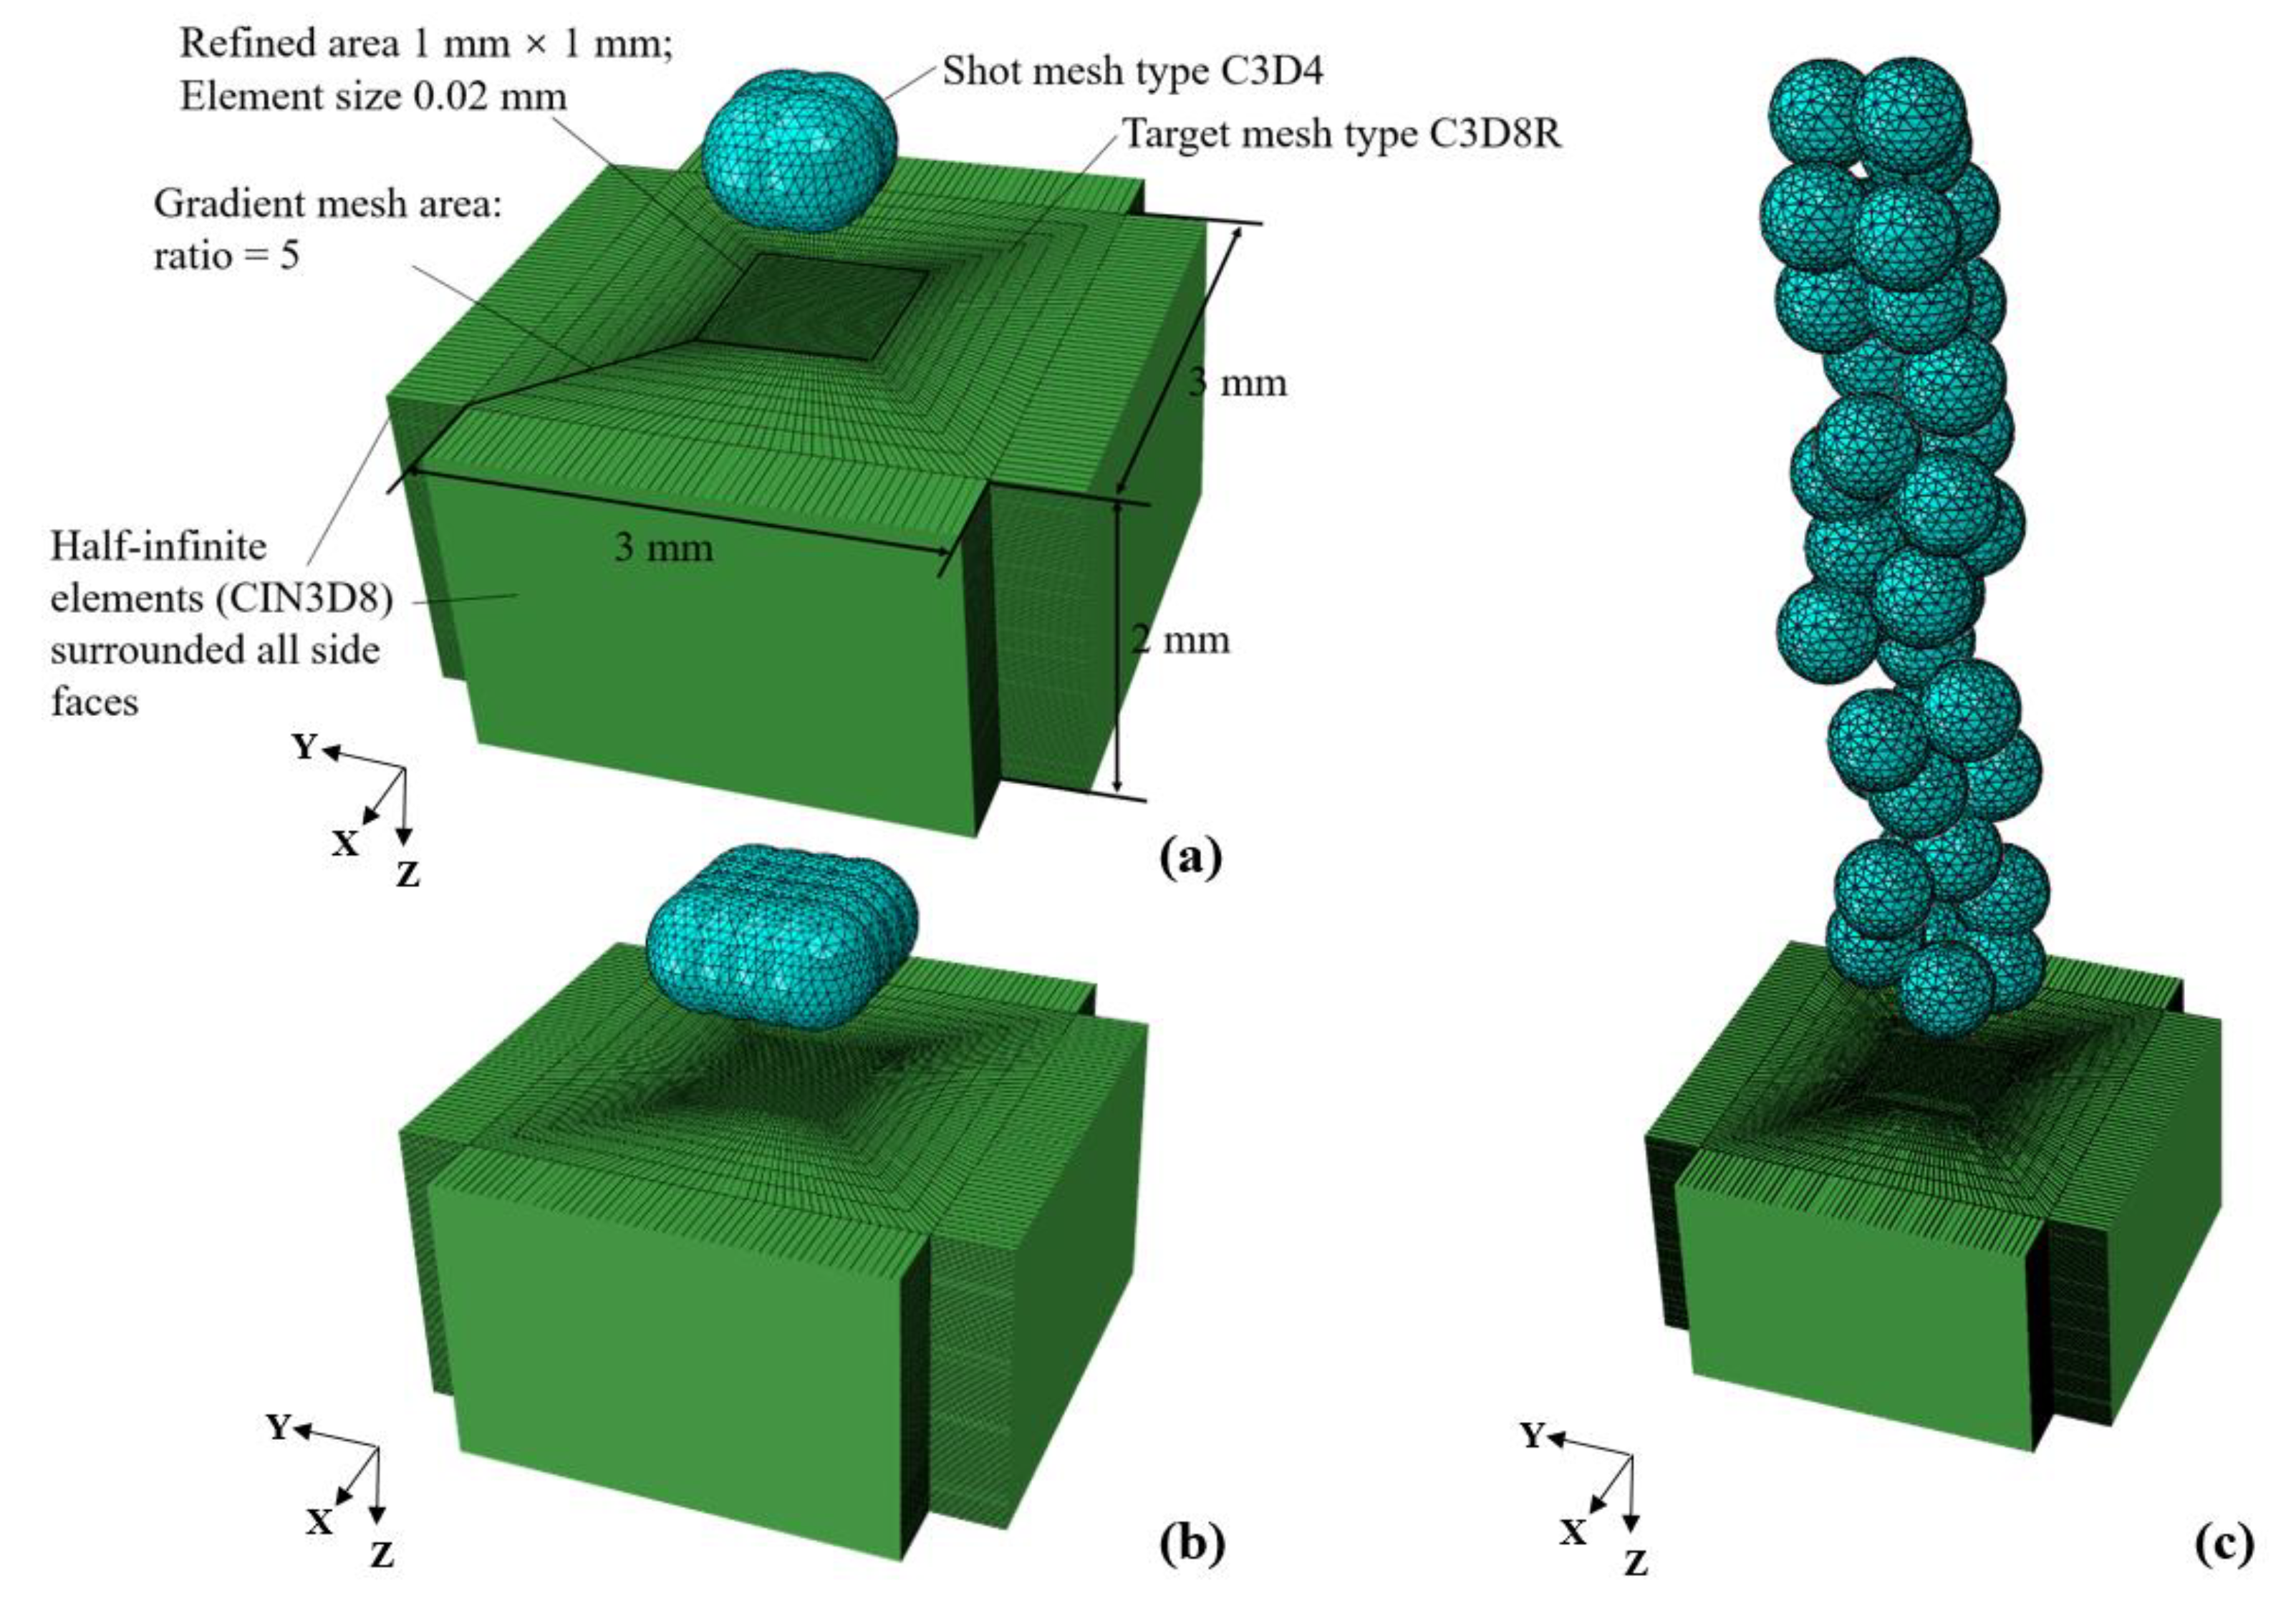
Figure 2.
Schematic diagram of 100% coverage ratio dimple patterns: (a) N = 4 ordered dimple pattern; (b) N = 16 ordered dimple pattern; (c) N = 38 stochastic dimple pattern.
Figure 2.
Schematic diagram of 100% coverage ratio dimple patterns: (a) N = 4 ordered dimple pattern; (b) N = 16 ordered dimple pattern; (c) N = 38 stochastic dimple pattern.

Figure 3.
The schematic diagram of residual stress evaluation area.
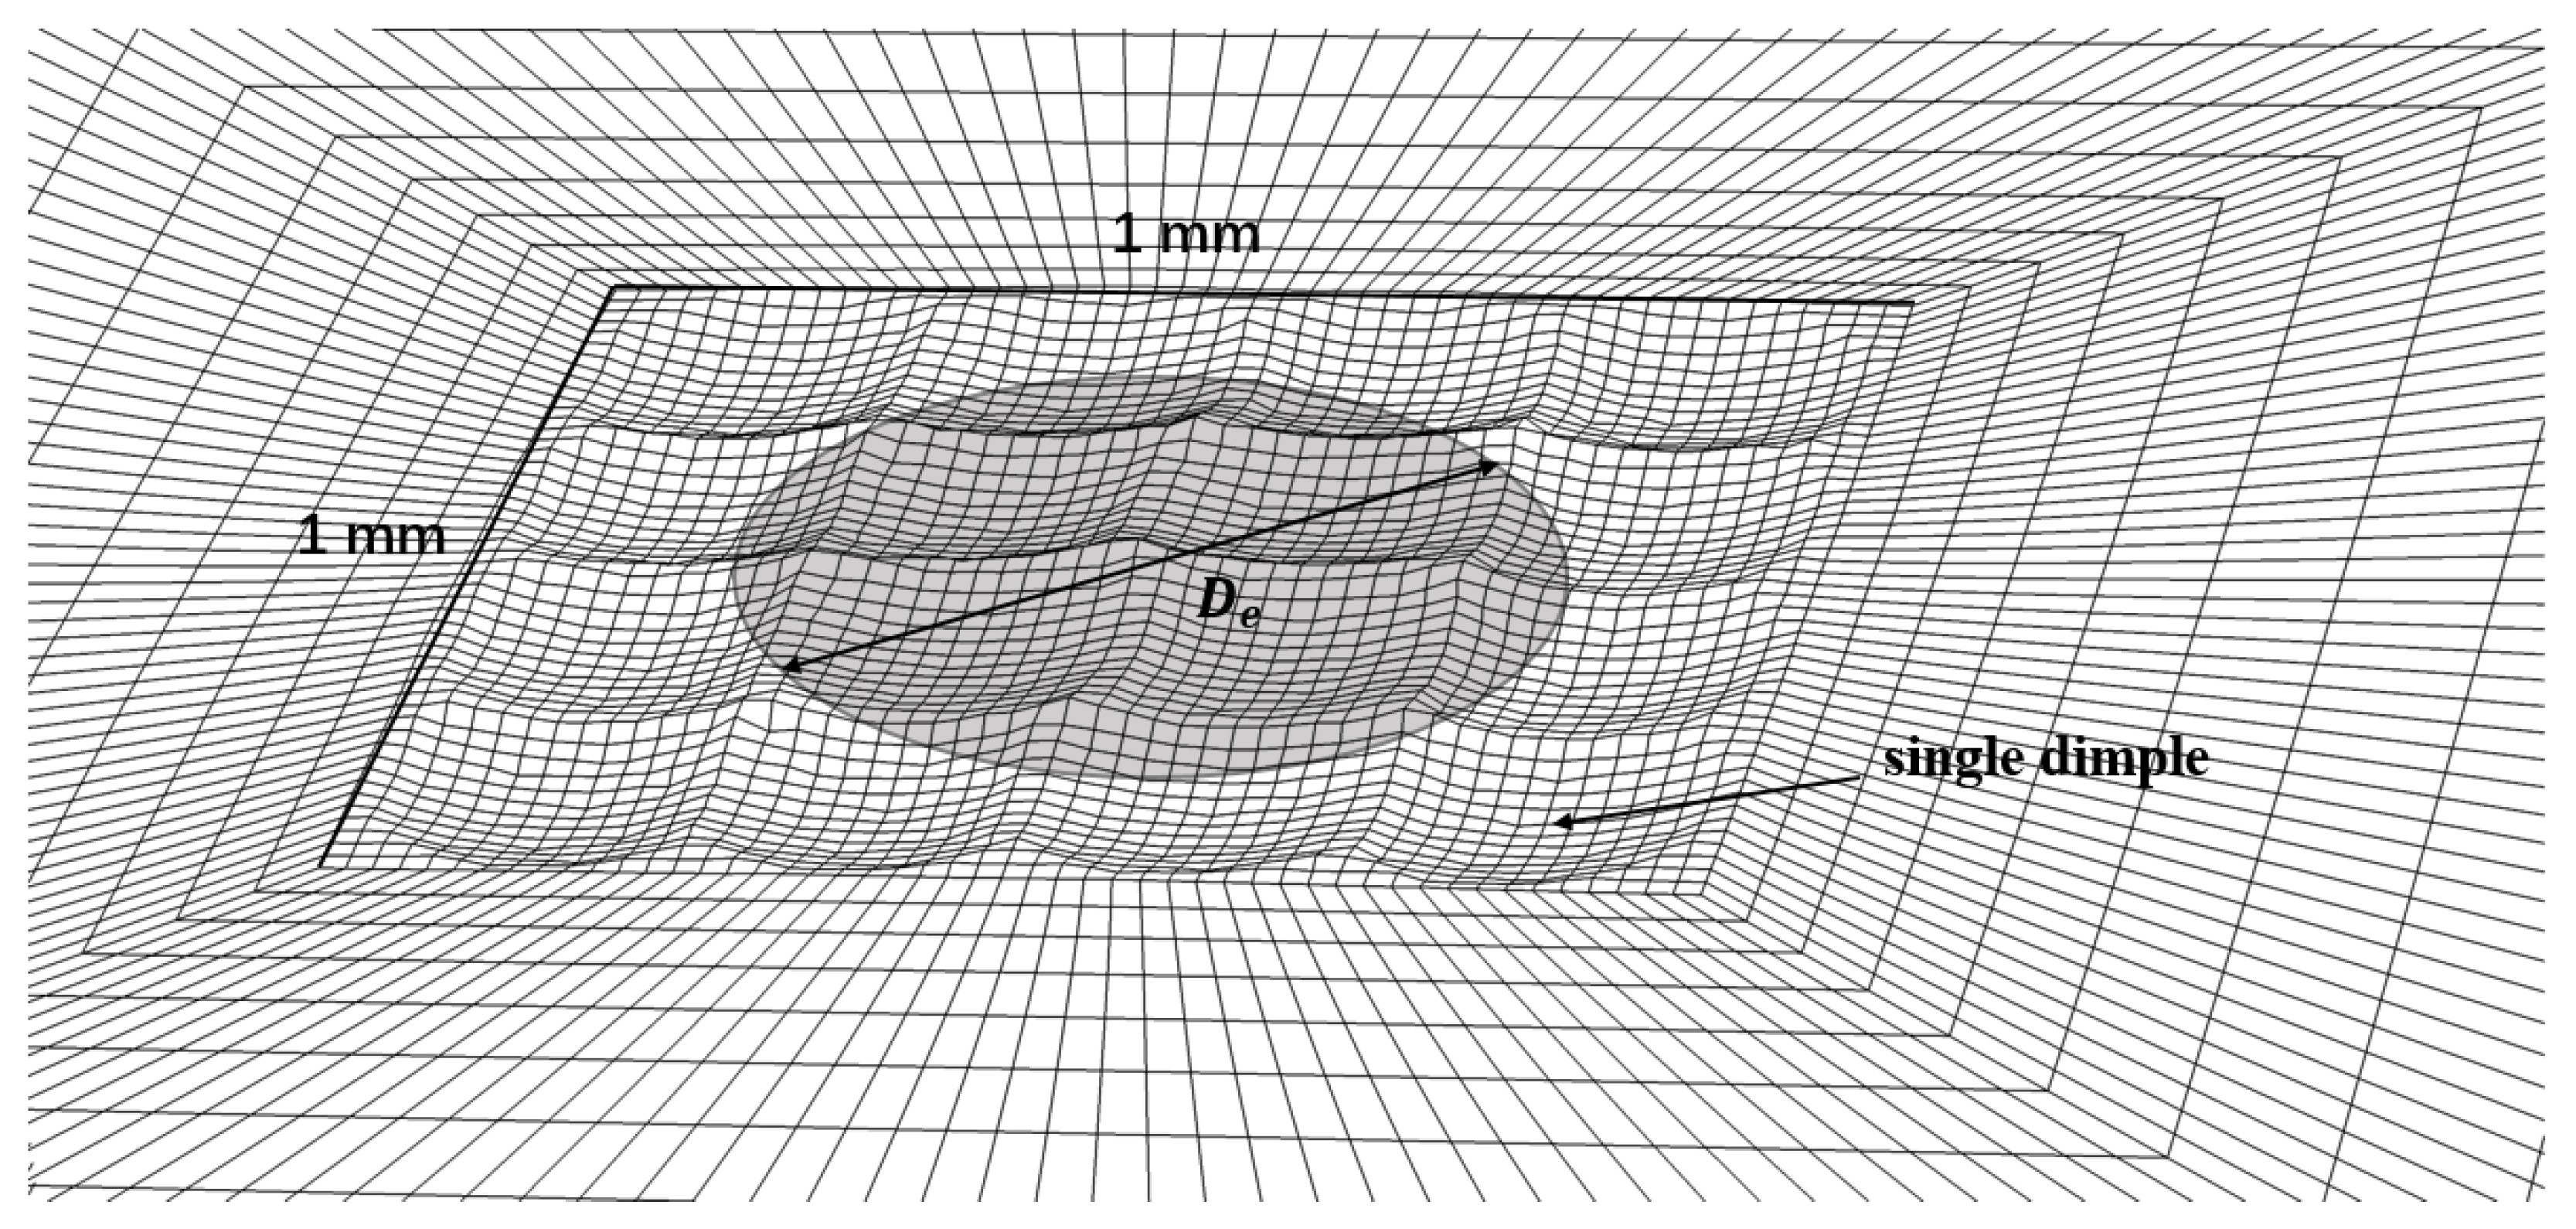
Figure 4.
Schematic diagram of (a) the vertical distance between shots in 4-shots model; (b) the impacting sequence in 4-shots model.
Figure 4.
Schematic diagram of (a) the vertical distance between shots in 4-shots model; (b) the impacting sequence in 4-shots model.

Figure 5.
The residual stress depth profiles of five different vertical distance between shots (Z) SP models in the condition of V = 60 m/s, d = 0.8 mm and C = 100%.
Figure 5.
The residual stress depth profiles of five different vertical distance between shots (Z) SP models in the condition of V = 60 m/s, d = 0.8 mm and C = 100%.
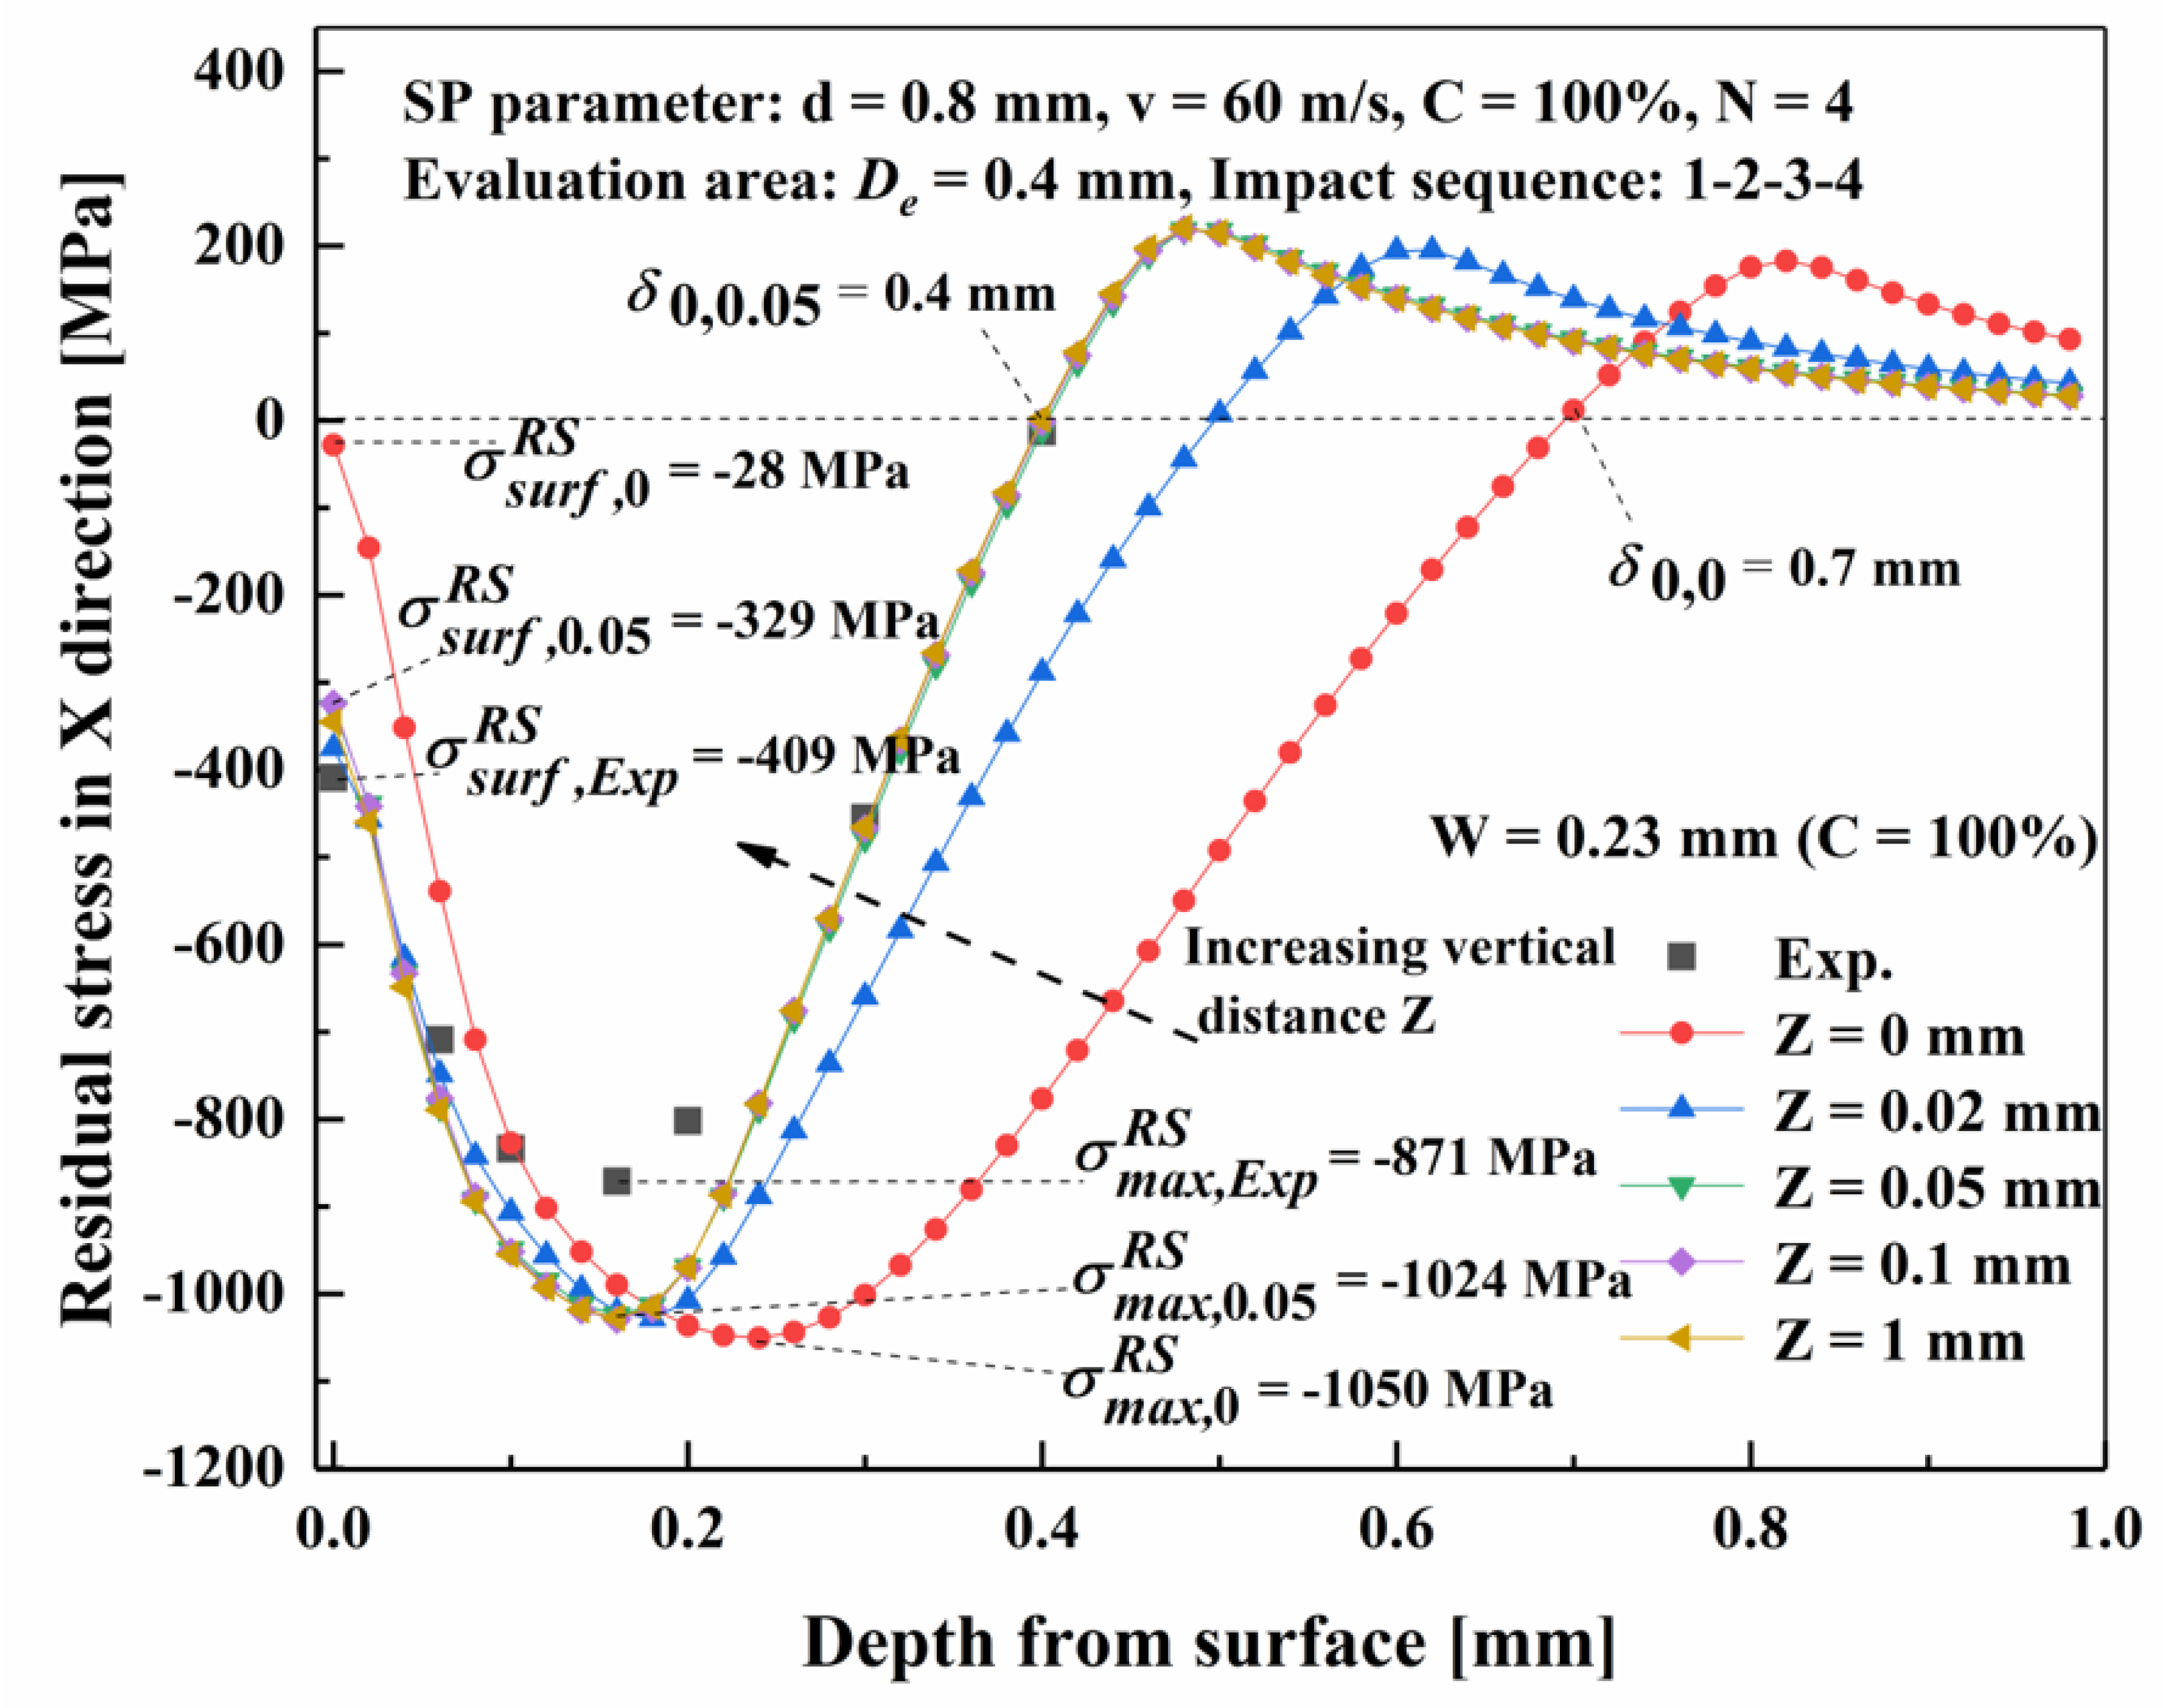
Figure 6.
The residual stress depth profiles of five different vertical distance between shots (Z) SP models in the condition of V = 120 m/s, d = 1.0 mm and C = 100%.
Figure 6.
The residual stress depth profiles of five different vertical distance between shots (Z) SP models in the condition of V = 120 m/s, d = 1.0 mm and C = 100%.

Figure 7.
Schematic diagram of the horizontal distance between shots in 4-shots model: (a) W = 0.23 mm (C = 100%); (b) W = 0.46 mm (C = 40%); (c) W = 0.66 mm (C = 20%).
Figure 7.
Schematic diagram of the horizontal distance between shots in 4-shots model: (a) W = 0.23 mm (C = 100%); (b) W = 0.46 mm (C = 40%); (c) W = 0.66 mm (C = 20%).
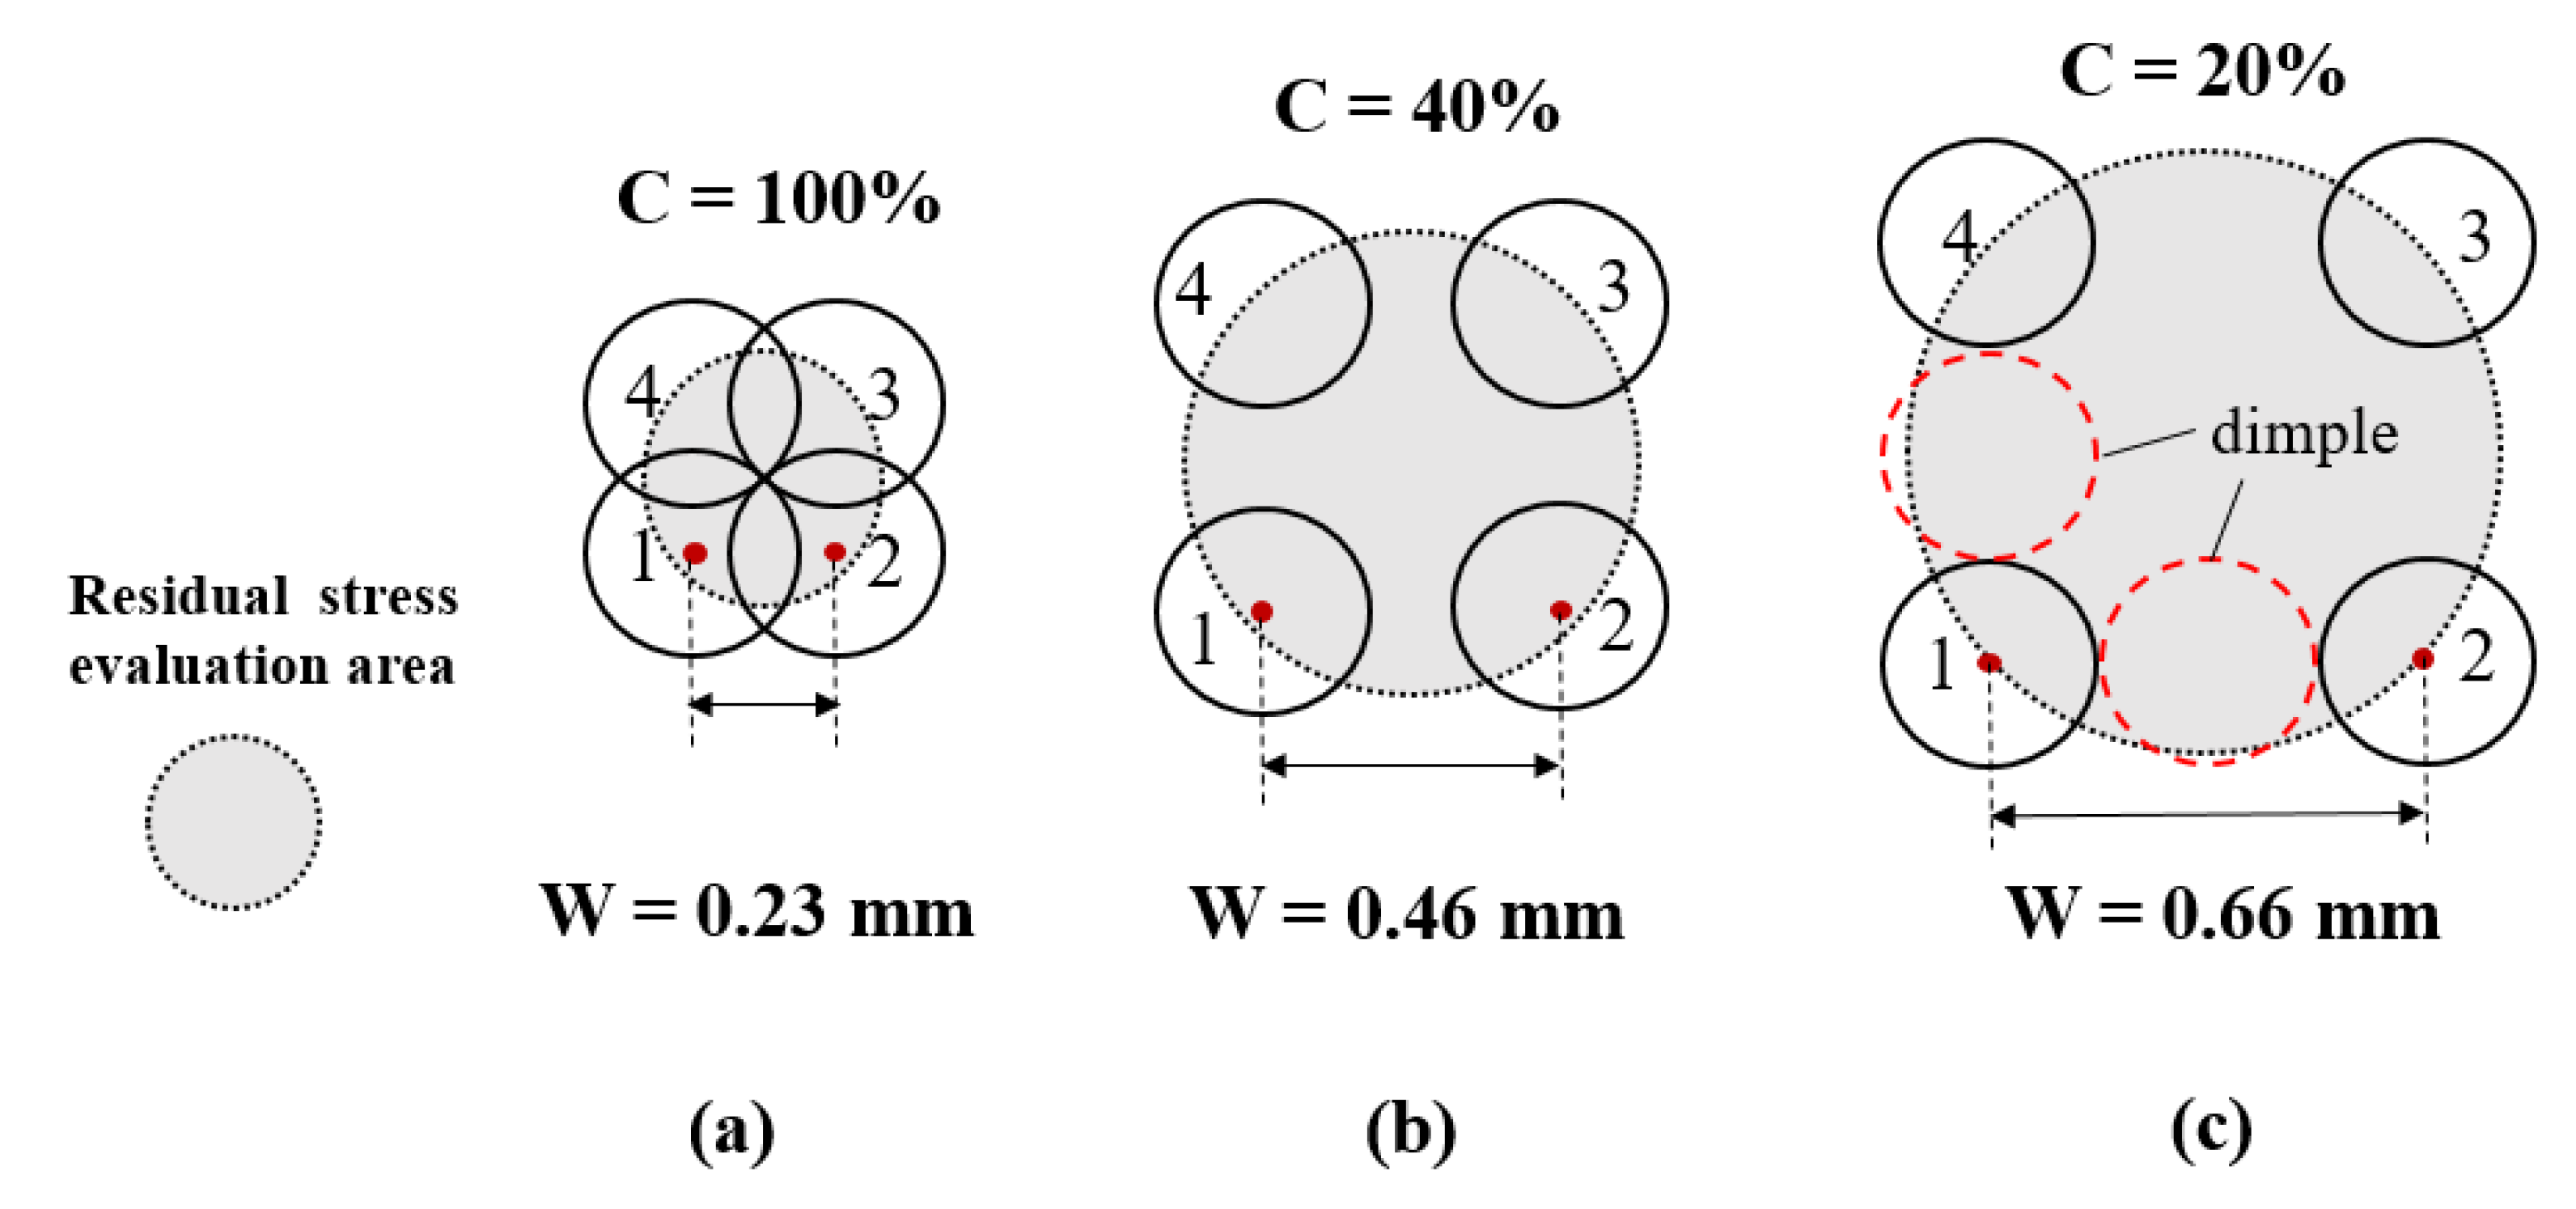
Figure 8.
The residual stress depth profiles of four different vertical distance between shots (Z) SP models in the condition of (a) V = 60 m/s, d = 0.8 mm and C = 40% (W= 0.46 mm) and (b) V = 60 m/s, d = 0.8 mm and C = 20% (W = 0.66 mm).
Figure 8.
The residual stress depth profiles of four different vertical distance between shots (Z) SP models in the condition of (a) V = 60 m/s, d = 0.8 mm and C = 40% (W= 0.46 mm) and (b) V = 60 m/s, d = 0.8 mm and C = 20% (W = 0.66 mm).
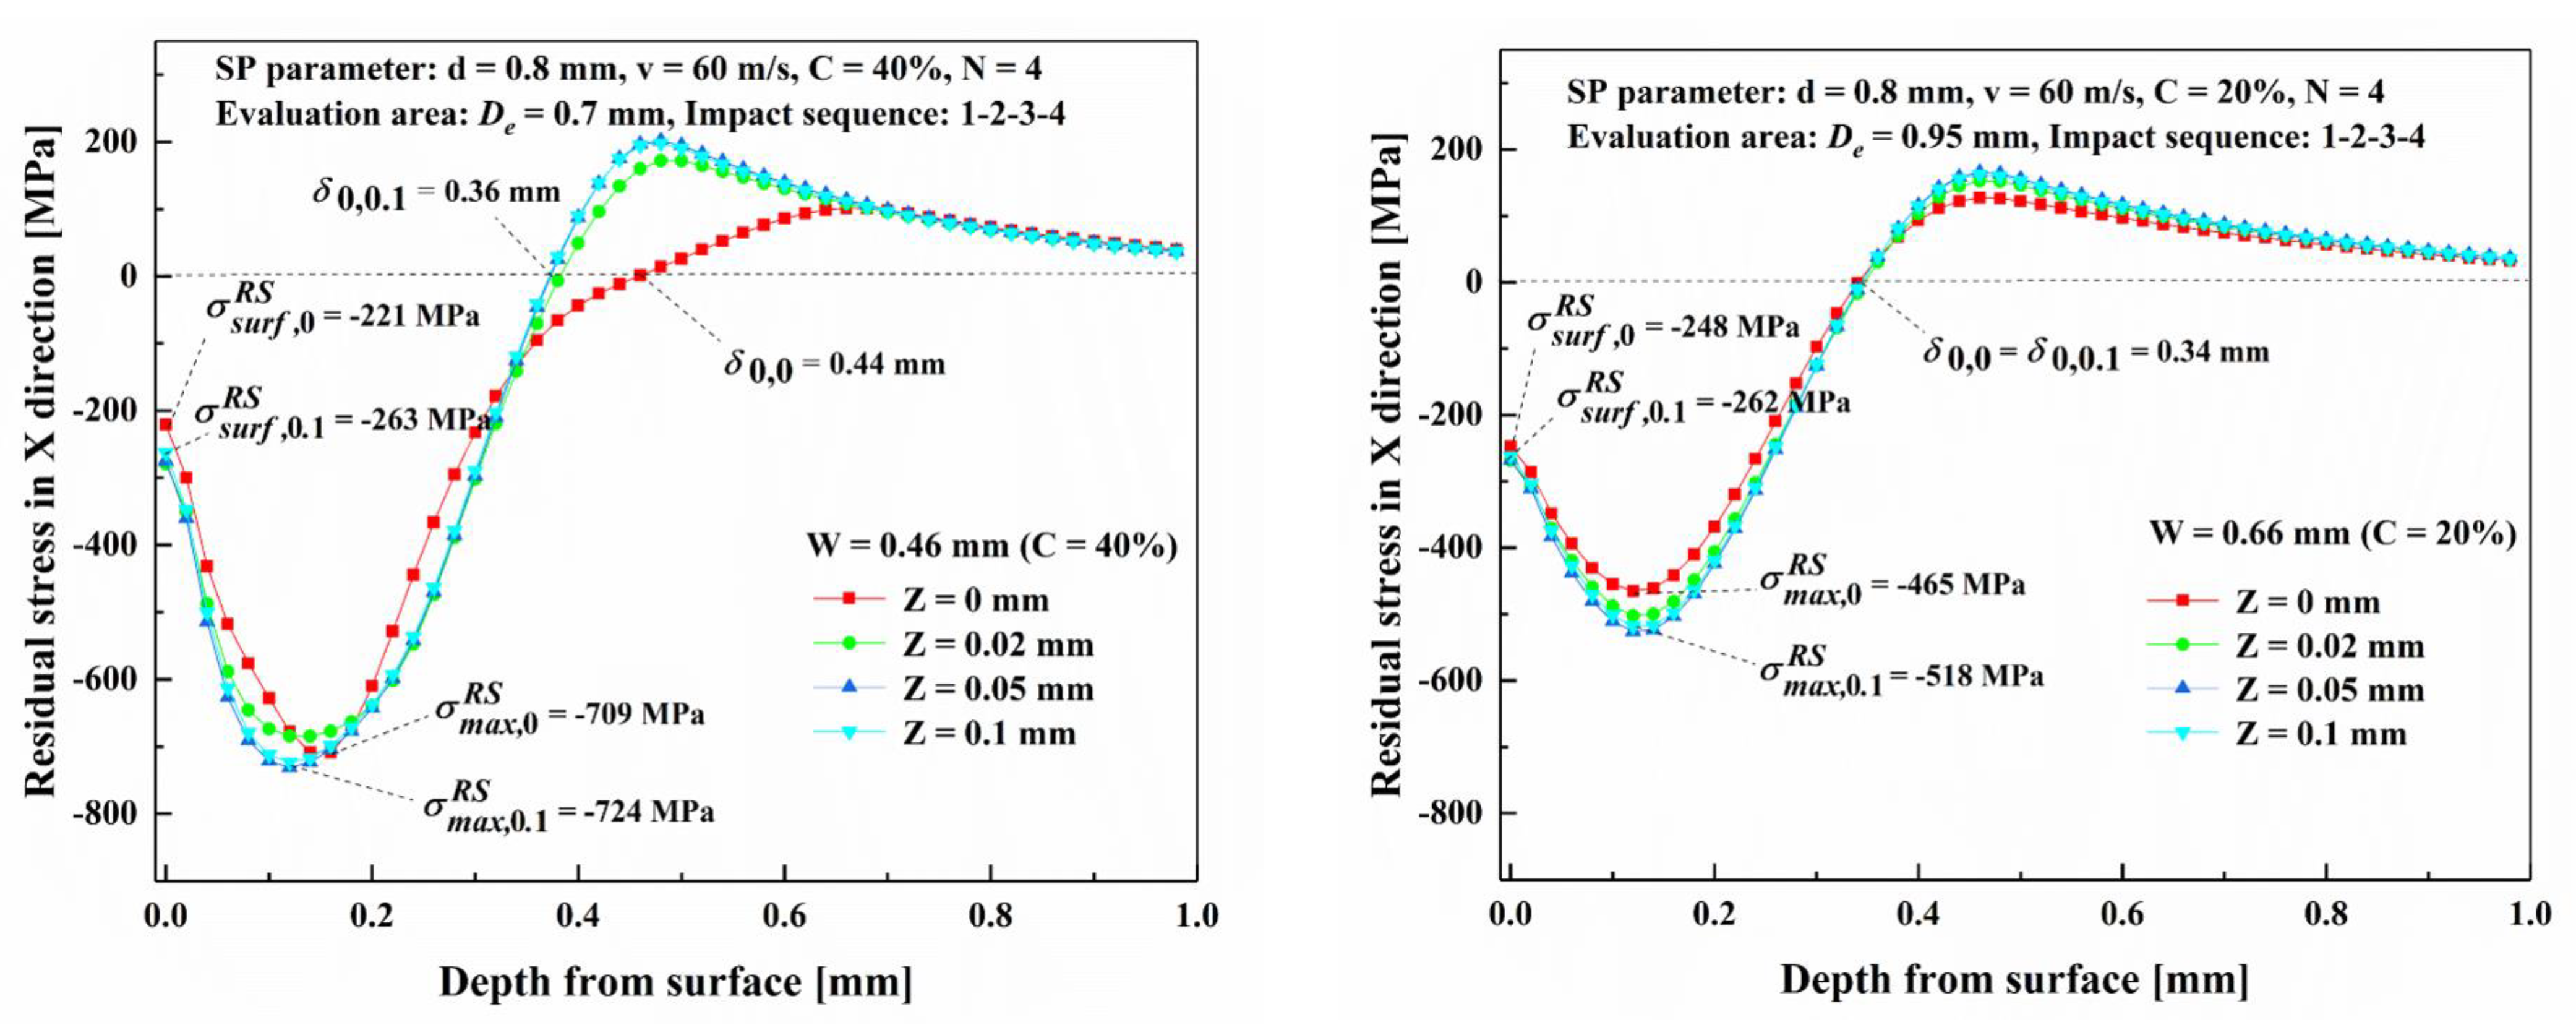
Figure 9.
Schematic diagram of dimple pattern and impact sequence in 4-shots model. (a) 1-2-3-4; (b) 1-3-2-4; (c) 1-4-2-3.
Figure 9.
Schematic diagram of dimple pattern and impact sequence in 4-shots model. (a) 1-2-3-4; (b) 1-3-2-4; (c) 1-4-2-3.
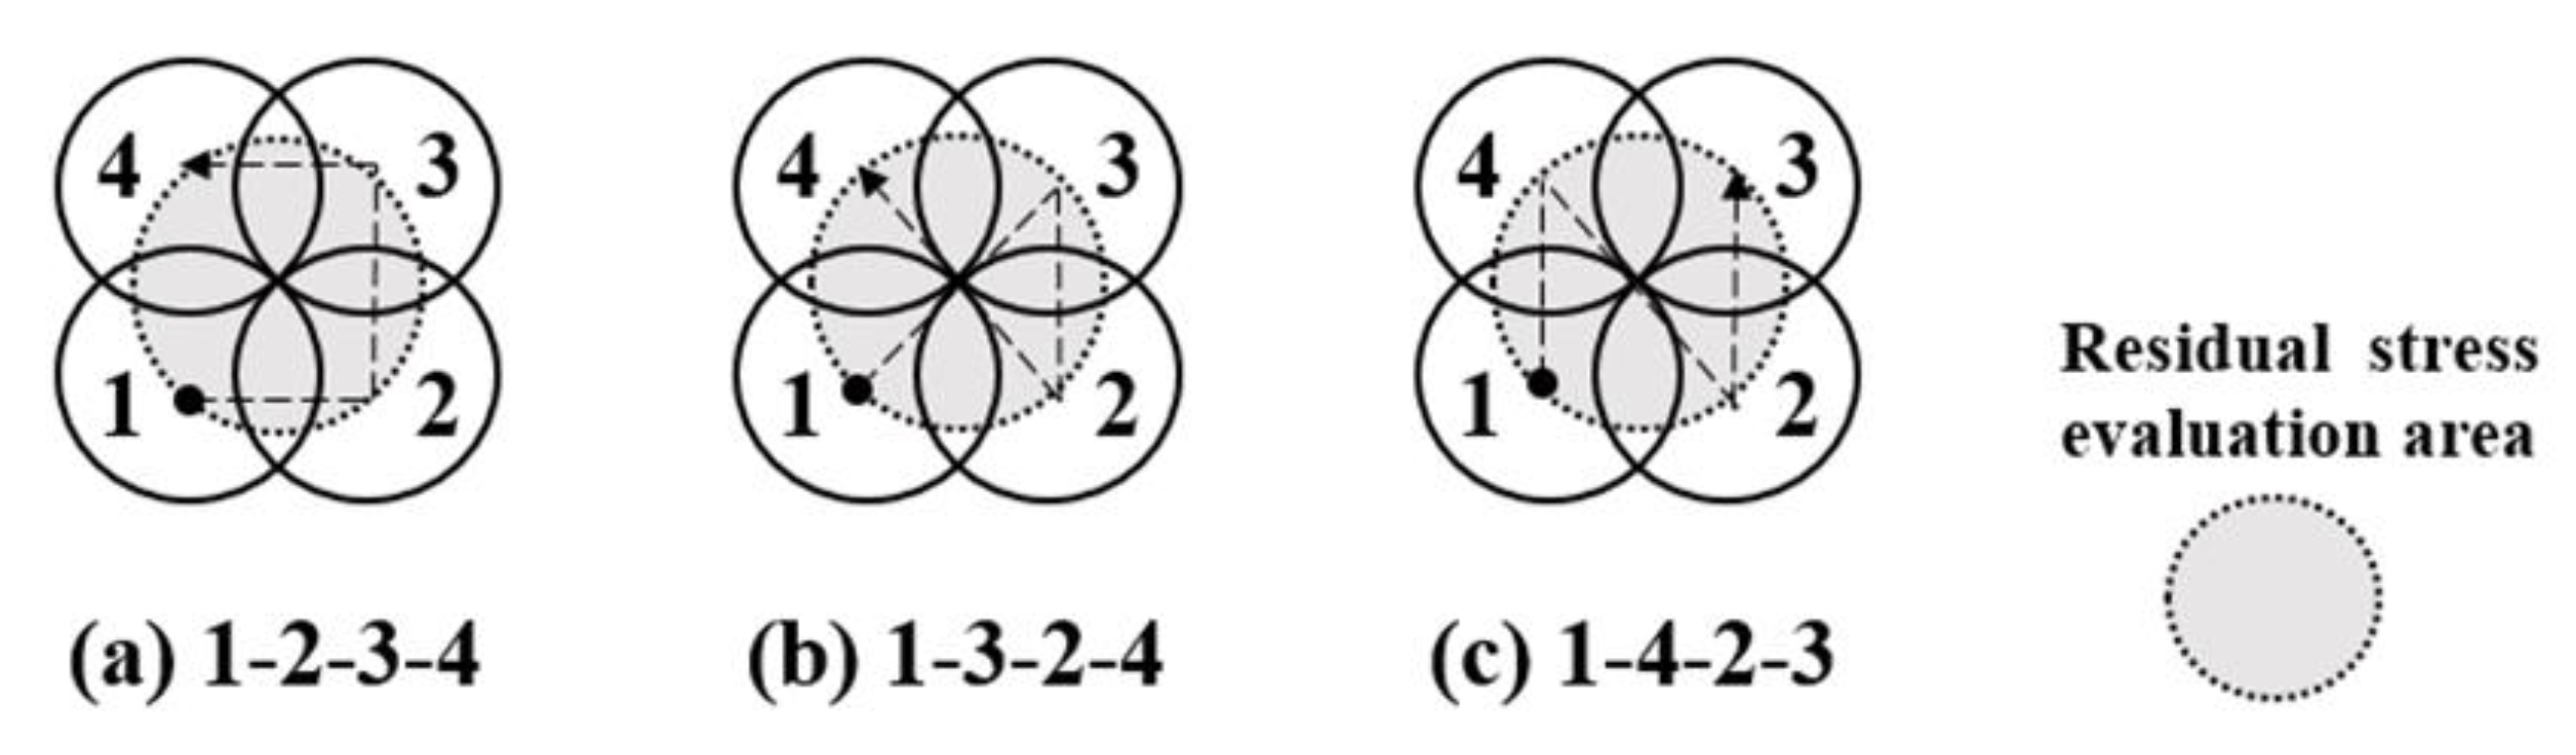
Figure 10.
Schematic diagram of dimple pattern and impact sequence in 16-shots model. (a) S1; (b) S2; (c) S3; (d) S4; (e) S5.
Figure 10.
Schematic diagram of dimple pattern and impact sequence in 16-shots model. (a) S1; (b) S2; (c) S3; (d) S4; (e) S5.
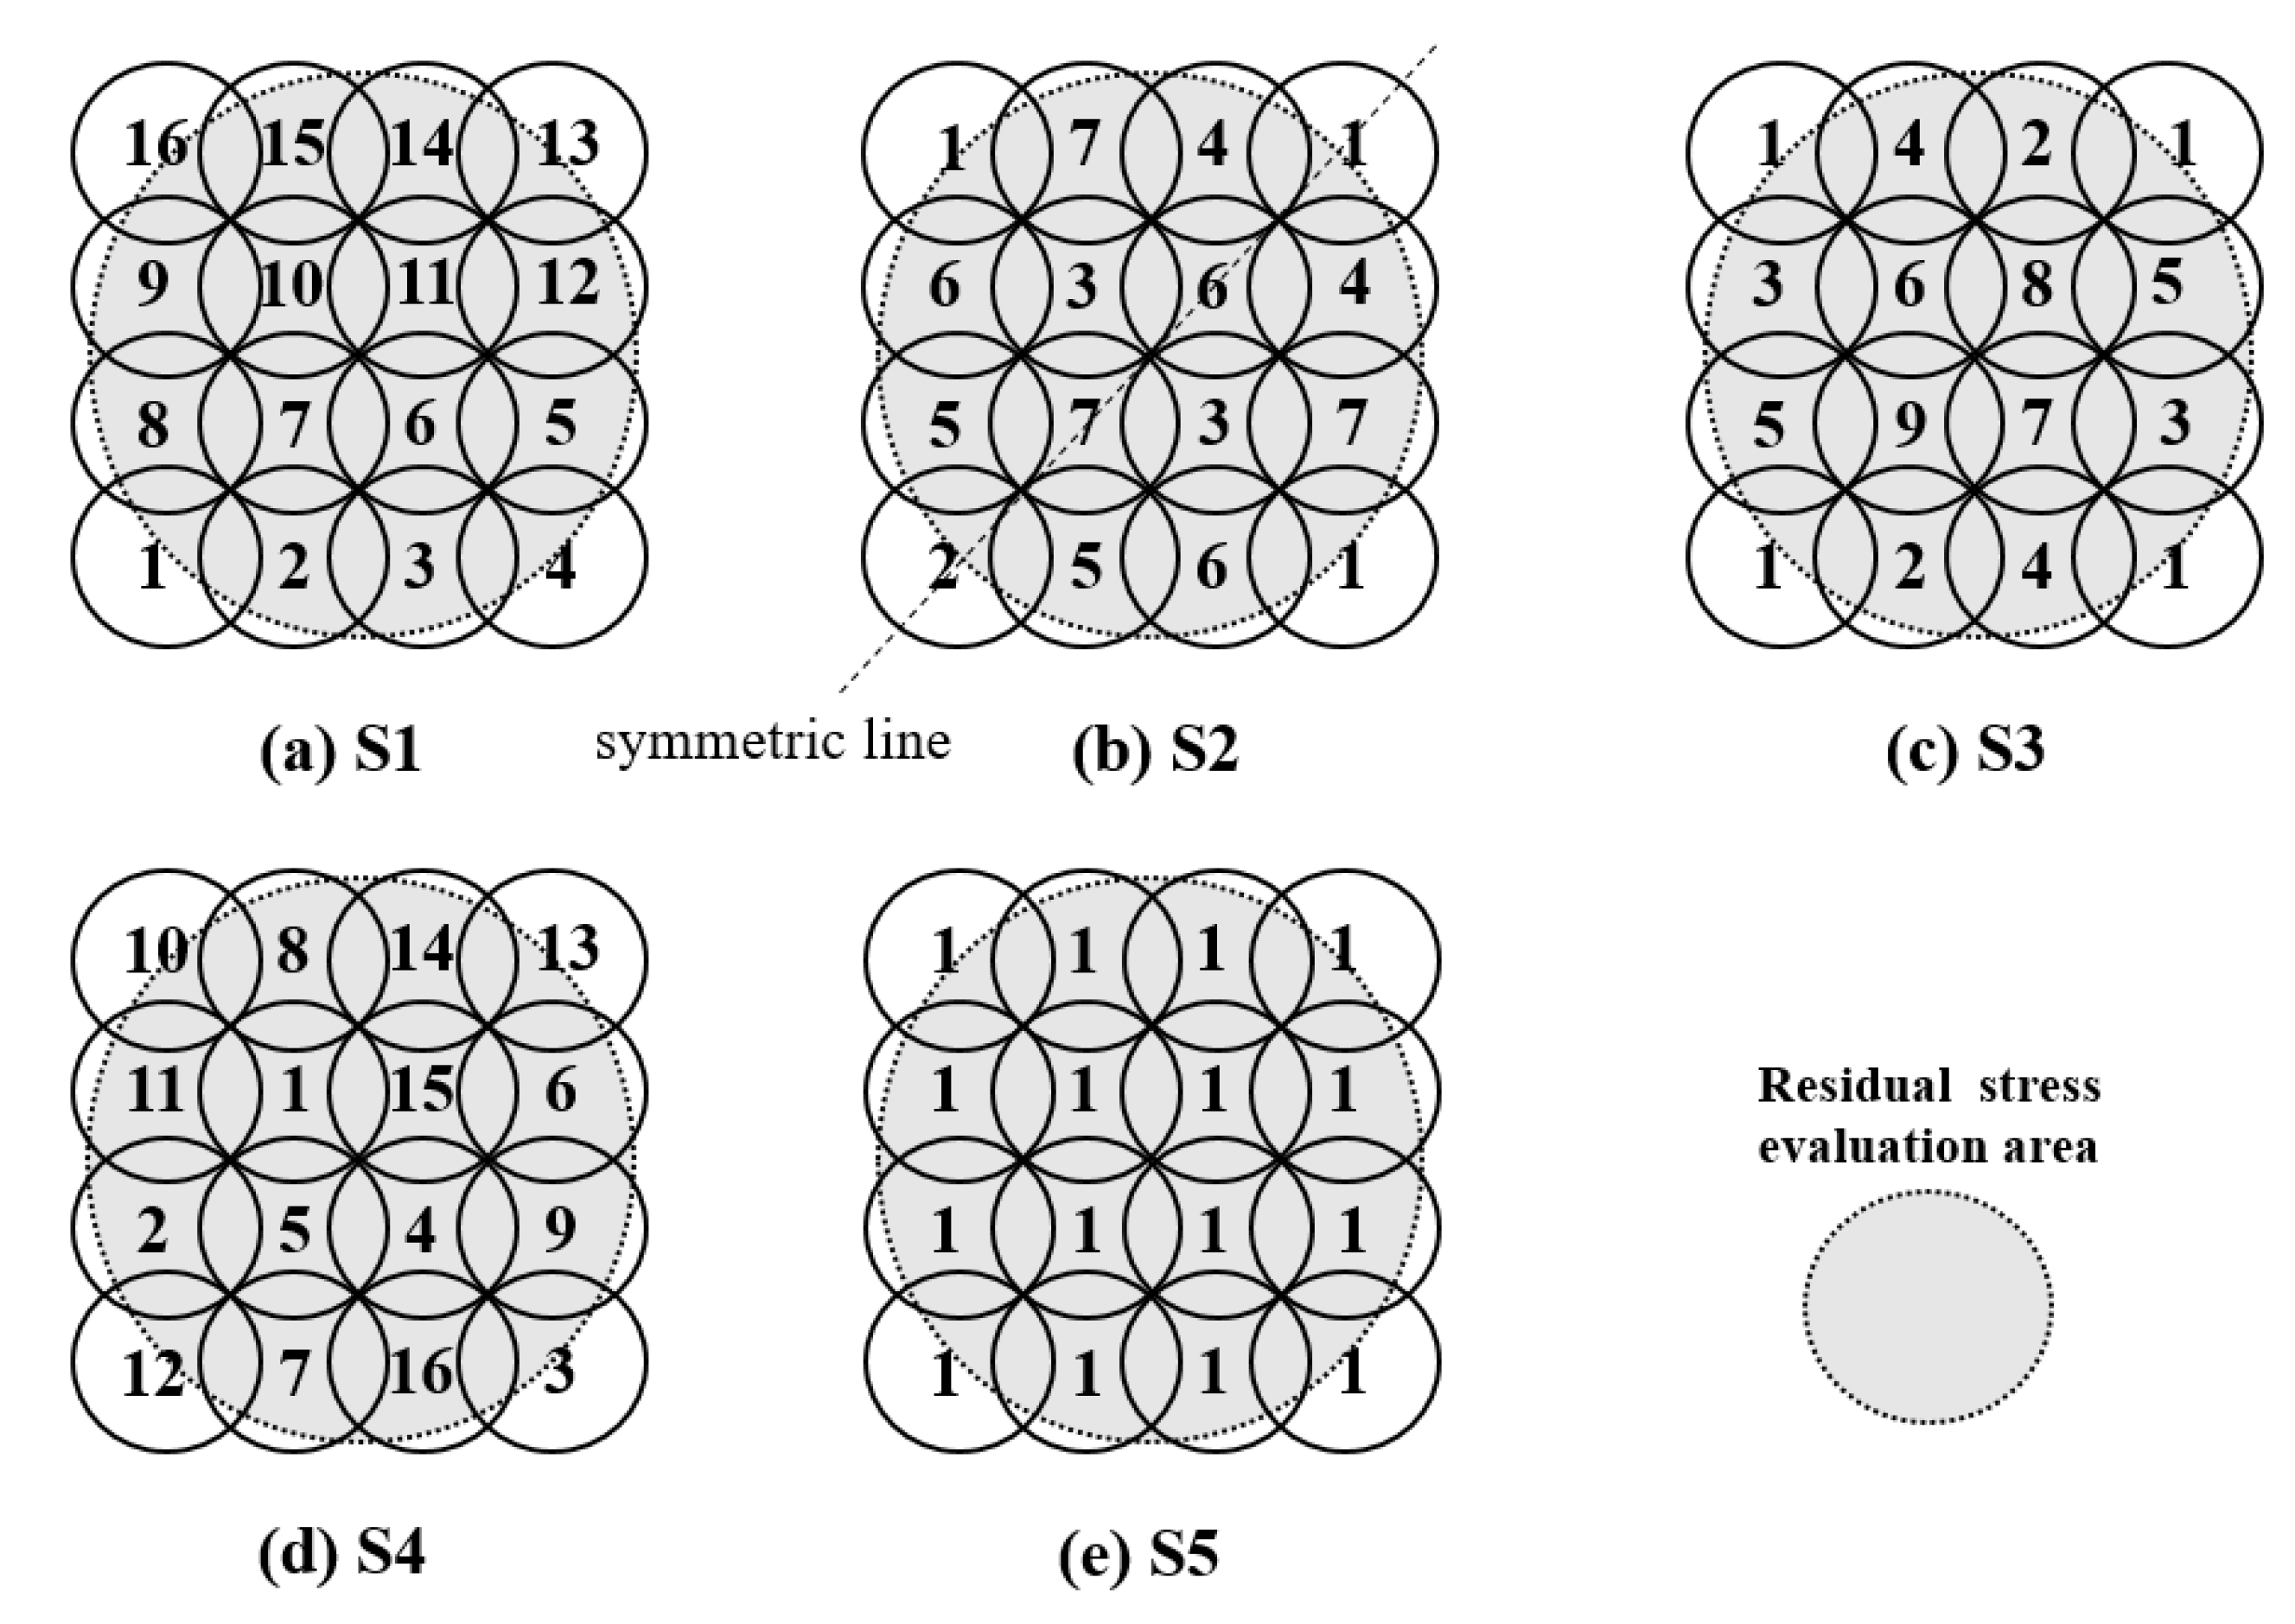
Figure 11.
The residual stress depth profiles after (a) 4 shots and (b) 16 shots impact the workpiece with different impact sequences.
Figure 11.
The residual stress depth profiles after (a) 4 shots and (b) 16 shots impact the workpiece with different impact sequences.
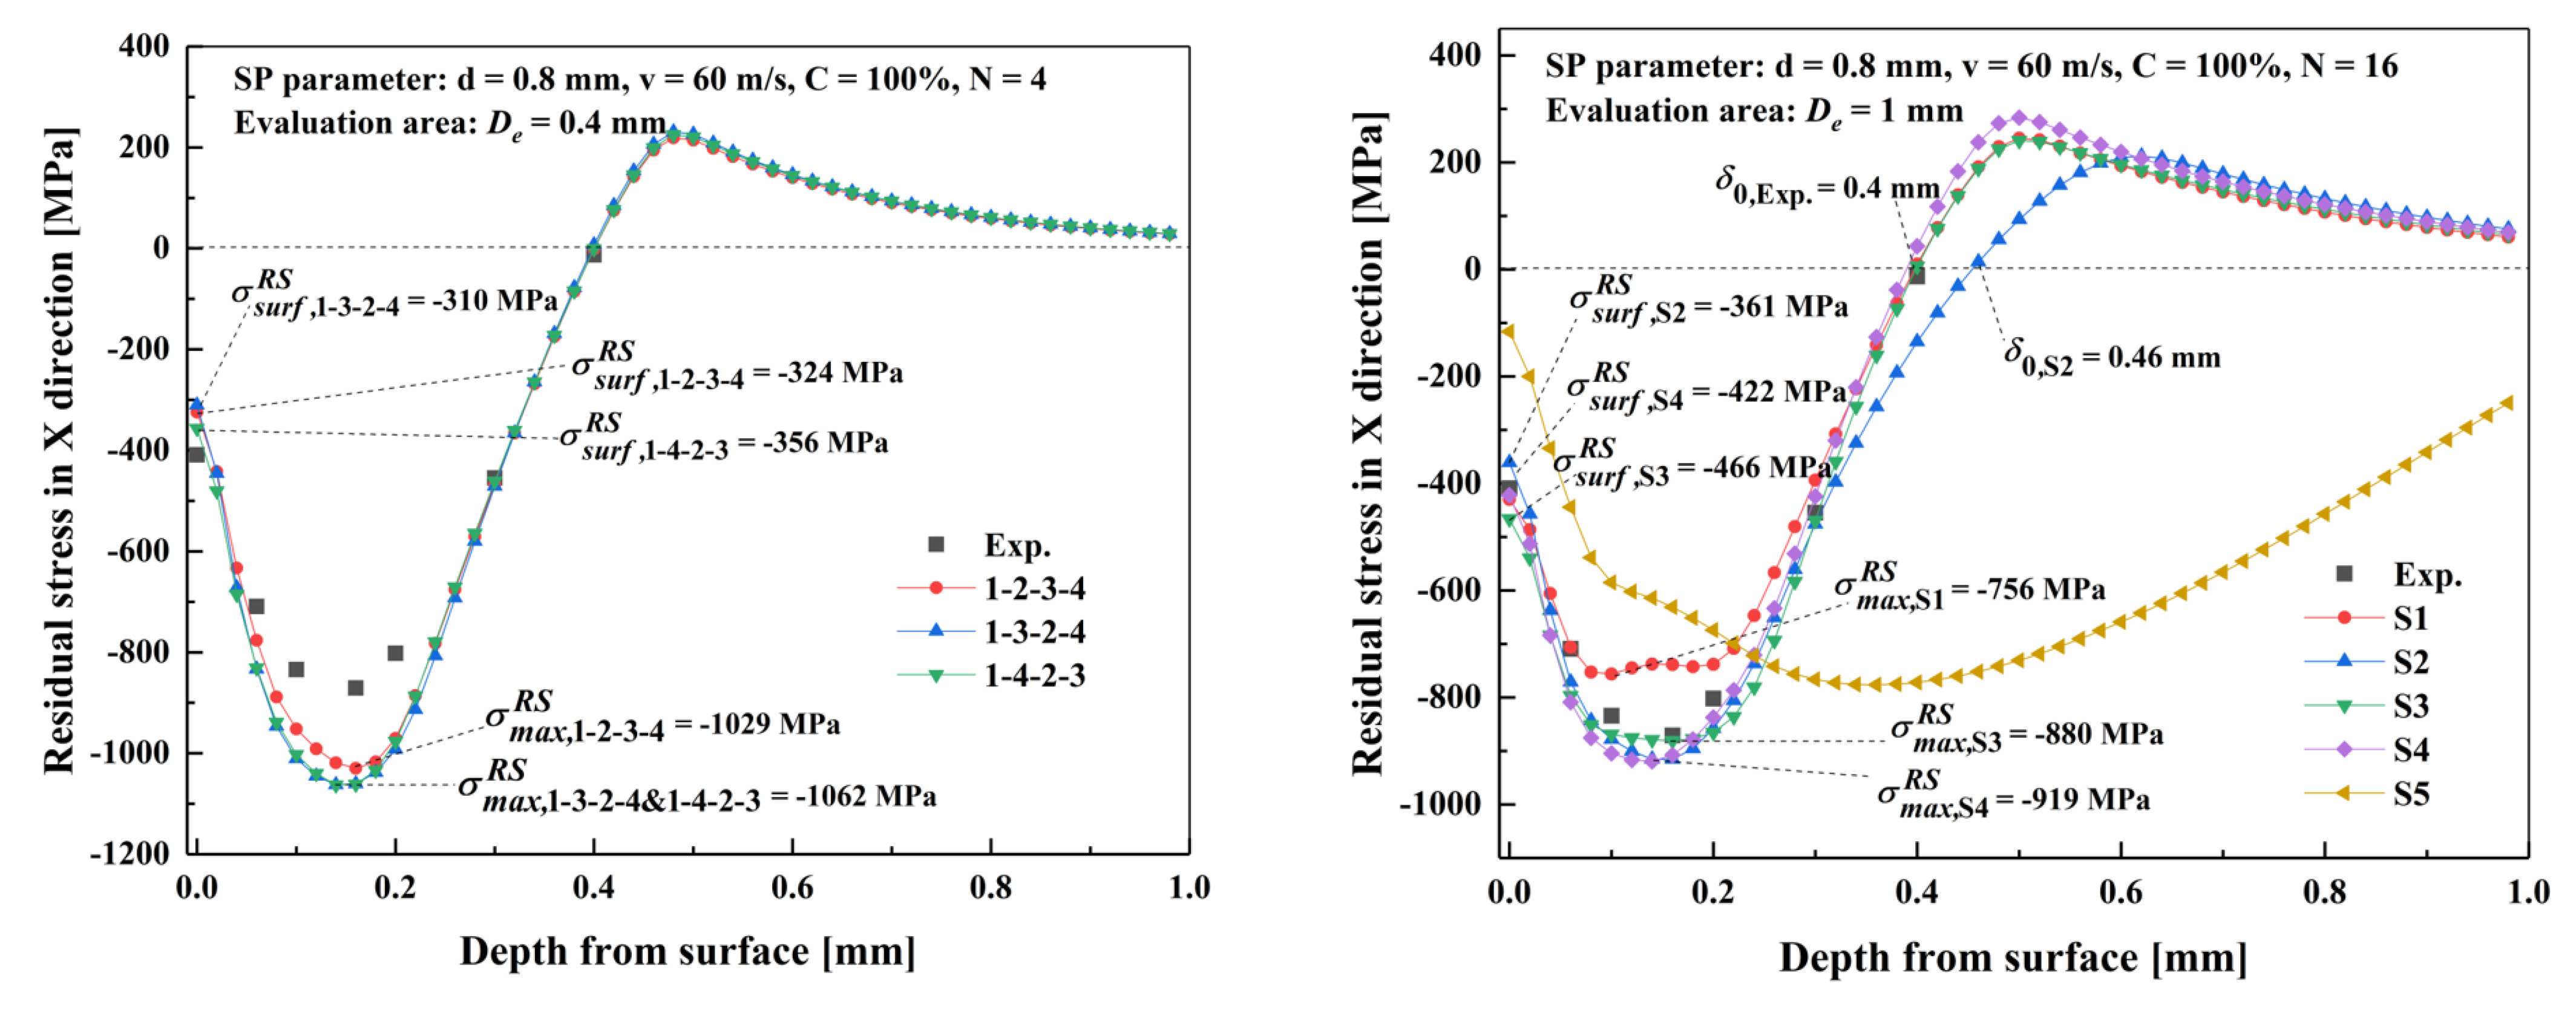
Figure 12.
Contour plots of the residual stress state evaluated in X-direction for five different impact sequences: (a) S1; (b) S2; (c) S3; (d) S4; (e) S5.
Figure 12.
Contour plots of the residual stress state evaluated in X-direction for five different impact sequences: (a) S1; (b) S2; (c) S3; (d) S4; (e) S5.
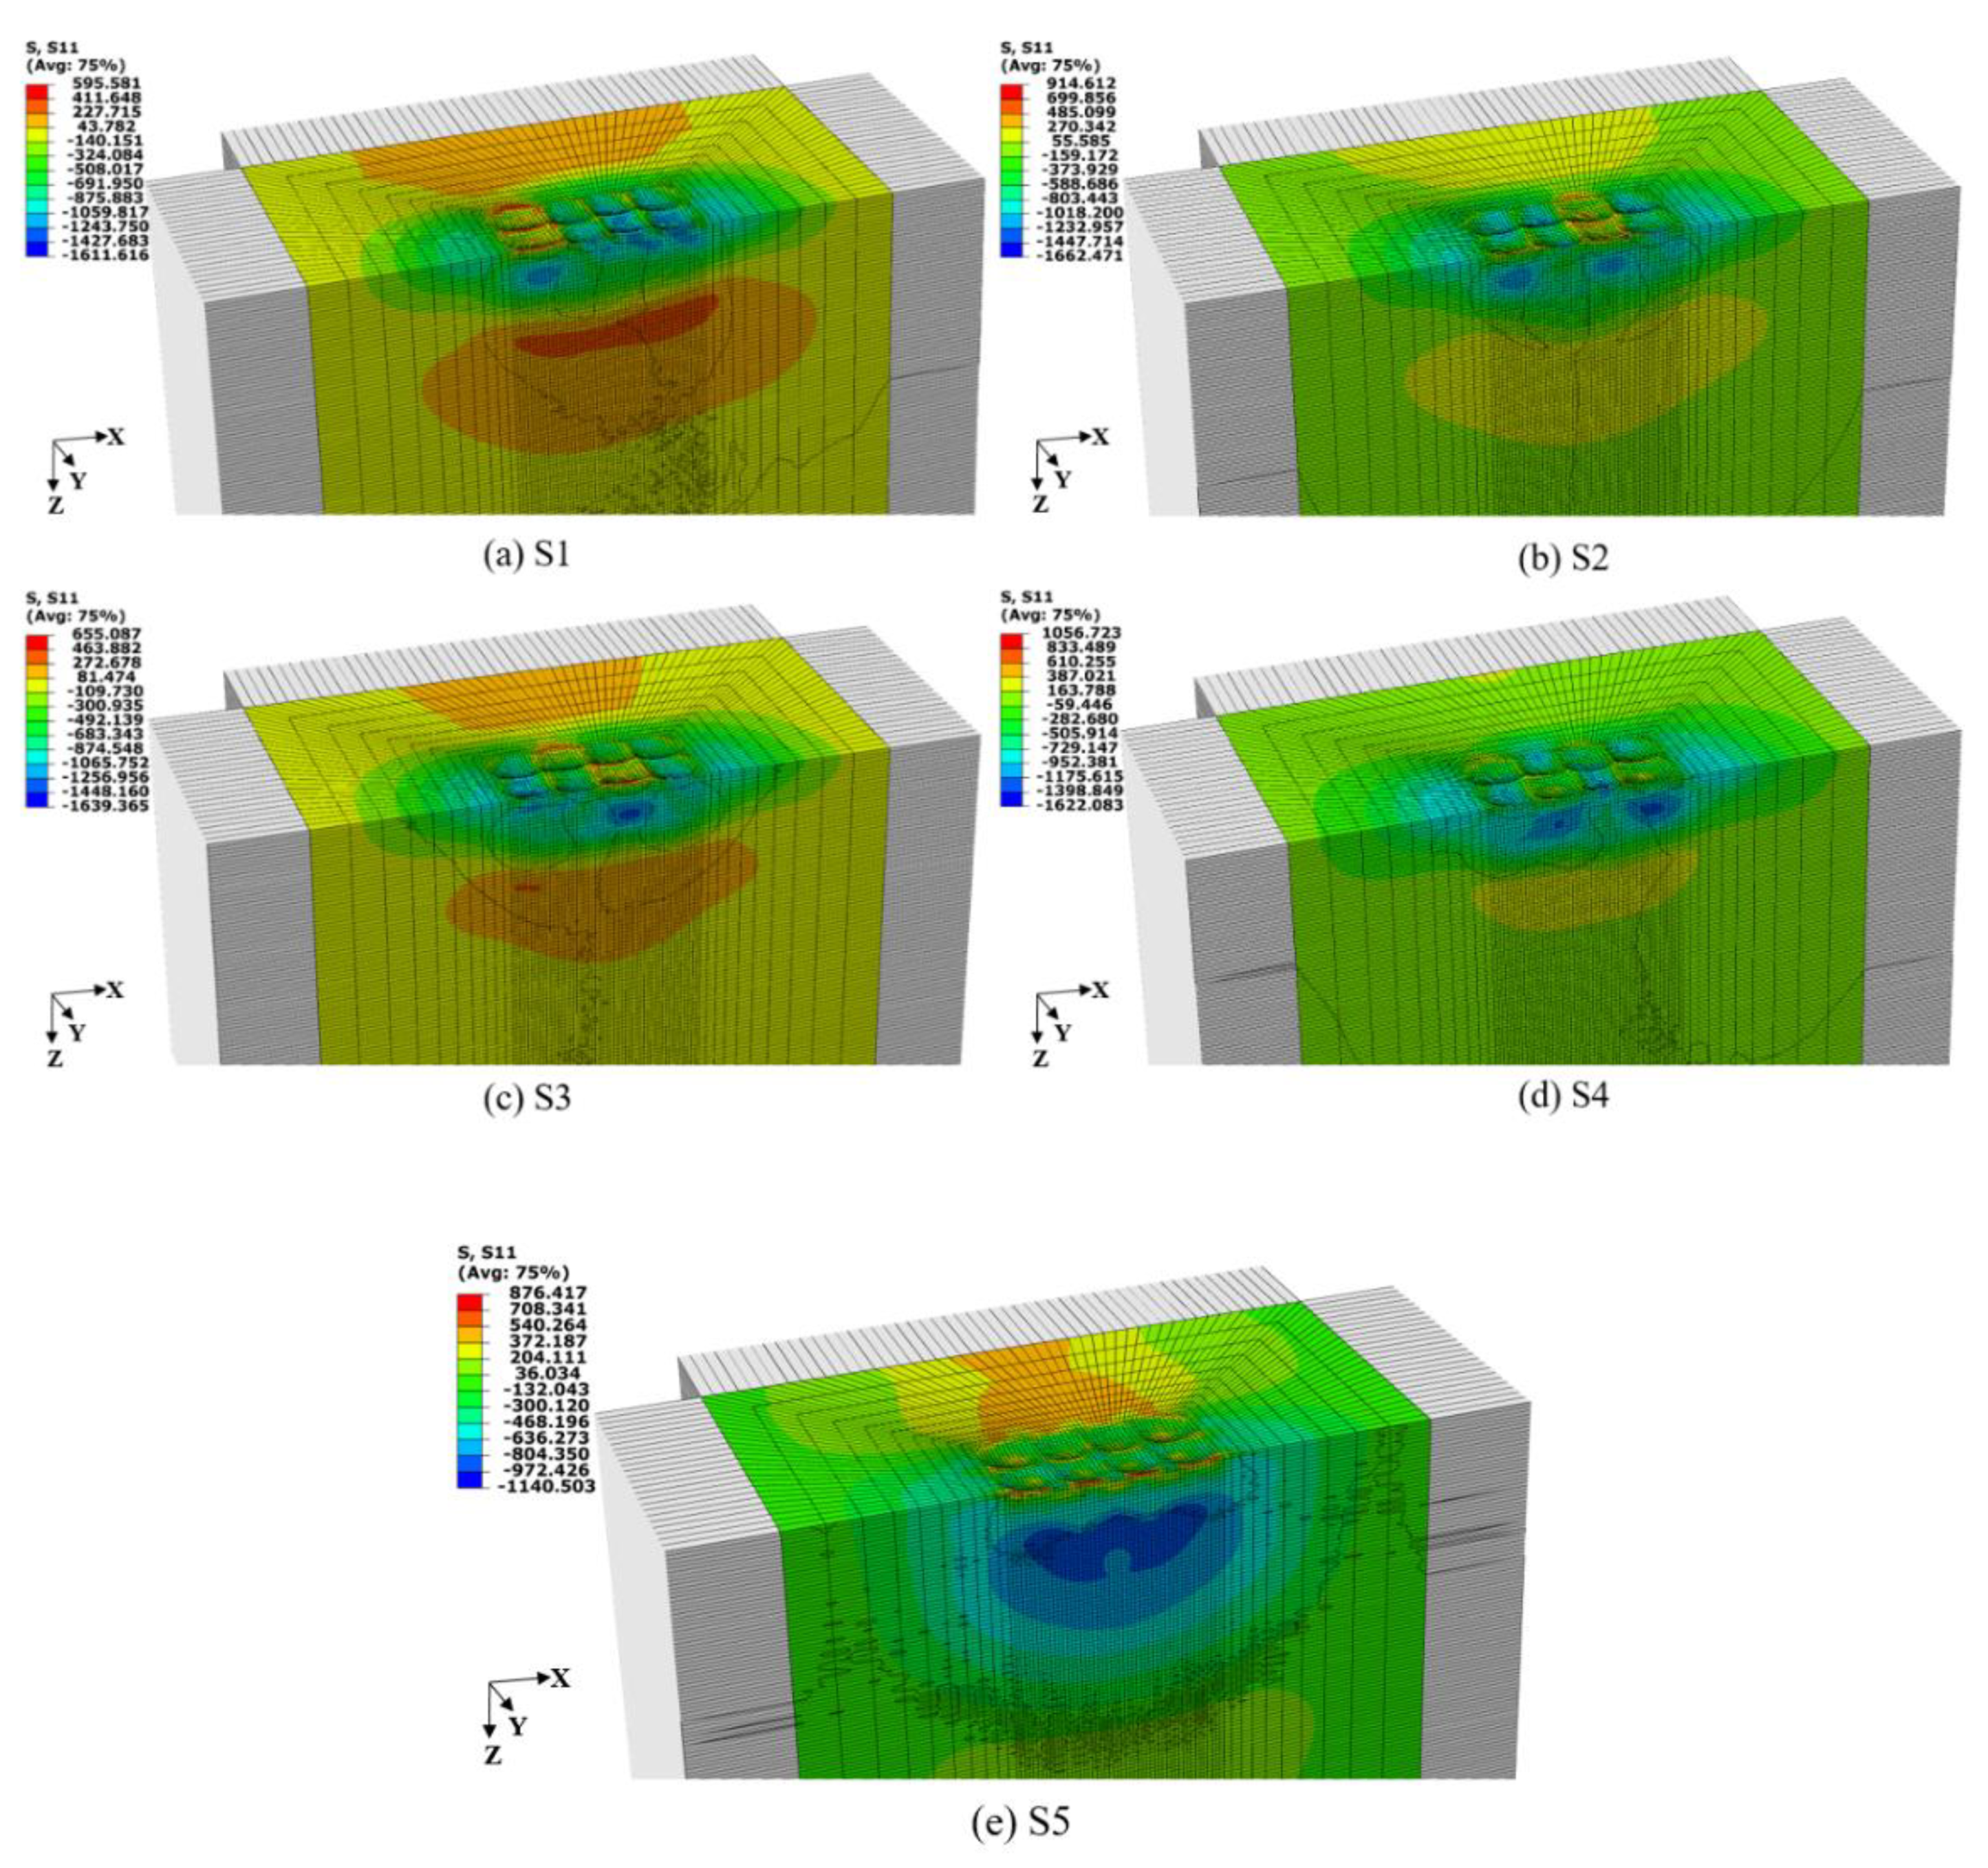
Figure 13.
Residual stress depth profile with different evaluation area in order dimple pattern SP model (SP parameter: d = 0.8 mm, V = 60 m/s, C = 100%, N = 16).
Figure 13.
Residual stress depth profile with different evaluation area in order dimple pattern SP model (SP parameter: d = 0.8 mm, V = 60 m/s, C = 100%, N = 16).
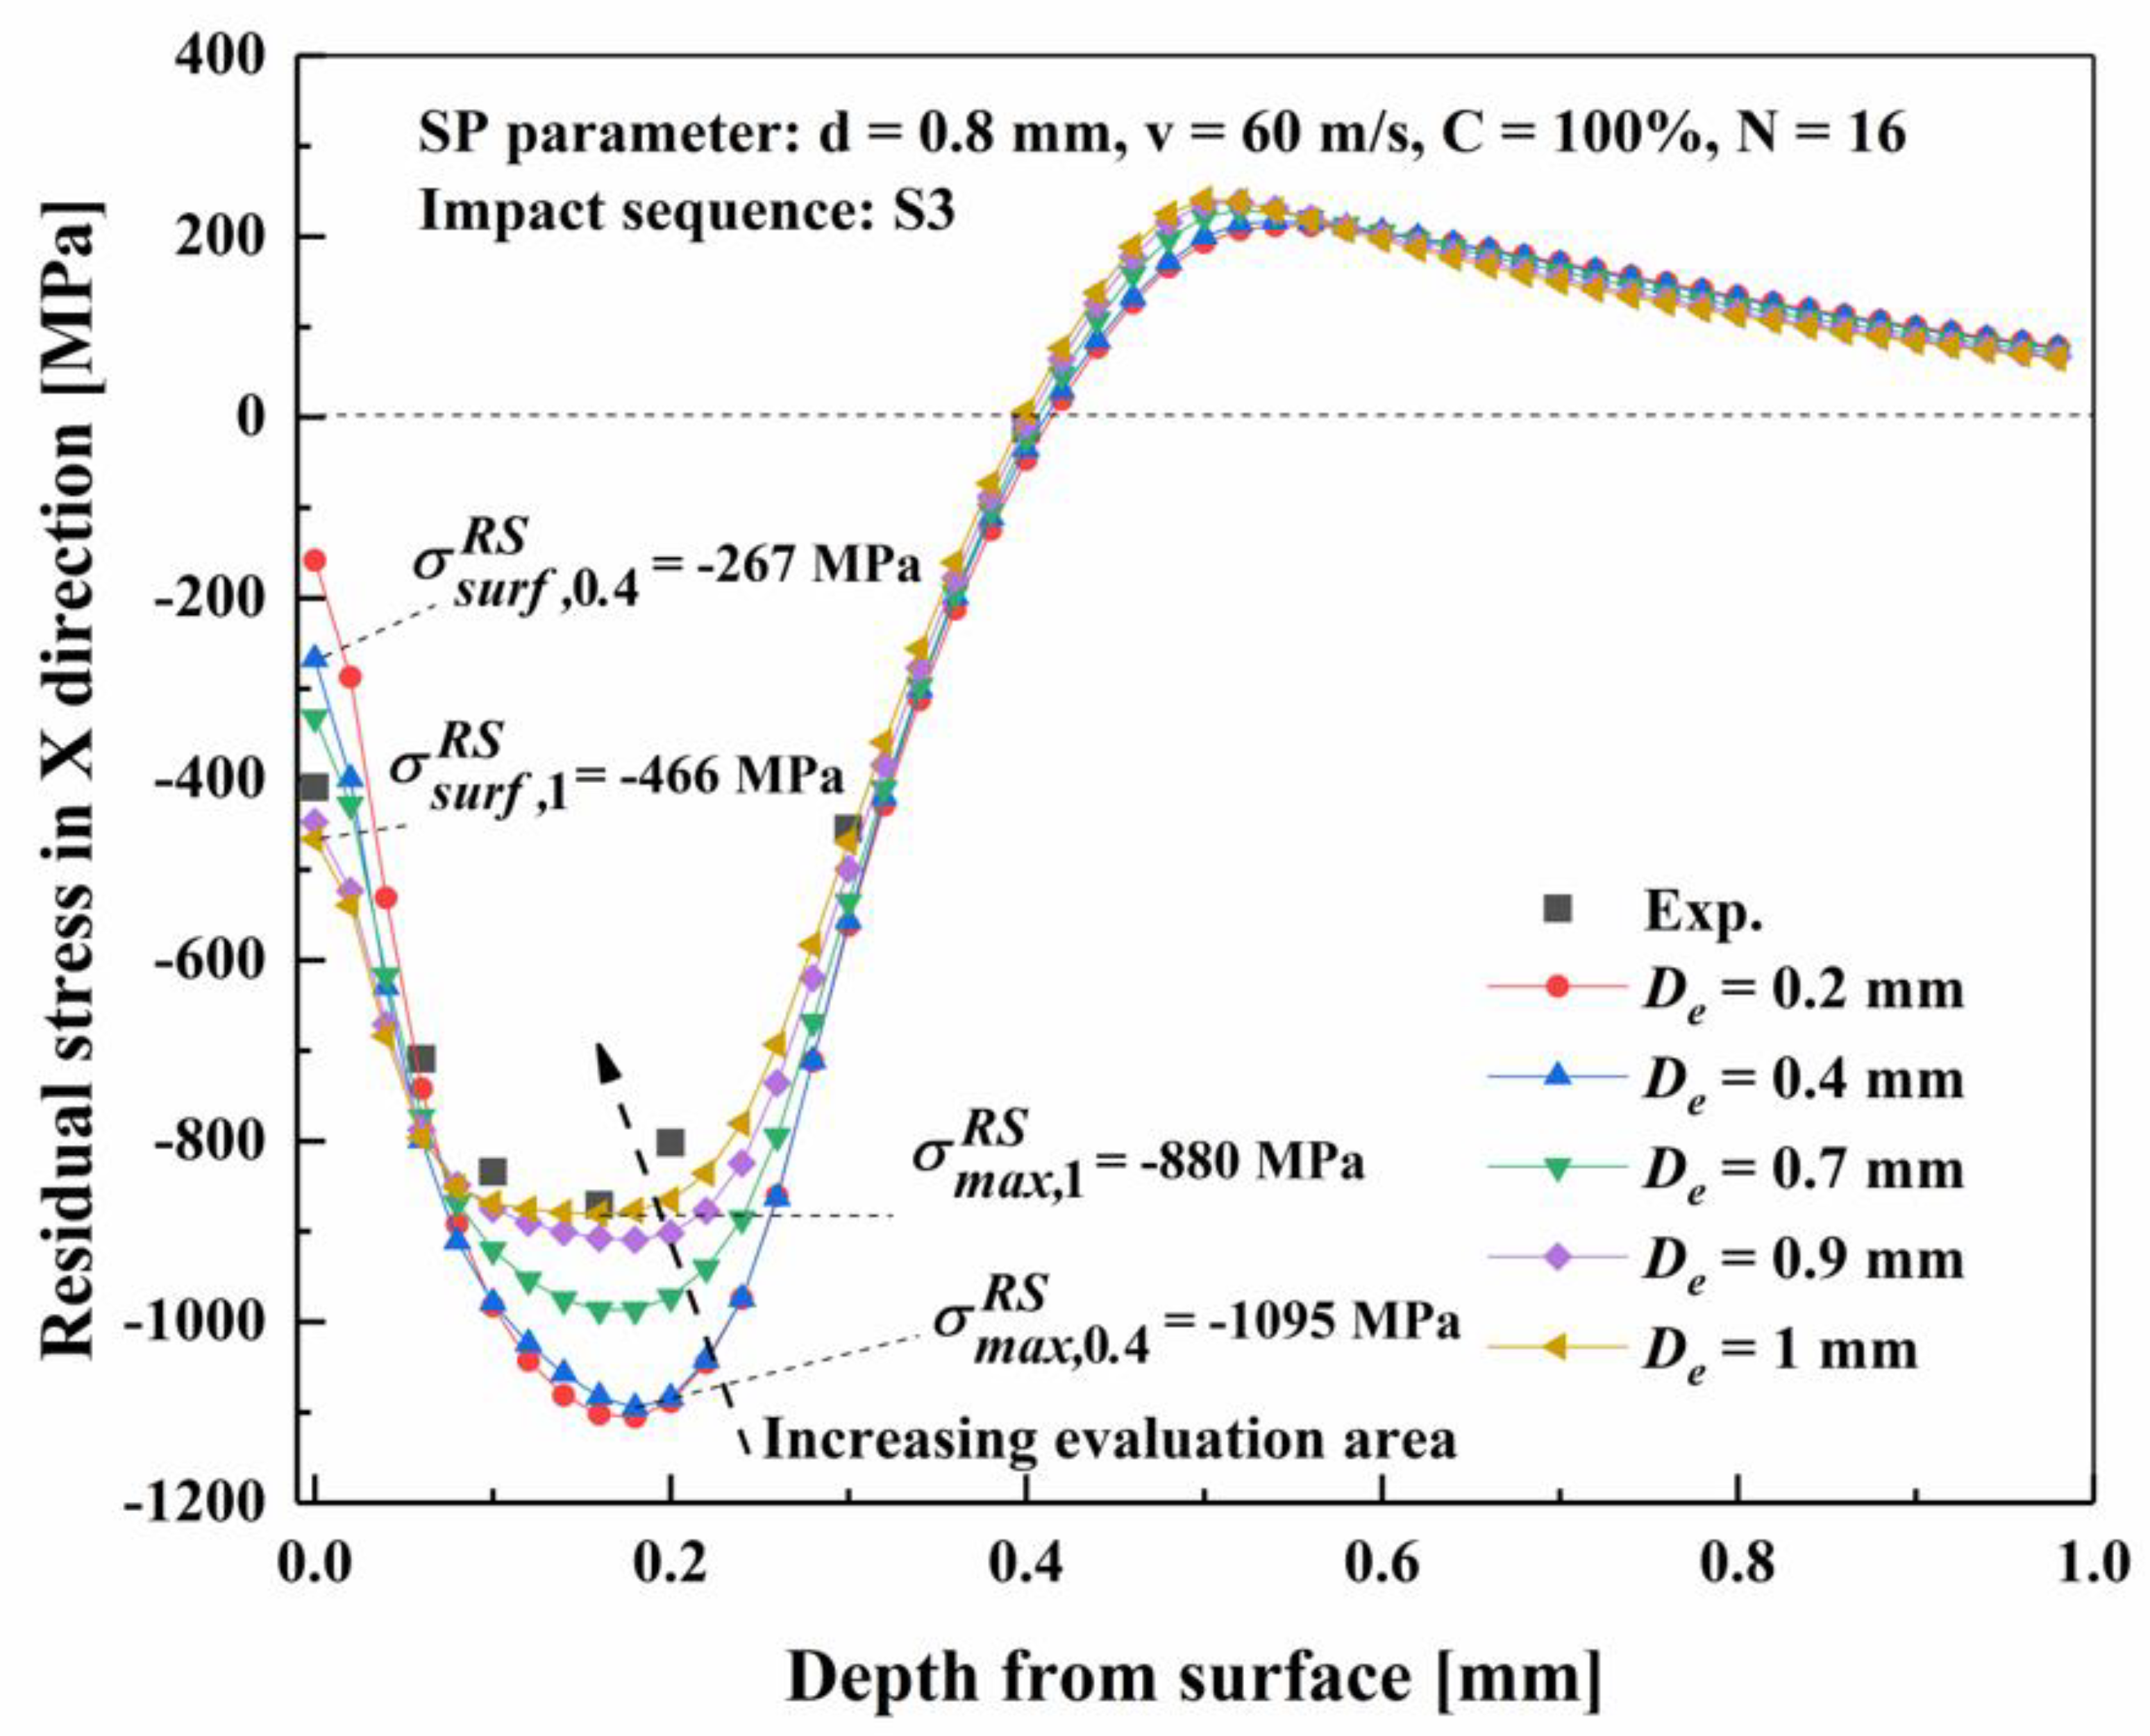
Figure 14.
Residual stress depth profile with different evaluation area in order dimple pattern SP model (SP parameter: d = 0.8 mm, V = 60 m/s, C = 100%, N = 16).
Figure 14.
Residual stress depth profile with different evaluation area in order dimple pattern SP model (SP parameter: d = 0.8 mm, V = 60 m/s, C = 100%, N = 16).

Figure 15.
Residual stress depth profile with different evaluation area in stochastic dimple pattern SP model (SP parameter: d = 0.8 mm, V = 60 m/s, C = 100%, N = 38).
Figure 15.
Residual stress depth profile with different evaluation area in stochastic dimple pattern SP model (SP parameter: d = 0.8 mm, V = 60 m/s, C = 100%, N = 38).


Table 1.
The Johnson-Cook model parameters of 42CrMo steel [38].
Table 1.
The Johnson-Cook model parameters of 42CrMo steel [38].
| Material | E/GPa | v | ρ/kg m−3 | A/MPa | B/MPa | n | m | C |
|---|---|---|---|---|---|---|---|---|
| 42CrMo | 208 | 0.3 | 7830 | 680 | 510 | 0.26 | 1.03 | 0.015 |
Publisher’s Note: MDPI stays neutral with regard to jurisdictional claims in published maps and institutional affiliations. |
© 2021 by the authors. Licensee MDPI, Basel, Switzerland. This article is an open access article distributed under the terms and conditions of the Creative Commons Attribution (CC BY) license (http://creativecommons.org/licenses/by/4.0/).
Share and Cite
MDPI and ACS Style
Wang, Z.; Shi, M.; Gan, J.; Wang, X.; Yang, Y.; Ren, X. The Effects of Shot Distance and Impact Sequence on the Residual Stress Field in Shot Peening Finite Element Model. Metals 2021, 11, 462. https://doi.org/10.3390/met11030462
AMA Style
Wang Z, Shi M, Gan J, Wang X, Yang Y, Ren X. The Effects of Shot Distance and Impact Sequence on the Residual Stress Field in Shot Peening Finite Element Model. Metals. 2021; 11(3):462. https://doi.org/10.3390/met11030462
Chicago/Turabian StyleWang, Zhou, Ming Shi, Jin Gan, Xiaoli Wang, Ying Yang, and Xudong Ren. 2021. "The Effects of Shot Distance and Impact Sequence on the Residual Stress Field in Shot Peening Finite Element Model" Metals 11, no. 3: 462. https://doi.org/10.3390/met11030462
Note that from the first issue of 2016, this journal uses article numbers instead of page numbers. See further details here.