Article

Experimental and Numerical Investigation of the ECAP Processed Copper: Microstructural Evolution, Crystallographic Texture and Hardness Homogeneity

1
Department of Mechanical Engineering, College of Engineering, Qassim University, Unaizah 56452, Saudi Arabia
2
Mechanical Engineering Department, College of Engineering at Al Kharj, Prince Sattam Bin Abdulaziz University, Al Kharj 11942, Saudi Arabia
3
Metallurgical and Materials Engineering Department, Faculty of Petroleum and Mining Engineering, Suez University, Suez 43511, Egypt
4
École de technologie supérieure, Department of Mechanical Engineering, 1100 Notre-Dame West, Montreal, QC H4J 1J9, Canada
5
Production Engineering and Mechanical Design Department, Faculty of Engineering, Port-Said University, Port-Said 42523, Egypt
6
Materials Science Research Institute, King Abdulaziz City for Science and Technology (KACST), Riyadh 11442, Saudi Arabia
7
Mechanical Engineering Department, Faculty of Engineering, Suez Canal University, Ismailia 41522, Egypt
*
Authors to whom correspondence should be addressed.
Metals 2021, 11(4), 607; https://doi.org/10.3390/met11040607
Submission received: 10 March 2021 / Revised: 4 April 2021 / Accepted: 6 April 2021 / Published: 9 April 2021
(This article belongs to the Special Issue Advances in Microstructural Characterization of Metals by EBSD)

Abstract

:
The current study presents a detailed investigation for the equal channel angular pressing of pure copper through two regimes. The first was equal channel angular pressing (ECAP) processing at room temperature and the second was ECAP processing at 200 °C for up to 4-passes of route Bc. The grain structure and texture was investigated using electron back scattering diffraction (EBSD) across the whole sample cross-section and also the hardness and the tensile properties. The microstructure obtained after 1-pass at room temperature revealed finer equiaxed grains of about 3.89 µm down to submicrons with a high density of twin compared to the starting material. Additionally, a notable increase in the low angle grain boundaries (LAGBs) density was observed. This microstructure was found to be homogenous through the sample cross section. Further straining up to 2-passes showed a significant reduction of the average grain size to 2.97 µm with observable heterogeneous distribution of grains size. On the other hand, increasing the strain up to 4-passes enhanced the homogeneity of grain size distribution. The texture after 4-passes resembled the simple shear texture with about 7 times random. Conducting the ECAP processing at 200 °C resulted in a severely deformed microstructure with the highest fraction of submicron grains and high density of substructures was also observed. ECAP processing through 4-passes at room temperature experienced a significant increase in both hardness and tensile strength up to 180% and 124%, respectively.

1. Introduction

Copper (Cu) and Cu alloys have been found to possess fairly high strength, outstanding thermal conductivity, resistance to corrosion while being easy to fabricate; as a result, they have gained popular appeal in applications like automobile manufacturing, railway transportation, electrical and electronic industries, structural applications and applications involving heating or temperature measurement [1,2,3,4,5]. Due to its known softness and ductility, industrially utilizing pure Cu is kept to a minimum in many engineering applications [6]. A common fix to this problem is the refinement of the grain structure on the nano-scale level using severe plastic deformation (SPD) techniques [7,8,9]. This produces ultrafine-grained (UFG) Cu that possesses many appealing properties such as the coexistence of high strength and ductility [4,10,11].
Currently SPD methods have achieved wide circulation because of their effect on microstructure behavior. SPD can be used to produce UFG microstructures and to deform pure and alloy materials that directly causes the improvement of both the physical and mechanical properties and the corrosion behavior of the processed materials [12,13]. Among the plethora of SPD processes available now are high-pressure torsion (HPT) [14,15,16,17], twist extrusion (TE) [18,19,20,21], accumulative roll-bonding (ARB) [22] and ECAP [12,23,24,25]. Among these processes, the most applicable of them is ECAP, which allows for extremely large magnitudes of strain to be applied to a bulk sample through intensive simple shear; thus, ECAP is highly capable and efficient in fabricating different types of UFG and nano-structured materials (NS) [26,27,28,29]. Furthermore, the ductility of a material can be increased through ECAP since the improvement of a duplex microstructure formed by NS grains sized coupled with micrometric or UFG without sacrificing the martials strength [30]. As a result, of its relative simplicity and its ability to produce large amount of material, ECAP is an available candidate for further utilization and deployment in industry [31].
The ECAP process can be applied to samples of different shapes like rectangles, squares, or circles. The SPD of the microstructure occurs without any significant changes in dimensions, which means the materials can undergo an unlimited number of passes and can be pressed indefinitely to achieve a higher total strain [27]. The die of ECAP includes two channels with the same cross-section intersecting at a channel angle Φ, and with an angle of curvature, Ψ. The equivalent plastic strain imposed to the ECAPed sample is largely dependent on the die angles and the number of processing passes [32]. The magnitude of equivalent effective plastic strain (εeq) after N passes can be calculated from the following relationship [33]:
ε e q =   N 3 [ 2 cot ( φ + ψ 2 ) + ψ   c o s e c ( φ + ψ 2 ) ]  
In addition, using a large number of ECAP passes increases friction between the processed billets and the die walls that results in increased density of the high-angle boundaries, which enhances the mechanical properties of the processed materials significantly [23,25,28,34,35,36].
Several studies are investigating the effect of ECAP processing parameters on the microstructural evolution and mechanical properties of pure copper. Wang et al. [37] processed pure Cu with routes Bc, A and new route has a specific rotation angle of the sample between consecutive passes called X. They found that processing pure Cu via new route X up to eight passes at room temperature (RT) is more effective than routes A and Bc in lower dislocation density and grain size in addition to improved strength and ductility of processed samples. As demonstrated by Guo et al. [38], ECAP processing led to a significant improvement in the strength of single crystal Cu. Simultaneously, the plasticity and conductivity of Cu maintained excellent values. Blum et al. [39] observed that the microcrystalline grains resulting from ECAP processing through two passes were coarsening discontinuously during the creep test, which led to dramatic changes in the creep rate. Zhu et al. [40] found that the large initial pure Cu grains were refined after four ECAP passes, while processing for five to eight passes caused saturation and high density of dislocation cells with a size of 500 nm is evolved inside micron grains. On the other hand, the hardness distribution maps revealed the inhomogeneity of mechanical properties. A crystal plasticity finite element model had been developed by Deng et al. [41] to investigate the pure Cu texture evolution during ECAP. They reported that the crystallographic orientation was capable of rotation in three dimensions during ECAP, with higher rotation angles around the Z-axis. It is worth mentioning here that static recrystallization resulting from performing ECAP at 200 °C generates a homogenous structure as reported by Blum et al. [42]. Moreover, the ductility was significantly improved by worm processing. Ebrahimi et al. [43] reported that ECAP processing resulted in a non-uniform hardness distribution with lower hardness at the bottom region of commercial pure Cu, which becomes more homogenous gradually by increasing the number of passes.
This study aims to provide a comprehensive analysis for the effect of ECAP on the mechanical properties, microstructural evolution, crystallographic texture, and hardness distribution across the ECAP processed commercial pure Cu. To this aim, a unique EBSD analysis was carried out along the longitudinal section of the ECAPed Cu sample from the right peripheral regions passing through the central regions down to the left peripheral regions to investigate the influence of ECAP possessing through multiple passes on the microstructural homogeneity and crystallographic texture. Furthermore, the microhardness distribution was studied along both the longitudinal and transverse section and correlated with the EBSD analysis. For better presentation, the hardness profiles and their degrees of homogeneity were illustrated by 3 dimensional color-coded outlines. In addition, a numerical modeling was used to investigate the induced effective stress-strain and their distribution along the Cu processed samples and compared with the experimental findings. Furthermore, the effect of the ECAP processing temperature on microstructural evolution and mechanical properties was investigated.

2. Materials and Methods

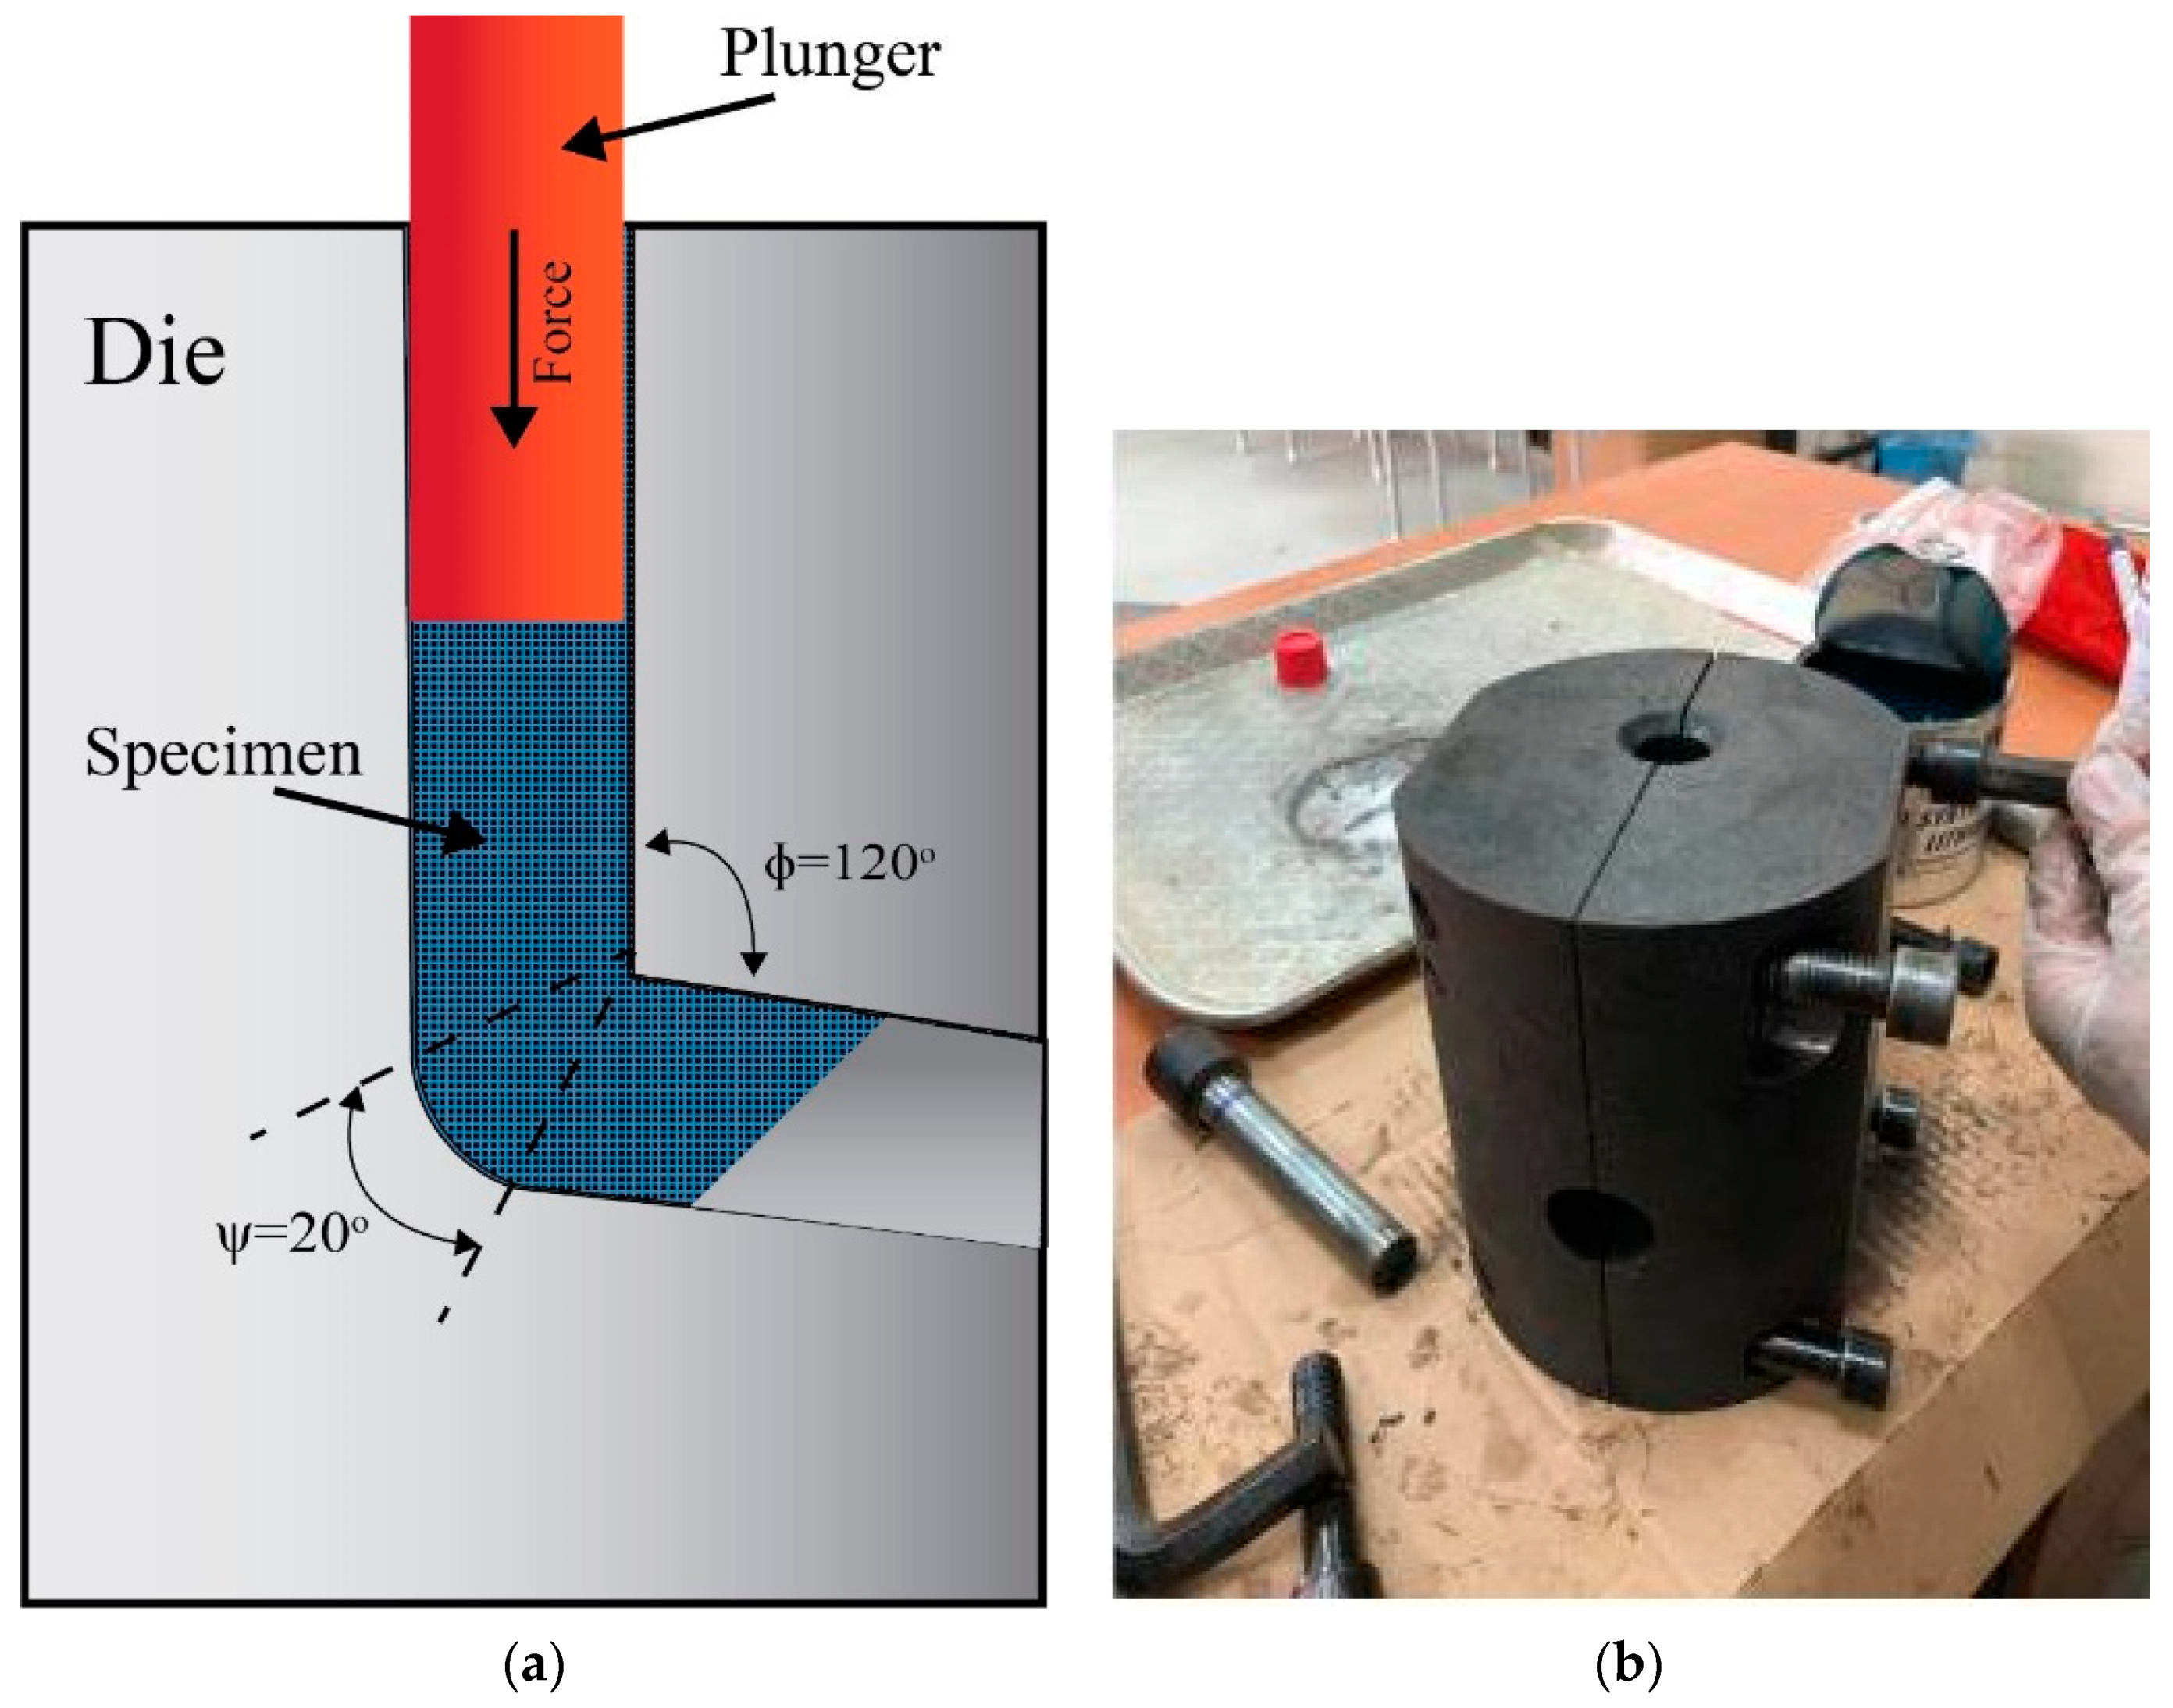
2.1. Finite Element Method

Finite element (FE) analysis was carried out to simulate the strain and stress distribution along the sample’s longitudinal and transverse sections during ECAP processing. In addition, the FE analysis was compared to the experimental geometries in order to investigate the effects of the geometric, material and process parameters on the plastic deformation behavior of pure Cu rods during the ECAP process. The ECAP process was modeled at RT to fully utilize the grain refinement effect and strain hardening results. To simulate the ECAP process, the cold forming extrusion module was used. The model consisted of the plunger, the ECAP die that consists of two halves, and the ECAPed rods. For clarity and improved visualization, all parts were invisible apart from the Cu samples during simulation. The 2-half die, and the plunger were modeled as discrete rigid elements made of an imaginary non-formable material whereas the Cu rod was modeled as a deformable object. The dimensions of the die and work-piece were the same as the experimental values. Pure Cu was selected from the ANSYS software (19.1, ANSYS Inc., Canonsburg, PA, USA) built-in library as the material of the work-piece and its mechanical and thermal properties were pre-described. Furthermore, hexahedral mesh, which is typically used in computational modeling of 3-dimensional (3D) regular shapes, was used with a mesh size of 0.5 mm. This gave a total number of nodes ranging from 9500 to 15,000 elements depending on specimen’s degree of distortion and in accordance with the mesh sensitivity analysis. The ECAPed material was modeled both as an isotropic linear elastic material and as a strain hardenable rigid plastic material. Tracked elements were located at specified regions on the plane in the middle of the specimen. The regions chosen were at the edge where max strain occurs and at the center where SPD has the lowest effect. Ram speed was chosen to be 0.15 mm/s, which equal the ram speed used experimentally. In previous studies [41,44], the coefficient of friction of μ = 0.05–0.1 showed good results. Therefore, the Coulomb’s friction model was used with die friction factor 0.07 in this study. As an added measure due to deformation, a remeshing criterion was set to take into consideration any changes in the geometry and dimensions of the rod processing. Remeshing criteria were used based on a strain change of 0.1 mm and an element size of 1 mm.

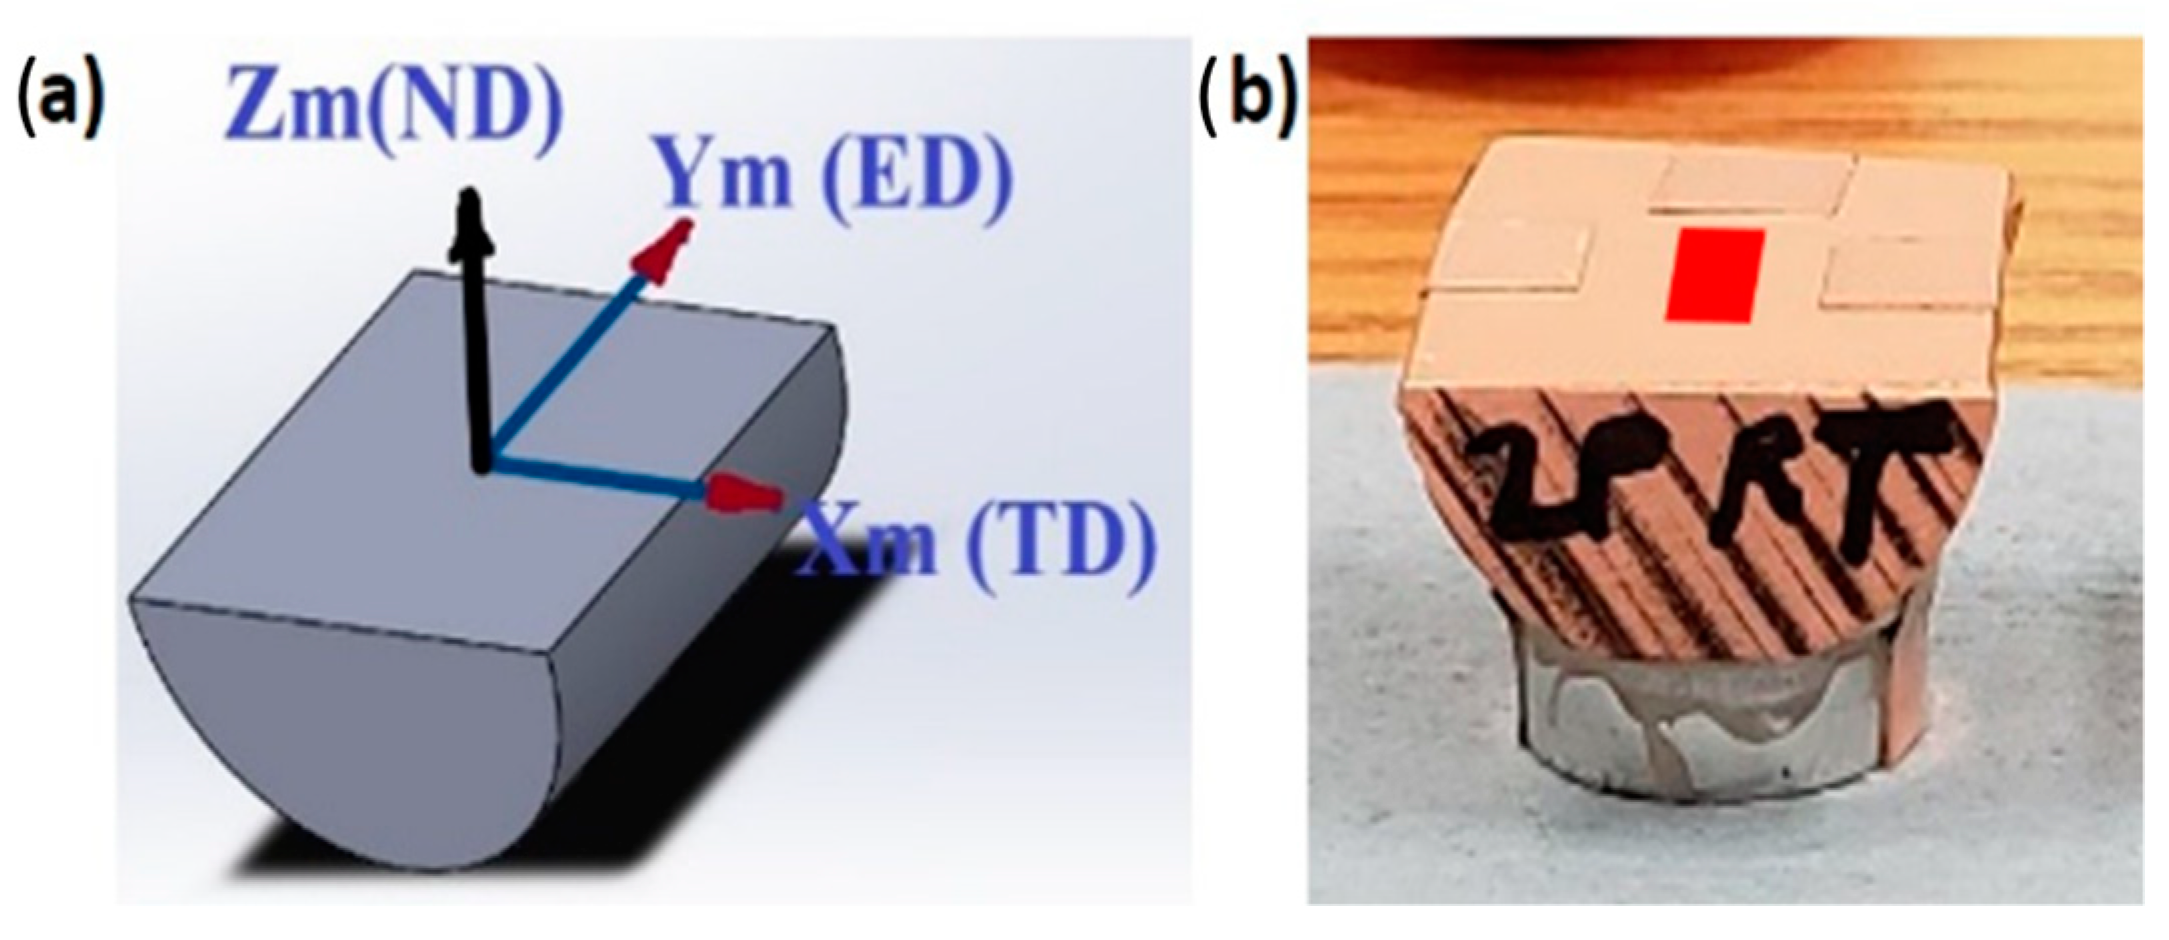
2.2. Experimental Procedure

Experiments were carried out on a commercial pure Cu billets (99.9% in mass), which were received in the form of rolled billets with a 20 mm diameter and length of 50 cm. The Cu billets were sectioned and machined using high precision cutting machine and a lathe to form ECAP samples with a diameter of 20 mm and a length of 70 mm. The billets were annealed at 500 °C for 1 h under an inert atmosphere before ECAP processing followed by furnace cooling to attain an initial homogenous and fully recrystallized starting microstructure with average grain size 5.14 µm and hardness of 55 HV. Cu rods were processed through ECAP for 1, 2 and 4 passes through route Bc (with the sample being rotated 90° along its longitudinal axis in the same direction after each pass) at RT with a ram speed of 0.15 mm/s. To investigate the effect of processing temperature, another ECAPed sample was processed for 1 and 4 passes using route Bc at 200 °C to enhance dynamic recrystallization during the processes and to create possible high-angle grain boundaries (HAGBs). A graphite-based lubricant was applied to reduce the friction between the ECAPed samples and the die’s inner walls before each pass. The ECAP process was performed using a split die shown in Figure 1 in which the two parts of the channel intersected with an internal channel angle of φ = 120° and with an additional outer corner angle of ψ = 20°. The die geometry imposed an equivalent strain of about 0.65 per pass according to Equation (1).
The billets before and after the ECAP process were sectioned along the central longitudinal lines parallel and perpendicular to the extrusion direction, and then grinded and polished to a mirror-like surface. Vicker’s microhardness tests (HV) were conducted on the sample. Microhardness values were measured by taking readings following a rectilinear grid pattern with the spacing of 1 mm between each separate indentation starting at the billets’ peripheries and moving towards the center on sections that were cut near the top part of the ECAPed samples. This was conducted on both parallel and perpendicular sections to the extrusion direction to evaluate the hardness variation across the ECAPed rods’ longitudinal and transverse sections (LS and TS). The LS was of a square area with dimensions 20 × 20 mm2, whereas the TS was of a circular area with 20 mm diameter. Both the longitudinal and transverse sections were cut near the upper part of the ECAP processed billets. The hardness test was carried out under an applied load of 1 kg for 15 s. The displayed results were averaged over a minimum of 5 equispaced indentations. Additionally, the hardness profiles and their degrees of homogeneity were illustrated by color-coded outlines created to display the hardness distribution along the LS and TS of the ECAPed samples.
Tensile tests were performed on a 100 kN universal testing machine (Instron 4210, Norwood, MA, USA) at RT with at a constant strain rate of 10−3 s−1. The tensile samples were prepared according to the specifications set by the American Society for Testing of Materials (E8M/ASTM). All the tensile samples were machined from the center of the ECAPed samples. To ensure an accurate display of the results, two tensile specimens were tested per processing.
Microstructural evolution of the rods before and after ECAP was characterized using a field emission scanning electron microscopy (FESEM) (Hitachi, Ltd., Tokyo, Japan), which equipped a NordlysMax2 EBSD detector. ECAPed rods preparation sequence was as follows: mounting the samples, followed by sample grinding, adequate polishing using alumina solution, and finally etching using a mixture of HCl and HNO3 solutions with a volume ratio of 3:1 as a final preparation step.
In addition, EBSD was used to investigate the structural evolution and crystallographic texture of the Cu-rods processed with multiple passes via ECAP. Figure 2a depicts references axes with respect to the ECAPed process. Samples for microstructural characterization (EBSD) were cut from the center of the ECAP samples along their longitudinal cross-section on the plane parallel to the pressing direction (flow plane) and perpendicular to the entry channel of the die, as described in Figure 2, where the axes of the reference system coincide with the extrusion ECAP direction “Y” (ED), the normal direction “Z” (ND) and the transversal direction “X” (TD). The investigated specimens were grinded and mechanically polished with a tripod polisher down to 1 µm diamond particle. A final chemical-mechanically polishing with 0.05 µm colloidal silica was performed for 12 h with a BUEHLER Vibrometer. The EBSD measurements were performed on the top surface TD-ED plan as indicated by a red rectangle on Figure 2b using a Hitachi SU-70 SEM operating at 15 kV and at a typical current of 1.5 nA. Crystallographic orientation maps were obtained using HKL Channel 5 acquisition system of oxford instruments. To achieve good statistical data due to the presence of coarser grains, a larger scan area was selected for as-annealed and processed samples. The EBSD scans were in areas of 127 µm × 95 µm with 0.2 µm step size. In order to minimize the measurements error and the deformation induced by the preparation stage, misorientations below 3° were not considered in the post-processing data procedure. Additionally, low angle grain boundaries (LAGBs) were defined as misorientation angles between 3° and 15° and presented in white lines on the band contrast maps, while the high-angle grain boundaries (HAGB) were defined when misorientation angles were greater than 15° and presented in black lines on the band contrast maps. Certainly, all grains in the outer frame of each region of interest were excluded. In Table 1, the total number of grains and number of grains after excluding the border grains and grains less than 4 pixels.

3. Results

3.1. Finite Element Analysis

Color contour maps showing the distribution of the stress and plastic strains in the longitudinal section of the simulated Cu sample after processing through 1-pass (1-P) of ECAP at RT are illustrated in Figure 3 and Figure 4, respectively. The plunger and die have been removed for better visualization. As evident in Figure 3 and Figure 4, the maximum stresses and strains are present at the corner and peripheral areas. This surge compared to the central areas occurs as the peripheral regions were in contact with the die’s walls. In addition, Figure 3 and Figure 4 revealed a slight increase in the stress and imposed strain at the top part of the sample compared to the bottom part due to the contact with the die channel angel. Accordingly, this finding agreed with Deng et al. [41]. On the other hand, the lower part of the ECAPed processed samples revealed lower effective strain as compared to the upper part due to imposing a combination of bending and shear mechanisms as depicted in Figure 4.
Figure 3 shows the processed rod after being processed via 1-P, where the maximum stress experienced was in the range of 379 MPa, which occurred in the peripheral regions. On the other hand, the bottom central region experienced lower stresses of 106 MPa, which confirms the distribution obtained in an earlier study [45]. Moreover, it can be observed that the upper part of the ECAPed billet experienced higher stresses (227 MPa) compared to the lower part (15.7 MPa) as a result of the direct contact between the top ends with the plunger. A similar trend was displayed for the strain distribution as shown in Figure 4 whereas, ECAP processing via 1-P displayed a max effective strain of 0.74, which was depicted in the upper peripheral region, which indicates considerable agreement with the results obtained from the analytical calculations using Equation (1). On the other hand, the lower central region encountered a minimum effective strain of 0.15, which matches with the stress distribution showed in Figure 3. Similar strain distribution patterns were noted in some earlier studies [46,47]. The increase in the effective plastic strain from the bottom to the top can be explained by the formation of the corner gap. As the bottom part of the ECAPed sample was no longer in contact with the die. Consequently, lower degree of deformation occurred in the bottom of the sample [4]. Accordingly, this inconsistency in the stresses and plastic strain values recorded along the LS of the ECAP sample will significantly affect the homogeneity in the mechanical properties and microstructural features throughout the sample.

3.2. Grain Structure and Crystallographic Texture

Figure 5 shows the inverse pole figure (IPF) coloring map where the grains are oriented with their 111 along the normal direction ND for the as annealed with its corresponding band contrast (BC) map with the high angle grain boundaries (HAGBs) of a misorientation angle above 15° are outlined as black lines and low angle grain boundaries (LAGBs) of misorientation between 3° and 15° are depicted in white lines. The IPF microstructure of the as annealed Cu (Figure 5a) consists of almost equiaxed grains. In addition, several twins are present within the as-annealing microstructure with an average grain size of 5.1 ± 3.7 μm including twins based on EBSD data with twin boundary criteria of 60 deg or less. However, the size distribution was heterogeneous through the as-annealing microstructure, and some finer grains down to 5 µm were visible between the coarse grains up to 27 µm. The grain boundary map in Figure 5b indicates that the map was dominated by HAGBs and almost free of the LAGBs, which implies that the microstructure was fully recrystallized.
Figure 6 shows three and their corresponding BC maps with the HAGBs > 15° in black lines and 15° > low angle grain boundaries (LAGBs) > 3° superimposed for the 1-P ECAP processed pure Cu at RT obtained at the two edges (a, c) and at the center (b) of the sample LS. It can be observed that the microstructure consists of a mixture of many relatively fine and few relatively coarse grains that can be considered a type bimodal microstructure. This can be observed across the whole cross section with notable increase in the density of the LAGBs relative to the as-annealed (AA) material. In addition, a microstructure exhibiting a smaller average grain size of 3.9 ± 2.0 µm with a high density of twins can be observed. The reduction in the average grain size can be attributed to the formation of new HAGBs due to the high amount of strain experienced during the first pass. The effective strain after the 1-P estimated by the numerical modeling above to be about 0.74 at the peripheral of the billet. Cu is a medium stacking fault energy (γSFE) fcc metal of about 80 mJ/m2 [48]. The amount of energy stored in the material due to plastic deformation is about 1% of the work done during plastic deformation and about 99% is dissipated as heat [49]. Thus, this condition can lead to partial recrystallization especially the recrystallization temperature of pure Cu is about 180 °C [49].
Figure 7 shows the IPF maps and their corresponding BC maps with the HAGBs and LAGBs superimposed for the 2 passes (2-Bc) (a) and 4 passes (4-Bc) (b) ECAP processed pure Cu at RT. It can be observed that the density of the LAGBs increased significantly due to the strain accumulation after 2-Bc and 4-Bc passes. The average grain size after 2-Bc and 4-Bc was also reduced to 3 ± 2.5 µm and 3.5 ± 3.0 µm, respectively. The 2-Bc passes and 4-Bc passes led to an increase in the amount of the substructure without any effect in grain coarsening. It was also observed that the UFG at RT were locally heterogeneous up to the second pass, but further deformation enhanced the homogeneity of grain size distribution. These obtained results were in good agreement with the reported [40,50]. Higuera-Cobos and Cabrera [50] studied the microstructure of pure Cu after ECAP processing with the starting annealed equiaxed grain structure of a grain size average of about 5.5 µm. They reported that the microstructure after the 1-P consists of elongated grains with well-developed substructure while after 4, 8 and 16 passes they reported saturated microstructure after the fifth pass that is a heterogeneous microstructure of large grains with ultrafine grains. Zhu et al. [40] studied the microstructure of pure Cu after ECAP with starting extremely large grains of 410 µm. They reported grain refining to about 210 µm after 4 passes. Then increasing the passes to 8-P resulted in the formation of dislocation cells with a size of 500 nm up to 3 µm.
The ECAP process also was carried out at temperature of 200 °C for 1-P and 4-Bc to study the effect of temperature on the microstructural evolution. Figure 8 shows the IPF coloring maps relative to the ND and the BC maps with the HAGBs > 15° misorientation in black lines and LAGBs < 15° misorientation in white lines for the ECAP processed pure Cu at 200 °C for 1-P and 4-Bc. It can be observed that the grains after 1-P were elongated with notable amount of LAGBs. Increasing the number passes to 4-Bc resulted in a significant increase in the density of the LAGBs with a clear reduction in the average grain size. The average grain size after 1-P and 4-Bc was 4.3 ± 3.4 µm and 2.5 ± 1.7 µm, respectively. The grain morphology indicates the heavy deformation that experienced and resulted in distorted grains after 1-P and more severely after 4-Bc. It is quite possible that the main features of the microstructure formed at 200 °C in regime 2 were similar to that formed at RT in regime 1. However, the amount of elongated grains decreased with increasing the deformation temperature and sharp boundaries became more evident at 200 °C. The average grain size summarized from the EBSD characterization are shown in Table 1 for the AA, 1-P, 2-Bc, 4-Bc, 1-P-200 °C and 4-P-200 °C samples.
Figure 9 shows the (110) and (111) pole figures of the AA and ECAP processed pure Cu at RT and at 200 °C. As can be seen from Figure 9a, the as annealed Cu showed high intensity texture of about 7 times random, which could be directly related to the previous processing history of the billet. This strong texture was completely transformed after the first ECAP pass towards the simple shear texture with an intensity of about 4 times random. After 2-Bc and 4-Bc the texture completely resembled the simple shear texture with about 7 times random again. Simple shear textures of fcc metals were characterized by two partial fibers: (i) (111)ǁND (Shear plane) containing A/ A ¯ and A 1 and A 2 and (ii) (110))ǁED (shear direction) composed of A/ A ¯ , B/ B ¯ and C as the ideal components [51,52], Table 2 lists the partial fibers and ideal simple texture components in fcc metals. From the pole figures after 2-Bc and 4-Bc it can be noted that the main texture components that developed after ECAP processing are A/ A ¯ and C with the miller indices of {111}/<101>, { 11 0 ¯ } /< 11 0 ¯ > and {001}/< 11 0 ¯ > respectively. These components can be observed almost at all their ideal positions in 111 and 110 pole figures after 4-Bc with the ideal component positions superimposed in Figure 10. These texture components are reported to be developed at low temperatures and low strain [51]. Li et al. [52] investigated the texture heterogeneity after ECAP processing of pure copper via route C and reported that after two passes a significant variation in the crystallographic texture across the sample thickness was observed and all the textures show shear-type characteristics. This is in agreement with the texture characteristics observed here. Additionally, Mishin and Bowen [53] investigated the texture of ECAP processed copper and reported a strong simple shear texture after equivalent strain of 10.
Figure 11 shows the grain size distribution for the as annealed Cu and after ECAP processed at RT (1-P, 2-Bc and 4-Bc) and at 200 °C (1-P and 4-Bc). It can be observed that the amount of UFG on the collected data was increased after the ECAP process. Figure 12 shows the misorientation angle distribution for the AA commercial pure Cu and after ECAP processed at RT (1-P and 4-Bc) and at 200 °C (1-P and 4-Bc). It can be noted that the amount of the LAGBs was significantly increased by the increase of the number of ECAP passes. Both the high amount of ultrafine grains and the high amount of LAGBs represent the main contributors in the significant improvement the mechanical properties after ECAP processing of commercial pure Cu.

3.3. Mechanical Properties

HV evolution through the LS of the commercial pure Cu processed after 1-P, 2-Bc and 4-Bc at RT was plotted in color-codded hardness contour maps shown in Figure 13. The hardness contours of the AA samples were not displayed because they were essentially homogeneous across the whole sample with an average of HV = 55. Similar plots presented in Figure 14 displays the hardness contour maps for the TS, which revealed that the strain hardening was the highest at the corner and peripheral regions and decreased towards the central regions. From Figure 13, it can be clearly observed that there is a compelling increase in the HV after the first pass and then a slight increase with the increase of passes. These findings are in a good agreement with the earlier studies [1,56]. On the other hand, the first pass ECAPed samples showed the most heterogeneous structure and this behavior was lessened at the following passes. Similar behavior was revealed as shown in Figure 14 for the hardness distribution along the ECAPed samples’ TS. From Figure 13 and Figure 14, the lowest hardness values were noticed at the central region of the ECAPed sample, and then the hardness values increased radially. It is worth mentioning here that, 1-P (Figure 13a) yielded higher hardness values at the upper part of the rod when put in comparison with the lower parts, which concurred with the findings from the billets ECAPed via either 2-Bc or 4-Bc, as shown in Figure 13. This could be explained by contact with the applied pushing force from the plunger, which yielded comparably higher hardness values at the top part. Accordingly, the hardness findings in a good correlation with the FE analysis shown in Figure 4, where the maximum imposed strain were depicted in the peripheral areas resulting in more strain hardening and led to increasing the hardness compared to the central regions.
Accordingly, from Figure 13 it is clear that higher hardness values were recorded at the periphery areas of the top surface of the billets’, which diminished toward the center and the bottom parts. The hardness values varied, reaching 126 HV at the sample top peripheral zone and decreasing up to 108 HV at the sample bottom central area. It was observed that the relative uniformity of the billets’ hardness was raised along the LS when processed via 2-Bc (Figure 13b), compared to the first pass, this increase was manifested from the peripheries to the centre of the rod, with hardness values varying, showing 115 HV at the center and increasing to 129 HV at the peripheries. Increasing the processing passes up to 4-Bc resulted in a significant increase in the hardness values. The recorded results revealed increasing the hardness value up to 158 HV in the top peripheral areas while the hardness value in the central zone increased to 127 HV (Figure 13c). Table 3 lists the average hardness values measured at the peripheral and central regions and the mechanical properties of the AA billets before and after ECAP.
In addition, as shown in Figure 14, processing via 1-P revealed 96% and 125% rises in the hardness values at the center and peripheries, respectively, when put in comparison with the AA condition. This invariably implies that the distribution of hardness values has a large degree of inhomogeneity across the transverse section of the rod (Figure 14a). However, the hardness homogeneity of the billets across their transverse section correlated with the number of passes as shown in Figure 14b,c. Processing through 2-Bc showed increase in the recorded hardness results up to 7%, and 5% in the central and peripheral areas, respectively compared to the 1-P condition. Additionally, 4-Bc correlated with rises in hardness values across the center and peripheries by 16.6% and 29% respectively, when compared with the 1-P condition.
Figure 15 and Figure 16 show the hardness distribution of ECAPed Cu billets processed at 200 °C through 1-P and 4-Bc along the sample’s LS and TS. There was a visible enhancement in hardness homogeneity along the LS that occurs due to ECAP processing at 200 °C as shown in Figure 15 compared to RT processing (Figure 13). The hardness homogeneity between the central and peripheral regions in the LS showed an increase of 22% after being processed through 1-P at 200 °C (Figure 13a), compared to the sample processed through the same route (1-P) at RT, which concurs with [43]. The hardness homogeneity between the central and peripheral regions showed an increase of 50% compared to the counterparts processed at RT when the strain was increased up to 4-Bc, which agrees with [42]. A similar trend was visible in the hardness contour maps of the sample TS as shown in Figure 16. The uniform hardness distribution can be attributed to the higher strains achieved by processing multiple passes, which led to the stabilization of the sample’s internal structure [21]. When processed at RT, the strain accumulating in the sample was higher, which resulted in a drastic increase in hardness, accompanied by the sample’s heterogeneity being marginally improved. The samples processed through 1-P at 200 °C showed an increase in the hardness uniformity from the central region (102 HV) to the peripheral regions (116 HV), shown in Figure 13. The sample processed through 4-Bc showed a slight variation of hardness values between the center (113 HV) and the peripheral regions (128 HV).
From examining Figure 15a, a trend emerged concerning hardness values. The highest hardness values were recorded at the top of the sample near the edges. From there, we noticed that their values decrease vertically until the bottom edges. The data confirm this, as hardness values of 116 HV were recorded left and right of the disc section’s longitudinal axis, decreasing to 102 HV as we moved toward the disc center; the lowest hardness value was 100.5 HV, recorded at the bottom central area (Figure 13a).
The samples that went through 4-Bc processing showed a distribution of microhardness values, which were symmetrical on either side of the longitudinal central axis; Figure 15b illustrates this. Moreover, the hardness values seemed to become more homogenous as we increased the number of passes, meaning that the 4-Bc samples had the highest microhardness distribution homogeneity (Figure 15b). So, as stated, the 4-Bc processing, at 200 °C, resulted in a more highly uniform hardness distribution. The HV values recorded from the LS of the sample range from 128 HV near the rod’s peripheries to 111 HV at the bottom of the central axis. A similar trend was noticed in the hardness distribution of the TS of both the ECAPed samples processed through 1-P (Figure 16a) and that processed through 4-Bc (Figure 16b) at 200 °C as more homogenous distribution of the hardness values from the ECAPed samples central to peripheral regions can be depicted.
It is worth mentioning here that the observed surge in hardness at the peripheral regions in comparison with the center is due to the friction between the rod and ECAP die walls [57]. The rod’s cross section impacted the strain imposed on the billets, increasing the strain inhomogeneity’ degree with the increase of the cross section; where the peripheries had higher strain while the center of the rod had lower strain. Accordingly, the enhancement in the hardness values after ECAP processing can be attributed to the strain accumulation through increasing the number of processing. It is worth mentioning here that ECAP processing is usually accompanied with production, multiplication and locking of dislocations processes, which results in the formation of LAGBs and HAGBs and, finally, the formation of UFG materials. In addition, it is commonly known that for the materials with moderate SFE such as Cu, twining is an important deformation mechanism, which resulted in grain refinement in addition to the dislocation slip during ECAP processing. Accordingly, the UFG structured yielded from ECAP processing inhibits dislocation glide thus leading to strengthening the material according to the Hall–Petch equation [58,59]. As mentioned above, it is reasonable to conclude that the strengthening of ECAP samples is generally thought of as the refinement of grains, formation of twins and accumulation of dislocations [12]. These hardness findings show good agreement with the developed EBSD maps in Figure 7 and with the pole figures shown in Figure 9. Indeed, the EBSD observation showed that processing through ECAP via multiple passes led to increasing the percentage of UFG (<1 μm) up to 33% as shown in Figure 7. In addition, the increase of the percentage of LAGBs and HAGBs after ECAP as shown in Figure 6, Figure 7 and Figure 8, processing hindered the mobile dislocations effectively. Hence, the refined grains make a significant contribution to improved hardness.
Table 3 shows the tensile properties of both the AA and ECAPed Cu samples. Tensile testing showed that the ECAPed samples had higher yield strength (YS) and ultimate tensile strength (UTS) than the AA samples. This increase in YS and UTS came at the expense of reduced ductility. These properties are expected since the samples underwent refinement in grain size and a relative increase in HAGBs [60,61] as the number of passes increased; the recorded increase in HV, YS and UTS values after being processed via ECAP confirm this. As observed in Table 3, 1-P processing results in higher YS and UTS, processing any further resulted in a gradual increase in YS and UTS, which agrees with the results of [62]. Drastic increases of (129.5%) and (76%) in YS and UTS, respectively, were noticed after processing through 1-P at RT, alongside a reduction of 39% in the ductility, compared to the AA samples. However, the tensile properties exhibited from 1-P revealed insignificant change when the sample was processed further up to 4-Bc at RT. Table 3 shows that there was not any evident difference in YS, or UTS between the 1-P warm processed samples and 1-P RT processed samples where the YS, UTS and ductility had improved by 4.2%, 0.8% and 4.7%, respectively. The tensile properties of the 200 °C processed 4-Bc samples showed 7.35% increase in the YS coupled with 13.3% and 5% reduction in the UTS and ductility, respectively, compared to the sample processed through 4-Bc at RT. These results are consistent with the outcomes of a recent study [13,60]. These findings confirm that the warm processing conditions still favor the material strength increase until the first pass [61]. On the other hand, the subsequent decrease of strength in further warm ECAP passes can be explained by the occurrence of dynamic recovery and discontinuous dynamic recrystallization, which leads to the elimination of dislocations [61].

4. Conclusions

In this study, the effect of ECAP processing on the microstructural evolution, crystallographic texture and hardness variation of commercial purity Cu processed at RT and 200 °C for up to 4 passes of route Bc was comprehensively investigated. The following conclusions can be drawn:
  • The FE numerical model revealed that processing via 1-P of pure copper experienced a max effective strain of about 0.74.
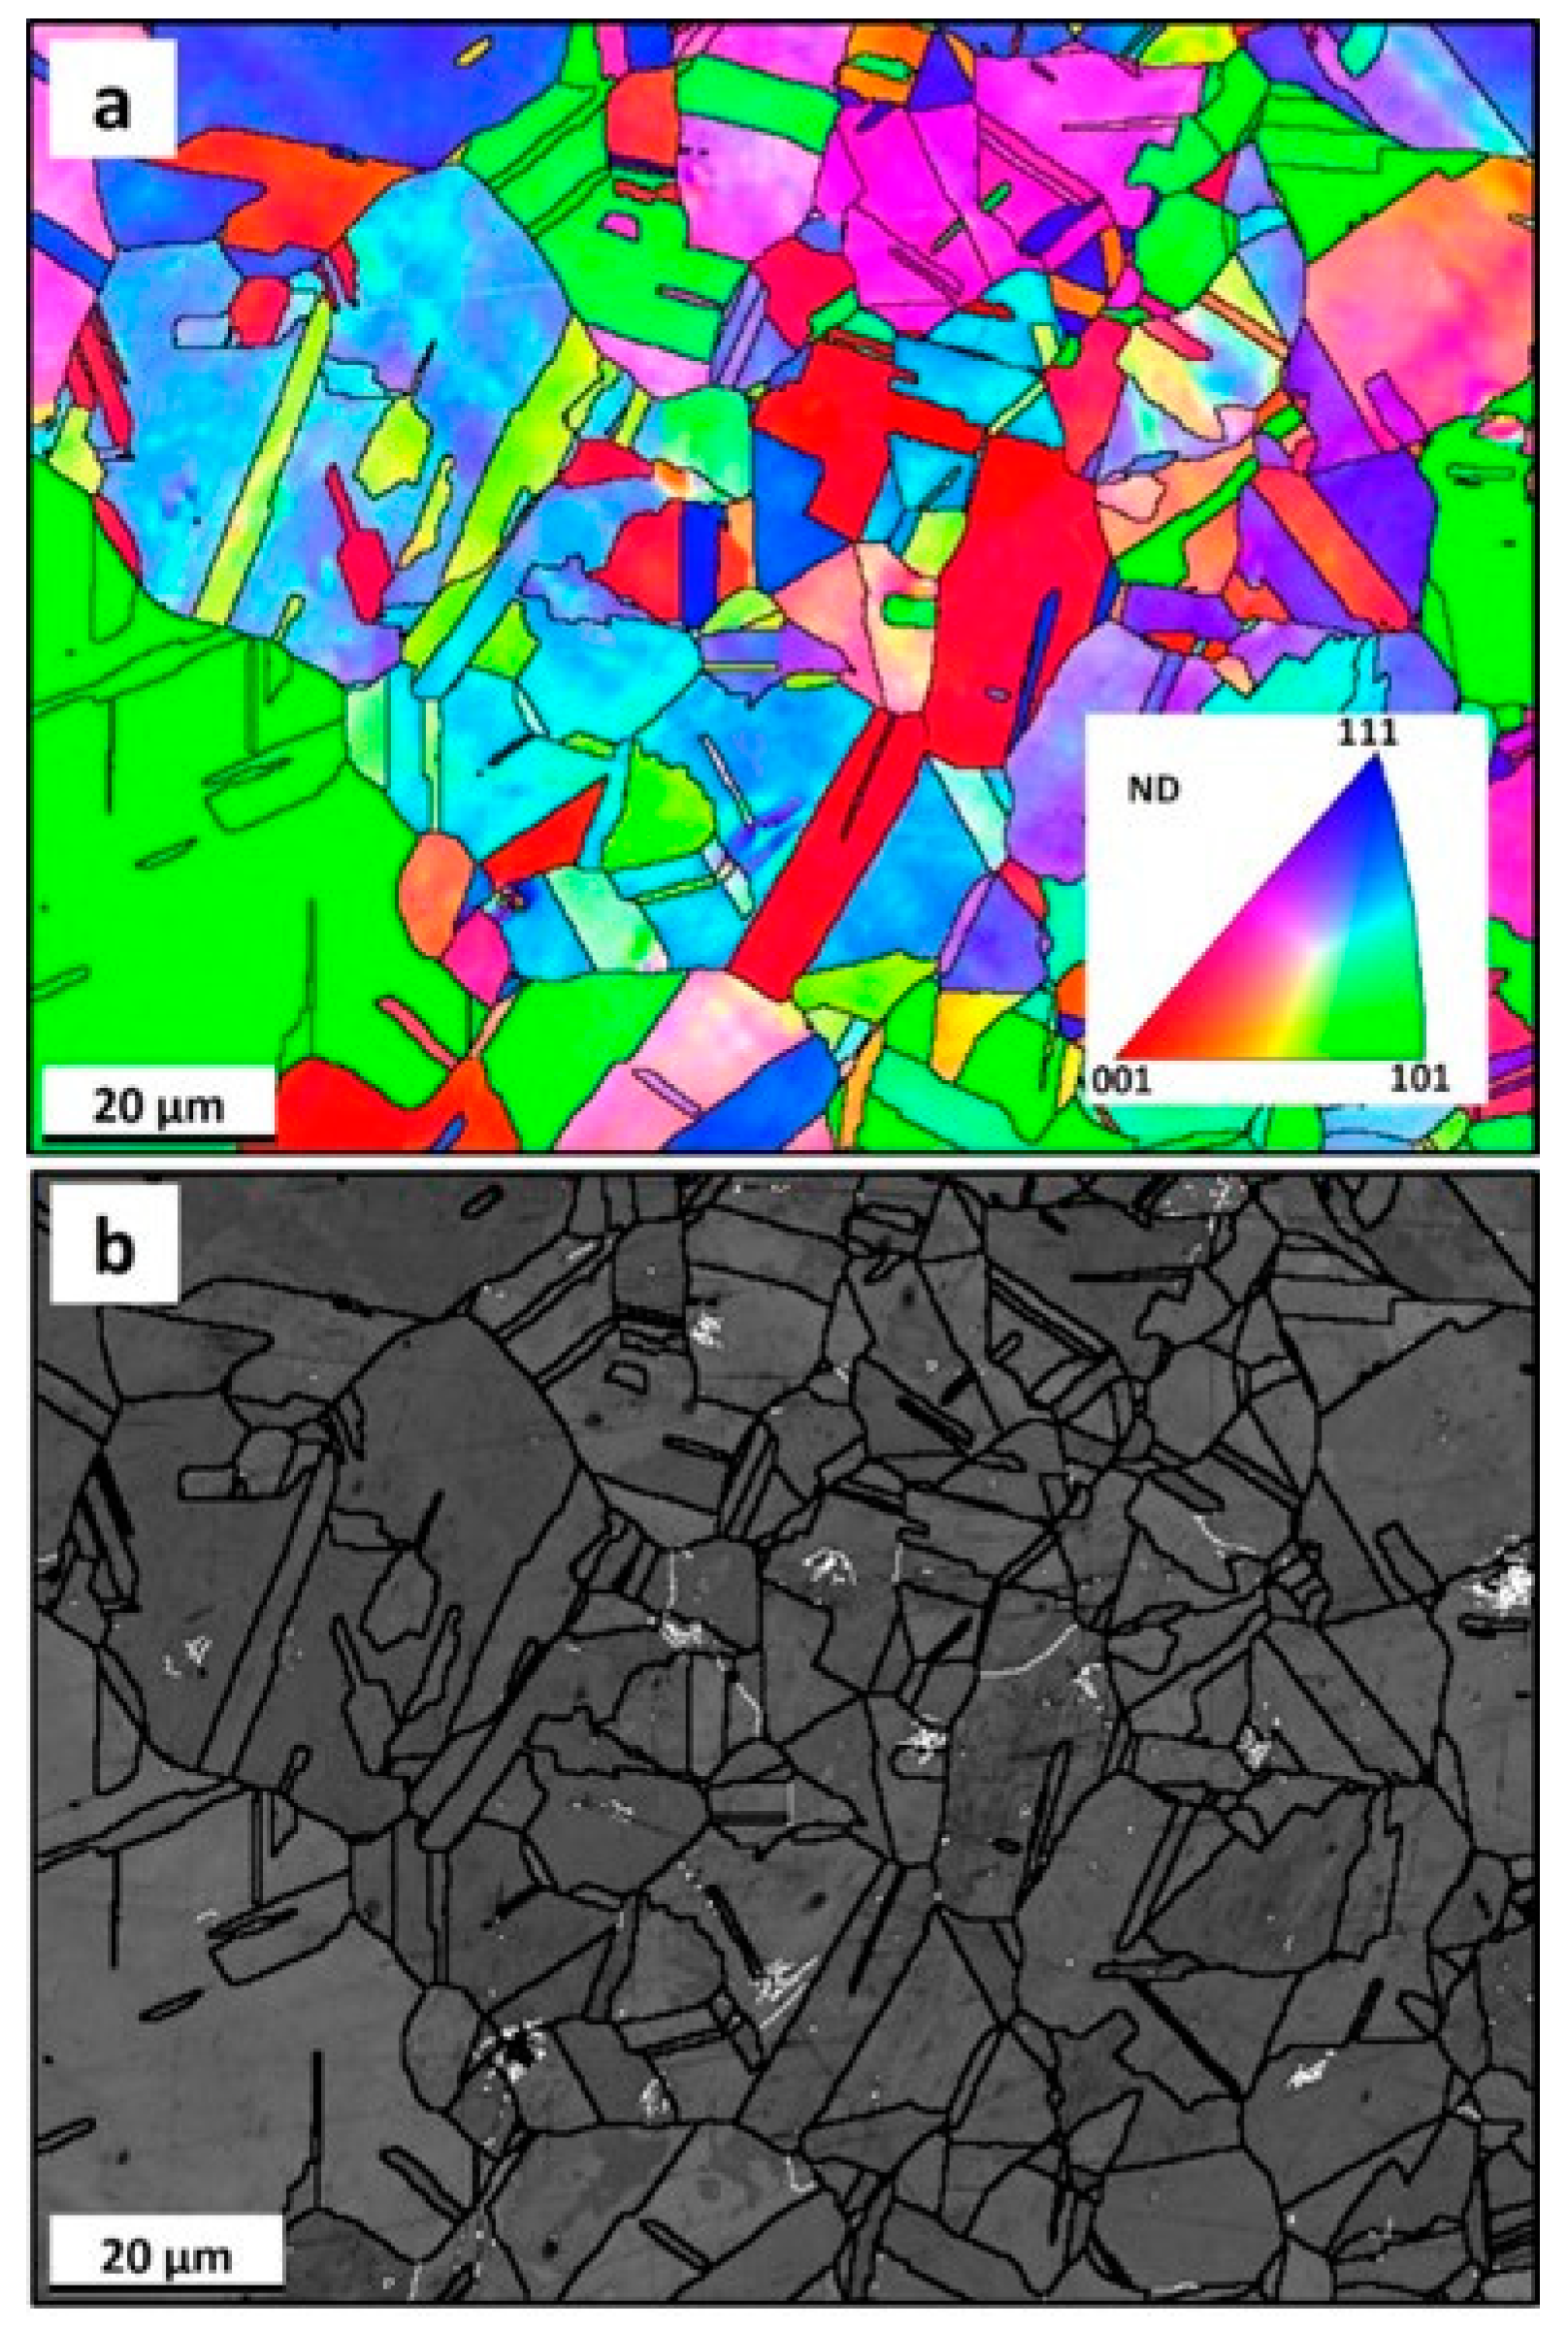
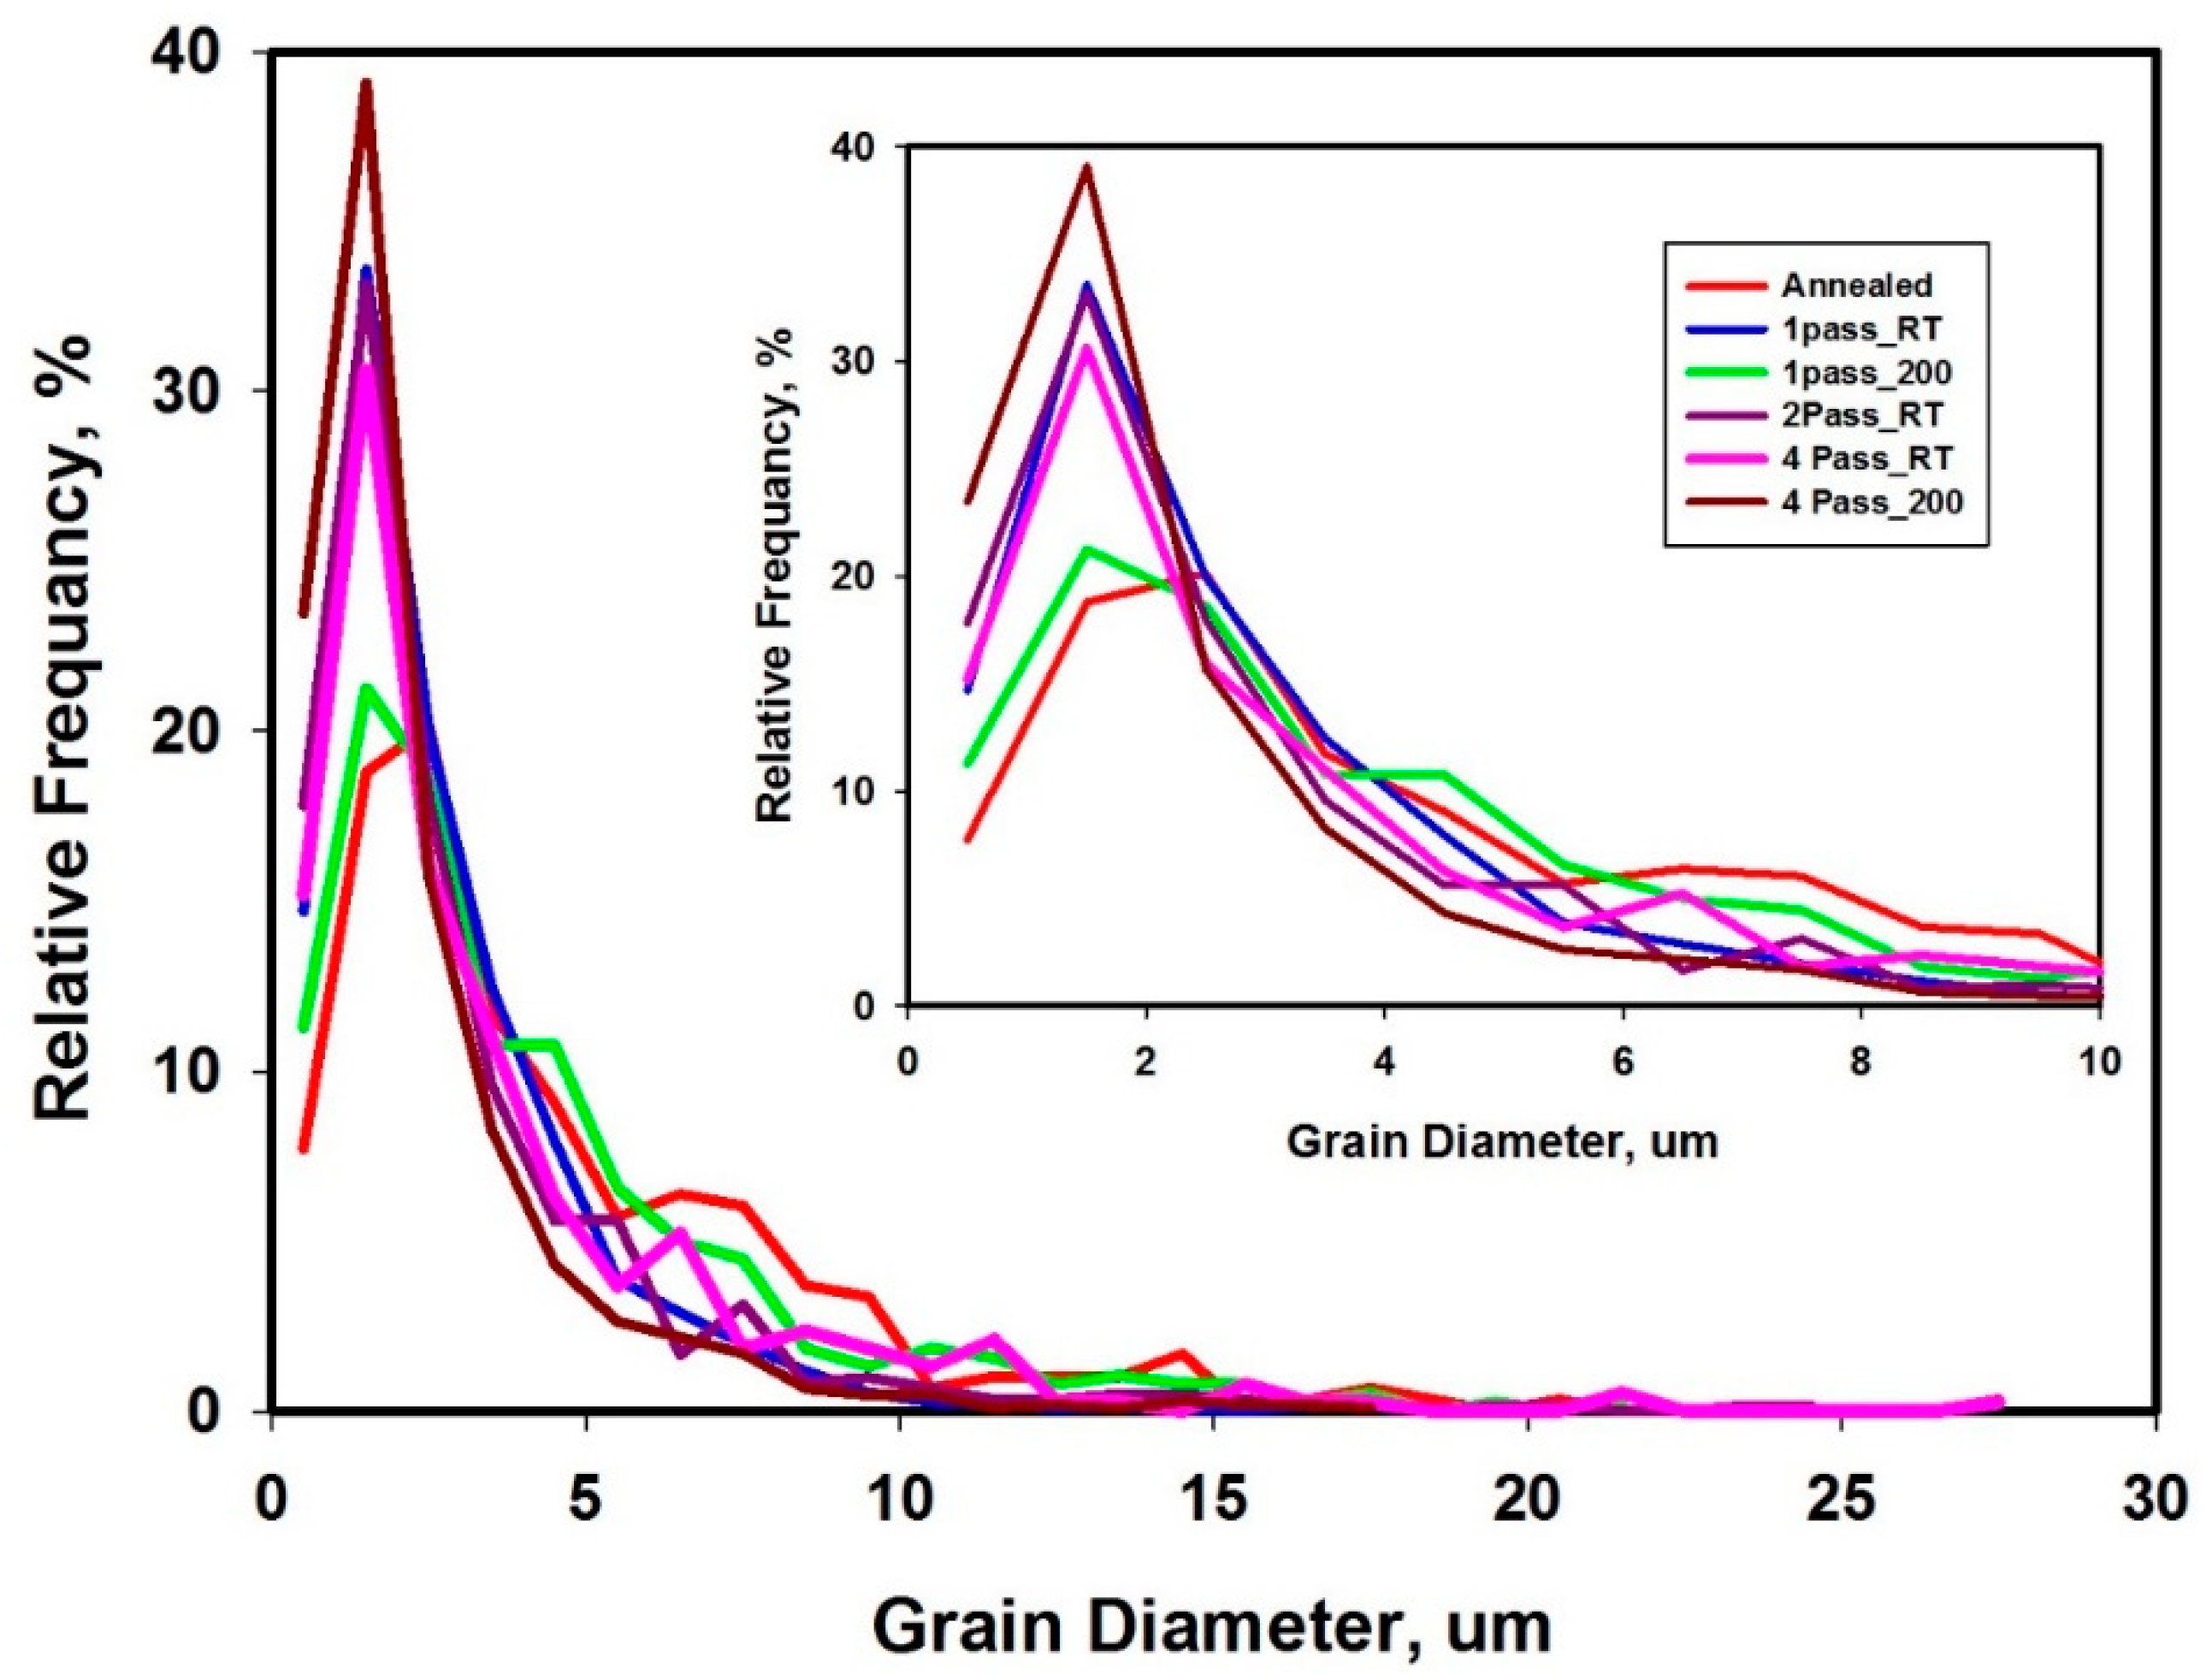
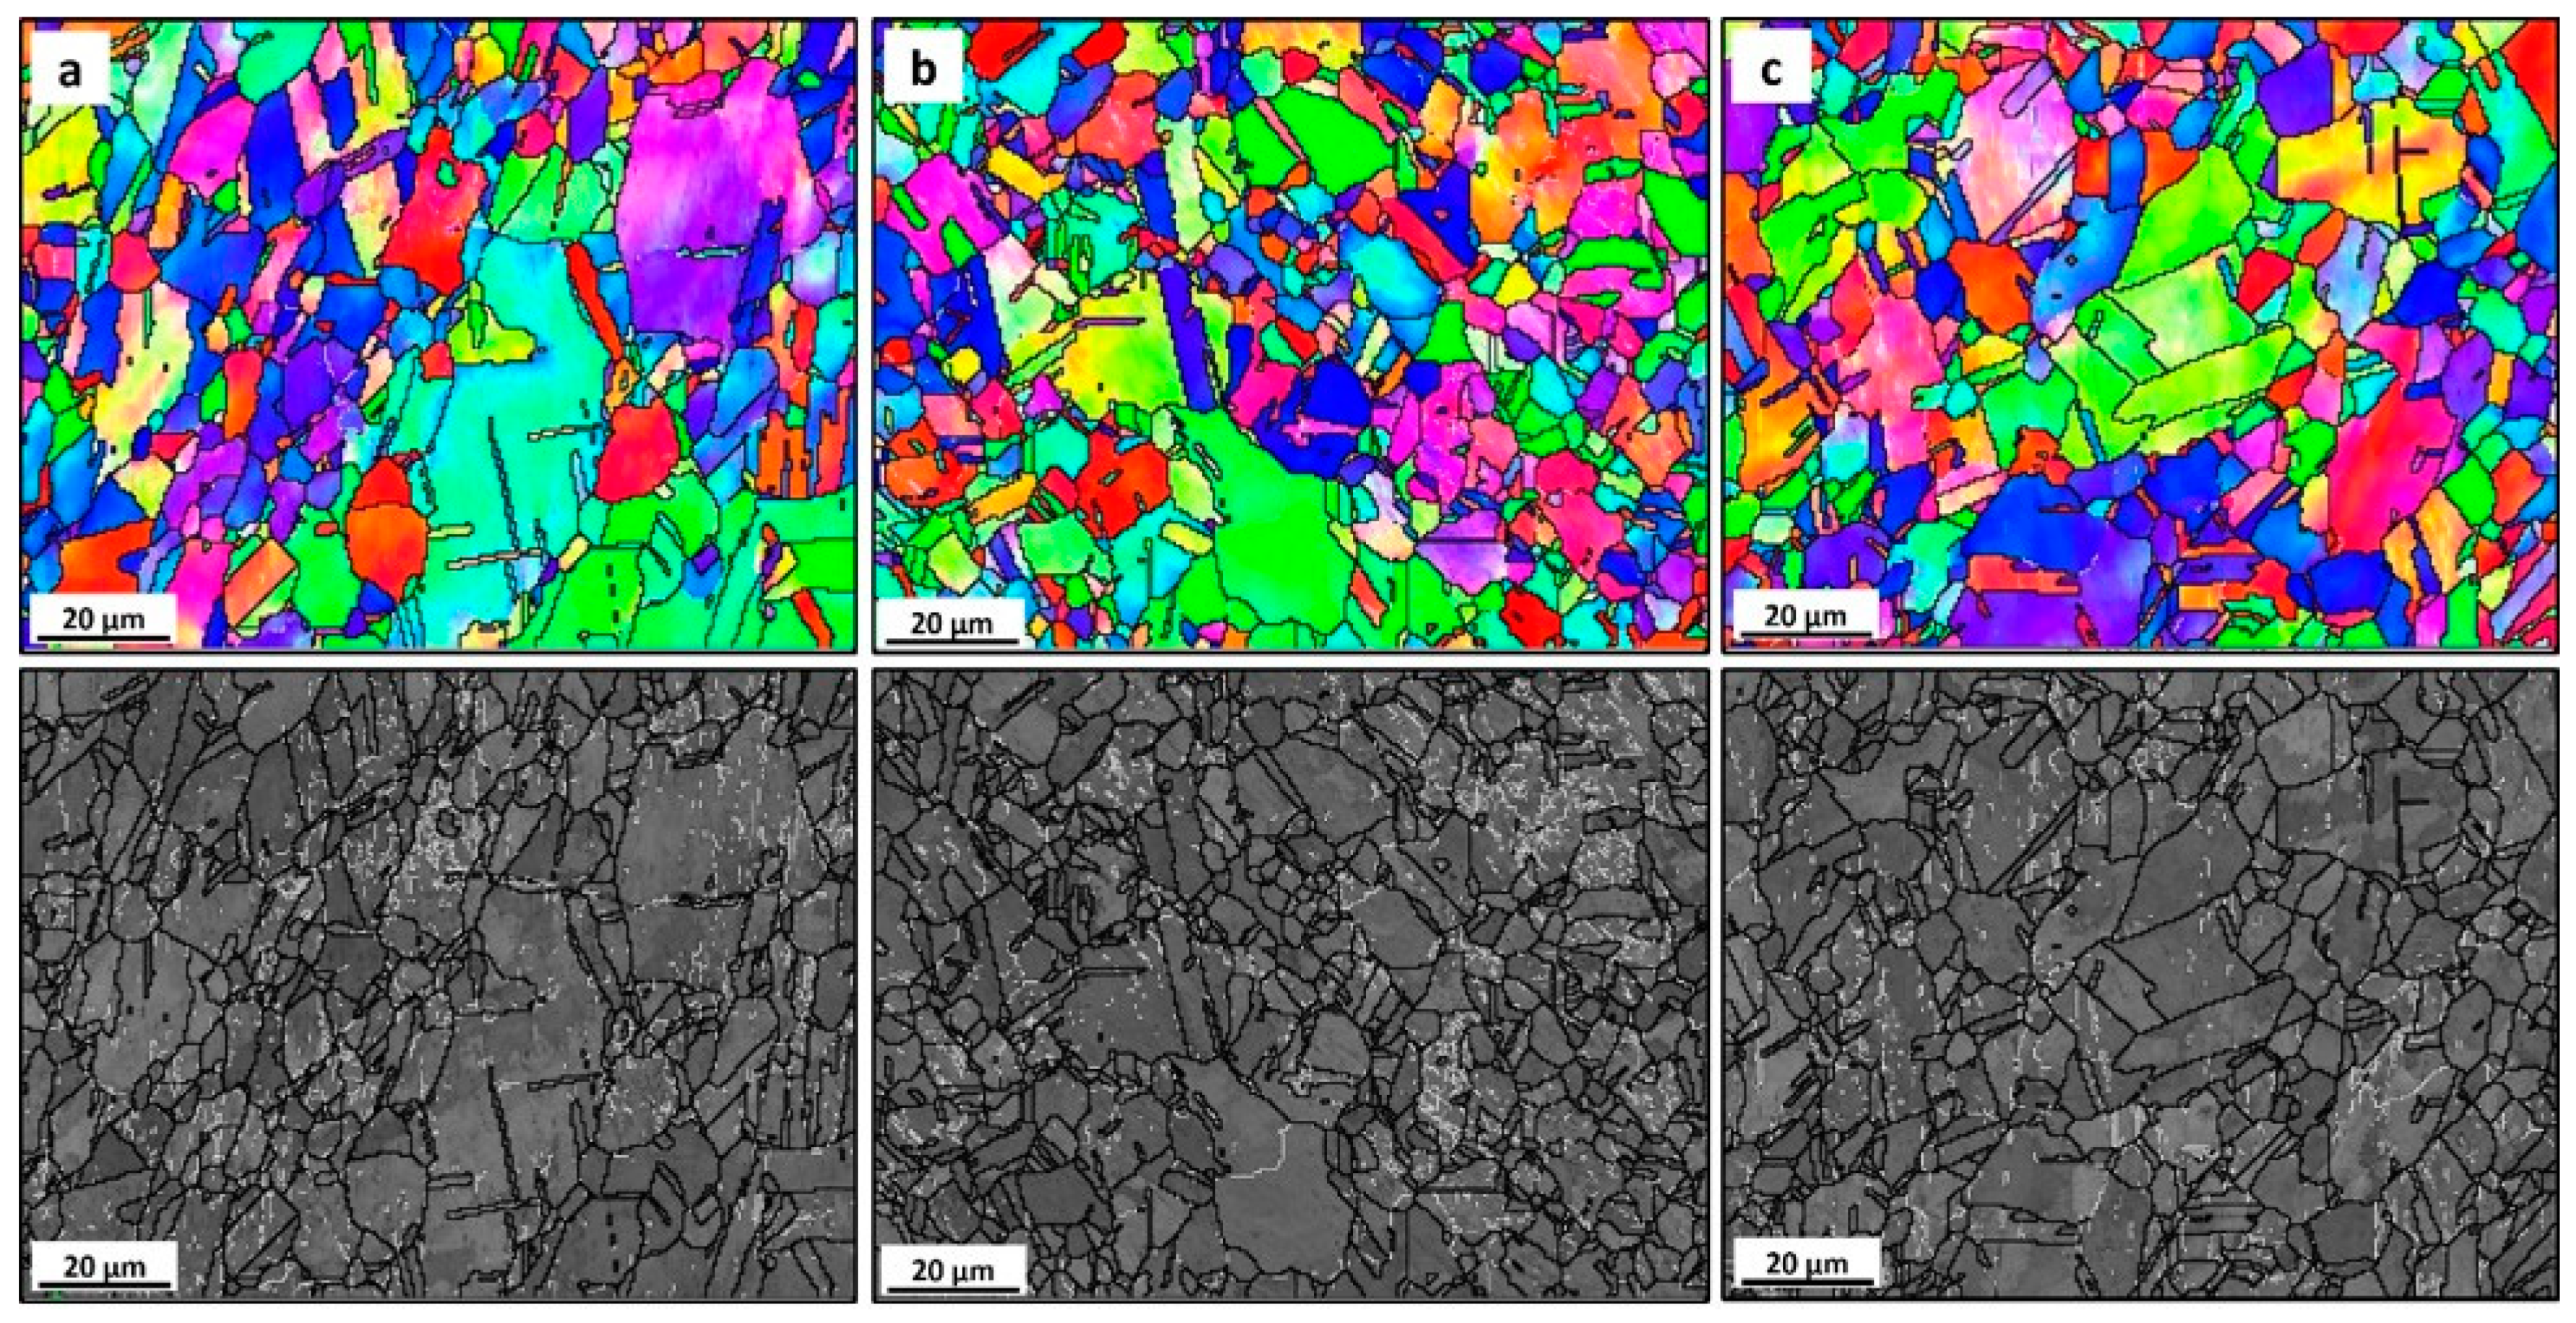
  • The microstructure obtained after 1-P exhibited finer equiaxed grains down to submicrons with a significant increase in the high angle boundaries, the substructures and high density of twin boundaries.
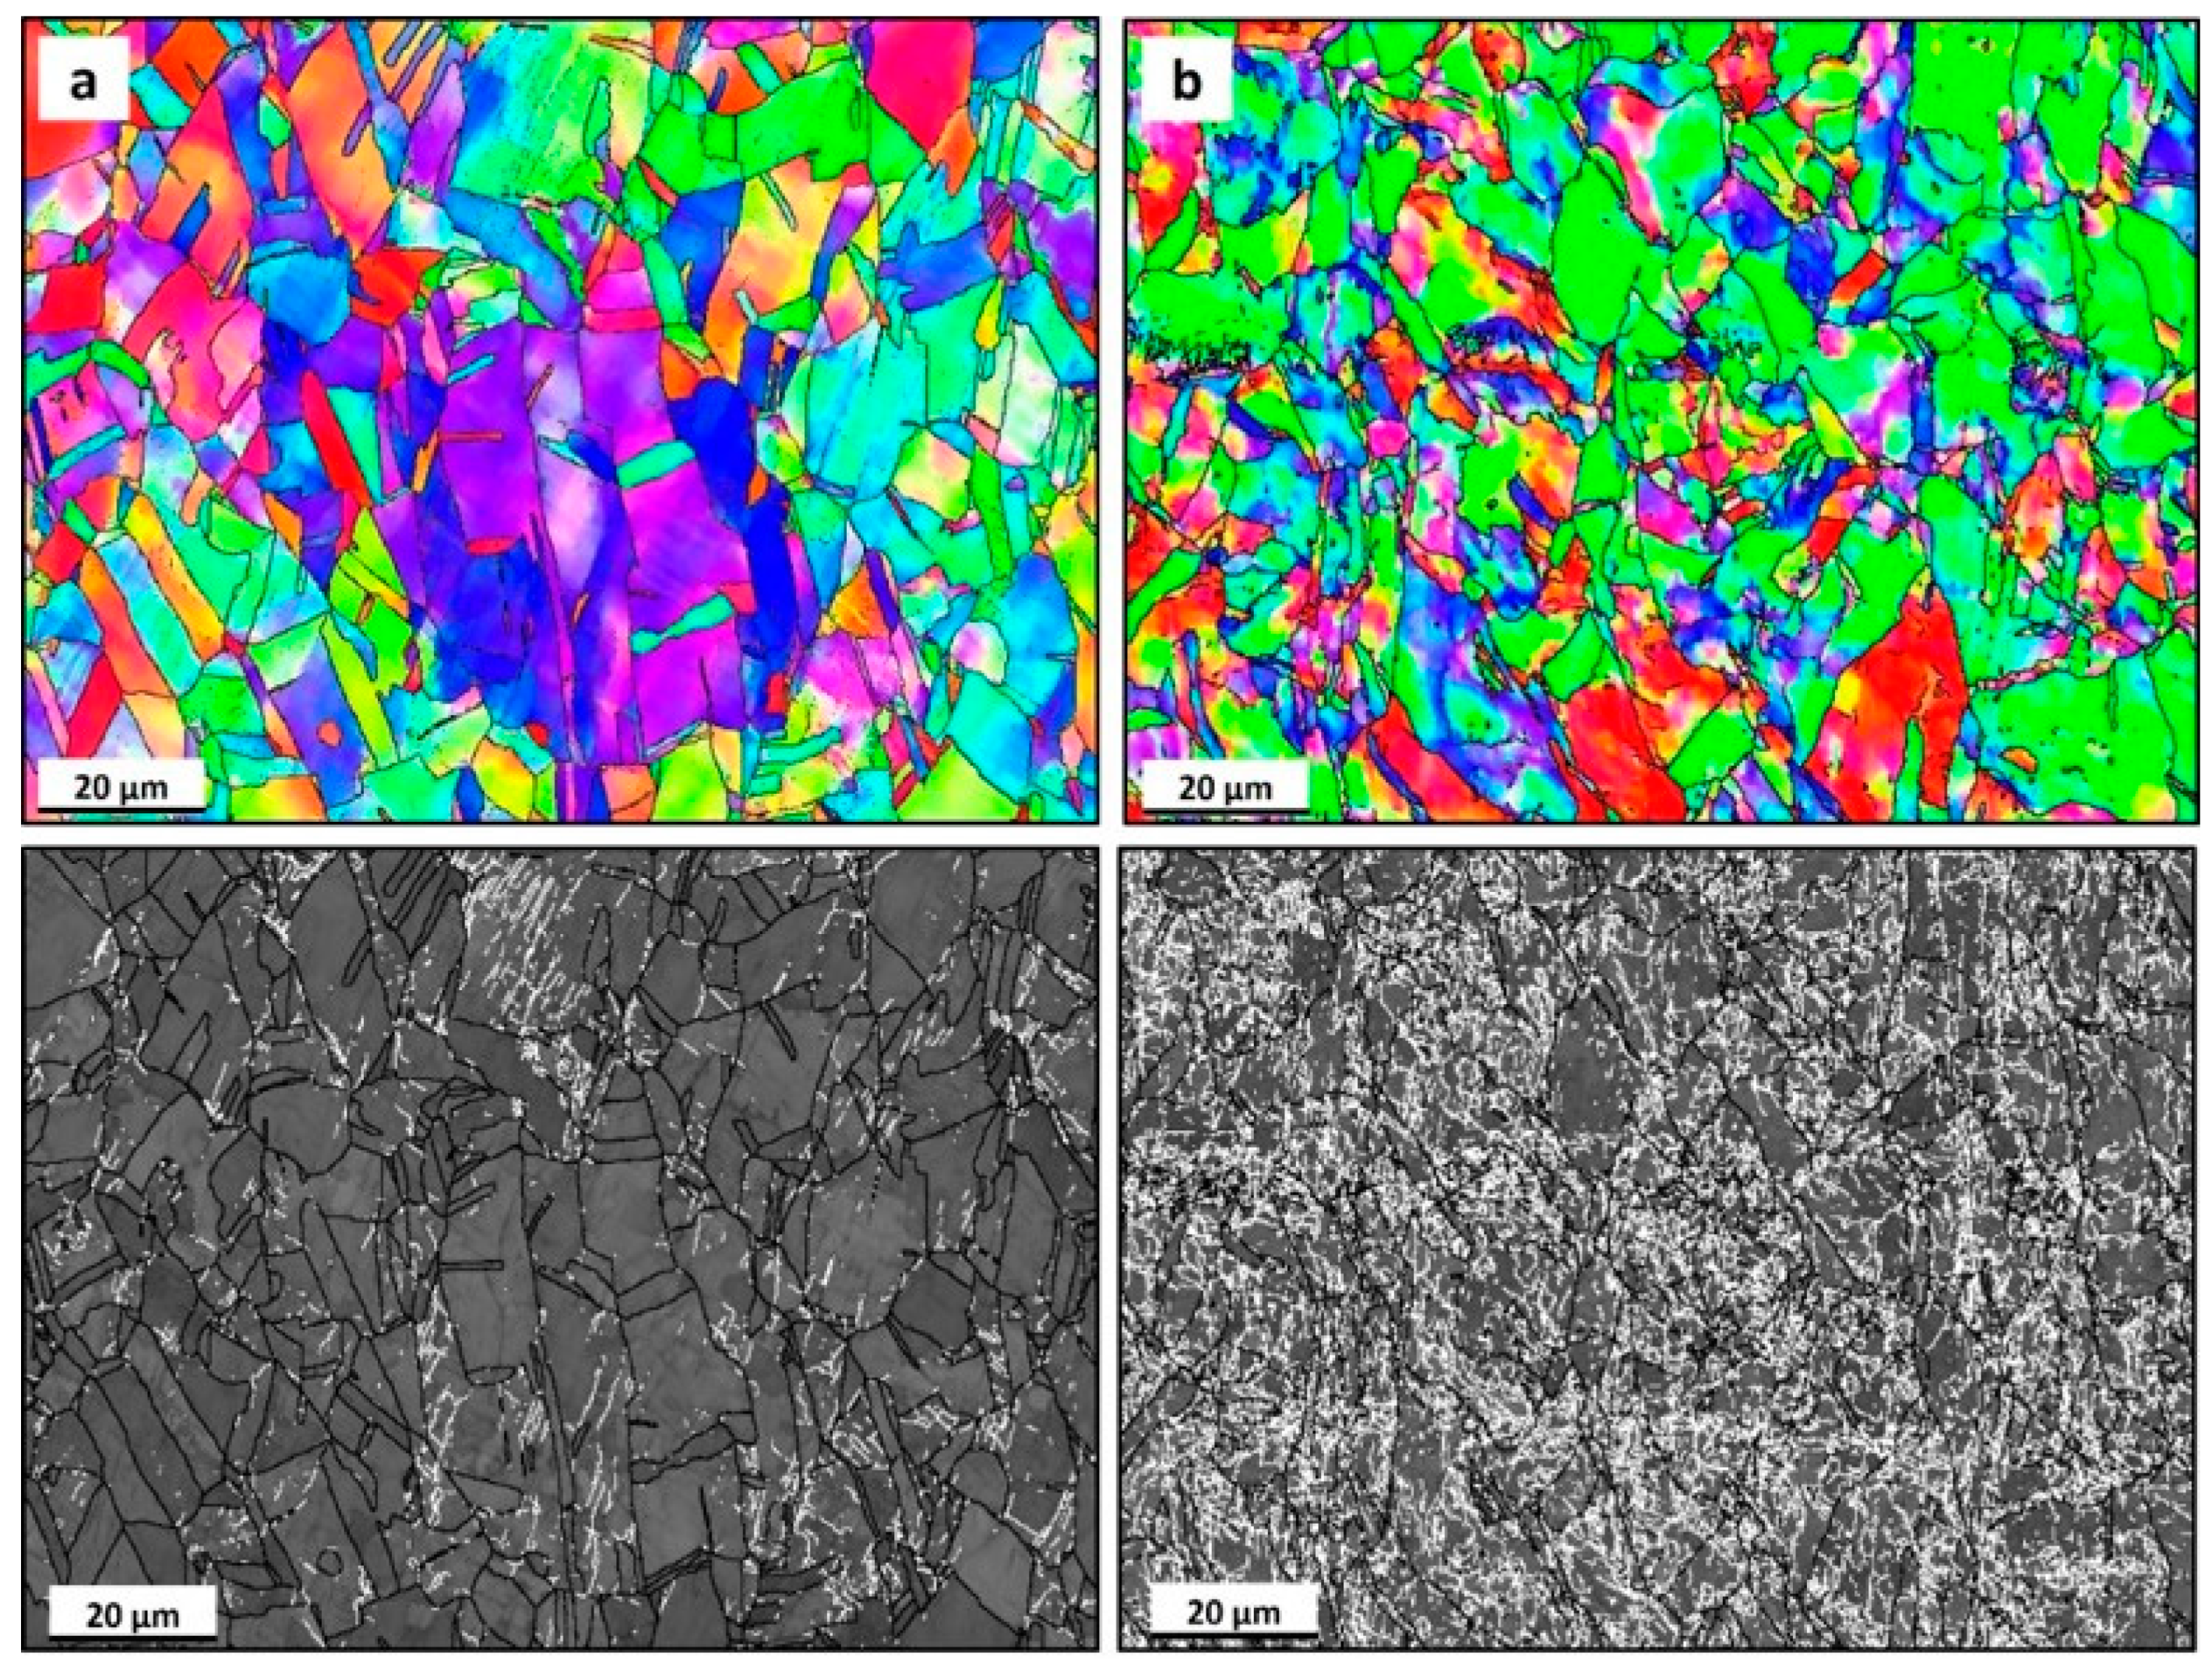
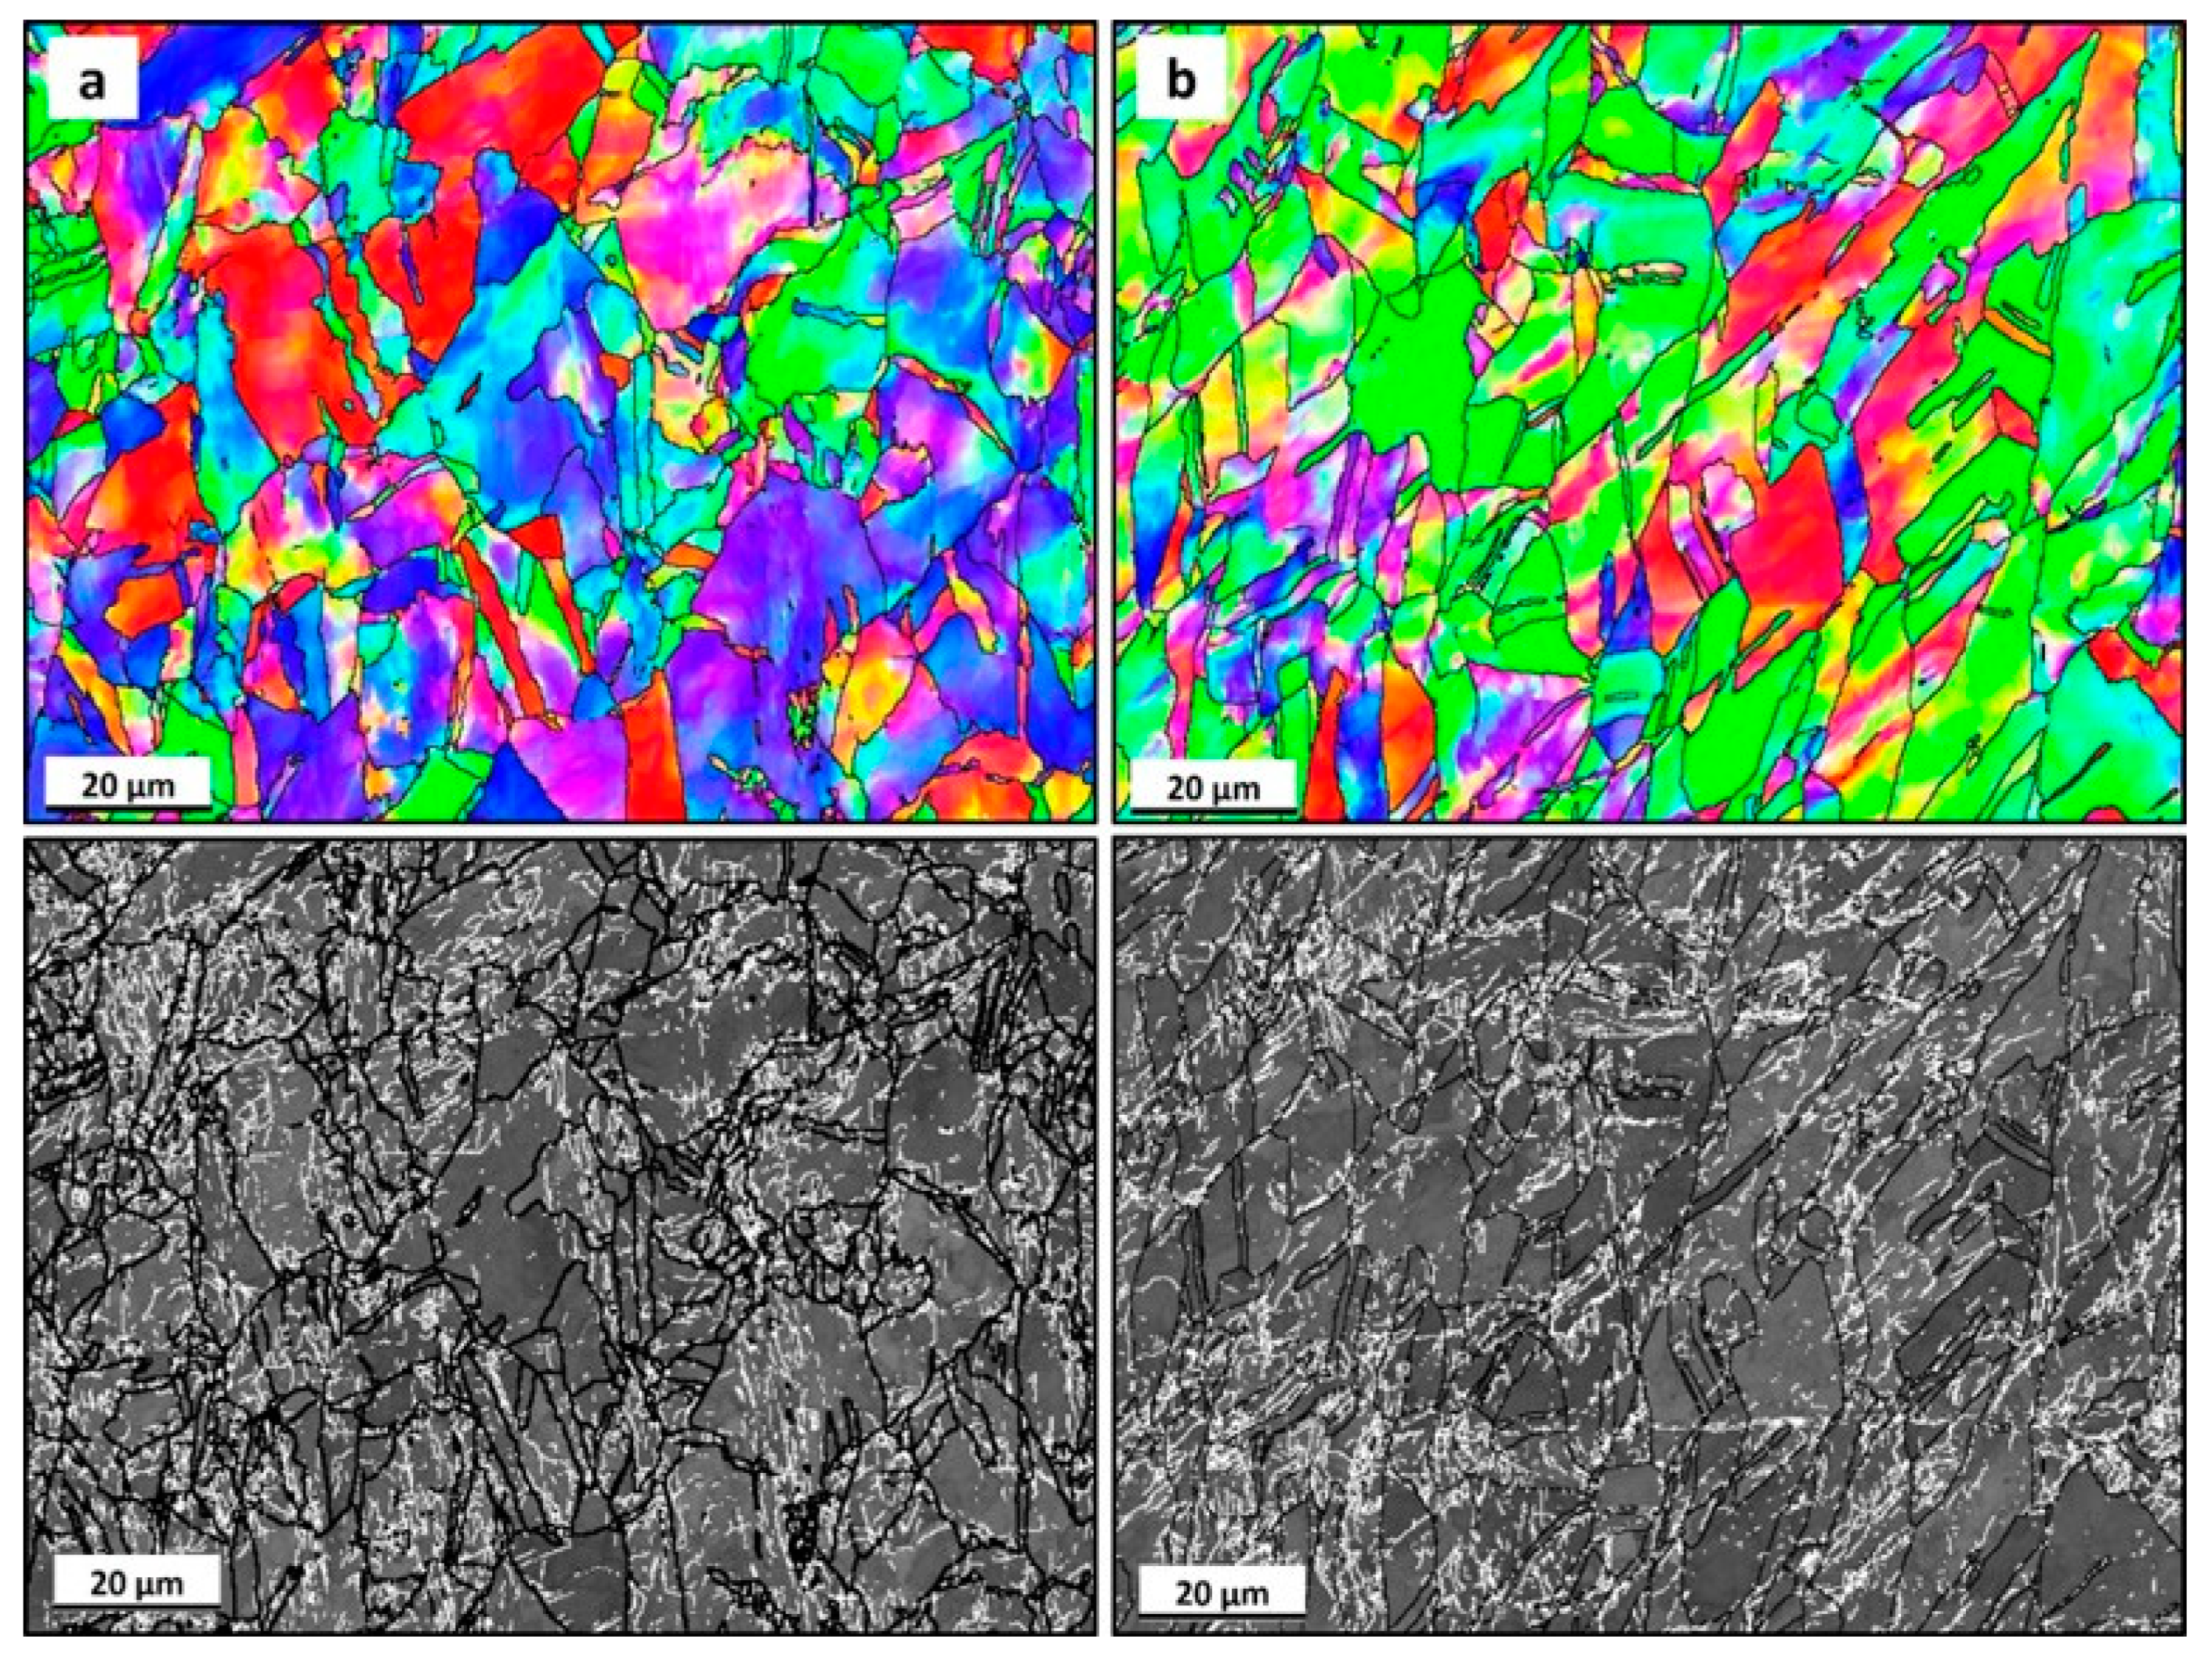
  • The microstructure was homogenous through the sample cross section and increasing the imposed strain up to 4-Bc had resulted in an increase of the deformed microstructural features.
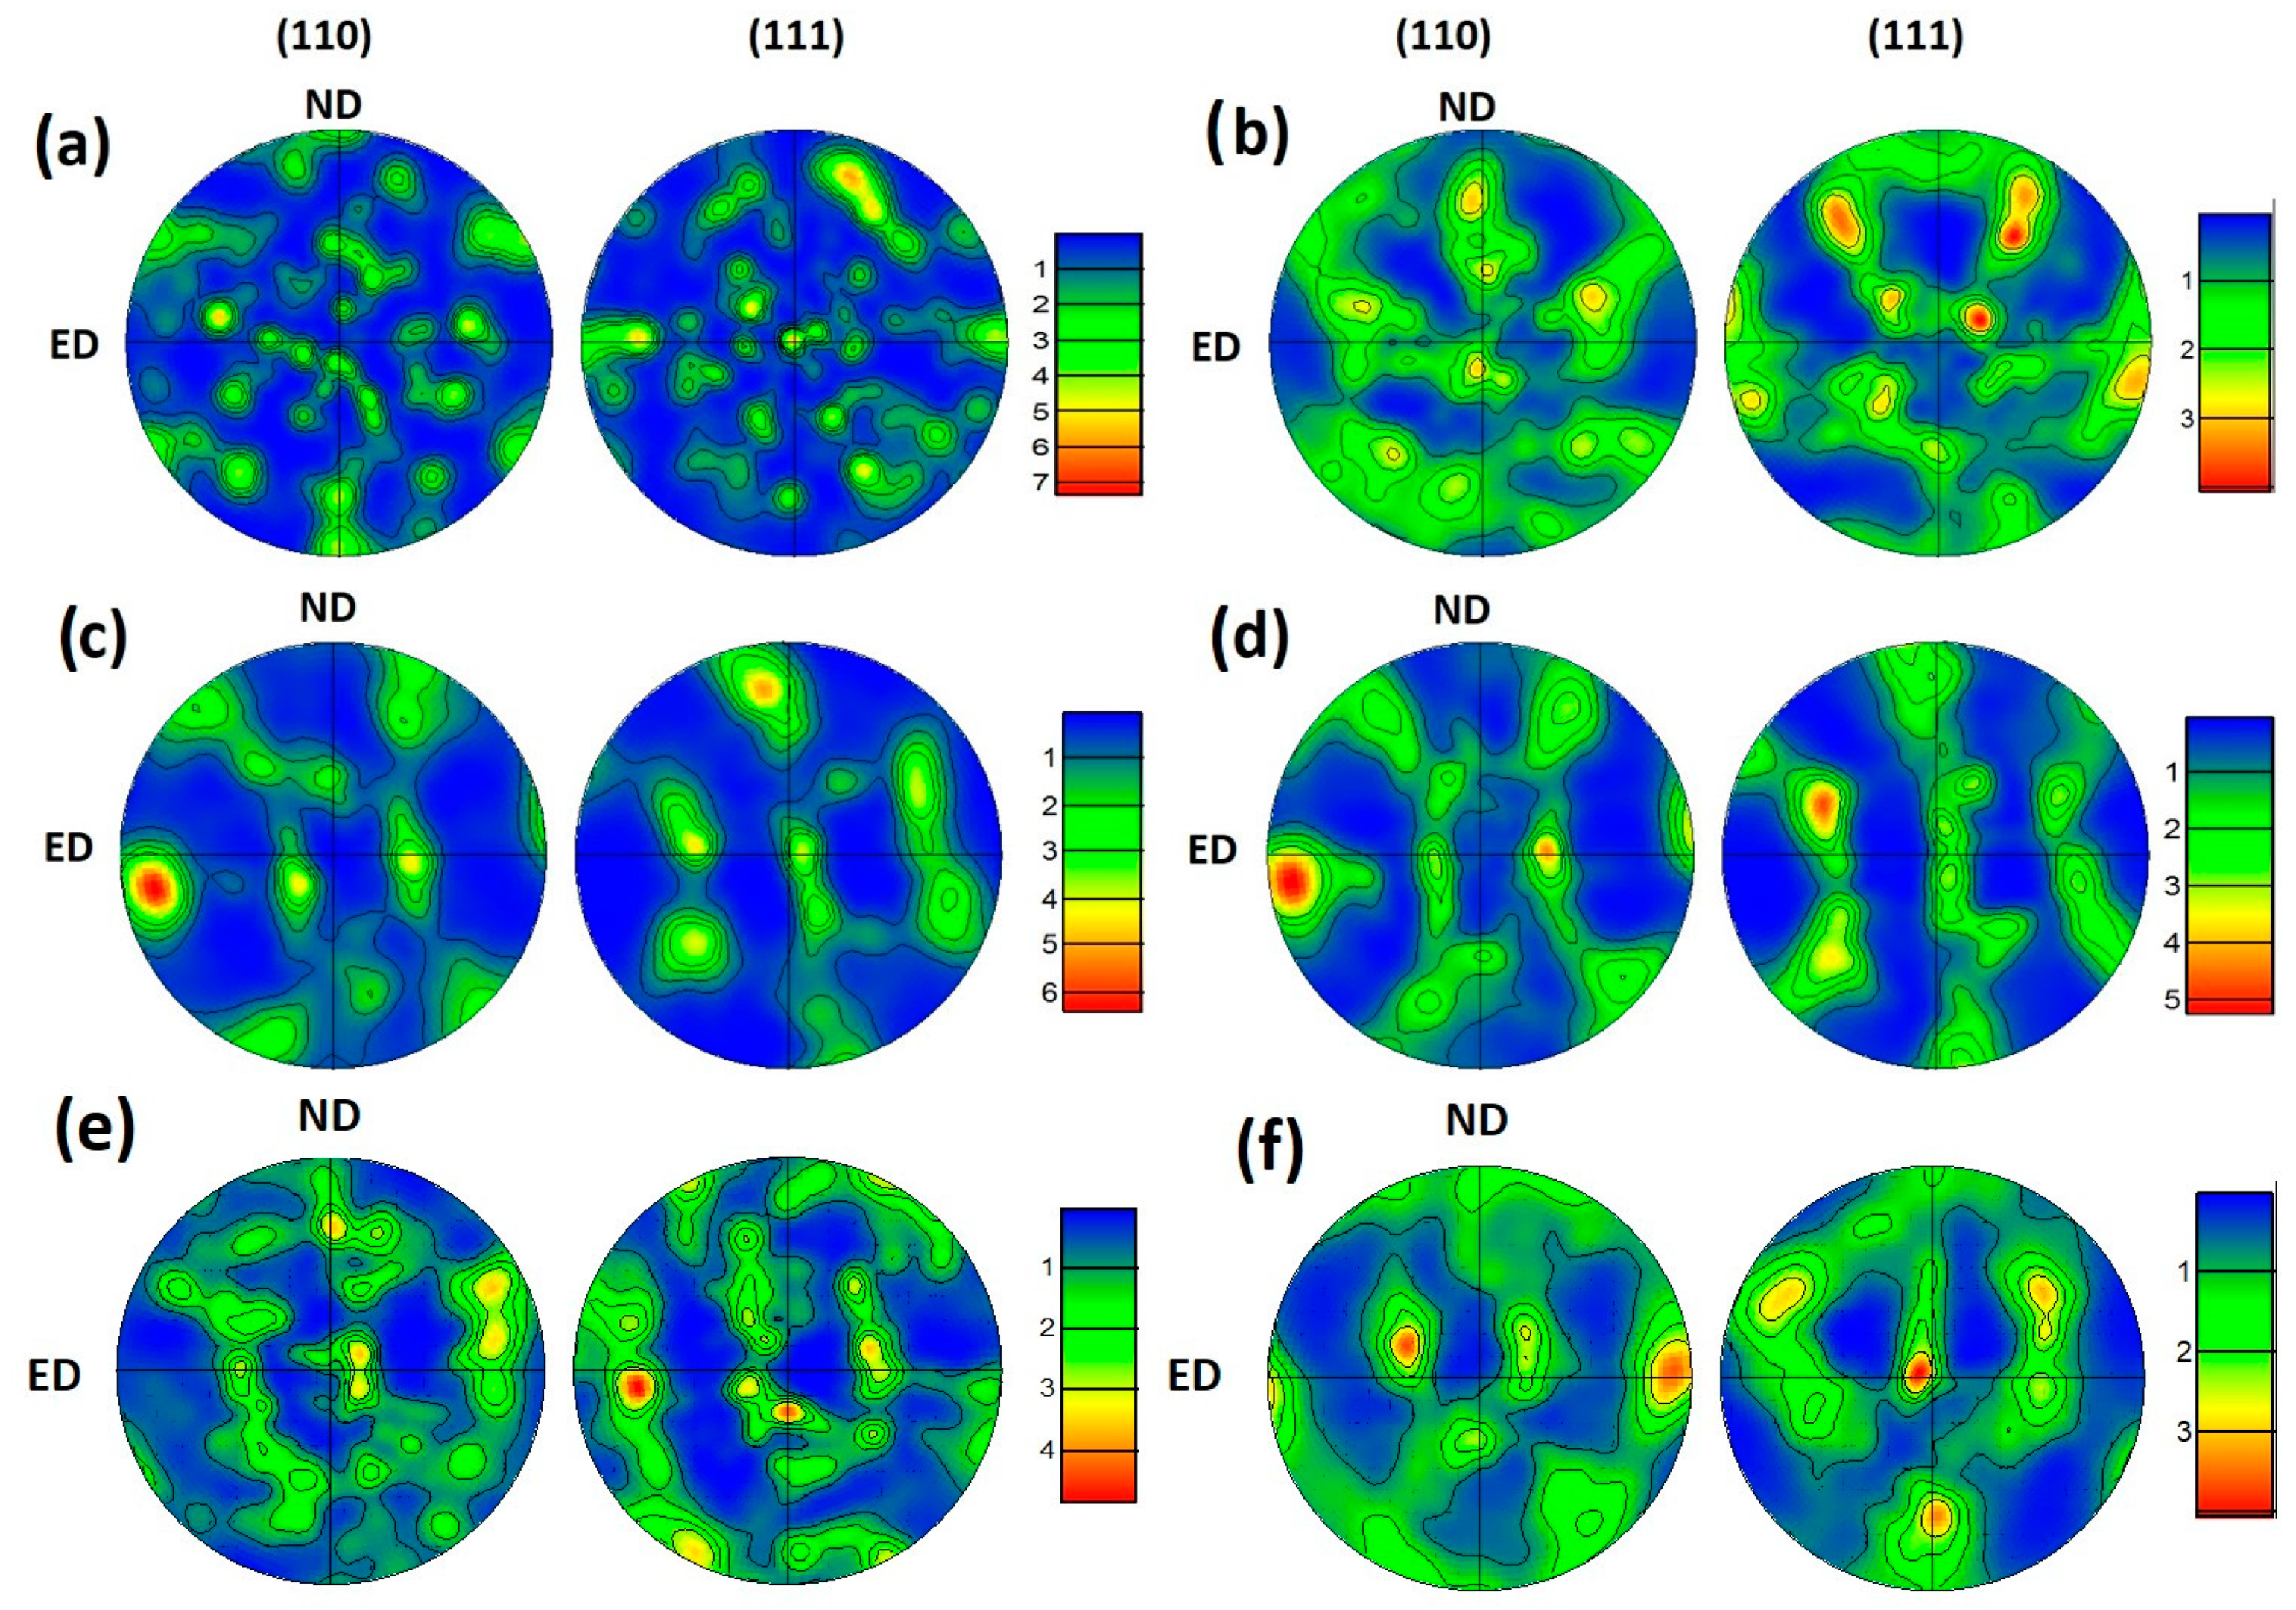
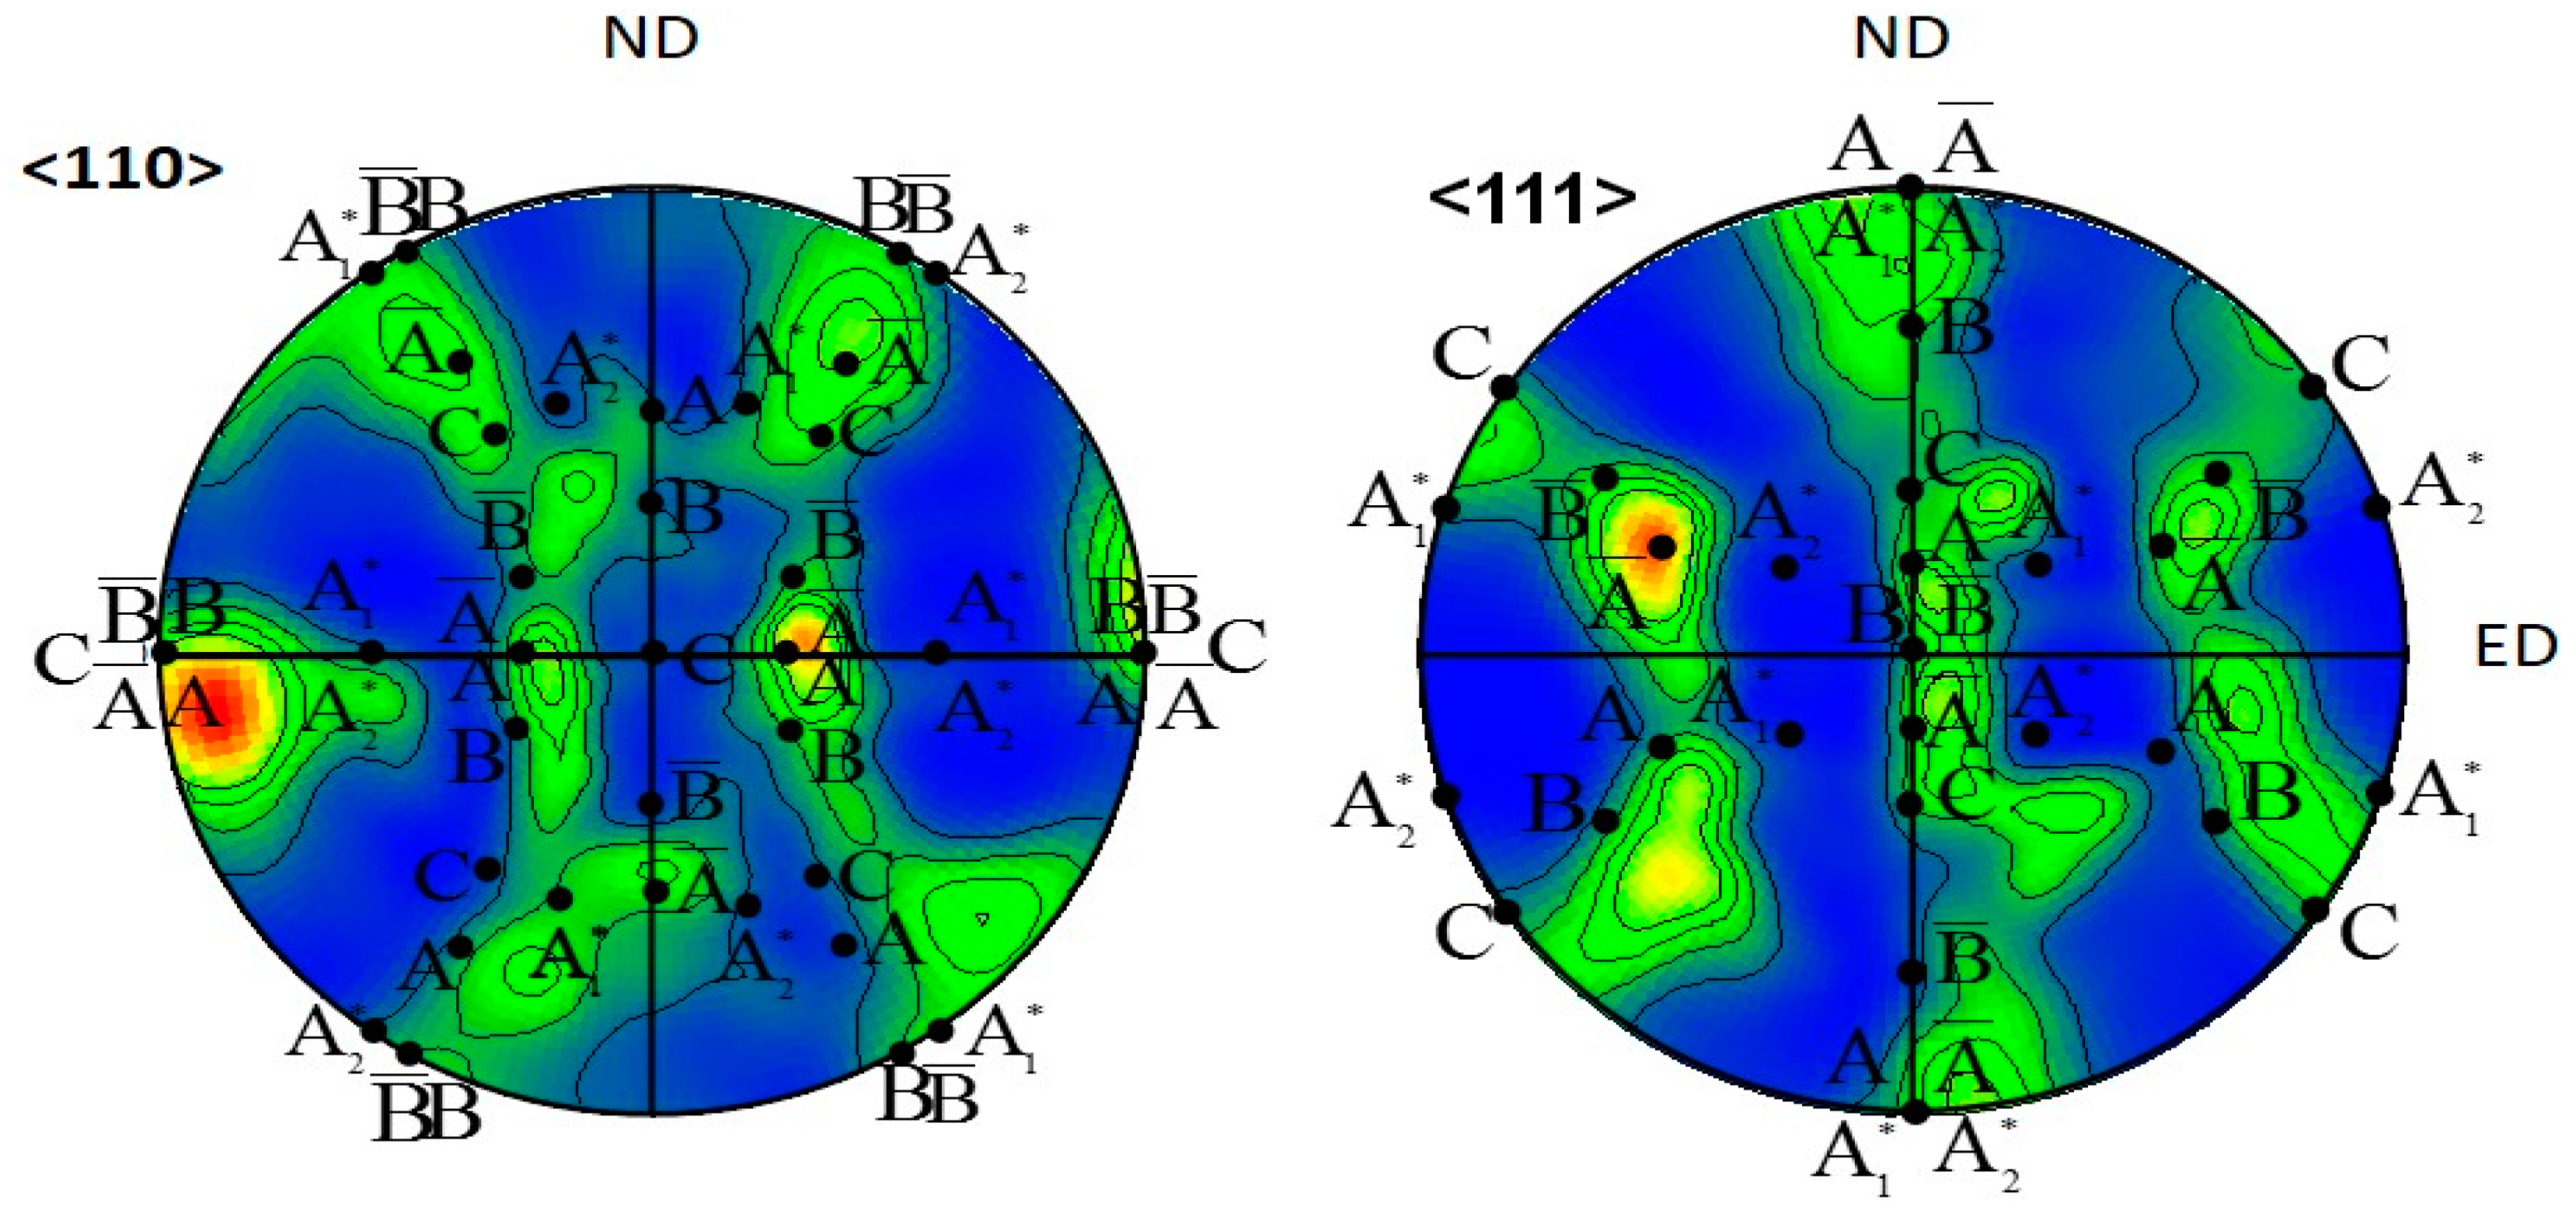
  • The crystallographic texture after 4-Bc at RT was a strong simple shear texture displaying about 7 times random.
  • Conducting the ECAP processing at 200 °C resulted in a severely deformed microstructure with the highest fraction of submicron grains and high density of substructures was also observed.
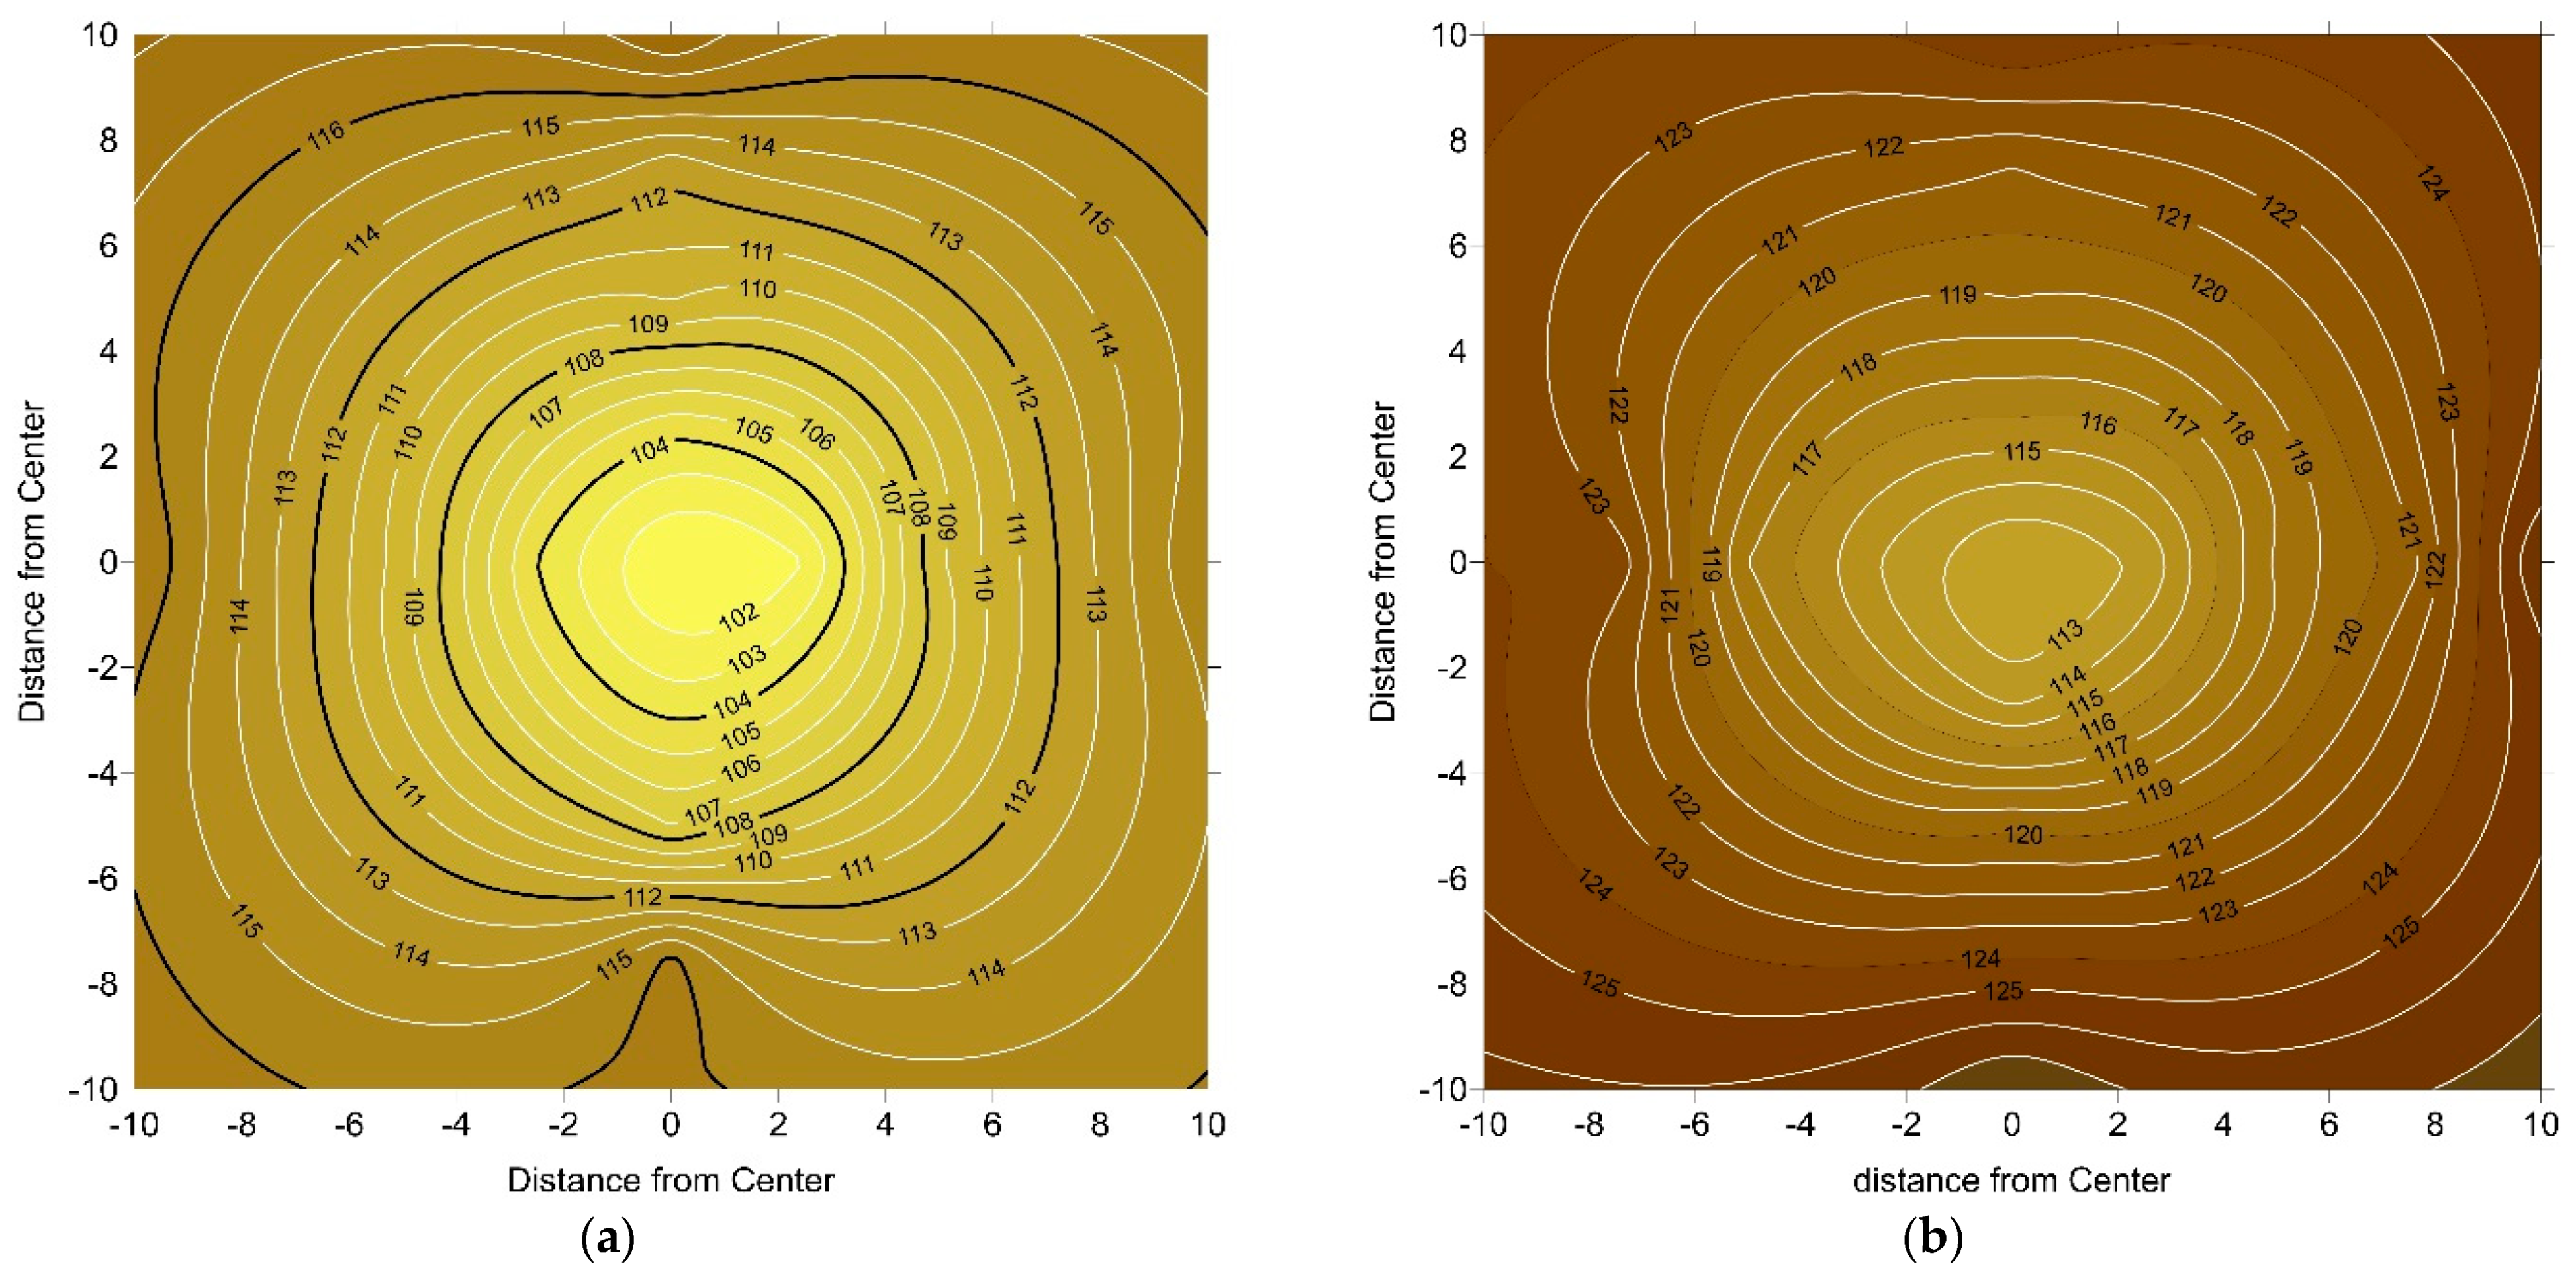
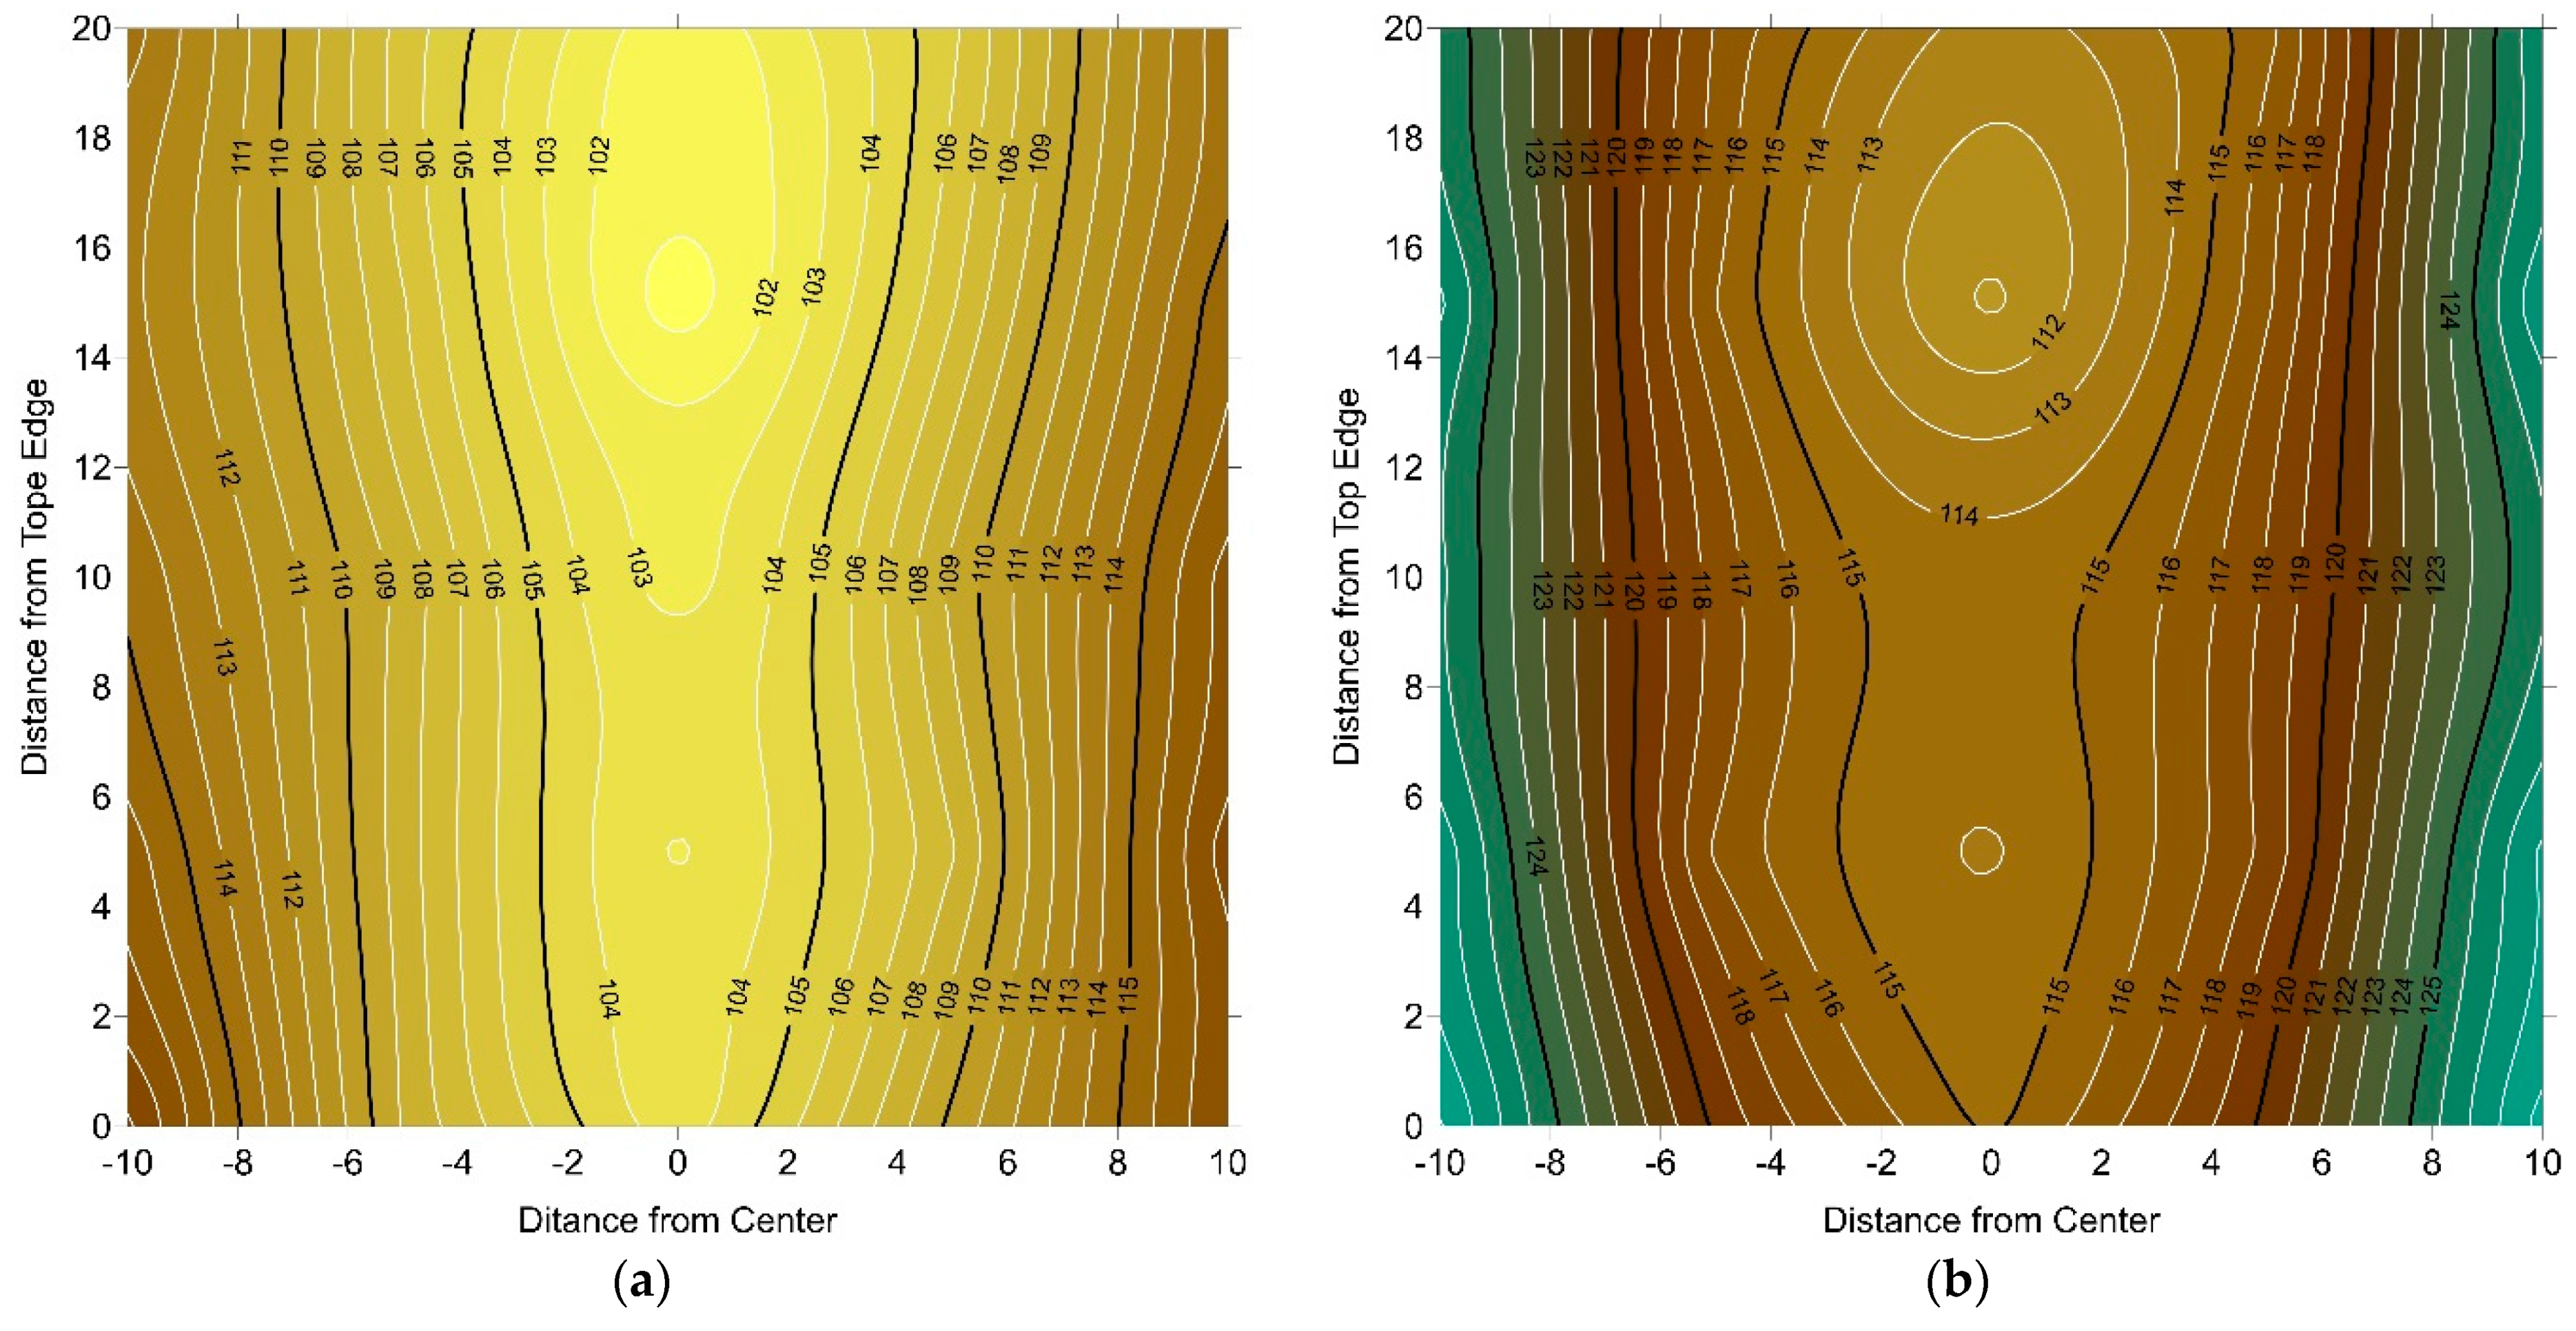
  • Processing through 1-P revealed an increase of the hardness values by 125% and 96% in the peripheral and central regions compared to the as-annealed counterpart.
  • Further straining up to 4-Bc revealed an additional increase of the hardness values by 29% and 16.6% in the peripheral and central regions compared to the 1-P counterpart.

Author Contributions

Conceptualization, A.I.A., H.A.E.-H. and W.H.E.-G.; methodology, A.I.A., M.M.Z.A.; Y.Z.; H.A.E.-H.; and W.H.E.-G.; validation A.I.A., M.M.Z.A.; Y.Z.; H.A.E.-H.; M.O.A. and W.H.E.-G. formal analysis, and M.M.Z.A.; Y.Z. and W.H.E.-G.; investigation, A.I.A., M.M.Z.A.; Y.Z.; H.A.E.-H.; M.O.A. and W.H.E.-G.; data curation, M.M.Z.A.; Y.Z. and W.H.E.-G.; writing—original draft preparation, M.M.Z.A.; Y.Z. and W.H.E.-G.; writing—review and editing, M.M.Z.A.; Y.Z.; M.O.A. and W.H.E.-G.; project administration, A.I.A., H.A.E.-H. and W.H.E.-G. All authors have read and agreed to the published version of the manuscript.

Funding

This research received no external funding.

Institutional Review Board Statement

Not applicable.

Informed Consent Statement

Not applicable.

Data Availability Statement

All the raw data supporting the conclusion of this paper were provided by the authors.

Acknowledgments

Researchers would like to thank the Deanship of Scientific Research, Qassim University, for funding publication of this project.

Conflicts of Interest

The authors declare no conflict of interest.

References

  1. Ma, M.; Li, Z.; Qiu, W.; Xiao, Z.; Zhao, Z.; Jiang, Y.; Xia, Z.; Huang, H. Development of homogeneity in a Cu-Mg-Ca alloy processed by equal channel angular pressing. J. Alloys Compd. 2020, 820, 153112. [Google Scholar] [CrossRef]
  2. Ma, M.; Li, Z.; Qiu, W.; Xiao, Z.; Zhao, Z.; Jiang, Y. Microstructure and properties of Cu–Mg-Ca alloy processed by equal channel angular pressing. J. Alloys Compd. 2019, 788, 50–60. [Google Scholar] [CrossRef]
  3. Abib, K.; Balanos, J.A.M.; Alili, B.; Bradai, D. On the microstructure and texture of Cu-Cr-Zr alloy after severe plastic deformation by ECAP. Mater. Charact. 2016, 112, 252–258. [Google Scholar] [CrossRef]
  4. Krishna, S.C.; Chawake, N.; Kottada, R.S.; Jha, A.K.; Pant, B.; Venkitakrishnan, P.V. High Strength and Good Ductility in Cu-3Ag-0.5Zr Alloy by Cryo-Rolling and Aging. J. Mater. Eng. Perform. 2017, 26, 350–357. [Google Scholar] [CrossRef]
  5. Murashkin, M.Y.; Sabirov, I.; Sauvage, X.; Valiev, R.Z. Nanostructured Al and Cu alloys with superior strength and electrical conductivity. J. Mater. Sci. 2016, 51, 33–49. [Google Scholar] [CrossRef]
  6. Ebrahimi, M.; Shaeri, M.H.; Gode, C.; Armoon, H.; Shamsborhan, M. The synergistic effect of dilute alloying and nanostructuring of copper on the improvement of mechanical and tribological response. Compos. Part B Eng. 2019, 164, 508–516. [Google Scholar] [CrossRef]
  7. Islamgaliev, R.K.; Nesterov, K.M.; Valiev, R.Z. Structure, strength, and electric conductivity of a Cu-Cr copper-based alloy subjected to severe plastic deformation. Phys. Met. Metallogr. 2015, 116, 209–218. [Google Scholar] [CrossRef]
  8. Král, P.; Dvořák, J.; Kvapilová, M.; Blum, W.; Sklenička, V. The influence of long-term annealing at room temperature on creep behaviour of ECAP-processed copper. Mater. Lett. 2017, 188, 235–238. [Google Scholar] [CrossRef]
  9. Huang, R.; Zhu, D.; Liao, X.; Yan, Q. Effect of ECAP Process and Subsequent Annealing on Microstructure and Properties of Cu-0.25Se-0.25Te Alloy. J. Electron. Mater. 2020, 49, 2617–2624. [Google Scholar] [CrossRef]
  10. Bochvar, N.R.; Rybalchenko, O.V.; Shangina, D.V.; Dobatkin, S.V. Effect of equal-channel angular pressing on the precipitation kinetics in Cu-Cr-Hf alloys. Mater. Sci. Eng. A 2019, 757, 84–87. [Google Scholar] [CrossRef]
  11. Xu, X.X.; Nie, F.L.; Zhang, J.X.; Zheng, W.; Zheng, Y.F.; Hu, C.; Yang, G. Corrosion and ion release behavior of ultra-fine grained bulk pure copper fabricated by ECAP in Hanks solution as potential biomaterial for contraception. Mater. Lett. 2010, 64, 524–527. [Google Scholar] [CrossRef]
  12. Patil, A.; Bontha, S.; Ramesh, M.R. Effect of ECAP on sliding wear behaviour of Mg-Zn-Gd-Zr alloy. Mater. Today Proc. 2020, 20, 97–102. [Google Scholar] [CrossRef]
  13. Safari, M.; Joudaki, J. Effect of Temperature on Strength and Hardness in Multi-pass Equal Channel Angular Pressing (ECAP) of Aluminum Alloys. Trans. Indian Inst. Met. 2020, 73, 619–627. [Google Scholar] [CrossRef]
  14. Kong, Y.; Pu, Q.; Jia, Z.; Liu, M.; Roven, H.J.; Jia, J.; Liu, Q. Microstructure and property evolution of Al-0.4Fe-0.15Zr-0.25Er alloy processed by high pressure torsion. J. Alloys Compd. 2020, 824, 153949. [Google Scholar] [CrossRef]
  15. Bednarczyk, W.; Kawałko, J.; Wątroba, M.; Gao, N.; Starink, M.J.; Bała, P.; Langdon, T.G. Microstructure and mechanical properties of a Zn-0.5Cu alloy processed by high-pressure torsion. Mater. Sci. Eng. A 2020, 776, 139047. [Google Scholar] [CrossRef]
  16. El-Garaihy, W.H.; Rassoul, E.S.M.A.; Salem, H.G. Consolidation of high performance AA6061 and AA6061-SiCp composite processed by high pressure torsion. In Materials Science Forum; Trans Tech Publications: Zurich, Switzerland, 2014; pp. 2623–2628. [Google Scholar]
  17. Salem, H.G.; El-Garaihy, W.H.; Rassoul, E.S.M.A. Influence of high pressure torsion on the consolidation behavior and mechanical properties of AA6061-SiCP composites powders. TMS Annu. Meet. 2012, 1, 553–560. [Google Scholar]
  18. Vu, V.Q.; Prokof’eva, O.; Toth, L.S.; Usov, V.; Shkatulyak, N.; Estrin, Y.; Kulagin, R.; Varyukhin, V.; Beygelzimer, Y. Obtaining hexagon-shaped billets of copper with gradient structure by twist extrusion. Mater. Charact. 2019, 153, 215–223. [Google Scholar] [CrossRef]
  19. Fouad, D.M.; Moataz, A.; El-Garaihy, W.H.; Salem, H.G. Numerical and experimental analysis of multi-channel spiral twist extrusion processing of AA5083. Mater. Sci. Eng. A 2019, 764, 138216. [Google Scholar] [CrossRef]
  20. Fouad, D.M.; El-Garaihy, W.H.; Ahmed, M.M.Z.; El-Sayed Seleman, M.M.; Salem, H.G. Influence of multi-channel spiral twist extrusion (MCSTE) processing on structural evolution, crystallographic texture and mechanical properties of AA1100. Mater. Sci. Eng. A 2018, 737, 166–175. [Google Scholar] [CrossRef]
  21. El-Garaihy, W.H.; Fouad, D.M.; Salem, H.G. Multi-channel Spiral Twist Extrusion (MCSTE): A Novel Severe Plastic Deformation Technique for Grain Refinement. Metall. Mater. Trans. A Phys. Metall. Mater. Sci. 2018, 49, 2854–2864. [Google Scholar] [CrossRef]
  22. Mansouri, H.; Eghbali, B.; Afrand, M. Producing multi-layer composite of stainless steel/aluminum/copper by accumulative roll bonding (ARB) process. J. Manuf. Process. 2019, 46, 298–303. [Google Scholar] [CrossRef]
  23. Shaeri, M.; Karimi Taheri, K.; Karimi Taheri, A.; Shaeri, M.H. An Investigation on Microstructure Evolution, Mechanical Properties, and Strain Aging of Mg-1.8Zn-0.7Si-0.4Ca Biomedical Alloy Processed by Equal Channel Angular Pressing. J. Mater. Eng. Perform. 2019, 28, 5207–5219. [Google Scholar] [CrossRef]
  24. Gopal, R.; Thangadurai, K.R.; Thirunavukkarasu, K. Behavior of ECAP processed copper electrodes in electrical discharge machining of AISI H13 steel. Mater. Today Proc. 2020, 21, 295–298. [Google Scholar] [CrossRef]
  25. Lugo, N.; Llorca, N.; Cabrera, J.M.; Horita, Z. Microstructures and mechanical properties of pure copper deformed severely by equal-channel angular pressing and high pressure torsion. Mater. Sci. Eng. A 2008, 477, 366–371. [Google Scholar] [CrossRef]
  26. Habibi, A.; Ketabchi, M.; Eskandarzadeh, M. Nano-grained pure copper with high-strength and high-conductivity produced by equal channel angular rolling process. J. Mater. Process. Technol. 2011, 211, 1085–1090. [Google Scholar] [CrossRef]
  27. Molodova, X.; Khorashadizadeh, A.; Gottstein, G.; Winning, M.; Hellmig, R.J. Thermal stability of ECAP processed pure Cu and CuZr. Z. Met. Res. Adv. Tech. 2007, 98, 269–275. [Google Scholar] [CrossRef]
  28. El-Danaf, E.A.; Soliman, M.S.; Almajid, A.A.; El-Rayes, M.M. Enhancement of mechanical properties and grain size refinement of commercial purity aluminum 1050 processed by ECAP. Mater. Sci. Eng. A 2007, 458, 226–234. [Google Scholar] [CrossRef]
  29. Bagherzadeh, S.; Abrinia, K.; Han, Q. Analysis of plastic deformation behavior of ultrafine-grained aluminum processed by the newly developed ultrasonic vibration enhanced ECAP: Simulation and experiments. J. Manuf. Process. 2020, 50, 485–497. [Google Scholar] [CrossRef]
  30. Srinivasarao, B.; Oh-ishi, K.; Ohkubo, T.; Hono, K. Bimodally grained high-strength Fe fabricated by mechanical alloying and spark plasma sintering. Acta Mater. 2009, 57, 3277–3286. [Google Scholar] [CrossRef]
  31. Krajňák, T.; Minárik, P.; Stráská, J.; Gubicza, J.; Dluhoš, L.; Máthis, K.; Janeček, M. Influence of temperature of ECAP processing on the microstructure and microhardness of as-cast AX41 alloy. J. Mater. Sci. 2020, 55, 3118–3129. [Google Scholar] [CrossRef]
  32. Jia, H.; Li, Y. Texture evolution of an Al-8Zn alloy during ECAP and post-ECAP isothermal annealing. Mater. Charact. 2019, 155, 109794. [Google Scholar] [CrossRef]
  33. Naik, G.M.; Narendranath, S.; Kumar, S.S.S. Effect of ECAP Die Angles on Microstructure Mechanical Properties and Corrosion Behavior of AZ80 Mg Alloy. J. Mater. Eng. Perform. 2019, 28, 2610–2619. [Google Scholar] [CrossRef]
  34. Lugo, N.; Llorca, N.; Suñol, J.J.; Cabrera, J.M. Thermal stability of ultrafine grains size of pure copper obtained by equal-channel angular pressing. J. Mater. Sci. 2010, 45, 2264–2273. [Google Scholar] [CrossRef]
  35. Valiev, R.Z.; Krasilnikov, N.A.; Tsenev, N.K. Plastic deformation of alloys with submicron-grained structure. Mater. Sci. Eng. A 1991, 137, 35–40. [Google Scholar] [CrossRef]
  36. Iwahashi, Y.; Horita, Z.; Nemoto, M.; Langdon, T.G. The process of grain refinement in equal-channel angular pressing. Acta Mater. 1998, 46, 3317–3331. [Google Scholar] [CrossRef]
  37. Wang, H.; Ban, C.; Zhao, N.; Zhu, Q.; Cui, J. Effective grain refinement of pure Cu processed by new route of equal channel angular pressing. Mater. Sci. Eng. A 2019, 751, 246–252. [Google Scholar] [CrossRef]
  38. Guo, T.; Wang, C.; Li, Q.; Wu, Y.; Tang, X. Texture Evolution and Strengthening Behavior of Single Crystal Copper During Equal Channel Angular Pressing. Xiyou Jinshu Cailiao Yu Gongcheng Rare Met. Mater. Eng. 2019, 48, 1065–1073. [Google Scholar]
  39. Blum, W.; Dvořák, J.; Král, P.; Sklenička, V. Dynamic grain coarsening in creep of pure Cu at 0.42Tm after predeformation by ECAP. Mater. Sci. Eng. A 2018, 731, 520–529. [Google Scholar] [CrossRef]
  40. Zhu, C.F.; Du, F.P.; Jiao, Q.Y.; Wang, X.M.; Chen, A.Y.; Liu, F.; Pan, D. Microstructure and strength of pure Cu with large grains processed by equal channel angular pressing. Mater. Des. 2013, 52, 23–29. [Google Scholar] [CrossRef]
  41. Deng, G.Y.; Lu, C.; Su, L.H.; Liu, X.H.; Tieu, A.K. Modeling texture evolution during ECAP of copper single crystal by crystal plasticity FEM. Mater. Sci. Eng. A 2012, 534, 68–74. [Google Scholar] [CrossRef]
  42. Blum, W.; Dvořák, J.; Král, P.; Eisenlohr, P.; Sklenička, V. Effect of grain refinement by ECAP on creep of pure Cu. Mater. Sci. Eng. A 2014, 590, 423–432. [Google Scholar] [CrossRef]
  43. Ebrahimi, M.; Gode, C. Severely deformed copper by equal channel angular pressing. Prog. Nat. Sci. Mater. Int. 2017, 27, 244–250. [Google Scholar] [CrossRef]
  44. Deng, G.Y.; Lu, C.; Tieu, A.K.; Su, L.H.; Huynh, N.N.; Liu, X.H. Crystal plasticity investigation of friction effect on texture evolution of Al single crystal during ECAP. J. Mater. Sci. 2010, 45, 4711–4717. [Google Scholar] [CrossRef]
  45. Lee, H.H.; Kim, W.; Jung, K.C.; Seo, S.; Lee, J.K.; Park, H.L.; Park, K.-T.; Kim, H.S. Circumferential twisting during route B equal-channel angular pressing. J. Mater. Process. Technol. 2018, 259, 305–311. [Google Scholar] [CrossRef]
  46. Abd El Aal, M.I. 3D FEM simulations and experimental validation of plastic deformation of pure aluminum deformed by ECAP and combination of ECAP and direct extrusion. Trans. Nonferrous. Met. Soc. China 2017, 27, 1338–1352. [Google Scholar] [CrossRef]
  47. Spirdione, J.; Ghonem, H. Dynamic flow stress of fine grain material processed using equal channel angular pressing. Mater. Sci. Eng. A 2017, 698, 256–267. [Google Scholar] [CrossRef]
  48. El Mahallawy, N.; Shehata, F.A.; Abd el Hameed, M.; Abd el Aal, M.I.; Kim, H.S. 3D FEM simulations for the homogeneity of plastic deformation in Al–Cu alloys during ECAP. Mater. Sci. Eng. A 2010, 527, 1404–1410. [Google Scholar] [CrossRef]
  49. Rollett, A.; Humphreys, F.; Rohrer, G.S.; Hatherly, M. Recrystallization and Related Annealing Phenomena, 2nd ed.; Elsevier: Amsterdam, The Netherlands, 2004; pp. 1–628. [Google Scholar]
  50. Higuera-Cobos, O.F.; Cabrera, J.M. Mechanical, microstructural and electrical evolution of commercially pure copper processed by equal channel angular extrusion. Mater. Sci. Eng. A 2013, 571, 103–114. [Google Scholar] [CrossRef]
  51. Suwas, S.; Tóth, L.S.; Fundenberger, J.J.; Eberhardt, A.; Skrotzki, W. Evolution of crystallographic texture during equal channel angular extrusion of silver. Scr. Mater. 2003, 49, 1203–1208. [Google Scholar] [CrossRef]
  52. Li, S.; Beyerlein, I.J.; Necker, C.T. On the Development of Microstructure and Texture Heterogeneity in ECAE via Route C. Acta Mater. 2006, 54, 1397–1408. [Google Scholar] [CrossRef]
  53. Mishin, O.V.; Bowen, J.R. Through-Thickness Variations of Deformed and Annealed Microstructures in ECAE-Processed Copper. Metall. Mater. Trans. A 2009, 40A, 1684. [Google Scholar] [CrossRef]
  54. Barnett, M.R.; Montheillet, F. The generation of new high-angle boundaries in aluminum during hot torsion. Acta Mater. 2002, 50, 2285–2296. [Google Scholar] [CrossRef]
  55. Fonda, R.W.; Bingert, J.F. Texture variations in an aluminum friction stir weld. Scr. Mater. 2007, 57, 1052–1055. [Google Scholar] [CrossRef]
  56. Djavanroodi, F.; Omranpour, B.; Ebrahimi, M.; Sedighi, M. Designing of ECAP parameters based on strain distribution uniformity. Prog. Nat. Sci. Mater. Int. 2012, 22, 452–460. [Google Scholar] [CrossRef] [Green Version]
  57. Alateyah, A.I.; Aljohani, T.A.; Alawad, M.O.; El-Hafez, H.A.; Almutairi, A.N.; Alharbi, E.S.; Alhamada, R.; El-Garaihy, B.W.; El-Garaihy, W.H. Improved Corrosion Behavior of AZ31 Alloy through ECAP Processing. Metals 2021, 11, 363. [Google Scholar] [CrossRef]
  58. Suresh, M.; Sharma, A.; More, A.; Kalsar, R.; Bisht, A.; Nayan, N.; Suwas, S. Effect of equal channel angular pressing (ECAP) on the evolution of texture, microstructure and mechanical properties in the Al-Cu-Li alloy AA2195. J. Alloys Compd. 2019, 785, 972–983. [Google Scholar] [CrossRef]
  59. Elhefnawey, M.; Shuai, G.L.; Li, Z.; Nemat-Alla, M.; Zhang, D.T.; Li, L. On achieving superior strength for Al–Mg–Zn alloy adopting cold ECAP. Vacuum 2020, 174, 109191. [Google Scholar] [CrossRef]
  60. Shaeri, M.H.; Shaeri, M.; Ebrahimi, M.; Salehi, M.T.; Seyyedein, S.H. Effect of ECAP temperature on microstructure and mechanical properties of Al-Zn-Mg-Cu alloy. Prog. Nat. Sci. Mater. Int. 2016, 26, 182–191. [Google Scholar] [CrossRef] [Green Version]
  61. Khelfa, T.; Muñoz-Bolaños, J.A.; Li, F.; Cabrera-Marrero, J.M.; Khitouni, M. Microstructure and Mechanical Properties of AA6082-T6 by ECAP under Warm Processing. Met. Mater. Int. 2020, 26, 1247–1261. [Google Scholar] [CrossRef]
  62. Tong, Y.X.; Wang, Y.; Qian, Z.M.; Zhang, D.T.; Li, L.; Zheng, Y.F. Achieving High Strength and High Electrical Conductivity in a CuCrZr Alloy Using Equal-Channel Angular Pressing. Acta Metall. Sin. 2018, 31, 1084–1088. [Google Scholar] [CrossRef] [Green Version]
Figure 1. (a) Schematic of the right half ECAP die and (b) picture of the assembled die.
Metals 11 00607 g001
Figure 2. (a) Representation of the references axes with respect to the ECAPed sample and (b) the position of the EBSD data acquired shown as red square on the longitudinal cross section of the ECAP processed sample.
Metals 11 00607 g002
Figure 3. Simulation of effective stresses distribution in Cu samples processed through 1-P at room temperature.
Metals 11 00607 g003
Figure 4. Simulation of effective strain distribution after processing through 1-P.
Metals 11 00607 g004
Figure 5. (a) Inverse pole figure (IPF) coloring maps and (b) band contrast maps with the angle boundaries superimposed for as annealed pure Cu. IPF coloring triangle is shown in (a), red: [001]; blue; [111] and green: [101] (for interpretation of the references to color in this figure legend, the reader is referred to the web version of the article).
Metals 11 00607 g005
Figure 6. IPF coloring maps relative to normal direction “Z” (ND) and their corresponding band contrast maps with the angle boundaries superimposed for the commercial pure Cu ECAP processed at room temperature (RT) for 1-P. (a) Left edge, (b) center and (c) right edge. Step size used in EBSD data collection was 0.5 µm in all cases (for interpretation of the references to color in this figure legend, the reader is referred to the web version of the article).
Metals 11 00607 g006
Figure 7. IPF coloring maps relative to ND and their corresponding band contrast maps with the angle boundaries superimposed for the commercial pure Cu ECAP processed at RT for (a) 2-P and (b) 4-Bc. Step size used in EBSD data collection was 0.2 µm in all cases (for interpretation of the references to color in this figure legend, the reader is referred to the web version of the article).
Metals 11 00607 g007
Figure 8. IPF coloring maps relative to ND and their corresponding band contrast maps with the angle boundaries superimposed for the commercial pure Cu ECAP processed at 200 °C for (a) 1-P and (b) 4-Bc Step size used in EBSD data collection was 0.2 µm in all cases (for interpretation of the references to color in this figure legend, the reader is referred to the web version of the article).
Metals 11 00607 g008
Figure 9. (110) and (111) pole figures of commercial pure Cu for the (a) AA, (b) 1-P_RT, (c) 2-Bc_RT, (d) 4-Bc_RT, (e) 1-P_200 °C and (f) 4-Bc_200 °C samples (for interpretation of the references to color in this figure legend, the reader is referred to the web version of the article).
Metals 11 00607 g009
Figure 10. (111) and (110) pole figures of commercial pure Cu after processing through 4-Bc_RT with the ideal simple shear texture components superimposed (for interpretation of the references to color in this figure legend, the reader is referred to the web version of the article).
Metals 11 00607 g010
Figure 11. Relative frequency of the different grain diameters of as annealed commercial pure Cu and after ECAP processing through 1-P, 2-Bc and 4-Bc.
Metals 11 00607 g011
Figure 12. Relative frequency of the misorientation angle distribution of AA commercial pure Cu and after ECAP processing for 1-P and 4-Bc.
Metals 11 00607 g012
Figure 13. Color coded contour maps for the hardness (HV) values recorded on the longitudinal section (LS) of the Cu billets processed via ECAP processing after (a) 1-P, (b) 2-Bc and (c) 4-Bc.
Metals 11 00607 g013
Figure 14. Color coded contour for the hardness values recorded on the transverse section (TS) of the Cu billets processed via ECAP processing after (a) 1-P, (b) 2-Bc and (c) 4-Bc.
Metals 11 00607 g014
Figure 15. Color coded contour for the hardness values recorded on the LS of the Cu billets processed via ECAP through (a) 1-P and (b) 4-Bc at 200 °C.
Metals 11 00607 g015
Figure 16. Color coded contour for the hardness values recorded on the TS of the Cu samples processed via ECAP through (a) 1-P and (b) 4-Bc at 200 °C.
Metals 11 00607 g016
Table 1. The average grain size of the commercial purity Cu processed through ECAP up to 4-Bc.
ConditionAverage Grain Size (µm)Standard Deviation (µm)Min Grain Size (µm)Max Grain Size (µm)Total Number of Grains Number of Subtotal Grains N
AA5.13.70.227.2688324
1-P-RT3.92.00.625.5914520
2-Bc-RT32.51.224.02004854
4-Bc-RT3.53.01.224.01486588
1-P-200 °C4.43.41.221.7765379
4-Bc-200 °C2.51.71.215.536691217
Table 2. Partial fibers and ideal components of simple shear texture in fcc metals [45,46,47,48,49,50,51,52,53,54,55].
Partial FibersShear PlaneShear Direction
A fiber {111}<uvw>
B fiber (hkl)<110>
Components
A fiberB fiber
A 1 { 11 1 ¯ } 2 1 ¯ 1
A 2 { 11 1 ¯ } 112
AA { 11 1 ¯ } 101
A ¯ A ¯ { 11 1 ¯ } 1 1 ¯ 0
B{112} 1 1 ¯ 0
B ¯ { 1 ¯ 1 ¯ 2 ¯ } 1 1 ¯ 0
C{001} 1 1 ¯ 0
Table 3. Mechanical properties of commercial pure Cu processed via ECAP.
Processing ConditionProcessing TemperatureHV-ValueYS
(MPa)
UTS
(MPa)
Elongation
(%)
CenterPeriphery
AA-55 ± 255 ± 212217041.5
1-PRT108 ± 2126 ± 2280299.525.3
2-Bc115 ± 2129 ± 232436425.3
4-Bc127 ± 2158 ± 327238130
1-P200 °C102 ± 1116 ± 329230226.8
4-Bc113 ± 2128 ± 129233028.5
Publisher’s Note: MDPI stays neutral with regard to jurisdictional claims in published maps and institutional affiliations.

