
Buckling Analysis of Corroded Pipelines under Combined Axial Force and External Pressure

1
Offshore Department, SINOPEC Petroleum Engineering & Consulting Corporation, Dongying 257026, China
2
State Key Laboratory of Coastal and Offshore Engineering, Dalian University of Technology, Dalian 116024, China
3
School of Hydraulic Engineering, Faculty of Infrastructure Engineering, Dalian University of Technology, Dalian 116024, China
*
Author to whom correspondence should be addressed.
Metals 2022, 12(2), 308; https://doi.org/10.3390/met12020308
Submission received: 9 January 2022
/
Revised: 30 January 2022
/
Accepted: 1 February 2022
/
Published: 10 February 2022
(This article belongs to the Special Issue Mechanical Failure and Metal Degradation of Ships and Marine Structures)
Abstract
:Affected by a complex environment, corrosion is a common defect in steel pipelines. Moreover, steel pipelines are subjected to large axial forces during their installation and operation. Corroded deep-sea steel pipelines are prone to local buckling under complex loads. Therefore, in view of this problem, the collapse response of corroded steel pipelines under the combined axial force and external pressure is analyzed in detail. First, a formula for evaluating the collapse pressure of corroded steel pipelines under external pressure and axial force is proposed. Then, the factors affecting the collapse pressure of the steel pipeline are parameterized by using the finite element method. The accuracy of the finite element model is proved by collapse tests of the corroded steel pipeline. As shown in finite element results, the diameter-to-thickness ratio, initial ovality and corrosion defect size have significant effects on the buckling response of a steel pipeline. The collapse pressure of the steel pipeline decreases as the axial force increases. Finally, based on the finite element simulation results, the parameter variables in the evaluation formula are obtained.
1. Introduction
Oil and gas steel pipelines have been widely used in the production industry [1,2,3,4]. With the discovery of deep-sea oil and gas fields, the demand for steel deep-sea oil and gas pipelines is also greatly increasing. Compared to land, the deep-sea environment is more complex. Therefore, steel pipelines with higher bearing capacities are required [5,6,7,8,9,10,11]. Moreover, corrosion defects are often formed on the surface of the steel pipeline under the perennial erosion of external seawater, which it will cause the local wall thickness of the steel pipeline to be thinned.
The fracture analysis of defective pipelines under complex loads has been extensively studied, and many important results have been obtained [12,13]. Miller [14] proposed an analytical solution based on the net section collapse criterion, including the ultimate load expressions for various defect types in different structures. After that, Jones and Eshelby [15] developed the ultimate load solution of thin-walled cylinder with partial symmetrical circumferential cracks and full-ring cracks under internal pressure. Kim et al. [16] fitted the ultimate load of the cylinder with partial penetrating surface cracks. Shim [17] used the finite element method to analyze the ultimate load of thick-walled pipes with irregular penetration cracks under combined loads. Staat and Vu [18] carried out the plastic limit analysis of circumferentially cracked tubes and vessels under the action of internal pressure by means of the finite element method and proposed the global limit load solution and the local limit load solution.
In the deep-sea environment, external pressure is the main factor causing corrosion and local buckling in steel pipelines [19,20]. Fan et al. [21] studied the instability mechanism of submarine steel pipelines through external pressure tests on full-scale and reduced-scale steel pipelines by considering the effects of initial ovality and pitting corrosion defects. Zhang et al. [22,23] performed a large number of finite element simulations on steel pipelines with initial ovality, initial wall thickness eccentricity and asymmetric corrosion defects. Additionally, the instability mode and collapse pressure response of the steel pipeline were discussed in detail. Netto et al. [24,25,26] conducted a large number of external pressure tests on steel pipelines with corrosion defects, and studied the influences of various defect shapes, defect sizes and steel pipeline sizes on the collapse pressure.
Finally, an empirical formula for predicting the collapse pressure of the steel pipeline was proposed.
Deep-sea pipelines usually bear multiple loads at the same time. Under the combined influence of corrosion defects and complex loads, such a steel pipeline may be partially buckled or collapse, causing serious economic losses. Therefore, the research on the buckling response of corroded steel pipelines under complex loads has received extensive attention. Steel pipelines are usually designed with the influences of pressure and tension in mind [27]. The presence of axial force leads to the collapse and buckling propagation of the steel pipelines. Heitzer [28] analyzed the plastic collapse of defective pipelines under internal pressure and tension. The study found that a circumferential defect has a great influence on the ultimate axial force of the pipeline. Qiao et al. [29] developed analytical formulas and finite element models, and concluded that an increase in internal pressure can enhance the tensile stiffness of the hose. Bai et al. [30,31] established a finite element model to study the effects of initial ellipticity, residual stress, strain hardening, yield anisotropy, loading path and other parameters on the collapse pressure of steel pipelines under combined external pressure, tensile force and bending force. The response of the steel pipeline under the combined loads is greatly affected by the load path. Madhavan [32] conducted experiments and numerical simulations of pipeline collapse under external pressure and axial force, and found that the different loading paths of p→T and T→p have almost no effect on the collapsed shell of the tube with lower initial ovality. Yu et al. [33] concluded that the loading path has a great influence on the ultimate load of the steel pipeline, and the p→T loading path is more serious than the T→p loading path. Although scholars have conducted a lot of research on the buckling of corroded steel pipelines, the formula for buckling pressure of corrosion steel pipelines under the combined action of external pressure and axial force is rarely involved [34,35,36,37], which is more convenient for engineering practice.
Therefore, a finite element model of corrosion defect steel pipeline is established, and its accuracy is verified through experiments. Based on finite element analysis, the buckling mechanism of corroded steel pipelines under the combined external pressure and axial force is studied in detail, and the collapse pressure evaluation formula of corroded steel pipelines is proposed, providing a theoretical basis for the design and application of deep-sea steel pipelines.
2. Theoretical Development
Timoshenko and Gere [37] conducted a theoretical study on a complete linear elastic thin-walled tube under external pressure and indicated that the buckling of the infinite tube can be simplified to a plane strain problem. The formula for the critical external pressure of eigenvalue buckling is [37].
where pco is the buckling pressure of intact pipeline, E is the young’s modulus, t is the wall thickness, μ is the poisson’s ratio and R is the mean radius.
The normalized critical external pressure formula can be written as
where py is the yield pressure, py = σyt/R and σy is the yield stress.
Due to the production process, the initial ovality is usually formed on a section of the pipeline. Herein, the initial ovality parameter is introduced in the formula. Assuming that the initial ovality is uniformly distributed along the pipeline axis, the initial ovality defect is introduced based on the following formula:
where w0 is the radial displacement, R is the mean radius, θ is the polar angle and Δ0 is the initial ovality, which is defined as:
where Dmax and Dmin are the maximum and minimum outer diameters of the steel pipeline, respectively. The formula for the collapse pressure of a steel pipeline with initial ovality can be expressed in the following form:
where pc is the collapse pressure. For corroded steel pipelines (Figure 1), the parameters of circumferential width and radial depth of the defect are added in Equation (5).
where d and θc are the depth and polar angle of corrosion defects, respectively. The influence of the axial force is further considered: the function h related to the axial force is added to Equation (6), which can be written as
where T and T0 are the axial force and yield axial force, respectively; T0 = πσyDt; and D is the outer diameters of the steel pipeline. The parameter analysis based on the experimentally verified finite element model was conducted in this study. Additionally, by fitting with parameter analysis results, the values of parameters f, g and h of Equation (7) were determined.
3. Experimental Study
3.1. Material Test
Three tensile specimens (X65) were taken from steel pipelines employed in actual engineering. Round rod specimens were taken along the axial direction of the pipeline. Figure 2 shows the specific sampling size of the tensile sample. The tensile specimen was composed of three parts: a clamping section, transition section and parallel section. The thickness and width of each section were measured twice by a vernier caliper, and the average value was taken. The minimum values of the measurement data, the thickness and width of the sample, were used to calculate the initial cross-sectional area of the sample.
The PLW-100 tensile testing machine was used to measure the material parameters of the pipeline steel. The entire test process was controlled by the control system; and the load value, displacement value, deformation value, test speed and test curve were monitored and dynamically displayed in real time. An extensometer and a static resistance strain gauge were used to measure the deformation and strain of the sample. The extension measuring range of SCDY-1 double-sided extensometer and YG-26 static resistance strain gauge used in the experiment was 25/50 mm, and the accuracy of the static resistance strain gauge was 0.1% [38].
The relative resistance ΔF and the relative strain average Δε were determined by using a static resistance strain gauge with a strain gauge pasted on the surface of the test piece. The test loading rate was 0.1 mm/min. The material Poisson’s ratio μ and elastic modulus E were calculated by the relative resistance ΔF and the relative strain average Δε. The two fractured patterns were tightly connected at the fracture, so that the axis was in a straight line, and a vernier caliper was used to measure the gauge length Lb after fracture. Figure 3 shows the round bar tensile specimen and the necking fracture of the specimen after the test.
The Ramberg–Osgood (R–O) model was used to represent the stress–strain response of the steel pipeline (Figure 4) [39]:
where ε and σ are the uniaxial strain and uniaxial stress. The measured elastic modulus E and yield stress σy of X65 steel were 172 Gpa and 376 Mpa, respectively. The material coefficients α and the strain hardening parameter β were 0.009 and 7.5, respectively.
3.2. Full-Scale Buckling Test of Steel Pipeline
A collapse test of a corroded steel pipeline was carried out. As shown in Figure 5, a full-size high-pressure test chamber with a total length of 11.8 m and an inner diameter of 1.2 m was used in the test. As shown in Figure 6, test specimens were three X65 steel pipelines 5000 mm in length, 273 mm in diameter and 12 mm in wall thickness. The three specimens had dual external corrosion defects distributed in the axial, circumferential and diagonal directions, respectively. The defect sizes are listed in Table 1, where LC and c are the length and arc length of defect, respectively; and SL and SC are the axial and circumferential spacings between the two defects.
Both ends of the test piece were sealed with flanges, and it was hoisted into the test chamber with a crane. The flanges were connected to the test chamber with bolts. Then the test chamber was sealed and filled with water, and external pressure was applied after the tightness was checked. The maximum pressure in the cabin during the experiment was defined as the collapse pressure. The trends of external pressure are shown in Figure 7. It can be noted that the pressure increased linearly and monotonously before reaching the critical buckling pressure. Then the pressure dropped sharply after pipeline collapse. The schematic diagram of pipeline after collapse is shown in Figure 8. The deformation was mainly concentrated in the corrosion defect area of each pipeline.
4. Establishment and Verification of the Finite Element Model
4.1. Establishment of the Finite Element Model
In this section, a finite element model is established for simulating the buckling failure behavior of a corroded steel pipeline under external pressure and axial force, and the commercial software ABAQUS was used to numerically calculate the collapse pressure of a corroded steel pipeline [40,41]. The 8-node hexahedral linear reduction integral element (C3D8R) was employed to establish the finite element model. This type of element can be used for linear and complex nonlinear analysis involving contact, plasticity and large deformation. In order to improve computing efficiency, only a quarter finite element model was established. The pipeline was divided into 50, 40 and 5 elements in the longitudinal, circumferential and radial directions, respectively. The boundary conditions and forces are shown in Figure 9. The X = 0 plane was set to be symmetrical about the YZ plane, and the nodes on the Y = 0 plane were set to be symmetrical about the XZ plane. We constrained the Y-direction position on the bottom node of the Z-axis on the X = 0 plane to prevent rigid body displacement from causing non-convergence of the calculation. A kinematic coupling was established at one end of X = L, and we coupled the end surface along the axial direction with the reference point, where L is the length of the steel pipeline. The axial force was applied to the reference point, and the external pressure was uniformly applied to the outer wall of the pipeline. The damage of the corrosion-defected steel pipeline under external pressure shows large pre-buckling deformation and material plasticity, which involves geometric nonlinearity. In this study, the Riks method (arc length method) was used to determine the buckling response of the corrosion-defected steel pipeline under external pressure and axial force. In the calculation process, the axial force was first applied to the specified value and then kept constant, and then external pressure was applied until local buckling instability occurred. With the continuous development of offshore oilfields into the deep sea, the operating temperature continues to rise, and the design temperature can sometimes reach 100°. The axial pressure caused by temperature can be estimated by the following formula.
where A is the cross-sectional area of the steel pipeline; λ is the temperature expansion coefficient of the steel pipeline material, with a value of 11.7 × 10⁻⁶; ΔT is the temperature difference. The calculated value range of the axial force T is approximately 0.2 T0 to 0.8 T0.
4.2. Validation of the Finite Element Model
In order to verify the accuracy of meshing, a sensitivity analysis of the number of meshes was carried out. The meshing scheme formulated above was called S1. In addition, coarser and finer mesh division schemes were called S2 and S3, respectively. The results of the sensitivity analysis of the number of grids are shown in Figure 10. It can be seen that the results of S1 and S2 are very close, whereas the results of S3 and the first two schemes are very different. It can be noted that S1 has sufficient accuracy and the finer mesh will not be significantly improved. Therefore, S1 was adopted as the meshing scheme in this study.
It is worth pointing out that the method of setting chamfers at the junction of the defect and the intact part was used to eliminate the error caused by the stress concentration in the study of internal pressure blasting of steel pipelines. In this study, a pair of chamfering and non-chamfering models were calculated using a grid scheme, as shown in Figure 11. The chamfering radius of the chamfering model was equal to half of the defect depth. Figure 12 shows the comparison between the calculation results of the chamfered model and the un-chamfered model. The results of the two models are very close, and the maximum difference between them is 1.93%. Based on the above results, combined with a large number of studies on the collapse of steel pipelines under external pressure, it can be seen that for modeling and calculations, the unchamfered model can be used instead of the chamfered model to study the collapse of corrosion-defected steel pipelines under external pressure and axial force.
Next, the results of finite element simulation are compared with those of the tests (Table 2). All errors are less than 12%, and the accuracy of the collapse pressure calculated by the finite element model can be verified. The finite element and experimental collapse modes are compared in Figure 13. It can be seen that the collapse modes given by the finite element analysis are basically consistent with those obtained from the experiments. Therefore, the finite element model of this study can be well applied to the calculation of steel pipeline collapse.
5. Parametric Analysis for Pipelines with Corrosion Defects
5.1. Influence of Diameter Thickness Ratio on the Buckling Responses of Pipelines
Figure 14 shows the effects of diameter thickness ratio on collapse pressure under different corrosion defect depths; the corrosion defect length, axial pressure and initial ovality remained constant. For a fixed corrosion defect depth, the collapse pressure of a corroded steel pipeline decreases gradually as the diameter thickness ratio increases. Compared with the steel pipeline with deep corrosion, the collapse pressure of the steel pipeline with shallow corrosion has a more obvious downward trend. This shows that when the corrosion is shallow, the collapse pressure is more sensitive to the diameter thickness ratio, and when the corrosion depth d/t ≥ 0.7, the influence of the diameter thickness ratio on the collapse pressure of corroded steel pipeline can be almost ignored.
5.2. Influence of Initial Ovality on the Buckling Responses of Steel Pipelines
In order to study the effect of initial ovality on the buckling response of corroded steel pipelines with different corrosion defect depths, the corrosion defect length, axial pressure and corrosion defect angle were kept unchanged. Figure 15 shows the effect of Δ0 on the collapse pressure of each corroded steel pipeline. It can be seen that the collapse pressure decreases as Δ0 increases. For the steel pipeline with D/t = 15, when d/t = 0.1, the dimensionless collapse pressure decreases from 0.714 to 0.328 while Δ0 changes from 0.1% to 1%; however, when d/t = 0.7, the dimensionless collapse pressure only decreases from 0.195 to 0.119 for the same ovality variation. This shows that for shallow corrosion defects, the effect of Δ0 on collapse pressure is more obvious than that for deeper defects.
5.3. Influence of Defect Size on the Buckling Responses of Steel Pipelines
Figure 16 shows the effect of θc on the collapse pressure of pipelines with different corrosion defect depths. It can be noted that for a given d/t, the ratio of pc/p0 was found to decrease with the growth of θc, but when θc becomes larger, the tendency is reversed. When the depth of corrosion defects is different, the relation of collapse pressure with the angle of corrosion defect is also different. When the depth of corrosion defect d/t = 0.1, the influence of corrosion defect angle on collapse pressure can be almost ignored. For pipelines with corrosion defect depth d/t > 0.1, when the corrosion defect angle is small, the collapse pressure decreases faster, and its influence on buckling force decreases gradually as corrosion defect angle increases.
As another important index of defect parameters, the depth of corrosion defect also has an important impact on the buckling instability of corroded steel pipeline [42,43]. It can be seen in Figure 17 that the collapse pressure gradually decreases as d/t increases. The change trend of collapse pressure is different under different corrosion defect size, θc. For the case of θc = 0.1, the decline rate of collapse pressure with the increasing d/t gradually becomes faster. For the cases of θc ≥ 0.5, the collapse pressure decreases approximately linearly.
Figure 18 shows the effect of corrosion defect length on collapse pressure under different corrosion defect depths. Obviously, as the length of corrosion defects increases, the collapse pressure of the steel pipeline decreases gradually. The falling speed of collapse pressure is different under different corrosion depth. When d/t = 0.1 and 0.7, the length of corrosion defect has little effect on the collapse pressure; when d/t = 0.3 and 0.5, the length of corrosion defect has a relatively large influence on the collapse pressure.
5.4. Influence of Axial Force on the Buckling Responses of Steel Pipelines
The buckling response of steel pipeline under different axial forces is shown in Figure 19. It can be seen that for all cases, the collapse pressure of the steel pipeline decreases in a parabola as axial force increases, and the decline speed is faster when the defect depth is smaller. For example, in the case of D/t = 15, when d/t = 0.1, pc/po decreases from 0.95 to 0.38 as T/T0 increases from 0 to 0.8. When d/t = 0.7, pc/po only decreases by 0.15 as T/T0 increases from 0 to 0.8. This shows that when the defect depth is small, the steel pipeline collapse pressure is more sensitive to axial force. In general, compared with a single external pressure condition, the combined action of external pressure and axial force has a more obvious impact on the buckling response of the steel pipeline, which is more likely to result in buckling failure of the steel pipeline. Therefore, in practical engineering, the impact of axial force on the buckling of corroded steel pipeline cannot be ignored.
5.5. Influence of Material Properties on the Buckling Responses of Steel Pipelines
Figure 20 shows the effect of yield stress on the buckling response. It can be noted that the collapse pressure increases as σy increases. For a steel pipeline with D/t = 15, when d/t = 0.1, the collapse pressure decreases from 9.45 to 82.35 MPa with the σy changing from 100 to 800 MPa; however, when d/t = 0.7, the collapse pressure only decreases from 4 to 16.2 MPa for the same σy variation. This shows that for shallow corrosion defects, the effect of σy on collapse pressure is more obvious than that for deeper defects.
Figure 21 shows the effect of the strain hardening parameter on collapse pressure with different corrosion defect depths. Obviously, in the initial stage, as the strain hardening parameter increases, the collapse pressure of the steel pipeline decreases rapidly. A further increase in β results in a slower decline in pc. It is noted that when β > 5, the collapse pressure is not sensitive to changes in β.
6. The Formula for the Collapse Pressure of Corroded Pipelines
The above research shows that the diameter thickness ratio, initial ovality and corrosion defect size of the steel pipeline have obvious effects on the collapse pressure of a steel pipeline. In this paper, a large number of parameters influencing steel pipeline collapse pressure were analyzed, and the empirical formula of steel pipeline collapse pressure is fitted according to the parameter analysis results. This empirical Formula (7) takes its form from [44,45,46,47].
where a1–a9 in Equation (10) are fitting parameters. The fitting parameters were obtained by least squares fitting and brought into Equation (10). The empirical formula of collapse pressure is:
The scope of application for the empirical formula (Equation (11)) is: 7.5 ≤ R/t ≤ 25, 200 MPa ≤ σy ≤ 500 MPa, 0 ≤ d/t ≤ 0.6, 0 ≤ θc/π ≤ 0.6, 0 ≤ Δ0 ≤ 3%, 0 ≤ T/T0 ≤ 0.6. Figure 22 shows values predicted by Equation (11) and compares them with the numerical results of the applicable parameter range. Due to too many fitting parameters, there are large errors at individual points. In order to discuss the error in more detail, the error distribution histogram was drawn, as shown in Figure 23. It can be seen that the overall correlation is very good; all errors are within 20%. In most cases, the error is no more than 15%.
Multiple corrosion defects are formed on the surfaces of deep-sea steel pipelines. Therefore, the applicability of the present formula for the collapse pressure of steel pipelines with multiple corrosion defects was studied. Based on the single corrosion defect model, the finite element models for steel pipelines with two, three and four defects were established as shown in Figure 24.
In order to calculate the collapse pressures of pipelines with multiple corrosion defects more accurately, the equivalent method was introduced in this study. Assuming that the pipeline has k corrosion defects, the corrosion defects are divided into n and m groups in the circumferential and longitudinal directions. Additionally, the size of each group of corrosion defects can be expressed as:
where, Lce, ce and de are the equivalent length, equivalent circumferential width and equivalent depth, respectively. By incorporating Equations (12)–(14) into Equation (11), the collapse pressure of the pipeline with multiple corrosion defects can be obtained.
Figure 25 shows the comparison for the collapse pressure of present formula and finite element model of steel pipelines with three and four defects. For all cases, the differences between the results of present formula and finite element are within 9%. Therefore, the collapse pressure of steel pipeline with two defects can be predicted by using present formula.
7. Conclusions
The buckling behavior of corroded steel pipelines under the combined action of external pressure and axial force was simulated by using ABAQUS software, and the collapse pressure of a steel pipeline was obtained. Full-scale tests of external pressure on corroded steel pipelines were conducted. Through comparison with experiments, the accuracy of our finite element model was verified. Based on the finite element parameter analysis, the empirical formula of the critical collapse pressure of a corroded steel pipeline under the combined action of external pressure and axial force was obtained by fitting. The main conclusions of this research are as follows:
- (1)
- Axial force, initial imperfections, material properties and defect size have significant effects on the collapse response of a pipeline. Compared with deep corrosion defects, the influences of various parameters on the collapse pressure of pipelines with shallow corrosion (d/t < 0.3) defects are more obvious. When d/t ≥ 0.7, the effects of D/t, Δ0 and Lc on the collapse pressure can be ignored. As the size of the defect, i.e. in length, width or depth, decreases, the collapse pressure decreases. In the case of θc = 0.1, the collapse pressure decreases gradually faster as d/t increases; for the case of θc ≥ 0.5, the collapse pressure decreases approximately linearly.
- (2)
- The formula for the collapse pressure of a corroded steel pipeline under the combined action of external pressure and axial force was established, and the accuracy of the formula was verified by comparison with the finite element results.
- (3)
- A formula was further proposed to conservatively calculate the collapse pressure of a steel pipeline with multiple corrosion defects.
The formula proposed in this study can be used for collapse pressure assessments of corroded pipelines in practical engineering to determine whether they can continue to serve safely, so as to avoid unnecessary repairs and replacements.
Author Contributions
Conceptualization, C.F. and H.W.; methodology, C.F. and H.W.; software, C.F.; validation, C.F. and H.W.; formal analysis, X.L.; investigation, C.F.; resources, X.L.; data curation, C.F.; writing—original draft preparation, C.F.; writing—review and editing, H.W. and X.L.; visualization, H.W.; supervision, X.L.; project administration, X.L.; funding acquisition, X.L. All authors have read and agreed to the published version of the manuscript.
Funding
This research was funded by the project “Submarine Pipeline Seismic Damage Assessment and Seismic Technology Research” of China Petroleum & Chemical Corporation (grant number 320088).
Institutional Review Board Statement
Not applicable.
Informed Consent Statement
Not applicable.
Data Availability Statement
Data sharing is not applicable.
Conflicts of Interest
The authors declare no conflict of interest.
Nomenclature
| A | cross-sectional area of the steel pipeline |
| c | arc length of defect |
| d | depth of corrosion defects |
| D | outer diameters of the steel pipeline |
| Dmax | maximum outer diameters of the steel pipeline |
| Dmin | minimum outer diameters of the steel pipeline |
| E | elastic modulus |
| ΔF | relative resistance |
| L | length of the steel pipeline |
| Lb | gauge length |
| Lc | length of defect |
| p | external pressure |
| pc | collapse pressure |
| pco | buckling pressure of intact pipeline |
| pca | collapse pressure of experimental |
| pcb | collapse pressure of finite element |
| py | yield pressure |
| r | notch radius of tensile specimen |
| R | mean radius of steel pipeline |
| SC | axial spacing between two defects |
| SL | circumferential spacing between two defects |
| t | wall thickness |
| T | axial force |
| T0 | yield axial force |
| ΔT | temperature difference |
| w0 | radial displacement |
| α | material coefficients |
| β | strain hardening parameter |
| Δ0 | initial ovality |
| ε | uniaxial strain |
| Δε | relative strain average |
| θ | polar angle |
| θc | polar angle of corrosion defects |
| λ | temperature expansion coefficient of the steel pipeline material |
| σ | uniaxial stress |
| σy | yield stress |
| μ | poisson’s ratio |
References
- Chen, Y.; Zhang, H.; Zhang, J.; Li, X.; Zhou, J. Failure analysis of high strength pipeline with single and multiple corrosions. Mater. Design 2015, 67, 552–557. [Google Scholar] [CrossRef]
- Chen, Y.; Zhang, H.; Zhang, J.; Liu, X.; Li, X.; Zhou, J. Failure assessment of X80 pipeline with interacting corrosion defects. Eng. Fail. Anal. 2015, 47, 67–76. [Google Scholar] [CrossRef]
- Zhao, H.; Lie, S.; Zhang, Y. Fatigue assessment of cracked pipes with weld misalignment by using stress intensity factors. Int. J. Fatigue 2018, 116, 192–209. [Google Scholar] [CrossRef]
- Zhao, H.; Lie, S.; Zhang, Y. Elastic-plastic fracture analyses for misaligned clad pipeline containing a canoe shape surface crack subjected to large plastic deformation. Ocean Eng. 2017, 146, 87–100. [Google Scholar] [CrossRef]
- Sun, M.; Zhao, H.; Li, X.; Liu, J.; Xu, Z. A new evaluation method for burst pressure of pipeline with colonies of circumferentially aligned defects. Ocean Eng. 2021, 222, 108628. [Google Scholar] [CrossRef]
- Li, X.; Bai, Y.; Su, C.; Li, M. Effect of interaction between corrosion defects on failure pressure of thin wall steel pipeline. Int. J. Press. Vessel. Pip. 2016, 138, 8–18. [Google Scholar] [CrossRef]
- Sun, M.; Zhao, H.; Li, X.; Liu, J.; Xu, Z. New evaluation method of failure pressure of steel pipeline with irregular-shaped defect. Appl. Ocean Res. 2021, 110, 102601. [Google Scholar] [CrossRef]
- Ramasamy, R.; Tuan, Y. Nonlinear finite element analysis of collapse and post-collapse behaviour in dented submarine pipelines. Appl. Ocean Res. 2014, 46, 116–123. [Google Scholar] [CrossRef]
- Smienk, H. Extending the Limits for Thick Walled Pipe (D/t < 20) for External Pressure and Combined Loading. In Proceedings of the ASME 2017 36th International Conference on Ocean, Offshore and Arctic Engineering; American Society of Mechanical Engineers Digital Collection, Trondheim, Norway, 25 June–1 July 2017. [Google Scholar]
- Zhao, H.; Lie, S.; Zhang, Y. Strain-based J-estimation scheme for fracture assessment of misaligned clad pipelines with an interface crack. Marine Struct. 2018, 61, 238–255. [Google Scholar] [CrossRef]
- Zhao, H.; Lie, S.; Zhang, Y. Fracture assessment of mismatched girth welds in oval-shaped clad pipes subjected to bending moment. Int. J. Press. Vessel. Pip. 2018, 160, 1–13. [Google Scholar] [CrossRef]
- Macek, W.; Sampath, D.; Pejkowski, Ł.; Żak, K. A Brief Note on Monotonic and Fatigue Fracture Events Investigation of Thin-Walled Tubular Austenitic Steel Specimens via Fracture Surface Topography Analysis (FRASTA). Eng. Fail. Anal. 2022, 134, 106048. [Google Scholar] [CrossRef]
- Shariati, M.; Mohammadi, E.; Masoudi Nejad, R. Effect of a New Specimen Size on Fatigue Crack Growth Behavior in Thick-Walled Pressure Vessels. Int. J. Press. Vessel. Pip. 2017, 150, 1–10. [Google Scholar] [CrossRef]
- Miller, A. Review of limit loads of structures containing defects. Int. J. Press. Vessel. Pip. 1988, 32, 191–327. [Google Scholar] [CrossRef]
- Jones, M.; Eshelby, J. Limit solutions for circumferentially cracked cylinders under internal pressure and combined tension and bending; Nuclear Electric Report TD/SID/REP/0032. J. Strain. Anal. Eng. Design 1990, 39, 673–683. [Google Scholar]
- Kim, Y.; Shim, D.; Nikbin, K.; Kim, Y.; Hwang, S.; Kim, J. Finite element based plastic limit loads for cylinders with part-through surface cracks under combined loading. Int. J. Press. Vessel. Pip. 2003, 80, 527–540. [Google Scholar] [CrossRef]
- Shim, D.; Han, T.; Huh, N. Finite element limit loads for non-idealized through-wall cracks in thick-walled pipe. Nucl. Eng. Design 2013, 265, 918–931. [Google Scholar] [CrossRef]
- Staat, M.; Vu, D. Limit loads of circumferentially flawed pipes and cylindrical vessels under internal pressure. Int. J. Press. Vessel. Pip. 2006, 83, 188–196. [Google Scholar] [CrossRef]
- Wang, H.; Yu, Y.; Yu, J.; Duan, J.; Zhang, Y.; Li, Z.; Wang, C. Effect of 3D random pitting defects on the collapse pressure of pipe—Part I: Experiment. Thin-Walled Struct. 2018, 129, 512–526. [Google Scholar] [CrossRef]
- Wang, H.; Yu, Y.; Yu, J.; Jin, C.; Zhao, Y.; Fan, Z.; Zhang, Y. Effect of 3D random pitting defects on the collapse pressure of pipe —Part II: Numerical analysis. Thin-Walled Struct. 2018, 129, 527–541. [Google Scholar] [CrossRef]
- Fan, Z.; Yu, J.; Sun, Z.; Wang, H. Effect of axial length parameters of ovality on the collapse pressure of offshore pipelines. Thin-Walled Struct. 2017, 116, 19–25. [Google Scholar] [CrossRef]
- Zhang, X.; Chen, B.; Guedes Soares, C. Effect of non-symmetrical corrosion imperfection on the collapse pressure of subsea pipelines. Marine Struct. 2020, 73, 102806. [Google Scholar] [CrossRef]
- Zhang, X.; Pan, G. Collapse of thick-walled subsea pipelines with imperfections subjected to external pressure. Ocean Eng. 2020, 213, 107705. [Google Scholar] [CrossRef]
- Netto, T. A simple procedure for the prediction of the collapse pressure of pipelines with narrow and long corrosion defects—Correlation with new experimental data. Appl. Ocean Res. 2010, 32, 132–134. [Google Scholar] [CrossRef]
- Netto, T. On the effect of narrow and long corrosion defects on the collapse pressure of pipelines. Appl. Ocean Res. 2009, 31, 75–81. [Google Scholar] [CrossRef]
- Netto, T.; Ferraz, U.; Botto, A. On the effect of corrosion defects on the collapse pressure of pipelines. Int. J. Solids Struct. 2007, 44, 7597–7614. [Google Scholar] [CrossRef]
- Gong, S.; Yuan, L.; Jin, W. Buckling response of offshore pipelines under combined tension, bending, and external pressure. J. Zhejiang Univ. A Sci. 2011, 12, 627–636. [Google Scholar] [CrossRef]
- Heitzer, M. Plastic limit loads of defective pipes under combined internal pressure and axial tension. Int. J. Mech. Sci. 2002, 44, 1219–1224. [Google Scholar] [CrossRef]
- Qiao, H.; Zhang, Y.; Bai, Y.; Cheng, P.; Lu, Y.; Han, P.; Tang, G. Study on reinforced thermoplastic pipe under combined tension and internal pressure. Ships Offshore Struct. 2018, 13, 86–97. [Google Scholar] [CrossRef]
- Bai, Y.; Igland, R.T.; Moan, T. Tube collapse under combined external pressure, tension and bending. Marine Struct. 1997, 10, 389–410. [Google Scholar] [CrossRef]
- Bai, Y.; Xu, W.; Cheng, P.; Wang, N.; Ruan, W. Behaviour of reinforced thermoplastic pipe (RTP) under combined external pressure and tension. Ships Offshore Struct. 2014, 9, 464–474. [Google Scholar] [CrossRef]
- Madhavan, R.; Babcock, C.D.; Singer, J. On the Collapse of Long, Thick-Walled Tubes Under External Pressure and Axial Tension. J. Press. Vessel. Technol. 1993, 115, 15–26. [Google Scholar] [CrossRef]
- Yu, J.; Han, M.; Duan, J.; Yu, Y.; Wang, H. The research on the different loading paths of pipes under combined external pressure and axial tension. Int. J. Mech. Sci. 2019, 160, 219–228. [Google Scholar] [CrossRef]
- Al-Owaisi, S.; Becker, A.; Sun, W. Analysis of shape and location effects of closely spaced metal loss defects in pressurised pipes. Eng. Fail. Anal. 2016, 68, 172–186. [Google Scholar] [CrossRef]
- Al-Owaisi, S.; Becker, A.; Sun, W.; Al-Shabibi, A.; Al-Maharbi, M.; Pervez, T.; Al-Salmi, H. An experimental investigation of the effect of defect shape and orientation on the burst pressure of pressurised pipes. Eng. Fail. Anal. 2018, 93, 200–213. [Google Scholar] [CrossRef]
- Fraldi, M.; Freeman, R.; Slater, S.; Walker, A.; Guarracino, F. An improved formulation for the assessment of the capacity load of circular rings and cylindrical shells under external pressure. Part 2. A comparative study with design codes prescriptions, experimental results and numerical simulations. Thin-Walled Struct. 2011, 49, 1062–1070. [Google Scholar] [CrossRef]
- Timoshenko, S.; Gere, J. Theory of Elastic Stability; McGraw-Hill: New York, NY, USA, 1961. [Google Scholar]
- Peng, Z.; Zhao, H.; Li, X. New ductile fracture model for fracture prediction ranging from negative to high stress triaxiality. Int. J. Plast. 2021, 145, 103057. [Google Scholar] [CrossRef]
- Ramberg, W.; Osgood, W. Description of Stress-Strain Curves by Three Parameters; NACA: Washington, DC, USA, 1943. [Google Scholar]
- Ren, Y.; Vengatesan, V.; Shi, W. Dynamic analysis of a multi-column TLP floating offshore wind turbine with tendon failure scenarios. Ocean Eng. 2022, 245, 110472. [Google Scholar] [CrossRef]
- Wang, Y.; Shi, W.; Michailides, C.; Wan, L.; Kim, H.; Li, X. WEC shape effect on the motion response and power performance of a combined wind-wave energy converter. Ocean Eng. 2022; accepted. [Google Scholar]
- Wu, H.; Zhao, H.; Li, X.; Feng, X. Elastic-plastic buckling of pipes with asymmetric dual corrosion defects subject to external pressure. Ocean Eng. 2021, 240, 109975. [Google Scholar] [CrossRef]
- Wu, H.; Zhao, H.; Li, X.; Feng, X. A semi-analytical approach to elastic-plastic buckling analysis of pipes with asymmetric local wall thinning. Thin-Walled Struct. 2021, 162, 107615. [Google Scholar] [CrossRef]
- Zhao, H.; Lie, S. Determination of dimensionless stress intensity factor of plate-to-plate butt welds between axially aligned members of different thickness. Eng. Fract. Mech. 2017, 172, 90–105. [Google Scholar] [CrossRef]
- Zhao, H.; Lie, S.; Zhang, Y. Stress intensity factors for semi-elliptical surface cracks in plate-to-plate butt welds with parallel misalignment of same thickness. Marine Struct. 2017, 53, 148–163. [Google Scholar] [CrossRef]
- Lie, S.; Zhao, H. Fracture analysis of load-carrying cruciform fillet welded joints with multiple cracks. Eng. Fract. Mech. 2018, 193, 32–46. [Google Scholar] [CrossRef]
- Zhao, H.; Li, X.; Lie, S. Strain-based fracture assessment for an interface crack in clad pipes under complicated loading conditions. Ocean Eng. 2020, 198, 106992. [Google Scholar] [CrossRef]
Figure 1.
Schematic diagram of corrosion steel pipeline.
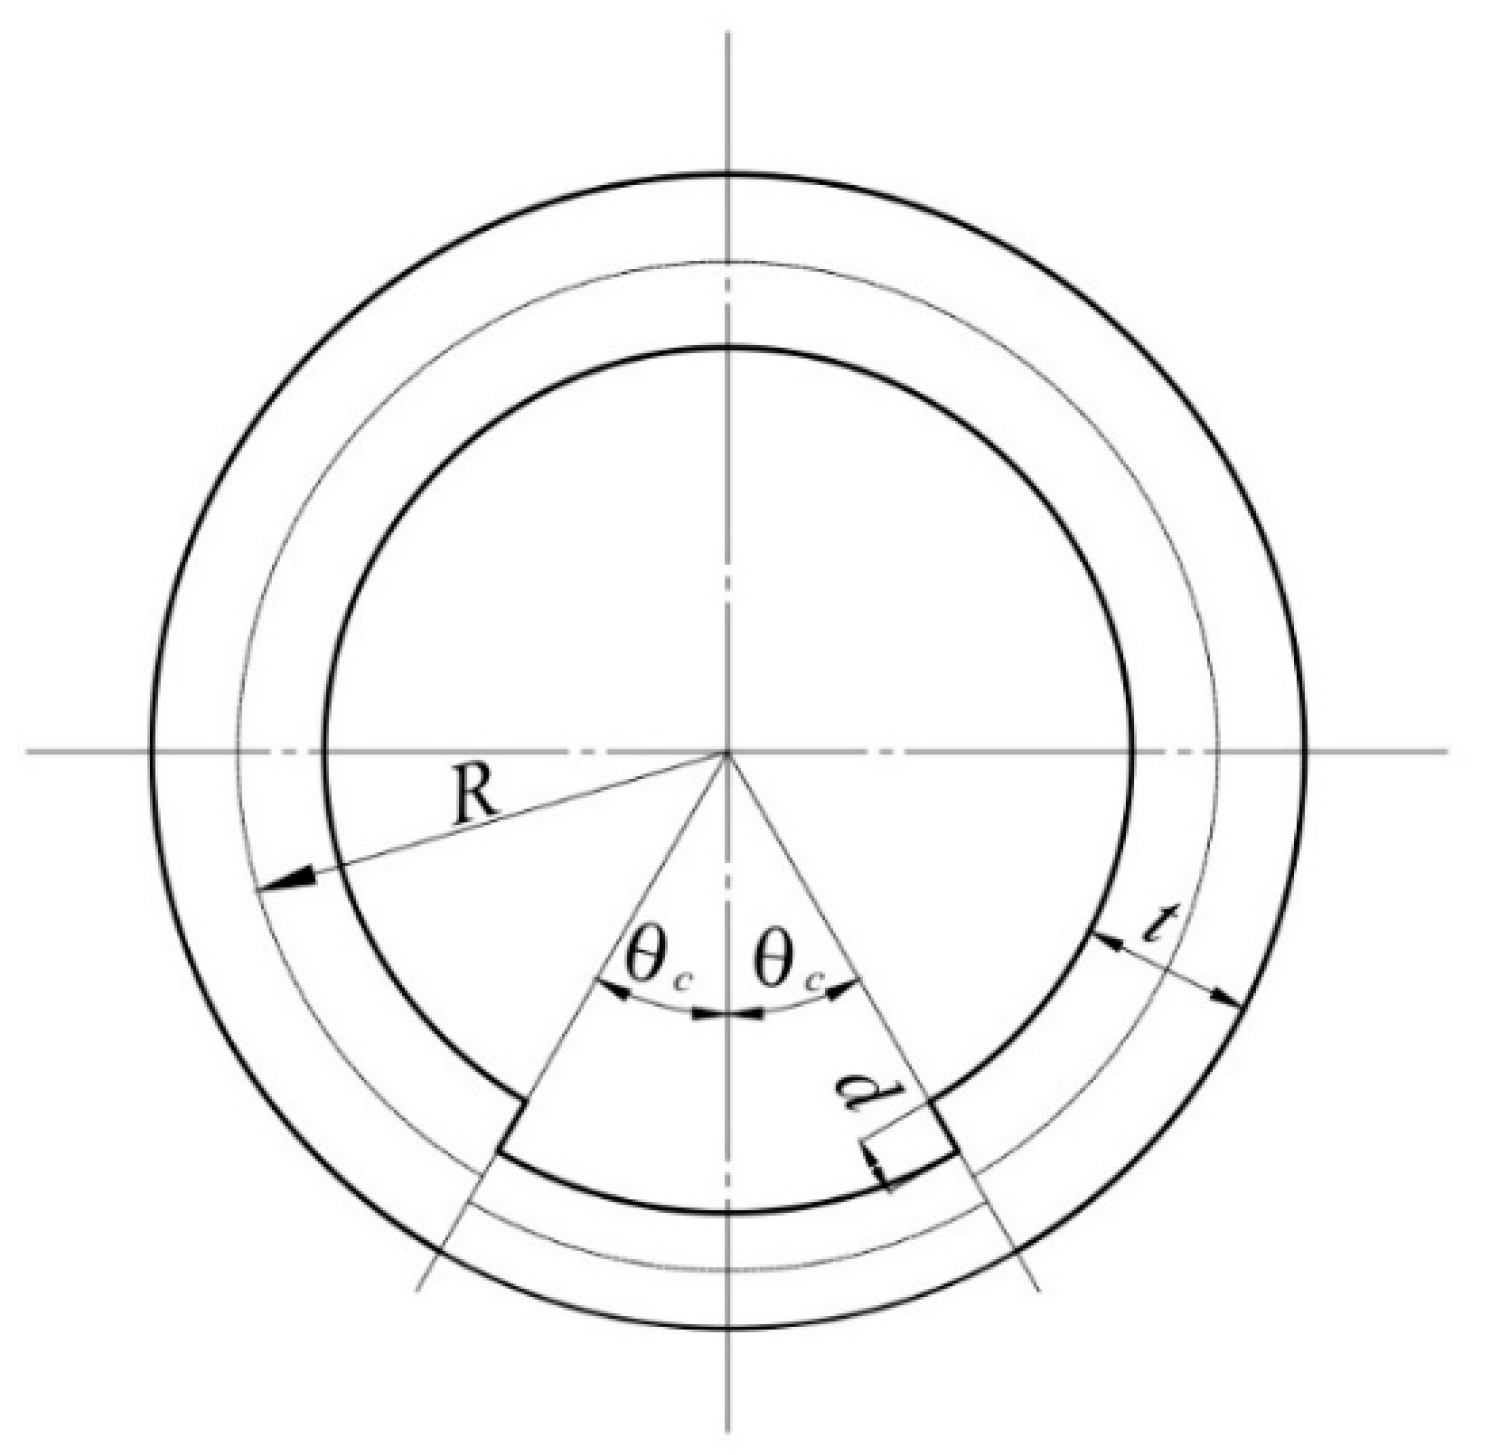
Figure 2.
Tensile specimen size (mm).
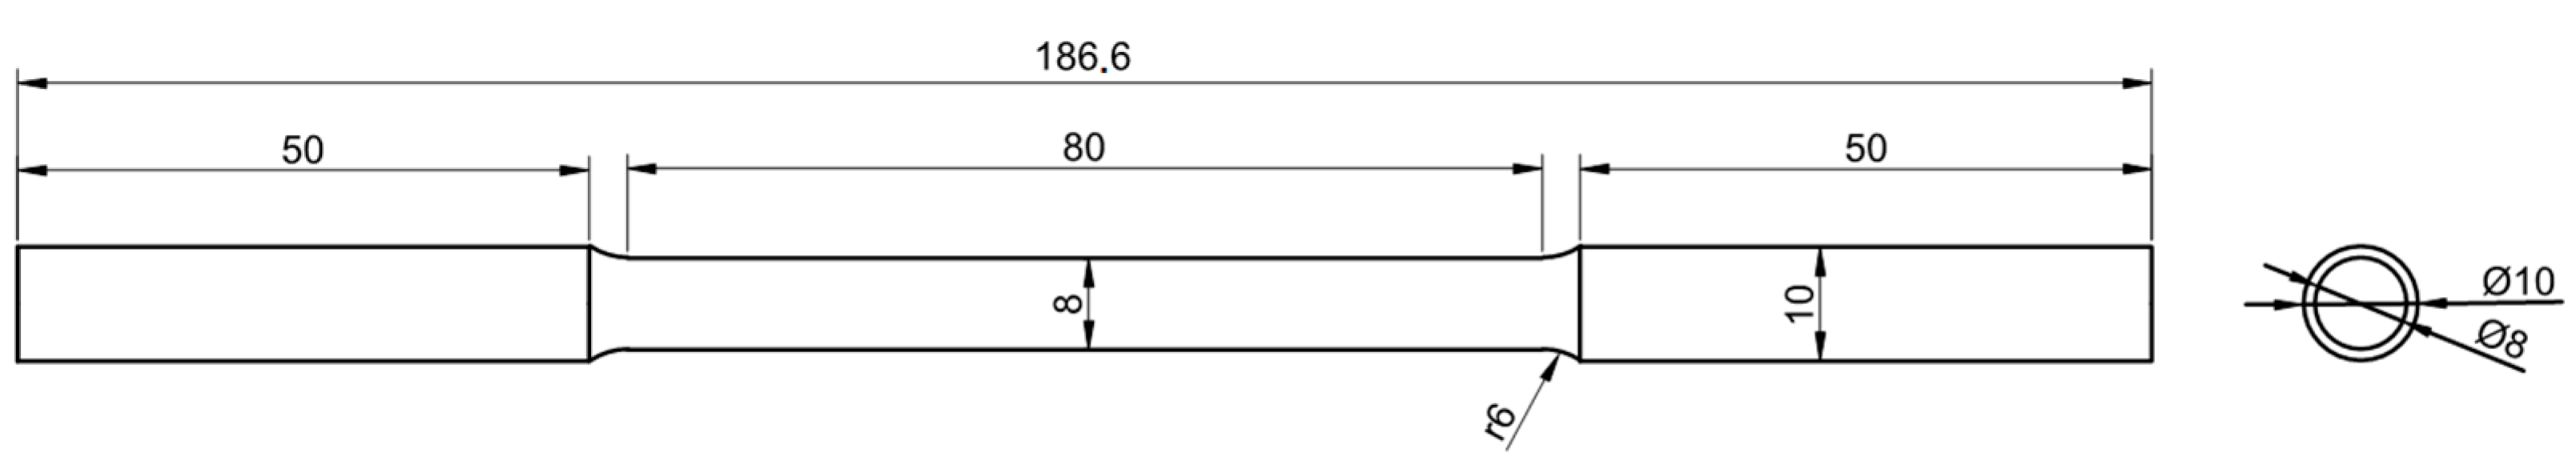
Figure 3.
Specimen with a circular section before and after the material test.

Figure 4.
Stress–strain curves for X65 pipelines.
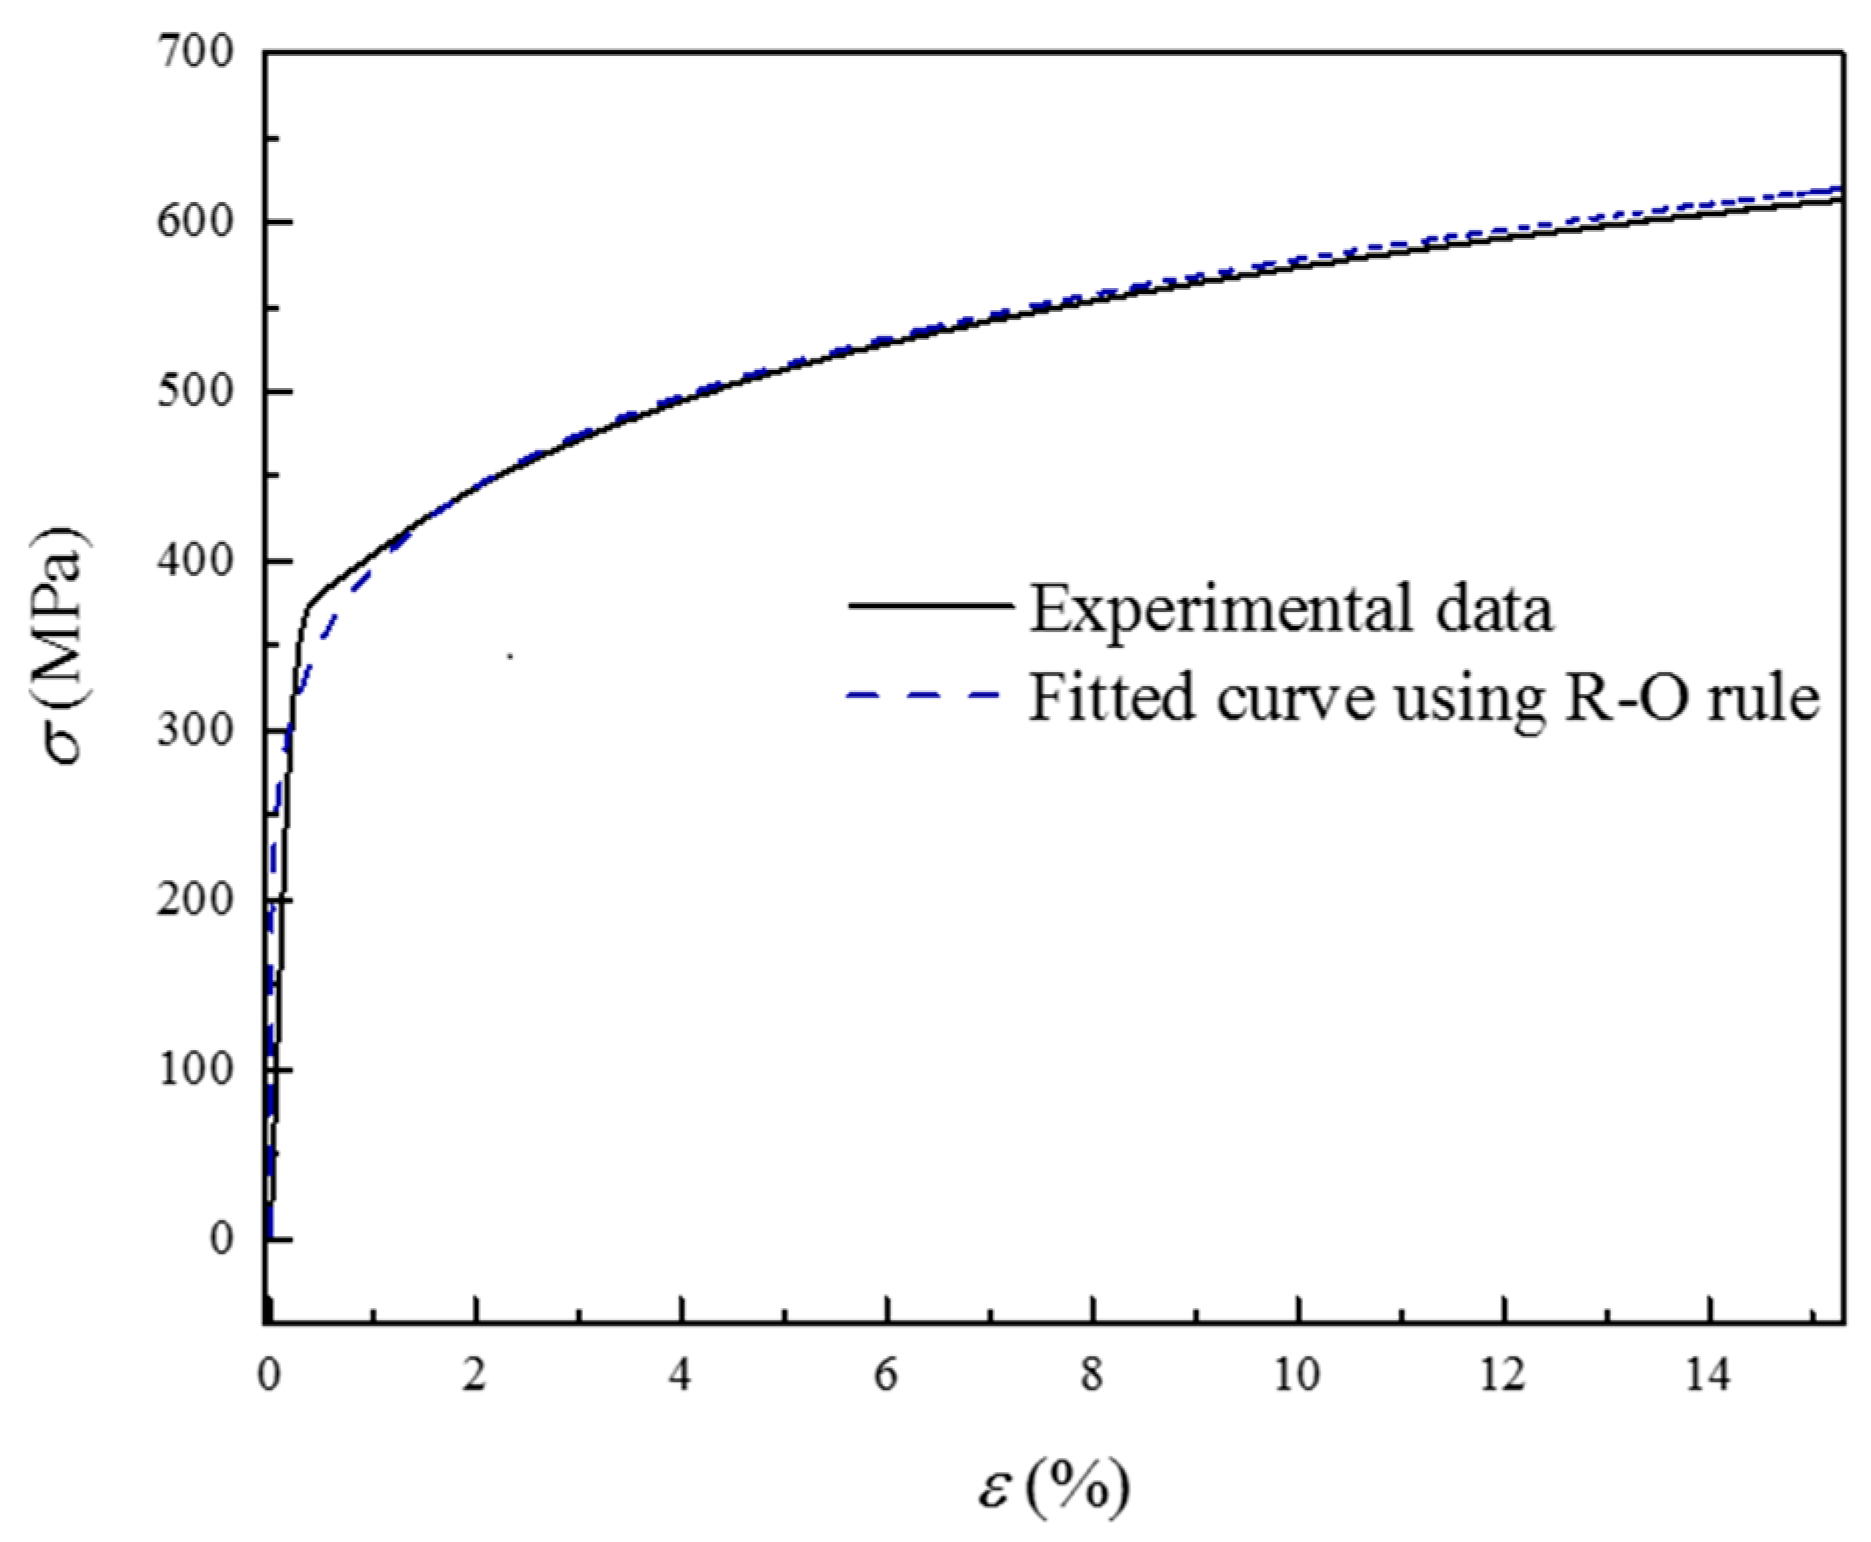
Figure 5.
Experimental setup for X65 pipelines, (a) schematic and (b) photograph of the experimental setup.
Figure 5.
Experimental setup for X65 pipelines, (a) schematic and (b) photograph of the experimental setup.
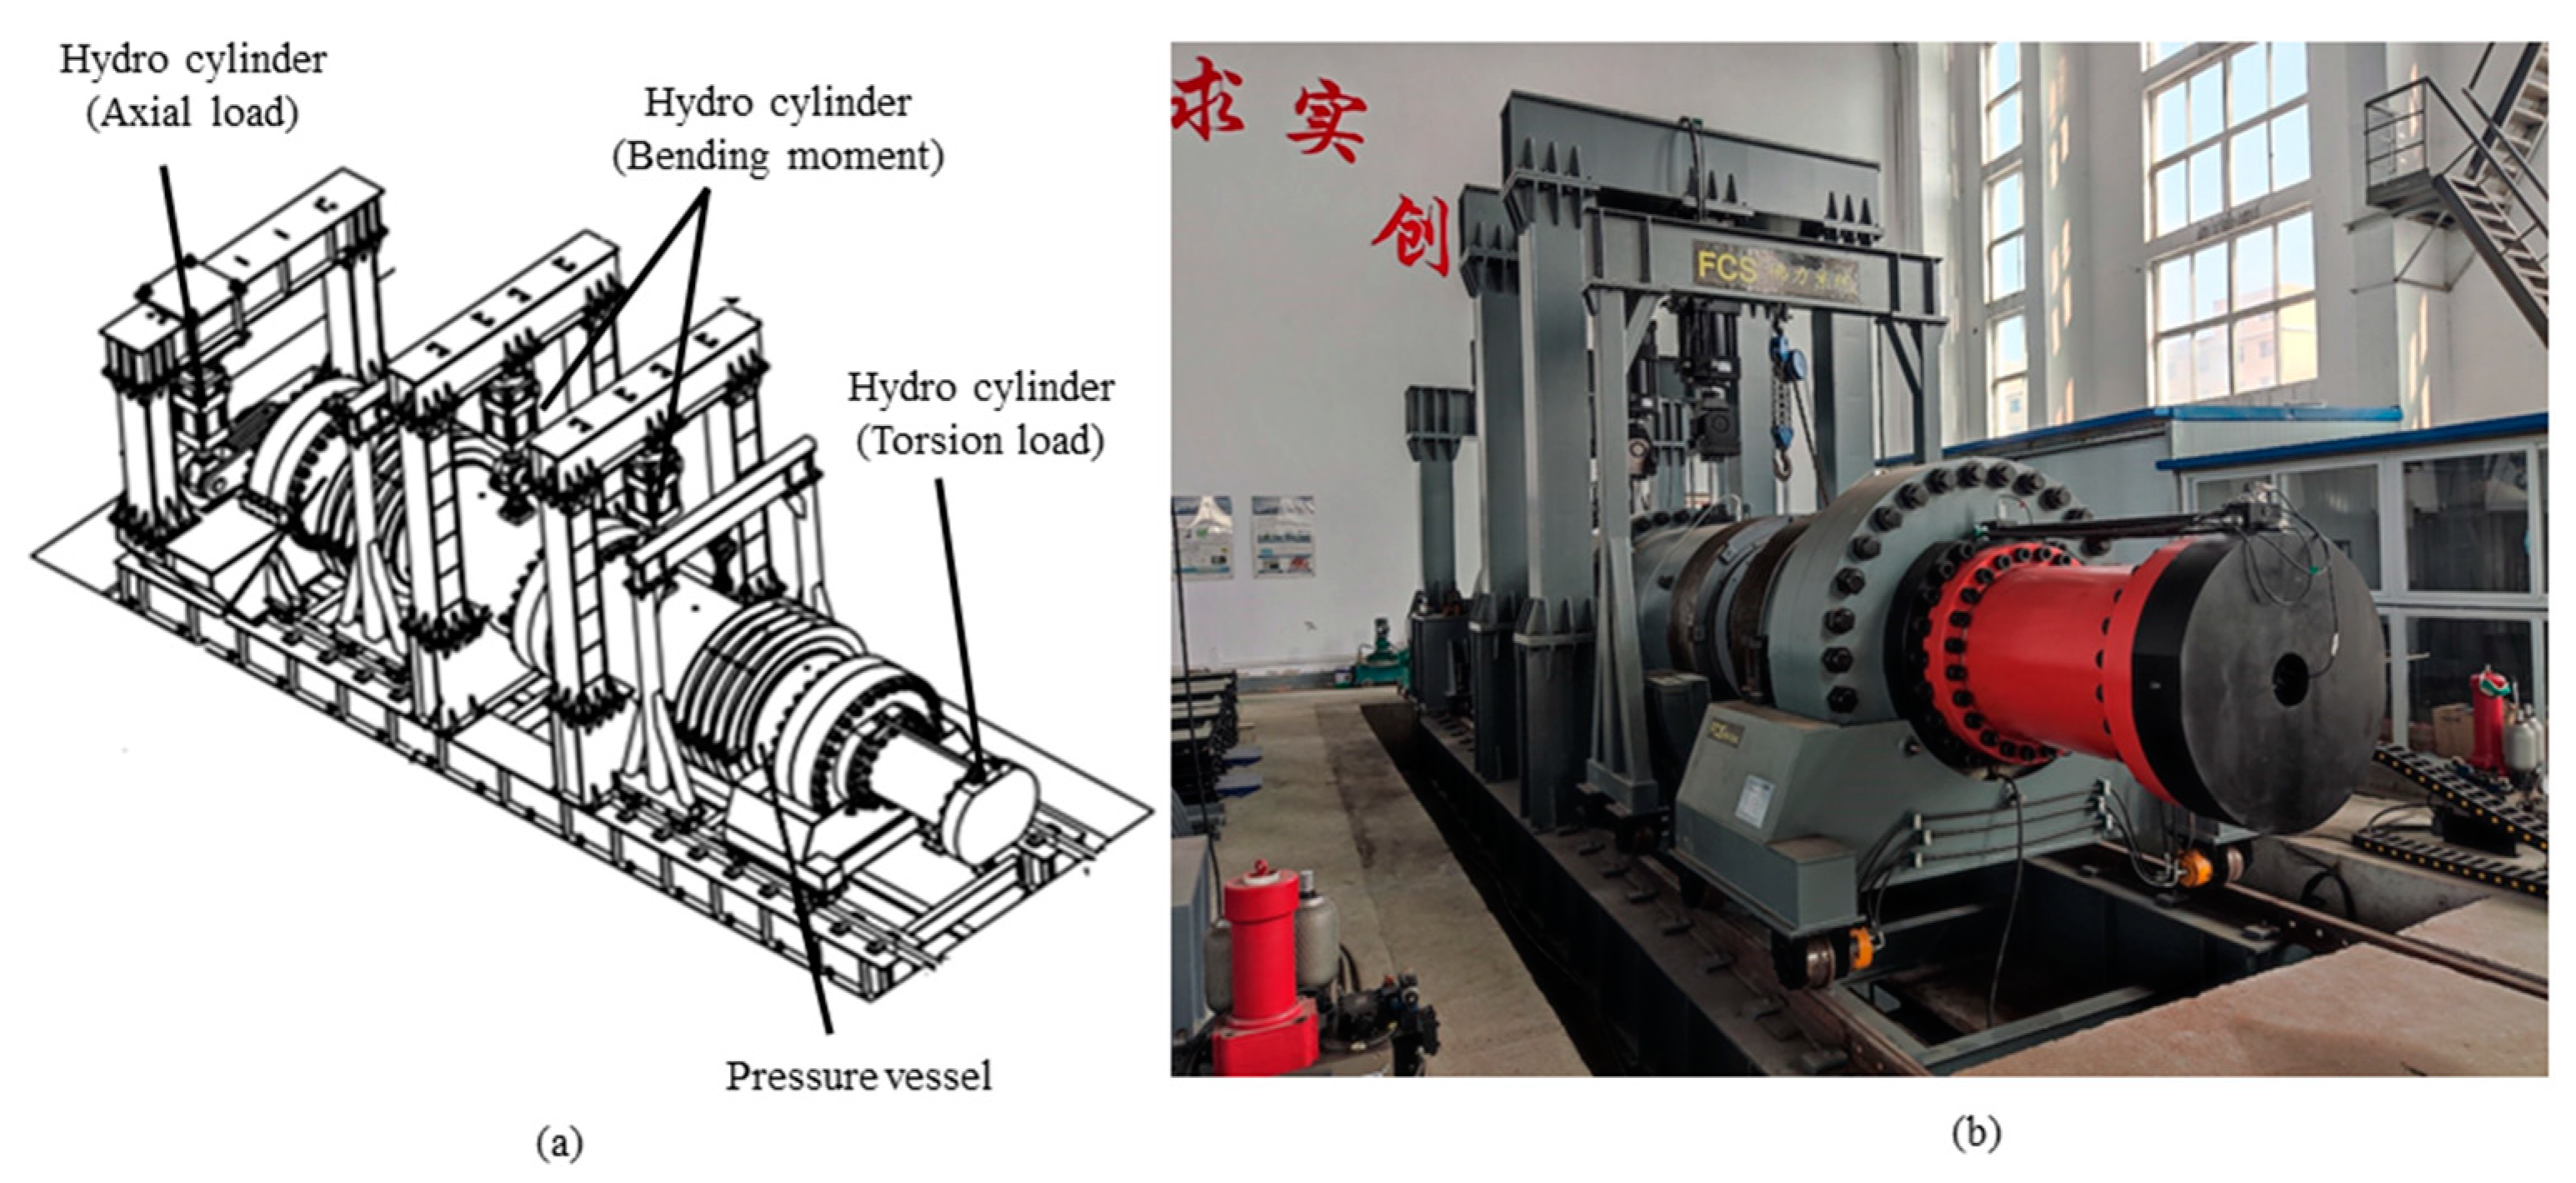
Figure 6.
Schematic diagram of dual defects distributed in (a) the axial direction, (b) the circumferential direction and (c) the diagonal direction.
Figure 6.
Schematic diagram of dual defects distributed in (a) the axial direction, (b) the circumferential direction and (c) the diagonal direction.
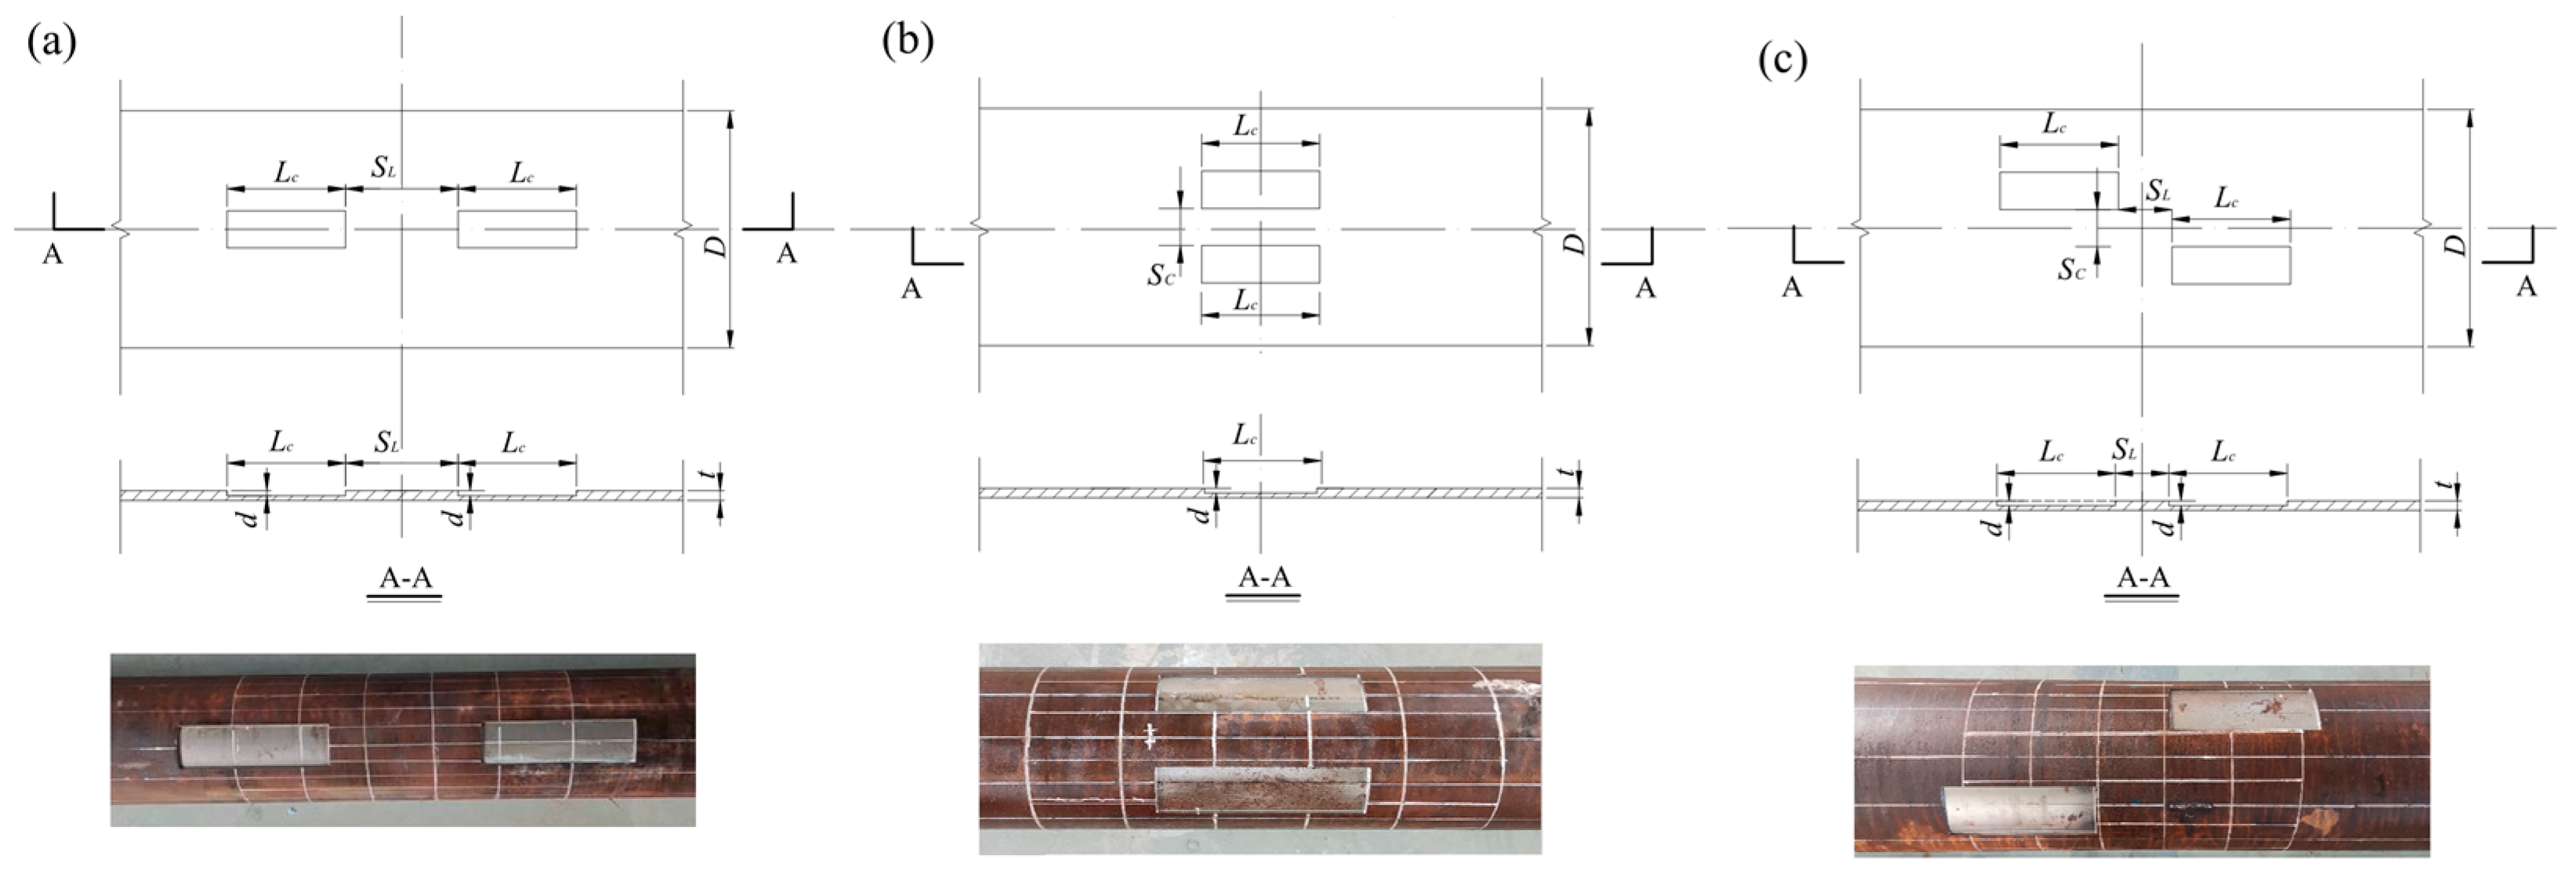
Figure 7.
Pressure–time history of the three pipeline specimens.

Figure 8.
The buckling modes of the pipeline specimens, (a) X65-1, (b) X65-2 and (c) X65-3.
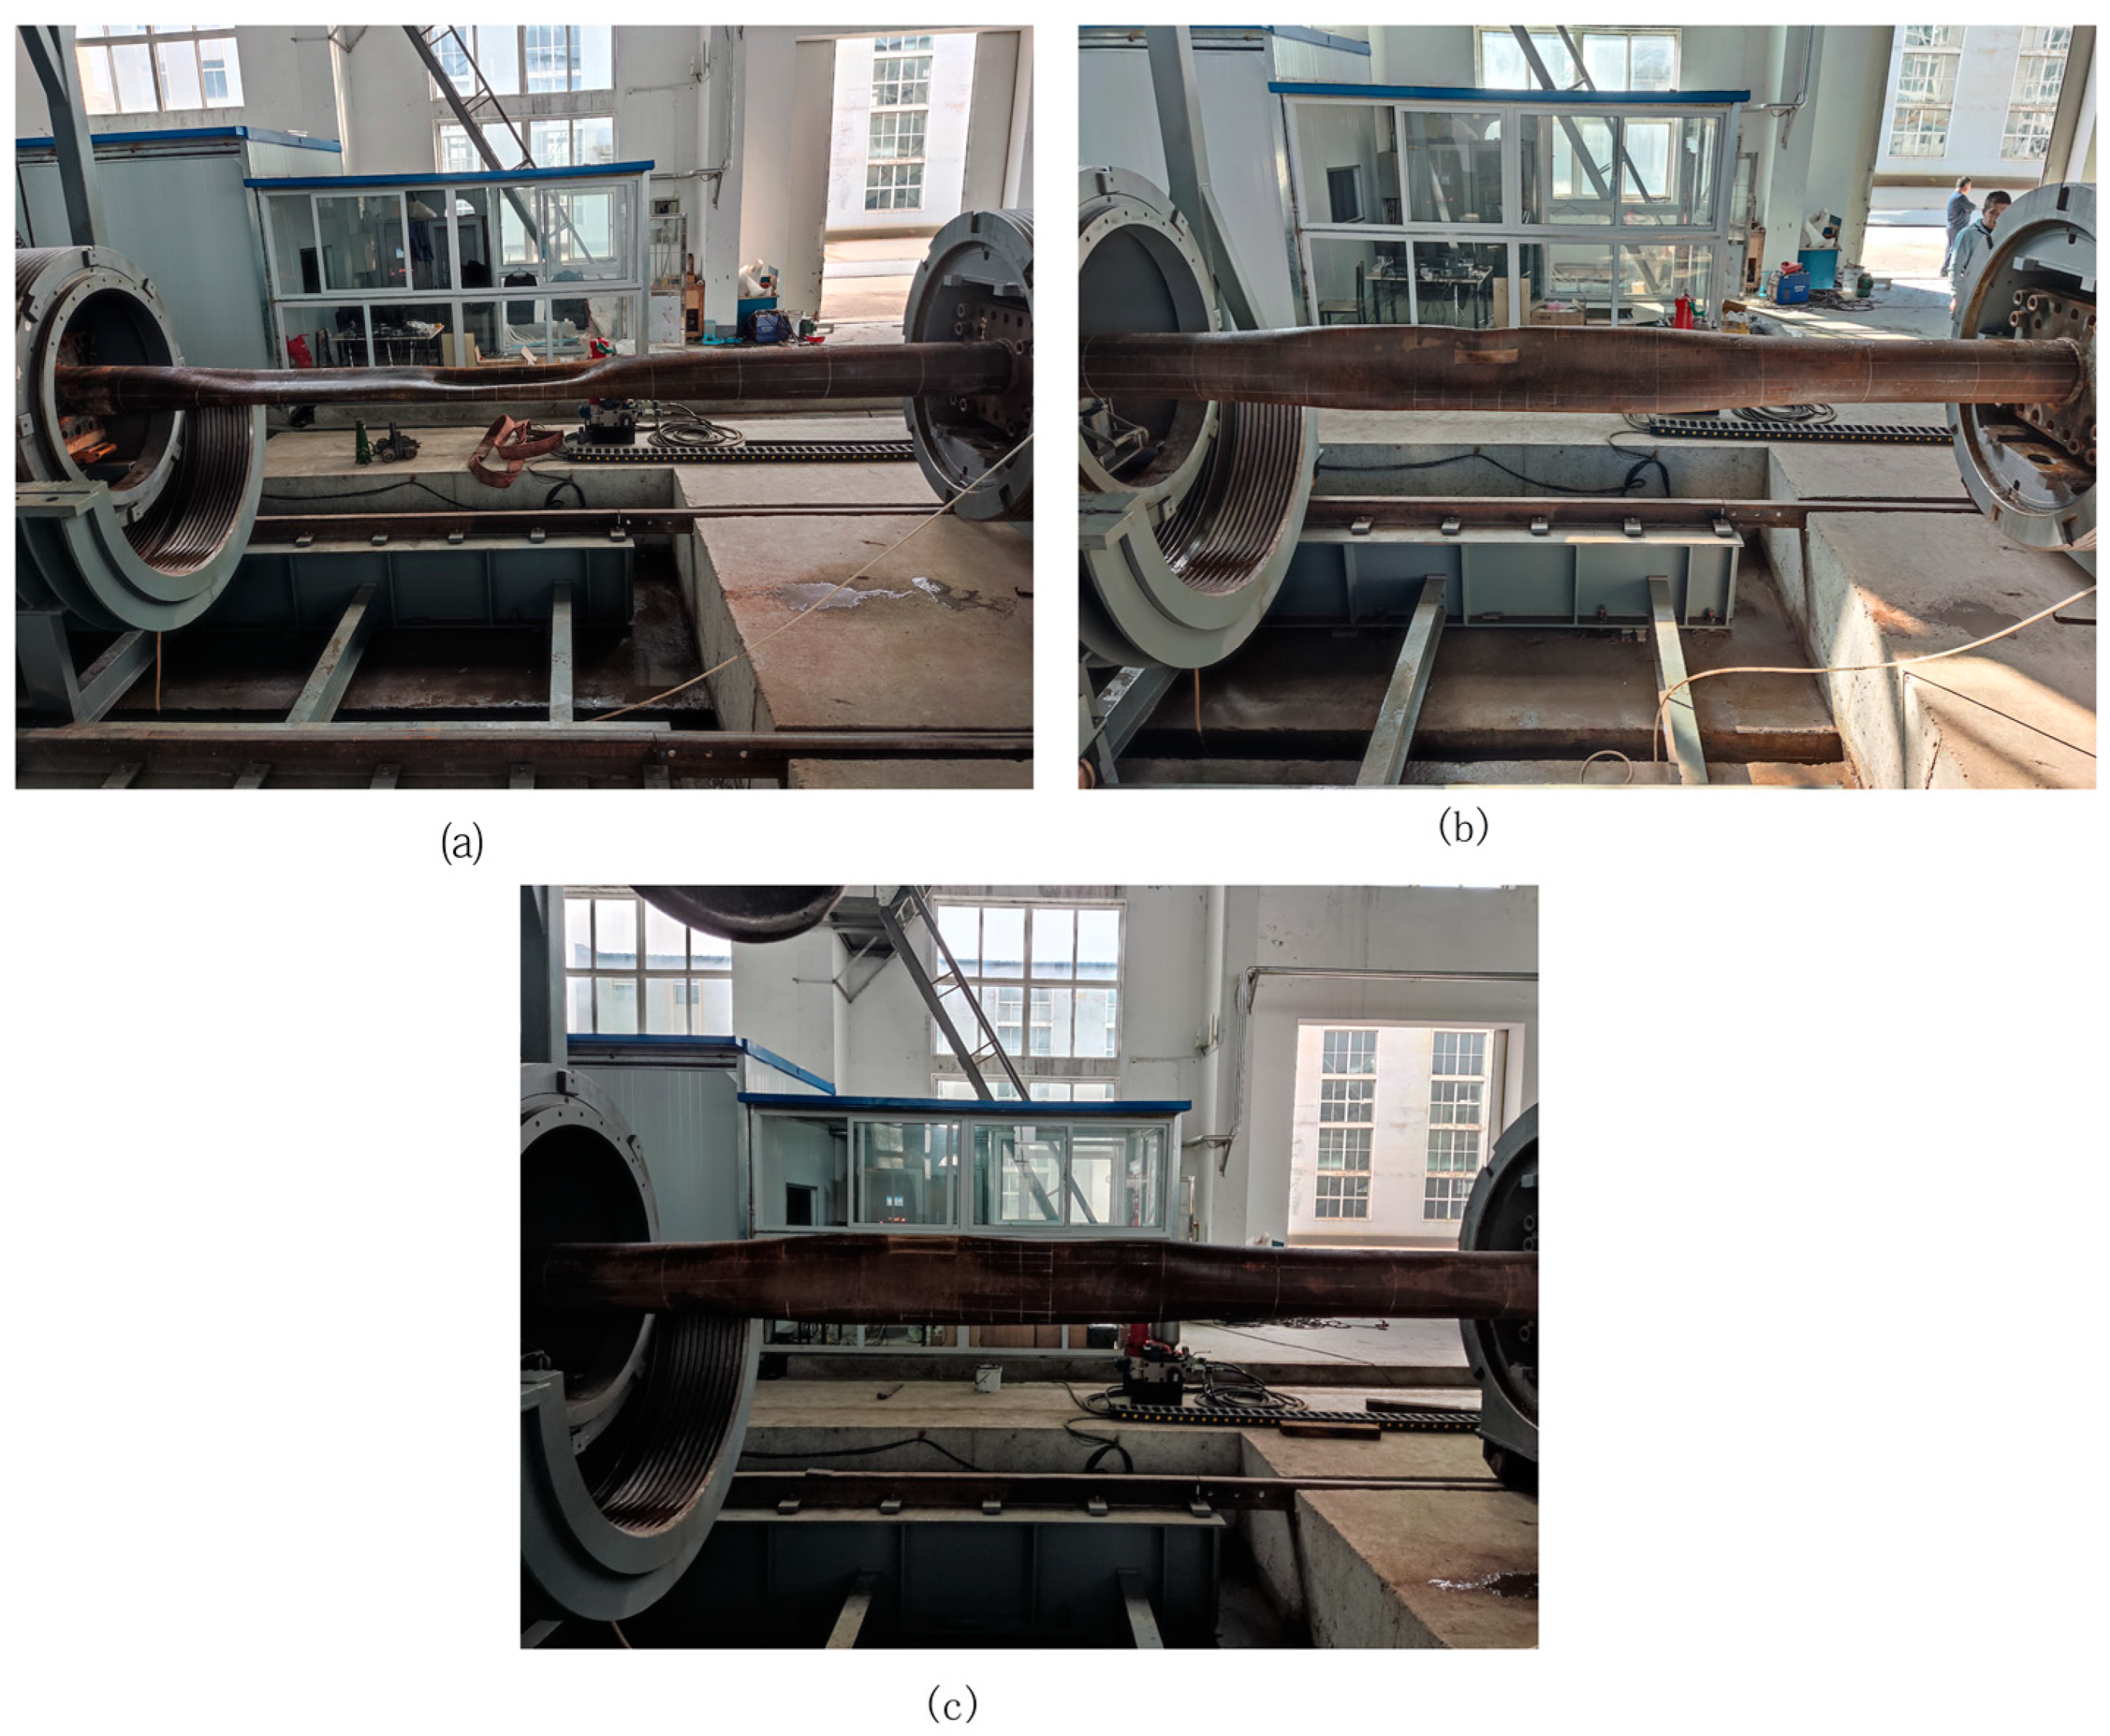
Figure 9.
Schematic diagram of the boundary conditions and forces of the finite element model.
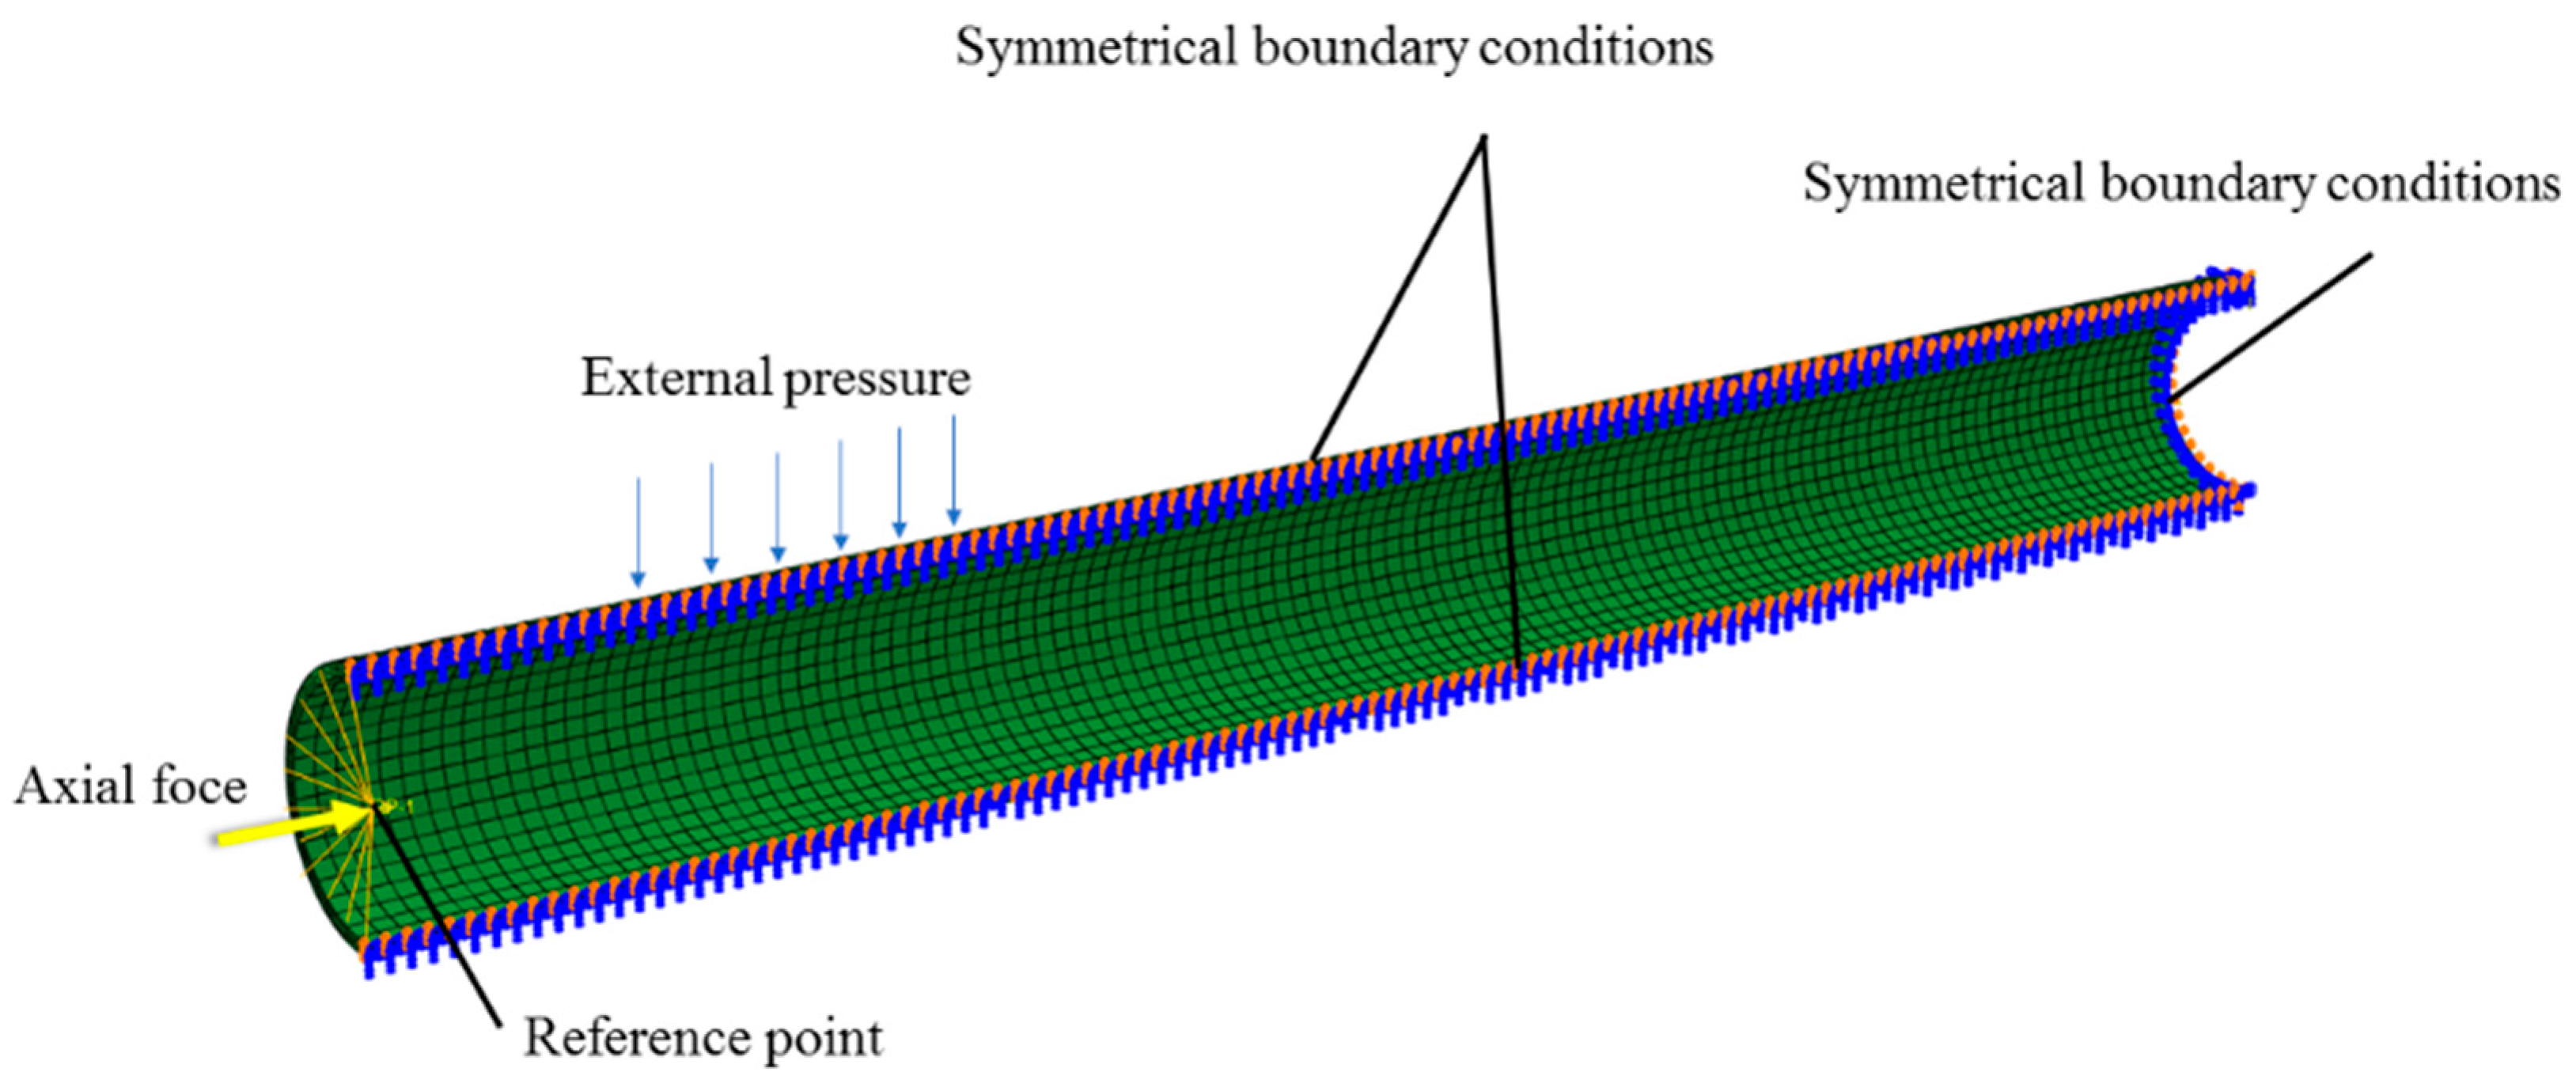
Figure 10.
Sensitivity analysis of the number of grids, (a) unchamfered model and (b) chamfered model.
Figure 10.
Sensitivity analysis of the number of grids, (a) unchamfered model and (b) chamfered model.

Figure 11.
Schematic diagram of finite element mesh, (a) unchamfered model and (b) chamfered model.
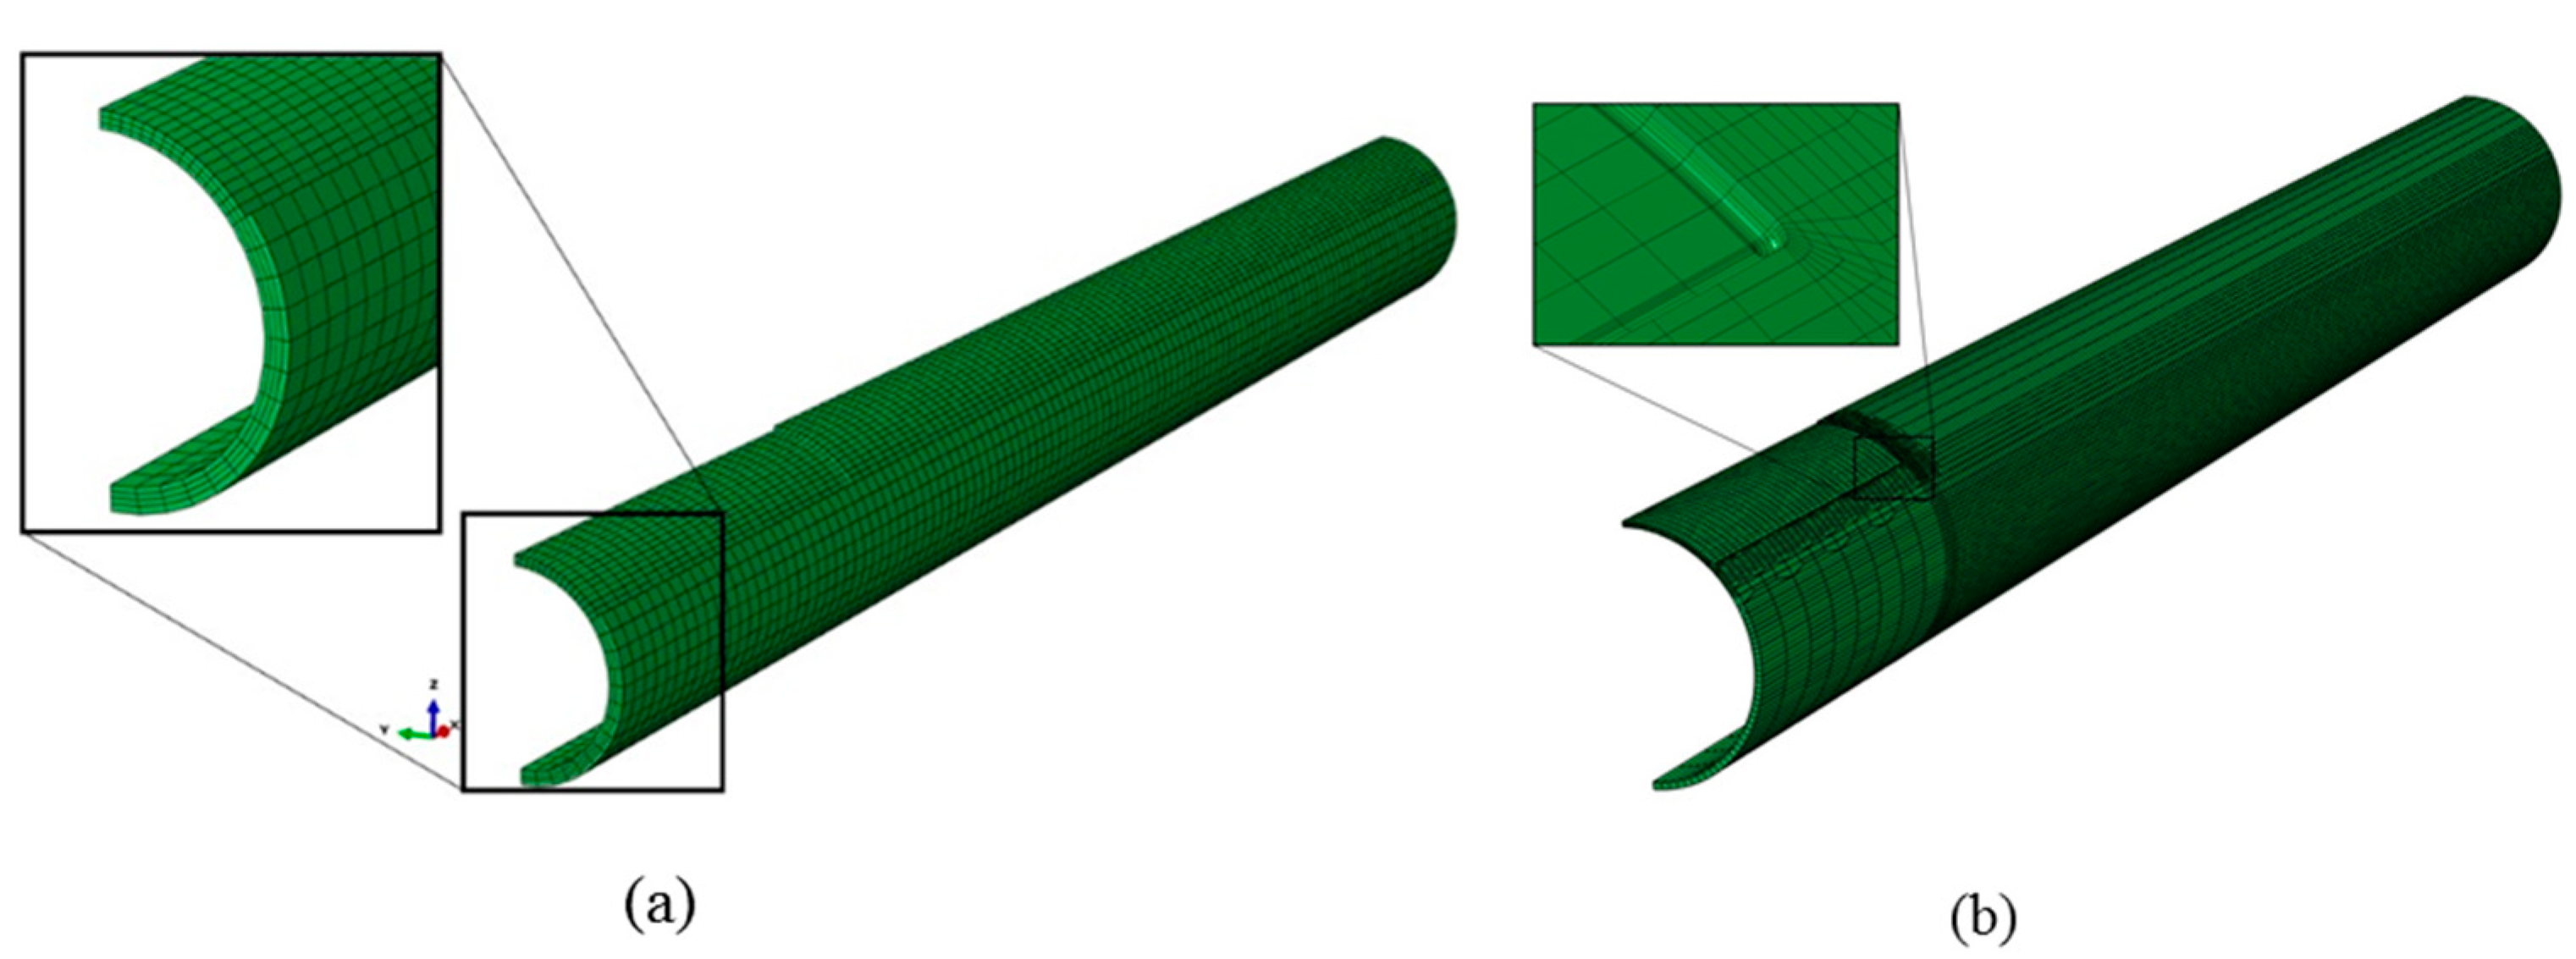
Figure 12.
Comparison between the results of chamfered and unchamfered models.

Figure 13.
Comparison of the collapse modes of finite element and tests, (a) X65-1, (b) X65-2 and (c) X65-3.
Figure 13.
Comparison of the collapse modes of finite element and tests, (a) X65-1, (b) X65-2 and (c) X65-3.
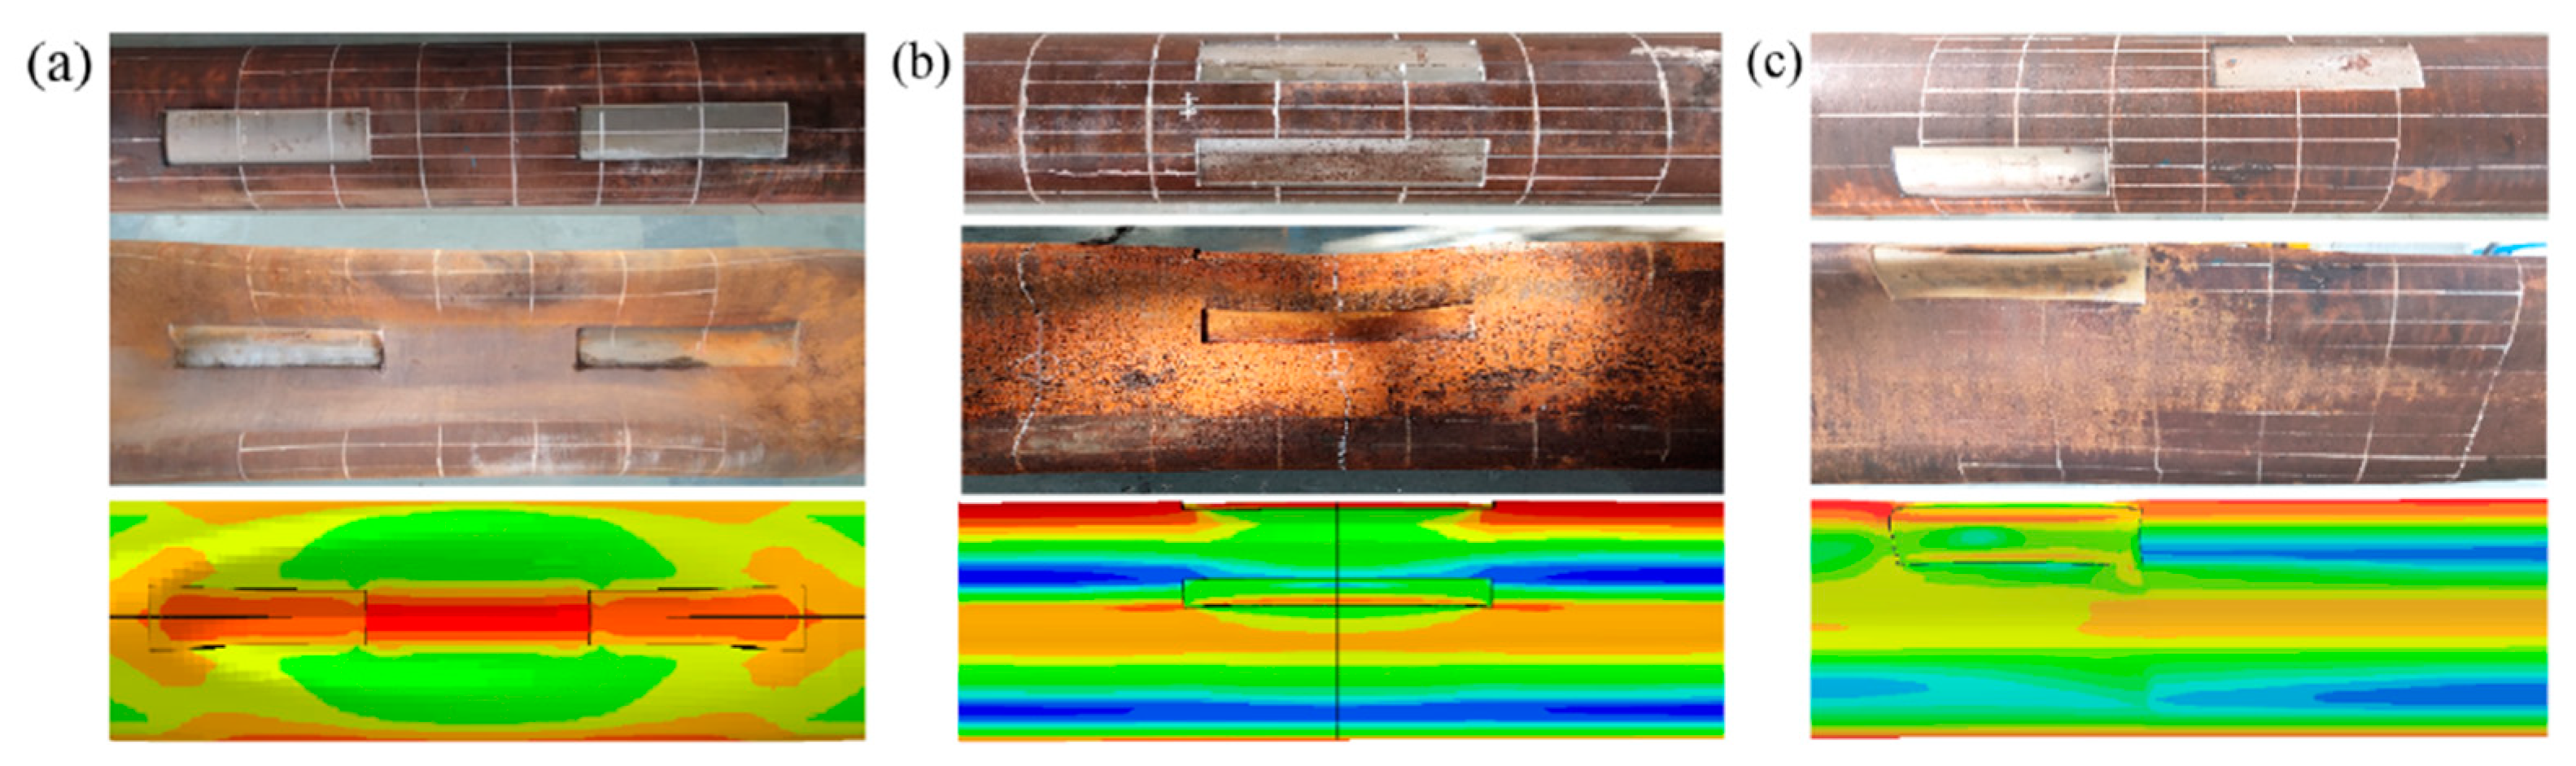
Figure 14.
Effect of D/t on buckling response, (a) θc = 0.3 π and (b) θc = 0.6 π.
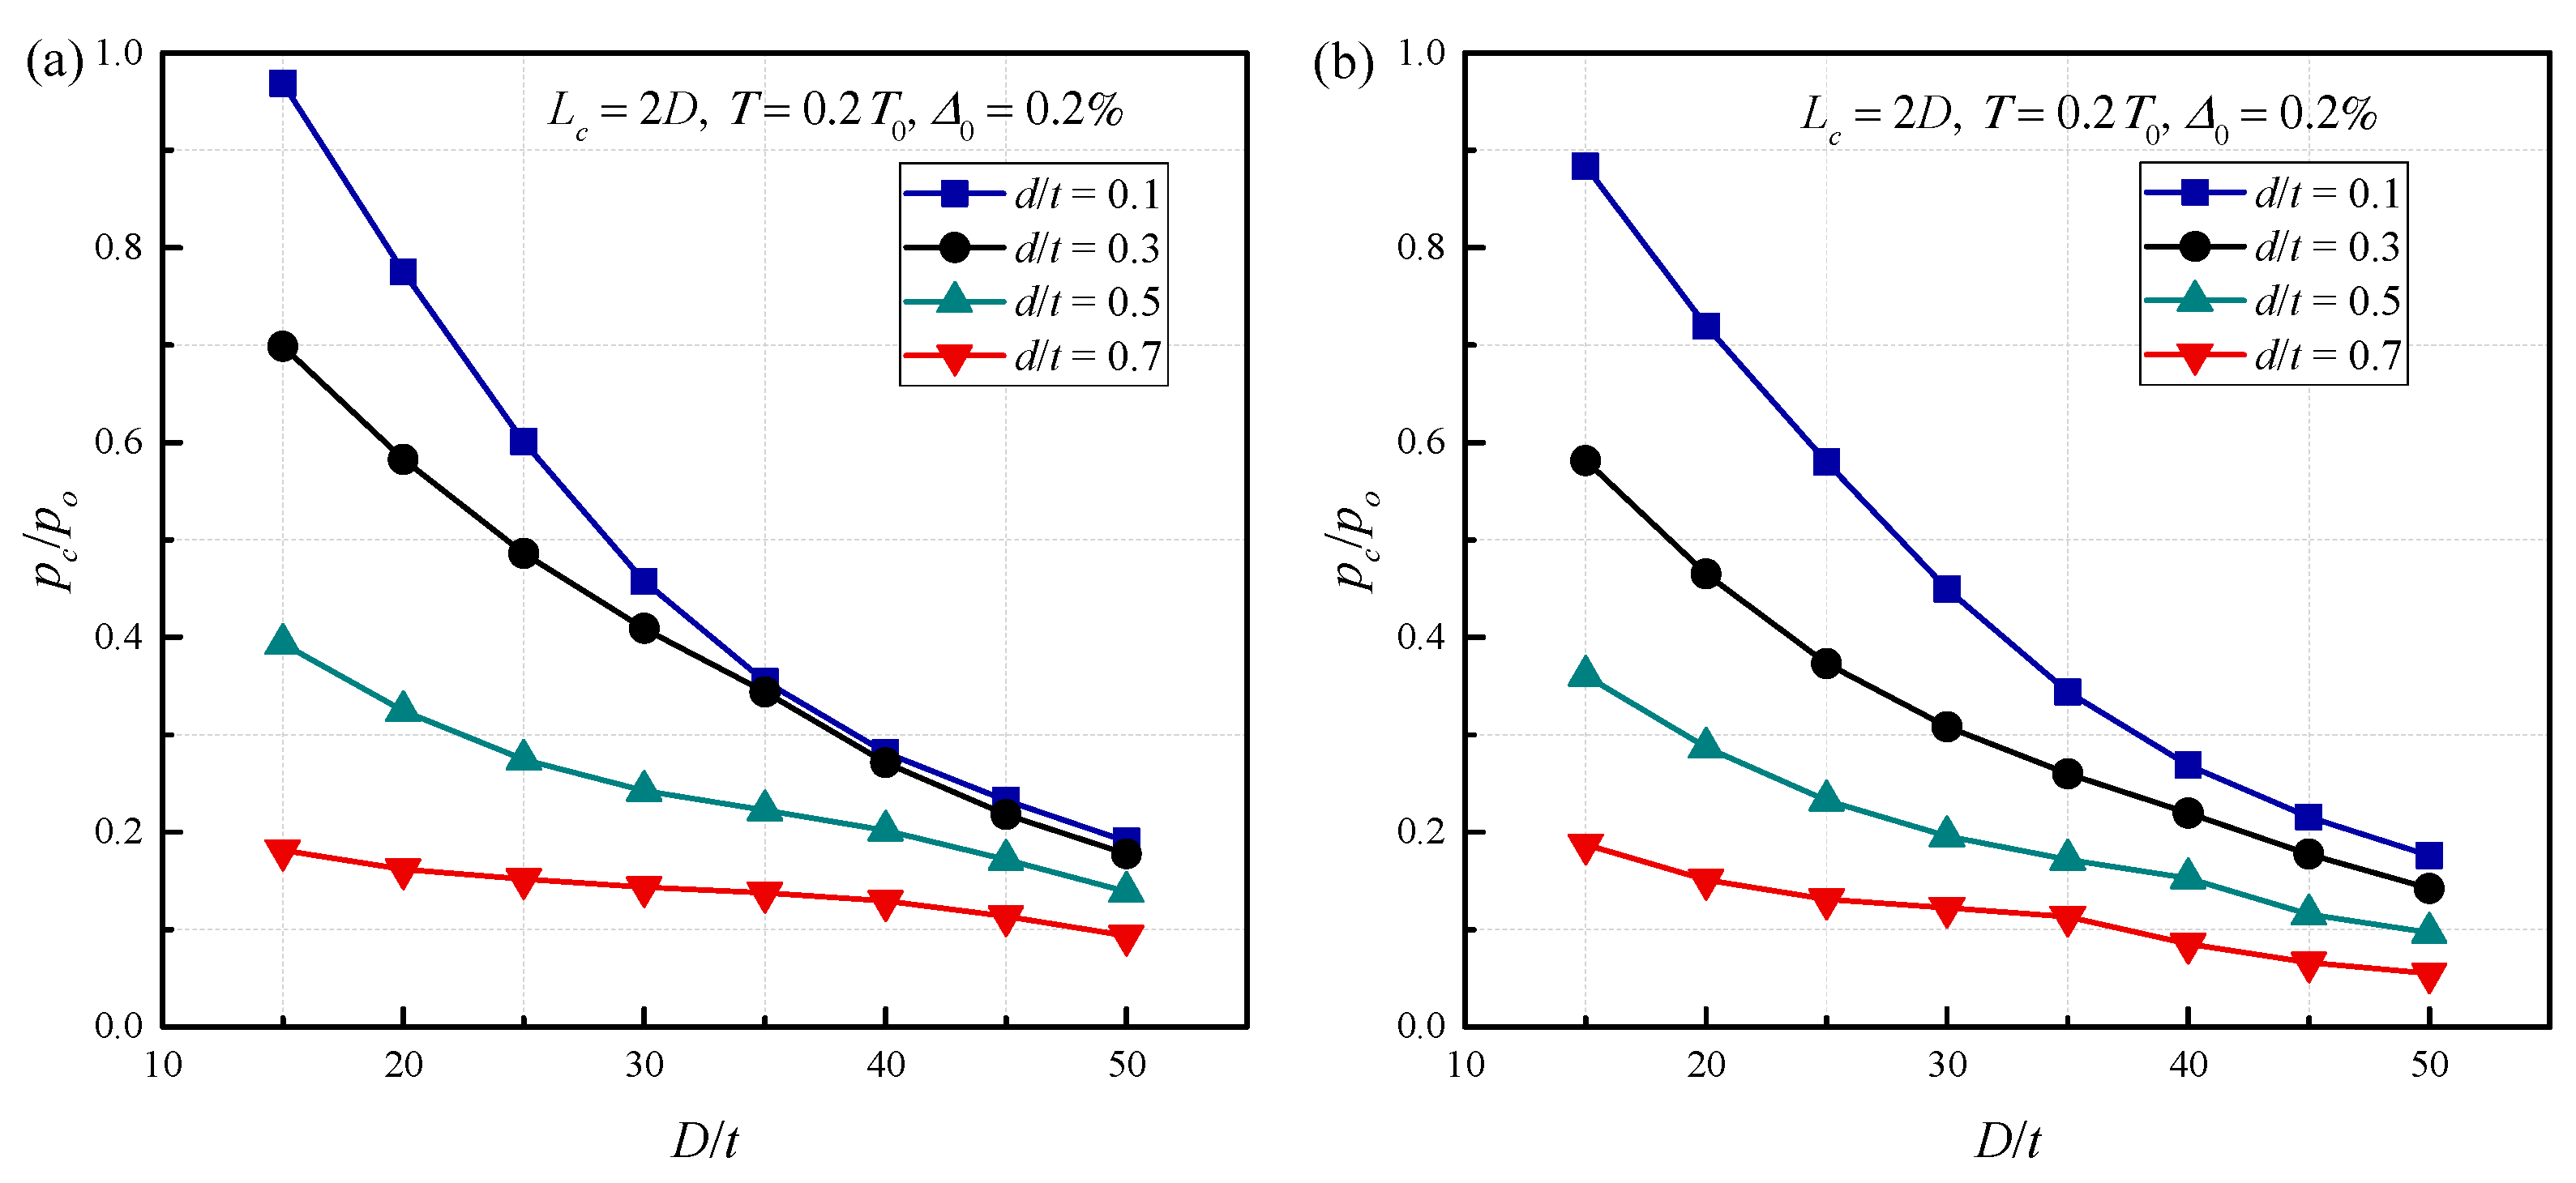
Figure 15.
Effect of Δ0 on buckling response, (a) D/t = 15 and (b) D/t = 20.
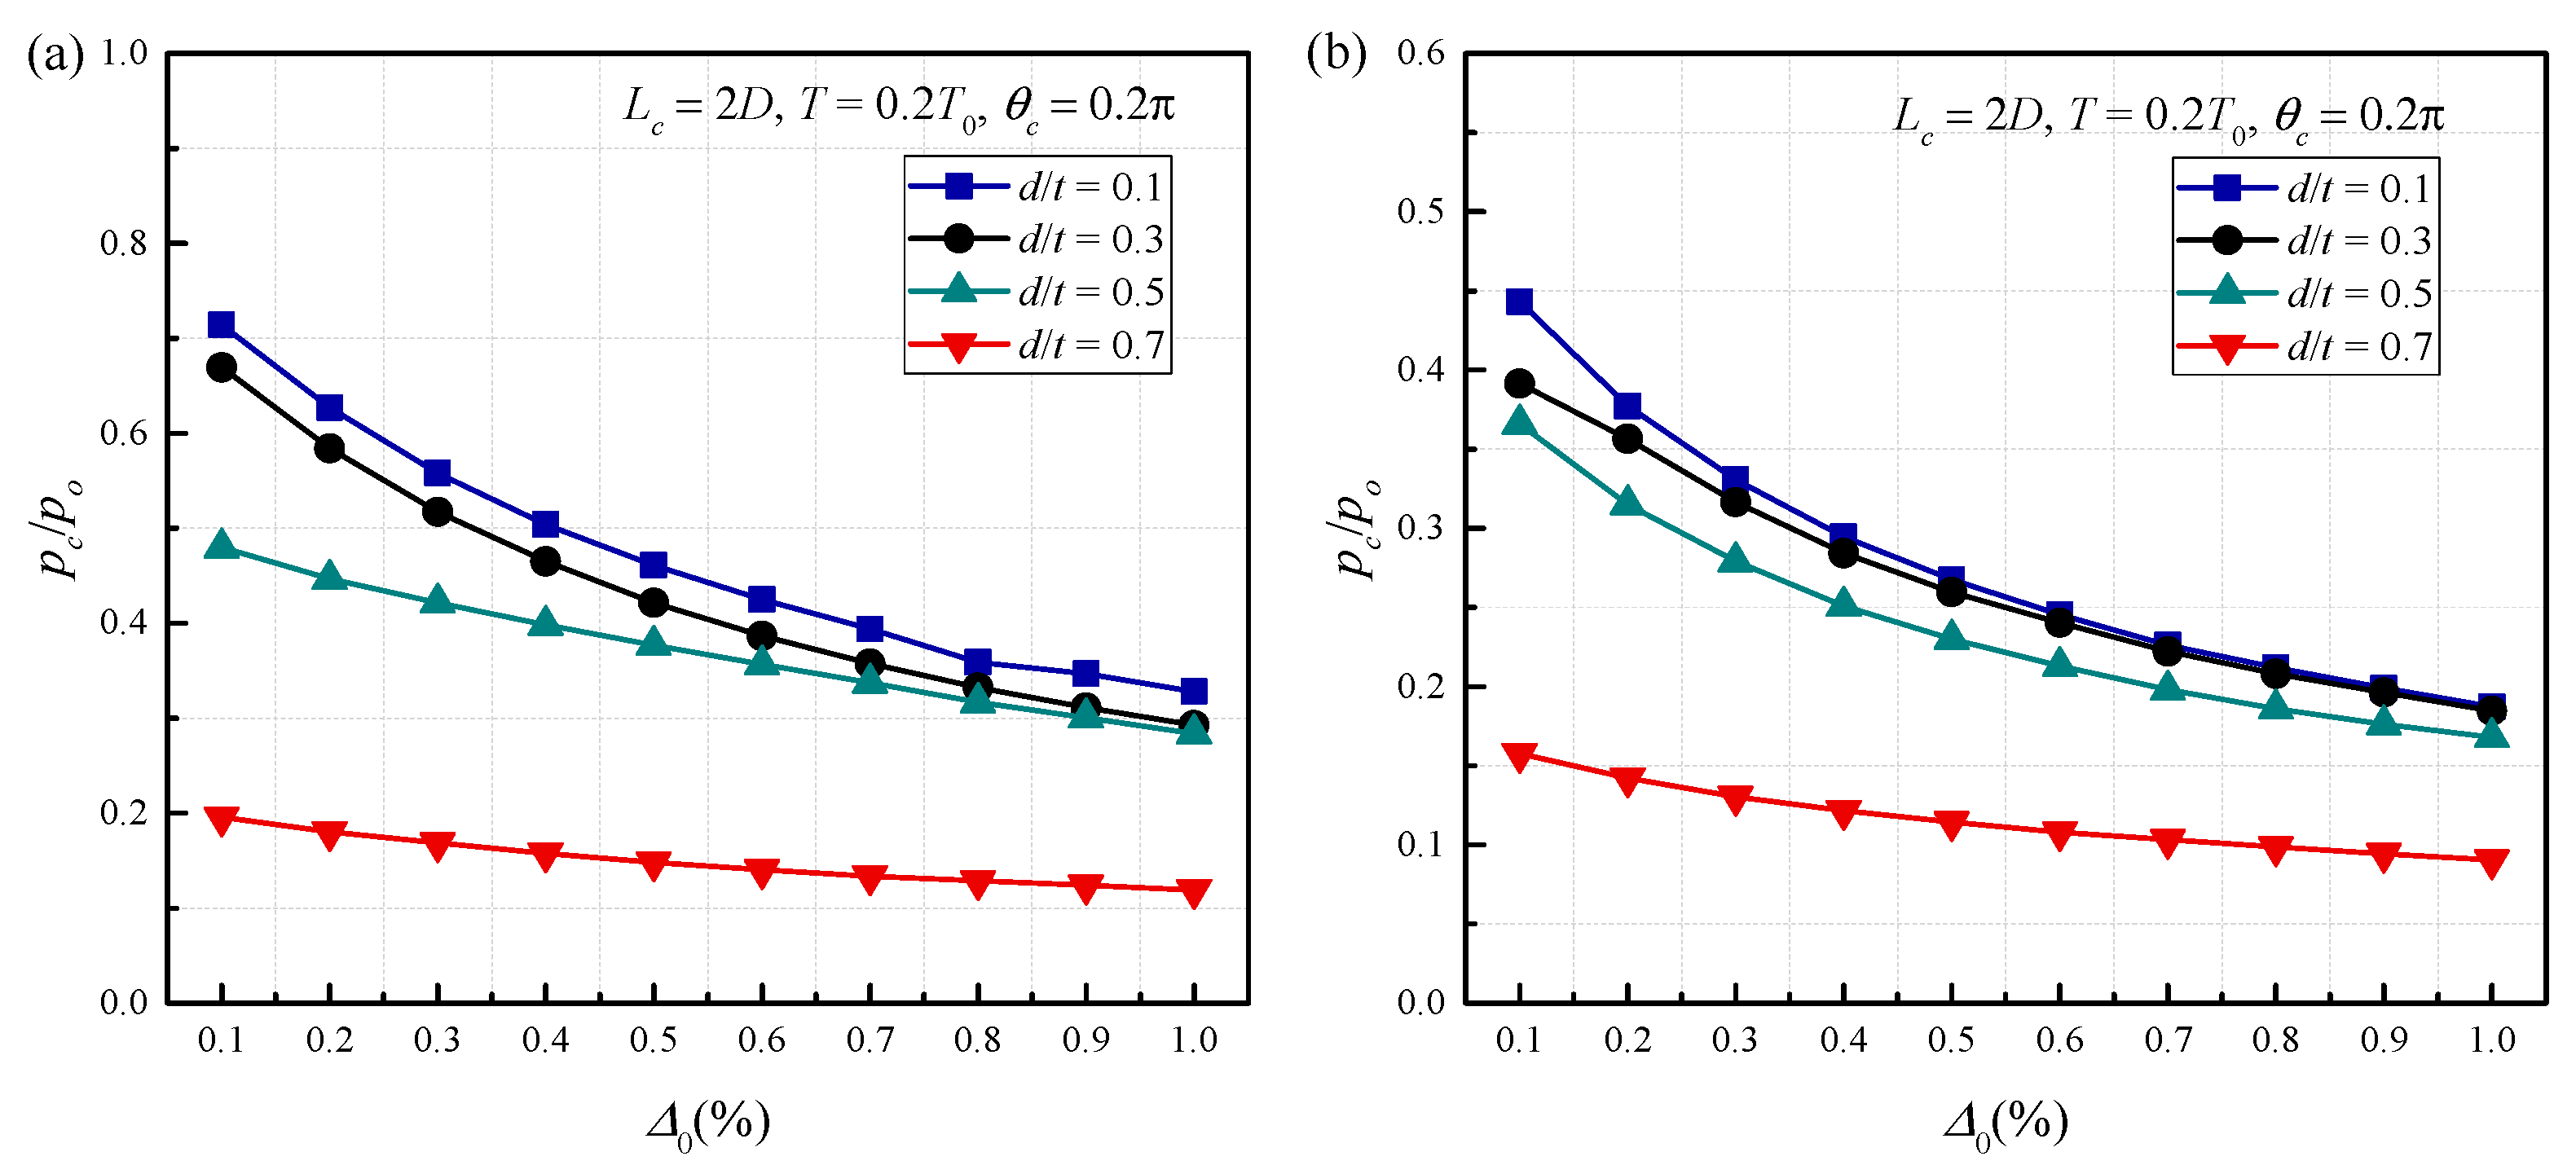
Figure 16.
Effect of θc on buckling response, (a) D/t = 15 and (b) D/t = 20.
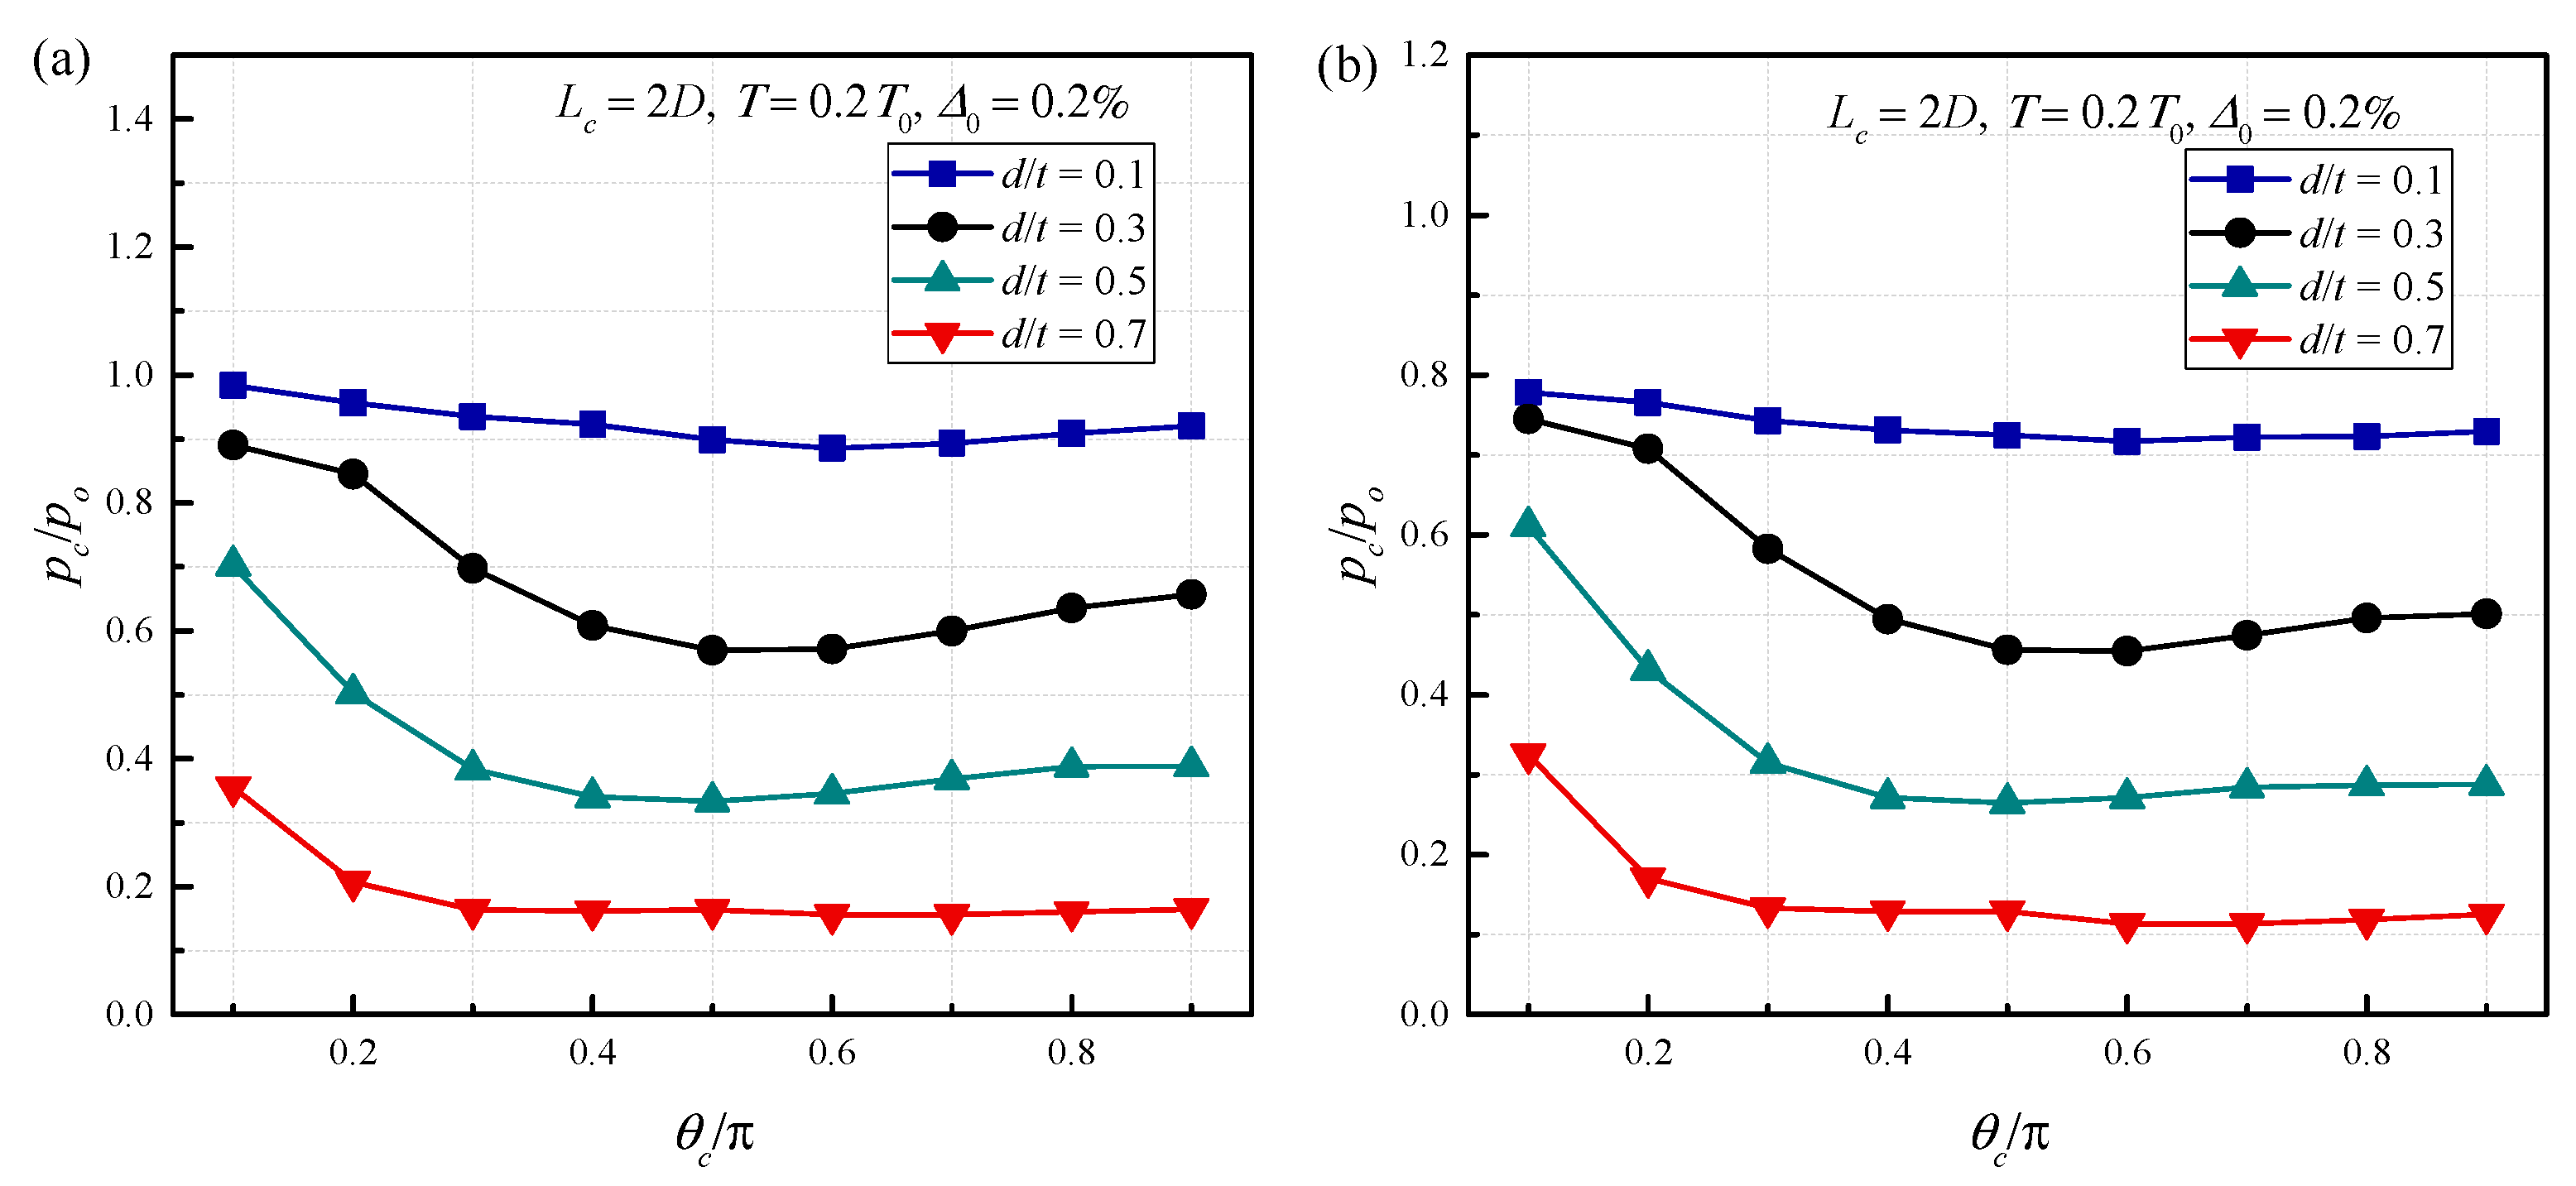
Figure 17.
Effect of d on buckling response, (a) D/t = 15 and (b) D/t = 20.
Figure 18.
Effect of Lc on buckling response, (a) D/t = 15 and (b) D/t = 20.

Figure 19.
Effect of T on buckling response, (a) D/t = 15 and (b) D/t = 20.

Figure 20.
Effect of σy on buckling response, (a) D/t = 15 and (b) D/t = 20.

Figure 21.
Effect of β on buckling response, (a) D/t = 15 and (b) D/t = 20.

Figure 22.
Comparison between fitting formula and finite element results.
Figure 23.
Error distribution histogram.

Figure 24.
Finite element models of pipelines with (a) two defects, (b) three defects and (c) four defects.
Figure 24.
Finite element models of pipelines with (a) two defects, (b) three defects and (c) four defects.
Figure 25.
Comparison for the collapse pressure of present formula and finite element analysis of steel pipelines with three and four defects.
Figure 25.
Comparison for the collapse pressure of present formula and finite element analysis of steel pipelines with three and four defects.

Table 1.
Geometric characteristics of corrosion defects used in experiments.
| Specimen | Aligned Type | LC (mm) | c (mm) | d (mm) | SL (mm) | SC (mm) |
|---|---|---|---|---|---|---|
| X65-1 | Axial | 273 | 85.7 | 6 | 273 | |
| X65-2 | Circumferential | 273 | 85.7 | 6 | - | 85.7 |
| X65-3 | Diagonal | 273 | 85.7 | 6 | 136.5 | 85.7 |
Table 2.
Comparison of collapse pressures between the finite element analysis and tests.
| Specimen | Aligned Type | pc a (MPa) | pcb (MPa) | Error (%) |
|---|---|---|---|---|
| X65-1 | Axial | 27.5 | 24.33 | 11.53 |
| X65-2 | Circumferential | 28.81 | 25.64 | 11.02 |
| X65-3 | Diagonal | 31.73 | 29.19 | 8.02 |
a Experimental results; b finite element results.
Publisher’s Note: MDPI stays neutral with regard to jurisdictional claims in published maps and institutional affiliations. |
© 2022 by the authors. Licensee MDPI, Basel, Switzerland. This article is an open access article distributed under the terms and conditions of the Creative Commons Attribution (CC BY) license (https://creativecommons.org/licenses/by/4.0/).
Share and Cite
MDPI and ACS Style
Feng, C.; Wu, H.; Li, X. Buckling Analysis of Corroded Pipelines under Combined Axial Force and External Pressure. Metals 2022, 12, 308. https://doi.org/10.3390/met12020308
AMA Style
Feng C, Wu H, Li X. Buckling Analysis of Corroded Pipelines under Combined Axial Force and External Pressure. Metals. 2022; 12(2):308. https://doi.org/10.3390/met12020308
Chicago/Turabian StyleFeng, Chunjian, Hang Wu, and Xin Li. 2022. "Buckling Analysis of Corroded Pipelines under Combined Axial Force and External Pressure" Metals 12, no. 2: 308. https://doi.org/10.3390/met12020308
Note that from the first issue of 2016, this journal uses article numbers instead of page numbers. See further details here.