Article

Investigation on Anisotropic Mechanical Behavior of Ti-6Al-4V Alloy via Schmid Factor and Kernel Average Misorientation Distribution

1
School of Materials Science and Engineering, Harbin Institute of Technology (Shenzhen), Shenzhen 518055, China
2
School of Materials Science and Engineering, Harbin Institute of Technology, Harbin 150001, China
3
National Key Laboratory of Precision Hot Processing of Metals, Harbin Institute of Technology, Harbin 150001, China
*
Author to whom correspondence should be addressed.
These authors contributed equally to this work.
Metals 2023, 13(1), 89; https://doi.org/10.3390/met13010089
Submission received: 2 December 2022 / Revised: 26 December 2022 / Accepted: 27 December 2022 / Published: 31 December 2022

Abstract

:
Anisotropic mechanical behavior of the Ti-6Al-4V alloy is essential for its forming and service. Generally, it is preferable to minimize the in-plane anisotropy of Ti-6Al-4V sheet. The present work investigates the anisotropy of Ti-6Al-4V alloy by tensile tests along the rolling direction (RD), transverse direction (TD), and diagonal direction (DD) of the sheet, evaluating the anisotropic yield and flow behaviors and exploring the causes of these anisotropic properties. The intrinsic deformation mechanism of Ti-6Al-4V alloy tensioned along different directions was studied with Schmid factor and kernel average misorientation (KAM) analysis. The samples tensioned along the RD and TD of the sheet (denoted as RD sample and TD sample) show similar yield stress, while tensile along the DD (denoted as DD sample) leads to lower yield strength. The mechanical anisotropy exhibited by the Ti-6Al-4V sheet is closely related to the crystallographic texture. The flow stresses of the RD and TD samples are higher than that of the DD sample due to the higher density of dislocations generated during the tensile deformation, in which prismatic a dislocations make a great contribution to coordinating plastic deformation.

1. Introduction

Titanium and its alloy have been widely used as an excellent structural material in aerospace, shipping, chemical, and biomedical engineering [1,2]. Ti-6Al-4V alloy, with low density, high specific strength, non-magnetic, and outstanding biocompatibility, has emerged as one of the most crucial titanium alloys for engineering applications [2,3,4]. In recent years, the precise forming of high-performance, lightweight materials has become a hot topic in the field of metal processing [5]. However, due to the existence of hexagonal close-packed (α) phases, which lack sufficient independent slip systems to accommodate the plastic deformation, Ti-6Al-4V alloy often exhibits different yield strength and ductility along various loading directions during processing, resulting in a narrow process window for precise forming [6]. Therefore, understanding the anisotropic mechanical behavior is crucial for optimizing the forming process and expanding the application of titanium alloys [7,8,9].
The mechanical anisotropy of Ti-6Al-4V alloy is currently receiving a fair amount of attention. Chen et al. [10] evaluated the mechanical behavior of Ti-6Al-4V alloy at ambient temperature. They found that yield strengths and flow stresses along the longitudinal and transverse directions differed significantly, which was attributed to the strong (0002) α phase texture. Song et al. [11] studied the mechanical properties of Ti-6Al-4V sheets with various textures obtained from a series of rolling tests. They discovered a strong correlation between the anisotropy of mechanical characteristics and the crystallographic texture of the α phase. Besides α phase texture, the β phase texture may also be responsible for the anisotropic mechanical behavior of Ti-6Al-4V alloy. Sheikh Ali et al. [12] confirmed that the flow stress anisotropy of Ti-6Al-4V sheet is attributed to the β phase texture. Note that the Ti-6Al-4V sheet contains randomly distributed α-phase and β-phase grains, and the β phase is located between the flaky α phases and accounts for a relatively high proportion (~10%). Thus, the texture of the two phases and the phase fractions significantly impact the anisotropic mechanical behavior of Ti-6Al-4V alloy.
However, the present investigation about the anisotropic mechanical behavior of Ti-6Al-4V alloy was explained by the texture and phase fraction, which is far from enough to fully understand the behind mechanism. For Ti-6Al-4V alloys with a small proportion of β phase, although the crystallographic texture is similar to some grades of commercially pure titanium, they exhibit significantly different mechanical behaviors [13,14,15]. This is because alloy elements (such as Al) have significantly changed their inherent deformation mechanisms, such as dislocation slip and twinning abilities. In this case, twinning during the tensile tests at ambient temperature is difficult to activate, while dislocation slip is very common, which is particularly different from commercially pure titanium [16,17]. Therefore, although they are all dominated by α-phase, the significantly different intrinsic deformation mechanisms make it necessary to examine the reasons for the anisotropic mechanical behavior of the alloys and how they are affected.
In this work, the microstructures of Ti-6Al-4V samples tensioned in various directions were characterized by EBSD observation. Then, the variations in the intrinsic deformation mechanism were investigated with Schmid factor and kernel average misorientation (KAM) analysis. The influences of the intrinsic deformation mechanism on the anisotropic yield and flow behaviors of the Ti-6Al-4V alloy were finally evaluated.

2. Material and Experiments

2.1. Material

Two-phase Ti-6Al-4V alloy with a thickness of 2 mm, supplied by Ti-Baoji Ginho industry and trade Co., Ltd., Baoji, China, was employed in this work. The sheet was hot rolled at 960 °C from 120 mm to approximately ~2.6 mm in several passes, cleaned with acid and alkali, then annealed at 810 °C for 1 h and cooled in the furnace. Finally, it was cold rolled to 2.0 mm and annealed at 760 °C for 45 min. The chemical composition of the Ti-6Al-4V sheet is listed in Table 1.

2.2. Mechanical Tests

Dog-bone tensile samples with 32 × 6 × 2 mm3 gauge dimensions were electro-discharge machined (EDM) along the rolling direction (RD), transverse direction (TD), and 45° to the RD (i.e., the diagonal direction (DD)) of Ti-6Al-4V sheet, followed by mechanical polishing. Figure 1 displays the sampling orientation and geometrical dimensions of the tensile sample. The samples were uniaxially tensioned in a Hualong micro-controlled universal testing machine at the strain rate of 10−3 s−1 at ambient temperature.

2.3. Microstructure Characterization

The initial and deformed microstructures were characterized by the electron back-scattering diffraction (EBSD) technique. Before the characterization, the surfaces of the samples were mechanically ground with 400, 800, 1200, and 3000 grade SiC grinding papers and then electropolished in a mixed solution of 5% perchloric acid, 60% methanol, and 35% 1-butanol (at −20 °C and 25 V for 20 s). EBSD observations were performed on a Gemini SEM 300 scanning electron microscope (Carl Zeiss, Oberkochen, Germany) outfitted with an Oxford Symmetry EBSD detector at an accelerating voltage of 20 kV. The working distance used for EBSD characterization was ~15 mm. EBSD data were analyzed using the software AZtecCrystal 2.0 (Oxford Instruments, Abingdon, UK).

3. Results and Discussion

3.1. Initial Microstructure

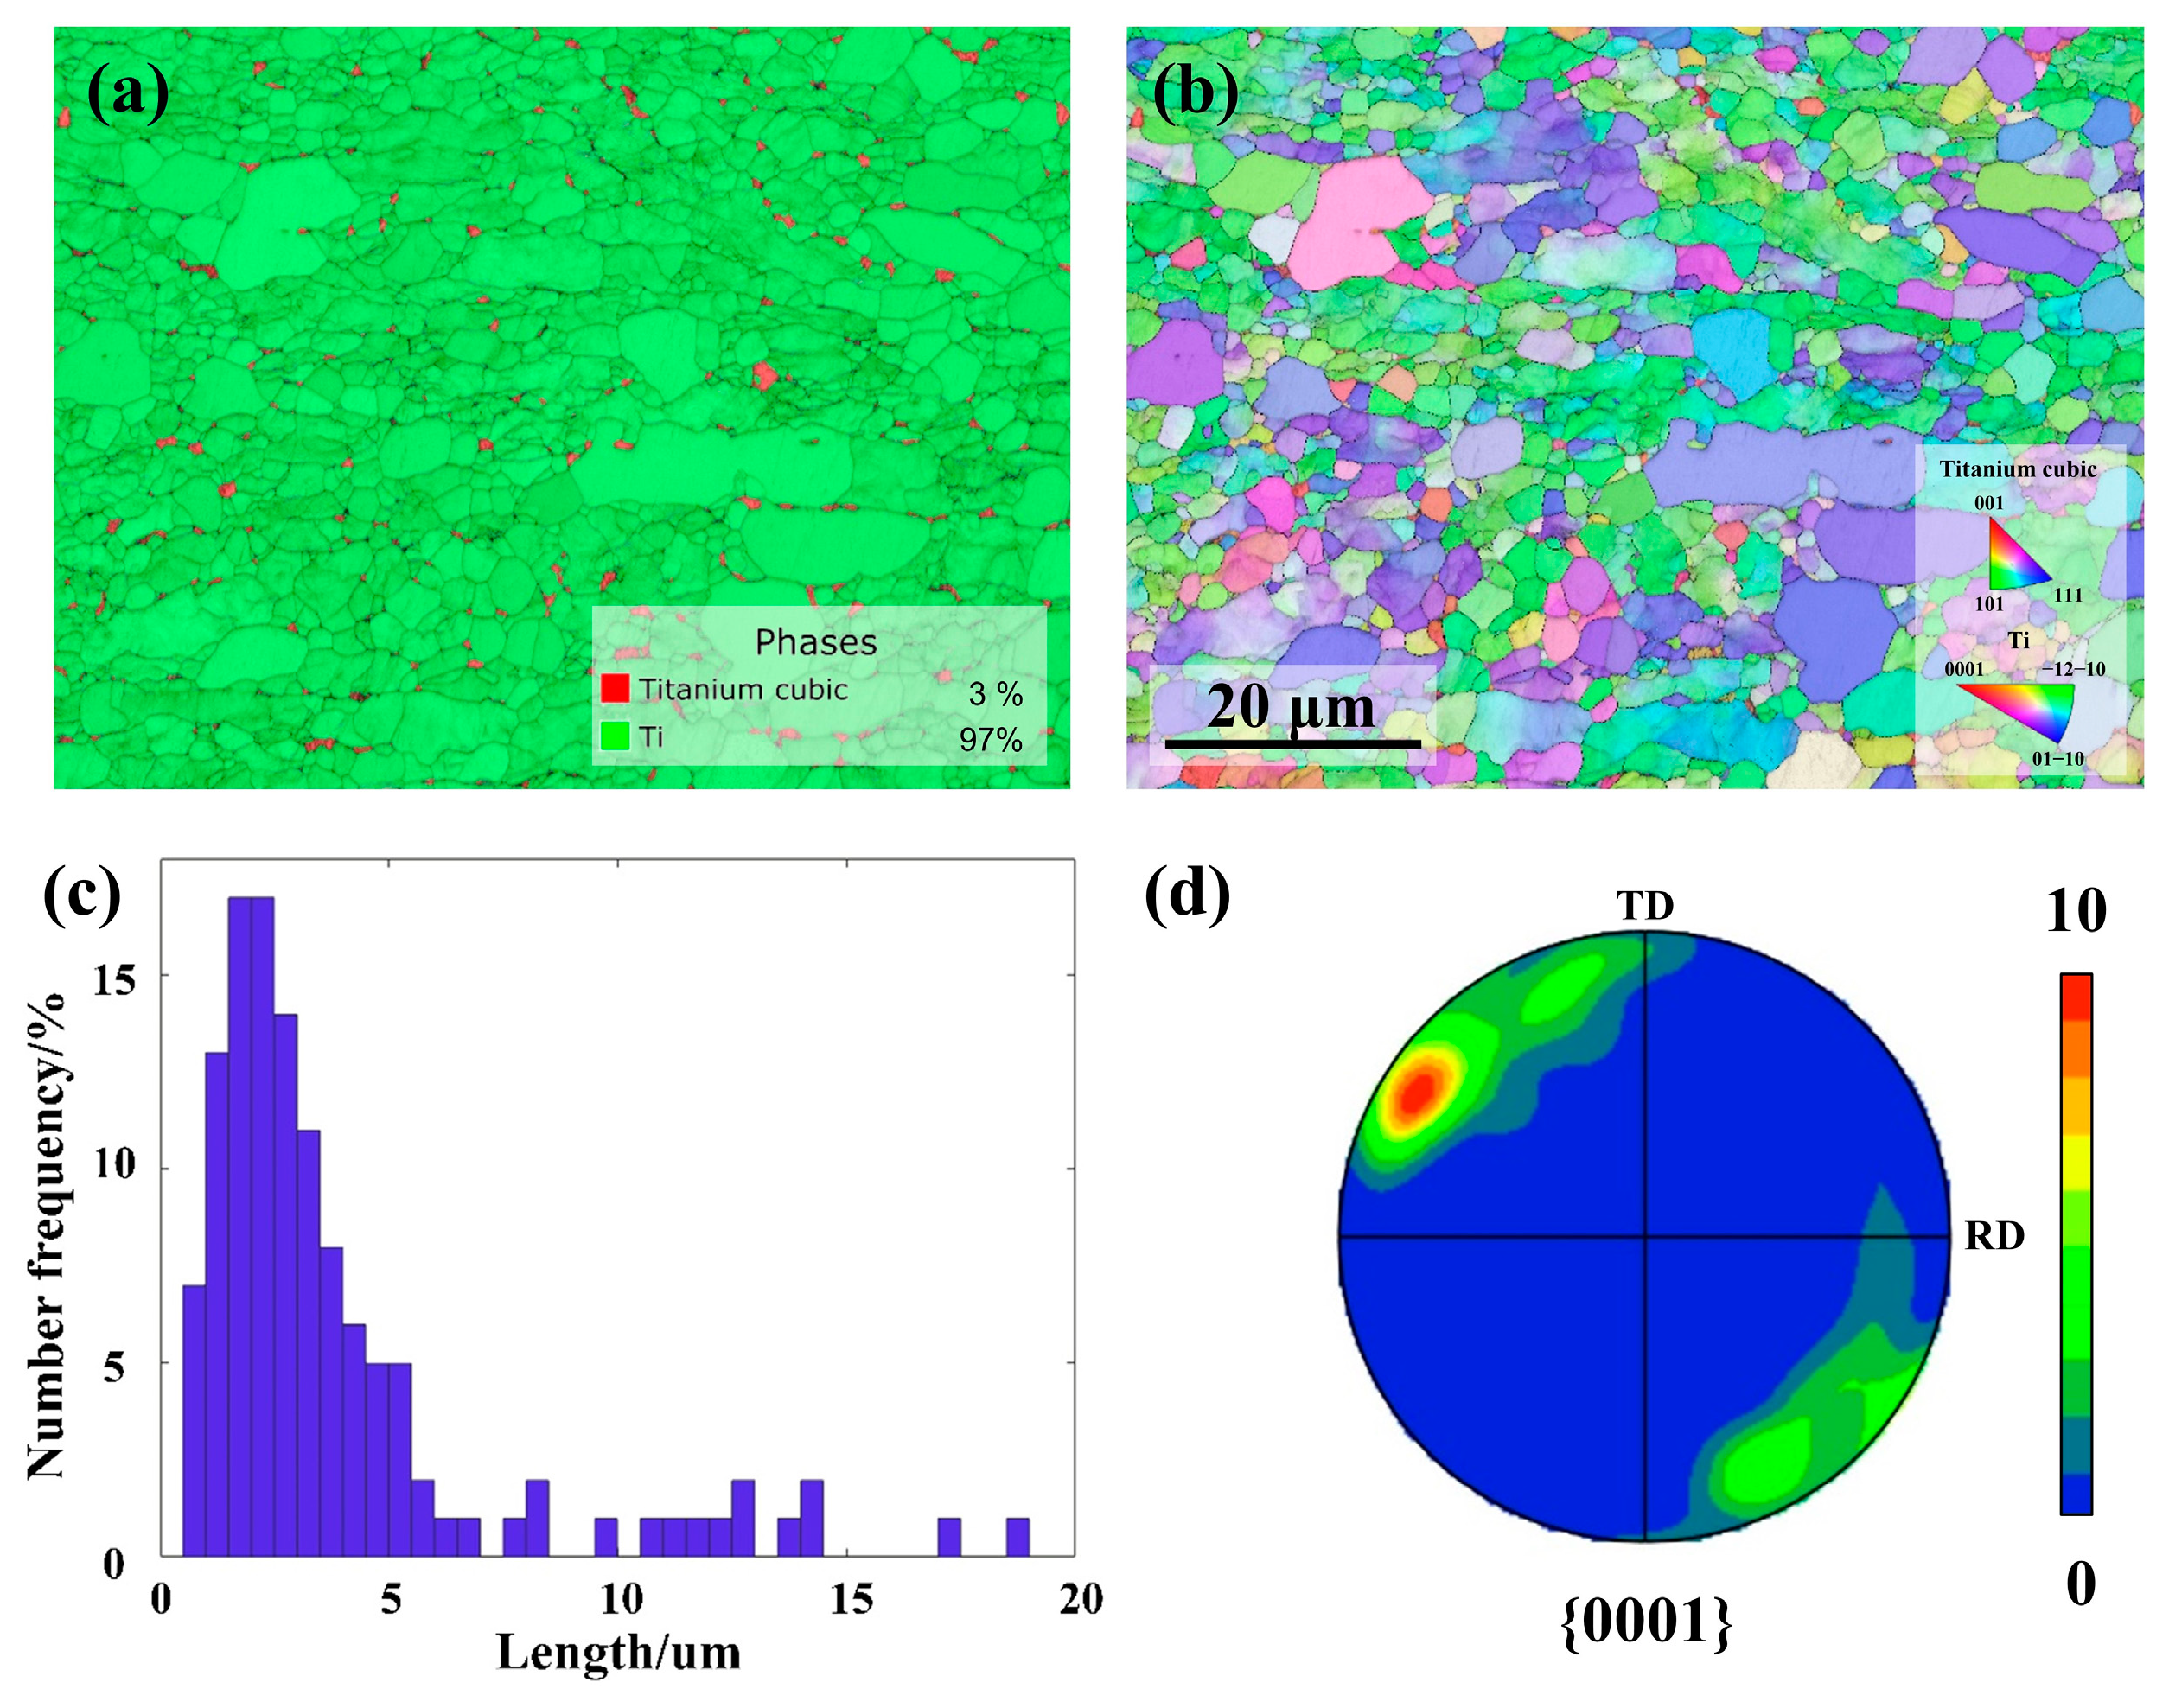
EBSD phase distribution map shows that the Ti-6Al-4V alloy is composed primarily of the α phase, which makes up ~97%, and the β phase only makes up ~3% (Figure 2a). Besides, the β phase is dispersed at the grain boundaries of the α phase and is quite small in size. EBSD inverse pole figure identifies that most grains belong to equiaxed grains (Figure 2b). The grain size distribution map reveals that most grains are ~3 μm while a few are in the range of 10~20 μm (Figure 2c). The {0001} pole figure shows that the Ti-6Al-4V alloy has a strong texture (Figure 2d). Most grains have similar orientations, and the c-axes are tilted to the DD. The preferred orientation of the present Ti-6Al-4V was expected to impact its mechanical anisotropy greatly.

3.2. Mechanical Behavior

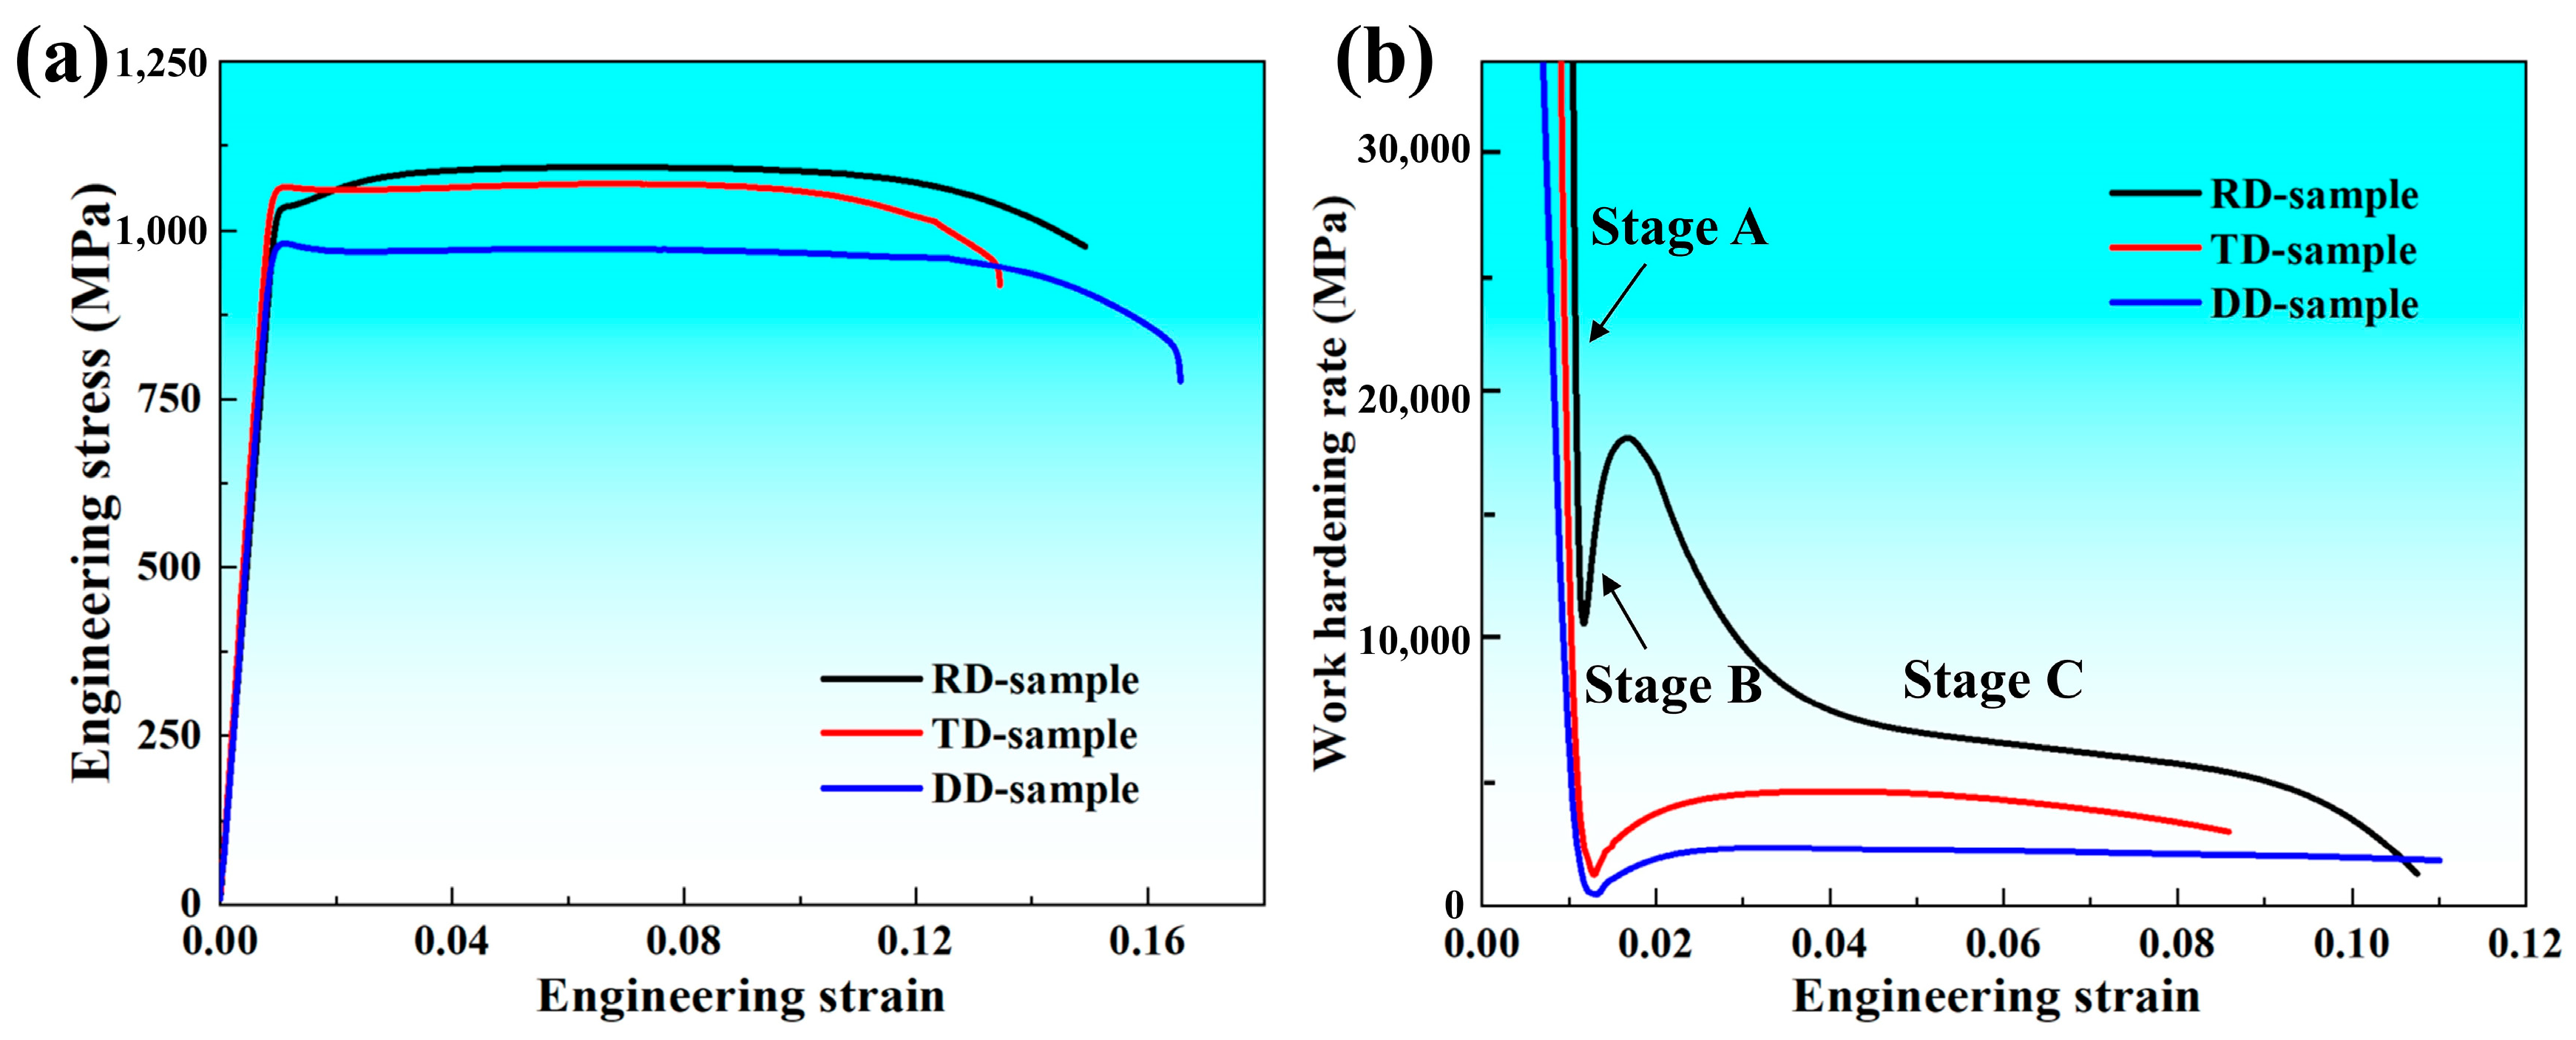
Uniaxial tensile tests were performed on the dog-bone tensile samples machined along the RD, TD, and DD of the Ti-6Al-4V sheet (denoted as RD sample, TD sample, and DD sample). The engineering stress-strain curves are displayed in Figure 3a. The curves show pronounced upper yield points along the three directions, attributed to the interstitial solutes of Ti-6Al-4V [18,19]. The yield stress ( σ s ) of the RD sample is slightly lower than that of the TD sample but higher than that of the DD sample. The RD sample first softened and then hardened with increasing strain after yielding, whereas the TD and DD samples exhibited similar softening behaviors. The RD sample exhibited the highest ultimate tensile strength ( σ b ), followed by the TD sample, and finally, the DD sample (Table 2). The fracture strain ( ε f ) values are 0.149 for the RD sample, 0.133 for the TD sample, and 0.165 for the DD sample. As displayed in Figure 3b, the work-hardening curves of the three samples exhibit distinct work-hardening behaviors. For all the samples, the work-hardening rate drops sharply after yielding (Stage A). Then, the work-hardening rate increases with strain (Stage B), and the curve forms a local minimum between Stage A and Stage B. Later, the work-hardening rate forms a local maximum with increasing strain, marking the entry into Stage C. For the RD sample, the local minimum upon yielding is significantly higher than those of the TD and DD samples. The curve of the RD sample exhibits the highest hump at the strain of ~1.5%, that is, the local maximum between Stage B and Stage C is significantly higher than the other two samples. The differences in mechanical properties and work hardening behaviors in different testing directions are attributed to the rolled sheet texture [20].

3.3. Microstructure Evolution and Deformation Mechanism

Dislocation slip is an important deformation mechanism of Ti-6Al-4V alloy. First of all, based on the microstructure of the initial material (Figure 2b), the Schmid factor analysis is employed to identify the likelihood of activated slip systems. The widely concerned slip systems for Ti-6Al-4V alloy, i.e., basal a , prismatic a , and pyramid c + a slip systems, are considered [7,21]. Figure 4a–i shows the Schmid factor distribution maps for the initial material tensioned along the RD, TD, and DD. The relative frequency of Schmid factor values for the basal a , prismatic a , and pyramid c + a slip systems are displayed in Figure 4j–l. When the initial material is subjected to the RD or TD stress, most grains are oriented for high Schmid factors for the basal a slip system (Figure 4a,d), while relatively lower Schmid factors for the DD (Figure 4g). However, as the initial material is subjected to the RD or TD stress, the Schmid factor values for the prismatic a slip system are lower than that to the DD stress. As shown in Figure 4c,f,i, similar Schmid factor distribution maps for the pyramid c + a slip system (i.e., {10–11}<11–23>) are observed as the initial material is tension along RD and TD, but their values are lower than those tensioned along the DD (Figure 4l).
The activation of the slip systems is not only related to the grain orientation, which has been discussed using Schmid factor analysis (Figure 4), but also related to the critical resolved shear stress (CRSS) of the slip systems [22,23]. Generally, prismatic a slip system is the most prevalent in Ti alloys, since the CRSS value of prismatic slip system is lower than those of basal a slip system and significantly lower than those of pyramid c + a slip system [23,24]. Thus, prismatic a slip is reasonably considered to be the dominant plastic deformation mechanism, followed by basal a slip. In the previous work, the total GND density of Ti-6Al-4V alloy has been demonstrated to dramatically increase compared to the initial microstructure after moderate tensile deformation, and the a dislocations is ~20 times more abundant than c + a ones [25]. Thus, pyramid c + a slip system is very infrequently triggered due to the high CRSS for the system [26], despite the high tendency shown by Schmid factor analysis as the initial material is tension along all three directions (Figure 4c,f,i). The prismatic a slip, which has the lowest CRSS, is most easily triggered (Figure 4h,k) and responsible for the lowest yield stress as the initial material is tensioned along the DD (Figure 3a). Given that the activities of various slip systems are quite similar (Figure 4j–l), the yield stresses for the initial material tensioned along the RD and TD are comparable (Figure 3a).
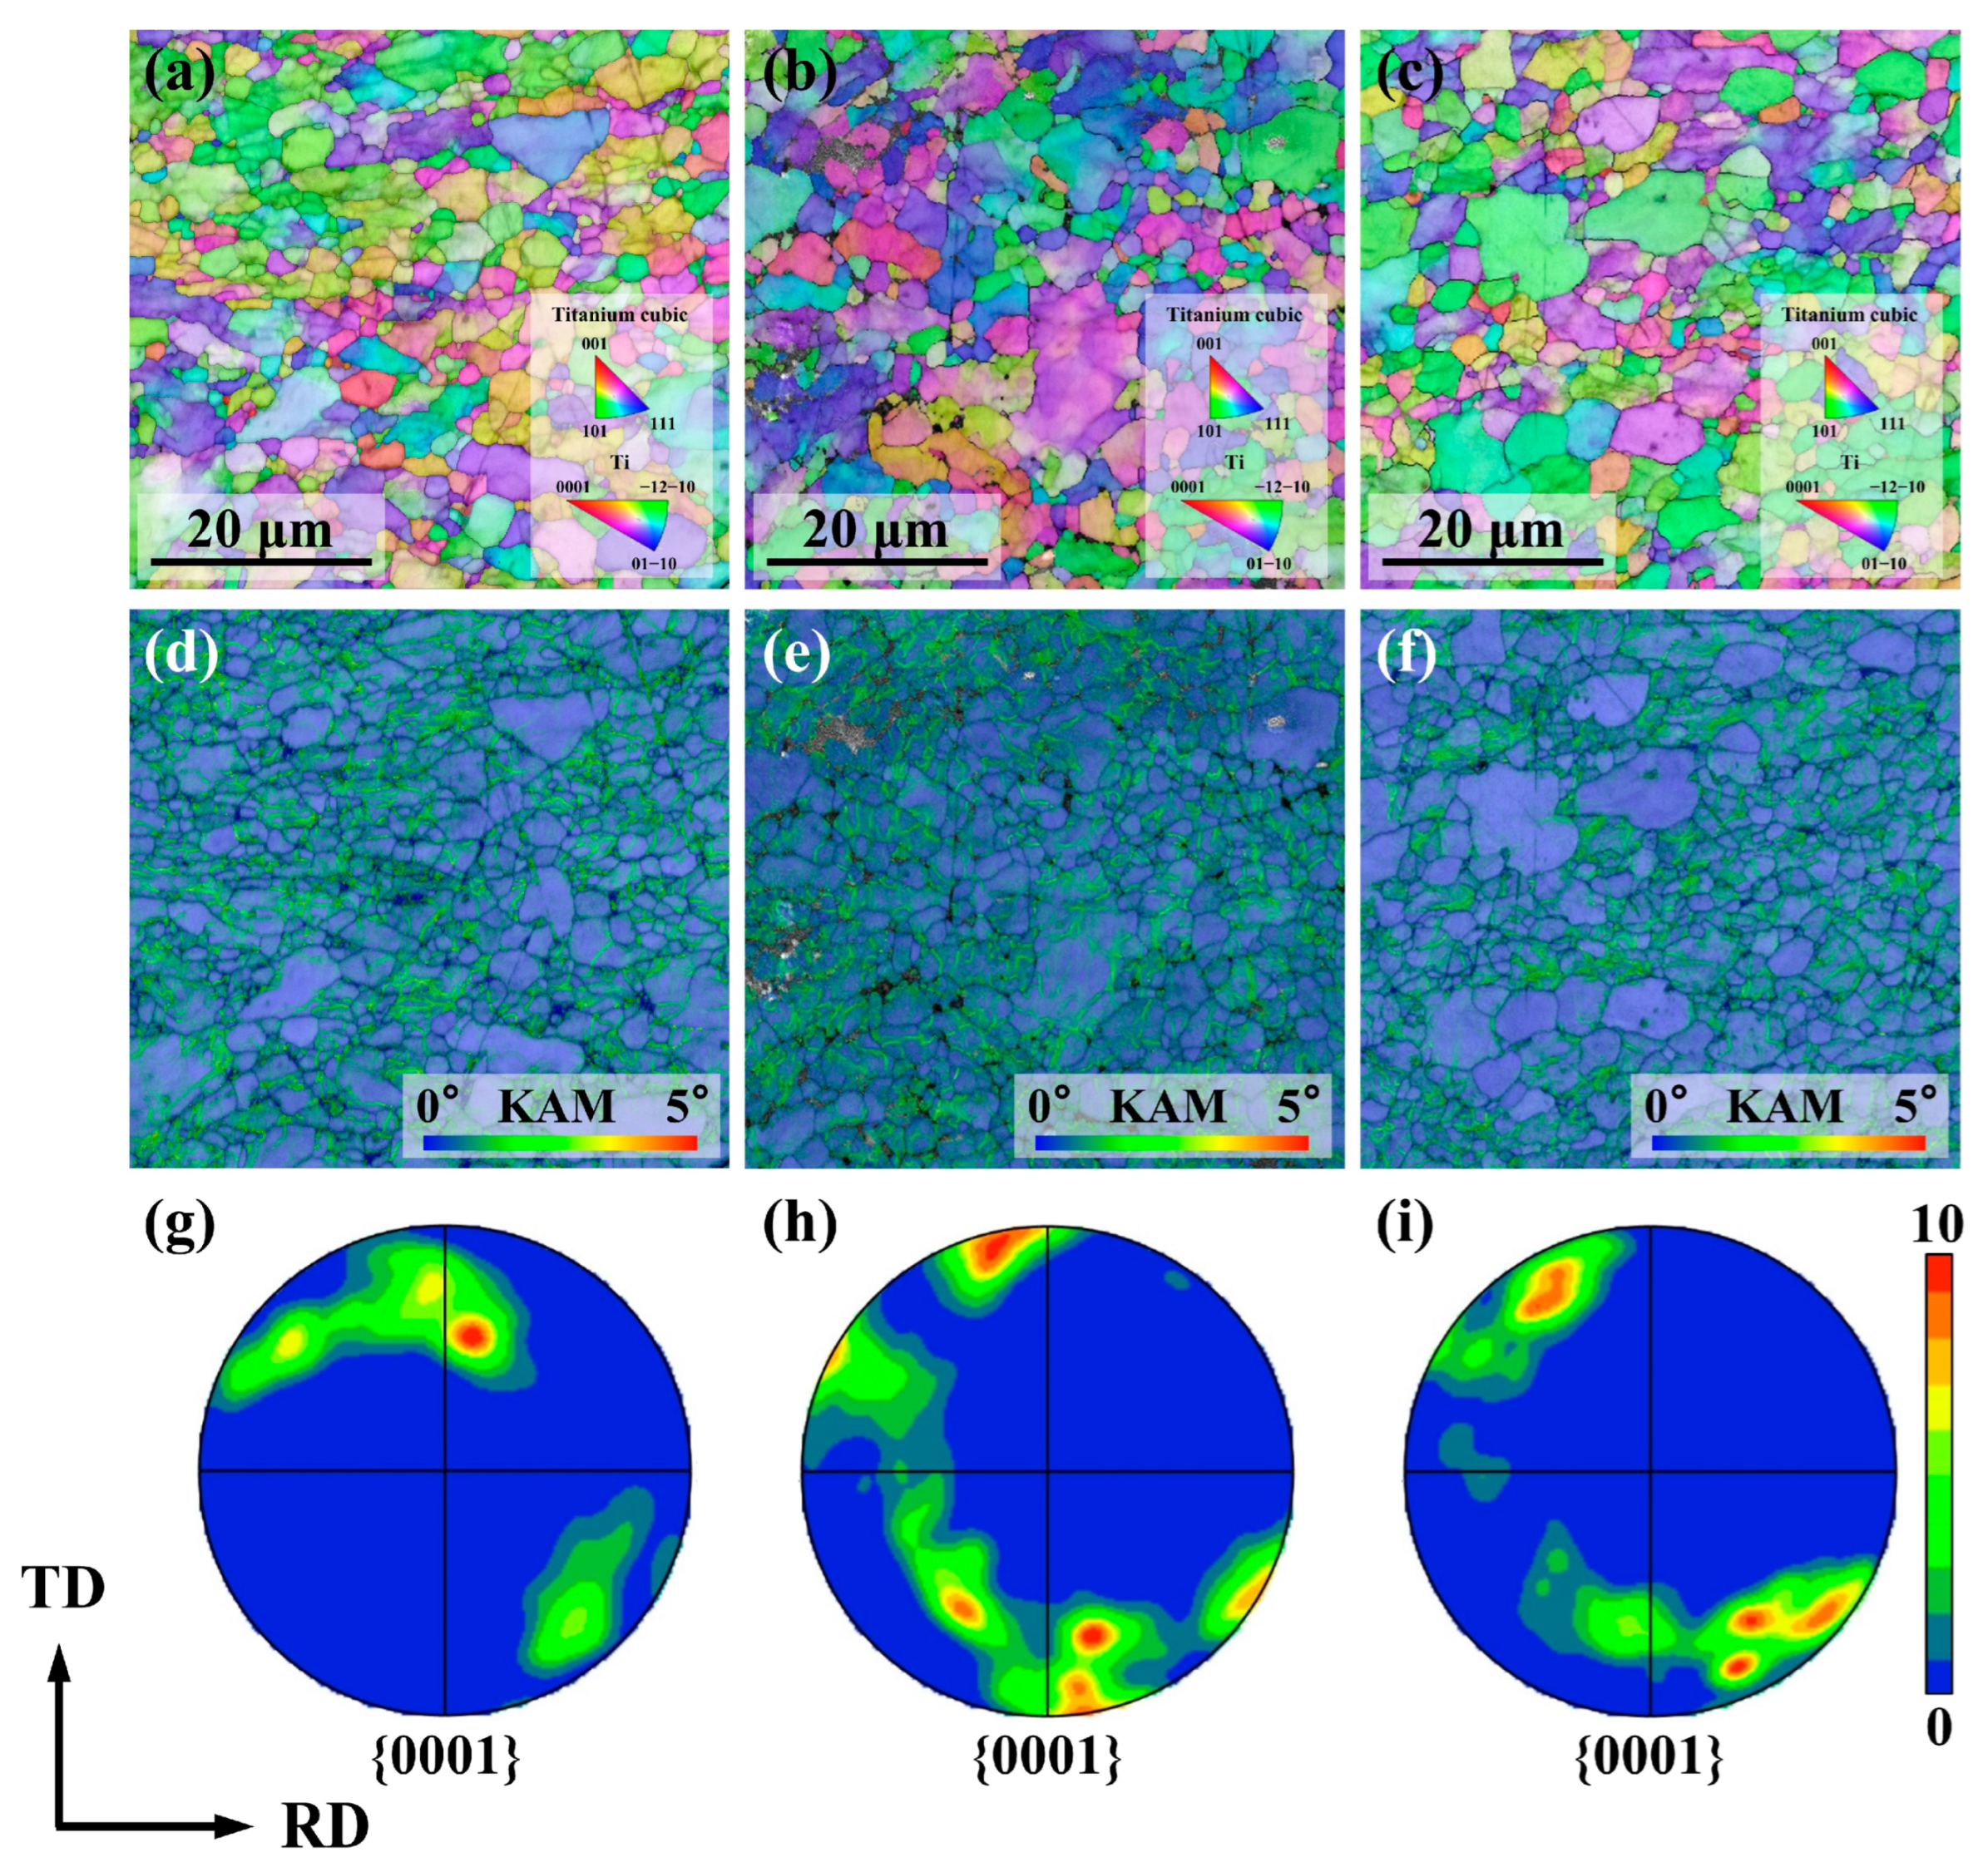
After yielding, the samples tensioned along different directions exhibit different flow behaviors (Figure 3a). The flow stress of the DD sample is significantly lower than that of the RD or TD sample. Generally, the flow stress ( σ ) combines the contributions of intrinsic lattice friction ( σ 0 ), grain boundaries ( σ g ), dislocations ( σ f ), and deformation twins ( σ t ), i.e., σ = σ 0 + σ g + σ f + σ t [27,28]. The contributions of solid solution ( σ 0 ) to the flow stress are the same for all three samples. The contribution of the grain boundary ( σ g ) is the obstacle of grain boundaries to the dislocation movement, which is closely related to the grain size [29]. Figure 5a–c shows the EBSD IPFs of the RD, TD, and DD samples at the tensile strain of 8%, respectively. Compared with the initial material (Figure 2b), there is no obvious grain size refinement of all three samples after undergoing tensile deformation with a strain of 8%. The grain sizes of all samples are nearly constant from the initial sample, thus σ g RD = σ g TD = σ g DD [30]. Besides, no deformation twins were detected during tensile deformation at ambient temperature (Figure 5a–c). In short, the difference between the flow stress of the samples can be attributed to the contribution of dislocations ( σ f ), which can be expressed as σ f = M α G b ρ [27,31]. Here, α is a constant related to the strength of dislocation-dislocation forest interactions, M is the average Taylor factor, and G is the shear modulus [32]. The value of σ f is determined by the dislocation density, which comprises of statistically-stored dislocations (SSDs) and geometrically-necessary dislocations (GNDs) [33,34]. Compared with GNDs, SSD density is lower, and the total dislocation density ρ can be evaluated by ρ = ρ GND + ρ SSD = ρ GND 90 % . The GND density ρ GND is characterized by KAM values, i.e., ρ GND = 2 υ / μ b [33]. υ is the KAM angle, μ is the EBSD step size, and b is the magnitude of Burger’s vector. The KAM angle can be used to characterize the GND density and reflect the contribution of dislocations ( σ f ). The KAM distribution maps corresponding to the microstructures of the RD, TD, and DD samples are displayed in Figure 5d–f. The KAM values of DD sample show a lower distribution compared to the others, suggesting that the GND dislocation density in DD sample is lower. Thus, the dislocation strengthening effect within the DD sample was also slightly lower than the RD and TD samples, resulting in lower flow stress of the DD sample at the strain of 8% (Figure 3a). In comparison to the initial texture (Figure 2d), the textures of the samples tensioned along different directions alter to some extent (Figure 5g–i). For the RD sample, the crystal orientations of some grains slightly changed at the strain of 8%, resulting in the <0001> pole turned to the ND-TD plane (Figure 5g). For the TD and DD samples, the <0001> pole was more dispersed than the initial texture (Figure 5h–i).
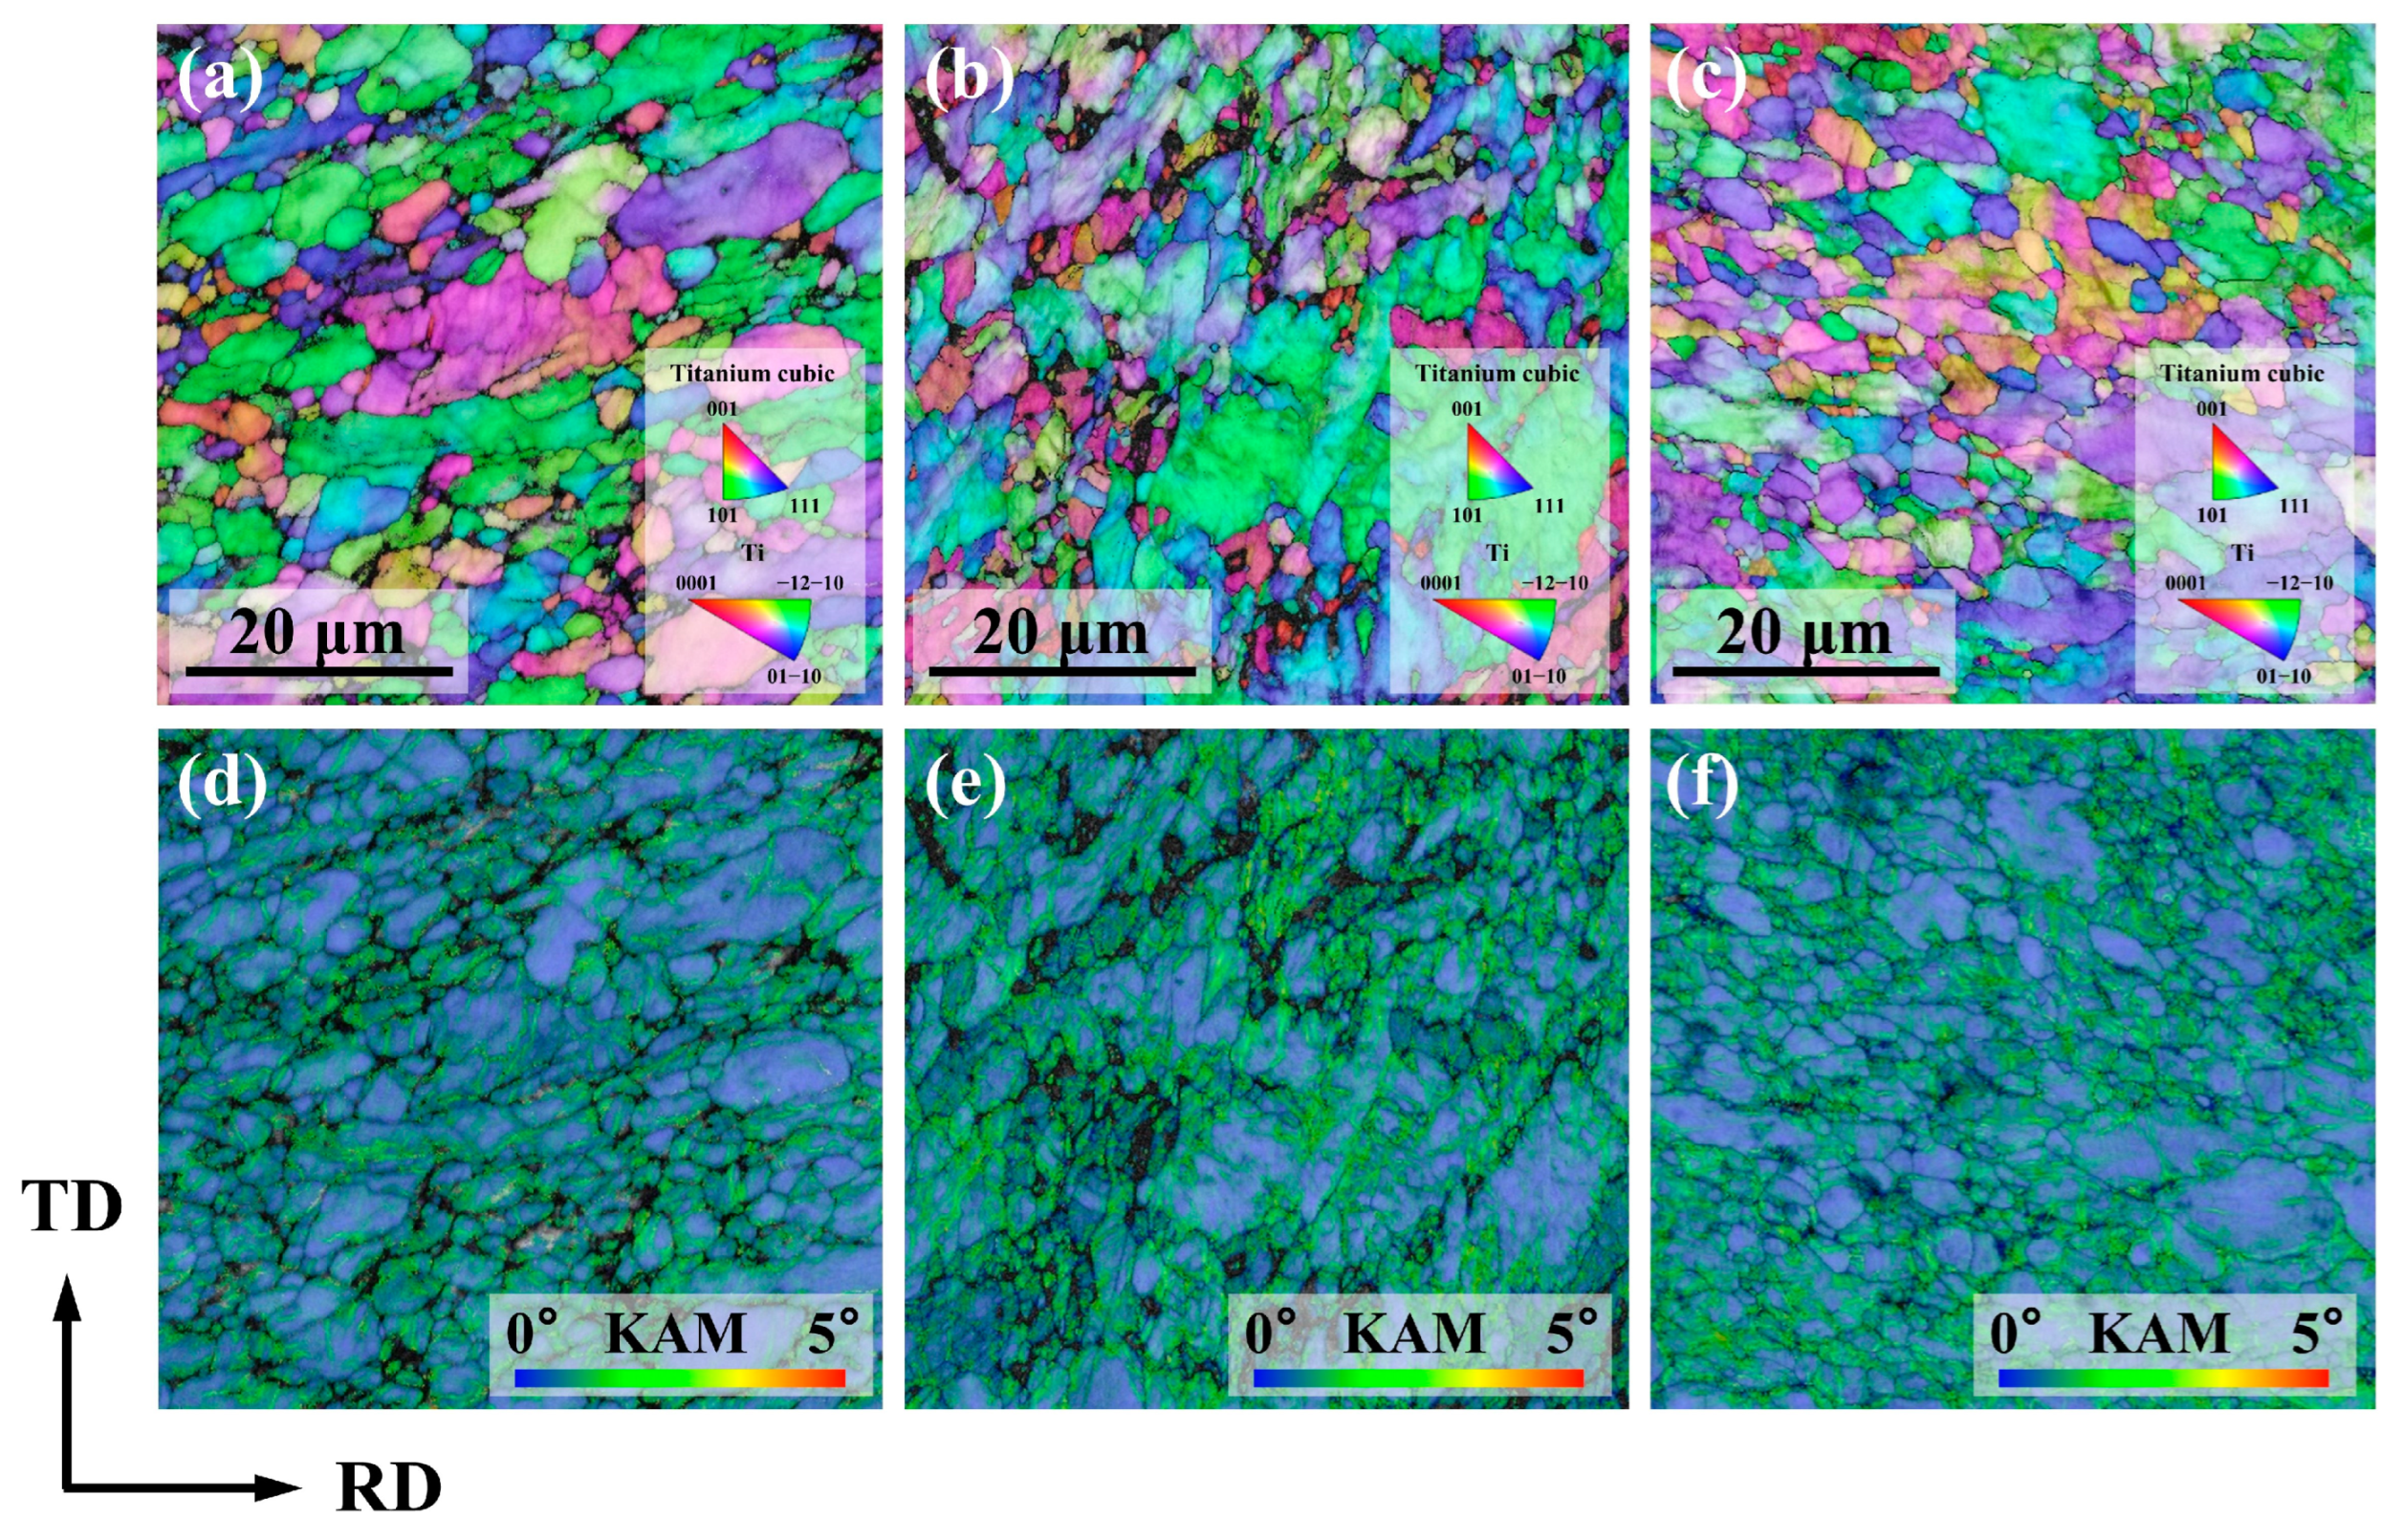
Figure 6 shows the microstructures near the fractures of the RD, TD, and DD samples. As shown in Figure 6a, the grains within the fractured RD sample are elongated in RD (i.e., the horizontal direction), and the degree of elongation is greater than that at the strain of 8% (Figure 5a). For the TD sample, the grains are somewhat elongated in TD (i.e., the vertical direction). The grains have undergone more significant deformation when compared to that of the TD sample at the strain of 8% (Figure 6b). For the DD sample, the grains are elongated along ~45o direction relative to the horizontal (Figure 6c). Figure 6d–f shows the KAM distribution maps corresponding to Figure 6a–c, respectively. Compared with the microstructure at the strain of 8%, the KAM values of all three samples increase significantly, indicating that the dislocation density increases significantly with tensile deformation. Still, no twins were detected at this time, indicating that dislocation slip rather than deformation twins is the controlling deformation mechanism when the alloy is tensioned in various directions.

4. Conclusions

In this work, the anisotropic mechanical behavior of Ti-6Al-4V alloy was investigated by uniaxial tensile tests along the RD, TD, and DD of the sheet. The microstructure evolution of the samples along the RD, TD, and DD was characterized by EBSD observation. The slip activities of Ti-6Al-4V alloy were predicted by Schmid factor analysis based on the microstructure of the initial sample. The KAM analysis was adopted to explore the reasons for the difference in flow stress between the DD sample and the RD or TD sample. The main conclusions are as follows:
The yield stress, flow stress, and work-hardening rate of Ti-6Al-4V alloy exhibit obvious mechanical anisotropy. The yield and flow stress of the RD sample is similar to that of the TD sample but much higher than that of the DD sample. Compared to the work-softening behaviors exhibited by the other samples, the RD sample exhibits a significantly different hardening behavior with a higher local minimum upon yielding and a higher local maximum after tensioned to a strain of ~1.5%.
Prismatic a slip with lowest CRSS is the most important deformation mode of Ti-6Al-4V alloy. When the initial material is subjected to the DD stress, the Schmid factor values for the prismatic a slip system are higher than that to the RD or TD stress, resulting in lower yield stress of the DD sample.
The difference in dislocation density is the main reason for the anisotropy of flow stress in Ti-6Al-4V alloy. As revealed by the KAM distribution maps, the dislocation densities of the RD sample and the TD sample are similar at the strain of 8%, and both are higher than that of the DD sample, which is responsible for the higher flow stress of the RD and TD samples.

Author Contributions

Formal analysis, J.M. and X.C.; methodology, L.L. and J.J.; writing—original draft preparation, J.M. and X.C.; writing—review and editing, J.M. and L.L.; funding acquisition, L.L.; data curation, J.J.; conceptualization, L.L. All authors have read and agreed to the published version of the manuscript.

Funding

This work was financially supported by the National Natural Science Foundation of China (No. U1737206), and Shenzhen Fundamental Research Fund (Nos. JCYJ20210324122801005 and RCBS20210609103711035).

Institutional Review Board Statement

Not applicable.

Informed Consent Statement

Not applicable.

Data Availability Statement

Data are contained within the article.

Conflicts of Interest

The authors declare no conflict of interest.

References

  1. Sun, Q.Y.; Gu, H.C. Tensile and low-cycle fatigue behavior of commercially pure titanium and Ti-5Al-2.5Sn alloy at 293 and 77 K. Mater. Sci. Eng. A 2001, 316, 80–86. [Google Scholar] [CrossRef]
  2. Ahmed, A.A.; Mhaede, M.; Wollmann, M.; Wagner, L. Effect of micro shot peening on the mechanical properties and corrosion behavior of two microstructure Ti-6Al-4V alloy. Appl. Surf. Sci. 2016, 363, 50–58. [Google Scholar] [CrossRef]
  3. Ye, X.; Yang, Y.; Song, G.; Tang, G. Enhancement of ductility, weakening of anisotropy behavior and local recrystallization in cold-rolled Ti-6Al-4V alloy strips by high-density electropulsing treatment. Appl. Phys. A 2014, 117, 2251–2264. [Google Scholar] [CrossRef]
  4. Zhou, J.Z.; Huang, S.; Zuo, L.D.; Meng, X.K.; Sheng, J.; Tian, Q.; Han, Y.H.; Zhu, W.L. Effects of laser peening on residual stresses and fatigue crack growth properties of Ti-6Al-4V titanium alloy. Opt. Lasers Eng. 2014, 52, 189–194. [Google Scholar] [CrossRef]
  5. Yuan, S.; Fan, X. Developments and perspectives on the precision forming processes for ultra-large size integrated components. Int. J. Extreme Manuf. 2019, 1, 022002. [Google Scholar] [CrossRef]
  6. Gao, S.; He, T.; Li, Q.; Sun, Y.; Sang, Y.; Wu, Y.; Ying, L. Anisotropic behavior and mechanical properties of Ti-6Al-4V alloy in high temperature deformation. J. Mater. Sci. 2022, 57, 651–670. [Google Scholar] [CrossRef]
  7. Salem, A.; Semiatin, S. Anisotropy of the hot plastic deformation of Ti-6Al-4V single-colony samples. Mater. Sci. Eng. A 2009, 508, 114–120. [Google Scholar] [CrossRef]
  8. Roth, A.; Lebyodkin, M.A.; Lebedkina, T.A.; Lecomte, J.S.; Richeton, T.; Amouzou, K.E.K. Mechanisms of anisotropy of mechanical properties of α-titanium in tension conditions. Mater. Sci. Eng. A 2014, 596, 236–243. [Google Scholar] [CrossRef]
  9. Srinivasan, N.; Velmurugan, R.; Singh, S.K.; Pant, B.; Kumar, R. Texture strengthening and anisotropic hardening of mill annealed Ti-6Al-4V alloy under equi-biaxial tension. Mater. Char. 2020, 164, 110349. [Google Scholar] [CrossRef]
  10. Chen, W.; Boehlert, C.J. Texture induced anisotropy in extruded Ti-6Al-4V-xB alloys. Mater. Char. 2011, 62, 333–339. [Google Scholar] [CrossRef]
  11. Song, J.H.; Hong, K.J.; Ha, T.K.; Jeong, H.T. The effect of hot rolling condition on the anisotropy of mechanical properties in Ti-6Al-4V alloy. Mater. Sci. Eng. A 2007, 449, 144–148. [Google Scholar] [CrossRef]
  12. Sheikh-Ali, A. On flow stress anisotropy in Ti-6Al-4V alloy sheet during superplastic deformation. J. Mater. Sci. 2007, 42, 3621–3626. [Google Scholar] [CrossRef]
  13. Battaini, M.; Pereloma, E.; Davies, C.H.J. Orientation effect on mechanical properties of commercially pure titanium at room temperature. Metall. Mater. Trans. A 2007, 38, 276–285. [Google Scholar] [CrossRef] [Green Version]
  14. Srinivasan, N.; Velmurugan, R.; Kumar, R.; Singh, S.K.; Pant, B. Deformation behavior of commercially pure (CP) titanium under equi-biaxial tension. Mater. Sci. Eng. A 2016, 674, 540–551. [Google Scholar] [CrossRef]
  15. Yi, N.; Hama, T.; Kobuki, A.; Fujimoto, H.; Takuda, H. Anisotropic deformation behavior under various strain paths in commercially pure titanium Grade 1 and Grade 2 sheets. Mater. Sci. Eng. A 2016, 655, 70–85. [Google Scholar] [CrossRef] [Green Version]
  16. Warwick, J.L.W.; Jones, N.G.; Rahman, K.M.; Dye, D. Lattice strain evolution during tensile and compressive loading of CP Ti. Acta Mater. 2012, 60, 6720–6731. [Google Scholar] [CrossRef]
  17. Cizek, P.; Kada, S.R.; Wang, J.; Armstrong, N.; Antoniou, R.A.; Lynch, P.A. Dislocation structures representing individual slip systems within the α phase of a Ti-6Al-4V alloy deformed in tension. Mater. Sci. Eng. A 2020, 797, 140225. [Google Scholar] [CrossRef]
  18. Conrad, H. Effect of interstitial solutes on the strength and ductility of titanium. Prog. Mater. Sci. 1981, 26, 123–403. [Google Scholar] [CrossRef]
  19. Orozco-Caballero, A.; Li, F.; Esque-De Los Ojos, D.; Atkinson, M.D.; da Fonseca, J.Q. On the ductility of alpha titanium: The effect of temperature and deformation mode. Acta Mater. 2018, 149, 1–10. [Google Scholar] [CrossRef] [Green Version]
  20. Mayeur, J.R.; McDowell, D.L. A three-dimensional crystal plasticity model for duplex Ti-6Al-4V. Int. J. Plast. 2007, 23, 1457–1485. [Google Scholar] [CrossRef]
  21. Bantounas, I.; Dye, D.; Lindley, T.C. The effect of grain orientation on fracture morphology during high-cycle fatigue of Ti-6Al-4V. Acta Mater. 2009, 57, 3584–3595. [Google Scholar] [CrossRef] [Green Version]
  22. Meng, J.K.; Liu, L.; Jiang, J.T.; Huang, G.; Zhen, L. Fracture behaviors of commercially pure titanium under biaxial tension: Experiment and modeling. J. Mater. Sci. Technol. 2023, 140, 176–186. [Google Scholar] [CrossRef]
  23. Wang, L.; Zheng, Z.; Phukan, H.; Kenesei, P.; Park, J.S.; Lind, J.; Suter, R.M.; Bieler, T.R. Direct measurement of critical resolved shear stress of prismatic and basal slip in polycrystalline Ti using high energy X-ray diffraction microscopy. Acta Mater. 2017, 132, 598–610. [Google Scholar] [CrossRef]
  24. Zaefferer, S. A study of active deformation systems in titanium alloys: Dependence on alloy composition and correlation with deformation texture. Mater. Sci. Eng. A 2003, 344, 20–30. [Google Scholar] [CrossRef]
  25. Littlewood, P.D.; Britton, T.B.; Wilkinson, A.J. Geometrically necessary dislocation density distributions in Ti-6Al-4V deformed in tension. Acta Mater. 2011, 59, 6489–6500. [Google Scholar] [CrossRef]
  26. Barkia, B.; Doquet, V.; Couzinie, J.P.; Guillot, I.; Heripre, E. In situ monitoring of the deformation mechanisms in titanium with different oxygen contents. Mater. Sci. Eng. A 2015, 636, 91–102. [Google Scholar] [CrossRef]
  27. Zhou, P.; Liang, Z.Y.; Liu, R.D.; Huang, M.X. Evolution of dislocations and twins in a strong and ductile nanotwinned steel. Acta Mater. 2016, 111, 96–107. [Google Scholar] [CrossRef]
  28. Liang, Z.Y.; Li, Y.Z.; Huang, M.X. The respective hardening contributions of dislocations and twins to the flow stress of a twinning-induced plasticity steel. Scripta Mater. 2016, 112, 28–31. [Google Scholar] [CrossRef]
  29. Zhao, P.C.; Yuan, G.J.; Wang, R.Z.; Guan, B.; Jia, Y.F.; Zhang, X.C.; Tu, S.T. Grain-refining and strengthening mechanisms of bulk ultrafine grained CP-Ti processed by L-ECAP and MDF. J. Mater. Sci. Technol. 2021, 83, 196–207. [Google Scholar] [CrossRef]
  30. Benjamin Britton, T.; Wilkinson, A.J. Stress fields and geometrically necessary dislocation density distributions near the head of a blocked slip band. Acta Mater. 2012, 60, 5773–5782. [Google Scholar] [CrossRef]
  31. Gao, J.; Huang, Y.; Guan, D.; Knowles, A.J.; Ma, L.; Dye, D.; Rainforth, W.M. Deformation mechanisms in a metastable beta titanium twinning induced plasticity alloy with high yield strength and high strain hardening rate. Acta Mater. 2018, 152, 301–314. [Google Scholar] [CrossRef]
  32. Fattah-alhosseini, A.; Keshavarz, M.K.; Mazaheri, Y.; Reza Ansari, A.; Karimi, M. Strengthening mechanisms of nano-grained commercial pure titanium processed by accumulative roll bonding. Mater. Sci. Eng. A 2017, 693, 164–169. [Google Scholar] [CrossRef]
  33. Jiang, Y.; Li, C.; Di, X.; Wang, D.; Liu, J. EBSD analysis of microstructures and mechanical properties of softened zones in X60 reeled-pipeline welded joint after cyclic plastic deformation. Weld. World 2020, 64, 1213–1225. [Google Scholar] [CrossRef]
  34. Moshtaghi, M.; Safyari, M.; Kuramoto, S.; Hojo, T. Unraveling the effect of dislocations and deformation-induced boundaries on environmental hydrogen embrittlement behavior of a cold-rolled Al-Zn-Mg-Cu alloy. Int. J. Hydrogen Energy 2021, 46, 8285–8299. [Google Scholar] [CrossRef]
Figure 1. (a) The loading orientation and (b) geometrical dimensions of the tensile sample.
Metals 13 00089 g001
Figure 2. Initial microstructure of the Ti-6Al-4V. (a) Phase distribution map (Green for α and red for β phase). (b) EBSD inverse pole figure (IPF). (c) Grain size distribution map of the α phase. (d) {0001} pole figure (PF).
Metals 13 00089 g002
Figure 3. (a) Engineering stress-strain curves and (b) corresponding work-hardening curves of the Ti-6Al-4V samples tensioned in RD, DD, and TD orientations.
Metals 13 00089 g003
Figure 4. Schmid factor maps for the initial material tensioned along the (ac) RD, (df) TD, and (gi) DD. (a,d,g) are the Schmid factor maps for the basal a slip system. (b,e,h) are those for the prismatic a slip system. (c,f,i) are those for the pyramid c + a slip system. Relative frequency of Schmid factor values for the (j) basal a , (k) prismatic a , and (l) pyramid c + a slip systems.
Metals 13 00089 g004
Figure 5. EBSD inverse pole figures (IPFs) of the (a) RD sample, (b) TD sample, and (c) DD sample at the strain of 8%. (df) shows the kernel average misorientation (KAM) maps of (ac). (gi) shows the PFs of (ac).
Metals 13 00089 g005
Figure 6. EBSD inverse pole figures (IPFs) of the (a) RD sample, (b) TD sample, and (c) DD sample at the fractured strains. (df) shows kernel average misorientation (KAM) maps of (ac).
Metals 13 00089 g006
Table 1. Chemical compositions of the Ti-6Al-4V alloy (in wt.%).
ElementsAlVFeHOTi
Analyzed composition6.184.160.120.010.12Bal.
Table 2. Mechanical properties of Ti-6Al-4V obtained in different tensile directions.
Tensile Direction σ s / MPa σ b / MPa ε f
RD103010900.149
TD106010690.133
DD9609800.165
Disclaimer/Publisher’s Note: The statements, opinions and data contained in all publications are solely those of the individual author(s) and contributor(s) and not of MDPI and/or the editor(s). MDPI and/or the editor(s) disclaim responsibility for any injury to people or property resulting from any ideas, methods, instructions or products referred to in the content.