Article

Hydrogen Production Properties of Aluminum–Magnesium Alloy Presenting β-Phase Al3Mg2

by
Laurent Cuzacq
1,
Chloé Polido
1,
Jean-François Silvain
1,2 and
Jean-Louis Bobet
1,*
1
Department of Chemistry, University Bordeaux, CNRS, Bordeaux INP, ICMCB, UMR 5026, 33600 Pessac, France
2
Department of Electrical and Computer Engineering, University of Nebraska-Lincoln, Lincoln, NE 68588, USA
*
Author to whom correspondence should be addressed.
Metals 2023, 13(11), 1868; https://doi.org/10.3390/met13111868
Submission received: 3 October 2023 / Revised: 31 October 2023 / Accepted: 2 November 2023 / Published: 9 November 2023
(This article belongs to the Special Issue Feature Papers in Metallic Functional Materials)

Abstract

:
In this study, aluminum–magnesium (Al-Mg) bulk porous materials were fabricated by using uniaxial hot pressing to control the porosity rate of the material over a wide range (up to 50%). The fabricated materials were analyzed by X-ray diffraction and scanning electron microscopy. The results demonstrated the appearance of intermetallic (IM) phase Al3Mg2, and its quantity increased with the applied pressure. In the context of the decline of global fossil fuel reserves, the revalorization of these materials by hydrogen (H2) production was investigated. Hydrolysis of the Al-Mg materials was carried out in a simulated seawater solution (aqueous solution of sodium chloride 35 g/L). The results showed the role of the porosity rate in the H2 production properties of the fabricated materials; the increase of porosity rate from 10% to 50% cuts the reaction time in half. Finally, the role of IM phase Al3Mg2 in H2 production was highlighted through galvanic coupling.

1. Introduction

Aluminum (Al) is the third-most abundant element in the Earth’s crust. Its utilization spans a multitude of industrial sectors, with a particularly pronounced presence in transportation, in which the imperative for structural lightweighting is steadily gaining prominence. However, when used in its pure form, Al exhibits relatively low mechanical properties. Consequently, Al is frequently employed in alloys in which Al is combined with various other metals, such as magnesium, copper, and zinc, or nonmetals like silicon [1].
The alloying elements significantly enhance the mechanical and chemical properties of Al. Among these alloys, we will focus on Al-Mg alloys, which belong to the 5000 series. These alloys are typically produced through metallurgy, in which metals are melted at high temperatures and cast into various forms [2,3]. These alloys offer the advantage of being even lighter than pure Al because the density of Mg (1.74 g/cm3) is lower than that of Al (2.70 g/cm3). Al-Mg alloys exhibit higher mechanical properties than pure Al and are primarily utilized in mechanical applications, particularly within the transportation sector [4].
In these alloys, the formation of intermetallic phases is a common occurrence. Indeed, two major phases exist in the Al-Mg phase diagram (Figure S1, Supplementary Material [5]): Al12Mg17 [6] and Al3Mg2 [7,8]. In the context of this study (alloys rich in Al), we will focus particularly on the formation of the Al3Mg2 intermetallic (IM) phase. The presence of precipitates of Al3Mg2 has been previously investigated, and it has been demonstrated that their presence y induced structural strengthening. Furthermore, the Al3Mg2 phase is typically stabilized through prolonged annealing [7,9,10] or milling times [11,12], high pressures [11], or temperatures exceeding 450 °C (the eutectic temperature on the phase diagram), leading to liquid-state sintering [13].
On the other hand, the production of hydrogen (H2) from metals is increasingly being explored. The way we have used fossil fuels as our main source of energy since the Industrial Revolution has led to a massive increase in the levels of CO2 and other greenhouse gases in our atmosphere, which is the main cause of global warming [14]. Renewable energy will play a key role in transitioning to clean and sustainable energy [15,16] and hydrogen as an energy carrier is one of the most promising solutions to the aforementioned problems [14,17,18,19]. Hydrogen can be produced from a variety of domestic resources. These include nuclear energy, natural gas, coal, biomass, and other renewable sources [20]. This production can be accomplished using various process technologies, namely electrolysis, photolysis, biolysis, thermolysis, plasma arc methane decomposing, coal gasification, fermentation, and so on [14,16,20,21,22]. Nowadays, hydrogen is mainly produced by steam reforming natural gas, a process that leads to massive emissions of greenhouse gases [23,24]. However, all these production techniques are limited by economic, environmental, and resource constraints (especially production from biomass). H2 production has already been extensively studied using Mg, Mg alloys, and Al [6,25,26,27,28]. The hydrolysis reaction (i.e., oxido-reduction reaction) of 1 mole of Al (Equation (1)) could generate 1.5 times more H2 than 1 mole of Mg (Equation (2)) because of the number of valence electrons (3 for Al and 2 for Mg).
A l ( s ) + 3   H 2 O l A l O H 3 ( s ) + 3 2 H 2 ( g )
M g ( s ) + 2   H 2 O l M g O H 2 ( s ) + H 2 ( g )
In this regard, changing the hydrolysis medium could be a possibility to explore [28,29], as well as the addition of alloying elements to Al to trigger galvanic coupling. The addition of additives such as indium, bismuth, lithium, or tin has already been investigated [30,31,32,33].
This type of material (i.e., Al-Mg) can also be used as a heat sink or heat spreader to control the temperature induced by the electronic ship in high-power electronic devices. Indeed, the porosity rate influences the heat dissipation. At the end of their lives, these materials should be dismantled to be reused, or at least to be valorized. We explore revalorization via the hydrolysis process (i.e., production of H2). Considering the rate of H2 created by 1 mole of material and the intended application, porous Al-rich materials will be studied. Al and Mg powders were mixed in an 80/20 mass ratio to create porous materials containing (or not) IM-phase Al3Mg2 through solid-state sintering at quite low temperatures and pressures with a short sintering time (10 min). Subsequently, the H2 production properties of the synthesized alloys will be investigated, along with the role of the intermetallic phase in the context of this application.
This study aims to show the H2 production properties of Al-Mg materials and the role of IM-phase Al3Mg2 in this production.

2. Materials and Methods

2.1. Sample Preparations

Gas-atomized 1080 Al spherical powder 61 (ULTD0065; Hermillon powders, Savoie, France) with a medium grain size d50 = 7 μm and Mg powders with an average size of 44 µm were used as raw material. The powders were mixed for 5 min at 1200 rpm in a planetary mixer, Thinky ARE250CE, Thinky Corporation, Tokyo, Japan. This mix (Al 80 wt.% + Mg 20 wt.%) (further named Al80Mg20) was placed in a cylindrical stainless-steel mold to achieve a final sample size of 10 mm in diameter and approximately 5 mm in height. The solid-state sintering technique (uniaxial hot pressing using induction heating) was used to fabricate the final material [34].
As shown in Table 1, the fabrication temperature and the dwell time were fixed at 400 °C and 10 min, respectively, and the applied pressure ranged from 0 to 40 MPa. A primary vacuum atmosphere (0.1–1 Pa) was used to prevent further oxidation of the powders during the sintering process. The pressure was adjusted to fabricate Al80Mg20 samples with controlled porosity ranging from 10 to 50% (NB: at a porosity rate >50%, the material could not be handled). The temperature was monitored by a K-type thermocouple located in the stainless-steel mold and close to the powder. After densification, the samples were broken and small pieces of approximately 30 mg were used for the hydrolysis experiments.

2.2. Characterizations

The phase composition of the samples was identified by X-ray diffraction (XRD) using Cu Kα radiation (λ = 0.154 nm, Bruker D8 Focus X-ray or Brucker D8.1 diffractometer; Brucker, Madison, WI, USA). Microstructural analysis was performed with a scanning electronic microscope (SEM; Tescan, VEGA © II SBH, Brno–Kohoutovice, Czech Republic) after cryofracture. Energy-dispersive X-ray spectroscopy (EDS) was used to obtain elemental composition information. Theoretical density was calculated using mixture law for each sample obtained. The experimental porosity of the foams was estimated using geometrical measurement. The diameter, length, and mass of the samples were measured to calculate their volume and density. The relative density was obtained by dividing the experimental density by the theoretical density of the sample. Finally, the global porosity of the samples is obtained by Equation (3):
P = 1 ρ r e l a t i v e
where P is the global porosity (in %) and ρ relative is the relative density of the samples (in %).

2.3. Hydrolysis

Hydrolysis reactions were performed in a closed 100 mL three-neck, round bottom flask connected to a burette that dips in a beaker of tap water. This setup is described in detail in a previous paper [26]. The production of H2 during the experiment induces water displacement back to the beaker, and a balance connected to a computer records the mass variation. This setup allows us to follow H2 production in real time. Samples of 30 mg of porous parts react with 20 mL of an aqueous solution of sodium chloride (NaCl) concentrated at 35 g/L (i.e., simulated sea water).

2.4. Modelling

The experimental results were then fitted with the Avrami–Erofeev model, often used to describe the hydrolysis mechanism [35]. It is described by Equation (4):
α = 1 e k   t n
where α is the hydrolysis kinetic, k is the kinetic constant, and n is a nondimensional parameter that reflects the reaction mode.

3. Results and Discussions

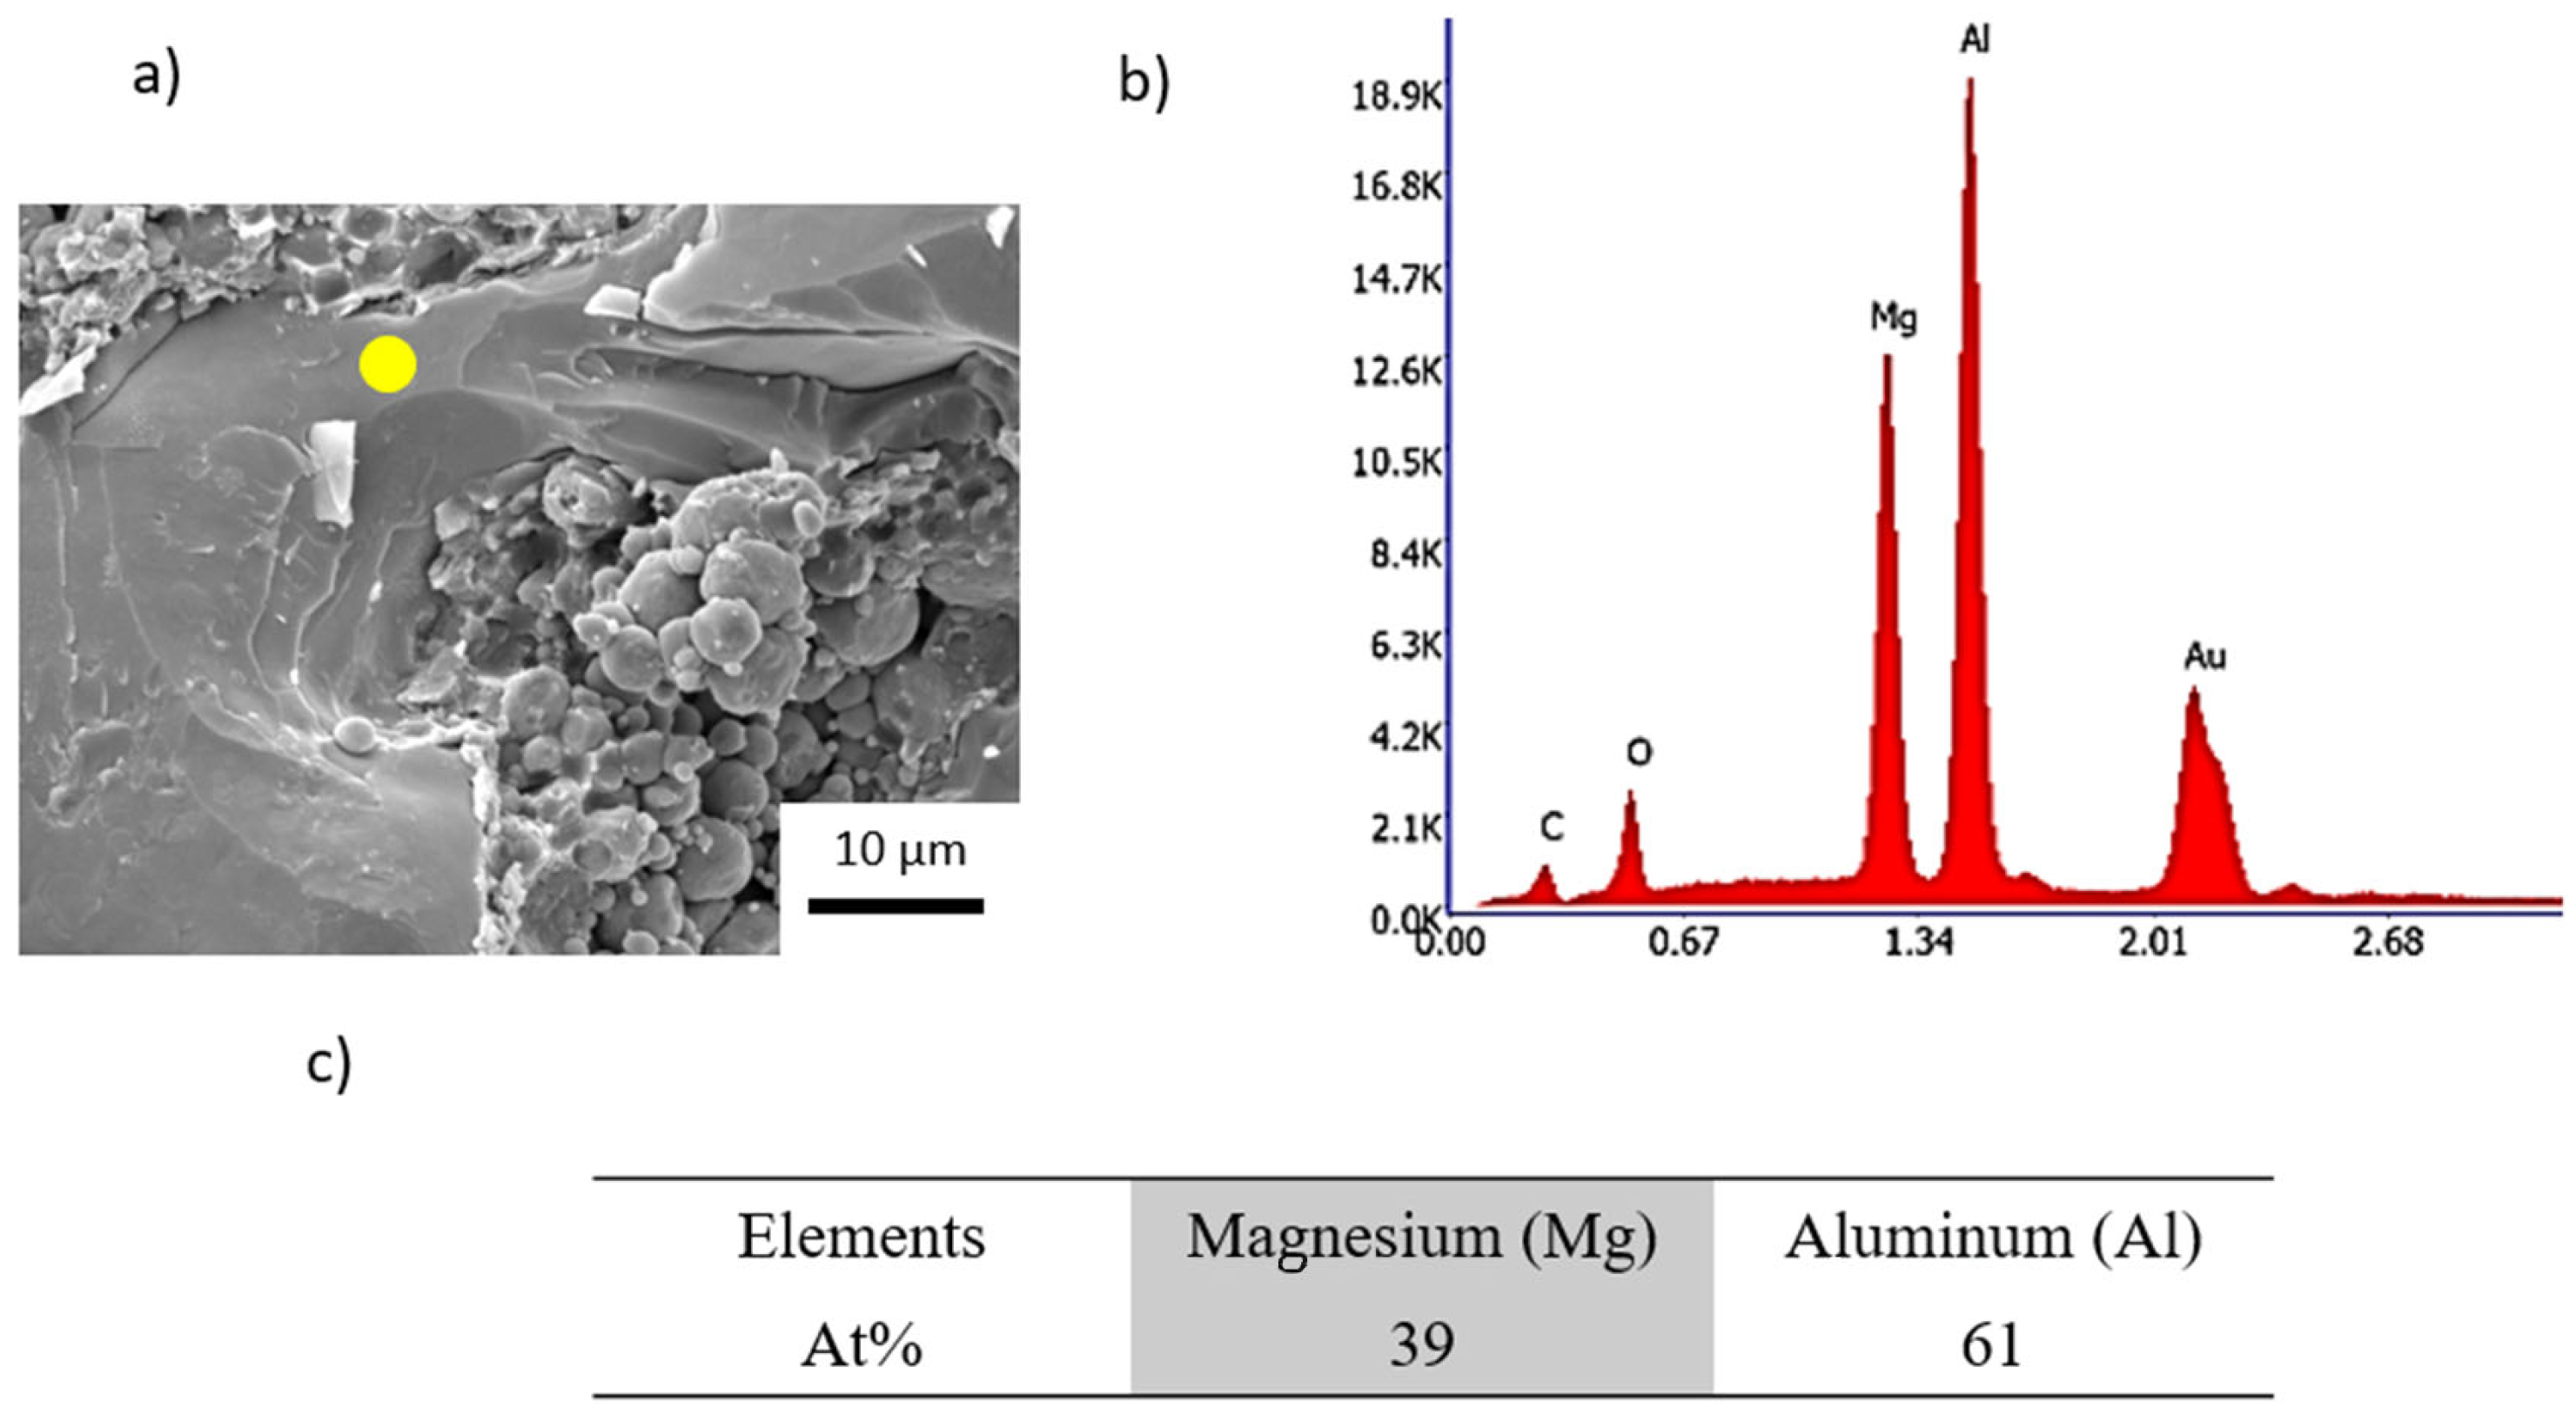
3.1. Fabrication of the Intermetallic Phase Al3Mg2

Three samples were fabricated by uniaxial hot pressing (cf. Table 1) and then analyzed using XRD. The results are shown in Figure 1. Even if the initial mixture is always the same (80 wt.% Al + 20 wt.% Mg), different phase compositions are observed at varied porosity rates. At 50% porosity, only Al and Mg are detected. Under these specific conditions of temperature, pressure, and dwell time (400 °C, 0 MPa, and 10 min, respectively), no intermetallic phases or solid solutions were formed. We found the weight proportion of each phase: 79 wt.% Al and 21 wt.% Mg. This observation is in agreement with the phase diagram. Because the temperature is below the Al-Mg eutectic point, with no driving force (P = 0 MPa), the system is in its equilibrium state.
However, when the applied pressure is increased to 15 MPa, the material exhibits, as expected, a lower porosity ratio (close to 30%), and the emergence of new phases becomes evident. Notably, the intermetallic phase, Al3Mg2, is observed with two solid solutions: one involving Mg in Al and the other involving Al in Mg. These solid solutions are indicated by the appearance of shoulders on the peaks related to Al and Mg. An example of a shoulder is shown in the Supplementary Materials Figure S2. For the solution of Mg in Al, the lattice parameter of the cubic (FCC) lattice is equal to 4.074 Å (it is equal to 4.049 Å for pure Al); this led to a volume of the solid solution V1 equal to 67.62 Å3. For the second solid solution (Al in Mg), the cell parameters of the hexagonal (HCP) lattice are a = 3.191 Å and c = 5.192 Å, leading to a cell volume equal to 45.78 Å3. An analysis of the lattice parameters for these solid solutions reveals approximately 5 wt.% of Mg in Al and 4 wt.% of Al in Mg in accordance with the results of Hardie et al. [36]. The weight proportion of each phase was calculated and we obtained 20 wt.% Al3Mg2, 57 wt.%, Al, 3 wt.% solid solution of Mg in Al, 3 wt.% solid solution of Al in Mg, and 16 wt.% of Mg. These results (i.e., the coexistence of 2 solid solutions with pure Al and Mg and the IM phase Al3Mg2) suggest that the system is out of equilibrium. In the Al-Mg phase diagram, for our composition (Al80Mg20), if the system is in an equilibrium state, only a combination of a solid solution of Mg in Al and IM-phase Al3Mg2 should be observed. Therefore, to achieve the equilibrium state, the sintering temperature or dwell time should be increased. The fact that we are out of equilibrium seems consistent considering the short dwell time and the fact that we are in a case of solid-state sintering. However, the creation of Al3Mg2 leads us to hypothesize that the pressure applied allows it to act in the same way as a temperature increase.
For the third fabrication conditions (400 °C, 40 MPa, 10 min), the XRD analysis shows two main phases: the solid solution Mg in Al and the Al3Mg2 IM. For this pressure, the system can be considered in an equilibrium state because the phases in presence are in agreement with the Al-Mg phase diagram. The obtained FCC solid solution exhibits a different lattice parameter (a = 4.093 Å) than the previous one, indicating a higher concentration of Mg in the solid solution (close to 9 wt.%). The weight proportion of each phase was calculated and we obtained 43 wt.%, Al3Mg2, 30 wt.%, Al, 24 wt.% solid solution of Mg in Al, and 3 wt.% of Mg. These analyses can be correlated with the SEM micrographs presented in Figure 2.
The evolution of the microstructures, observed in the different materials, is in agreement with the XRD results. Specifically, for the 50% porosity material, only Al spherical particles and Mg particles are observed. This is consistent with the XRD analysis, which shows no intermetallic phase and, therefore, no diffusion of Mg into Al (or Al into Mg) when no pressure is applied. For the other materials (30% and 10% porosity), large domains of another phase can be identified. These domains are both larger and more numerous for the denser sample. This further observation corroborates the previous XRD analysis and shows that denser samples exhibit a higher abundance of the intermetallic (IM) phase. The composition of these domains was analyzed with EDS and the results are shown for the denser sample (NB: Figure 3a is equivalent to Figure 2 (10% porosity) in Figure 3b,c. This EDS analysis highlights the ratio of Al/Mg, which is close to 3/2 (exactly 61/39), proving the presence of the Al3Mg2 phase as previously analyzed with XRD. It is, therefore, worth pointing out that the EDS analysis also shows the presence of carbon, oxygen, and gold: (i) the presence of oxygen can be associated with the oxide films present on the surface of both Al and Mg particles, (ii) the carbon peak should be linked with the residue of carbon foil that is used during the sintering process, and (iii) the gold peak is due to the metallization step in the sample preparation.

3.2. Hydrogen Production by Hydrolysis

3.2.1. Hydrogen Production

Figure 4 shows the evolution of hydrogen production as a function of time for the three different fabricated materials. All three materials induce, with seawater, the production of hydrogen with a conversion yield of 50% after (i) 3 h for the 50% porosity material, (ii) 6 h for the 30% porosity material, and (iii) 9 h for the 10% porosity material. As previously mentioned, for pure Al, because of the surface layer of Al oxide (Al2O3), hydrolysis is inhibited in water [37]. Therefore, the hydrolysis reaction of Al (covered with Al2O3) is often performed in basic solutions (pH close to 14) to avoid the domain of stability of the Al2O3 surface layer [38]. The hydrolysis of the Mg is possible in pure water but is often studied in simulated seawater [6,25,26] to increase the reaction kinetics. As demonstrated by our first results, the addition of Mg to Al (20 wt.% in this study) allows for the activation of the hydrolysis reaction of Al in simulated seawater and therefore improves H2 production.
Nevertheless, a clear difference in hydrolysis reaction time is observed when the porosity percentage increases from 10% to 50%. This difference is associated with the difference in the surface accessible to seawater of each material. Indeed, as shown in Figure 2, for the more porous samples, the particles are quite individualized, and the hydrolysis reaction surface is larger than the one for the denser sample. When the pores are percolated (open porosity), it is much easier for the simulated seawater to reach all the particles and consequently, the reaction is faster. However, if the porosity is low enough, the seawater solution must penetrate the materials via an erosion process (e.g., through grain boundaries), which results in a longer reaction time. However, when the reaction takes place, it also creates some diffusion pathways (cracks or defects) that allow for better propagation of the reaction.
Figure 4b shows a fit of the results using the Avrami–Erofeev model. With this model, a very good fit (an example is given in Figure 4b for the 30% porosity material) of all the results is obtained, regardless of the porosity percentage. Results are presented in Table 2.
For each alloy, the fit was made twice. The first fit was completed, as usual, with n and k as parameters. The n values are always close (but lower) than 1, meaning that the reaction involved in the hydrolysis is a surface reaction, as expected. Nevertheless, the values decrease monotonously from 0.94 to 0.79, indicating that for denser materials, a bulk reaction should also be considered (or at least becomes nonnegligible). This first fit also demonstrated that the k value is decreasing with decreasing porosity. A second fit was completed with the same model by fixing the n value to 1 (i.e., assuming only a surface reaction). In such refinement, the evolution of k values is still the same, demonstrating that the surface reaction is the most probable (and predominant) reaction type.

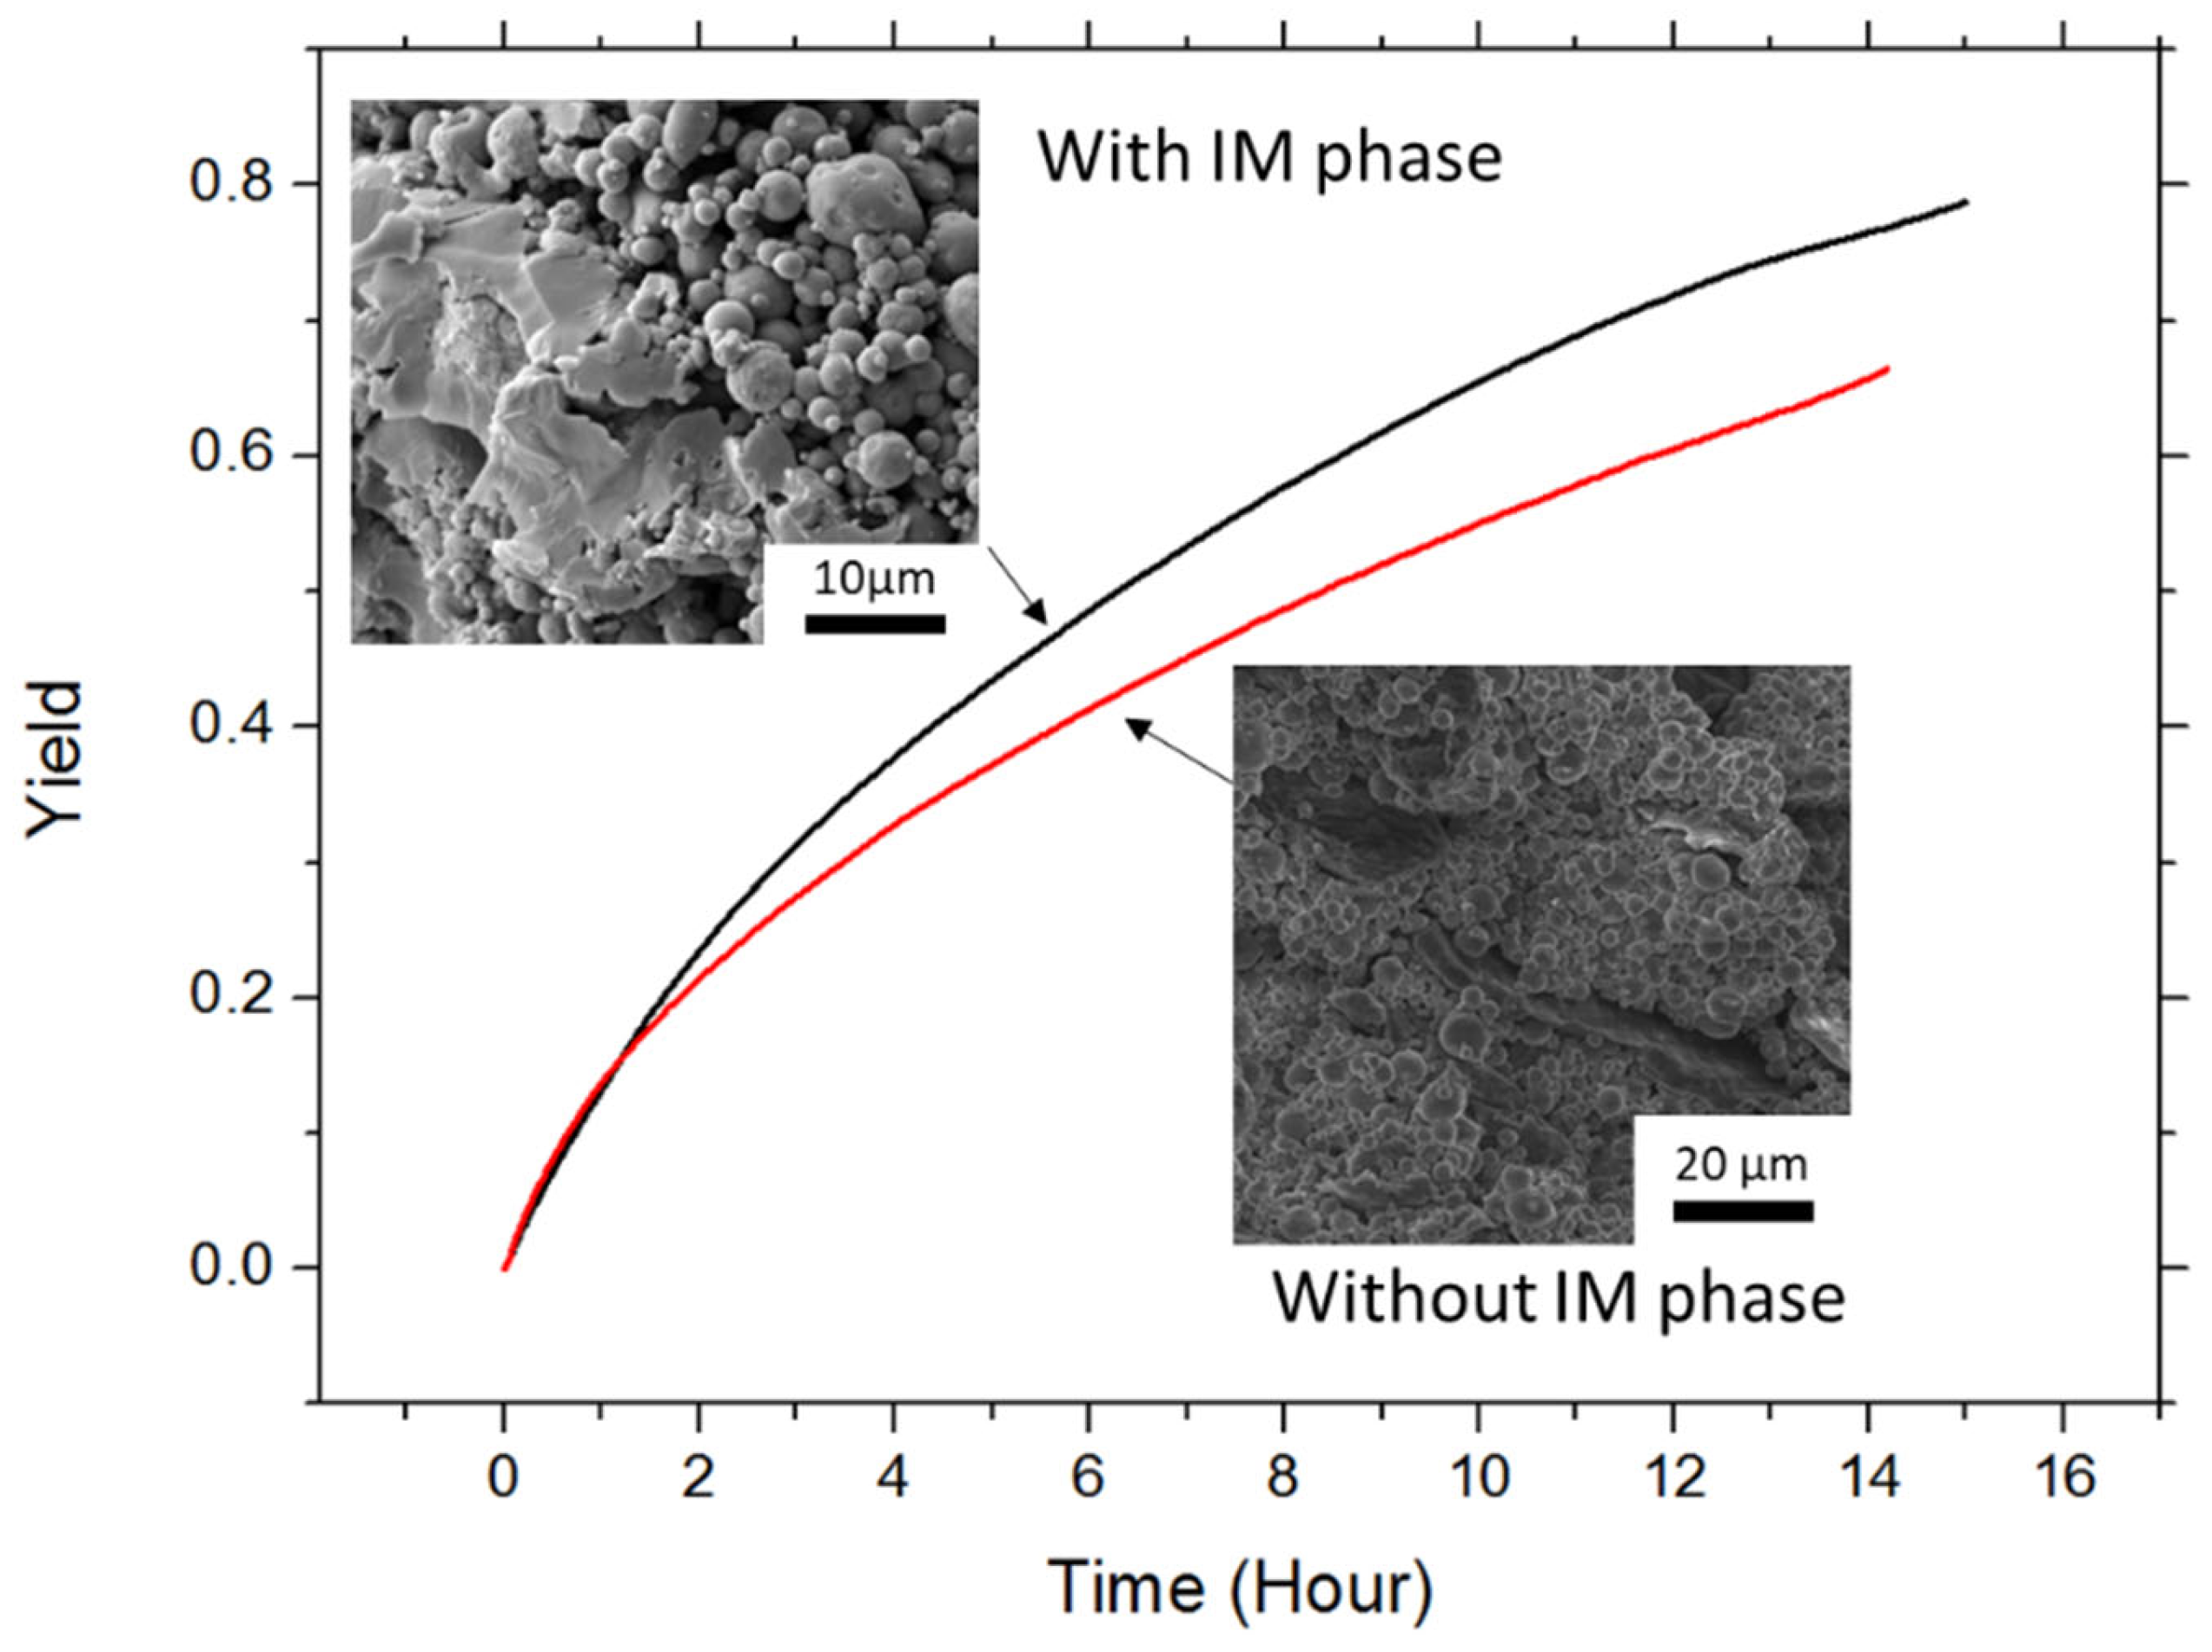
3.2.2. Role of the Intermetallic Phase

To better understand (and isolate) the influence of the Al3Mg2 IM phase on the kinetics of H2 production, another material with the same porosity level (30%) was synthesized without the presence of Al3Mg2. Because the formation of the IM is temperature-dependent, we chose a lower temperature than the one previously used. Therefore, to reach a similar porosity rate, we kept the dwell time constant and increased the applied pressure. The sample without the IM phase was prepared through uniaxial hot pressing. The thermal treatment performed was 350 °C, 40 MPa, and 10 min (resulting in a porosity rate of 30%) and was compared with the previous 30% porosity sample. The hydrolysis curves of these two materials and the corresponding micrographs are shown in Figure 5. The XRD data for these two curves are given in the Supplementary Materials Figure S3.
A clear difference is observed between both materials. Indeed, for a given porosity rate (30%), the presence of the intermetallic phase influences the kinetics and efficiency of the hydrolysis reaction. The presence of Al3Mg2 leads to a better conversion yield and faster reaction kinetics. This observation is attributable to a difference in open-circuit potential between Al and Al3Mg2 (e.g., 0.4 V) [39]. This difference, greater than 0.25 V, implies that the galvanic coupling is strong enough to promote the hydrolysis reaction. It can explain the results highlighted in Figure 5. This phenomenon has already been reported for the Mg-Al12Mg17 binary material [6] or other alloys [25,40].

4. Conclusions

In summary, this study focused on the incidence of the formation of the intermetallic phase Al3Mg2 during solid-state sintering on the hydrolysis properties.
For the materials fabricated in this study (Al80 wt.% + Mg20 wt.%), we have highlighted the appearance of the intermetallic phase for a densification temperature equal to 400 °C, a dwell time of 10 min, and a pressure equal or higher than 15 MPa. Under the following conditions (400 °C, 10 min dwell time, and 15 MPa), the phases detected are Al, Mg, Al3Mg2, and 2 solid solutions. This analysis proves that the system is out of equilibrium. When the pressure is further increased, the system becomes closer to the equilibrium state, and the phases observed are Al, an FCC solid solution of Mg in Al, and IM-phase Al3Mg2 without increasing either the dwell time or temperature.
The H2 production properties of the densified materials have been studied. Results show that the production of H2 is possible in simulated seawater for each material. Moreover, it has been shown that when the density of the materials increases, the kinetic of the hydrolysis reaction decreases. The hydrolysis reaction is mainly a surface reaction, but a bulk reaction becomes nonnegligible for denser materials. Finally, for the same porosity rate, it has been shown that IM-phase Al3Mg2 plays a positive role in the improvement of H2 production. The increase in H2 production is attributed to the difference in the potential between Al3Mg2 and Al leading to a galvanic coupling.

Supplementary Materials

The following supporting information can be downloaded at: https://www.mdpi.com/article/10.3390/met13111868/s1. Figure S1: Al-Mg binary phase diagram; Figure S2: Zoom on the XRD of the 30% porosity sample showing the solid solution of Mg in Al signature (shoulders on the Al peaks); Figure S3: Comparison of XRD data for samples with the same porosity (30%) and with or without the IM phase.

Author Contributions

The work was completed through contributions of L.C., C.P., J.-F.S. and J.-L.B.; L.C. and C.P. conceived and designed the experiments; L.C. and C.P. performed the experiments; L.C., J.-F.S. and J.-L.B. analyzed the data; J.-F.S. and J.-L.B. contributed reagents/materials/analysis tools; L.C. and J.-L.B. wrote the paper. All authors have read and agreed to the published version of the manuscript.

Funding

Financial support of (i) MENRT (French Ministry of Education and Research) through a grant given to L.C. and (ii) ANR (Project ANR-22-PEHY-0007) were greatly appreciated.

Data Availability Statement

All data needed to evaluate the conclusions in the paper are presented in the paper. The datasets generated during the current study are available from the corresponding author on reasonable request.

Conflicts of Interest

The authors declare no conflict of interest.

References

  1. Vargel, C. Corrosion de L’aluminium; Technique et ingénierie Série Matériaux; Dunod: Paris, France, 1999; ISBN 978-2-10-006569-1. [Google Scholar]
  2. Vargel, C. Métallurgie de L’aluminium. Available online: https://www.techniques-ingenieur.fr/base-documentaire/materiaux-th11/metaux-et-alliages-non-ferreux-42357210/metallurgie-de-l-aluminium-m4663/ (accessed on 4 September 2023).
  3. Hajjari, E.; Divandari, M.; Razavi, S.H.; Homma, T.; Kamado, S. Intermetallic Compounds and Antiphase Domains in Al/Mg Compound Casting. Intermetallics 2012, 23, 182–186. [Google Scholar] [CrossRef]
  4. L’aluminium: Dossier Complet|Techniques de L’Ingénieur. Available online: https://www.techniques-ingenieur.fr/base-documentaire/43804210-techniques-du-batiment-connaitre-les-materiaux-de-la-construction/download/tba1066/l-aluminium.html (accessed on 22 September 2021).
  5. Murray, J.L. ASM Handbook, Volume 3, Alloy Phase Diagrams; ASM International: Novelty, OH, USA, 1992. [Google Scholar]
  6. Al Bacha, S.; Thienpont, A.; Zakhour, M.; Nakhl, M.; Bobet, J.-L. Clean Hydrogen Production by the Hydrolysis of Magnesium-Based Material: Effect of the Hydrolysis Solution. J. Clean. Prod. 2021, 282, 124498. [Google Scholar] [CrossRef]
  7. Bauer, E.; Kaldarar, H.; Lackner, R.; Michor, H.; Steiner, W.; Scheidt, E.-W.; Galatanu, A.; Marabelli, F.; Wazumi, T.; Kumagai, K.; et al. Superconductivity in the Complex Metallic Alloy β−Al3Mg2. Phys. Rev. B 2007, 76, 014528. [Google Scholar] [CrossRef]
  8. Liu, Y.; Ma, Y.; Liu, W.; Huang, Y.; Wu, L.; Wang, T.; Liu, C.; Yang, L. The Mechanical Properties and Formation Mechanism of Al/Mg Composite Interface Prepared by Spark Plasma Sintering under Different Sintering Pressures. Vacuum 2020, 176, 109300. [Google Scholar] [CrossRef]
  9. Bhargava, N.R.M.R.; Samajdar, I.; Ranganathan, S.; Surappa, M.K. Role of Cold Work and SiC Reinforcements on the Β′/β Precipitation in Al-10 Pct Mg Alloy. Metall. Mater. Trans. A 1998, 29, 2835–2842. [Google Scholar] [CrossRef]
  10. Ding, Y.; Gao, K.; Huang, H.; Wen, S.; Wu, X.; Nie, Z.; Guo, S.; Shao, R.; Huang, C.; Zhou, D. Nucleation and Evolution of β Phase and Corresponding Intergranular Corrosion Transition at 100–230 °C in 5083 Alloy Containing Er and Zr. Mater. Des. 2019, 174, 107778. [Google Scholar] [CrossRef]
  11. Scudino, S.; Liu, G.; Sakaliyska, M.; Surreddi, K.B.; Eckert, J. Powder Metallurgy of Al-Based Metal Matrix Composites Reinforced with β-Al3Mg2 Intermetallic Particles: Analysis and Modeling of Mechanical Properties. Acta Mater. 2009, 57, 4529–4538. [Google Scholar] [CrossRef]
  12. Zhou, D.; Zhang, X.; Zhang, D. Making Strong Al(Mg)-Al3Mg2 Composites. Materialia 2021, 16, 101099. [Google Scholar] [CrossRef]
  13. Zheng, T.; Zhang, J.; Tang, Y.; Wan, P.; Yuan, Q.; Hu, H.; Coulon, F.; Hu, Q.; Yang, X.J. Production of High-Purity Hydrogen and Layered Doubled Hydroxide by Hydrolysis of Mg-Al Alloys. Chem. Eng. Technol. 2021, 44, 797–803. [Google Scholar] [CrossRef]
  14. Dawood, F.; Anda, M.; Shafiullah, G.M. Hydrogen Production for Energy: An Overview. Int. J. Hydrogen Energy 2020, 45, 3847–3869. [Google Scholar] [CrossRef]
  15. Marbán, G.; Valdés-Solís, T. Towards the Hydrogen Economy? Int. J. Hydrogen Energy 2007, 32, 1625–1637. [Google Scholar] [CrossRef]
  16. Midilli, A.; Ay, M.; Dincer, I.; Rosen, M.A. On Hydrogen and Hydrogen Energy Strategies: I: Current Status and Needs. Renew. Sustain. Energy Rev. 2005, 9, 255–271. [Google Scholar] [CrossRef]
  17. Hanley, E.S.; Deane, J.; Gallachóir, B.Ó. The Role of Hydrogen in Low Carbon Energy Futures–A Review of Existing Perspectives. Renew. Sustain. Energy Rev. 2018, 82, 3027–3045. [Google Scholar] [CrossRef]
  18. Mazloomi, K.; Gomes, C. Hydrogen as an Energy Carrier: Prospects and Challenges. Renew. Sustain. Energy Rev. 2012, 16, 3024–3033. [Google Scholar] [CrossRef]
  19. Abe, J.O.; Popoola, A.P.I.; Ajenifuja, E.; Popoola, O.M. Hydrogen Energy, Economy and Storage: Review and Recommendation. Int. J. Hydrogen Energy 2019, 44, 15072–15086. [Google Scholar] [CrossRef]
  20. Kalamaras, C.M.; Efstathiou, A.M. Hydrogen Production Technologies: Current State and Future Developments. Conf. Pap. Sci. 2013, 2013, 690627. [Google Scholar] [CrossRef]
  21. Holladay, J.D.; Hu, J.; King, D.L.; Wang, Y. An Overview of Hydrogen Production Technologies. Catal. Today 2009, 139, 244–260. [Google Scholar] [CrossRef]
  22. Dincer, I.; Acar, C. Review and Evaluation of Hydrogen Production Methods for Better Sustainability. Int. J. Hydrogen Energy 2015, 40, 11094–11111. [Google Scholar] [CrossRef]
  23. Konieczny, A.; Mondal, K.; Wiltowski, T.; Dydo, P. Catalyst Development for Thermocatalytic Decomposition of Methane to Hydrogen. Int. J. Hydrogen Energy 2008, 33, 264–272. [Google Scholar] [CrossRef]
  24. Balat, M.; Balat, M. Political, Economic and Environmental Impacts of Biomass-Based Hydrogen. Int. J. Hydrogen Energy 2009, 34, 3589–3603. [Google Scholar] [CrossRef]
  25. Donadey, G.; Caillaud, S.; Coeuret, P.; Moussa, M.; Cuzacq, L.; Bobet, J.-L. Hydrogen Generation from Mg Wastes by Cold Rolling and Ball Milling by Hydrolysis Reaction: Elektron 21 (UNS-M12310) in Simulated Seawater. Metals 2022, 12, 1821. [Google Scholar] [CrossRef]
  26. Legrée, M.; Bobet, J.-L.; Mauvy, F.; Sabatier, J. Modeling Hydrolysis Kinetics of Dual Phase α-Mg/LPSO Alloys. Int. J. Hydrogen Energy 2022, 47, 23084–23093. [Google Scholar] [CrossRef]
  27. Alinejad, B.; Mahmoodi, K. A Novel Method for Generating Hydrogen by Hydrolysis of Highly Activated Aluminum Nanoparticles in Pure Water. Int. J. Hydrogen Energy 2009, 34, 7934–7938. [Google Scholar] [CrossRef]
  28. Soler, L.; Macanás, J.; Muñoz, M.; Casado, J. Aluminum and Aluminum Alloys as Sources of Hydrogen for Fuel Cell Applications. J. Power Sources 2007, 169, 144–149. [Google Scholar] [CrossRef]
  29. Zou, H.; Chen, S.; Zhao, Z.; Lin, W. Hydrogen Production by Hydrolysis of Aluminum. J. Alloys Compd. 2013, 578, 380–384. [Google Scholar] [CrossRef]
  30. Liu, Y.; Liu, X.; Chen, X.; Yang, S.; Wang, C. Hydrogen Generation from Hydrolysis of Activated Al-Bi, Al-Sn Powders Prepared by Gas Atomization Method. Int. J. Hydrogen Energy 2017, 42, 10943–10951. [Google Scholar] [CrossRef]
  31. Liu, S.; Fan, M.; Wang, C.; Huang, Y.; Chen, D.; Bai, L.; Shu, K. Hydrogen Generation by Hydrolysis of Al–Li–Bi–NaCl Mixture with Pure Water. Int. J. Hydrogen Energy 2012, 37, 1014–1020. [Google Scholar] [CrossRef]
  32. Chen, X.; Zhao, Z.; Liu, X.; Hao, M.; Chen, A.; Tang, Z. Hydrogen Generation by the Hydrolysis Reaction of Ball-Milled Aluminium–Lithium Alloys. J. Power Sources 2014, 254, 345–352. [Google Scholar] [CrossRef]
  33. du Preez, S.P.; Bessarabov, D.G. Hydrogen Generation by the Hydrolysis of Mechanochemically Activated Aluminum-Tin-Indium Composites in Pure Water. Int. J. Hydrogen Energy 2018, 43, 21398–21413. [Google Scholar] [CrossRef]
  34. Silvain, J.-F.; Heintz, J.-M.; Veillere, A.; Constantin, L.; Lu, Y.F. A Review of Processing of Cu/C Base Plate Composites for Interfacial Control and Improved Properties. Int. J. Extrem. Manuf. 2020, 2, 012002. [Google Scholar] [CrossRef]
  35. Buryakovskaya, O.A.; Kurbatova, A.I.; Vlaskin, M.S.; Valyano, G.E.; Grigorenko, A.V.; Ambaryan, G.N.; Dudoladov, A.O. Waste to Hydrogen: Elaboration of Hydroreactive Materials from Magnesium-Aluminum Scrap. Sustainability 2022, 14, 4496. [Google Scholar] [CrossRef]
  36. Hardie, D.; Parkins, R.N. Lattice Spacing Relationships in Magnesium Solid Solutions. Philos. Mag. 1959, 4, 815–825. [Google Scholar] [CrossRef]
  37. Huang, X.; Gao, T.; Pan, X.; Wei, D.; Lv, C.; Qin, L.; Huang, Y. A Review: Feasibility of Hydrogen Generation from the Reaction between Aluminum and Water for Fuel Cell Applications. J. Power Sources 2013, 229, 133–140. [Google Scholar] [CrossRef]
  38. Pourbaix, M.J.N. Atlas D’équilibres Électrochimiques; Gauthier-Villars & Cie: Paris, France, 1963. [Google Scholar]
  39. Jones, R.H.; Baer, D.R.; Danielson, M.J.; Vetrano, J.S. Role of Mg in the Stress Corrosion Cracking of an Al-Mg Alloy. Metall. Mater. Trans. A 2001, 32, 1699–1711. [Google Scholar] [CrossRef]
  40. Legrée, M. Étude d’un Procédé de Production d’Hydrogène In-Situ Sous Haute Pression Par Hydrolyse En Présence de Magnésium. Ph.D. Thesis, Université de Bordeaux, Bordeaux, France, 2022. [Google Scholar]
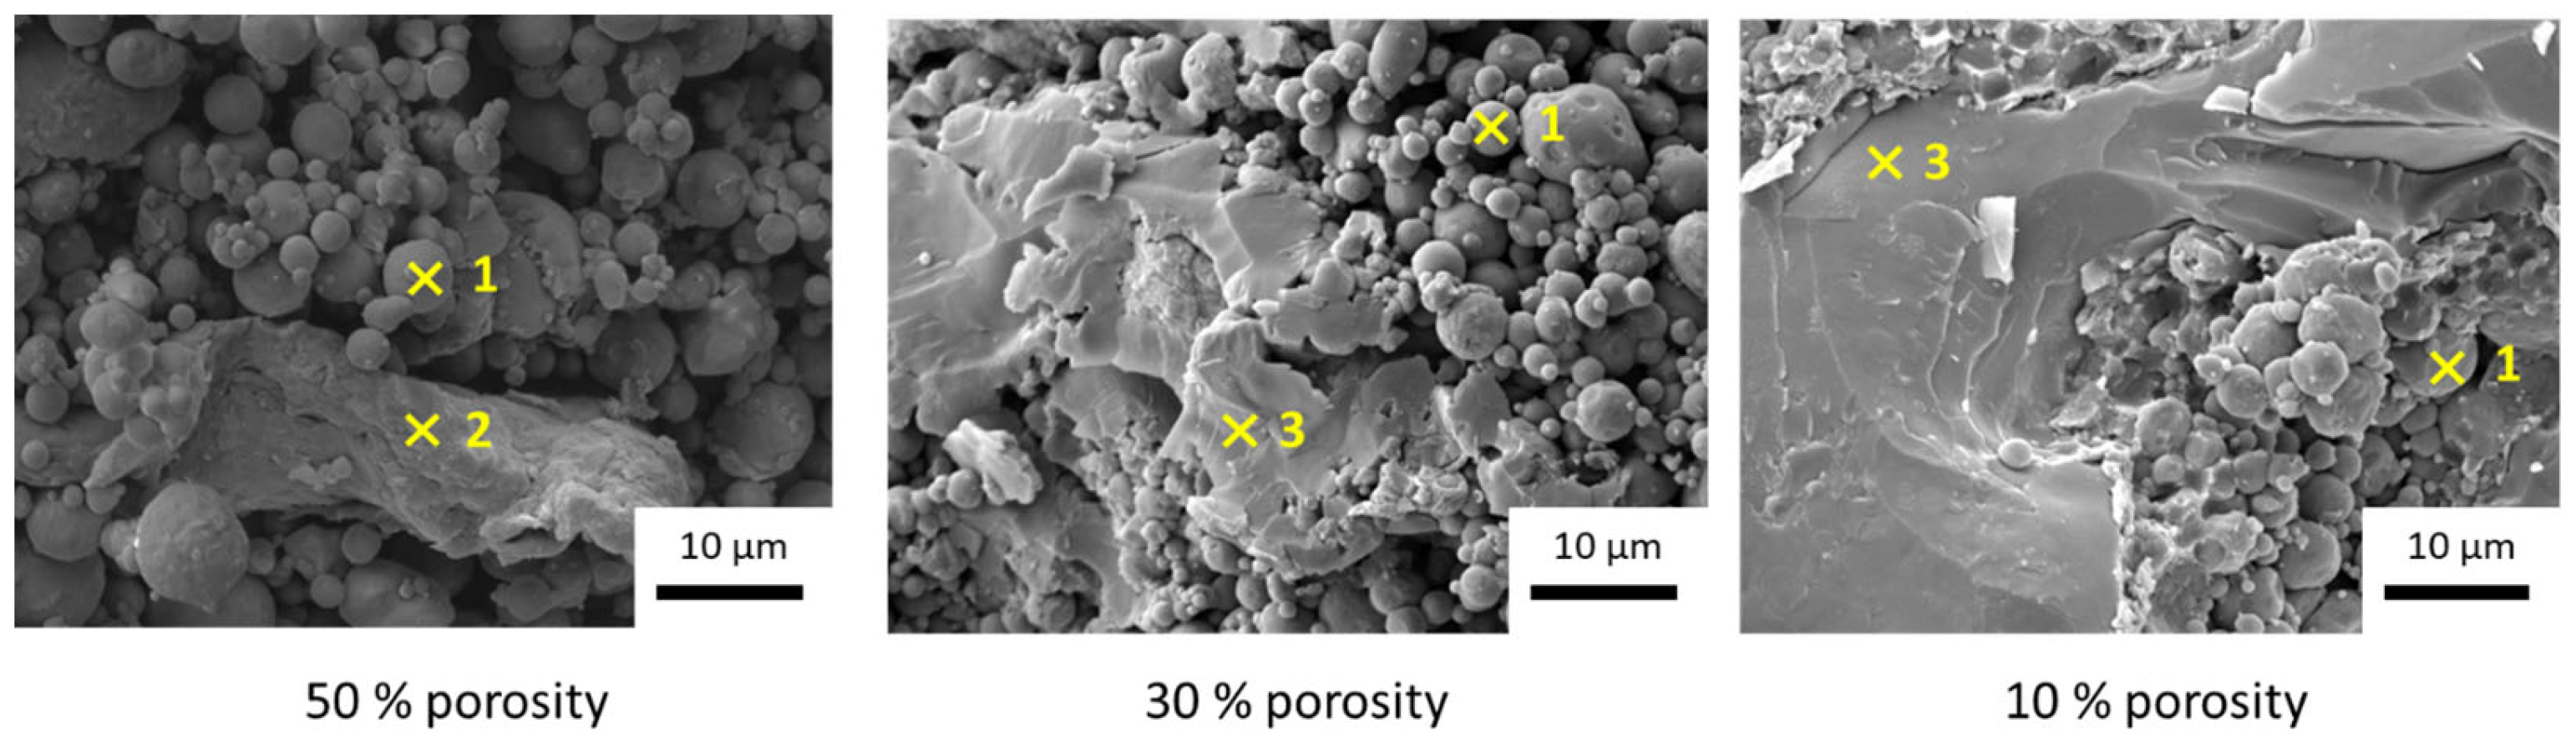
Figure 1. XRD analysis of the alloys (with 10, 30, and 50% porosity) fabricated with uniaxial hot pressing.
Metals 13 01868 g001
Figure 2. Microstructures of the alloys (three different porosities) studied by SEM 1, 2, and 3, referred to as Al particles, Mg particles, and Al3Mg2 domains, respectively.
Metals 13 01868 g002
Figure 3. Analysis of the 10% porosity material: (a) SEM micrograph, (b) EDS map of the yellow point, and (c) atomic concentration of the elements Al and Mg detected with EDS.
Metals 13 01868 g003
Figure 4. (a) Hydrolysis curves of the different alloys synthesized, (b) example of fitting of a hydrolysis curve with the Avrami–Erofeev model (30% porosity).
Metals 13 01868 g004
Figure 5. Hydrolysis curves and respective microstructures of alloys containing Al3Mg2 phase or not (30% porosity).
Metals 13 01868 g005
Table 1. Sintering parameters of the different Al80Mg20 materials synthesized.
Temperature (°C)Pressure (MPa)Time (min)Porosity (%)
40001050
400151030
400401010
Table 2. Values of the Avrami–Erofeev parameters calculated from the fitted hydrolysis curves. The second fit values are given in parentheses.
Avrami–Erofeev Parameters50%30%10%
n0.94 (1)0.88 (1)0.79 (1)
k0.25 (0.133)0.14 (0.109)0.12 (0.076)
Disclaimer/Publisher’s Note: The statements, opinions and data contained in all publications are solely those of the individual author(s) and contributor(s) and not of MDPI and/or the editor(s). MDPI and/or the editor(s) disclaim responsibility for any injury to people or property resulting from any ideas, methods, instructions or products referred to in the content.

