Article

The Effect of Pore Sealing in a Multilayer Si–O–Zr/Al2O3 Coating Designed to Protect Aluminium from Corrosion

Department of Physical and Organic Chemistry, Jožef Stefan Institute, Jamova c. 39, SI-1000 Ljubljana, Slovenia
*
Author to whom correspondence should be addressed.
Metals 2023, 13(12), 1960; https://doi.org/10.3390/met13121960
Submission received: 21 October 2023 / Revised: 24 November 2023 / Accepted: 28 November 2023 / Published: 30 November 2023
(This article belongs to the Special Issue Advances in Corrosion and Protection of Materials (Second Edition))

Abstract

:
This study deals with the combination of two corrosion protection strategies for aluminium: barrier protection (provided by a 3.8 μm thick hybrid sol–gel coating) and aluminium pore sealing via the use of a 100 nm thick layer of aluminium oxide. A Si–O–Zr hybrid sol–gel coating (TMZ) was synthesised by combining two separately prepared sols (i) tetraethyl orthosilicate and 3-methacryloxypropyl trimethoxysilane and (ii) zirconium(IV) n-propoxide chelated with methacrylic acid. The synthesis of the Si–O–Zr hybrid sol–gel was evaluated at various stages using real-time infrared spectroscopy. A 100 nm thick Al2O3 film was prepared via thermal atomic layer deposition at 160 °C using trimethyl aluminium and water as precursors. The coating and film properties were assessed via focused ion beam/scanning electron microscopy coupled with energy-dispersive X-ray spectrometry. Sealing with the Al2O3 film did not affect the microstructure and composition of the underlying sol–gel coating. The coating’s corrosion performance in 0.1 M NaCl solution was evaluated using electrochemical impedance spectroscopy. Compared to individual coatings, the multilayer TMZ/Al2O3 coating ensured prolonged (more than three weeks) durable corrosion protection for the aluminium. The impedance magnitude increased by two orders compared to the uncoated substrate (|Z|10 mHz from 16 kΩ cm2 to almost 830 MΩ cm2). Thus, the pore sealing of the sol–gel coating using an ALD alumina film produced a protective multilayer coating system, with |Z|10 mHz remaining above 5 MΩ cm2 after four weeks in NaCl solution.

1. Introduction

In recent decades, the protection of metals and alloys from corrosion in different corrosive environments has been provided mainly via the hexavalent chromium-based compounds (chromate) used in coating systems and chromate conversion coatings [1,2,3,4]. However, chromate compounds are hazardous for humans and the environment [5], and their use must be reduced [6]. Since September 2017, stricter regulations have been mandated, and chromates have been banned or restricted in several industrial sectors [6]. As a result, there is a significant need to develop and replace hazardous chromates with environmentally friendly, non-toxic surface treatments capable of providing sufficient corrosion protection [4,7,8].
One of the promising alternatives of surface barrier prevention is the deposition of hybrid sol–gel coatings on the metal surface, which provide a physical barrier against water and the penetration of aggressive ions (i.e., Cl) to the metal surface [9,10]. In the literature, many organically modified silicates (ormosils) have demonstrated good corrosion protection on aluminium [11,12], even in acidic and alkaline conditions [11]. In addition, coatings containing zirconium in the sol–gel network further improve the silane matrix’s coating properties [13,14,15]. This was confirmed in Si–O–Zr (Si/Zr) hybrid coatings based on tetraethyl orthosilicate (TEOS), 3-methacryloxypropyl trimethoxysilane (MAPTMS), zirconium(IV) n-propoxide (ZTP), and methacrylic acid (MAA) [11,16,17,18,19,20]. Hydrolysis, condensation, and polymerisation reactions in such systems were studied in detail at various stages using several techniques, such as spectroscopic techniques, solution characterisation techniques, and coating characterisation techniques [11,16,18,20]. The coatings deposited on the aluminium [11,18] or aluminium alloys [17,21] were amorphous, homogeneous, and only a few micrometres thick, with very low porosity (between 0.85 and 0.49%) [20]. The degree of corrosion protection depends on several parameters, and the ZTP content in the coating and ZTP/MAA ratio are the main ones [16]. Under optimal conditions, ZTP can stimulate the condensation reaction and formation of large domains of polycondensed Si species [11]. In neutral chloride solutions, TMZ coatings containing more ZTP expressed greater corrosion resistance [20], but the dependence on coating properties is not straightforward due to other parameters such as ageing time, curing temperature, etc., which are still poorly understood [21]. In the present study, we first focused on conducting a real-time analysis of the kinetics of hydrolysis and condensation reactions for coatings with greater ZTP contents (ZTP/MAA = 1:2) during synthesis and then characterised the coatings’ morphologies, structures, and thicknesses.
Aluminium, in the presence of oxygen or humidity/water, instantly forms a native (passive) oxide film that is a few nanometres thick [22,23]. Its thickness, composition, and porosity depend on several parameters, such as temperature, surface structure, topography, or other metal impurities present in the structure [22,24]. Such films are stable in a pH range between 4.5 and 8 [25], but in more aggressive acidic [26,27] and alkaline media [27,28], they can be dissolved [27,28]. In addition, pits can be formed in a chloride-containing corrosive environment due to the passive film breakdown [22,29,30].
The shortcomings of the aluminium native passivation process can be minimised by depositing an additional barrier film using atomic layer deposition (ALD). This technique allows for the deposition of highly uniform ultra-thin films with thicknesses in the range of atomic or molecular layers due to the self-limiting reactions of the deposited materials [23,31]. The use of ALD for protecting metallic substrates from corrosion was proposed in the late 1980s and early 1990s [23]. Nowadays, ALD is widely used in the industry for the deposition of metal and metal nitride films (Al, Ti, AlN, TiN) and the deposition of dielectric thin films (HfO2, ZrO2, and Al2O3) [32,33,34,35,36]. The coatings deposited by ALD provide new applications in diverse areas of corrosion [37] because a thin ALD film serves as an efficient barrier protection against gases [38,39] and liquids [36,40]. Up to now, the most frequently used ALD corrosion protection coating has been Al2O3, which is usually deposited from trimethyl aluminium (Al(CH)3) and water [39,41,42,43,44] at temperatures ranging from 33 to 500 °C [37,45,46,47]. The deposition of ALD films at higher temperatures improves the reaction between TMA and Al–OH at the surface. However, deposition at higher temperatures is challenging for metals, as overheating may cause surface oxidation, potentially weakening the protective layer as a result [45]. This can be problematic, especially for corrosion-resistance applications that require dense films without defects [33,45,48]. A low deposition temperature is also relevant to the energetic efficiency for obtaining amorphous coatings, preventing the growth of crystallite-/grain-defective boundaries as possible diffusion channels for corrosive species [35,45,48].
Ultra-thin Al2O3 films have been reported to efficiently protect various metals, such as steel [47,48,49,50], copper [51,52], and aluminium and its alloys [40,47]. In addition to depositing individual films, ALD is also used as a sealing method to block the pinholes in hard coatings prepared via physical and chemical vapour deposition (PVD and CVD) [37,53] and anodised aluminium [54]. ALD precursors penetrate deep into the coating, forming a film and blocking the pinholes. The sealing performance is reflected by decreasing the corrosion current density and increasing the corrosion potential to less negative potential [37,41]. Various ALD films have been tested to protect different polymeric surfaces or flexible polymer films [55,56], but we failed to find any studies on pore sealing Si–O–Zr coatings using ALD films in the literature.
Based on the literature summary presented above, the main aim of this work was to investigate the possibility of using a thin ALD alumina film to seal the pores of a Si–O–Zr hybrid sol–gel coating. First, individual coatings (TMZ and ALD Al2O3) were characterised using microstructure and compositional analysis at the top and cross-section. In addition, the Si–O–Zr synthesis kinetics were followed using real-time Fourier-transform infrared spectroscopy. The level of corrosion protection was analysed using electrochemical impedance spectroscopy in 0.1 M NaCl solution. Second, a multilayer TMZ/Al2O3 coating was prepared and comparatively analysed to confirm the benefits of multilayer coatings in terms of prolonged corrosion protection.

2. Materials and Methods

2.1. Aluminium Substrate

One-millimetre-thick aluminium (Al > 99.0%) flat sheets were supplied by Goodfellow, Cambridge Ltd. (Huntingdon, UK) The sheets were cut into 14 mm diameter disks, and then the surface was ground using a Struers LaboSystem LaboPol-20 machine employing 2400- and 4000-grit SiC emery papers (distributed by Struers ApS, Ballerup, Denmark) to remove the natural oxide layer from the aluminium surface. After the grinding process, the sample was rinsed with distilled water and further cleaned in anhydrous ethanol utilising an ultrasonic cleaner for 10 min to eliminate any organic substances. Finally, the samples were dried using compressed nitrogen.

2.2. Coating/Film Deposition

Table 1 summarises the coatings’ precursors, deposition methods, and thicknesses.

2.2.1. Hybrid Sol–Gel Coating

The hybrid sol–gel coating was synthesised by mixing two separately prepared solutions from silicon (Sol 1) and zirconium sol–gel reagents (precursors) (Sol 2): tetraethyl orthosilicate (TEOS: Si(OC2H5)4, 99.9%, Sigma-Aldrich (St. Louis, MO, USA), CAS Number 78-10-4), 3-methacryloxypropyl trimethoxysilane (MAPTMS: H2C=C(CH3)CO2(CH2)3Si(OCH3)3, ≥98%, Sigma-Aldrich, CAS Number 2530-85-0), zirconium(IV) n-propoxide solution, (ZTP: Zr(OPr)4, 70 wt.%, in 1-propanol, Sigma-Aldrich, CAS Number 23519-77-9), and methacrylic acid (MAA: H2C=C(CH3)COOH, 99.0% Sigma-Aldrich, CAS Number 79-41-4). The hydrolysis was initiated by adding deionised Milli-Q water containing hydrochloric acid (HCl: >37%, AppliChem, Darmstadt, Germany).
The detailed synthesis procedure has been described in the literature [11,16,17,18]. The molar ratio of the reagents was as follows: TEOS/MAPTMS/ZTP/MAA = 0.18:1:0.48:0.96 (ZTP/(TEOS + MAPTMS) = 0.48/1.18; Zr/Si = 0.41). The final sol and coating are denoted with the abbreviation TMZ. All syntheses were performed in a 25 mL reactor at atmospheric pressure open to the air using the EasyMax 102 advanced synthesis workstation. The reactor jacket temperature was kept constant at 23 ± 0.1 °C.
The sol–gel synthesis reactions were characterised by recording real-time ATR-FTIR spectra at intervals of 1 min in the range of 600–2800 cm−1. The spectra were measured using a ReactIR™ 45 spectrometer (Mettler Toledo, Columbus, OH, USA) with a resolution of 4 cm−1, averaging 256 scans. An EasyMax 102 controller (Mettler Toledo, Columbus, OH, USA) was used to control the conditions during the reaction. The instruments were controlled using iControl EasyMax 6.1 and iC IR 7.1 software. The spectra were recorded from 1800 to 500 cm−1, where the most intensive and characteristic bands were present. The intensities of the spectra are shown in absorbance units (A.U.). The intensity of the selected band was compared to zero in the spectra baseline.
The prepared sol–gel solutions were applied to the ground aluminium substrate after one hour of synthesis using a spin-coater (Laurell—WS-650-23NPP/LITE/IND, Laurell Technology Corporation, Lansdale, PA, USA). Excess sol was applied by injecting the fluid through a polytetrafluoroethylene (PTFE) syringe filter with a 0.2 μm membrane onto the centre of the substrate. Then, the sample was spun with a rotation speed of 4000 rpm for 30 s. During rotation, excess sol was removed, leaving the substrate covered with an evenly thick coating. The coated samples were kept in ambient conditions for 10 min and then cured on a preheated hot plate at 160 °C for 1 h in an air atmosphere.

2.2.2. Atomic Layer Deposition of the ALD Al2O3 Film

The thermal ALD Al2O3 (alumina) films were grown in a flow-type ALD reactor Beneq (Beneq Qy, Espoo, Finland). The films were grown using trimethyl aluminium (TMA, Al(CH3)3, Elec. Gr., 99.99%-Al, Puratrem, manufactured by STREM Chemmicals, Inc, Bischheim, France, Europe) as a precursor and H2O (deionised Milli-Q water) as a co-reagent. Both chemicals were vapourised at room temperature. Dry compressed nitrogen (>99.999%, HiQ Nitrogen 5.0, Instrabenz Plini, Bertoki, Slovenia) was used as a carrier and purging gas. The chamber of the ALD system was constantly pumped using a turbomolecular vacuum pump, and the chamber pressure during the process was approximately 10 mbar. The time sequence of deposition precursor/purge/water/purge was 0.3/1/0.35/1 s. The deposition temperature was set to 160 °C. The stabilisation time (heating the chamber to set temperature) was about 30 min. The final Al2O3 film thickness was ~100 nm (obtained after 1000 cycles). The samples were taken from the ALD chamber when the chamber temperature was below 100 °C.

2.2.3. Multilayer TMZ/Al2O3 System

A multilayer Si–O–Zr hybrid sol–gel/Al2O3 system (abbreviation TMZ/Al2O3) was prepared by applying one layer of TMZ coating followed by the deposition of 100 nm ALD film (as described in the above text).

2.3. Coating Characterisation

2.3.1. Composition Characterisation

FTIR spectra of the uncoated (ground) aluminium and aluminium coated with the TMZ, Al2O3, and TMZ/Al2O3 coatings were recorded using a PerkinElmer Spectrum 100 (PerkinElmer Life and Analytical Sciences, Shelton, CT, USA) instrument with the attenuated total reflection (ATR) sampling accessory. The spectra were recorded from 4000 to 500 cm−1 with a resolution of 4 cm−1, averaging 4 scans. The spectra were normalised and are presented as transmittance in % from 3800 to 2800 cm−1 and 1800 to 500 cm−1, where the most intensive and characteristic bands were present.

2.3.2. Surface and Cross-Section Analysis

Field emission scanning electron microscopy (FE-SEM) was used to analyse the morphologies and microstructures of the TMZ, Al2O3, and TMZ/Al2O3 deposited on the aluminium. Coating thickness and composition were evaluated via focused ion beam/scanning electron microscopy (FEI Helios NanoLab 600 Dual beam, Waltham, MA, USA). The cross-section of selected regions on the samples was obtained after the deposition of a thin layer of platinum on the surface (first, 0.2 μm thick layer at 2 kV, 0.4 nA; second, 1 μm thick layer deposited at 30 kV, 0.24 nA), followed by cutting the coating using a Ga FIB beam at 30 kV, 9.4 nA. Ultimately, the surface was polished using a Ga beam at 30 kV, 0.4 nA. Imaging along the cross-section was performed via SEM using the secondary electron and (SE) and back-scattered electron (BSE) modes at 5 kV energy. EDS mapping analysis of the caotings’compositions was conducted using EDS Aztec software at 10 kV voltage. The mapping of EDS lasted for 1000 s.

2.3.3. Electrochemical Corrosion Testing

Corrosion performance was tested using EIS. Measurements were performed in a three-electrode corrosion cell, where 1 cm2 of the sample was exposed to the corrosive medium (0.1 M NaCl). Silver/silver chloride (Ag/AgCl 0.25 V vs. saturated hydrogen electrode) were used as reference electrodes, and a carbon rod served as a counter electrode. Measurements were performed at ambient temperature using a Multi Autolab PGSTAT M204 (Metrohm Autolab, Utrecht, The Netherlands) potentiostat/galvanostat controlled via Nova 2.1 software. Electrochemical impedance spectra were recorded between 10 mHz and 100 kHz using a frequency response analyser (FRA) module. The amplitude of the sinusoidal voltage signal was 10 mV (RMS). Impedance responses were recorded after selected periods of immersion (from 1 h up to 4 weeks). Measurements were performed at least in triplicate for each sample type (uncoated and coated). The representative ones are plotted in the Bode plots as impedance magnitude and phase angle versus frequency.

3. Results and Discussion

3.1. Preparation and Analysis of the TMZ Sol–Gel

3.1.1. Real-Time FTIR Analysis of the Sol–Gel TMZ Solution

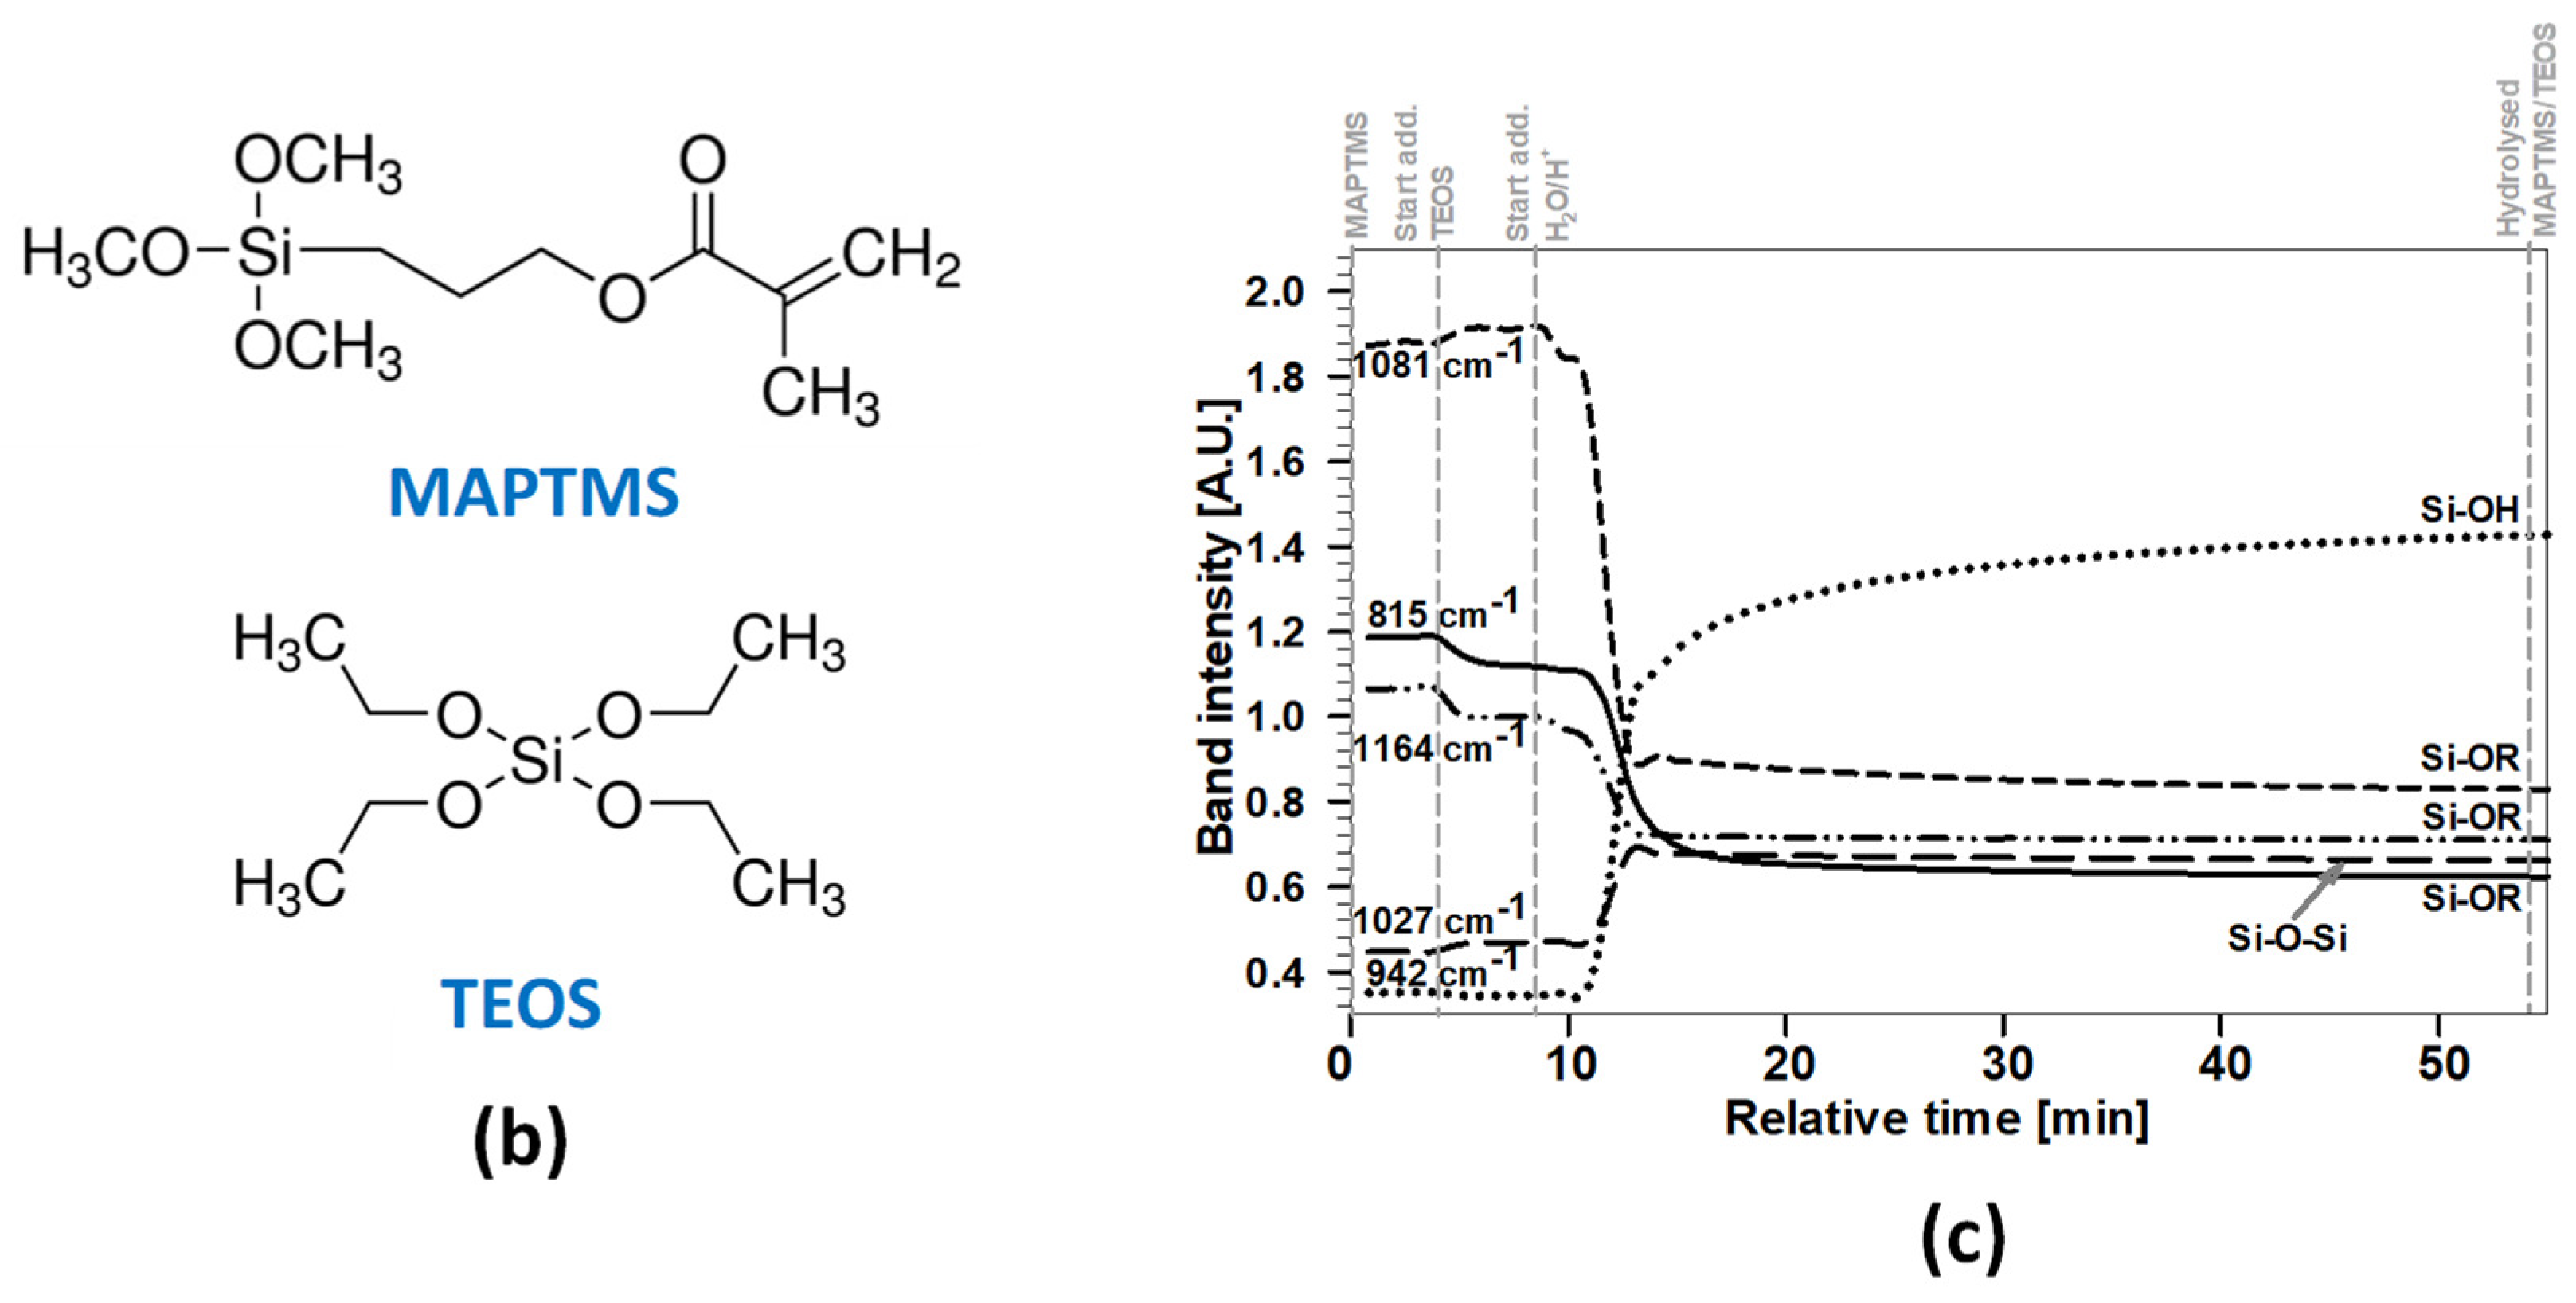
The hydrolysis and condensation reactions during the synthesis of hybrid sol–gel coatings are essential for obtaining desirable properties, such as a desirable composition, homogeneity, and density. Therefore, the synthesis process at selected steps was optimised using real-time FTIR spectroscopy. In the first step, the synthesis of Sol 1 was followed at different synthesis stages (Figure 1).
FTIR spectra from 1250 to 750 cm−1 were recorded to determine the hydrolysis of the mixture of MAPTMS and TEOS after adding acidic water (H2O/H+) (Table 2).
The mixture spectrum shows that the most intensive initial bands of both reagents were at 1164, 1081, 815, and 785 cm−1. Molecular structures are presented in Figure 1b. Reactions between the initial reagents did not occur, and the changes in the band intensities were solely due to the fact that they were combined in the reactor (Figure 1c, relative time less than 10 min). This process has been described in detail for similar systems [11,18]. The focus herein is on the kinetics of the reactions (Figure 1c). The reactions started immediately after the addition of H2O/H+, as evident due to the intensive decrease in all the characteristic bands of initial precursors (1164, 1081, and 815 cm−1) and the appearance of an intensive broad Si–O–Si band at 1027 cm−1. The latter is related to asymmetric stretching; another Si–O–Si band was also noticed at 1084 cm−1 (Figure 1a,b). The hydrolysis and condensation reactions were accompanied by by-products such as ethanol (a bond at 882 cm−1) and the formation of a Si–O band at 914 cm−1 and Si–OH at 942 cm−1.
The reactions were most predominant after the first 10 min after the addition of H2O/H. At longer times, the changes were smaller (Figure 1c). In the next 30 min, the intensities of the Si–OR and Si–O–Si bands changed slowly, but the Si–OH band gradually increased even after 45 min of mixing. This is due to the instability of Sol 1, with many Si–OH groups available for further condensation. However, a band at 1164 cm−1 representing the methoxy silane (Si–O–Me) in the MAPTMS molecule remained in the spectra, confirming that all groups did not react. This is probably related to the low ratio between the three methoxy groups in MAPTMS and H2O/H+. The unreacted groups can be further hydrolysed/condensed after combining with Sol 2.
The MAPTMS precursor also contains an acrylate group (Figure 1b). Due to the absence of a polymerisation initiator, the reaction of acrylate groups did not occur at this preparation stage at ambient temperature [11,16].
In the second step, the characterisation of Sol 2 was related to reducing the high reactivity of ZTP with water and its chelation with MAA (Figure 2).
The molecular structures of the reagents are presented in Figure 2b. ZTP shows six characteristic absorbance bands at 1130, 1044, 1003, 890, and 834 cm−1, and the two other characteristic bands located between 1376 and 1459 cm−1 are related to the stretching vibrations of the aliphatic C–H groups in the ZTP molecule (Figure 2a) (Table 2). Bands related to the chelating product (1-propanol) also appeared between 970 and 1100 cm−1 and can partially contribute to the ZTP bands in this range. The MAA can be characterised by the bands at 1691 cm−1 (C=O), 1634 cm−1 (C=C), 1455 and 1428 cm−1 (CH3 and CH2), 1298 and 1203 cm−1 (C–O stretching in acid), 945 cm−1 (COO), and 810 cm−1 (C=C).
After the dropwise addition of MAA to ZTP, the FTIR spectra provided clear evidence of the formation of a zirconium complex with an organic ligand (MAA) (Figure 2c). This process can be described by reaction (1):
Zr(OCH2CH2CH3)4 + CH2=CCH3COOH
→ Zr(OCH2CH2CH3)3OOCCH3C=CH2 + CH3CH2CH2OH
The spectrum of chelated ZTP/MAA (Sol 2) spectra combine the spectral characteristics of both substances, ZTP and MAA, and show two additional bands characteristic of chelating at 1555 and 834 cm−1. The bands characteristic for ZTP remained visible. Except for the bands in the CH3 range, all bands characteristic of MAA were almost absent in the spectrum for Sol 2, showing a small amount of free MAA during chelation.
In the next 40 min of mixing, the most characteristic bands did not change significantly (Figure 2c). The only exception was the band at 1555 cm−1 (related to the chelating process of ZTP/MAA), which confirmed that Sol 2 was incompletely stabilised. Therefore, the ZTP remained active for further reactions.
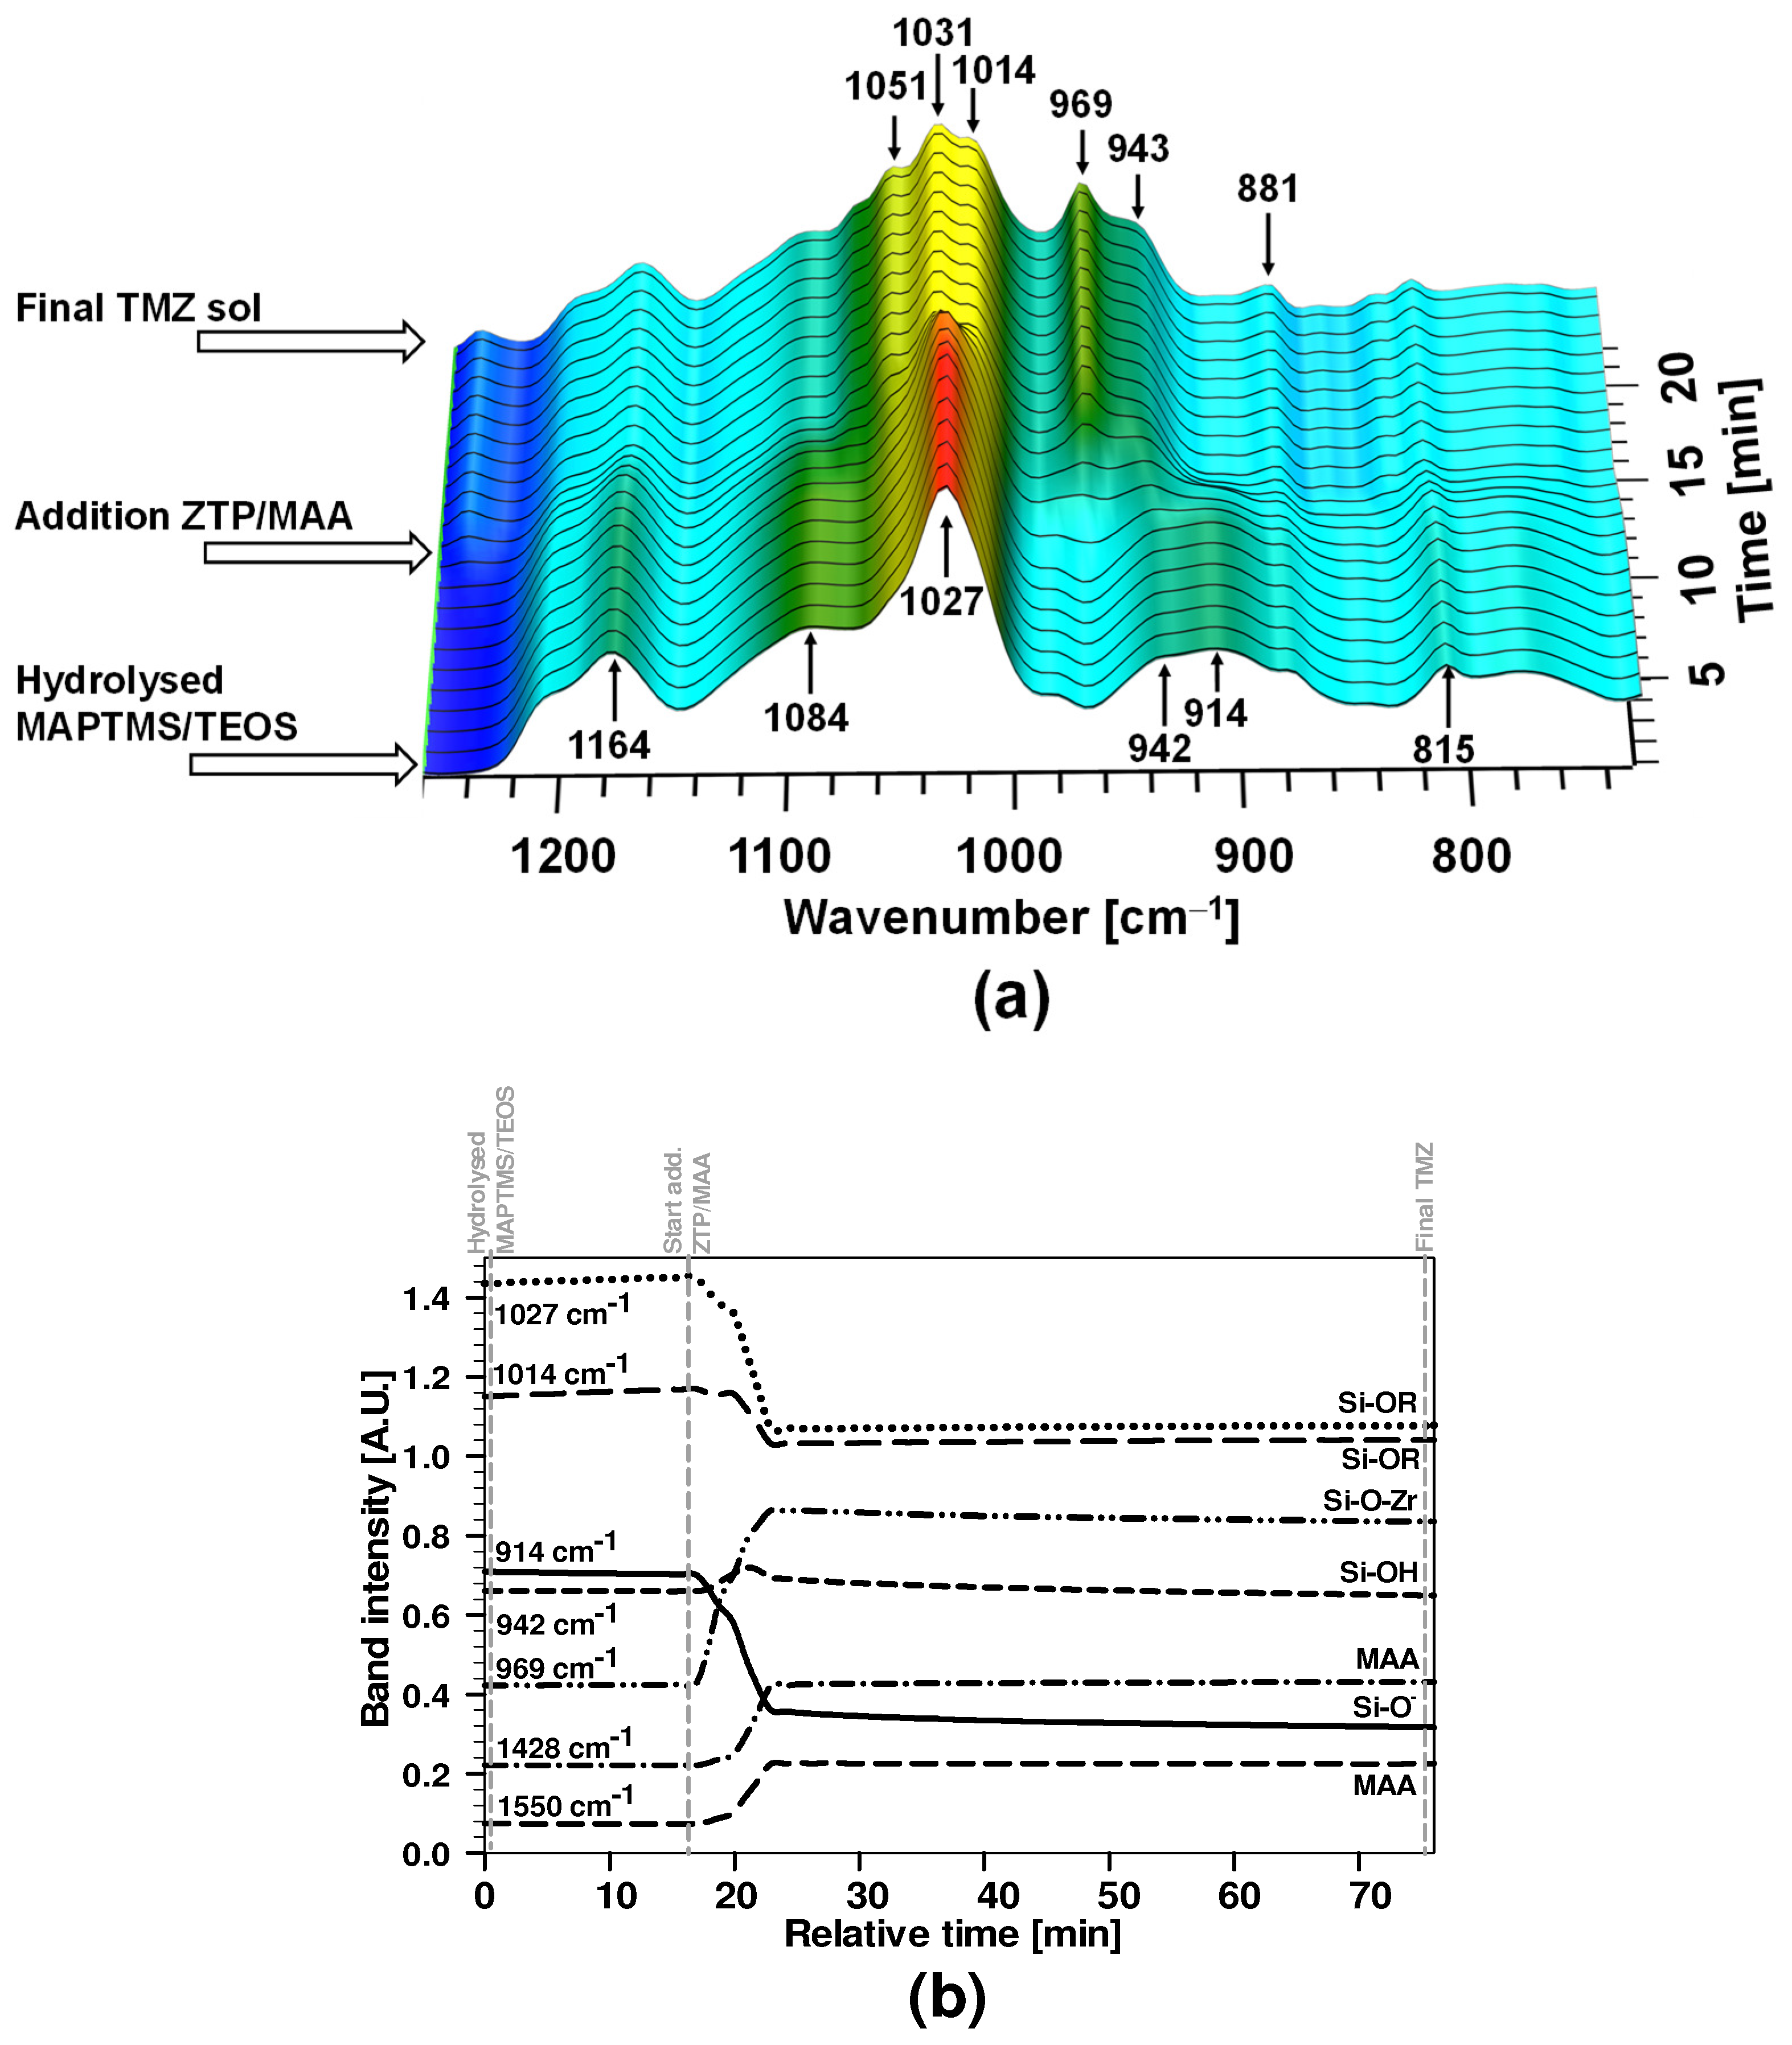
In the last step, Sol 2 was added to Sol 1 to form the final sol TMZ (Figure 3).
The marked decrease in the characteristic bands between 650 and 940 cm−1 for Sol 1 occurred due to dilution after adding Sol 2. The reactions between the sols took place in the first 5 min (Figure 3b). The decrease in the Si–OH groups at 942 cm−1 and non-reacted Si–O (ion) at 914 cm−1 indicate the induction of condensation and the formation of more complex networks (Si–O–Zr) after the addition of ZTP/MAA to the hydrolysed sol. The decrease in the band at 942 cm−1 is less significant due to the overlapping with the formed product of Si–O–Zr at 943 and 969 cm−1; the condensation can be better seen via the Si–O–Zr bands at 1014 and 1031 cm−1. The presence of these bands confirms a co-hybrid system between the two precursors. The intensive band at 1027 cm−1 corresponds to the linear Si–O–Si groups, whilst that at 1031 cm−1 is related to cyclic, more condensed groups (Figure 3b). The intensive bands for non-hydrolysed Si–O–R at 1084 and 1164 cm−1 were also reduced.
The characteristic C–H band related to 1-propanol (formed as a by-product) is at 881 cm−1. The slow release of MAA during condensation was identified via the increase in the characteristic bands at 1428 and 1550 cm−1, corresponding to vibrations of the carboxylic group (COO) (Figure 3b). During the coating thermal curing process, the released MAA can later participate in co-polymerisation with MAPTMS.
Hydrolysis–condensation reactions proceeded continuously for 1 h of mixing (Figure 3b). The main effect was on the siloxane bands due to the formation of more complex networks with linear or cyclic chains. The characteristic bands of the remaining non-reacted species are located between 914 and 942 cm−1; their intensity decreased during mixing due to the formation of a more condensed solution.
To sum up, the hydrolyses and condensation reactions formed Si–O–Si and Si–O–Zr networks. The reactions proceeded faster at the beginning, but after optimised times, the sols were partially stabilised to obtain a good incorporation of Zr and the formation of the solution network.

3.1.2. FTIR Analysis of the Sol–Gel TMZ Coating

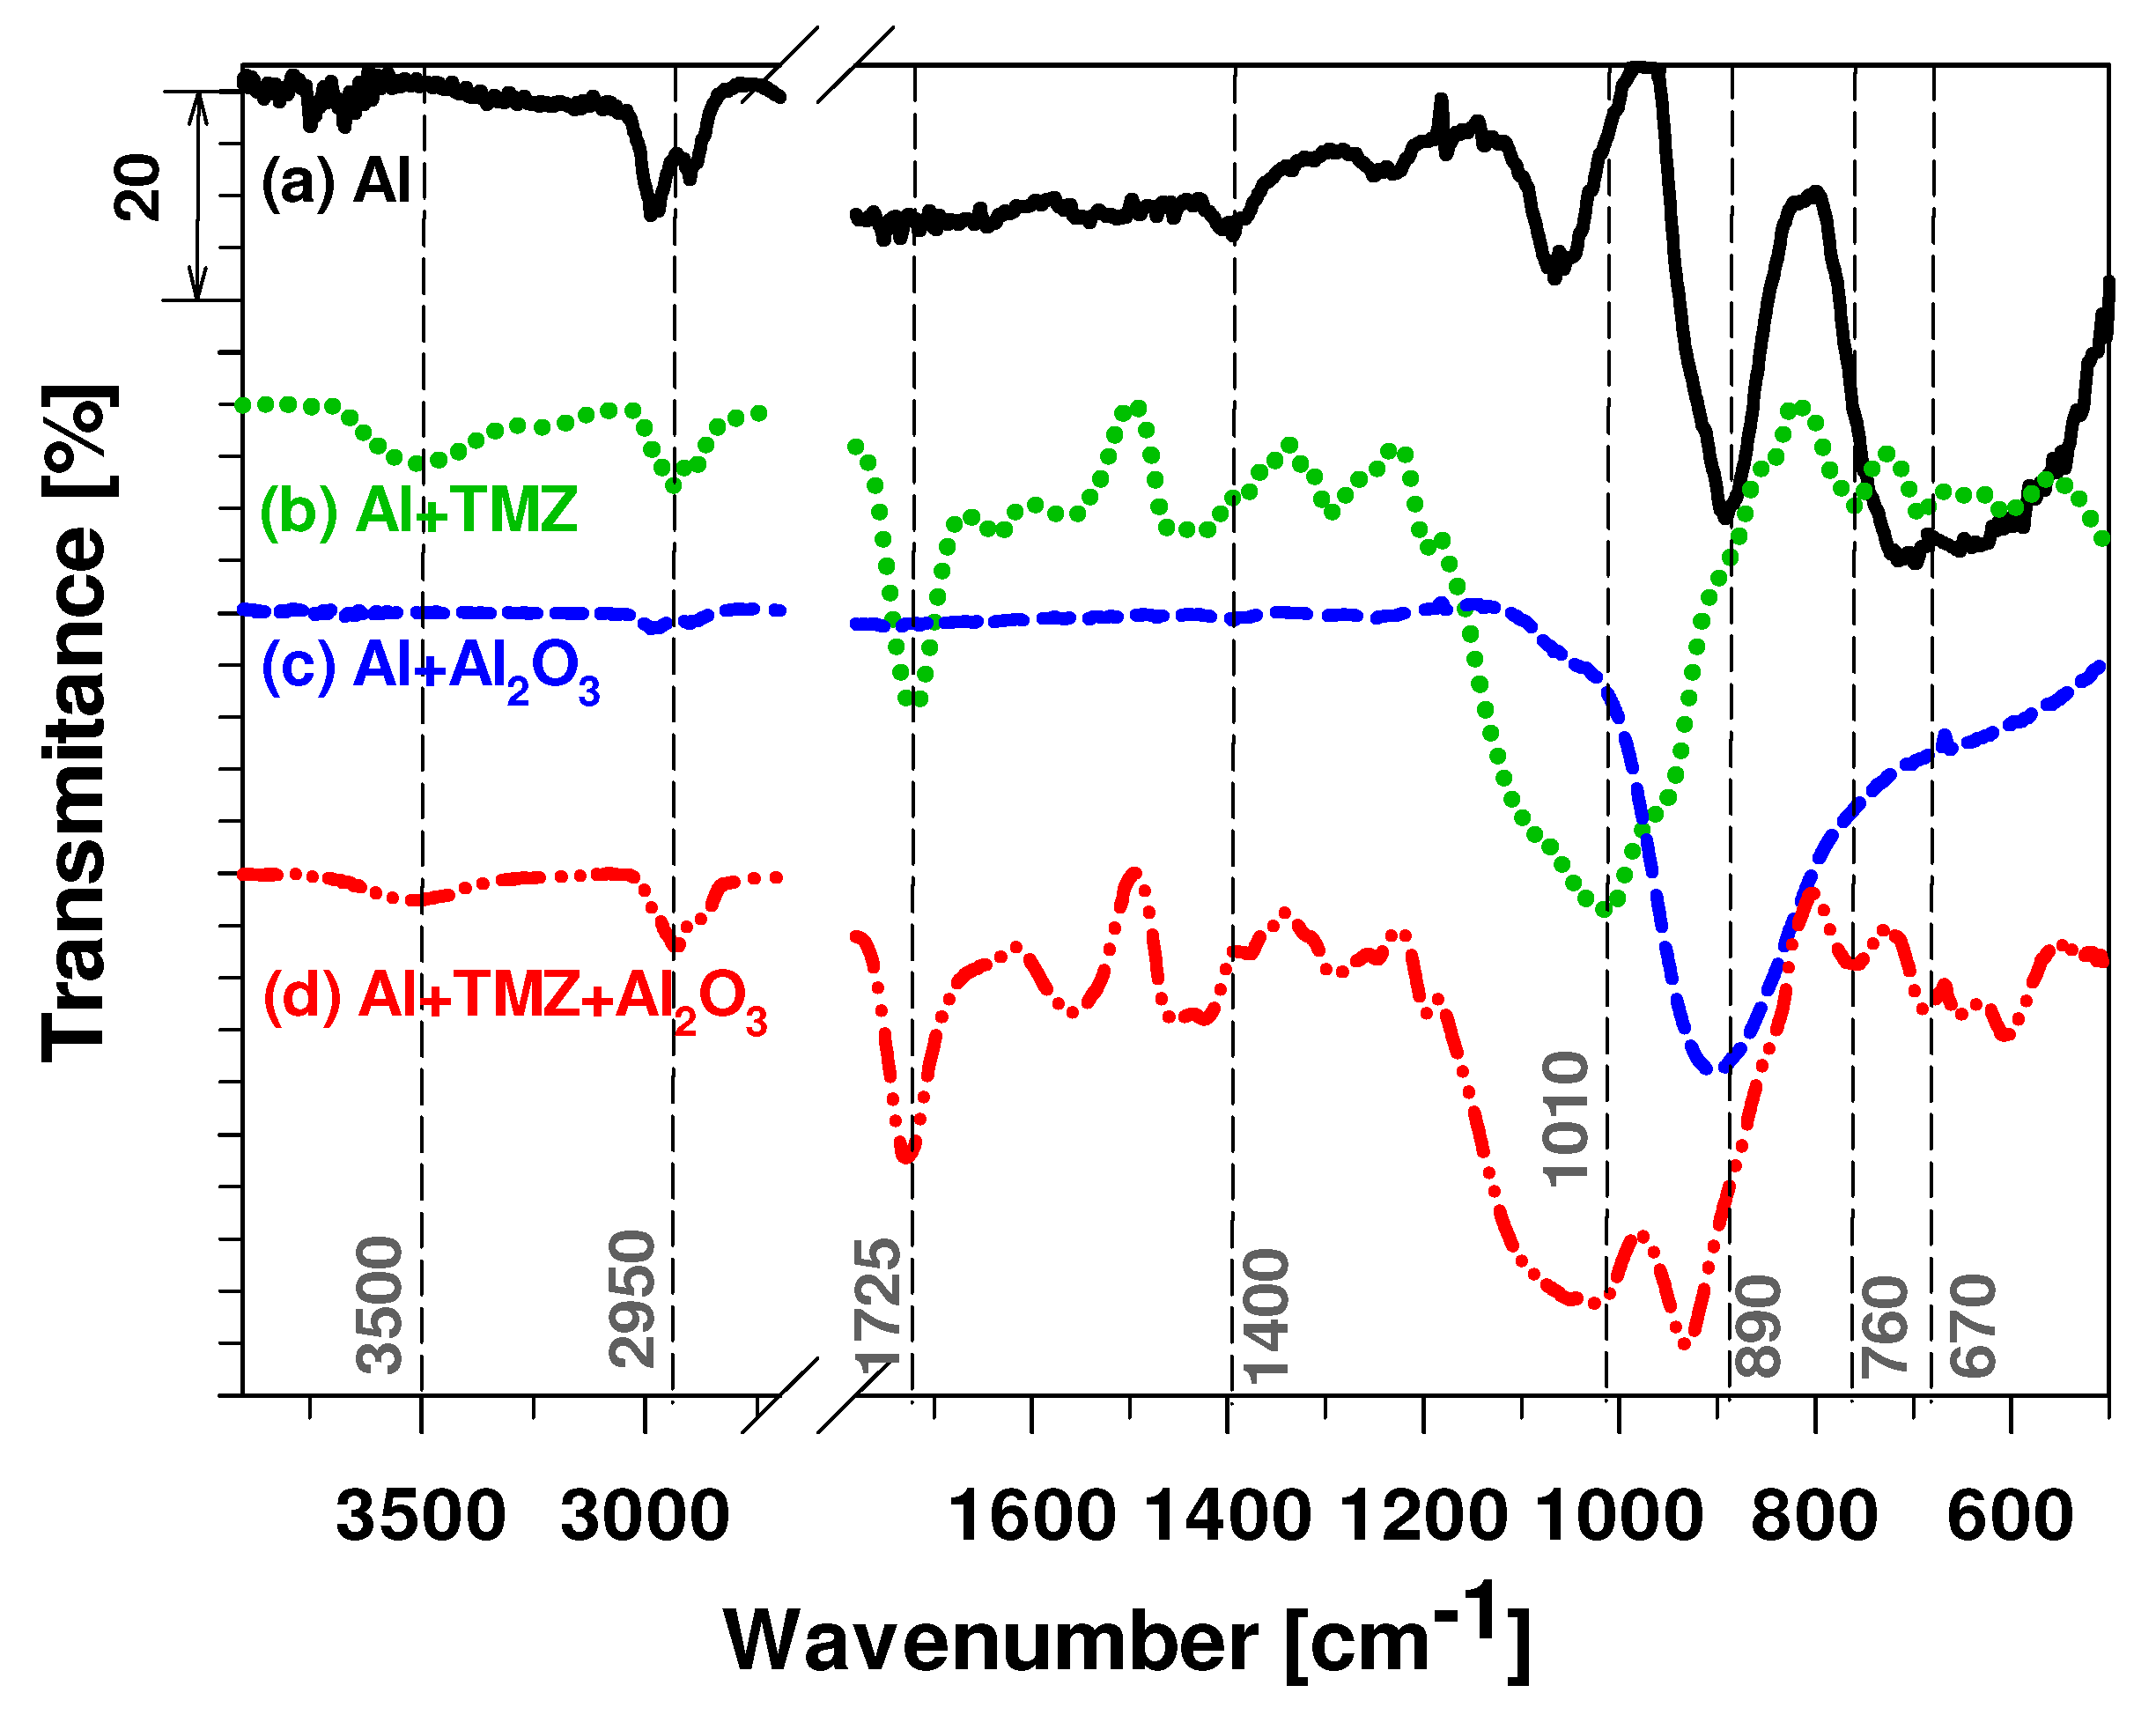
Sol TMZ was deposited on the ground Al surface as a coating. Several main differences between the real-time FTIR spectrum of the TMZ sol (Figure 3) and the ATR FTIR spectrum of TMZ coating (Figure 4) were observed in the region between 1250 and 700 cm−1. These differences resulted from the network formed between silicon, zirconium, and oxygen (Si–O–Si and Si–O–Zr). The decrease in the bands characteristic of the initial precursors between 750 and 850 cm−1 indicates that hydrolysis and condensation reactions finally occurred during the curing process. As a result, several characteristic siloxane (Si–O–Si) and siloxane-Zr (Si–O–Zr) bands appeared between 1200 and 900 cm−1, with the maximum appearing at 1010 cm−1.
Additionally, the co-polymerisation process of acrylate groups in the MAPTMS and MAA was thermally induced during curing at 160 °C (Figure 4).
The low intensity of the C=C bands at 1640 cm−1 and slightly shifted carbonyl group C=O (from 1720 cm−1 to 1725 cm−1) indicate that co-polymerisation occurred, as evidenced by the band at 1640 cm−1, which is related to the C=C bond. The co-polymerisation remained incomplete due to the absence of a co-polymerisation initiator. The polymerisation degree is difficult to evaluate due to the overlapping of the C=C band with a band characteristic of water (1638 cm−1). In addition, the broad absorption band, extending from 3000 cm−1 to 3800 cm−1, is the sum of the band at wavenumber generated by the stretching vibration of the O–H groups belonging to the external silanols (Si–OH) at 3610 cm−1 and water molecules adsorbed in solution (free water is at ca. 3600 cm−1) (Figure 4).

3.2. Preparation and Analysis of the ALD Al2O3 Film

The growth mechanism of ALD Al2O3 films fabricated using trimethylaluminium (TMA; Al(CH3)) and H2O vapour has been studied extensively [39,48,57]. The ALD process is well controlled and self-limiting, and it occurs on the exposed surface. During deposition, precursors are separately present in the chamber (Figure 5a).
The first ALD reaction cycle reaction occurs on the aluminium surface. After one cycle, it is adsorbent only on ALD-grown film [23]. The reagent completely covers the metal surface regardless of the shape, and during one cycle, deposition occurs half a monolayer at a time.
The water vapour is introduced into the chamber, leading to hydroxyl groups forming bonds with the metal surface. Excess water is then purged from the chamber. The purge is followed by introducing TMA, which reacts with the adsorbed hydroxyl groups. The metal atom bonds react with oxygen. Meanwhile, the hydrogen atom leaves the surface as a reaction by-product in methane, which is evacuated from the chamber. TMA continuously reacts with the remaining hydroxyl group but does not react with itself. Thus, the growth is terminated after one layer. The remaining precursor TMA is then evacuated from the chamber and purged with nitrogen. The cycle is repeated until the desired thickness is achieved. Another critical parameter is the water dose, which should be optimised because increasing the water dose could enhance the growth rate [58]. However, the amount of water has a low influence on the composition and electrical or optical properties [58].
Formed aluminium oxide is a chemically stable amphoteric compound, but its stability is reduced in acid or base solutions. The solubility is higher if the film is formed at lower temperatures [42].
The mechanism of film formation can be described by reactions (2) and (3):
Al–OH + Al(CH3)3 → Al–O–Al(CH3)2 + CH4
Al–CH3 + H2O → Al–OH + CH4
In the reaction processes, the surface –OH is a crucial reactive group that determines the successive self-limiting reactions. Higher temperatures can reduce the number of reactive surface sites and the type of chemisorbed species [23].

FTIR Analysis of the Ground Al and Al Coated with the Al2O3 ALD Film

FTIR spectra of ground Al covered by a naturally formed oxide (passive) film and Al2O3-coated Al are presented in Figure 4. The naturally formed passive film on the Al is a mixture of aluminium oxide (Al2O3) and hydroxide (Al(OH)3, AlO(OH)) [59]. The band at ~1060 cm−1 is characteristic of the Al–O vibration mode in alumina. The band at 890 cm−1 is assigned to the bending vibrations of the Al–O bond. The Al–O–Al bond in the γ-alumina generates the broad band centred at 710 cm−1 [60]. The bands between 2900 and 3000 cm−1 and at 1400 cm−1 are characteristic of CH groups. They are present due to organic contamination during surface preparation (grinding the surface). The critical information that can be derived from these FTIR spectra is the presence of hydroxide groups on the aluminium surface, evidenced by an intensive band at 910 cm−1. As explained in the text above, –OH groups help form strong covalent bonds with the substrate.
The differences in the FTIR spectra of natural passivated and thermally deposited ALD Al2O3 films are compared in Figure 4. For the former, the broad absorption band in the range of 750–1100 cm−1 was attributed to the mixed contributions of the Al–O bending and stretching modes. The absorption peak at 905 cm−1 represents O–Al–O bending. Compared to the naturally passivated surface, the FTIR spectrum of the ALD film exhibits a relatively small band intensity of the C–H bending modes. The absorption band at 1385 cm−1 usually reflected the remaining formate species’ OCOH bending [57,61], but due to the efficient reaction, this band was not present in the FTIR spectra. Some other relatively very small bands for the C–H bending mode of the H2O-based Al2O3 film were observed, such as the absorption band attributable to carbon species, including C–H stretching vibrations, at 2850–3050 cm−1, but its intensity was much lower compared to the ground surface (Figure 4). During the ALD process at 160 °C, the carbon species of the TMA are not entirely removed from the surface, and their presence in the H2O-based Al2O3 film hinders the self-limiting reaction of the ALD process. In addition, the absence of a broad band between 3200 and 3700 cm−1, the band at 1638 cm−1, and the band at 1470 cm−1 in the ALD/Al2O3 FTIR spectrum confirmed that applying the controlled pulse and purge process during thermal ALD deposition allowed for the formation of the film without any physisorbed water.

3.3. Preparation and Analysis of the Multilayer TMZ/Al2O3

The multilayer Si–O–Zr hybrid sol–gel/Al2O3 (abbreviation TMZ/Al2O3) was prepared by applying one layer of TMZ coating, followed by the deposition of 100 nm ALD. This multilayer thus consists of a thick sol–gel TMZ coating sealed by a thin ALD film.
The corresponding FTIR spectrum confirmed the presence of the ALD Al2O3 film on the TMZ coating (Figure 4) since it shows a characteristic band of Al–O–Al at 920 cm−1. The spectrum also contained several bands related to TMZ coating (Si–O–Si and Si–O–Zr bands), which can be detected below that of the thin ALD Al2O3 film. The main difference is the reduced intensity of the band related to hydroxy groups at ~3500 cm−1, confirming the reaction between non-hydrolysed –OH groups on the TMZ surface with the ALD film according to reaction (4).
Si/Zr–OH* + Al(CH3)3 → Si/Zr–O–Al(CH3)2* + CH4
The asterisks mark the surface species during film deposition. Therefore, the FTIR spectrum confirmed that the deposited ALD Al2O3 film reacted with the hydroxyl groups on the TMZ coating surface, forming a more condensed coating. Further, the spectrum of the multilayer system is comparable to that of the TMZ coating, indicating similar polymerisation degrees and Si–O–Zr network formation (band at 1640 cm−1).

3.3.1. Surface and Cross-Section Analysis

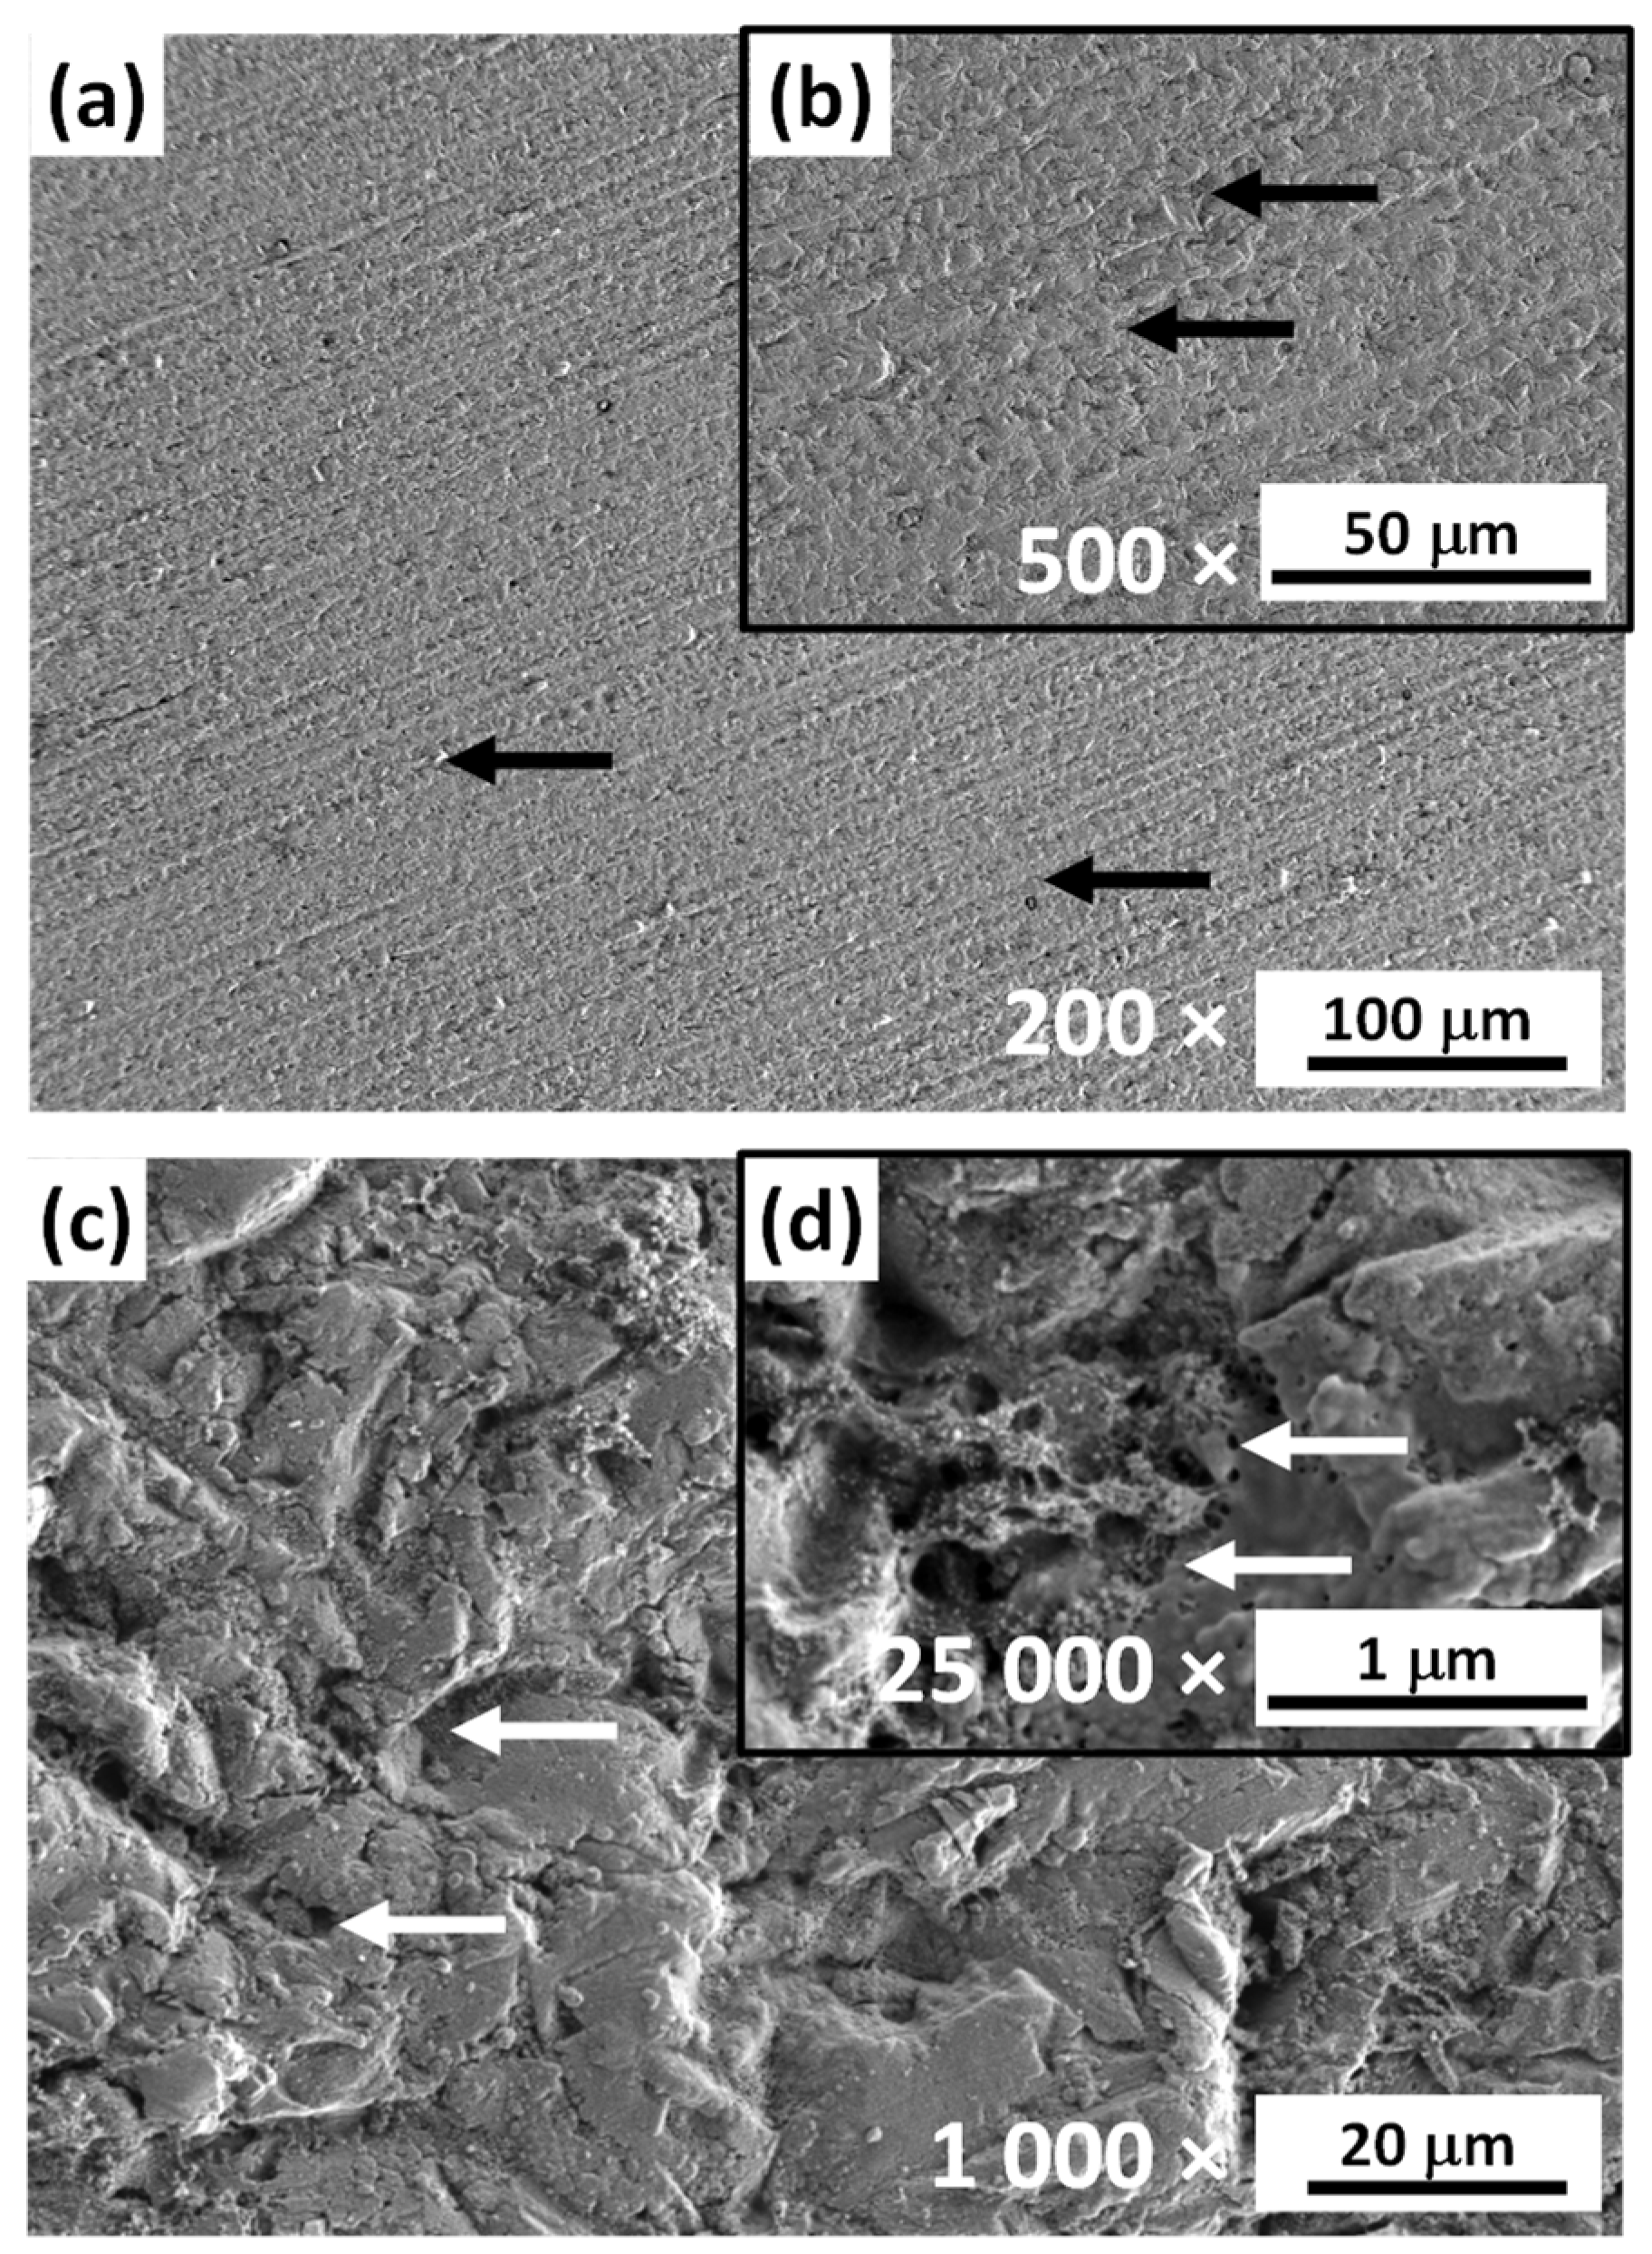
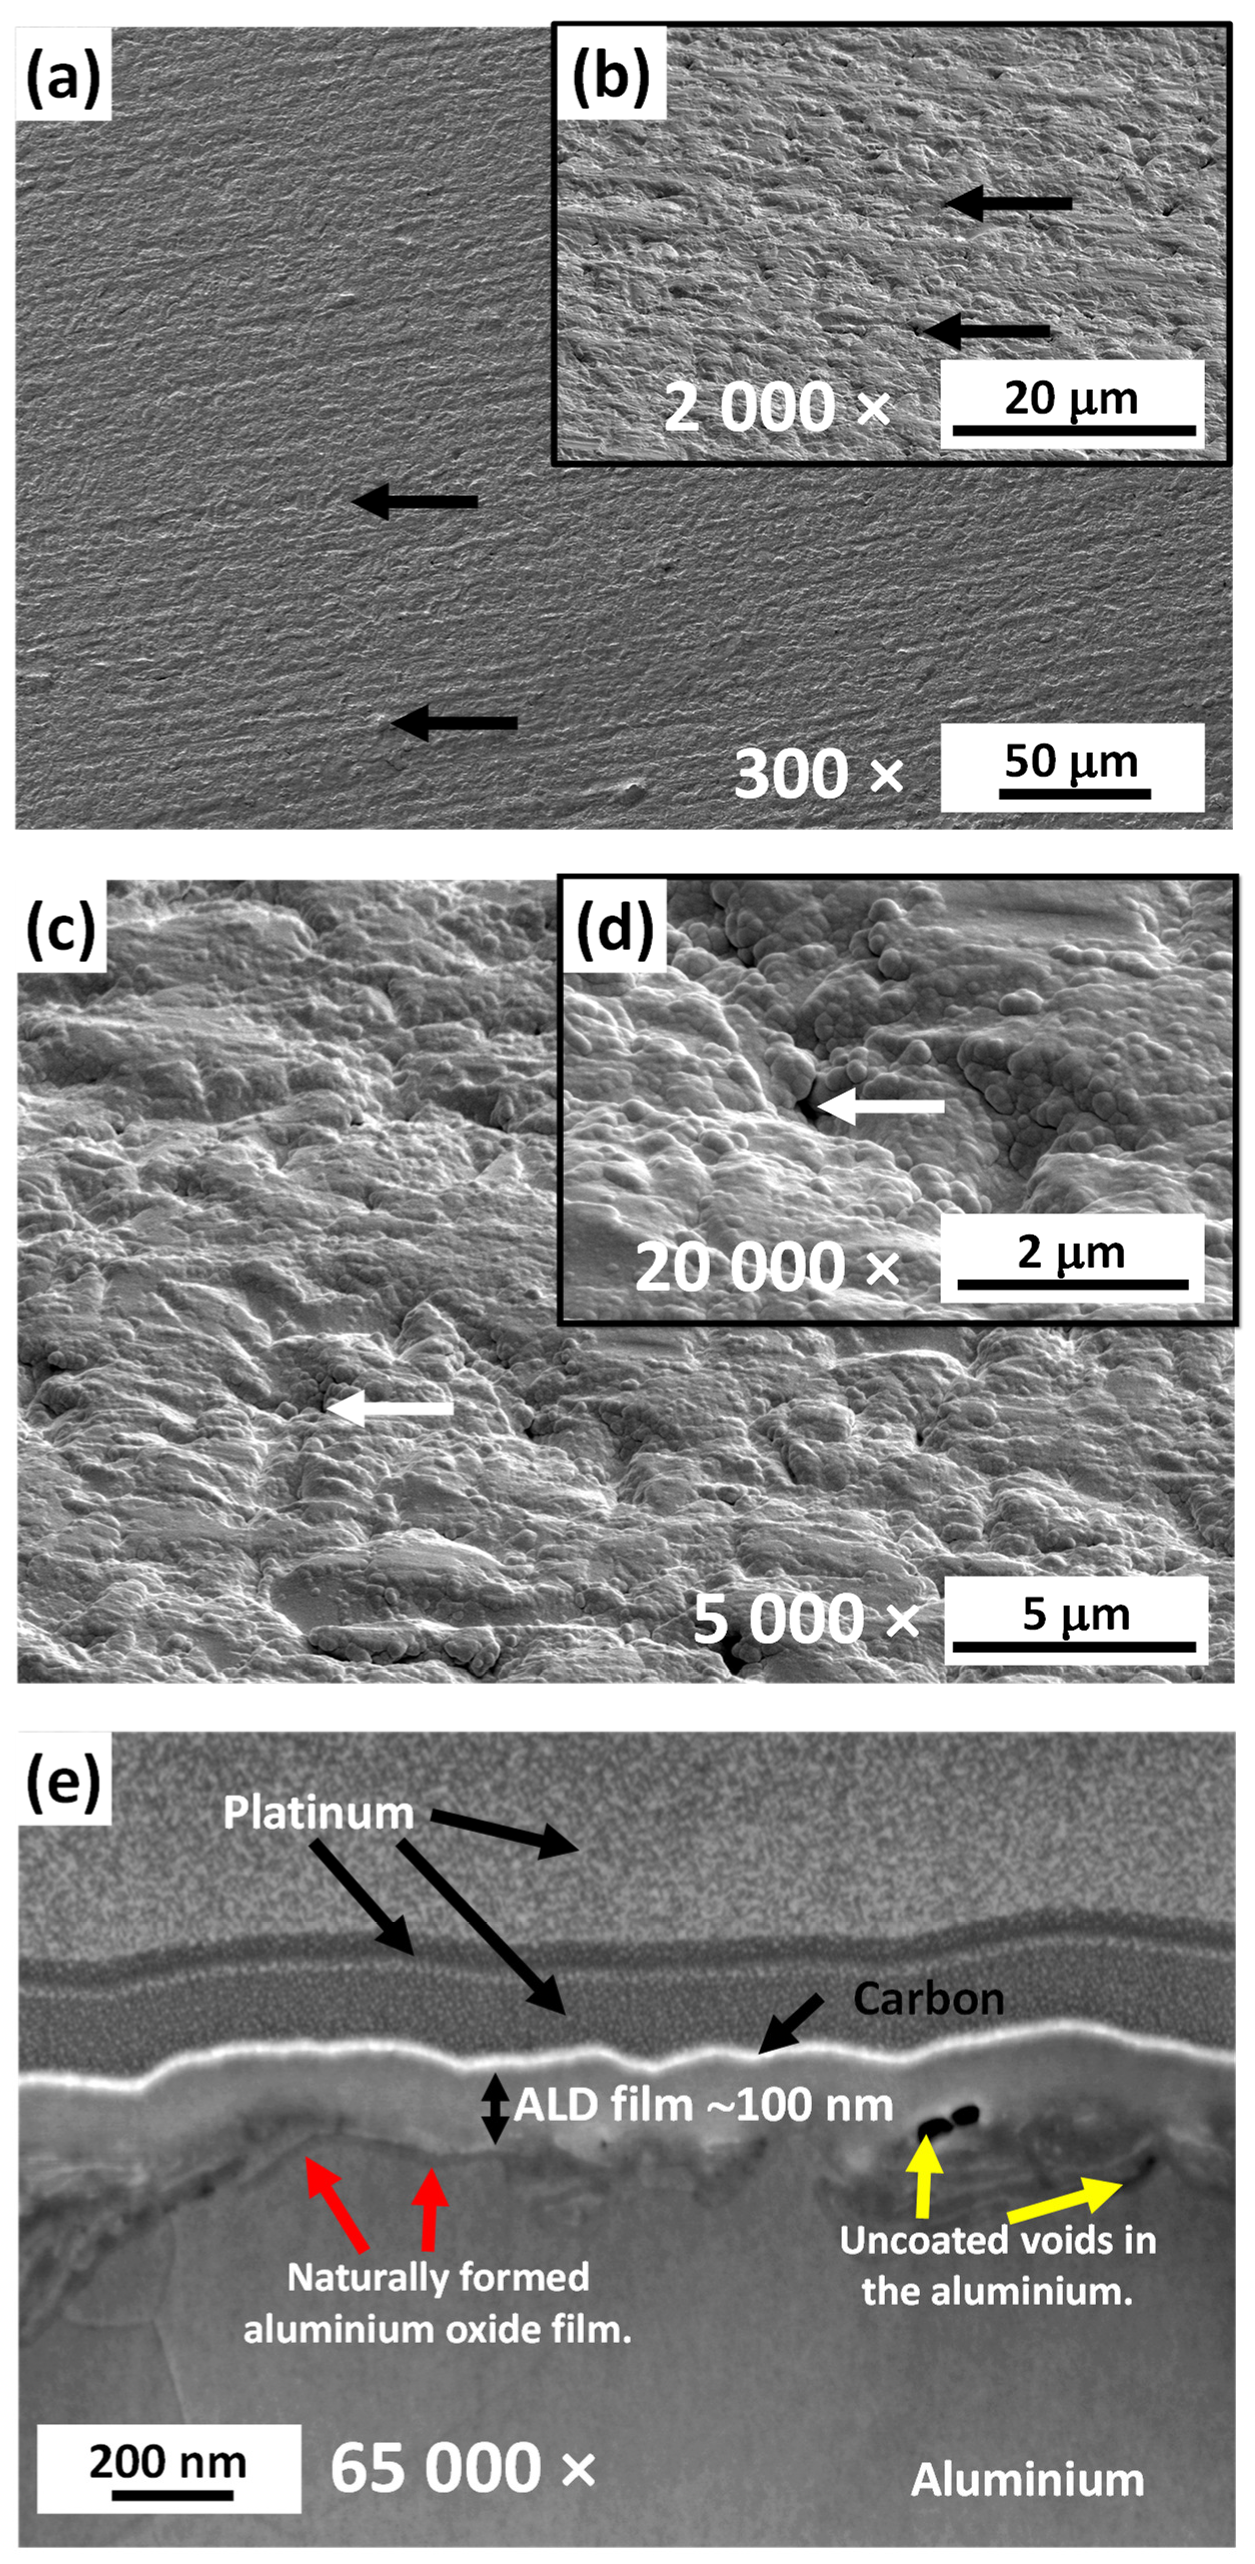
SEM/EDS analysis results are shown for uncoated (ground) aluminium and aluminium coated with TMZ, Al2O3, and TMZ/Al2O3 in Figure 6, Figure 7, Figure 8, Figure 9 and Figure 10. Since Al is a relatively soft metal (the Rockwell hardness of pure aluminium is typically in the range of B20 to B30), grinding affects its surface texture. The top-view SEM image of the ground Al (Figure 6a,b) shows an uneven surface with many irregularities and grinding residuals in the direction of the grinding (marked with black arrows), resulting in a complex and rough surface texture.
At higher SEM magnification (Figure 6c,d), many small, nanometre-sized voids (marked with white arrows) can be noticed. These represent weak points for surface passivation and, consequently, for initiating corrosion.
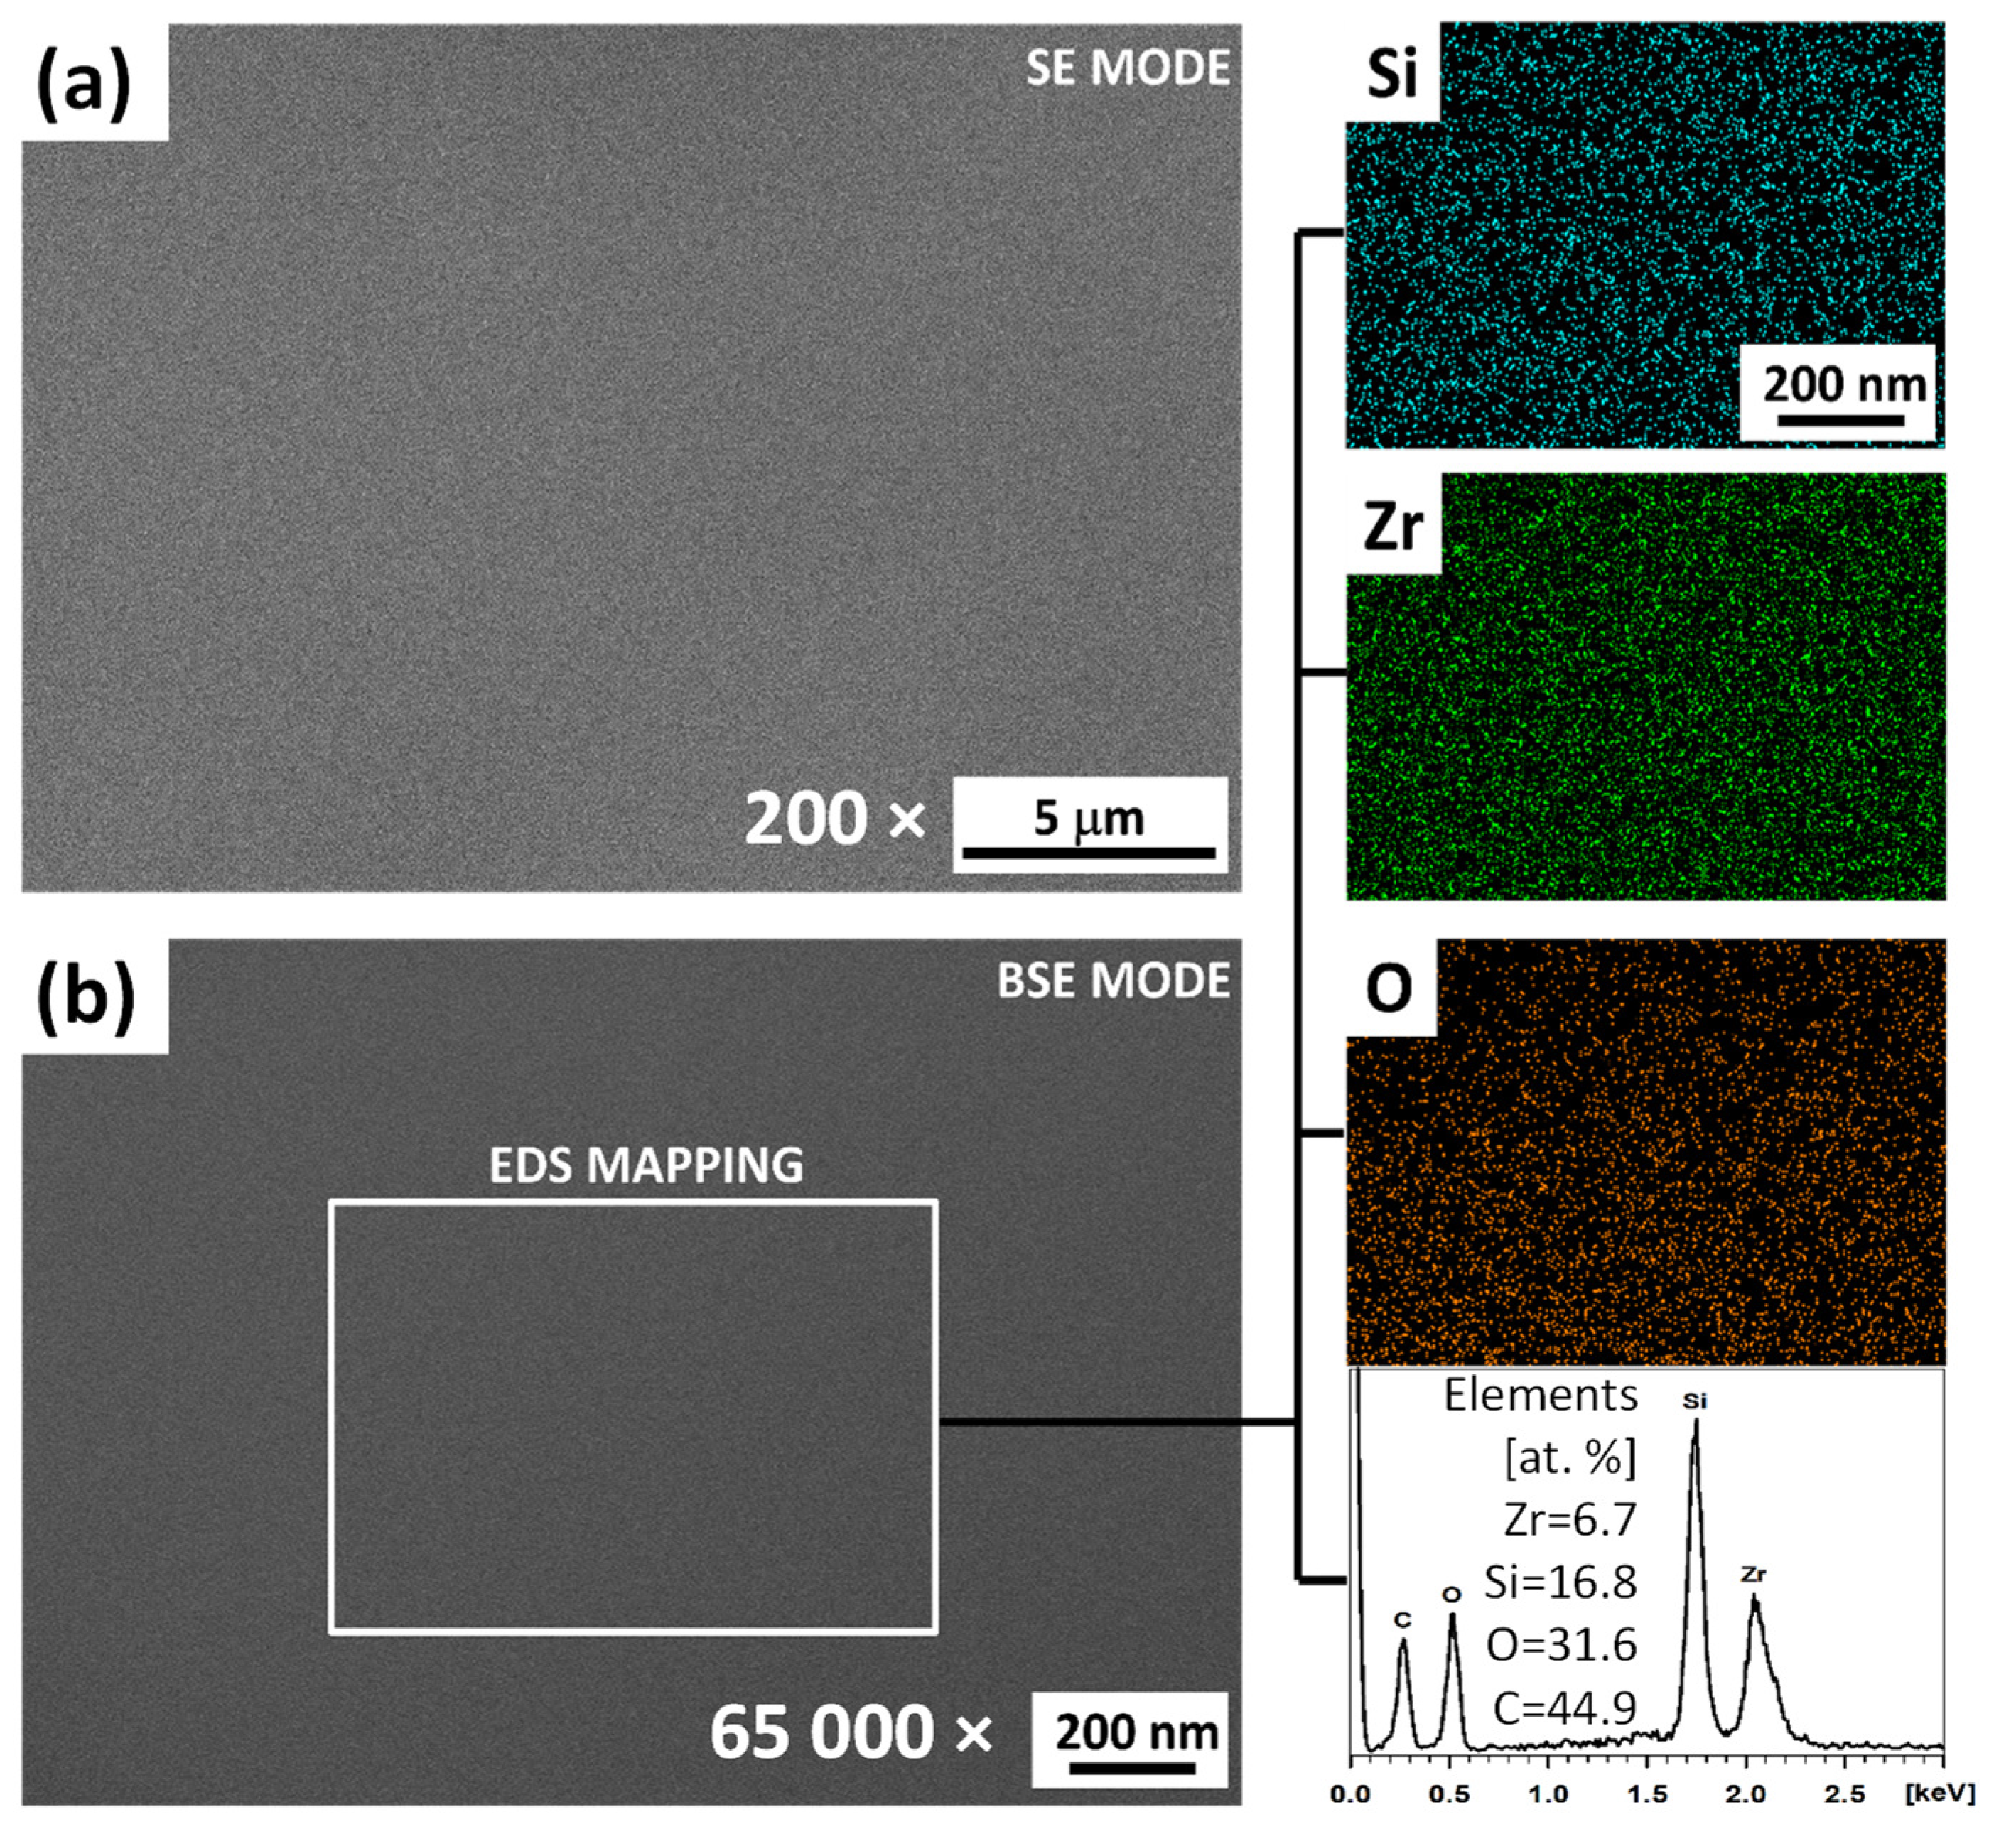
The aluminium surface coated with the TMZ coating is characterised by the top-view SEM image in Figure 7a.
The coating was uniform and smooth without any micro-cracks or visible defects. Its composition was homogenous, even at high magnifications (see BSE SEM image Figure 7b). EDS mapping was performed at the area marked in Figure 7b. Si and Zr are evenly distributed in the formed coating. The atomic ratio between Zr and Si is 1:2.5, which agrees with the starting composition of the sol (Zr/Si = 0.41). Such an evenly formed structure is related to well-optimised synthesis conditions to achieve efficient degrees of condensation between the initial Si and Zr precursors and co-polymerisation between the acrylate group in MAPTMS and MAA forming dense coating [18,20].
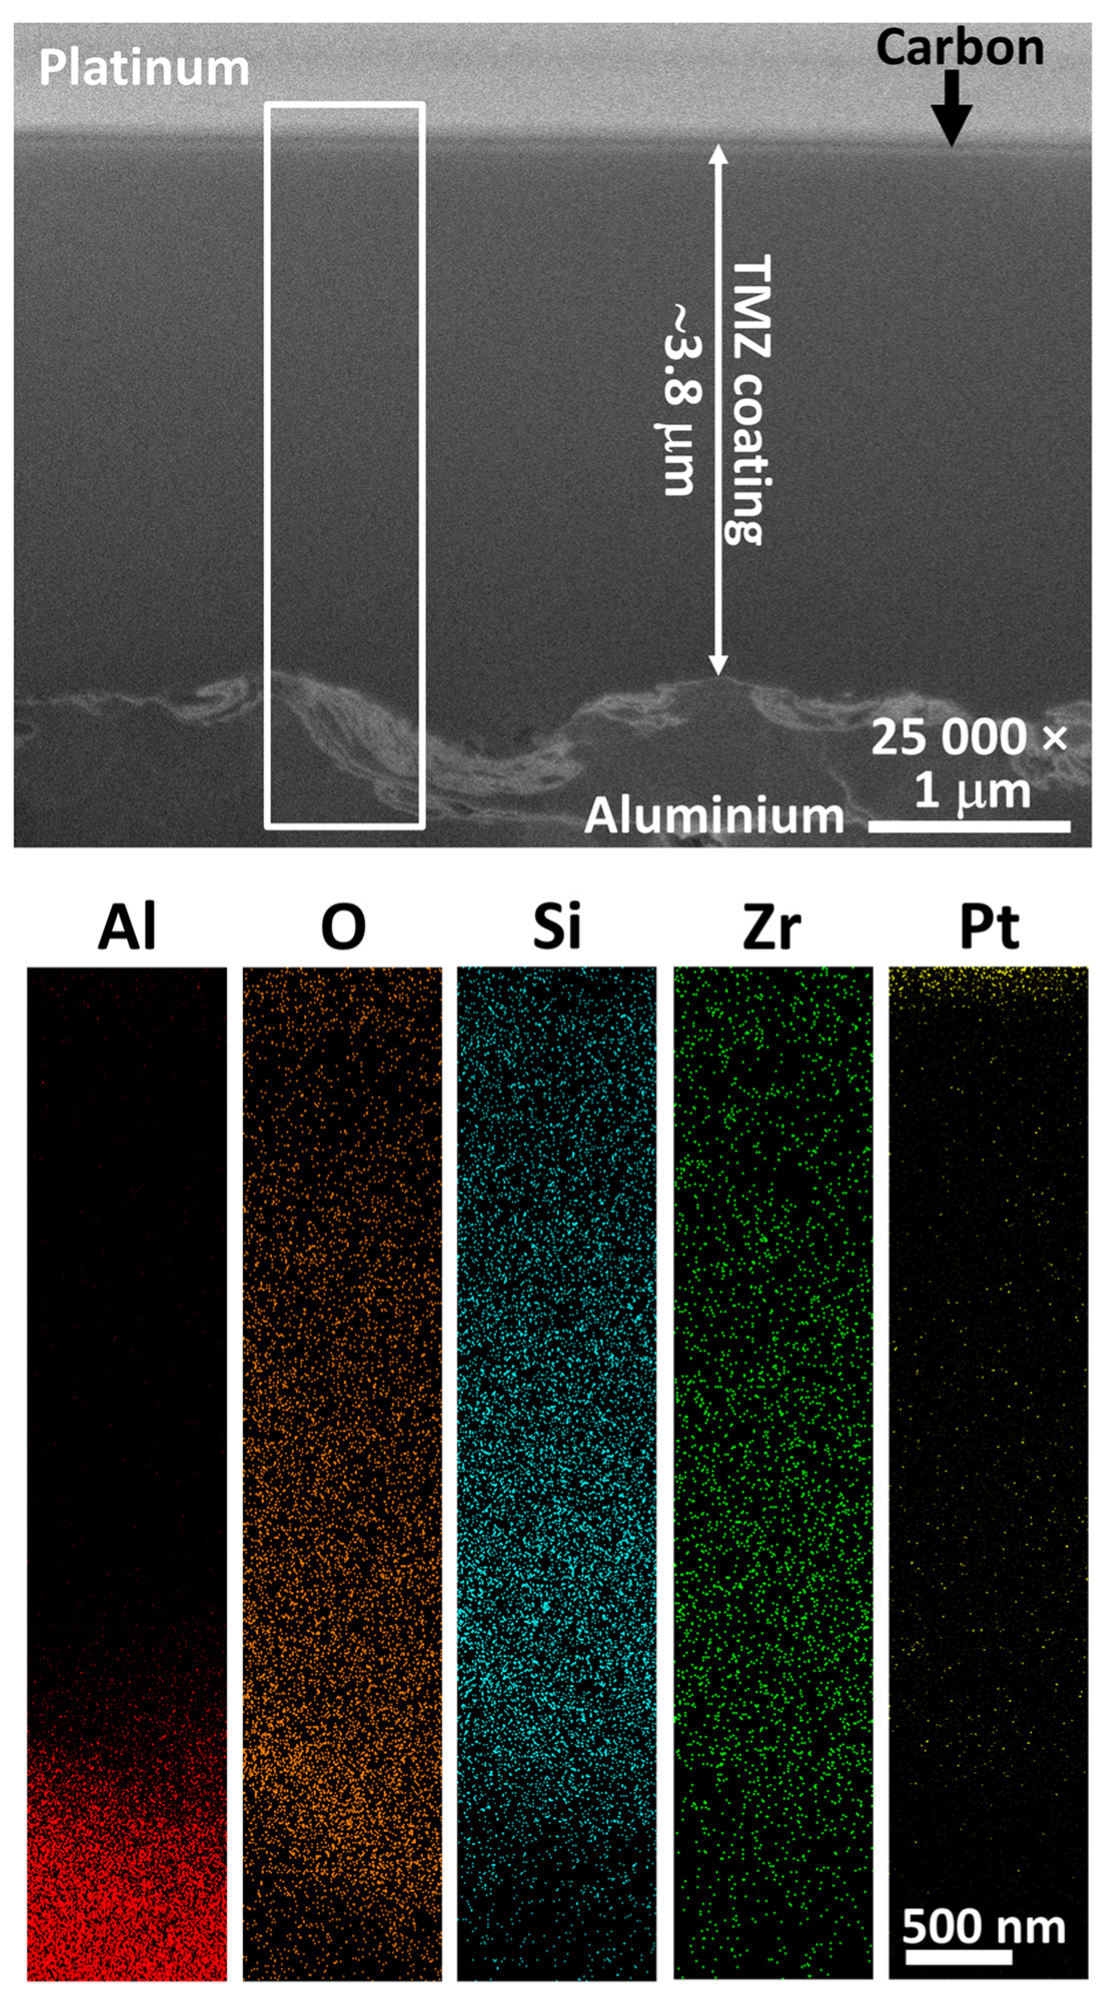
The coating composition along the cross-section was characterised via FIB/SEM/EDS (Figure 8). The compact coating structure without any visible defects along the performed cross-section was confirmed. Based on previous research, these types of coatings are slightly porous, but this porosity cannot be observed using SEM. In previous publications, the determined porosity for similar coatings using photothermal beam deflection spectroscopy or electrochemical measurements was between 0.85 and 0.49% [20]. The coating covered the aluminium surface entirely despite its rough surface. The coating thickness estimated based on FIB-SEM imaging was ~3.8 μm (Figure 8).
The coating appearance resembles other TMZ coatings with different TEOS/MAPTMS and ZTP ratios [18]. Still, the slightly greater thickness of the TMZ coating is probably related to the higher condensation degree between ZTP and TEOS/MAPTMS. In addition, the MAA remained unreacted during the incomplete chelation of ZTP in Sol 2 (Figure 2) and can further co-polymerise with MAPTMS. The homogeneity of the coating was also confirmed with EDS mapping analysis on the marked rectangle in Figure 8, where the efficient incorporation of Zr in the Si–O–Si sol–gel structure is evidenced.
Top-view and cross-section SEM images of the ALD Al2O3-coated Al are presented in Figure 9.
Despite the ALD film having a small thickness of only 100 nm, there was a difference in the macroscopic observations of the alumina (Figure 9a) compared to the ground aluminium (Figure 6a). The number of irregularities and voids observed on the ground Al was significantly reduced after the deposition of the ALD film (Figure 6c,d). The surface was more uniform, containing less visible lines from the grinding process (Figure 6a,b and Figure 9a,b). The deposited Al2O3 film perfectly covers the surface and decreases the surface roughness. From the top-view imaging, it is impossible to distinguish the naturally formed Al2O3 and the ALD Al2O3 film (Figure 6d and Figure 9d). This was obtained using a FIB-SEM cross-section (Figure 9e). The ALD Al2O3 film is much thicker (~100 nm), more compact, and more homogeneous compared to a naturally formed layer. The ALD film also covers the irregularities in the Al structure and the other defects marked with white arrows.
Top-view SEM images of the aluminium coated with a multilayer (TMZ/Al2O3) system is presented in Figure 10.
Due to the low thickness of the ALD film (100 nm thin Al2O3), there were no significant differences observed between the TMZ and TMZ/Al2O3 coatings’ surface appearances (Figure 7 and Figure 10a,b). The ALD film was better distinguished in the cross-section FIB-SEM imaging and analyses where the in-depth chemical composition was obtained (Figure 10c,d). EDS maps of aluminium, oxygen, silicon zirconium, and platinum are presented in Figure 10d. Please note that the upper part of the cross-section is related to the carbon and platinum layers deposited during the FIB procedure. The multilayer composition is divided into two layers: Al2O3 at the top and TMZ at the bottom. The reaction between the TMZ coating and ALD film is presented in Figure 5b. It is thought that the TMA reacts with the Si–OH and Zr–OH bonds and forms a covalent bond Si/Zr–O–Al, as described in reaction (4). The TMZ was homogeneous throughout the whole depth. The signal ratio of Si and Zr follows the molar composition of the synthesised TMZ sols, confirming the homogeneous contribution of both of the major elements in the coating. The increased content of Al and O at the top is related to the formed Al2O3. The thickness of the Al2O3 film on the TMZ coating was determined from the cross-section mapping. The estimated thickness of the Al2O3 film was ~200 nm. There is a discrepancy between the thickness of the individual ALD Al2O3 film (100 nm, Figure 9e) and the multilayer system (200 nm, Figure 10c,d). The reason for this is probably the sealing of the open pores within the sol–gel coating, where alumina diffuses during the ALD process through the coating pores in the outer part (ca. 100 nm), reacts with Si/Zr–OH groups, and forms a denser structure, as shown schematically in Figure 5b.

3.3.2. Electrochemical Corrosion Testing

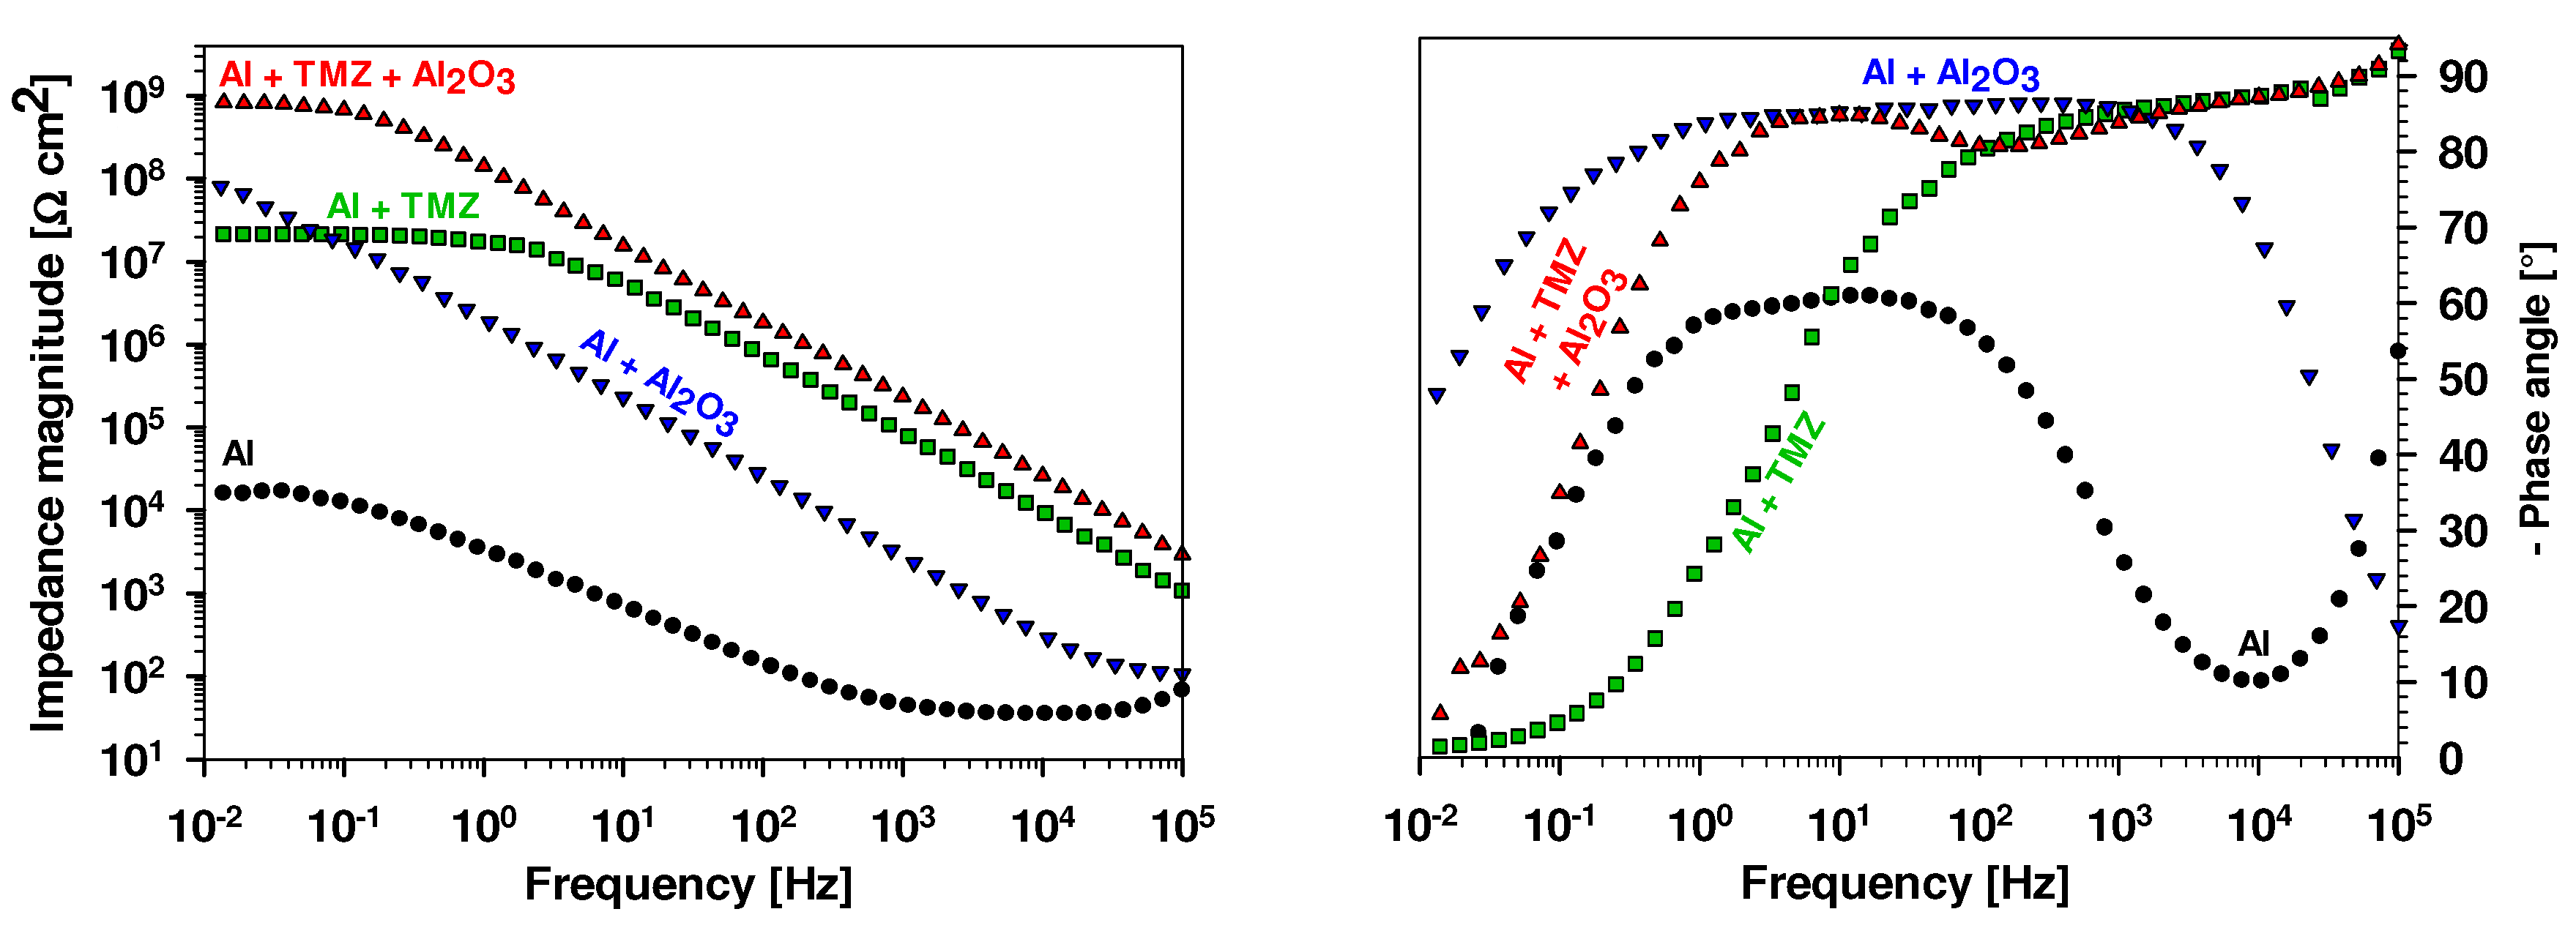
The electrochemical properties of the uncoated and TMZ-, Al2O3- and TMZ/Al2O3-coated Al samples were studied via EIS while being immersed in 0.1 M NaCl. The EIS spectra recorded after 1 h immersion are given in the Bode plots (magnitudes of the impedance, |Z|, and the phase angle, ϕ, as a function of the frequency) presented in Figure 11. The Nyquist spectra are presented in Figures S1–S3.
The impedance magnitudes at the lowest frequency of 10 mHz (|Z|10 mHz) were taken as critical values to be considered when evaluating the protective properties of different protective systems. Table 3 summarises the |Z|10 mHz values for the TMZ-, Al2O3- and TMZ/Al2O3-coated Al samples after different immersion times.
The Bode plots reflect that the aluminium surface was passivated with spontaneously formed oxide. The impedance magnitude at low frequency (|Z|10 mHz) was 16 kΩ cm2, and the maximum ϕ of around −61° was in the middle range frequency. These data indicate that the oxide layer offers a limited barrier to the diffusion of corrosive species. In contrast, the TMZ-, Al2O3-, and especially the multilayer TMZ/Al2O3-coated samples showed different Bode plots compared to the uncoated Al (Figure 11). The EIS response of the TMZ-coated Al showed improved corrosion protection, as expressed by a more extended constant impedance modulus plateau in the low- and middle-frequency part. After 1 h of immersion, the |Z|10 mHz of the TMZ coating was significantly greater than that of the uncoated coating (25.5 MΩ cm2 compared to 16 kΩ cm2, respectively). For the Bode ϕ vs. f plot, values close to −90° were obtained, stretching over a high-frequency range and indicating the coating’s highly capacitive character. The plateau of the constant phase angle was extended up to 102 Hz frequencies, showing the capacitive behaviour of the coating. The measured values of the studied TMZ coating were greater than similar TMZ coatings with a lower amount of Zr, confirming the beneficial effect of increasing the Zr content in the coating [11,18,20].
The results regarding the EIS measurements on the ALD Al2O3-coated aluminium (Figure 11, Table 3) indicated impedance values even higher (80.4 MΩ cm2) than those of the TMZ-coated aluminium. The deposited ALD coating showed increased impedance values and a widened high phase angle region, reflecting the extended passivation range in the case of the samples coated with 100 nm thin coating compared to the naturally passivated aluminium surface. Thus, the ALD Al2O3 film presents better (more efficient) resistance against corrosion. The Bode ϕ vs. f plot showed that values close to −90° were obtained, stretching over a high-frequency range and indicating that the ALD Al2O3 exhibits a highly capacitive character.
The greatest |Z|10 mHz values of 827.2 MΩ cm2 were obtained for the multilayer TMZ/Al2O3 system coating (Figure 11). The Bode ϕ vs. f plot showed values close to −90° stretching from 5 Hz to a high-frequency range. The enhanced barrier properties of the multilayer system are related to the pore-sealing effect of the outer part of the TMZ coating with the ALD film, thus blocking the ingress of corrosive species from the solution.
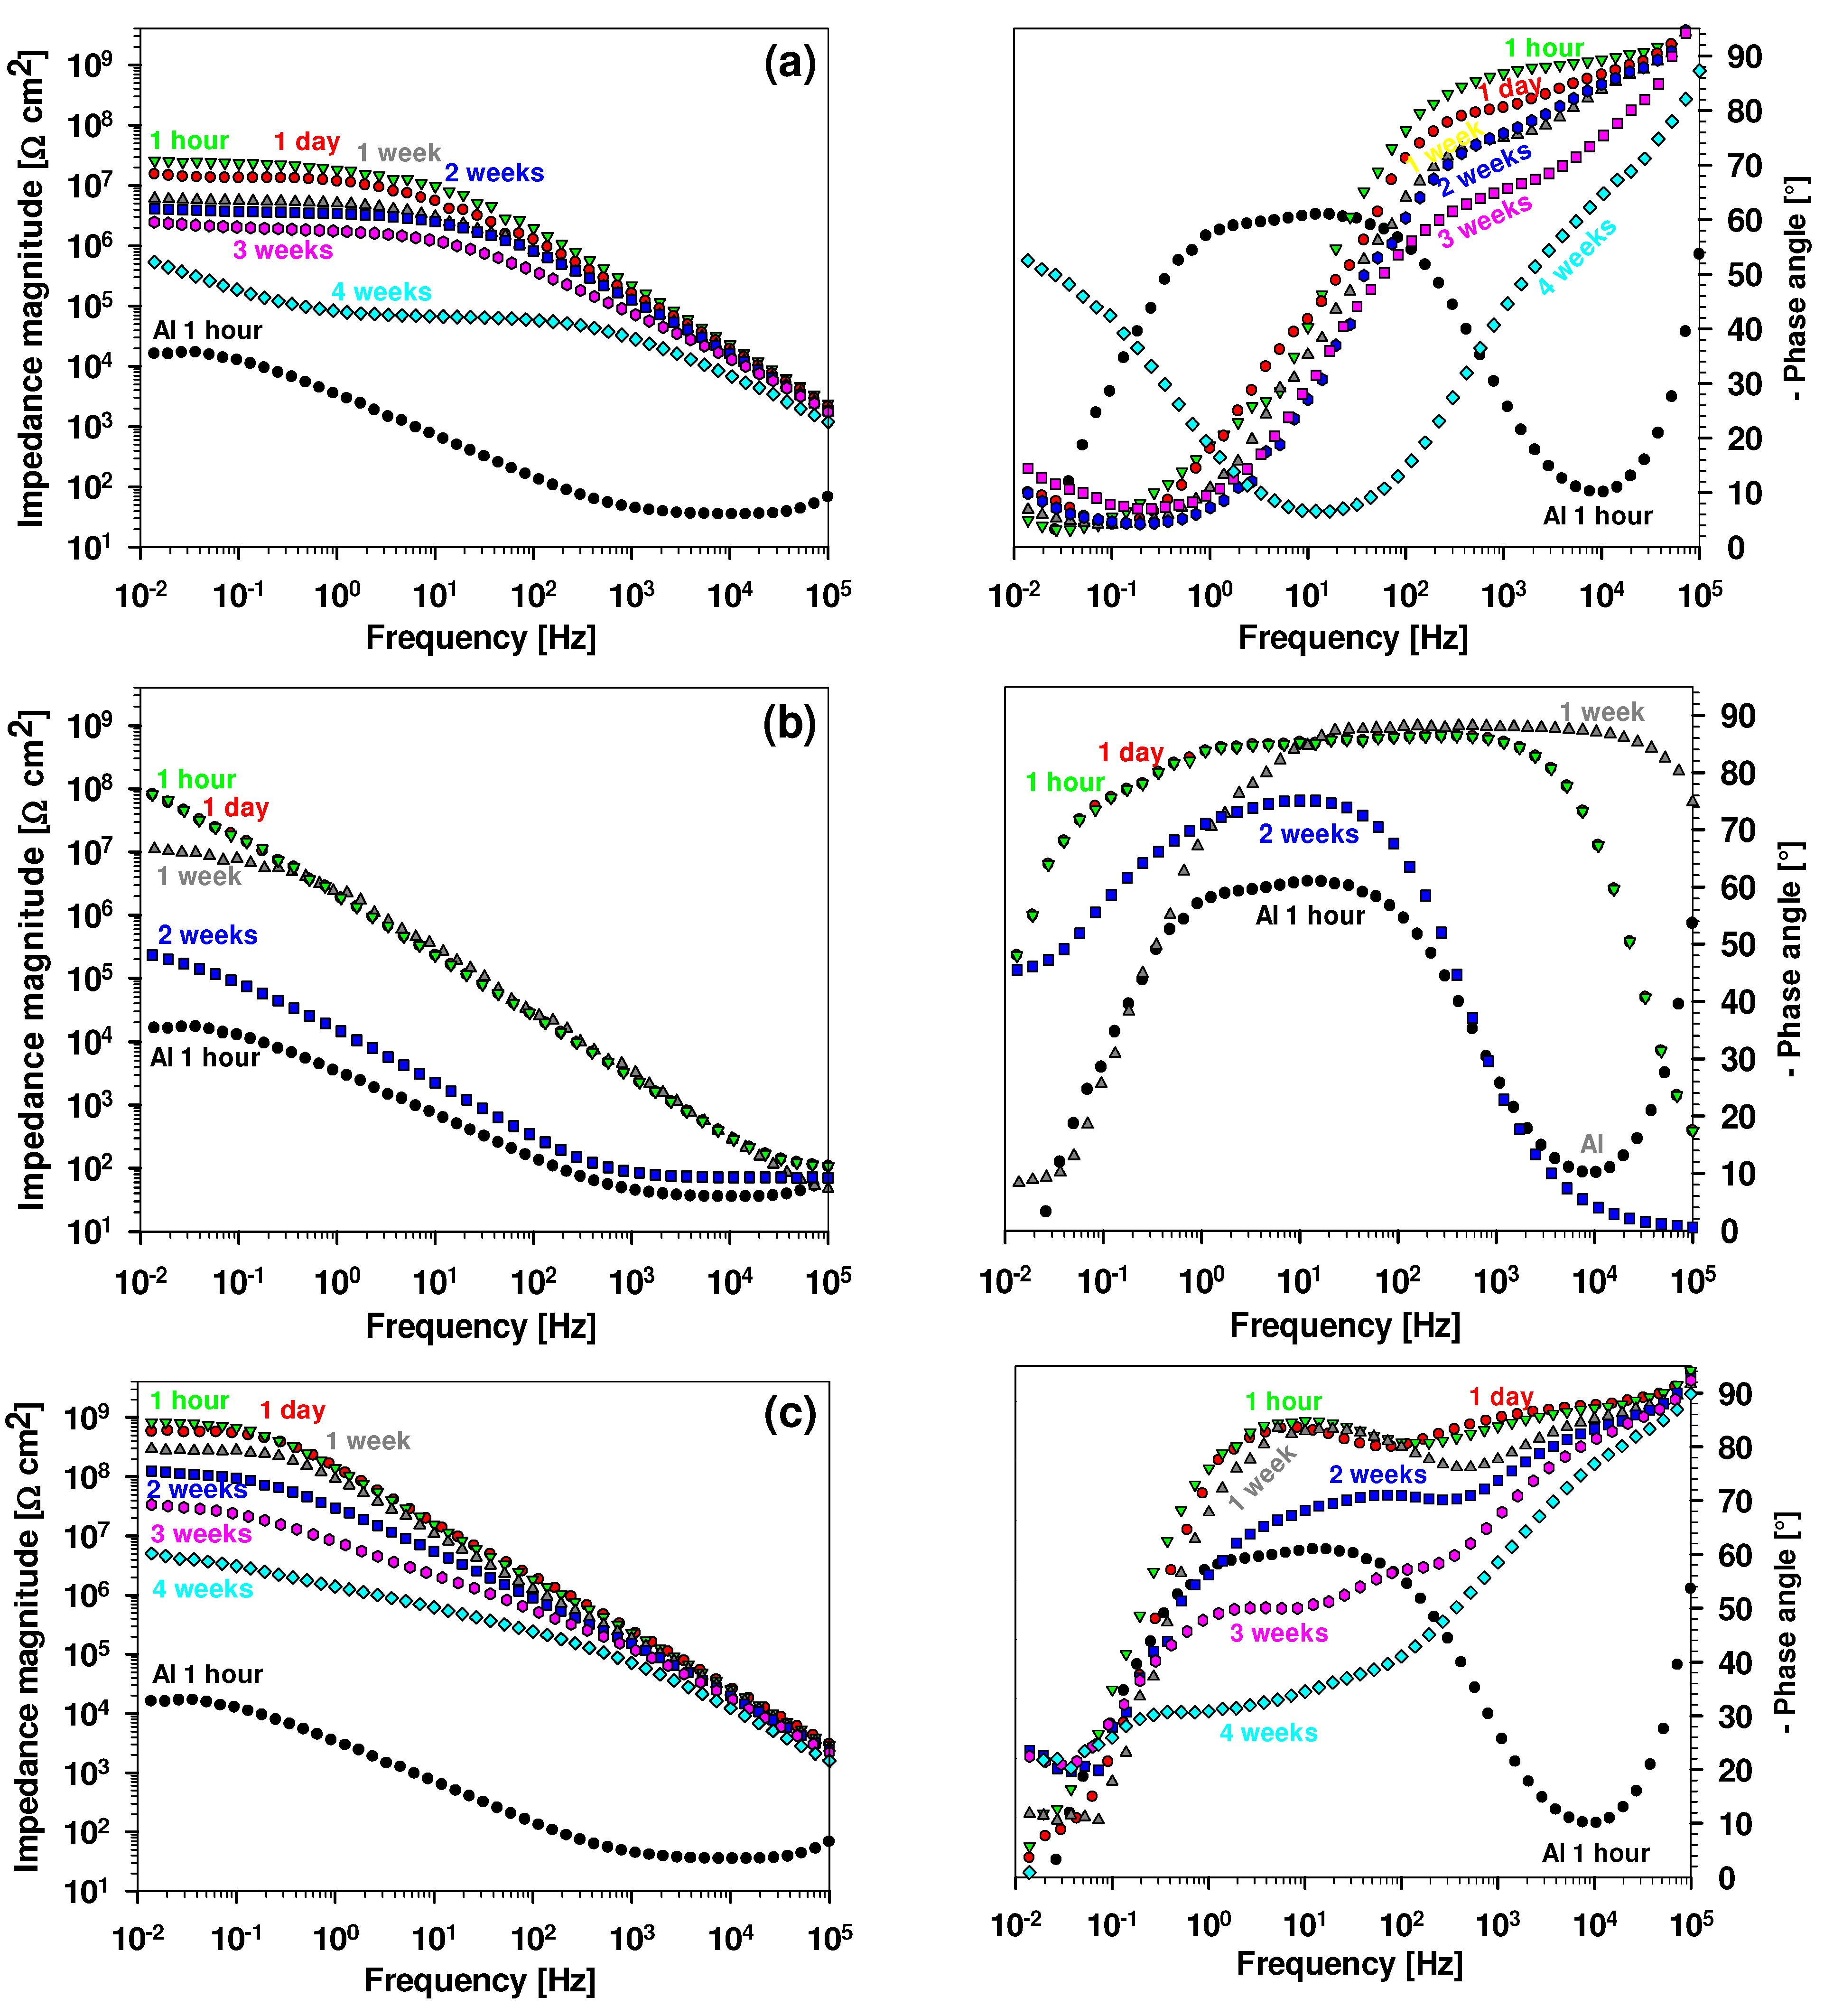
The EIS measurements pertaining to an extended immersion time are presented in Figure 12. Deduced |Z|10 mHz values are presented in Table 3, and the Nyquist spectra are presented in Figures S1–S3. The layer formed spontaneously on the Al surface offers only a limited degree of protection [18]. Thus, only the curve recorded after immersion for one hour is presented. The |Z|10 mHz of the TMZ coating slightly decreased during immersion (to 15.4 MΩ cm2 after 1 day and 2.5 MΩ cm2 after 3 weeks), and the phase angle values shifted to higher frequencies (Figure 12a).
The extent of the impedance plateau remained unchanged, indicating that the degradation processes did not significantly affect the coating’s structure and, in turn, the corrosion rate of the underlying Al substrate. However, the obtained spectra indicate that despite a minimal coating porosity [20,21], it can generate diffusion pathways for the aggressive electrolyte to access the substrate after a longer immersion time. This process was reflected in the shape of the middle-frequency part after 2 weeks of immersion. In the ϕ vs. f plot, signs of corrosion at the inner substrate/coating interface (low frequency) are visible (Figure 12a). On the high-frequency side, which reflects the coating capacitance, the value of ϕ also decreased, indicating the deterioration of the TMZ coating with increasing immersion time. Therefore, although the TMZ coating imparts good corrosion protection for the underlying Al substrate, some pores and pathways were formed in the coating, starting after 2 weeks of the immersion, enabling the electrolyte to ingress to the substrate.
The ALD Al2O3-coated Al samples showed less durable protection than the TMZ-coated samples (Figure 12b). Despite higher impedance at the beginning of immersion, the |Z|10 mHz values decreased after one week for almost one order of magnitude and then gradually further decreased after 2 weeks of immersion (Table 3). The low durability of the ALD Al2O3 film is probably related to the nanometric thickness of the film and, possibly, voids in the film (Figure 9c). Further, due to deposition at low temperatures, the chemisorption of Al(CH3)3 to the surface may not be completed [45,48] (Figure 4). Therefore, the film formed under such conditions contains carbon at the surface, reducing the corrosion efficiency after extended immersion time.
In the Bode plots for the multilayer TMZ/Al2O3 coating system, two distinct regions can be observed (Figure 12c). The high-frequency range is related to the outer part of the TMZ/Al2O3 coating at the coating/electrolyte interface, and the intermediate frequency range is related to the inner part of the TMZ coating. For up to 4 weeks of immersion, the multilayer coating acted as a barrier, as evidenced by the increased |Z|10 mHz for over one order of magnitude compared to the TMZ-coated Al (Table 3). After 4 weeks of immersion, the impedance magnitude decreased in the whole frequency range, but this decrease was much slower than that of the TMZ-coated Al (|Z|10 mHz 5 MΩ cm2). Despite a stable and dense interface, the coating formed some pores, but in the ϕ vs. f plot, no signs of corrosion at the inner substrate/coating interface (low frequency) were visible (Figure 12c). On the high-frequency side, reflecting the coating capacitance, the value of ϕ also remained similar, indicating that the multilayer coating system remained more protective at longer immersion times.

4. Conclusions

This study focused on the possibility of combining two strategies of corrosion protection—a micrometre-thick sol–gel hybrid coating sealed with a nanometre-thick alumina layer—and evaluating their properties and corrosion resistance in 0.1 M NaCl when deposited on aluminium.
The preparation of hybrid sol–gel coatings from silica and zirconia precursors Si/Zr was characterised using real-time FTIR spectroscopy. After hydrolysis and condensation, chelating reactions stopped at a certain level, at which the efficient incorporation of zirconia into the siloxane network occurred. The reactions were completed after thermal curing.
FTIR spectra of the aluminium surface showed the difference in composition between the naturally formed aluminium oxide film (consisting of a mixture of aluminium oxides) and the well-defined ALD Al2O3 deposited film.
The FTIR spectrum of the multilayer system showed the presence of the ALD film on the TMZ coating. During deposition, the ALD film reacted with a Si–O–Zr network, mainly with unreacted –OH groups forming a Si/Zr–O–Al film. The multilayer was homogeneous and exhibited a low number of defects, as shown by the top and cross-section SEM/EDS images. The ALD alumina film diffused in the TMZ coating structure, thus sealing the pores in the outer part of the TMZ coating.
The aluminium coated with the multilayer TMZ/Al2O3 coating imparted excellent corrosion resistance to the underlying aluminium substrate during three weeks of immersion in 0.1 M NaCl. The impedance magnitude increased by two orders compared to the uncoated aluminium substrate (|Z|10 mHz from 16 kΩ cm2 to almost 830 MΩ cm2). Thus, the pore sealing of the sol–gel coating using the ALD alumina film produced a protective multilayer coating system because |Z|10 mHz remained above 5 MΩ cm2 after four weeks in sodium chloride solution.

Supplementary Materials

The following supporting information can be downloaded at: https://www.mdpi.com/article/10.3390/met13121960/s1, Figure S1: Nyquist plots of the aluminium coated with the TMZ coating at different immersion times; Figure S2: Nyquist plots of the aluminium coated with the ALD Al2O3 coating at different immersion times; Figure S3: Nyquist plots of the aluminium coated with the TMZ/Al2O3 coating at different immersion times.

Author Contributions

Conceptualisation, P.R. and I.M.; methodology, P.R.; validation, P.R; formal analysis, P.R. and B.K.; writing—original draft preparation, P.R. and I.M.; writing—review and editing, I.M.; project administration, I.M.; funding acquisition, P.R and I.M. All authors have read and agreed to the published version of the manuscript.

Funding

Financial support was provided by the Slovenian Research Agency (research core funding No. P2-0393 and No. P1-0134).

Data Availability Statement

The data presented in this study are available on request from the corresponding author. The data are not publicly available due to technical reasons.

Acknowledgments

The Centre of Excellence for Integrated Approaches in Chemistry and Biology of Proteins (CIPKeBiP) is acknowledged for allowing us to use the ReactIR™ 45 FTIR instrument and accompanying equipment. The Center of Excellence in Nanoscience and Nanotechnology (CENN) is acknowledged for allowing us to use their FIB/SEM/EDS.

Conflicts of Interest

The authors declare no conflict of interest.

References

  1. Hagans, P.L.; Haas, C.M. Chromate Conversion Coatings. In Surface Engineeringings; ASM Handbook; ASM International: Cleveland, OH, USA, 1994; Volume 5, pp. 405–411. [Google Scholar]
  2. Pokorny, P.; Tej, P.; Szelag, P. Chromate Conversion Coatings and Their Current Application. Metalurgija 2016, 55, 253–256. [Google Scholar]
  3. Zhao, J.; Xia, L.; Sehgal, A.; Lu, D.; McCreery, R.L.; Frankel, G.S. Effects of Chromate and Chromate Conversion Coatings on Corrosion of Aluminum Alloy 2024-T3. Surf. Coat. Technol. 2001, 140, 51–57. [Google Scholar] [CrossRef]
  4. Peltier, F.; Thierry, D. Review of Cr-Free Coatings for the Corrosion Protection of Aluminum Aerospace Alloys. Coatings 2022, 12, 518. [Google Scholar] [CrossRef]
  5. Gharbi, O.; Thomas, S.; Smith, C.; Birbilis, N. Chromate Replacement: What Does the Future Hold? npj Mater. Degrad. 2018, 2, 12. [Google Scholar] [CrossRef]
  6. ECHA. European Chemicals Agency Chromium VI Compounds—ANNEX XVII TO REACH—Conditions of Restrictions; ECHA: Helsinki, Finland, 2016. [Google Scholar]
  7. Twite, R.; Bierwagen, G. Review of Alternatives to Chromate for Corrosion Protection of Aluminum Aerospace Alloys. Prog. Org. Coat. 1998, 33, 91–100. [Google Scholar] [CrossRef]
  8. Carreira, A.F.; Pereira, A.M.; Vaz, E.P.; Cabral, A.M.; Ghidini, T.; Pigliaru, L.; Rohr, T. Alternative Corrosion Protection Pretreatments for Aluminum Alloys. J. Coat. Technol. Res. 2017, 14, 879–892. [Google Scholar] [CrossRef]
  9. Metroke, T.L.; Parkhill, R.L.; Knobbe, E.T. Passivation of Metal Alloys Using Sol–Gel-Derived Materials—A Review. Prog. Org. Coat. 2001, 41, 233–238. [Google Scholar] [CrossRef]
  10. Chou, T.P.; Chandrasekaran, C.; Cao, G.Z. Sol–Gel-Derived Hybrid Coatings for Corrosion Protection. J. Sol–Gel Sci. Technol. 2003, 26, 321–327. [Google Scholar] [CrossRef]
  11. Rodič, P.; Milošev, I.; Lekka, M.; Andreatta, F.; Fedrizzi, L. Corrosion Behaviour and Chemical Stability of Transparent Hybrid Sol–Gel Coatings Deposited on Aluminium in Acidic and Alkaline Solutions. Prog. Org. Coat. 2018, 124, 286–295. [Google Scholar] [CrossRef]
  12. Figueira, R.B. Hybrid Sol–Gel Coatings for Corrosion Mitigation: A Critical Review. Polymers 2020, 12, 689. [Google Scholar] [CrossRef]
  13. Castro, Y.; Aparicio, M.; Moreno, R.; Duran, A. Silica-Zirconia Alkali-Resistant Coatings by Sol–Gel Route. J. Sol–Gel Sci. Technol. 2005, 35, 41–50. [Google Scholar] [CrossRef]
  14. Bae, J.-Y.; Yang, S.; Jin, J.H.; Jung, K.; Kim, J.-S.; Bae, B.-S. Fabrication of Transparent Methacrylate Zirconium Siloxane Hybrid Materials Using Sol–Gel Synthesised Oligosiloxane Resin. J. Sol–Gel Sci. Technol. 2011, 58, 114–120. [Google Scholar] [CrossRef]
  15. Chuah, G.K.; Liu, S.H.; Jaenicke, S.; Li, J. High Surface Area Zirconia by Digestion of Zirconium Propoxide at Different pH. Microporous Mesoporous Mater. 2000, 39, 381–392. [Google Scholar] [CrossRef]
  16. Rodič, P.; Iskra, J.; Milošev, I. Study of a Sol–Gel Process in the Preparation of Hybrid Coatings for Corrosion Protection Using FTIR and 1H NMR Methods. J. Non-Cryst. Solids 2014, 396–397, 25–35. [Google Scholar] [CrossRef]
  17. Rodič, P.; Mertelj, A.; Borovšak, M.; Benčan, A.; Mihailović, D.; Malič, B.; Milošev, I. Composition, Structure and Morphology of Hybrid Acrylate-Based Sol–Gel Coatings Containing Si and Zr Composed for Protective Applications. Surf. Coat. Technol. 2016, 286, 388–396. [Google Scholar] [CrossRef]
  18. Rodič, P.; Zanna, S.; Milošev, I.; Marcus, P. Degradation of Sol–Gel Acrylic Coatings Based on Si and Zr Investigated Using Electrochemical Impedance, Infrared and X-Ray Photoelectron Spectroscopies. Front. Mater. 2021, 8, 756447. [Google Scholar] [CrossRef]
  19. Varma, P.C.R.; Colreavy, J.; Cassidy, J.; Oubaha, M.; Duffy, B.; McDonagh, C. Effect of Organic Chelates on the Performance of Hybrid Sol–Gel Coated AA 2024-T3 Aluminium Alloys. Prog. Org. Coat. 2009, 66, 406–411. [Google Scholar] [CrossRef]
  20. Rodič, P.; Katić, J.; Korte, D.; Desimone, P.M.; Franko, M.; Ceré, S.M.; Metikoš-Huković, M.; Milošev, I. The Effect of Cerium Ions on the Structure, Porosity and Electrochemical Properties of Si/Zr-Based Hybrid Sol–Gel Coatings Deposited on Aluminum. Metals 2018, 8, 248. [Google Scholar] [CrossRef]
  21. Rodič, P.; Milošev, I. Electrochemical and Salt Spray Testing of Hybrid Coatings Based on Si and Zr Deposited on Aluminum and Its Alloys. J. Electrochem. Soc. 2015, 162, C592–C600. [Google Scholar] [CrossRef]
  22. Bard, A.J.; Stratmann, M.; Frankel, G.S. Encyclopedia of Electrochemistry: Volume 4: Corrosion and Oxide Films, 1st ed.; Wiley-VCH Verlag GmbH & Co. KGaA: Weinheim, Germany, 2003. [Google Scholar]
  23. Puurunen, R.L. Surface Chemistry of Atomic Layer Deposition: A Case Study for the Trimethylaluminum/Water Process. J. Appl. Phys. 2005, 97, 121301. [Google Scholar] [CrossRef]
  24. George, S.M. Atomic Layer Deposition: An Overview. Chem. Rev. 2010, 110, 111–131. [Google Scholar] [CrossRef]
  25. Pourbaix, M. Atlas of Electrochemical Equilibria in Aqueous Solutions; National Association of Corrosion Engineers: Houston, TX, USA; Brussels, Belgium, 1974. [Google Scholar]
  26. Ishwara Bhat, J.; Alva, V.D.P. A Study of Aluminium Corrosion Inhibition in Acid Medium by an Antiemitic Drug. Trans. Indian Inst. Met. 2011, 64, 377–384. [Google Scholar] [CrossRef]
  27. Boukerche, I.; Djerad, S.; Benmansour, L.; Tifouti, L.; Saleh, K. Degradability of Aluminum in Acidic and Alkaline Solutions. Corros. Sci. 2014, 78, 343–352. [Google Scholar] [CrossRef]
  28. Emregül, K.C.; Aksüt, A.A. The Behavior of Aluminum in Alkaline Media. Corros. Sci. 2000, 42, 2051–2067. [Google Scholar] [CrossRef]
  29. Strehblow, H.-H.; Marcus, P. Mechanisms of Pitting Corrosion. In Corrosion Mechanisms in Theory and Practice, 2nd ed.; Marcus, P., Ed.; Marcel Dekker, Inc.: Basel, Switzerland, 2011; pp. 349–393. [Google Scholar]
  30. Natishan, P.M.; O’Grady, W.E. Chloride Ion Interactions with Oxide-Covered Aluminum Leading to Pitting Corrosion: A Review. J. Electrochem. Soc. 2014, 161, C421. [Google Scholar] [CrossRef]
  31. Paranjpe, A.; Gopinath, S.; Omstead, T.; Bubber, R. Atomic Layer Deposition of AlOx for Thin Film Head Gap Applications. J. Electrochem. Soc. 2001, 148, G465–G471. [Google Scholar] [CrossRef]
  32. Seshan, K. Handbook of Thin Film Deposition; William Andrew (Elsevier): Amsterdam, The Netherlands, 2012. [Google Scholar]
  33. Van Hemmen, J.L.; Heil, S.B.S.; Klootwijk, J.H.; Roozeboom, F.; Hodson, C.J.; van de Sanden, M.C.M.; Kessels, W.M.M. Plasma and Thermal ALD of Al2O3 in a Commercial 200 Mm ALD Reactor. J. Electrochem. Soc. 2007, 154, G165–G169. [Google Scholar] [CrossRef]
  34. Marin, E.; Lanzutti, A.; Guzman, L.; Fedrizzi, L. Corrosion Protection of AISI 316 Stainless Steel by ALD Alumina/Titania Nanometric Coatings. J. Coat. Technol. Res. 2011, 8, 655–659. [Google Scholar] [CrossRef]
  35. Ahvenniemi, E.; Akbashev, A.R.; Ali, S.; Bechelany, M.; Berdova, M.; Boyadjiev, S.; Cameron, D.C.; Chen, R.; Chubarov, M.; Cremers, V.; et al. Review Article: Recommended Reading List of Early Publications on Atomic Layer Deposition—Outcome of the “Virtual Project on the History of ALD”. J. Vac. Sci. Technol. A 2016, 35, 010801. [Google Scholar] [CrossRef]
  36. Spajić, I.; Rodič, P.; Šekularac, G.; Lekka, M.; Fedrizzi, L.; Milošev, I. The Effect of Surface Preparation on the Protective Properties of Al2O3 and HfO2Thin Films Deposited on Cp-Titanium by Atomic Layer Deposition. Electrochim. Acta 2021, 366, 137431. [Google Scholar] [CrossRef]
  37. Pehkonen, S.O.; Yuan, S. Chapter 7—The Inorganic Film Coatings for Corrosion Protection. In Interface Science and Technology; Pehkonen, S.O., Yuan, S., Eds.; Tailored Thin Coatings for Corrosion Inhibition using a Molecular Approach; Elsevier: Amsterdam, The Netherlands, 2018; Volume 23, pp. 185–255. [Google Scholar]
  38. Dameron, A.A.; Davidson, S.D.; Burton, B.B.; Carcia, P.F.; McLean, R.S.; George, S.M. Gas Diffusion Barriers on Polymers Using Multilayers Fabricated by Al2O3 and Rapid SiO2 Atomic Layer Deposition. J. Phys. Chem. C 2008, 112, 4573–4580. [Google Scholar] [CrossRef]
  39. Carcia, P.F.; McLean, R.S.; Reilly, M.H.; Groner, M.D.; George, S.M. Ca Test of Al2O3 Gas Diffusion Barriers Grown by Atomic Layer Deposition on Polymers. Appl. Phys. Lett. 2006, 89, 031915. [Google Scholar] [CrossRef]
  40. Oliveira, M.P.; Silva, R.M.; Yasakau, K.A.; Bastos, A.; Kallip, S.; Zheludkevich, M.L.; Silva, R.F.; Ferreira, M.G.S. Atomic Layer Deposition of Nanometric Alumina for Corrosion Protection of Heterogeneous Metallic Surfaces—The Case of Aeronautical Grade Aluminium Alloy 2024-T3. Corros. Sci. 2022, 209, 110773. [Google Scholar] [CrossRef]
  41. Marin, E.; Lanzutti, A.; Andreatta, F.; Lekka, M.; Guzman, L. Atomic Layer Deposition: State-of-the-Art and Research/Industrial Perspectives. Corros. Rev. 2011, 29, 191–208. [Google Scholar] [CrossRef]
  42. Matero, R.; Ritala, M.; Leskelä, M.; Salo, T.; Aromaa, J.; Forsén, O. Atomic Layer Deposited Thin Films for Corrosion Protection. J. Phys. IV 1999, 09, Pr8-493–Pr8-499. [Google Scholar] [CrossRef]
  43. Im, H.; Wittenberg, N.J.; Lindquist, N.C.; Oh, S.-H. Atomic Layer Deposition: A Versatile Technique for Plasmonics and Nanobiotechnology. J. Mater. Res. 2012, 27, 663–671. [Google Scholar] [CrossRef]
  44. King, D.M.; Spencer, J.A.; Liang, X.; Hakim, L.F.; Weimer, A.W. Atomic Layer Deposition on Particles Using a Fluidized Bed Reactor with in Situ Mass Spectrometry. Surf. Coat. Technol. 2007, 201, 9163–9171. [Google Scholar] [CrossRef]
  45. Groner, M.D.; Fabreguette, F.H.; Elam, J.W.; George, S.M. Low-Temperature Al2O3 Atomic Layer Deposition. Chem. Mater. 2004, 16, 639–645. [Google Scholar] [CrossRef]
  46. Choi, H.; Shin, S.; Jeon, H.; Choi, Y.; Kim, J.; Kim, S.; Chung, S.C.; Oh, K. Fast Spatial Atomic Layer Deposition of Al2O3 at Low Temperature (<100 °C) as a Gas Permeation Barrier for Flexible Organic Light-Emitting Diode Displays. J. Vac. Sci. Technol. A 2016, 34, 01A121. [Google Scholar] [CrossRef]
  47. Potts, S.E.; Schmalz, L.; Fenker, M.; Díaz, B.; Światowska, J.; Maurice, V.; Seyeux, A.; Marcus, P.; Radnóczi, G.; Tóth, L. Ultra-Thin Aluminium Oxide Films Deposited by Plasma-Enhanced Atomic Layer Deposition for Corrosion Protection. J. Electrochem. Soc. 2011, 158, C132–C138. [Google Scholar] [CrossRef]
  48. Díaz, B.; Härkönen, E.; Światowska, J.; Maurice, V.; Seyeux, A.; Marcus, P.; Ritala, M. Low-Temperature Atomic Layer Deposition of Al2O3 Thin Coatings for Corrosion Protection of Steel: Surface and Electrochemical Analysis. Corros. Sci. 2011, 53, 2168–2175. [Google Scholar] [CrossRef]
  49. Díaz, B.; Härkönen, E.; Maurice, V.; Światowska, J.; Seyeux, A.; Ritala, M.; Marcus, P. Failure Mechanism of Thin Al2O3 Coatings Grown by Atomic Layer Deposition for Corrosion Protection of Carbon Steel. Electrochim. Acta 2011, 56, 9609–9618. [Google Scholar] [CrossRef]
  50. Marin, E.; Lanzutti, A.; Paussa, L.; Guzman, L.; Fedrizzi, L. Long Term Performance of Atomic Layer Deposition Coatings for Corrosion Protection of Stainless Steel. Mater. Corros. 2015, 66, 907–914. [Google Scholar] [CrossRef]
  51. Abdulagatov, A.I.; Yan, Y.; Cooper, J.R.; Zhang, Y.; Gibbs, Z.M.; Cavanagh, A.S.; Yang, R.G.; Lee, Y.C.; George, S.M. Al2O3 and TiO2 Atomic Layer Deposition on Copper for Water Corrosion Resistance. ACS Appl. Mater. Interfaces 2011, 3, 4593–4601. [Google Scholar] [CrossRef] [PubMed]
  52. Chang, M.L.; Wang, L.C.; Lin, H.C.; Chen, M.J.; Lin, K.M. Investigation of Defects in Ultra-Thin Al2O3 Films Deposited on Pure Copper by the Atomic Layer Deposition Technique. Appl. Surf. Sci. 2015, 359, 533–542. [Google Scholar] [CrossRef]
  53. Härkönen, E.; Kolev, I.; Díaz, B.; Światowska, J.; Maurice, V.; Seyeux, A.; Marcus, P.; Fenker, M.; Toth, L.; Radnoczi, G.; et al. Sealing of Hard CrN and DLC Coatings with Atomic Layer Deposition. ACS Appl. Mater. Interfaces 2014, 6, 1893–1901. [Google Scholar] [CrossRef] [PubMed]
  54. Merisalu, M.; Aarik, L.; Kozlova, J.; Mändar, H.; Tarre, A.; Sammelselg, V. Effective Corrosion Protection of Aluminum Alloy AA2024-T3 with Novel Thin Nanostructured Oxide Coating. Surf. Coat. Technol. 2021, 411, 126993. [Google Scholar] [CrossRef]
  55. Parsons, G.N.; Atanasov, S.E.; Dandley, E.C.; Devine, C.K.; Gong, B.; Jur, J.S.; Lee, K.; Oldham, C.J.; Peng, Q.; Spagnola, J.C.; et al. Mechanisms and Reactions during Atomic Layer Deposition on Polymers. Coord. Chem. Rev. 2013, 257, 3323–3331. [Google Scholar] [CrossRef]
  56. Guo, H.C.; Ye, E.; Li, Z.; Han, M.-Y.; Loh, X.J. Recent Progress of Atomic Layer Deposition on Polymeric Materials. Mat. Sci. Eng. C 2017, 70, 1182–1191. [Google Scholar] [CrossRef]
  57. Wang, H.; Liu, Y.; Liu, H.; Chen, Z.; Xiong, P.; Xu, X.; Chen, F.; Li, K.; Duan, Y. Effect of Various Oxidants on Reaction Mechanisms, Self-Limiting Natures and Structural Characteristics of Al2O3 Films Grown by Atomic Layer Deposition. Adv. Mater. Interfaces 2018, 5, 1701248. [Google Scholar] [CrossRef]
  58. Matero, R.; Rahtu, A.; Ritala, M.; Leskelä, M.; Sajavaara, T. Effect of Water Dose on the Atomic Layer Deposition Rate of Oxide Thin Films. Thin Solid Film. 2000, 368, 1–7. [Google Scholar] [CrossRef]
  59. Lee, D.H.; Condrate, R.A. An FTIR Spectral Investigation of the Structural Species Found on Alumina Surfaces. Mater. Lett. 1995, 23, 241–246. [Google Scholar] [CrossRef]
  60. Liu, C.; Shih, K.; Gao, Y.; Li, F.; Wei, L. Dechlorinating Transformation of Propachlor through Nucleophilic Substitution by Dithionite on the Surface of Alumina. J. Soils Sediments 2012, 12, 724–733. [Google Scholar] [CrossRef]
  61. Goldstein, D.N.; McCormick, J.A.; George, S.M. Al2O3 Atomic Layer Deposition with Trimethylaluminum and Ozone Studied by in Situ Transmission FTIR Spectroscopy and Quadrupole Mass Spectrometry. J. Phys. Chem. C 2008, 112, 19530–19539. [Google Scholar] [CrossRef]
Figure 1. (a) Three-dimensional real-time FTIR spectra of hydrolysed MAPTMS and TEOS to obtain Sol 1; (b) molecular structures of 3-methacryloxypropyl trimethoxysilane (MAPTMS) and tetraethyl orthosilicate TEOS; (c) intensities of selected bands in the FTIR spectra vs. the time denoted in (a).
Metals 13 01960 g001aMetals 13 01960 g001b
Figure 2. (a) Individual FTIR spectra of ZTP, MAA, and ZTP+MAA of Sol 2; (b) molecular structures of zirconium(IV) n-propoxide and methacrylic acid; (c) intensities of selected bands denoted in (a) during the chelation process of ZTP during the addition of MAA to obtain the Sol 2 (ZTP/MAA = 1:2).
Metals 13 01960 g002
Figure 3. (a) Three-dimensional real-time FTIR spectra of hydrolysed MAPTMS and TEOS (Sol 1), followed by the addition of ZTP/MAA (Sol 2) to obtain the final TMZ sol; (b) intensities of selected bands in the FTIR spectra vs. time from (a) (part of the FTIR spectra for bands 1428 and 1550 cm−1 is not shown).
Metals 13 01960 g003
Figure 4. Normalised FTIR spectra of (a) the ground aluminium surface and ground aluminium surfaces coated with (b) the TMZ coating, (c) the Al2O3 film, and (d) the multilayer TMZ/Al2O3 system (vertical dashed lines denote some of the characteristic bands in the FTIR spectra).
Metals 13 01960 g004
Figure 5. Schematic presentation of (a) the ALD cycle using trimethyl aluminium (TMA) and water as co-reagent and (b) the multilayer TMZ/Al2O3 coatings system deposited on the aluminium surface. The inset figure schematically presents the principle of the ALD pore-sealing effect of a TMZ coating (Si–O–Zr hybrid sol–gel coating).
Metals 13 01960 g005
Figure 6. SEM morphology images of the ground aluminium surface at (a,b) low and (c,d) high magnification. The black arrows in (a,b) mark the irregularities and grinding residuals in the direction of the grinding. The white arrows in (c,d) mark the voids and pores in the naturally passivated aluminium surface.
Metals 13 01960 g006
Figure 7. SEM morphology images of aluminium coated with TMZ coating using (a) the secondary electron (SE) and (b) back-scattering electron (BSE) imaging modes. The square marks the positions where the EDS mapping was performed. The elemental mapping analyses of silicon, zirconium, and oxygen are shown on the right. Additionally, the EDS spectrum and composition are given in the atomic percentage.
Metals 13 01960 g007
Figure 8. FIB-SEM cross-section morphology of aluminium coated with TMZ coating and elemental mapping analysis of aluminium, oxygen, silicon, zirconium, and platinum of the marked white rectangle.
Metals 13 01960 g008
Figure 9. SEM morphology images of the surface of ground aluminium after the thermal deposition of 100 nm ALD Al2O3 at 160 °C presented at (a,b) at low and (c,d) high magnification. The black arrows in (a,b) mark the grinding residuals, and the white arrows in (b) mark the voids and pores. Figure (e) shows a cross-section of ALD film on the ground Al. The red arrows in (e) mark the naturally formed aluminium oxide film, and the yellow arrows mark the uncoated voids in the aluminium structure.
Metals 13 01960 g009
Figure 10. (a,b) SEM morphology images of the TMZ/Al2O3 multilayer system on Al. (c) FIB-SEM cross-section image of the multilayer system and (d) elemental mapping analysis of aluminium, oxygen, silicon, zirconium, and platinum of the marked white rectangle in (c).
Metals 13 01960 g010
Figure 11. Bode plots (impedance magnitude and phase angle) of the aluminium coated with TMZ, ALD Al2O3, and TMZ/Al2O3 after 1 h of immersion. A curve for the ground aluminium immersed for 1 h has been plotted for comparison.
Metals 13 01960 g011
Figure 12. Bode plots (impedance magnitude and phase angle) of the aluminium coated with (a) TMZ, (b) ALD Al2O3, and (c) TMZ/Al2O3 at different immersion times. A curve for the ground aluminium immersed for 1 h has been plotted for comparison.
Metals 13 01960 g012
Table 1. Summary of the coatings’ characteristics.
CoatingPrecursorsPreparationCoating DepositionThickness
TMZ
sol–gel
MAPTMS, TEOS, ZTP and MAASynthesis at room temperature.Spin-coating.3.8 µm
Al2O3-ALDTMA, H2ODeposition in vacuum at 150 °C.Layer-by-layer deposition.100 nm
Table 2. Most characteristic bands in the FTIR spectra for bonds in initial precursors and TMZ sols. Data from [11,16].
Chemical BondsWavenumber [cm−1]
Si–O–R (MAPTMS or TEOS)1164, 1081, 815, 785
Si–OH942
Si–O–Si1084, 1027
Zr–O–R (ZTP)1555, 1376, 1459, 1130, 1044, 1003, 890, 834
MAA1691, 1634, 1455, 1428, 1298, 1203, 810
ZTP/MAA1646, 1055, 1248, 834
Si–O–Zr (TMZ)1014, 1031, 943, 969
Table 3. Impedance magnitude at 10 mHz (|Z|10 mHz) determined from EIS spectra in Figure 12 for the TMZ-, Al2O3- and TMZ/Al2O3-coated Al samples after different immersion times in 0.1 M NaCl.
SampleImmersion Time|Z|10 mHz [MΩ cm2]
Ground Al 1 h0.016
Al coated with TMZ1 h25.5
1 day15.4
1 week6.1
2 weeks4.1
3 weeks2.5
4 weeks0.54
Al coated with ALD1 h80.4
1 day78.5
1 week11.1
2 weeks0.23
Al coated TMZ+ALD1 h827.2
1 day580.9
1 week280.2
2 weeks124.8
3 weeks 31.9
4 weeks5.0
Disclaimer/Publisher’s Note: The statements, opinions and data contained in all publications are solely those of the individual author(s) and contributor(s) and not of MDPI and/or the editor(s). MDPI and/or the editor(s) disclaim responsibility for any injury to people or property resulting from any ideas, methods, instructions or products referred to in the content.