
Wear Mechanism of Fe/Cu Self-Lubricating Composite Coatings Fabricated by Electro-Explosive Spraying under Dry Friction


1
State Key Laboratory of Explosion Science and Technology, Beijing Institute of Technology, Beijing 100081, China
2
College of Mechatronics Engineering, North University of China, Taiyuan 030051, China
*
Author to whom correspondence should be addressed.
Metals 2023, 13(2), 390; https://doi.org/10.3390/met13020390
Submission received: 16 January 2023
/
Revised: 6 February 2023
/
Accepted: 9 February 2023
/
Published: 14 February 2023
(This article belongs to the Section Metal Casting, Forming and Heat Treatment)
Abstract
:In the present work, Fe/Cu composite coatings were fabricated by electro-explosive spraying technology (EEST), with good lubrication performance and high wear resistance. The microstructure and morphology were characterized by an energy-dispersive spectrometer (EDS), 3D digital microscope, and scanning electron microscope (SEM) coupled with electron backscattered diffraction (EBSD). Mechanical properties and tribological performance were measured using a micro Vickers hardness tester, universal testing machine, and universal friction and wear testing machine. The composite coating had low porosity with a minimum value of 0.7%, high microhardness with a maximum value of 729.9 HV0.2, high bonding strength with a maximum average value of 55.25 MPa, and good wear resistance and self-lubrication, and the ratio of soft metal and hard metal in the coatings was controllable. Under dry friction conditions, the friction reduction mechanism was that there were both metallic oxide particles and soft metal attached in the friction pairs. When the ratio of soft metal in the composite coating was higher, the self-lubricating performance of the coating was better, with adhesive wear as the main wear mechanism; when the ratio of hard metal was higher, the wear resistance was better and the wear mechanism was mainly abrasive wear.
1. Introduction
A self-lubricating coating is a type of modification technology of material surfaces, which is to prepare a layer of anti-wear coating on the substrate [1]. It can effectively solve the problems of hardness, wear resistance, and lubricity of the material surface. Common lubricating materials are soft metals, graphite, sulfides, oxides, fluorides, and selenides. Most of these materials have low shear strength and adhere to the counterpart to change the friction mode, so they have good lubricity [2].
At present, the preparation technologies of self-lubricating coatings mainly are powder sintering technology [3], magnetron sputtering technology [4], thermal spraying technology [5], electroplating [6], electroless plating [7], vacuum coating technology [8], and laser cladding technology [9,10]. However, there are some technical defects that are difficult to overcome. For example, the powder sintering process is simple, but the coating’s bonding strength is low; meanwhile, the coating’s surface quality is poor, which is not conducive to reprocessing. Laser cladding technology needs to be improved in reducing the evaporation of materials and reducing cracks and voids in coatings; electroplating has some limitations in the selection of materials, and there are problems such as a low deposition rate and environmental pollution. Electroless plating has problems such as solution stability and pollution; for physical and chemical vapor deposition technology, it is difficult to enhance the bonding strength between the substrate and coating [11,12,13,14,15]. In addition, the wear mechanism of self-lubricating coatings was also studied, such as the research on the wear resistance of aluminum matrix composites [10] and the evaluation of the wear mechanism between TC4 titanium alloys and self-lubricating fabrics [16].
EEST is a type of thermal spraying technology. Its principle is that the metal conductor explodes when a current with high energy density flows through it. The shock wave generated by the explosion sprays the partially molten metal droplets onto the surface of the substrate at a very high speed, and the metal droplets condense in a very short time to form a coating [17]. The spraying material can be made of industrial metal wire without special treatment. The results show that the thickness of the coating formed by each spraying is relatively uniform, so the thickness of the coating is easy to control, there are few oxide inclusions in the coating, the porosity of the coating is small, and the bonding strength is high. At present, a variety of coatings have been prepared by EEST, such as ceramic zirconium coatings [18], molybdenum coatings [19], submicron MoSi2-based coatings [20], and ZnO-Ag coatings resistant to electrical erosion, which were prepared for the first time on the surface of the electromagnetic starter CJ20 by EEST [21], by spraying TiC-Ti-Al and TiB2-Ti-Al coatings, the wear resistance of die steel was increased more than five times [22]. These studies aimed to prepare a single functional material coating on the substrate, and the research on the preparation methods of composite functional coatings is very limited.
In this study, EEST was used to fabricate Fe/Cu composite coatings with different composite schemes on a 45 steel substrate by changing the spraying sequence and spraying time of the spraying materials [23]. In the composite coating, hard and soft metal materials are fused with each other. When the coating surface is polished, the composite coating surface with uniform distribution of soft and hard metals can be obtained. The purpose of this study was to compare and analyze the mechanical properties, microstructures, and tribological properties of coatings with different composite schemes, and to determine the effects of the spraying sequence and spraying time on the wear resistance and self-lubricating properties of the coatings.
2. Preparation of the Composite Coating
2.1. Electro-Explosive Spraying Equipment
The experimental setup of EEST is shown in Figure 1. The spraying equipment mainly consisted of charging equipment, a storage capacitor bank, a pulse discharge device, and an electro-explosive platform. The highest energy storage voltage of the device was 50 kV; the capacitance of the storage capacitor bank was 112 μF.
2.2. Materials and Parameters
The materials for spraying were relatively economical metal wires for industrial use, including molybdenum wire (Mo with a purity of 99.9%); 80# high-carbon steel wire (80#HCS) with a nominal composition (wt.%) of 0.85% C, 0.37% Si, 0.8% Mn, 0.25% Cr, 0.3% Ni and Fe in balance; and Albronze wire (S215) with the following chemical composition (wt.%): 8.5–11% Al, 0.5–1.5% Fe and Cu in balance. First, Mo was sprayed on the substrate as a bonding layer, and then a functional coating composed of 80# and S215 was sprayed on the bonding layer. Mo has a high melting point and is commonly used as a bonding material for composite coatings [16]; S215 has high thermal conductivity, wear reduction, and fatigue resistance [23]; 80# is a tool steel with high hardness and strength, and it is a commonly used as wear-resistant material [24].
The length of the wire was 140 mm and the diameter was 1.5 mm. The distance from the metal wire to the sprayed surface of the sample was 30 mm. The best voltage for the spraying of each material was obtained from the preliminary experiments and is shown in Table 1.
2.3. Design and Preparation of Composite Coatings
According to the experimental experience, the spreading mode of droplets formed by EEST has a correlation with the spraying voltage [25]. For the same material, the higher the voltage, the smaller the diameter of the droplets, the smaller the spreading area of the droplets, and the faster the cooling rate of the droplets, which can make the coating thinner. In other words, the spraying voltage can be controlled to change the spreading shape (area, thickness, and microhardness, etc.) of the droplets during each spraying [26]. In this study, the unique spreading mode of the droplets of EEST was applied to obtain multi-layer composite coatings with a staggered space structure by changing the spraying sequence and spraying time of the materials under the optimal voltage [23].
The composite coatings were prepared as follows. All spraying materials were sprayed one by one, only one wire could be sprayed at a time. First, we sprayed Mo five times on the substrate to form a bonding coating, and then a functional coating was prepared. The functional coating was composed of HCS and Albronze. According to the different spraying sequences and spraying times of the functional materials, three types of composite coatings were prepared. The preparation scheme of the composite coatings is shown in Table 2. As shown in Table 2, in this study, P1, P2, and P3 represent different spraying schemes, respectively. From the substrate to the surface of the coating, the spraying sequence of P1 was P1 = (Mo + Mo + Mo + Mo + Mo) + (80# + 80# + 80# + S215) × 7, in which (Mo + Mo + Mo + Mo + Mo) was the bonding layer, and (80# + 80# + 80# + S215) × 7 was the functional coating. The spraying sequence of P2 was P2 = (Mo + Mo + Mo + Mo + Mo) + (80# + 80# + S215 + S215) × 7. The spraying sequence of P3 was P3 = (Mo + Mo + Mo + Mo + Mo) + (80# + S215 + S215 + S215) × 7. In each scheme, 7 groups of functional coatings were sprayed, and the spraying was performed 33 times in all cases.
According to the experimental requirements, two types of 45 steel samples were prepared: (1) a round sample with a size of φ 25.4 mm × 7 mm, used for morphology analysis, microhardness detection, and bonding strength tests; (2) ring-shaped samples with outer diameter 31.5 mm, inner diameter 15.5 mm, and thickness 10 mm, used for friction and wear tests. Figure 2 displays the relative positions of the metal wire and the sample.
After the samples were coated, they needed to be treated before being tested.
For the observation of the coating’s cross-section, the tested specimens were prepared by first cutting the coated round samples into small pieces, cleaning them with acetone, mounting and fixing them, and polishing them, followed by etching the cross-section with 4% nitric acid alcohol solution for 4 s, and then using absolute ethanol to rinse them immediately and drying them.
For the observation of the coating surface, the tested samples were prepared by first cleaning the sprayed samples with acetone, and then mounting and fixing them, and finally polishing them.
The pretreatment method of the specimens for the bonding strength test was to sandblast all the surfaces of the specimens. The specimens needed to be ground and then polished before testing the hardness.
The pretreatment of the specimens for the friction and wear test was to grind and polish the surface firstly, and then wash it with acetone. The coating surface’s average roughness after polishing was 0.3–0.5 μm.
Figure 3 displays the prepared samples.
3. Characterization of Coatings
The coating’s thickness, the morphology of the cross-section, and the elemental distribution were detected by scanning electron microscopy (SEM, BCPCAS4800, Hitachi, Tokyo, Japan) and energy-dispersive spectrometer (EDS, Oxford X-Max 50, High Wycombe, Oxford, UK).
The coating’s surface was inspected with a 3D digital microscope (KEYENCE, VR-6000, KEYENCE, Tokyo, Japan) for the coating surface’s porosity and the components’ distribution law.
Grains of the composite coatings were analyzed by electron-backscattered diffraction (EBSD, JSM-7900F, JEOL, Tokyo, Japan). The samples were vibrated and polished for 6 h with a silica suspension with a particle size of 50 nm.
For the bonding strength testing, a computer-controlled electronic universal testing machine (WDW-E100D, Chenxin, Jinan, China) was used via the tensile method. Four specimens were tested simultaneously every time. The adhesive used for the bonding strength test was FM-1000 adhesive; the loading speed was 0.001 mm/min. The bonding strength was calculated as the average of four values.
The Vickers microhardness of the composite coating’s surface was detected by a digital micro Vickers hardness tester (401MVD, Wolpert Wilson, Norwood, IL, USA) at a load of 200 g. Seven points were selected in the area of HCS and Albronze on the surface of the coating, and then average values were determined.
The coatings’ friction and wear characteristics were tested by a universal friction and wear testing machine (MMW-1, Kesheng, Jinan, China). The dry friction test of the coating was carried out by means of the small face-face contact method. The counterpart was quenched 45 steel in a disc shape with a circular friction surface on it, and the microhardness was 600 HV0.2. The applied loads were 10 N, 20 N, 30 N, 40 N, 50 N, 60 N, 70 N, and 100 N; the relative sliding speed for counterparts was 60 r/min, and the total time was 4000 s. The wear morphologies were detected with a 3D digital microscope. The wear mass of specimens was measured by an electronic analytical balance. Five sets of tests were carried out for each coating under each load, and the average value was used as an index to test the wear resistance and self-lubricity of the coating.
4. Results and Discussion
4.1. Cross-Sectional Morphology of the Coating
Thickness in five different locations was detected for every sample, as shown in Table 3. The cross-sectional images are shown in Figure 4.
It can be seen from Table 3 that the thickness of the three coatings is similar. The average thickness values of P1, P2, and P3 are 225.2 μm, 227.8 μm, and 226 μm, respectively. The coefficients of variation of the thicknesses of P1, P2, and P3 are 0.0324, 0.0281, and 0.0323, respectively. This is because the size of the metal droplets in EEST is uniform, and the thickness error of a single spraying is small. The cross-sectional morphology of the coating (Figure 4b) shows that there is a wavy layered structure inside the composite coating, and there is no obvious gap inside the coating. The substrate/bonding layer, bonding layer/HCS layer, and HCS layer/Abronze layer are closely bonded [23].
An EDS line scan was performed on the fusion zone of different materials on the cross-sections of the three composite coatings. Because the electrochemical parameters of the equipment were the same when the coatings of different schemes were prepared, the atomic diffusion laws of the fusion zones of different materials in each coating were the same. As shown in Figure 5 and Figure 6, the cross-sectional image of P2 was studied. Figure 5 is the EDS line scan for the fusion zone of the bonding layer/substrate. It can be seen from Figure 5 that there is obvious atomic diffusion between the bonding layer (Mo) and the substrate (45 steel), and the mutual penetration depth is greater than 1 μm. Figure 6 shows the EDS line scan of the fusion zone of the HCS layer/Abronze layer in the functional coating, which illustrates that the mutual penetration depth of the two materials is around 2 μm. The same penetration also be detected between the bonding layer and the functional coating. It shows that there is metallurgical bonding in the fusion zones of different materials inside the composite coating fabricated by EEST, which can enhance the coating’s bonding strength.
4.2. Surface Morphology of the Coating
Figure 7 displays the polished surface morphologies of P1, P2, and P3 detected by the 3D digital microscope. In Figure 7a,c,e, the gray area is HCS and the yellow area is Abronze. The area ratios of HCS and porosities in different schemes of coatings could be calculated, as shown in Table 4.
Combining Figure 7 with Table 4, it can be seen that the area ratio of HCS on any plane inside the coating is very close to the value of the coating design. The ratio of the number of spraying times of HCS and Albronze in P1 is 3:1, the theoretical ratio of the HCS area is 75%, and the actual value is 67.5%. The ratio of the number of spraying times of HCS and Albronze in P2 is 2:2, the theoretical ratio of the HCS area is 50%, and the actual value is 49.8%. The ratio of the number of spraying times of HCS and Albronze in P3 is 1:3, the theoretical ratio of the HCS area is 25%, and the actual value is 22.6%. This shows that the area ratios of different materials in the composite coating fabricated by EEST can be controlled by changing the spraying times and spraying sequences of the spraying materials.
Combining the coating’s cross-sectional morphology in Figure 4 and the coatings’ surface morphologies in Figure 7, it can be inferred that the HCS and Abronze components in the composite coatings are interwoven and staggered in space. This composite spatial structure is able to make full use of the advantages of the two spraying materials in terms of their properties. When the composite coating is subjected to an external load, for the coating, the hard HCS can play a supporting role, increase the wear resistance and bearing capacity, and prevent the soft Abronze from being over-extruded to damage the coating [27]. At the same time, the soft Abronze can absorb external impact forces. When the coating is subjected to a large force, the soft metal deforms and part of the material is released into the friction interface for lubrication and to reduce the friction, and the soft metal is capable of containing fine hard particles entering the friction interface from outside to avoid scratching the friction surface, which can improve the coatings’ working environment.
Figure 8 shows the EDS mapping of the fusion zone of HCS/ Abronze on the etched coating surface [28]. The left part of the figure is the Abronze area, and the right part is the HCS area. It can be seen from Figure 8a,b that the HCS becomes very uniform and contains fine dendrites after EEST, showing that EEST can play a role in fine grain strengthening. It can be seen from Figure 8c,d that after etching, the Abronze component under the HCS area is also partially exposed, and the elements are uniformly distributed, indicating that the HCS and Abronze components are well integrated and superimposed, and there is no obvious gap.
Figure 9 displays the coating surface’s EDS spectra obtained through the element analysis. As can be seen, the content of O element in the coating is 0.9%, indicating that the oxide content is low. EEST is beneficial to protect the metal droplets from being oxidized. Figure 8e,f show that there is a small amount of oxide of aluminum in the Abronze area and a small amount of iron oxides in the HCS area. The reason for the formation of oxides is that when the droplets solidify after the explosion shock wave, the surrounding air returns to the surface of the coating. At this time, because the droplet cooling rate is very fast, only a few oxides are formed [26].
4.3. Bonding Strength of the Composite Coatings
Bonding strength is one of the indicators used for coating quality judgment. Table 5 displays the bonding strength of the three types of composite coatings. Figure 10 shows the coatings’ fracture surfaces.
It can be seen from Table 5 that the composite coatings have high bonding strength, and the average values of P1, P2, and P3 are 55.3 MPa, 53.8 MPa, and 43.7 MPa, respectively. The coefficients of variation of the bonding strength of P1, P2, and P3 are 0.033, 0.028, and 0.020, respectively. Compared with coatings prepared by low-pressure cold spray (LPCS) technology, in which the bonding strength was approximately 29–36 MPa [29], the bonding strength of the coatings fabricated by EEST is higher. Figure 10 shows that fracture surface of each type of coating is flat, without an obvious tear-off area, indicating that the coating has good uniformity and compactness. By analyzing the composition of the fracture surface, it is found that the main component of P1 and P2 is Mo, and those of P3 are Mo, HCS, and Abronze, indicating that (1) the fracture position of P1 and P2 is inside the bonding layer, and the fracture position of P3 is the fusion zone of the bonding layer/functional layer; (2) when spraying the first group of functional layers in P3 (Fe/Cu = 1/3), HCS sprayed once cannot completely cover the entire bonding layer, so, in the fusion zone of the bonding layer/functional layer, some areas show Fe/Mo bonding and some areas show Cu/Mo bonding. Because Mo and copper are not fused with each other, it is difficult for atoms to penetrate, resulting in low local bonding strength, which affects the overall bonding strength, so the values of P1 and P2 are very close, and the value of P3 is 20–25% lower than those of P1 and P2. In order to enhance the coatings’ bonding strength, when spraying the first group of functional coatings, HCS should be sprayed at least twice as the transition layer to separate Mo and copper alloys.
4.4. Hardness of the Composite Coatings
The hardness of the coating determines the wear resistance of the coating [30,31]. Figure 11 shows the average microhardness of the surface of the composite coating. As shown in Figure 11, from P1 to P3, the value of the same component decreases successively, from 647 HV0.2 to 550 HV0.2 for the HCS component and from 300 HV0.2 to 188 HV0.2 for the Abronze component. The reason is that HCS and Abronze in the composite coating are intertwined and fused in space, and the Abronze component is attached to the support structure formed by HCS.
In P1, the content of HCS is the highest and that of Abronze is the lowest. In the microhardness test, the indenter penetrates the Abronze layer, and the HCS under the detection point bears part of the pressure. Therefore, the microhardness of the Abronze component in P1 is the highest among the three types of coatings. In P2, the thicknesses of the HCS layer and Abronze layer are between the values in P1 and P3; the indenter does not penetrate the HCS layer and penetrates the Abronze layer slightly, so the microhardness of the HCS component is very close to that in P1, and the microhardness of the Abronze component is slightly lower than that in P1. The content of Abronze in P3 is the highest, so the thickness of the Abronze layer is the highest, while the thickness of the HCS layer is the lowest, resulting in the hardness of the HCS component and Abronze component being the lowest among the three types of coatings. The thickness difference in the HCS layer and Abronze layer in different coatings results in different microhardness values, which is in line with the expected hardness distribution in the experimental design.
According to the solidification theory, the crystallization parameter G/R (R is the solidification rate and G is the temperature gradient) determines the morphology of the solidification structure. In the process of EEST, the temperature of metal droplets can reach 10,000 °C, and the cooling rate can reach up to 107 °C/s [32]. The rapid cooling of metal droplets greatly inhibits the grain growth, forming amorphous, microcrystalline, and nanocrystalline structures; the effect of grain refinement is achieved, which helps to enhance the coating’s microhardness and wear resistance [33].
Figure 12 shows the electron-backscattered diffraction (EBSD) images of the HCS and the Abronze in the composite coating (P2). Figure 12a,b show that the diameters of many HCS grains are approximately 1 μm, and the grains consist of ferrite and austenite structures; the grains with a grain angle of 15–180° account for 86% of the total grains, which is consistent with the law that crystals grow upwards from the inside of the coating. There are obvious carbonization precipitates at the grain boundary, which were found to be cementite by testing [33]. The grain refinement is obvious. The average microhardness values of the composite coatings (P1, P2, P3) are 3.2, 3.1, and 2.72 times the microhardness of the raw material (annealed HCS wire, 202 HV0.2), respectively. The average microhardness values of the composite coatings (P1, P2, P3) are 3.24 times, 3.13 times, and 2.75 times the microhardness of the substrate (45 steel, 200 HV0.2), respectively. The maximum value is 729.9 HV0.2.
Figure 12c,d show that the grain size of the Abronze area is also obviously refined, reaching the micron level [23]. There is a large number of micron crystal structures and twin structures. The crystals in the yellow-lined areas in the figure are twin copper crystals. These structures can increase the coating’s hardness, strength, and wear resistance.
The cooling rate of metal droplets formed by EEST is very fast. The higher the subcooling, the faster the nucleation rate, and the lower the temperature of newly formed grains, which can decrease the diffusion rate of atoms and prevent full grain growth, so as to refine the grains [34]. Compared with LPCS technology, EEST can provide a higher deformation temperature for the spraying of materials, so it can achieve a better fine grain strengthening effect. The experiment demonstrated that the microhardness of the coating fabricated by LPCS had no significant change compared with the raw materials. For example, the microhardness of Zn-Ni-Al2O3 composite coatings prepared by LPCS is 120HV0.3 [29], which is lower than the value when fabricated by EEST.
4.5. Friction and Wear Properties of the Composite Coatings
Figure 13 displays the variation in the friction coefficient with time (P1, 60 N). Figure 14 shows the curves of the average friction coefficient and average wear mass of the three composite coatings at different loads.
Figure 13 displays the variation in the friction coefficient with time. The whole wear test consisted of three stages: the initial stage, friction coefficient fluctuation stage, and stable wear stage. In the initial stage, the friction coefficient rises rapidly, the contact of the specimen and the counterpart is actually the contact of asperities, the contact area is small, and the compressive stress is large. The rough coating surface gradually becomes smooth because of the plowing of the asperities in the initial stage and the friction coefficient fluctuation stage [34]. When the asperities are cut off gradually, the coating surface is smoothed, and the friction pairs enter the stable wear stage. At this stage, the relative contact area of the specimen and the counterpart becomes larger and the wear resistance becomes larger. The counterpart begins to contact the soft metal in the coating. Under the action of the load, the soft metal Abronze gradually enters the friction pairs for lubrication [35]. For the same coating, the greater the load, the more soft metal Abronze entering the friction pairs, and the self-lubricating performance of the coating is better; meanwhile, the friction coefficient is lower, which corresponds to the changing trend that the friction coefficient decreases with the increase in load, as shown in Figure 14a. Under the same load, the higher the ratio of Abronze in the coating, the more soft metal entering the friction pairs, and the lubrication performance is better and the friction coefficient is lower, which is also demonstrated in Figure 14a, where P1 has the highest friction coefficient and P3 has the lowest value.
During the test, the wear form in the initial stage was mainly abrasive wear. As the test progressed, the friction surface was heated up, and the abrasive particles were oxidized, producing tiny metal oxide particles that filled in the friction pairs. There were brown–black substances and scaly yellow substances attached to the coating surface. Through detection and analysis, it was determined that the brown–black substances were Fe2O3 and Fe3O4, and the yellow flakes were Abronze. In the friction coefficient fluctuation stage and stable wear stage, there was both adhesive wear and abrasive wear [36,37]. The mass loss of the coating was mainly due to the hard HCS asperities on the coating surface and Abronze extruded for lubrication.
The average wear mass of the composite coatings at different loads is presented in Figure 14b. As indicated, when the load is 40N, the wear mass values of P1, P2, and P3 are 0.65 mg, 1.35 mg, and 2.2 mg, respectively. The values are consistent with the microhardness (Figure 11) because the wear resistance is directly related to the material hardness [38,39]. In addition, as shown in Figure 14, with the increase in HCS content and the decrease in Abronze content, the friction coefficient of the composite coating increases and the wear mass decreases significantly. Composite coating P1 gives the lowest wear mass, and its mass loss is only 48% of the value of P2 and 30% of the value of P3 when the load is 40 N.
Figure 15 demonstrates the worn surface morphologies of the composite coatings (60 N), and the 3D worn surface morphologies are displayed in Figure 16, which can help to demonstrate the wear mechanism of the composite coatings.
As illustrated in Figure 15a and Figure 16a, there are fine and uniform circular scratches on the surface of coating P1, which are typical abrasive wear traces; the maximum wear depth is 6.91 μm, and the average friction coefficient is 0.6772. Soft Abronze rarely participates in the movement of friction pairs. Friction reduction mainly depends on metallic oxide particles between friction pairs, abrasive wear is the main wear mechanism, and there is adhesive wear in a few areas, so the friction coefficient is the highest.
Compared with P1, P2 has fewer scratches, the maximum wear depth is 14.69 μm, and some areas have Abronze extrusion marks and red oxide particles attached, indicating that the soft Abronze participates in friction and plays a self-lubricating role. Adhesive wear and abrasive wear are the main wear mechanisms, and the area of adhesive wear is larger than that in P1.
In P3, deep scratches appear on the coating surface, and the maximum wear depth is 20.58 μm, while the average friction coefficient is 0.2894. At the edge of the scratch, more Abronze is extruded to the coating surface, so the self-lubricating effect is the best, the value of wear mass is the highest, and the friction coefficient is the lowest. The soft metal mainly plays the role of reducing friction, and the wear forms are mainly abrasive wear in the initial stage and adhesive wear in the friction coefficient fluctuation stage and stable wear stage.
5. Conclusions
In the present study, Fe/Cu multi-layer composite coatings with different HCS and Abronze content were successfully fabricated on a 45 steel substrate by EEST. The main conclusions are as follows.
The HCS and Abronze components in the composite coatings were interwoven and staggered in space. This spatial structure is able to make use of the advantages of the different spraying materials. The area ratios of HCS and Abronze on the composite coating surface can be controlled according to the experimental requirements.
According to the EDS line scan, there was metallurgical bonding between the substrate/bonding layer, bonding layer/functional coating, and HCS layer/Abronze layer in the functional coatings; the mutual penetration depth was approximately 2 μm, which can enhance the coating’s bonding strength. The composite coatings had high bonding strength, with the maximum value of 55.25 MPa.
The EDS mapping and the EBSD images revealed that EEST can refine the grains of spraying materials, which can increase the hardness of the coating. The diameters of HCS and Abronze grains in the coatings could reach the micron level. The maximum microhardness of the composite coatings was 729.9 HV0.2. The average microhardness values (P1, P2, P3) were 3.2 times, 3.1 times, and 2.72 times that of the raw material, respectively. The EDS showed that the O element content in the coatings was low, with a value of 4.75%, indicating that EEST is beneficial to protect the metal droplets from being oxidized.
The friction coefficient decreased with the increase in load. Under the same load, the higher the ratio of Abronze in the coating, the lower the friction coefficient; the friction coefficient of P1 was the highest and that of P3 was the lowest, and P1 had the lowest wear mass while P3 had the largest wear mass.
The wear morphologies of the composite coatings showed that P1 had the best wear resistance, P3 had the best self-lubrication, P2 had better wear performance and better self-lubrication, and abrasive wear and adhesive wear were the main wear mechanisms.
Author Contributions
Conceptualization, Q.S.; methodology, K.H.; software, Y.L.; validation, K.H., Q.S. and Y.L.; formal analysis, Y.L.; investigation, K.H.; resources, Q.S.; data curation, K.H.; writing—original draft preparation, K.H., Y.J.; writing—review and editing, Y.J.; supervision, P.C.; project administration, Q.S. All authors have read and agreed to the published version of the manuscript.
Funding
This research received no external funding.
Institutional Review Board Statement
This study did not require ethical approval.
Informed Consent Statement
Not applicable.
Data Availability Statement
Not applicable.
Conflicts of Interest
The authors declare that they have no conflict of interest.
References
- Hui, W.; Wang, H. Fabrication of self-lubricating coating on aluminum and its frictional behavior. Appl. Surf. Sci. 2007, 253, 4386–4389. [Google Scholar]
- Caicedo, J.C.; Zambrano, O.A.; Aguilar, Y. Tribological study of the TiCN/TiNbNC system: From laboratory results to real industrial application. Surf. Coat. Technol. 2018, 342, 146–158. [Google Scholar] [CrossRef]
- Sivakumar, G.; Dusane, R.; Shrikant, V. A novel approach to process phase pure α-Al2O3 coatings by solution precursor plasma spraying. J. Eur. Ceram. Soc. 2013, 33, 2823–2829. [Google Scholar] [CrossRef]
- Todor, V.; Talha, B.; Manuel, E.; Albano, C. Synthesis, Microstructural, and Mechano-Tribological Properties of Self-Lubricating W-S-C(H) Thin Films Deposited by Different RF Magnetron Sputtering Procedures. Coatings 2020, 10, 272. [Google Scholar]
- Datta, S.; Das, M.; Balla, V.K.; Bodhak, S.; Murugesan, V.K. Mechanical, wear, corrosion and biological properties of arc deposited titanium nitride coatings. Surf. Coat. Technol. 2018, 344, 214–222. [Google Scholar] [CrossRef]
- Tillmann, W.; Kokalj, D.; Stangier, D. Optimization of the deposition parameters of Ni-20Cr thin films on thermally sprayed Al2O3 for sensor application. Surf. Coat. Technol. 2018, 344, 223–232. [Google Scholar] [CrossRef]
- Zhao, G.; He, Y. Plasma electroplating Ni coating on pure copper sheet—The effects of H2SO4 concentration on the microstructure and mechanical properties. Surf. Coat. Technol. 2012, 206, 4411–4416. [Google Scholar] [CrossRef]
- Li, W.X.; Zhang, K.; Dai, J.F.; Liang, J.; Huo, X.D. Preparation and Tribological Properties of Self-Lubricating Al2O3/Graphite Composite Coating on TA2 Titanium. J. Aeronaut. Mater. 2013, 33, 46–52. [Google Scholar]
- Liu, Y.; Qu, W.; Su, Y. TiC Reinforcement Composite Coating Produced Using Graphite of the Cast Iron by Laser Cladding. Materials 2016, 9, 815. [Google Scholar] [CrossRef]
- Riquelme, A.; Rodrigo, P.; Escalera-Rodriguez, M.D.; Rams, J. Wear Resistance of Aluminum Matrix Composites’ Coatings Added on AA6082 Aluminum Alloy by Laser Cladding. Coatings 2022, 12, 41. [Google Scholar] [CrossRef]
- Li, G.; Zhang, L.; Cai, F.; Yang, Y.; Wang, Q.; Zhang, S. Characterization and corrosion behaviors of Ti N/Ti Al N multilayer coatings by ion source enhanced hybrid arc ion plating. Surf. Coat. Technol. 2019, 366, 355–365. [Google Scholar] [CrossRef]
- Kameneva, A.; Kichigin, V. Corrosion wear and friction behavior of a number of multilayer two-, three- and multicomponent nitride coatings on different substrates, depending on the phase and elemental composition gradient. Adv. Mater. Sci. Eng. 2019, 489, 165–174. [Google Scholar] [CrossRef]
- Vardelle, A.; Moreau, C. Nickolas, A Perspective on Plasma Spray Technology. Plasma Chem. Plasma 2015, 35, 491–509. [Google Scholar] [CrossRef]
- Xian, G.; Xiong, J.; Zhao, H.; Fan, H.; Li, Z.; Du, H. Evaluation of the structure and properties of the hard TiAlN-(TiAlN/CrAlSiN)-TiAlN multiple coatings deposited on different substrate materials. Int. J. Refract. Met. Hard Mater. 2019, 85, 105056. [Google Scholar] [CrossRef]
- Shan, L.; Wang, Y.; Li, J.; Chen, J. Effect of N2 flow rate on microstructure and mechanical properties of PVD CrNx coatings for tribological application in seawater. Surf. Coat. Technol. 2014, 242, 74–82. [Google Scholar] [CrossRef]
- Zhao, S.; Meng, F.; Fan, B.; Dong, Y.; Wang, J.; Qi, X. Evaluation of wear mechanism between TC4 titanium alloys and self-lubricating fabrics. Wear 2023, 512, 204532. [Google Scholar] [CrossRef]
- Wang, J.; Peng, C.; Dai, H.; Lu, F.; Zhao, Z. Synthesis of Zirconium Dioxide Nanoparticles by Electrical Explosion of Zirconium Wire and Characteristics. Rare Metal Mater. Eng. 2019, 48, 2118–2121. [Google Scholar]
- Tamura, H.; Ogura, T.; Nagahama, M.; Tanabe, Y.; Sawaoka, A.B. Spraying of the brittle ceramic zirconium diboride by a wire explosion technique. J. Appl. Phys. 1994, 75, 1789. [Google Scholar] [CrossRef]
- Jin, G.; Xu, B.S.; Wang, H.D.; Li, Q.F.; Wei, S.C. Tribological properties of molybdenum coatings sprayed by electro-thermal explosion directional spraying. Surf. Coat. Technol. 2007, 201, 6678–6680. [Google Scholar] [CrossRef]
- Hou, S.X.; Liu, D.Y.; Li, B.R.; Zhang, N.Q. Microstructure and oxidation resistance of Mo–Si and Mo–Si–Al alloy coatings prepared by electro-thermal explosion ultrahigh speed spraying. Mater. Sci. Eng. A 2009, 518, 108–117. [Google Scholar] [CrossRef]
- Romanov, D.; Moskovskii, S.; Konovalov, S.; Sosnin, K.; Gromov, V.; Ivanov, Y. Improvement of copper alloy properties in electro-explosive spraying of ZnO-Ag coatings resistant to electrical erosion. J. Mater. Res. Technol. 2019, 8, 5515–5523. [Google Scholar] [CrossRef]
- Romanov, D.A. Improving die tooling properties by spraying TiC-Ti-Al and TiB2-Ti-Al electro-explosive coatings. Mater. Res. Express 2020, 7, 045010. [Google Scholar] [CrossRef]
- Huang, K.; Song, Q.; Chen, P.; Liu, Y. Preparation and Performance of Mo/Cu/Fe MultiLayer Composite Coating with Staggered Spatial Structure by Electro-Explosive Spraying Technology. Materials 2022, 15, 3552. [Google Scholar] [CrossRef]
- Yan, W.; Chen, W.; Li, J. Quality Control of High Carbon Steel for Steel Wires. Materials 2019, 12, 846. [Google Scholar] [CrossRef] [PubMed] [Green Version]
- Li, Q.; Song, Q.Z.; Wang, J.Z.; Duo, Y.X. Effect of charging energy on droplet diameters and properties of high-carbon steel coatings sprayed by wire explosion spraying. Surf. Coat. Technol. 2011, 206, 202–207. [Google Scholar] [CrossRef]
- Liu, J.J.; Liu, Z.D. An experimental study on synthesizing TiC–TiB2–Ni composite coating using electro-thermal explosion ultra-high speed spraying method. Mater. Lett. 2010, 64, 684–687. [Google Scholar] [CrossRef]
- Liu, Y.J.; Li, Y.M.; Tan, Y.H.; Huang, B.Y. Apparent Morphologies and Nature of Packet Martensite in High Carbon Steels. J. Iron Steel Res. Int. 2006, 13, 40–46. [Google Scholar] [CrossRef]
- Shi, B.; Huang, S.; Zhu, P.; Xu, C.; Zhang, T. Microstructure and Wear Behaviorof In-Situ NbC Reinforced Composite Coatings. Materials 2020, 13, 3459. [Google Scholar] [CrossRef]
- Bai, Y.; Wang, Z.H.; Li, X.B.; Huang, G.S.; Li, C.X.; Li, Y. Microstructure an Mechanical Properties of Zn-Ni-Al2O3 Composite Coatings. Materials 2018, 11, 853. [Google Scholar] [CrossRef]
- Jia, K.; Fischer, T.E. Microstructure, Mechanical Properties and Wear Resistance of WC/Co Nanocomposites. MRS Proc. 1996, 457, 303. [Google Scholar] [CrossRef]
- Archard, J.F. Contact and Rubbing of Flat Surfaces. J. Appl. Phys. 1953, 24, 981–988. [Google Scholar] [CrossRef]
- Wang, Y.; Chen, Y.; Liu, Z.; Xue, Z.; Yang, G. Surface modifications of Al-based amorphous composite coatings on 7075 Al plate prepared by high-speed electrothermal explosion. Procedia Eng. 2012, 27, 1042–1047. [Google Scholar] [CrossRef]
- Morimoto, T.; Mukaihara, T.; Kusumoto, Y.; Oda, M.; Takeshima, K.; Yatoh, H. Development of Fine-Grained High-Carbon Steel in High Reduction Low Temperature Rolling. Steel Res. Int. 2011, 82, 155–163. [Google Scholar] [CrossRef]
- Zhang, S.L.; Sun, X.J.; Dong, H. Mechanism of Austenite Evolution During Deformation of Ultra-High Carbon Steel. J. Iron Steel Res. Int. 2008, 15, 42–46. [Google Scholar] [CrossRef]
- Cai, F.; Zhang, J.; Wang, J.; Zheng, J.; Wang, Q.; Zhang, S. Improved adhesion and erosion wear performance of Cr Si N/Cr multi-layer coatings on Ti alloy by inserting ductile Cr layers. Tribol. Int. 2021, 153, 106657. [Google Scholar] [CrossRef]
- Hou, S.X.; Liu, D.Y.; Zhao, L.P.; Li, B.; Liu, J.J. An experimental study on synthesizing submicron MoSi2-based coatings using electrothermal explosion ultra-high speed spraying method. Surf. Coat. Technol. 2008, 202, 2917–2921. [Google Scholar]
- Yonekura, D.; Fujita, J.; Miki, K. Fatigue and wear properties of Ti–6Al–4V alloy with Cr/CrN multilayer coating. Surf. Coat. Technol. 2015, 275, 232–238. [Google Scholar] [CrossRef]
- Thankachan, T.; Prakash, K.S. Microstructural, mechanical and tribological behavior of aluminum nitride reinforced copper surface composites fabricated through friction stir processing route. Mater. Sci. Eng. A 2017, 688, 301–308. [Google Scholar] [CrossRef]
- Kong, J.Z.; Li, C.; Sun, X.Y.; Xuan, Y.; Zhai, H.F.; Li, A.D.; Wang, Q.Z.; Zhou, F. Improved tribological properties and corrosion protection of CrN coating by ultrathin composite oxide interlayer. Appl. Surf. Sci. 2021, 541, 148606. [Google Scholar] [CrossRef]
Figure 1.
Photograph of EEST setup.

Figure 2.
Diagram of relative positions of sample and metal wire.
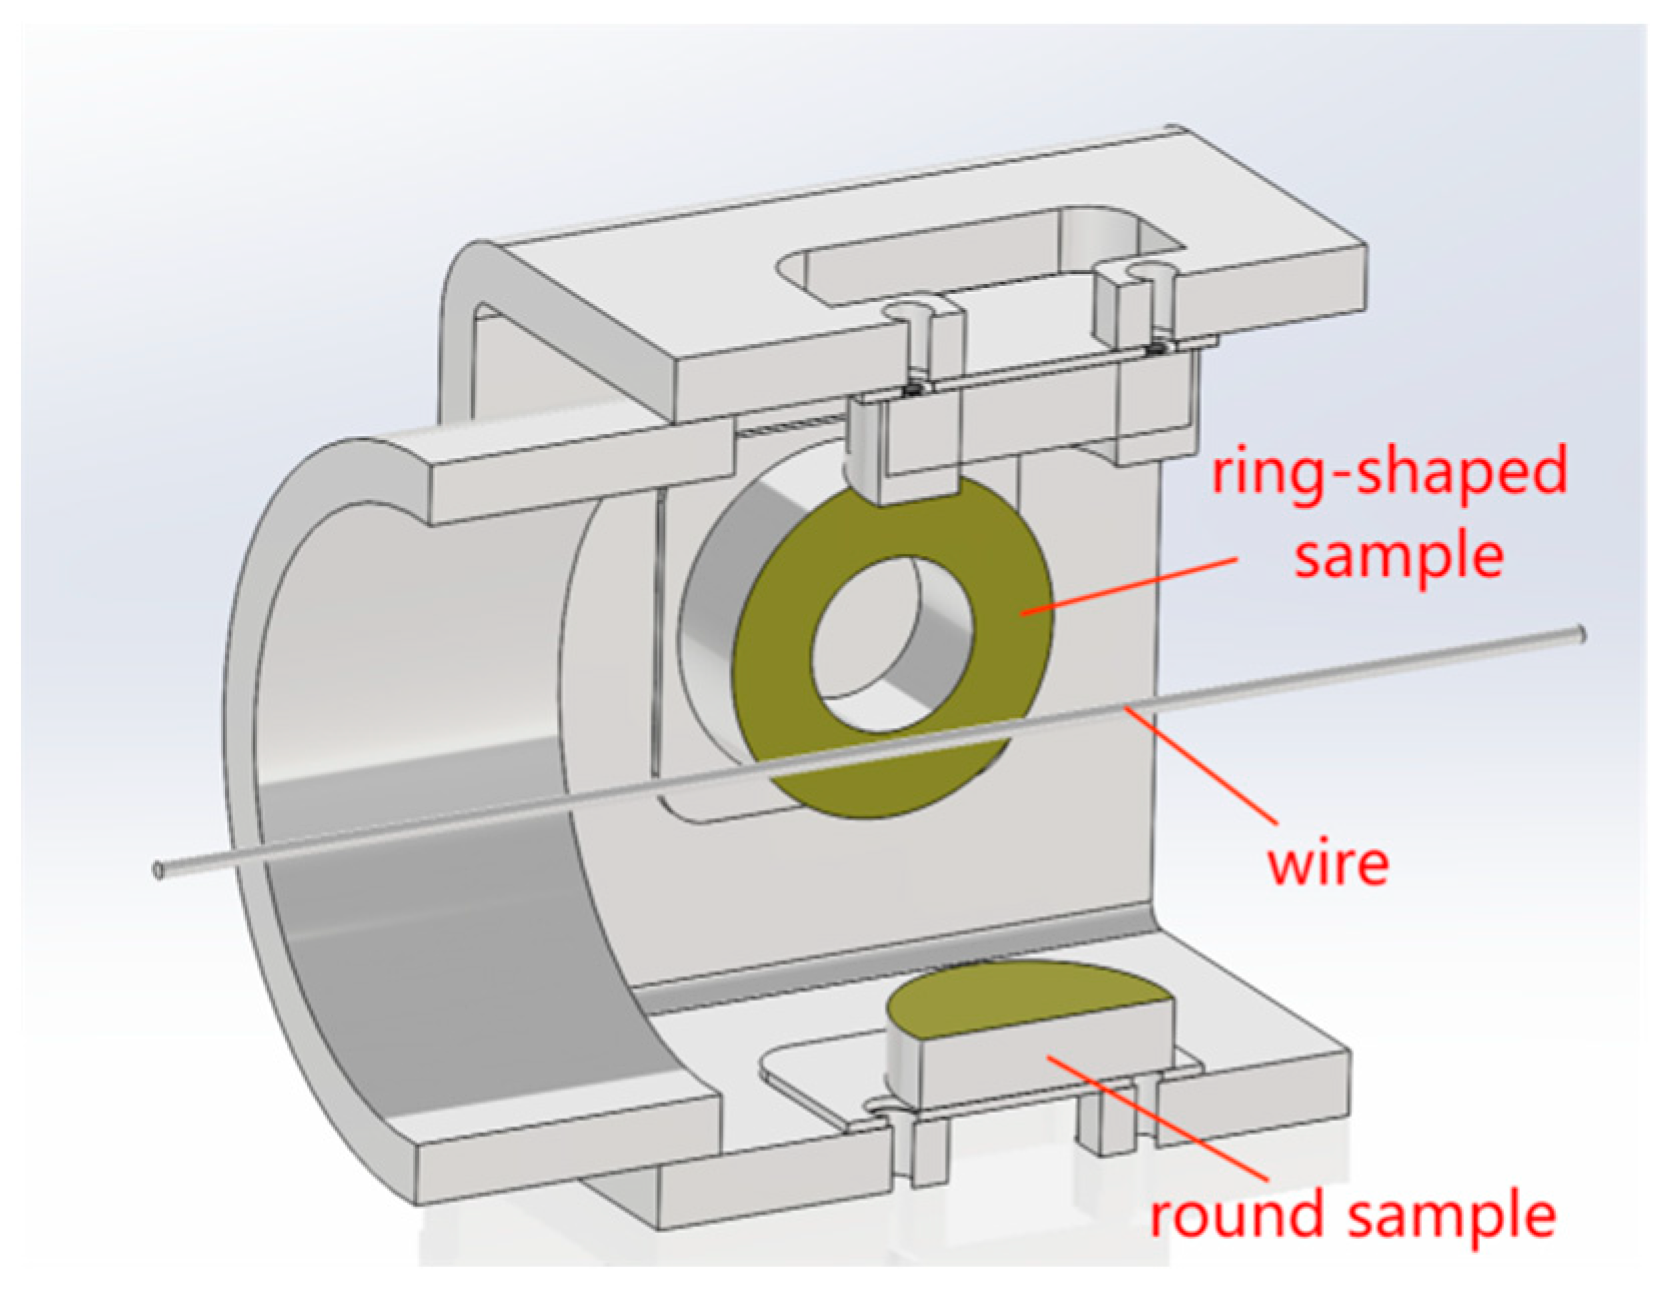
Figure 3.
Two types of prepared samples: (a) round sample; (b) ring-shaped sample.
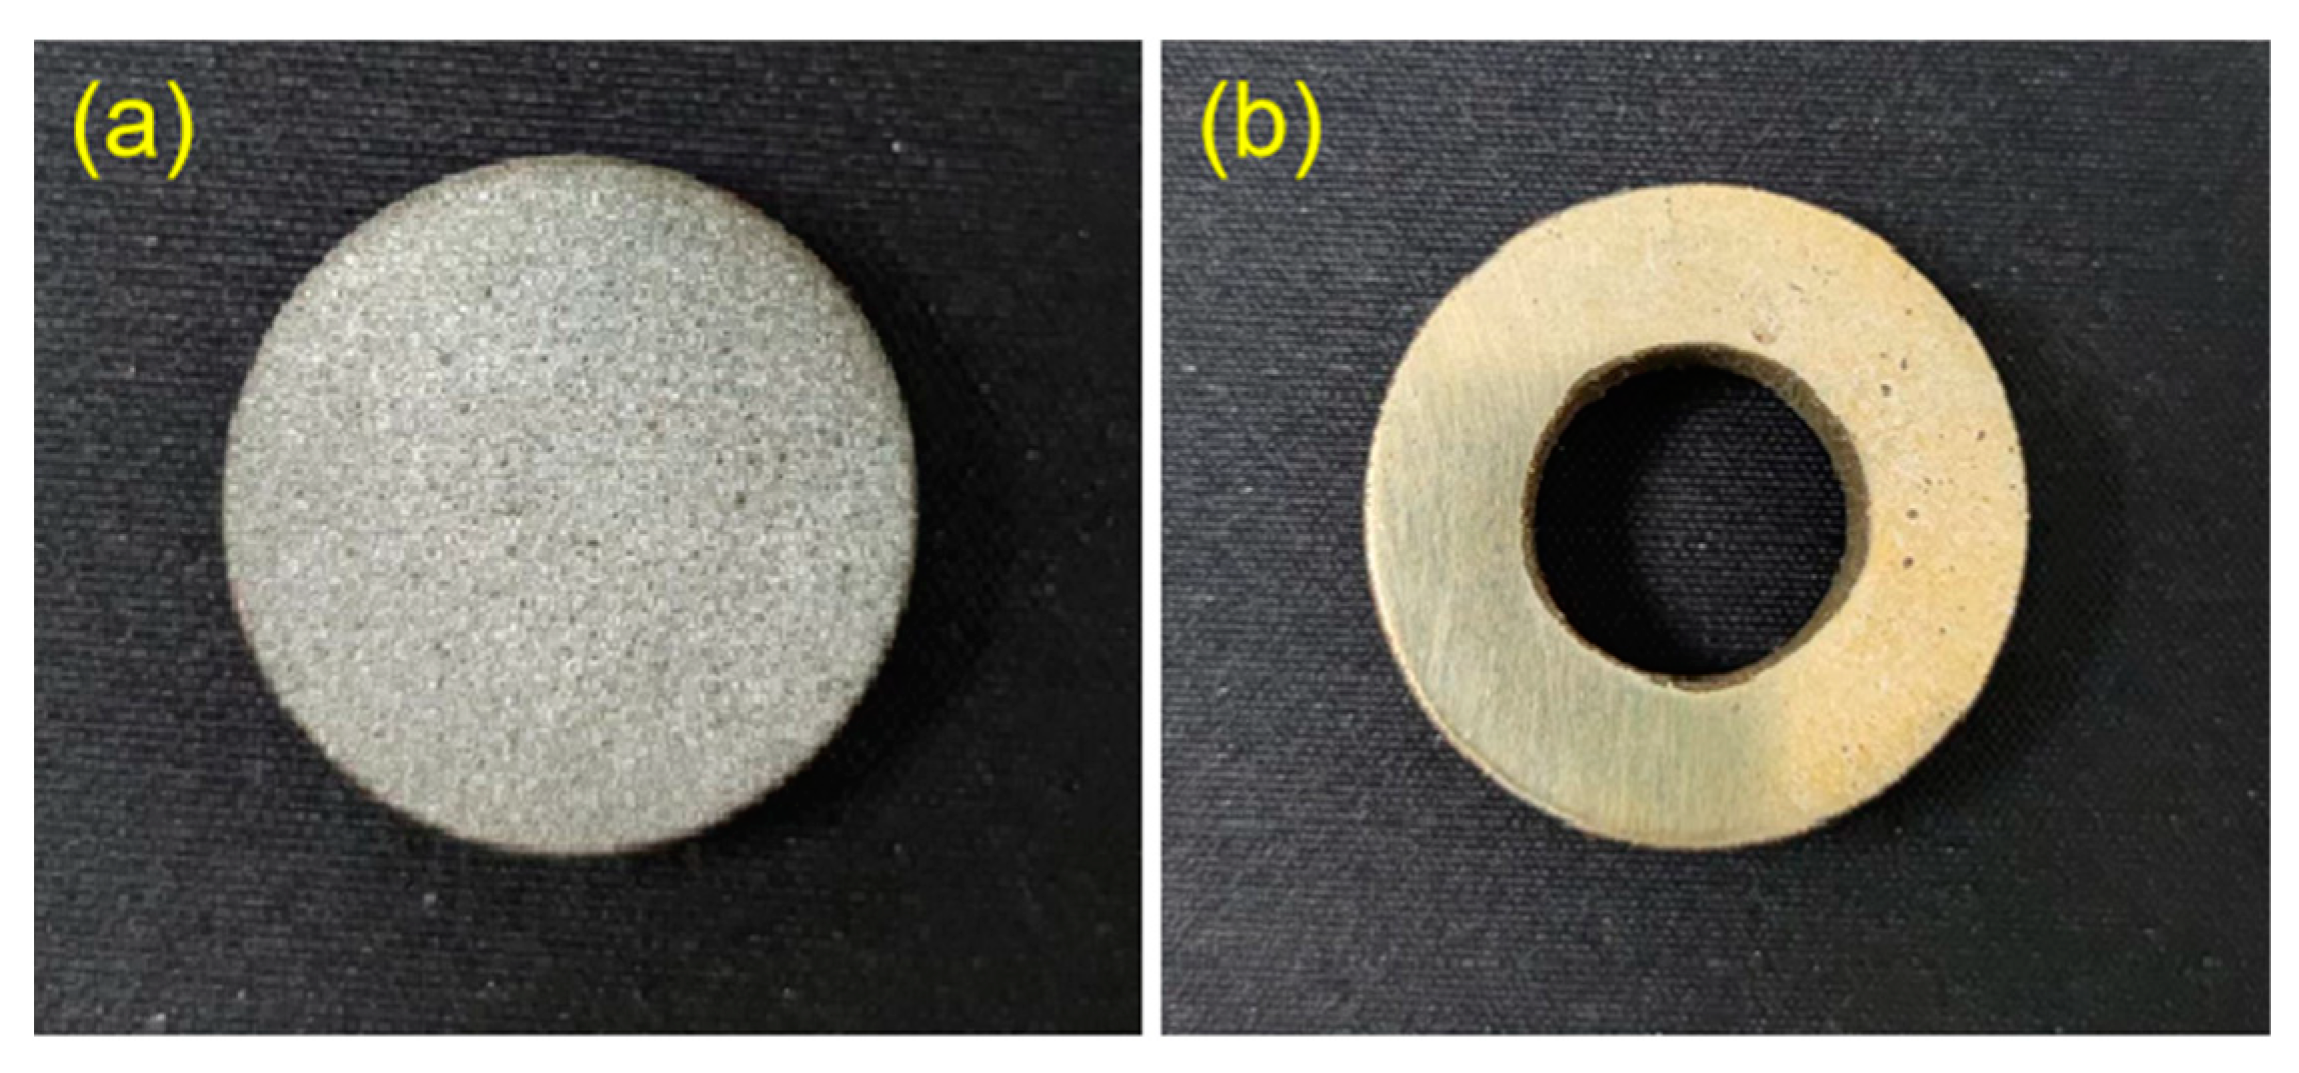
Figure 4.
(a) SEM image of the cross-section of P2; (b) cross-sectional image of P2 (before etching): A—HCS layer; B—Albronze layer; C—Mo layer; D—45 steel substrate.
Figure 4.
(a) SEM image of the cross-section of P2; (b) cross-sectional image of P2 (before etching): A—HCS layer; B—Albronze layer; C—Mo layer; D—45 steel substrate.
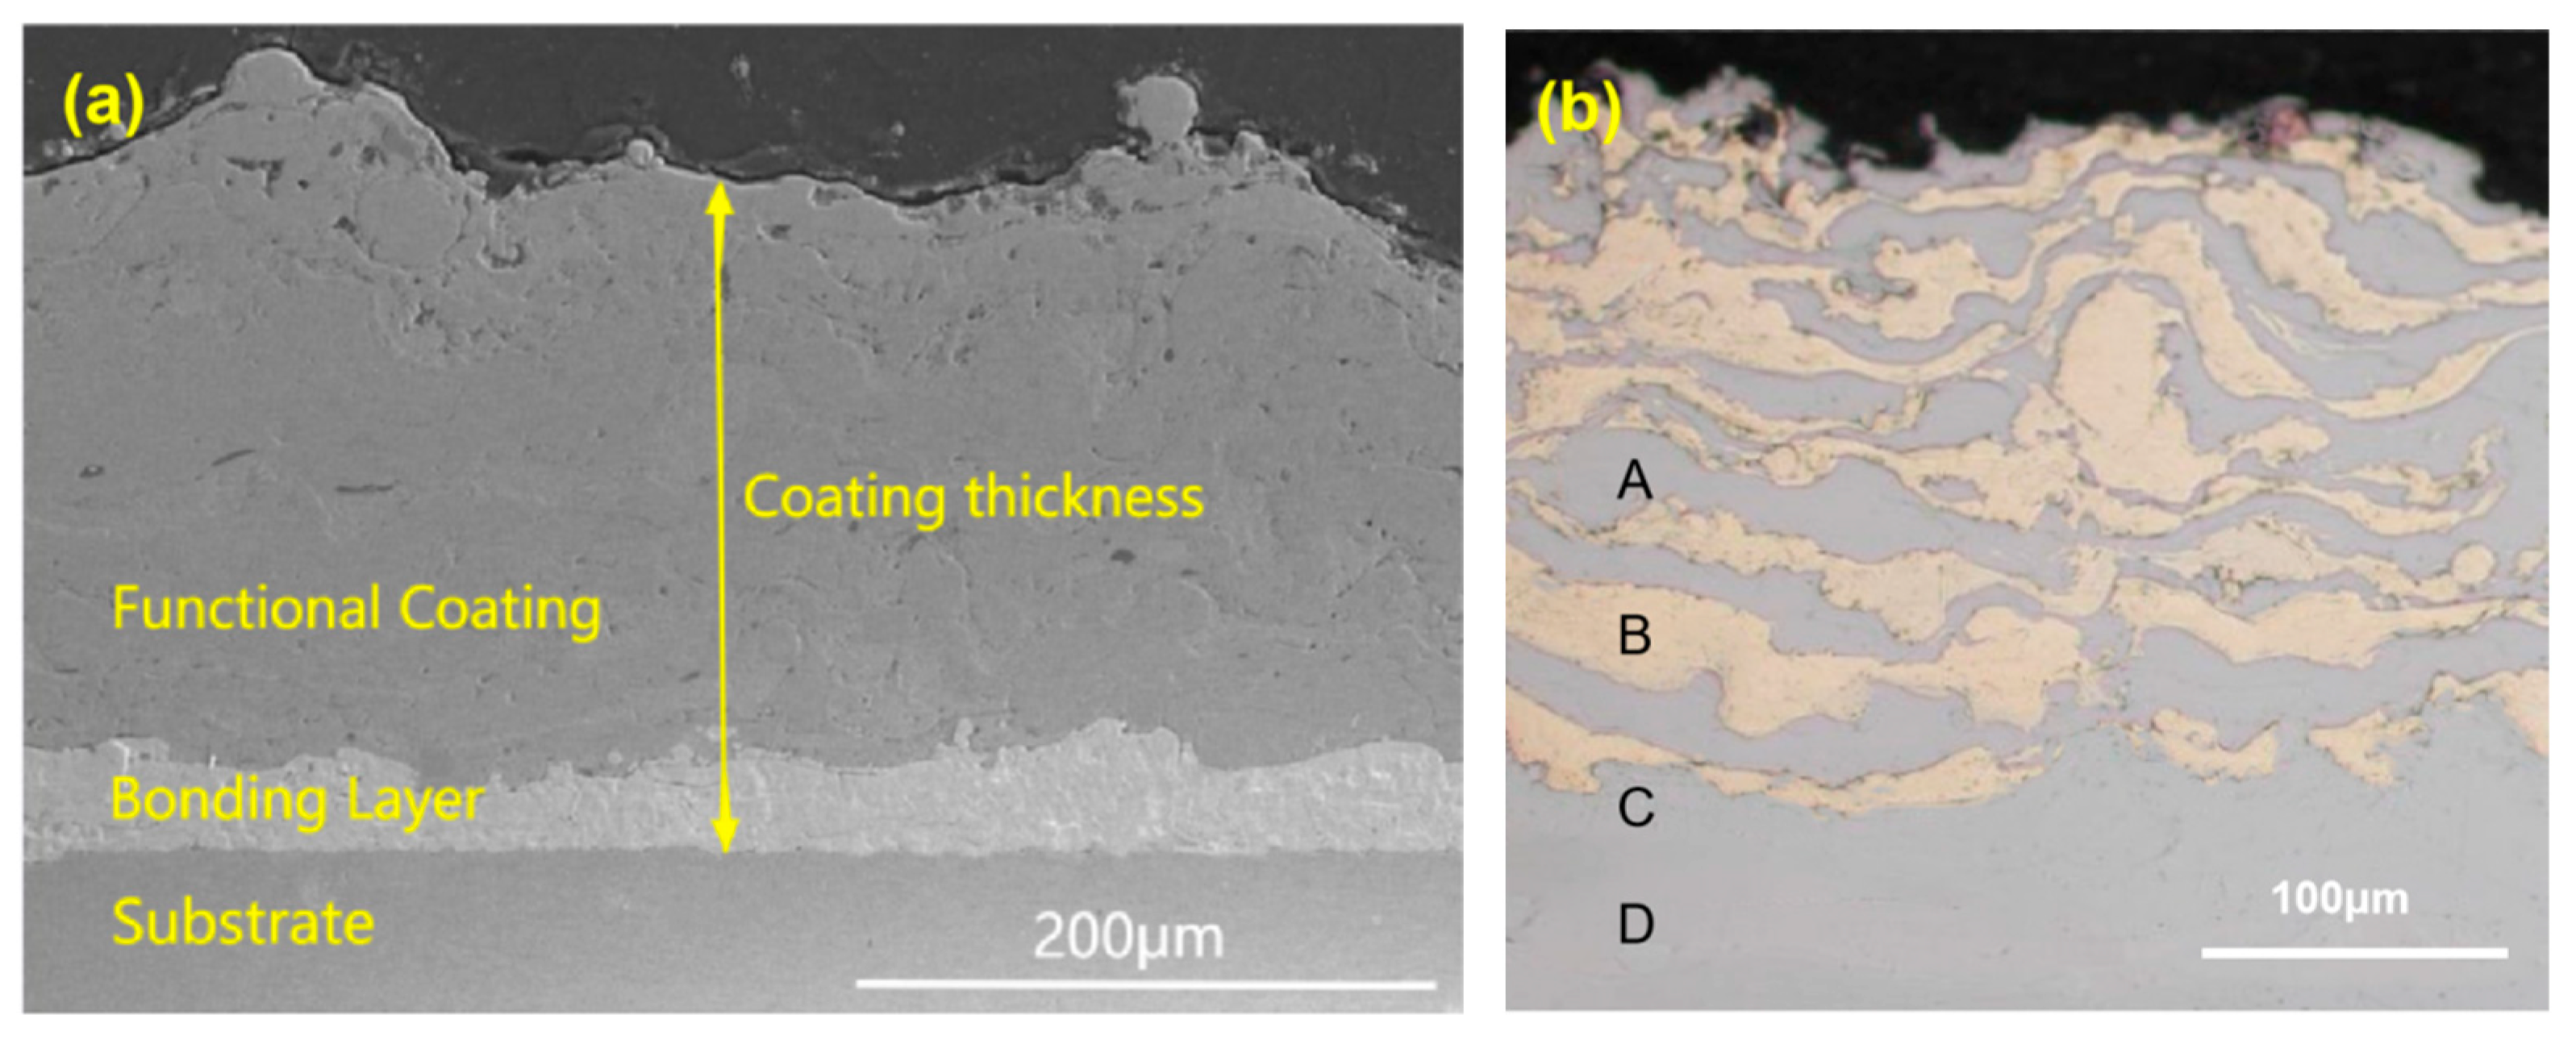
Figure 5.
EDS line scan of substrate/bonding layer fusion zone.
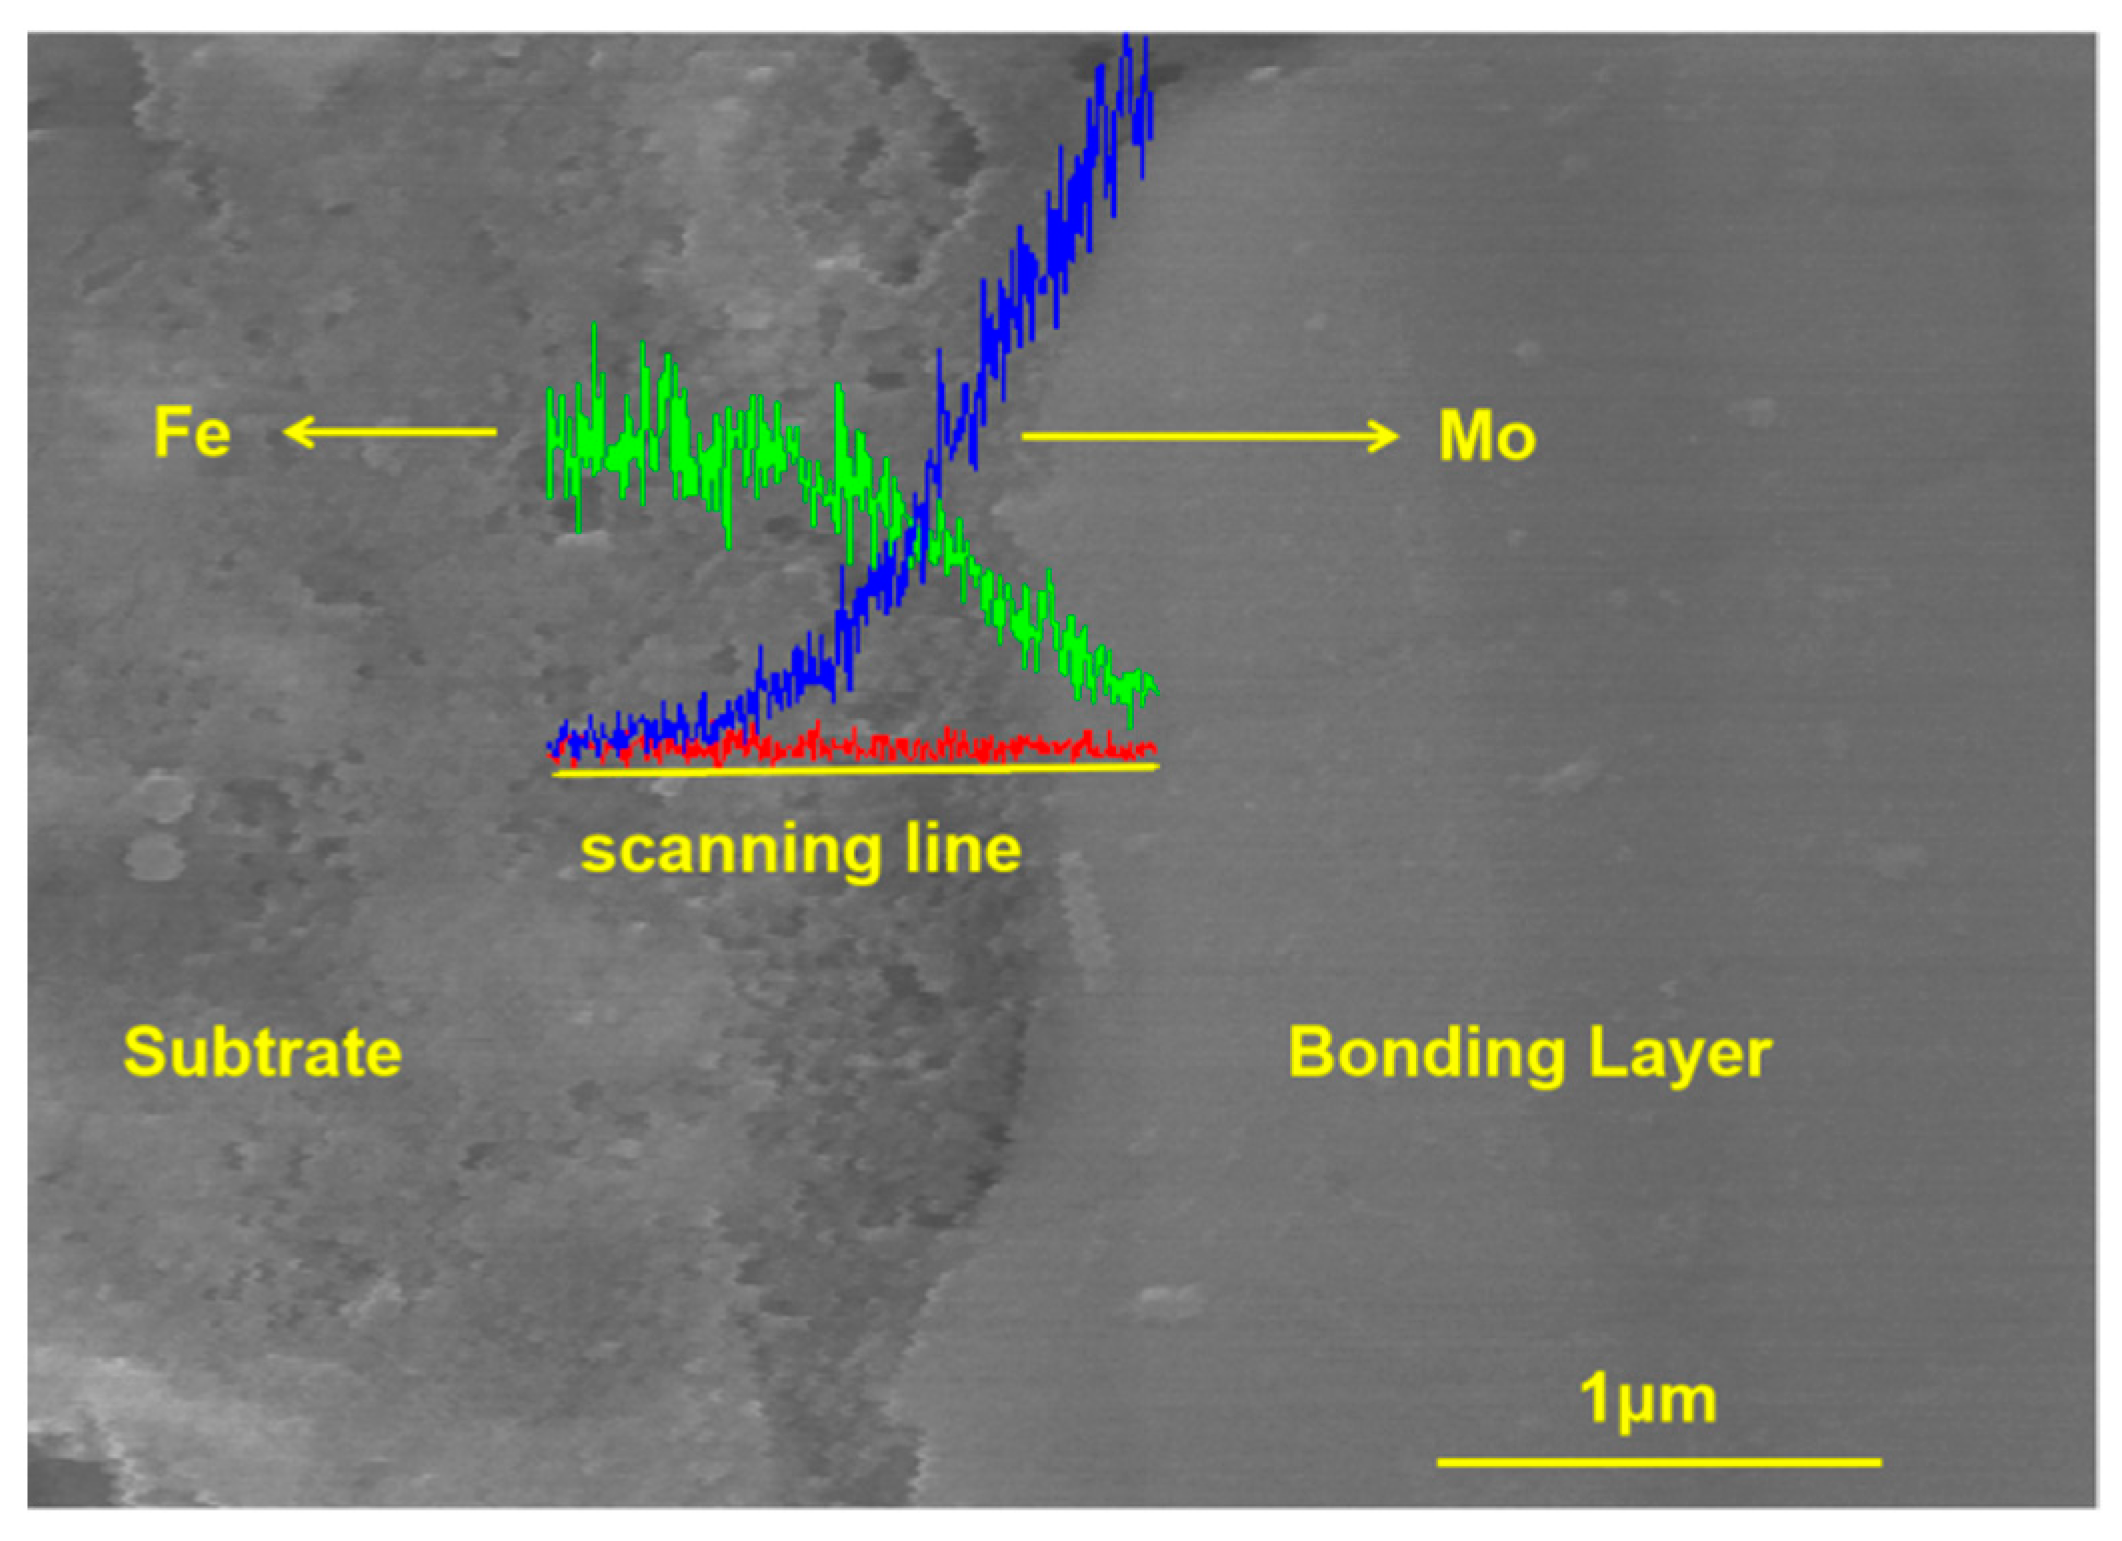
Figure 6.
EDS line scan of the fusion zone of HCS layer/Albronze layer: (a) EDS line scan position; (b) Distribution chart of various elements.
Figure 6.
EDS line scan of the fusion zone of HCS layer/Albronze layer: (a) EDS line scan position; (b) Distribution chart of various elements.
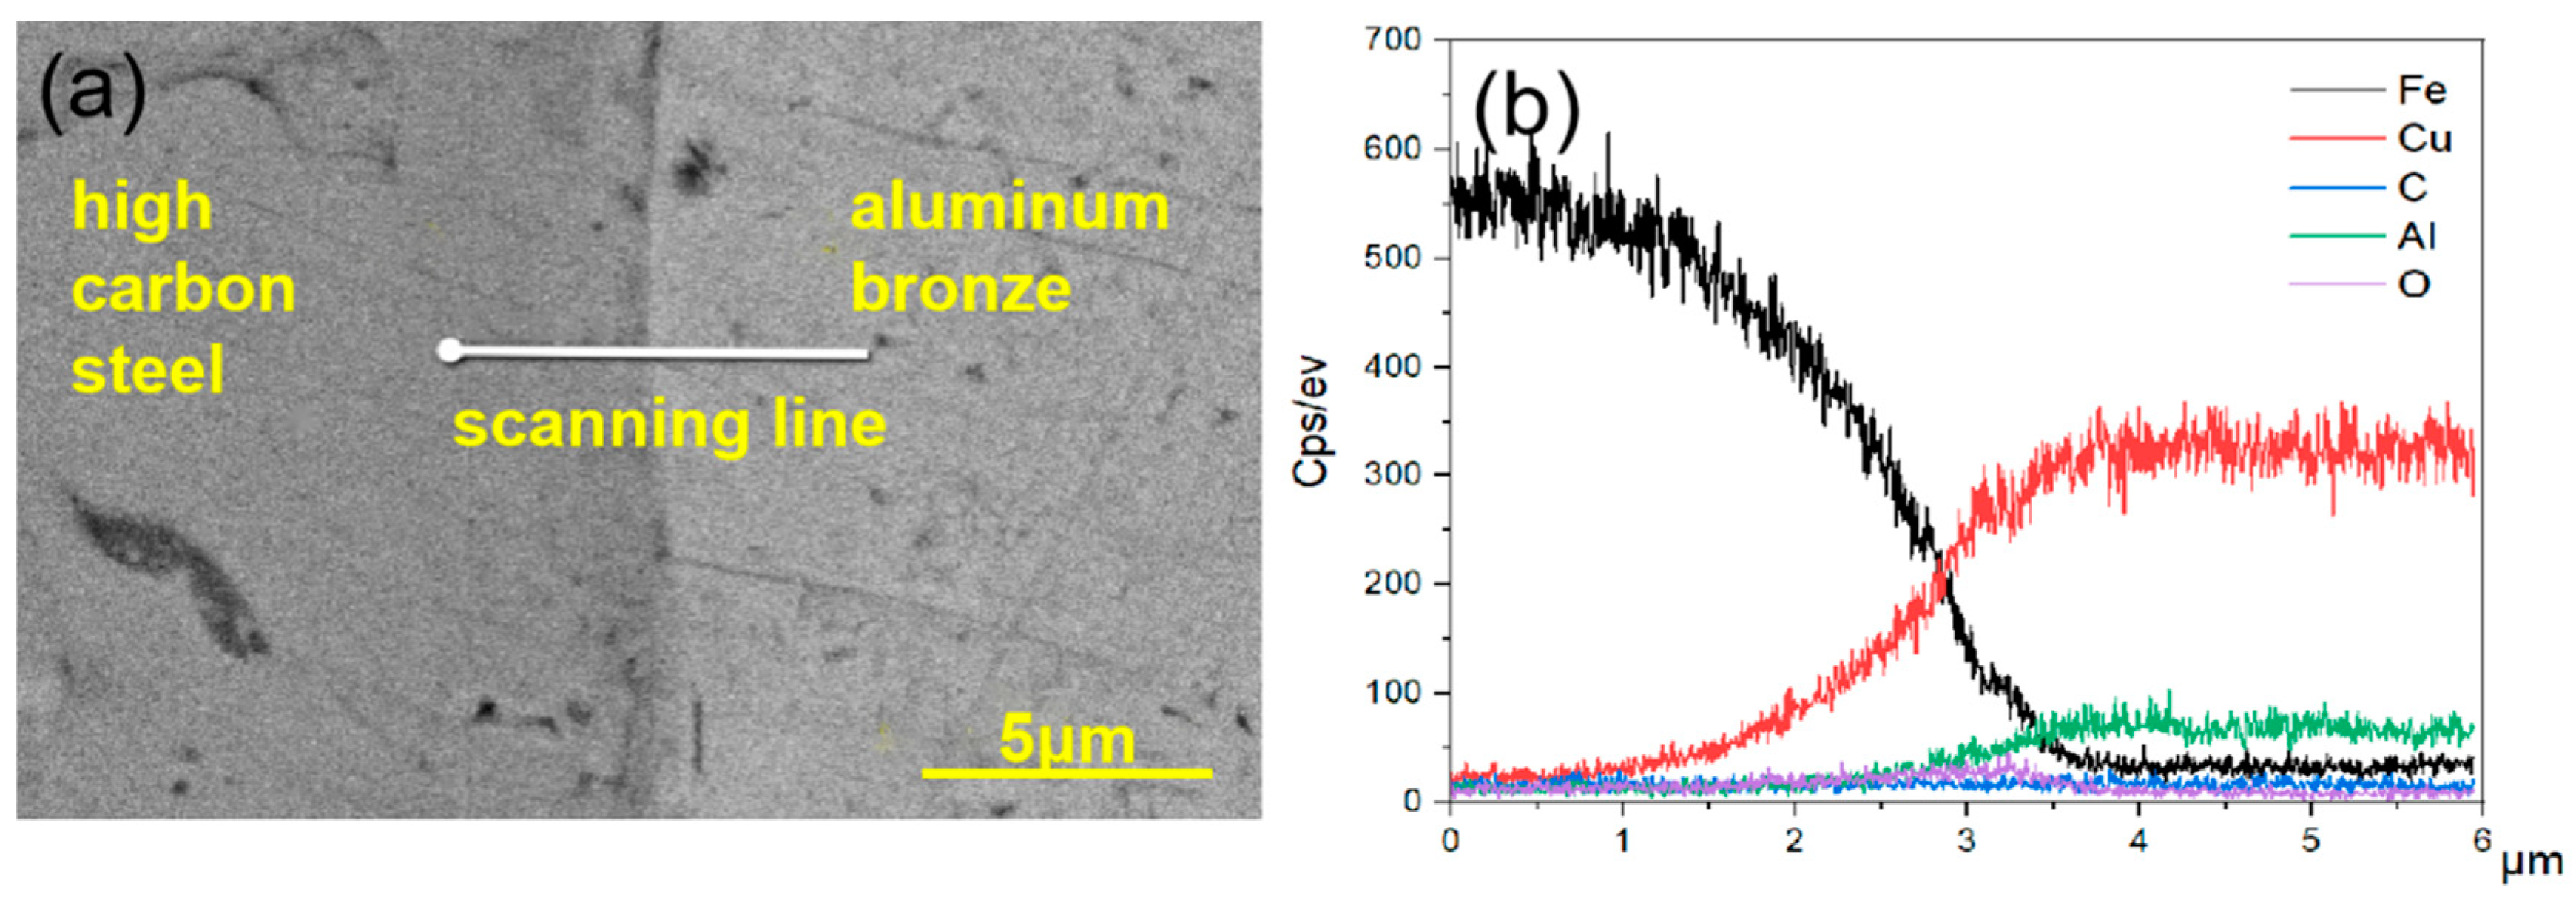
Figure 7.
The 3D morphologies and comparison chart of polished surfaces of three different types of coatings: (a) P1; (b) P1 comparison chart; (c) P2; (d) comparison chart of P2; (e) P3; (f) comparison chart of P3.
Figure 7.
The 3D morphologies and comparison chart of polished surfaces of three different types of coatings: (a) P1; (b) P1 comparison chart; (c) P2; (d) comparison chart of P2; (e) P3; (f) comparison chart of P3.
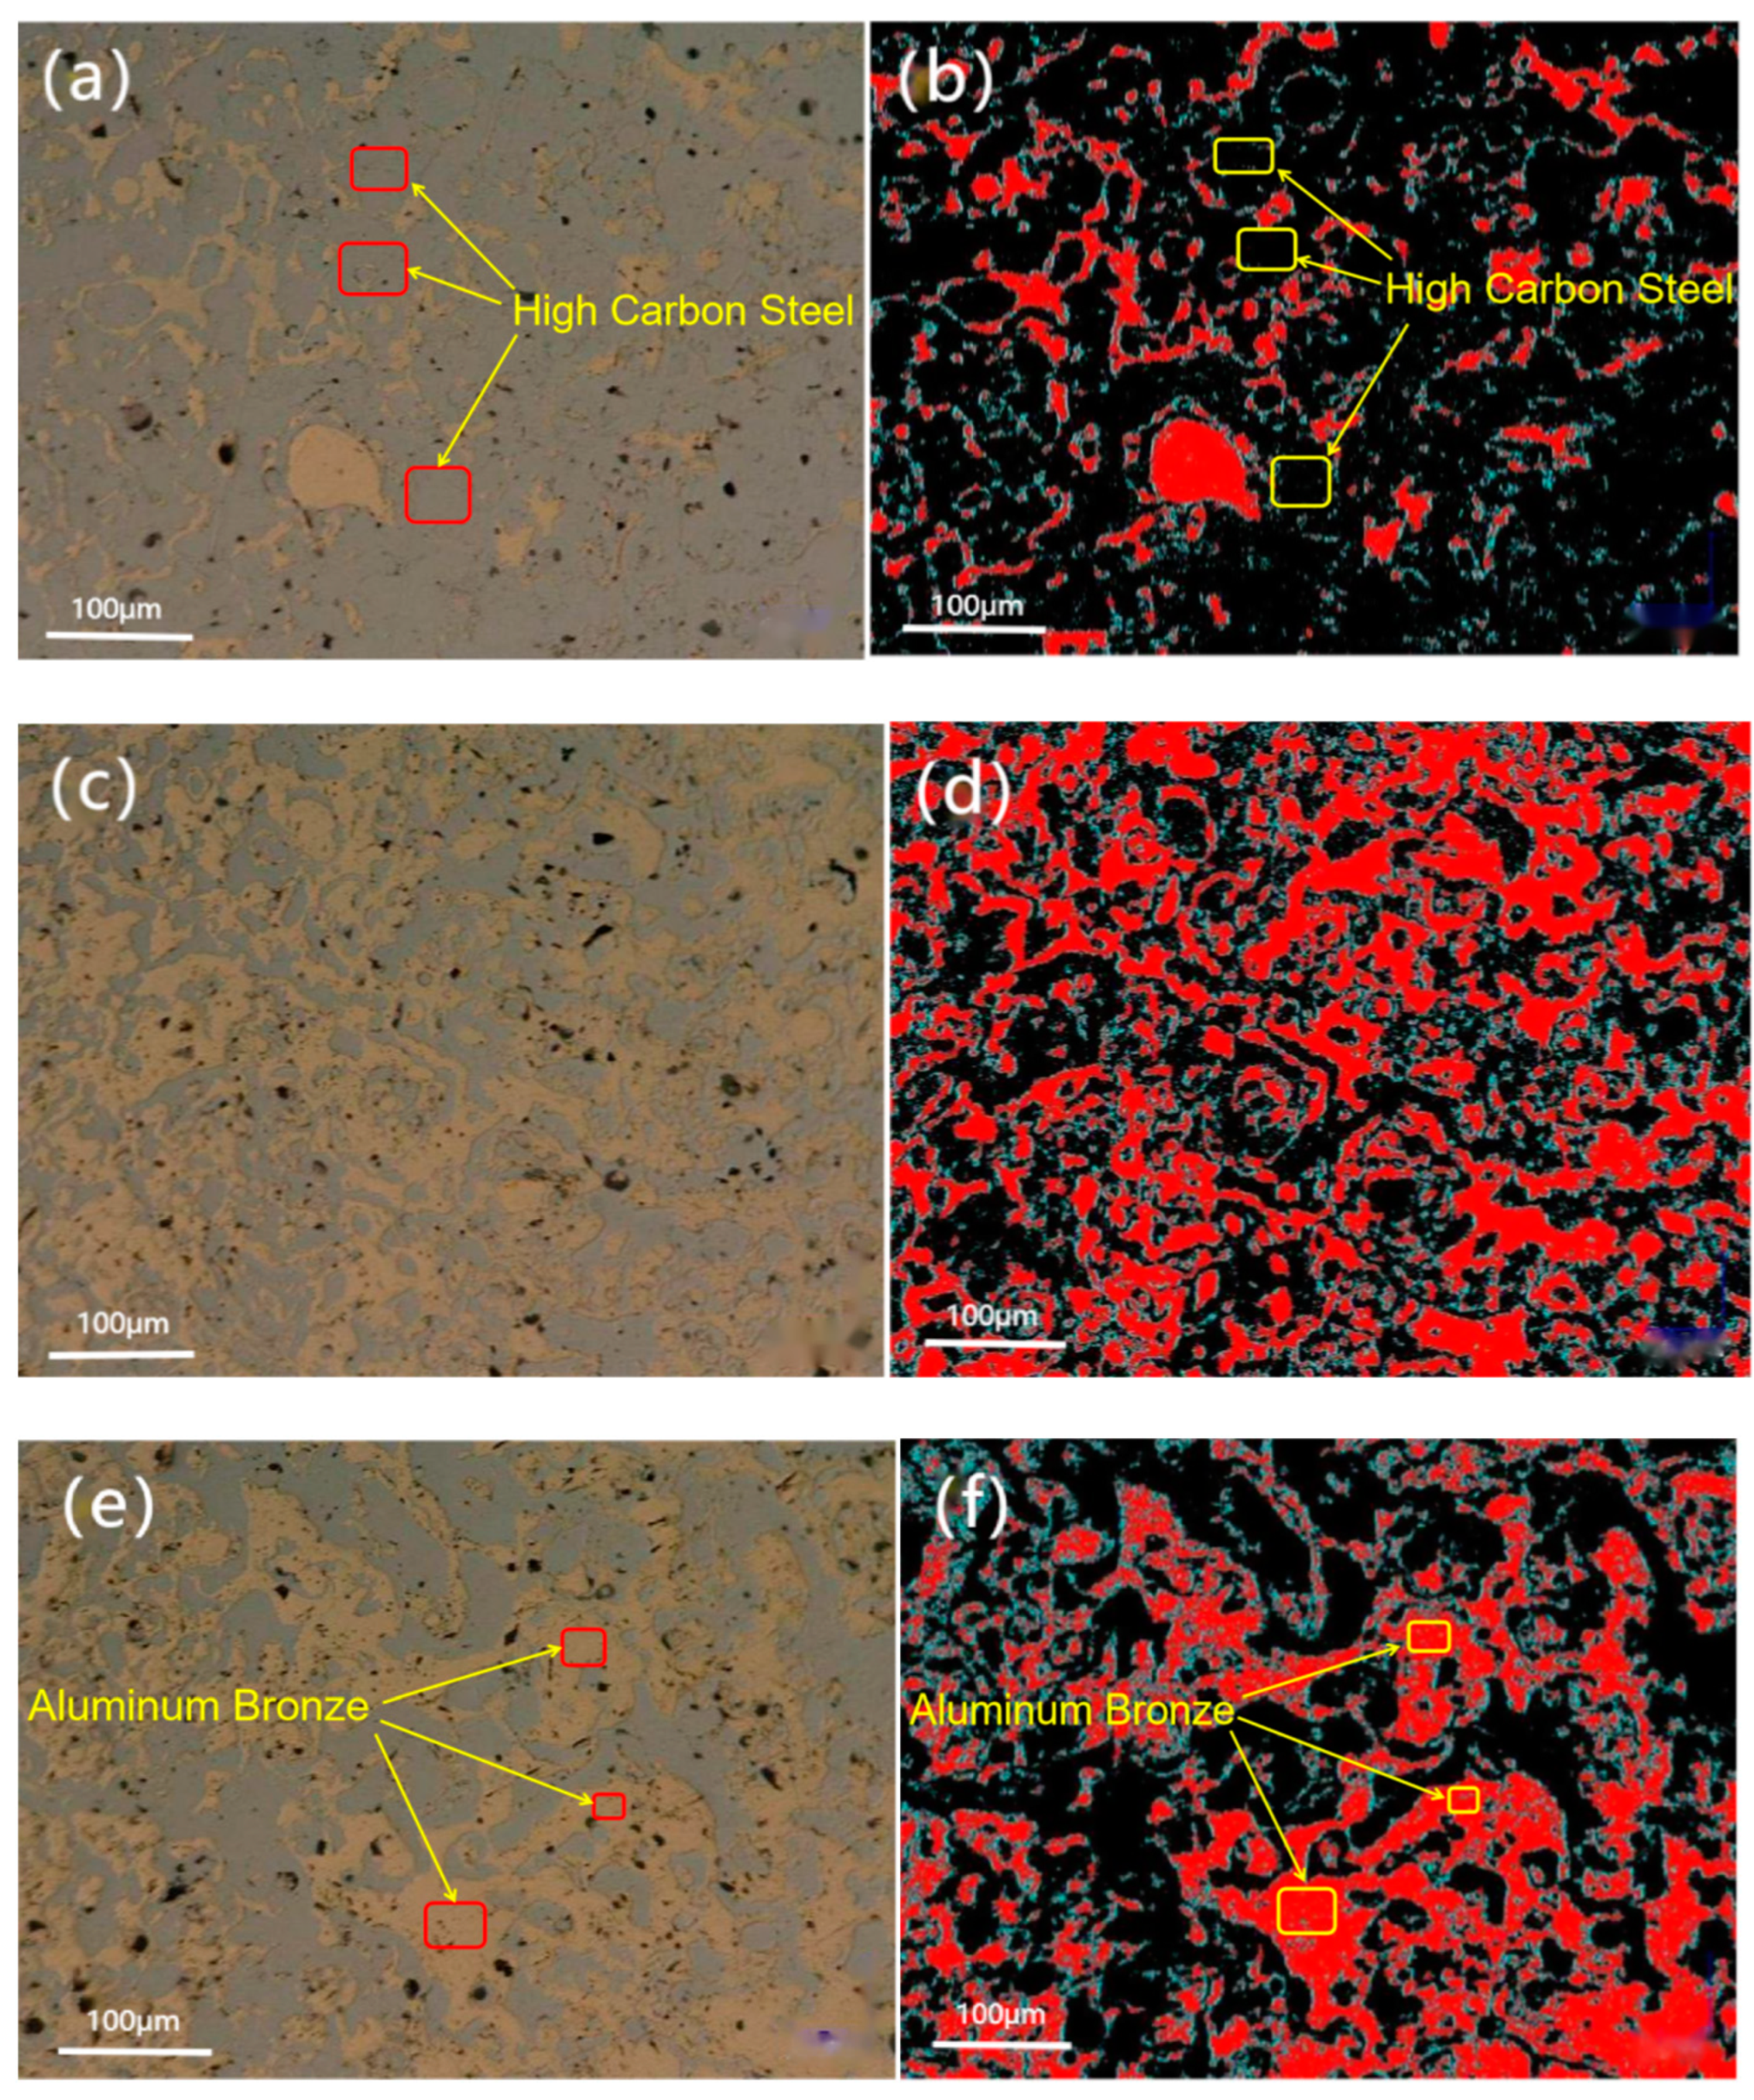
Figure 8.
Surface mapping of the coating: (a) etched surface; (b) magnified image of blocked area in (a); (c) Fe; (d) Cu; (e) Al; (f) O; (g) C.
Figure 8.
Surface mapping of the coating: (a) etched surface; (b) magnified image of blocked area in (a); (c) Fe; (d) Cu; (e) Al; (f) O; (g) C.

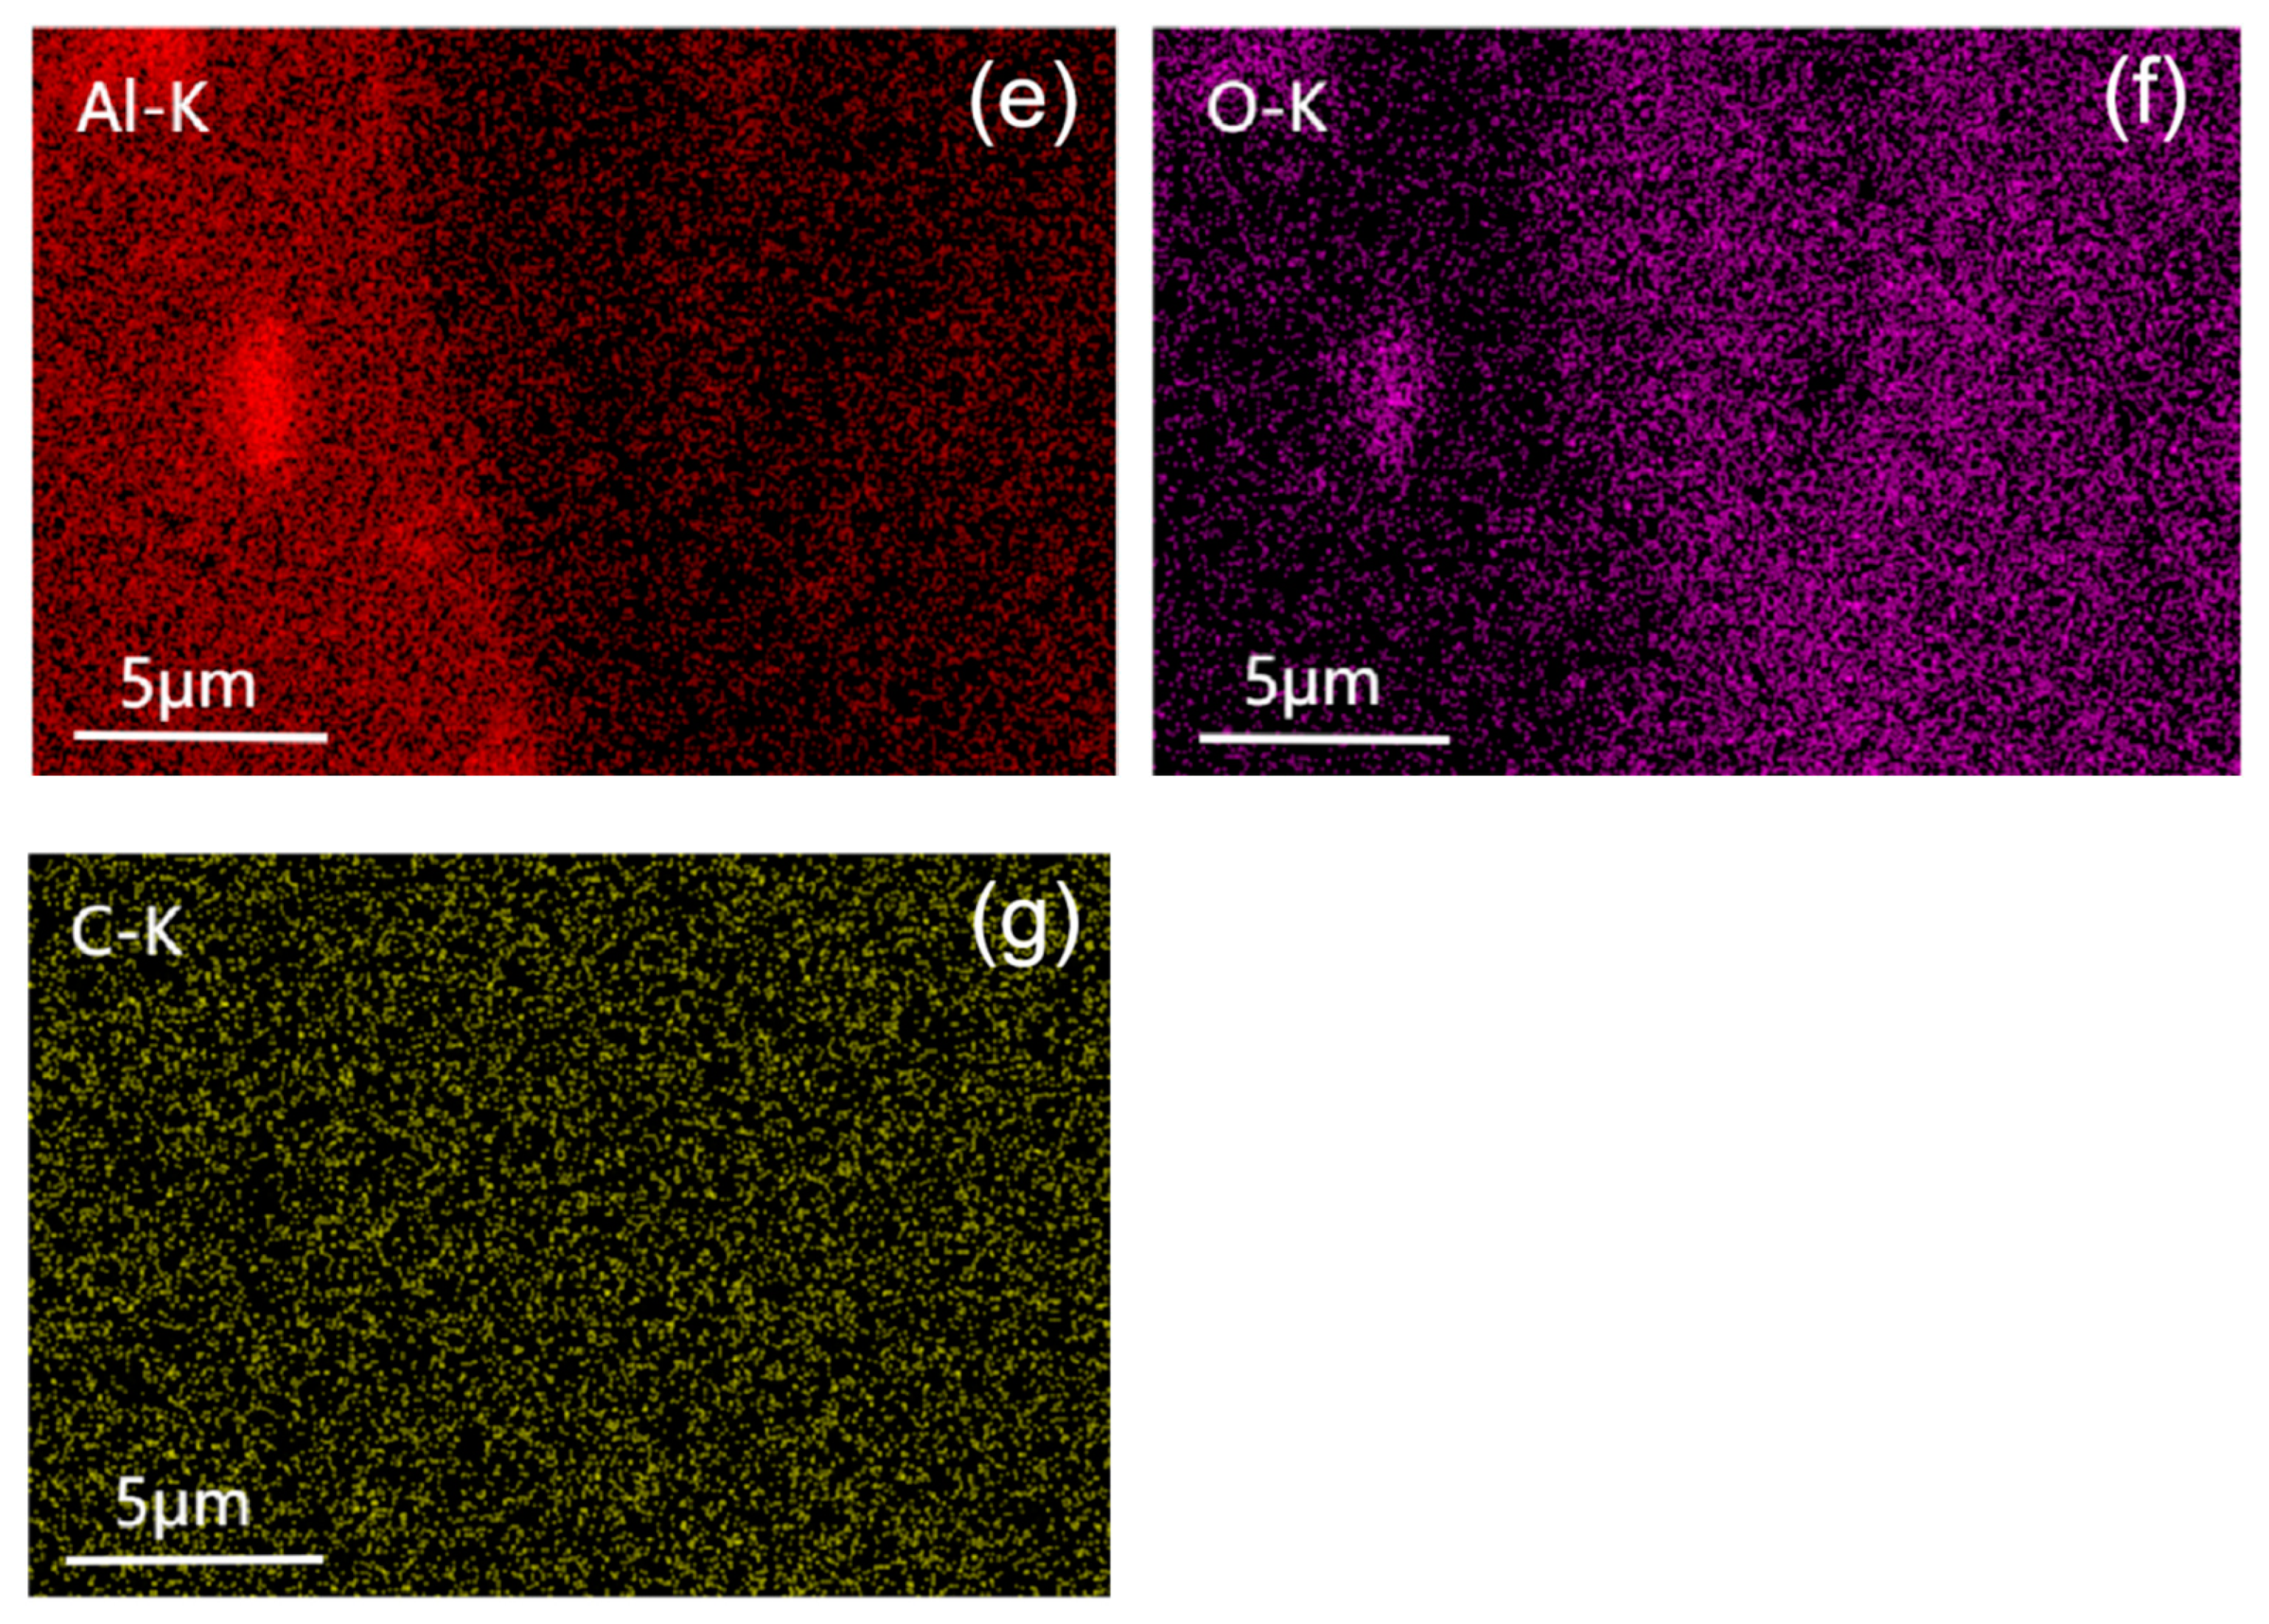
Figure 9.
EDS spectra for element analysis of coating surface (added EDS data).

Figure 10.
Fracture diagram of composite coatings after tensile test: (a) P1; (b) P2; (c) P3.
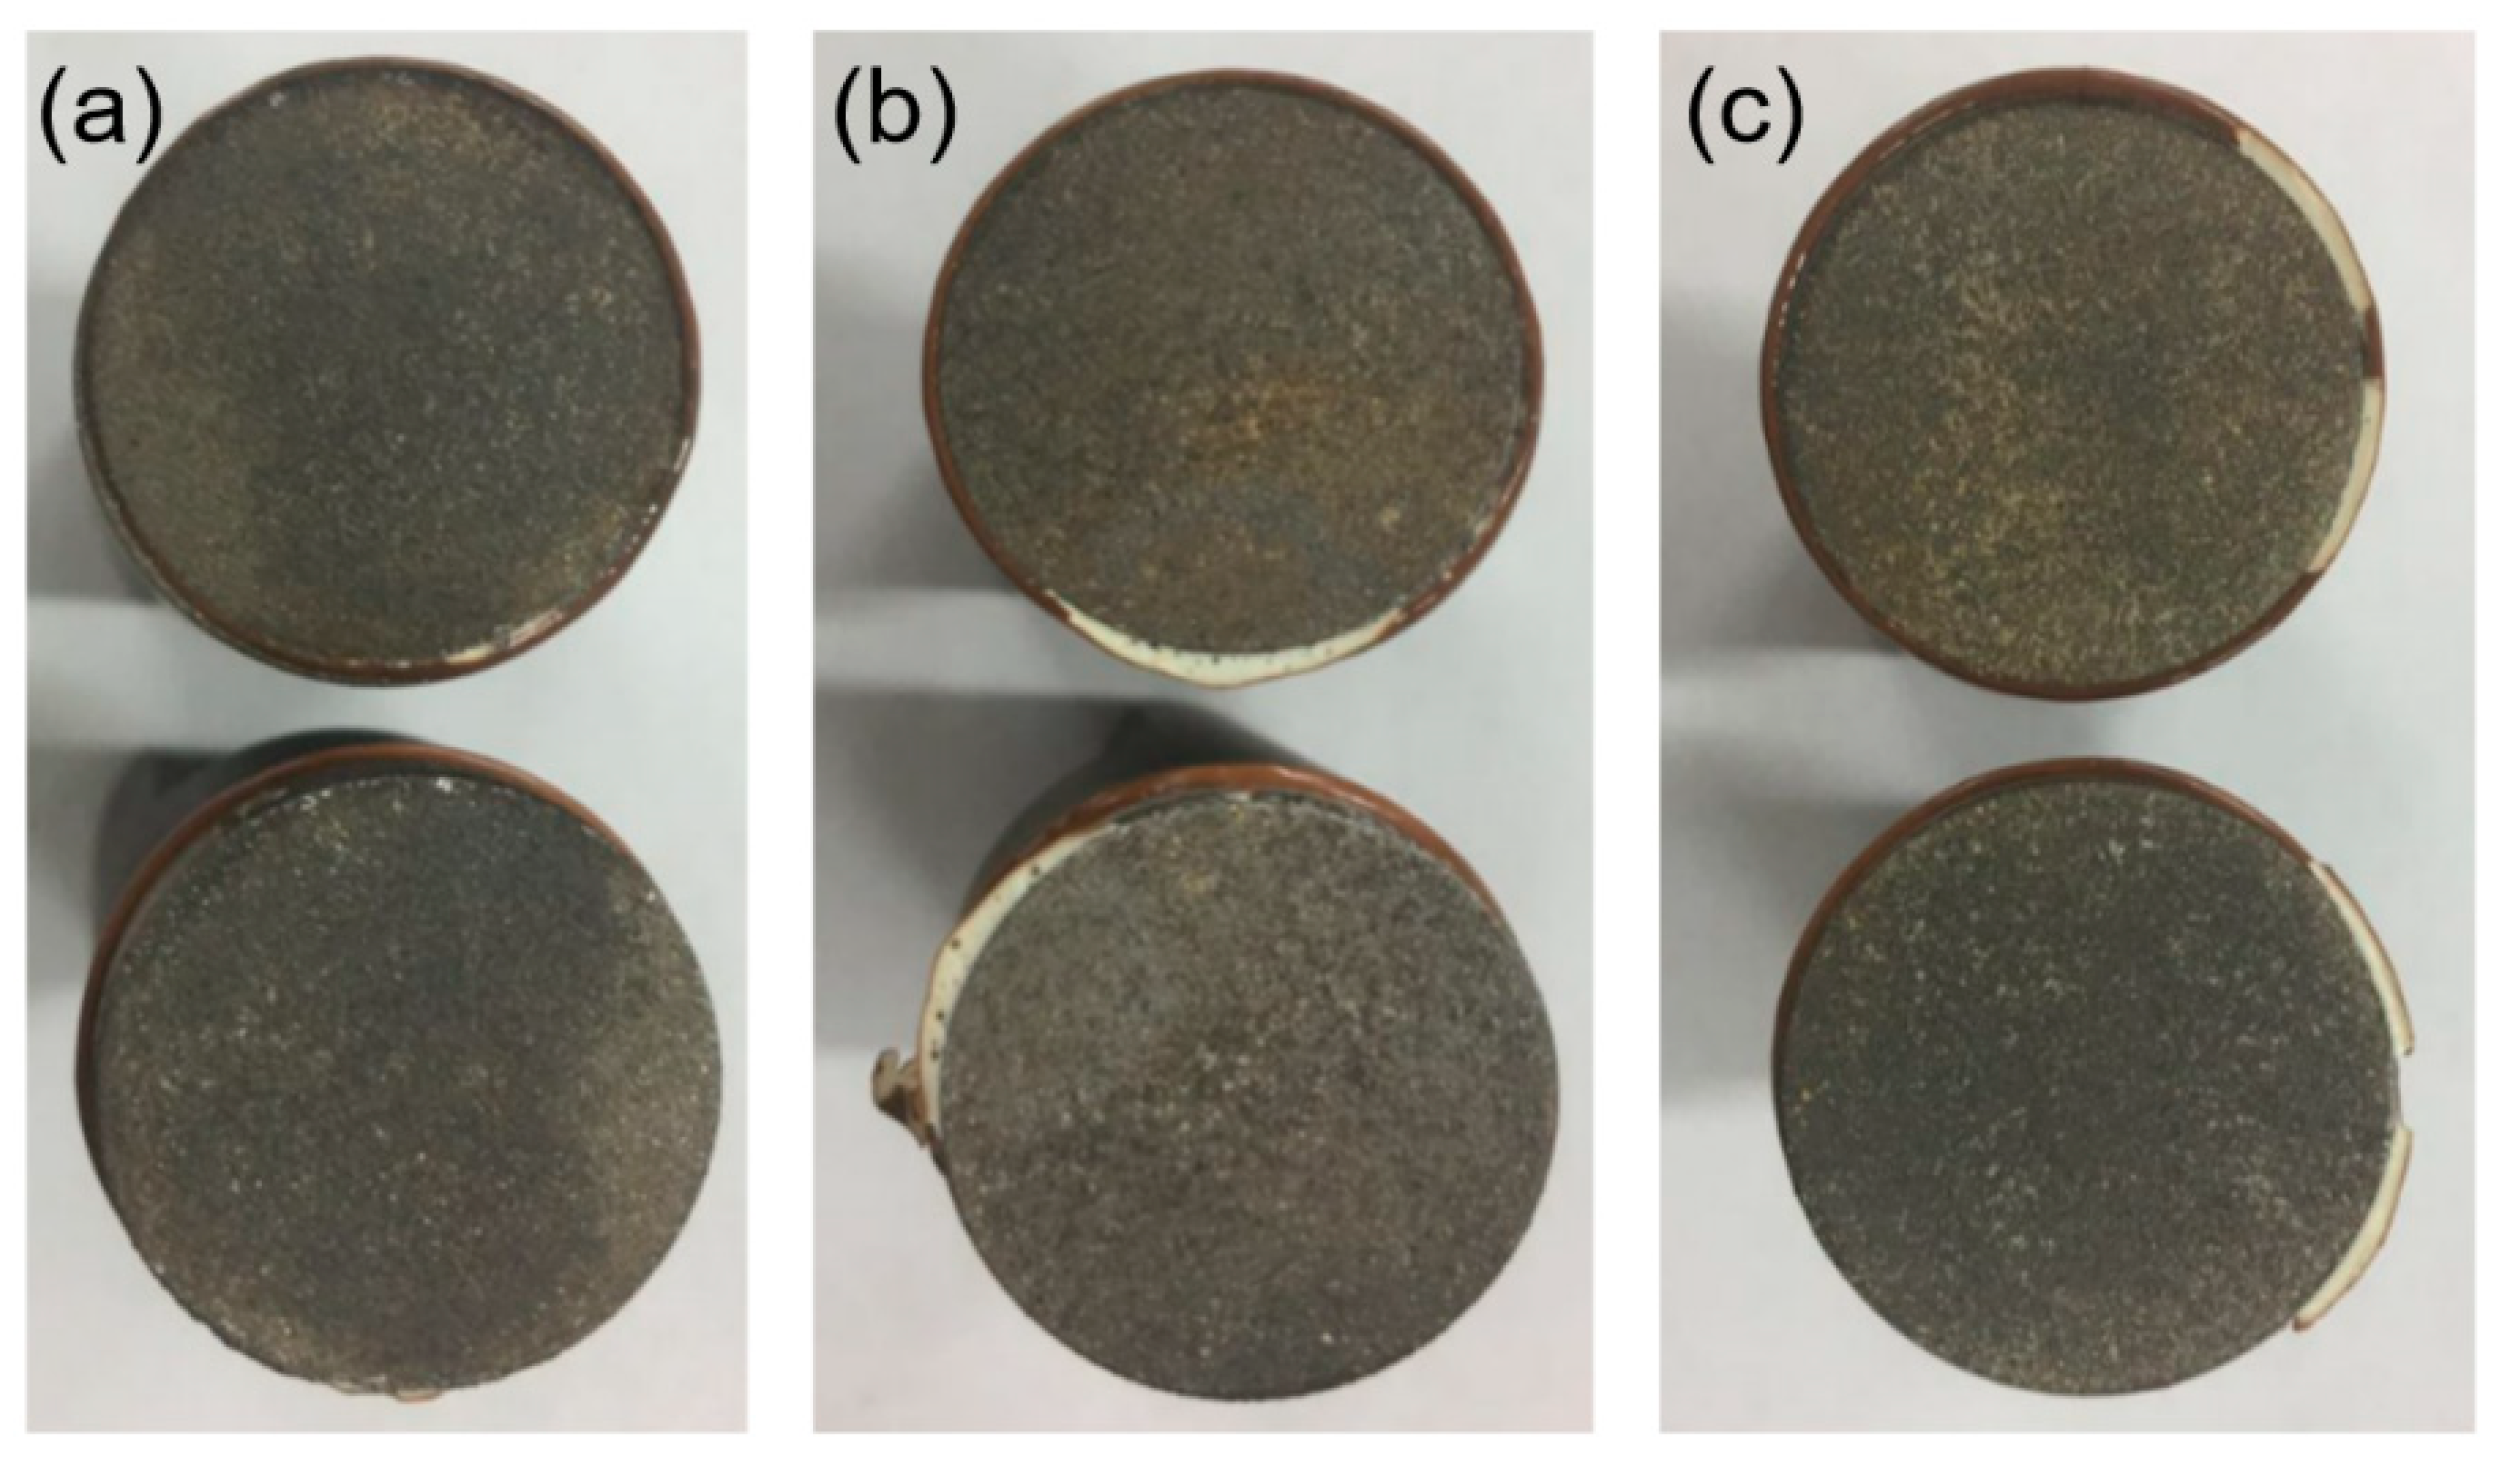
Figure 11.
Average microhardness of the coatings’ surfaces.
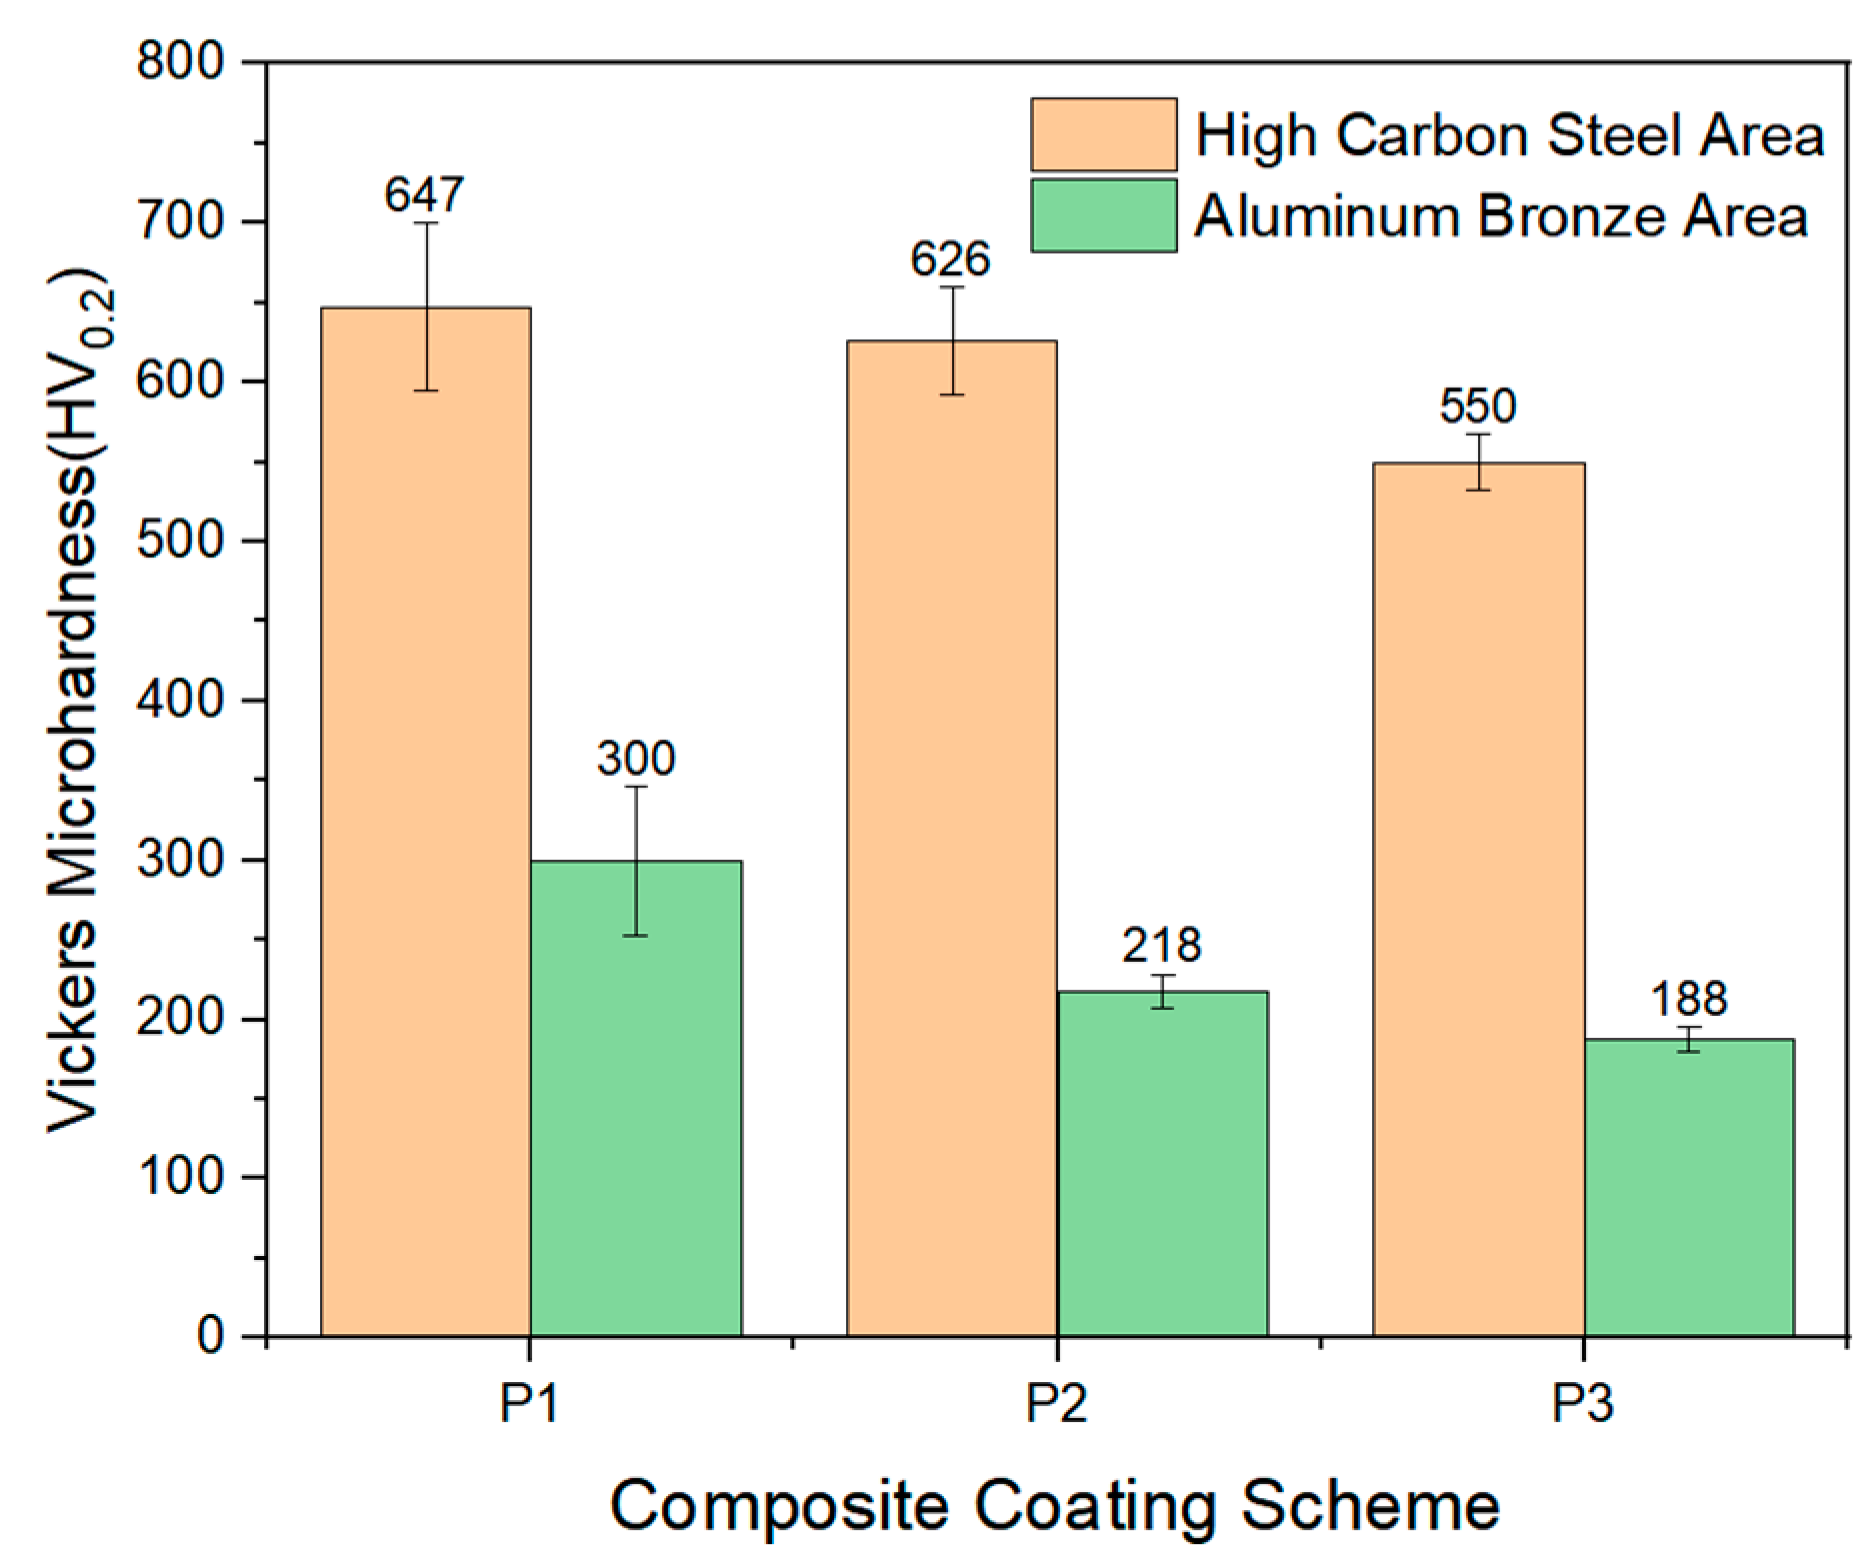
Figure 12.
EBSD images of the composite coating: (a) IQ map of HCS area; (b) IPF map of HCS area; (c) IQ map of Abronze area; (d) IPF map of Abronze area.
Figure 12.
EBSD images of the composite coating: (a) IQ map of HCS area; (b) IPF map of HCS area; (c) IQ map of Abronze area; (d) IPF map of Abronze area.

Figure 13.
Variation in friction coefficient with time.

Figure 14.
Curves of (a) average friction coefficient and (b) average wear mass for composite coatings at different loads.
Figure 14.
Curves of (a) average friction coefficient and (b) average wear mass for composite coatings at different loads.
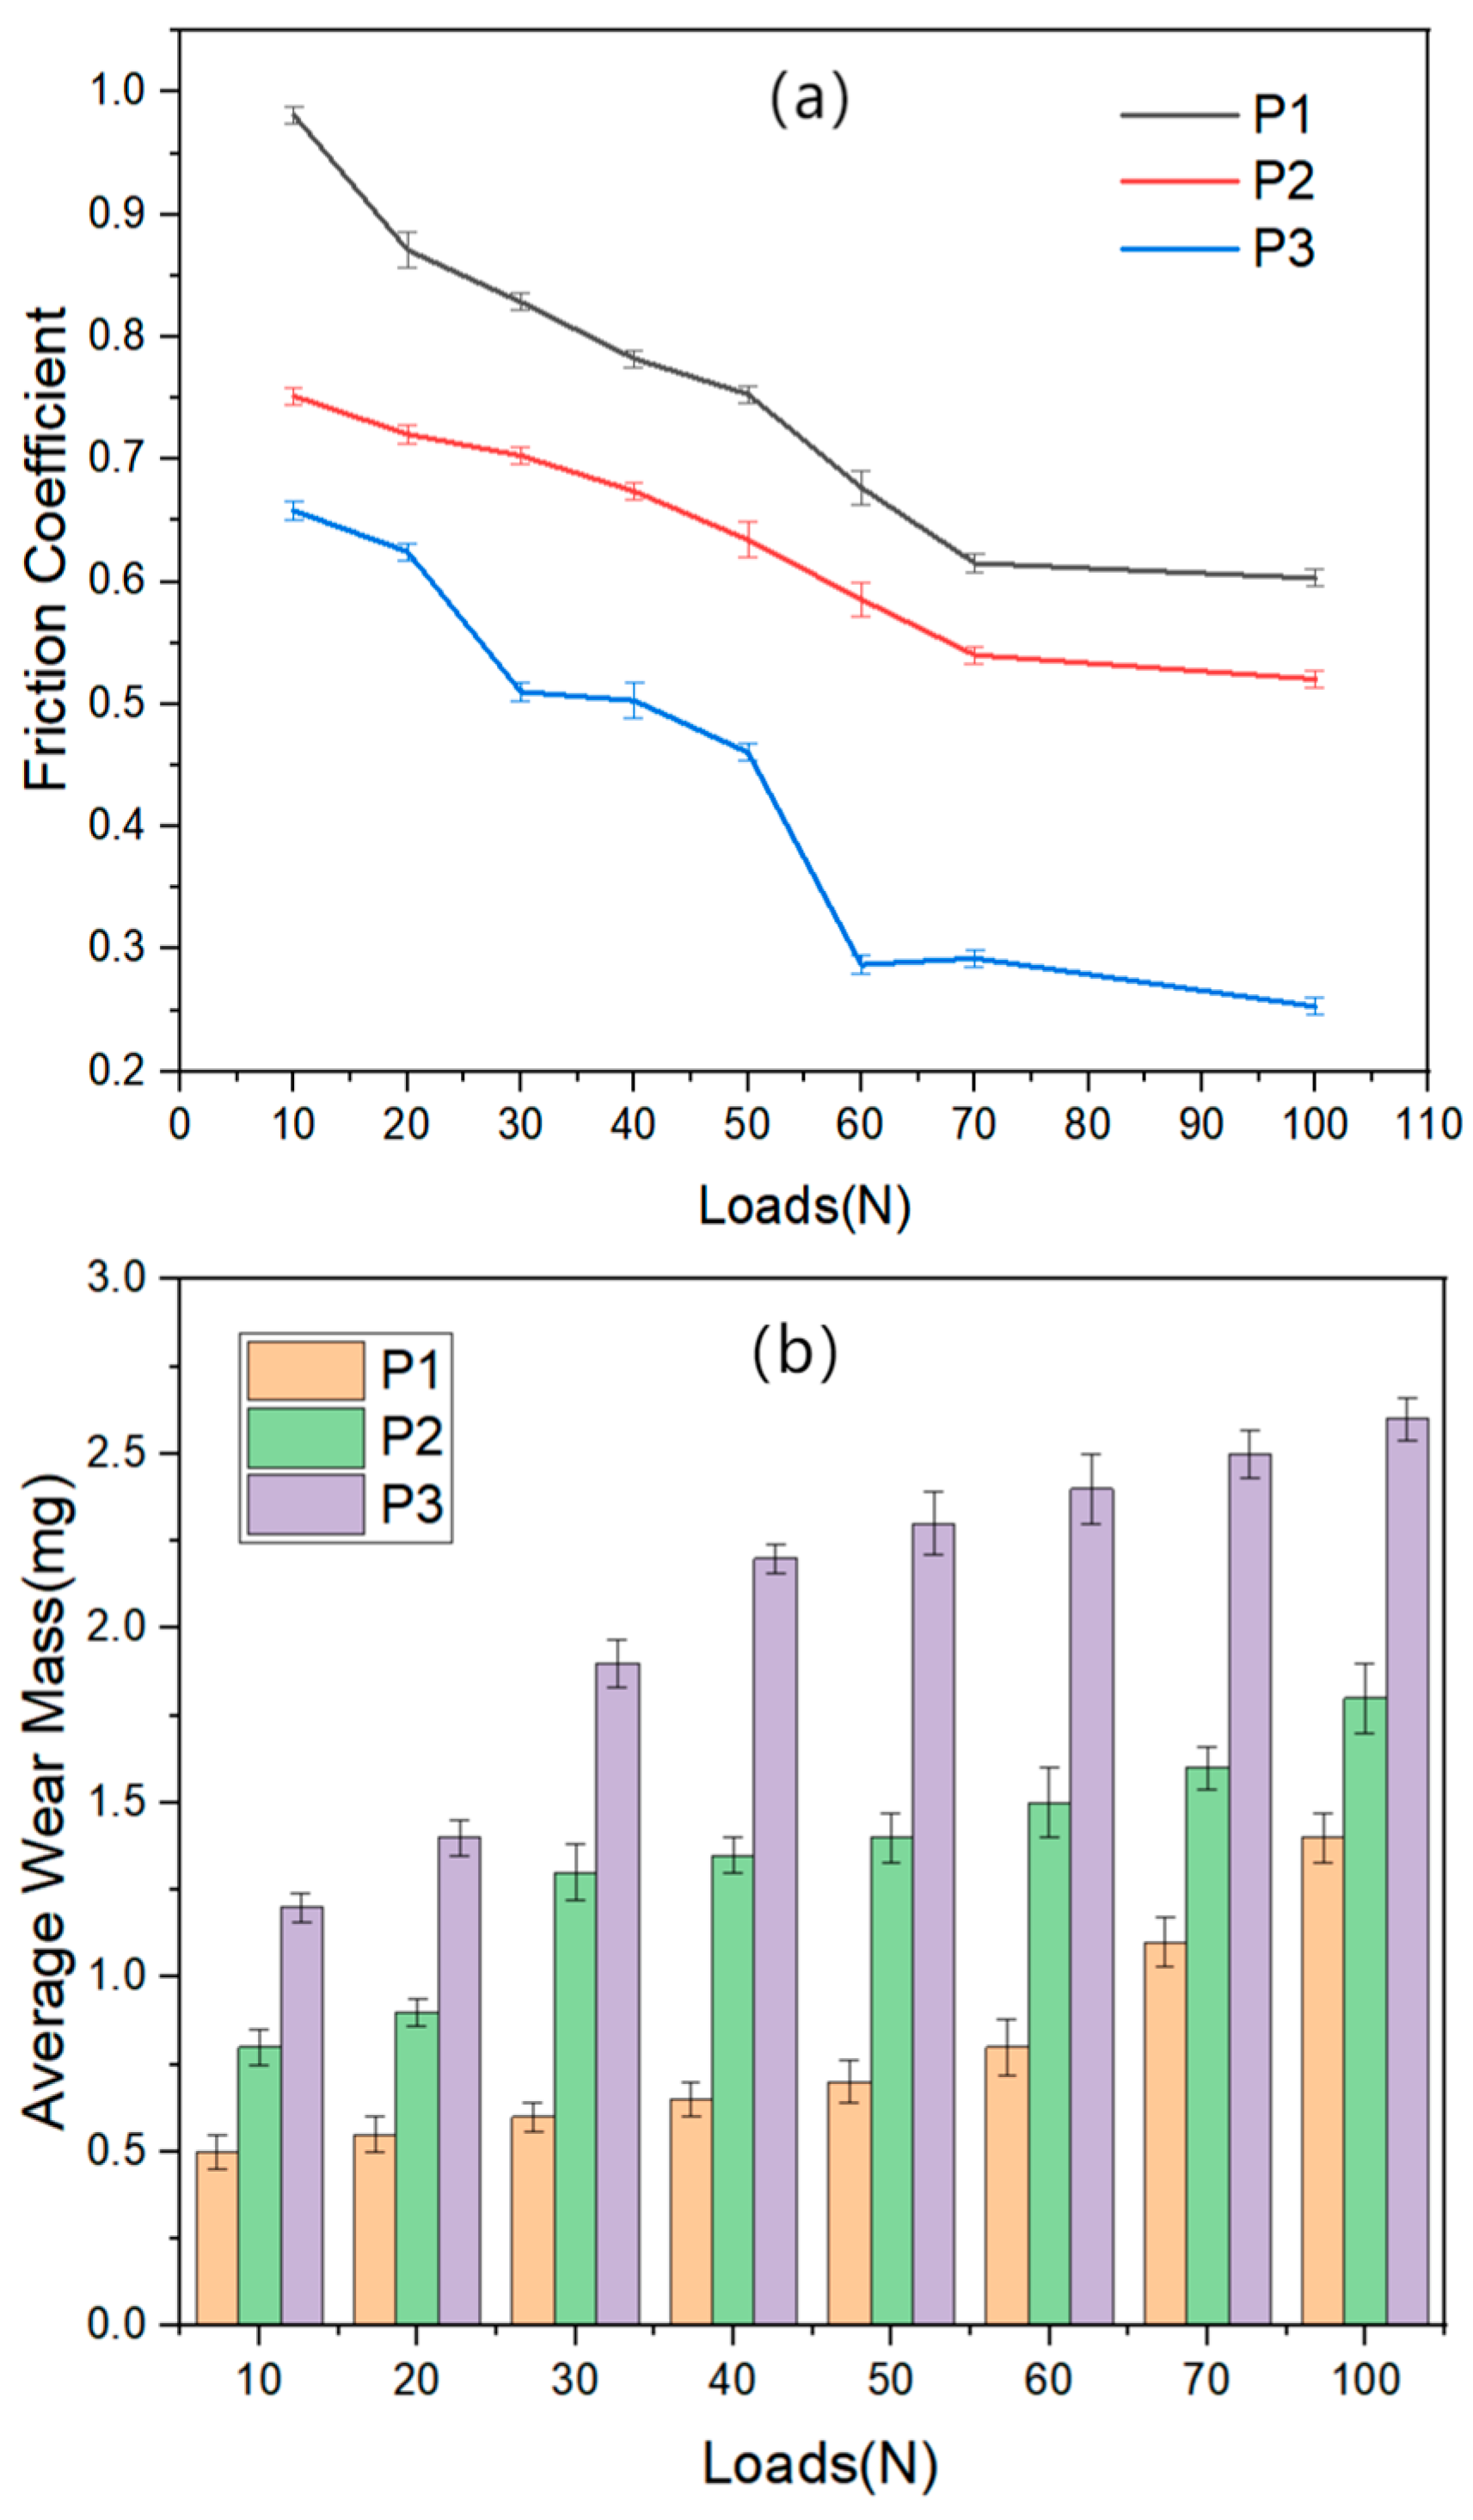
Figure 15.
Worn surface morphologies of composite coatings: (a) P1; (b) magnified image of blocked area in (a); (c) P2; (d) magnified image of blocked area in (c); (e) P3; (f) magnified image of blocked area in (e); A—Abronze, B—metallic oxide.
Figure 15.
Worn surface morphologies of composite coatings: (a) P1; (b) magnified image of blocked area in (a); (c) P2; (d) magnified image of blocked area in (c); (e) P3; (f) magnified image of blocked area in (e); A—Abronze, B—metallic oxide.
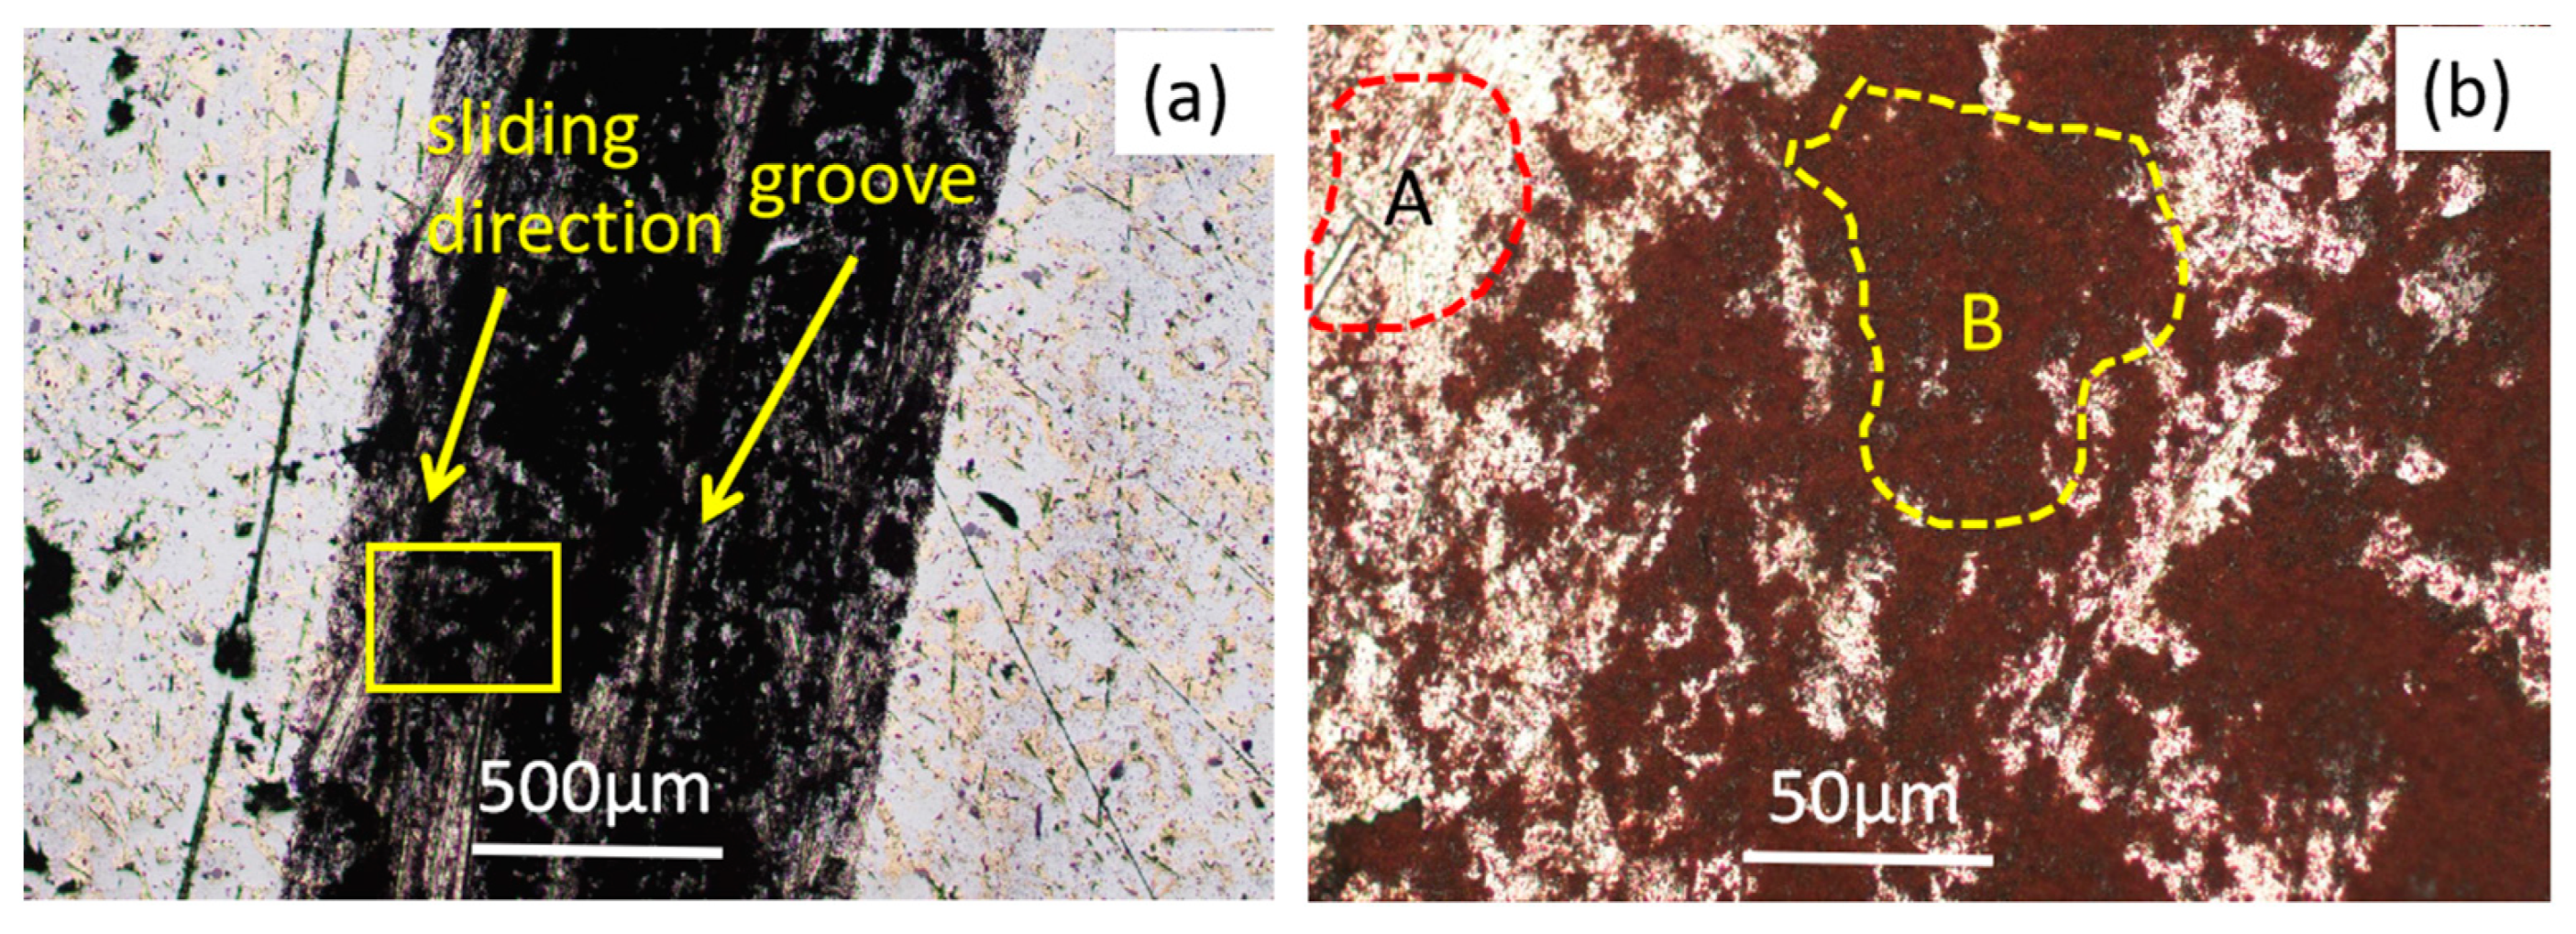

Figure 16.
The 3D worn surface morphologies of composite coatings: (a) P1; (b) P2; (c) P3.


Table 1.
Spraying materials and voltages.
| Materials | Mo | 80# | S215 |
|---|---|---|---|
| Voltages (kV) | 17.5 | 14.5 | 15 |
Table 2.
Preparation schemes of composite coatings (times).
| Composite Coating Schemes | Bonding Layer | Functional Coating | Total Spraying | ||
|---|---|---|---|---|---|
| Mo | 80# | S215 | Groups | ||
| P1 | 5 | 3 | 1 | 7 | 33 |
| P2 | 2 | 2 | 7 | 33 | |
| P3 | 1 | 3 | 7 | 33 | |
Table 3.
Coating thicknesses in different locations (μm).
| Coating | 1 | 2 | 3 | 4 | 5 | Average Thickness |
|---|---|---|---|---|---|---|
| P1 | 215 | 230 | 235 | 227 | 219 | 225.2 |
| P2 | 218 | 225 | 232 | 237 | 227 | 227.8 |
| P3 | 222 | 220 | 238 | 231 | 219 | 226 |
Table 4.
The area ratios of HCS and porosities of different coatings.
| Coatings | HCS Area (mm2) | Pore Area (mm2) | Total Area (mm2) | Ratio of HCS | Porosity (%) |
|---|---|---|---|---|---|
| P1 | 643,448.9 | 6673 | 953,257.5 | 67.5 | 0.7 |
| P2 | 474,278.4 | 7626 | 953,257.5 | 49.8 | 0.8 |
| P3 | 215,436.2 | 8579 | 953,257.5 | 22.6 | 0.9 |
Table 5.
Bonding strength of the composite coatings.
| Coatings | Bonding Strength (MPa) | ||||
|---|---|---|---|---|---|
| 1 | 2 | 3 | 4 | Average Value | |
| P1 | 53.4 | 55.3 | 58.2 | 54.1 | 55.3 |
| P2 | 52.1 | 53.8 | 56.2 | 53.1 | 53.8 |
| P3 | 42.5 | 43.7 | 45.0 | 43.5 | 43.7 |
Disclaimer/Publisher’s Note: The statements, opinions and data contained in all publications are solely those of the individual author(s) and contributor(s) and not of MDPI and/or the editor(s). MDPI and/or the editor(s) disclaim responsibility for any injury to people or property resulting from any ideas, methods, instructions or products referred to in the content. |
© 2023 by the authors. Licensee MDPI, Basel, Switzerland. This article is an open access article distributed under the terms and conditions of the Creative Commons Attribution (CC BY) license (https://creativecommons.org/licenses/by/4.0/).
Share and Cite
MDPI and ACS Style
Huang, K.; Song, Q.; Chen, P.; Liu, Y.; Jing, Y. Wear Mechanism of Fe/Cu Self-Lubricating Composite Coatings Fabricated by Electro-Explosive Spraying under Dry Friction. Metals 2023, 13, 390. https://doi.org/10.3390/met13020390
AMA Style
Huang K, Song Q, Chen P, Liu Y, Jing Y. Wear Mechanism of Fe/Cu Self-Lubricating Composite Coatings Fabricated by Electro-Explosive Spraying under Dry Friction. Metals. 2023; 13(2):390. https://doi.org/10.3390/met13020390
Chicago/Turabian StyleHuang, Kun, Qiuzhi Song, Pengwan Chen, Ye Liu, and Yinping Jing. 2023. "Wear Mechanism of Fe/Cu Self-Lubricating Composite Coatings Fabricated by Electro-Explosive Spraying under Dry Friction" Metals 13, no. 2: 390. https://doi.org/10.3390/met13020390
Note that from the first issue of 2016, this journal uses article numbers instead of page numbers. See further details here.