Article

Predictive Modeling of Hardness Values and Phase Fraction Percentages in Micro-Alloyed Steel during Heat Treatment Using AI

W Booth School of Engineering Practice and Technology, McMaster University, Hamilton, ON L8S 4L8, Canada
*
Author to whom correspondence should be addressed.
Metals 2024, 14(1), 49; https://doi.org/10.3390/met14010049
Submission received: 20 November 2023 / Revised: 18 December 2023 / Accepted: 27 December 2023 / Published: 30 December 2023

Abstract

:
In this work, we have proposed an AI-based model that can simultaneously predict the hardness and phase fraction percentages of micro-alloyed steel with a predefined chemical composition and thermomechanical processing conditions. Specifically, the model uses a feed-forward neural network enhanced by the ensemble method. The model has been trained on experimental data derived from continuous cooling transformation (CCT) diagrams of 39 different steels. The inputs to the model include a cooling profile defined by a set of time-temperature values and the chemical composition of the steel. Sensitivity analysis was performed on the validated model to understand the impact of key input variables, including individual alloys and the thermomechanical processing conditions. This analysis, which measures the variability in output in response to changes in a specific input variable, showed excellent agreement with experimental data and the trends in the literature. Thus, our model not only predicts steel properties under varied cooling conditions but also aligns with existing theoretical knowledge and experimental data.

1. Introduction

Steel’s ubiquitous application worldwide necessitates variants with specific properties, such as hardness, ductility, and tensile strength. These attributes are governed by the phase fractions within the steel’s microstructure [1,2,3]. This microstructure is determined by a combination of factors, including the steel’s chemical composition and the thermomechanical processing employed [4,5,6]. Thus, the ability to predict these properties based on the steel’s microstructure has become an area of intensive research intended to enhance the performance of steel in various applications.
Steel manufacturing entails the meticulous selection and proportioning of materials to yield the desired mechanical properties. The process involves heating steel to a high temperature, followed by a controlled cooling phase—a process known as continuous cooling transformation (CCT). This method is instrumental in bestowing steel with its characteristic properties.
Earlier researchers focused on the relationship between the mechanical properties and microstructure of steel, offering significant insight into the roles of dislocation density, lath thickness, alloying elements, and volume fractions of secondary particles. However, predicting these properties remains a complex challenge due to the numerous variables, ranging from the constituent alloying elements to the rolling and cooling conditions [1,2,3,4]. Neurocomputing techniques are very useful tools in such scenarios to unearth and establish the relationships between various parameters in complex engineering and natural science processes. Consequently, in this work, we have employed neural network techniques to understand the mechanical properties and phase fractions of steel with respect to its chemical composition and thermomechanical processing.
In light of previous research [7,8,9,10,11] showing the effectiveness and suitability of neural network models for solving such challenges, this study aims to develop a neural network model capable of predicting the microstructural phase fractions and hardness values of steel, based on its chemical composition and heat treatment profile. Our focus lies in identifying the optimal continuous cooling transformation that yields the desired mechanical properties of steel. Specifically, this research has three primary tasks:
  • Curate a comprehensive steel database from the CCT diagrams in the steel atlas [12]. This database will encompass an exhaustive set of temperature-time cooling profiles of a variety of steels with various alloying element combinations and the corresponding phase fractions and hardness values obtained from the thermomechanical processing of the steel.
  • Develop a neural network model capable of simultaneously predicting the hardness values of steel and microstructure phase fractions, given its composition and continuous cooling transformation profile.
  • Demonstrate the practical utility of this model and conduct a sensitivity analysis on the model to understand the impact of key input variables on the predicted output, providing further insight into the relationships between steel composition as well as heat treatment processes, and the resulting properties.
As evident from the literature survey below, to the best of our knowledge, there is no single model that works for a combination of low-, medium-, and high-carbon steels. Most works focus on one of these steel types with a few variations in the alloying elements.

2. Literature Review

AI has been used for a variety of studies in materials science, including steel research. For instance, the study by Huang et al. [7] effectively utilized 1400 datasets, which included billet compositions, control parameters of the rolling process, and mechanical properties of the rolled steel bars, as inputs to the neural network. The AI analyzer confidently predicted critical factors such as yield strength, tensile strength, and elongation percentage for the rolled steel bars. Their algorithm could precisely set the related control parameters on the bar rolling process to enhance the quality of steel bars while simultaneously reducing production costs [7].
Monajati et al. [8] used an artificial neural network (ANN) to analyze how processing parameters affect the formability of deep drawing quality (DDQ) steel sheets. To accurately model the mechanical and formability properties such as yield strength, work hardening exponent, and anisotropy, a detailed description of the material’s chemical composition was necessary. This resulted in the use of 19 input variables to analyze the properties. The optimal results were achieved using two hidden layers with 19 neurons each. After constructing the model, the researchers investigated the influence of various parameters on the formability of carbon steel. For instance, they examined the effect of carbon content by varying it in the range [0.0032, 0.062] while keeping all other parameters constant [8].
The researchers also analyzed the effects of finishing and coiling temperatures (FT and CT) on steel’s properties. To do this, they used all parameters except for FT and CT, which were varied in the range [854C, 910C] and [540C, 625C], respectively. Finally, the effects of heating rate and soaking time were studied by varying these parameters.
In another study, Sterjovski et al. [9] evaluated the effectiveness of three back-propagation artificial neural network models in predicting various mechanical properties of steel. Specifically, the authors studied the impact toughness of quenched and tempered pressure vessel steel exposed to multiple post-weld heat treatment cycles, the hardness of the simulated heat-affected zone in the pipeline and tap fitting steels after in-service welding, and the hot ductility and hot strength of various micro-alloyed steels in the continuous casting process. The ANN (Artificial Neural Network) proved to be successful in predicting these properties, as demonstrated by the close match between the predicted and actual experimental values. The authors utilized 150,000–500,000 cycles/iterations to minimize and stabilize the RMS error. The study also examined four micro-alloyed steels (Nb, Nb-Ti, Ti, and C-Mn-Al) of various chemical compositions, employing tensile test specimens that were cylindrical in shape with a 10 mm diameter and gauge length of 95 mm [9].
Sidhu et al. [10] employed artificial neural networks to determine the volume fraction of bainite in isothermally treated low-carbon steel. The dataset, which consisted of 437 data points, was analyzed through a rigorous comparison of the performance of 25 networks. The neural networks’ input included vital information such as chemical composition (C, Si, Mo, Cr, V, Ni, Mn), the highest temperature of bainite formation, the isothermal transformation temperature, and the transformation time. Additionally, the study delved into analyzing the impact of the alloying element composition on bainite volume fraction, and the results obtained were in line with established metallurgical theory. This study successfully demonstrated the capability of artificial neural networks to accurately predict bainite volume fraction, thereby paving the way for further advancements in the field of metallurgy [10].
In another study by the same authors [11], training was executed on a dataset consisting of 175 data points to predict the hardness of steel. The study considered not only the chemical composition but also the heat treatment conditions, specifically the austenitization temperature (Taus), isothermal transformation time (tiso), and isothermal transformation temperature (Tiso). The network’s performance was evaluated by applying the remaining 47 data points from the database, which were not included in the initial training. Furthermore, the model was employed to predict the hardness of five newly designed bainitic steels [11].
Sidhu et al. [13] employed AI and the particle swarm optimization (PSO) algorithm to obtain the optimal chemical composition and heat treatment conditions to obtain steels with the desired hardness. The combination of AI with the particle swarm algorithm resulted in a fast and accurate global search on a multi-dimensional search space to obtain steels with a specific hardness value. The authors used a simple objective function that was expressed as:
F = H V H V t a r g e t H V t a r g e t + C C t a r g e t ,
where F is the objective function, HV is Vicker’s hardness, and C is cost ($/gram). Here, the cost was minimized with the PSO algorithm. The PSO used a hardness value, and C was calculated from a reduced-order hardness model and was a function of the alloying elements and thermomechanical processing conditions [13].
Huang et al. [14] used TTT diagrams to study the microstructure of stainless steel. To extract information from such diagrams, different machine learning (ML) algorithms were employed, and the results were compared to check the accuracy. The algorithms, including BP artificial neural network, Random Committee, Random Forest, and Bagging, were developed for the prediction of TTT diagrams with relevant descriptors comprising the alloying elements, austenitizing temperature, and holding time. The results showed that such combinations could achieve high predictive accuracy on TTT diagrams of stainless steel with a high correlation coefficient value and low root mean squared error value.
Finally, Geng et al. [15] used CCT diagrams to extract data and discussed their significance. In this study, machine learning approaches were used to predict the CCT diagrams of tool steels using relevant material descriptors, including the chemical composition, austenitizing temperature, and cooling rate. The authors demonstrated that Random Forest proved to be the best model to accurately predict the pearlite transition temperature and martensite transformation start temperature. They found that K-Nearest Neighbors and Bagging were suitable models for predicting the start and end temperatures of bainite formation, respectively. These optimal models were then used to predict the CCT diagrams of T8, 6CrW2Si, 4CrMoV, CrMn, and Cr12W.
Drawing from this literature, in this work, we employ the principles of machine learning to simultaneously determine the mechanical properties and phase fractions of any steel that undergoes a continuous cooling transformation. In doing so, this work has focused on developing a generic model that is applicable to low-, medium-, and high-carbon steels. Specifically, the inputs to the algorithm include the chemical composition and cooling profile of the steel, and the outputs from the algorithm include the hardness and phase fractions of martensite, bainite, perlite, and untransformed austenite.

3. Methods

3.1. Database Creation

Continuous cooling transformation (CCT) is a fast and energy-efficient approach to designing steels with an array of mechanical properties. In conjunction with the alloying elements, this thermomechanical processing schedule with a variety of possible cooling profiles results in unique microstructures with a combination of phase fractions that can result in specific mechanical properties.
In constructing the database for this study, we extracted the cooling profiles [16] and resulting Vickers hardness values from the CCT diagrams of various types of steel listed in the steel atlas 24 [12]. Specifically, data from 39 different steels were collected with multiple cooling profiles for these steels. Thus, a total of 380 records were obtained. An example of the extracted cooling profiles and other relevant data from the digitized images in the atlas is shown in Figure 1. Each extracted record had information pertaining to the temperature-dependent cooling profile, chemical composition, phase fractions, and hardness value of the resulting steel. Table 1 and Table 2 summarize the input and output parameters, respectively, along with the ranges of these parameters.
To address the limited size of the dataset and account for the expected experimental variability, we implemented a data augmentation strategy. Specifically, in this approach, we adjusted the hardness values by ±0.2% while keeping other input parameters constant. This helped expand the dataset to 1134 records. Next, the augmented dataset was shuffled, and 80% of the dataset was randomly allotted for training, and the remaining was used for testing.

3.2. Description of the Cooling Profile

Three distinct approaches were considered to represent the cooling profile (time–temperature relationship) for input into the neural network (NN):

3.2.1. Lagrange Interpolating Polynomial

This strategy involved fitting a second-degree Lagrange polynomial [17] to 3 selected time–temperature pairs (e.g., the first, fourth, and eighth). The 3 coefficients of the polynomial were extracted and used as input features for the NN. Specifically, each cooling profile extracted from the atlas was defined by a set of 8 time-temperature points. To create a second-degree Lagrange polynomial, 3 specific data points were selected from this set of time-temperature points, i.e., ( t 1   1   , T 1 ), ( t 4   , T 4 ) and ( t 8 , T 8 ), where the subscript indicates the data point from the set. These points were strategically chosen to provide a representative snapshot of the entire cooling profile, capturing key characteristics of the underlying function. A second-degree Lagrange polynomial was constructed using these 3 data points.
In t 1 , f t 1 , t 4 , f t 4 , t 8 , f t 8 , t 1 , t 4 , and   t 8 are the time values and f t 1 , f t 4 , f t 8 are their corresponding temperatures. The cooling profile can be written as:
T t = f t 1 L 1 t + f t 4 L 4 t + f t 8 L 8 t
where the Lagrange-based polynomials, L i t , are given by:
L 1 t = t t 4 t t 8 t 1 t 4 t 1 t 8
L 4 t = t t 1 t t 8 t 4 t 1 t 4 t 8
L 8 t = t t 1 t t 4 t 8 t 1 t 8 t 4
Substituting these into the expression for T, we get:
T t = f t 1 t t 4 t t 8 t 1 t 4 t 1 t 8 + f t 4 t t 1 t t 8 t 4 t 1 t 4 t 8 + f t 8 t t 1 t t 4 t 8 t 1 t 8 t 4
This is analogous to a standard polynomial [18,19] of the form:
T t = a t 2 + b t + c
The coefficients a, b, and c can be determined by expanding the expression in Equation (3) and collecting like terms. Next, the constructed polynomial was evaluated at all of the given time values in the dataset to deduce the corresponding temperature values. The temperature predicted by the polynomial was compared with the temperature from the value extracted from the CCT profile to establish the accuracy of the profile described by Equation (4).

3.2.2. Least Squares Approximation

In this approach, we utilized all 8 available time–temperature pairs to fit a second-degree polynomial using the least squares method. The 3 coefficients of the polynomial were then used as inputs to the NN. To calculate the coefficients, unlike the Lagrange polynomials method, which only used 3 specific points in every cooling profile, the least squares method considered the entire dataset, seeking to minimize the sum of the squares of the differences between the predicted and true y-values.
The mathematical formulation of the second-degree polynomial is as described in Equation (4), where the coefficients a, b, and c are determined by solving a system of linear equations that result from minimizing the sum of the squared errors:
E r r o r = i = 1 i = 8 y i a x i 2 + b x i + c 2
In the above equation, y i is the actual temperature in the profile in the dataset. By solving this optimization problem, the coefficients were obtained to represent the best-fitting polynomial for the 8 data points.
Table 3 shows the results of the mean relative error (MRE) obtained after transforming the data using the above two mentioned methods and feeding the inputs to the NN model for training and testing. As seen in this table, the least squares approach was more accurate. This was expected since it used more information from every profile to determine the coefficients in Equation (4).

3.2.3. Directly Using All Temperature–Time Pairs

Finally, in this strategy, we directly employed all of the time–temperature pairs from the cooling profile as inputs into the NN, preserving the complete information about the cooling profile. There were no errors associated with this approach since the true cooling profile was directly used as input to train the neural networks.
As expected, after analyzing the three approaches, the third option—directly using all of the temperature–time pairs—was found to yield the most accurate results. By avoiding the constraints and potential errors associated with polynomial fitting, this approach leveraged the power of the NN to capture the underlying complexity of the cooling profile.

3.3. Neural Network Architecture for Hardness

In this research, a three-layer neural network known as a multi-layer perceptron (MLP), a type of feed-forward neural network, was employed. MLP was chosen because of its ability to manage multiple inputs, model non-linear relationships, and its flexibility towards architectural modifications. This made it well-suited for predicting steel hardness based on a dataset consisting of 23 features.
A schematic of the NN employed in this work is shown in Figure 2. As seen in this figure, the third layer of the network, i.e., the output layer, consisted of a single neuron, and the output of this neuron corresponded to the hardness value of steel with a given composition and thermomechanical processing schedule. The number of neurons (nH) in the first layer corresponded to the number of input parameters that were supplied to the NN. Specifically, the inputs to the NN included the concentrations of 15 alloying elements and a set of 8 time-temperature coordinates that helped to define the cooling profile, all of which were independent of each other. The second layer was the hidden layer, which had the same number of neurons as the input layer. This number was obtained after an exhaustive analysis of the different number of neurons in this layer and a combination of various hyperparameters, eventually confirming that using 31 neurons in the hidden layer provided the best R2 value for the NN predictions. The need for this rigorous exploration stemmed from the fact that, usually, the number of neurons in these hidden layers can significantly impact both the accuracy and complexity of the neural network [20]. Too few neurons may inadequately capture the trend in the training database, while too many neurons can result in overfitting of the training dataset [19,20]. Thus, multiple networks were created to ascertain the optimal number of neurons. The architecture of the neural network model, including the various hyperparameters, is summarized in Table 4.

3.4. Neural Network Architecture for Phase Fractions

Similarly, the same neural network architecture, the one developed for predicting the hardness values, was utilized for predicting the phase fractions of the steels. However, in this case, instead of predicting hardness, the phase fractions of ferrite, martensite, pearlite, and bainite microstructures were predicted. A distinct neural network with a three-layer structure consisting of two hidden layers and an output layer was established for each microstructure prediction. This architecture was consistent with that used by Geng et al. [21] to determine the phase fractions in low-alloy steels.

3.5. Neural Network Architecture for Phase Fractions

Once the neural network was designed, we conducted a sensitivity analysis to determine the impact of the individual chemical compositions on the hardness values predicted by the model. For this, we employed a systematic approach wherein each metal composition was perturbed in the range [−5%, +5%], while all other variables were held constant. This method enabled us to assess the influence of each alloying element on the overall hardness prediction. Specifically, the focus was on the absolute percentage change in predicted hardness in response to changes in the individual alloying element content. This approach elucidated how each composition affected hardness, providing insight into the critical factors affecting accurate hardness prediction.
It must be noted that this analysis relied on the assumption of independence between variables, which may only sometimes hold true in complex systems such as micro-alloyed steel. Additionally, the linearity of the response within the range of −5% to +5% variation may not be valid for larger perturbations. Nevertheless, this analysis provides valuable preliminary insight into the model’s sensitivity to changes in the chemical composition of steel.

3.6. MLP Training

The pre-processed database was used for the training and testing of the MLP models. From the dataset, 85% of the data was allocated for training, while the remaining 15% was reserved for testing. These testing configurations were pivotal in gauging model performance since the MLP models were not exposed to testing data during the training phase. The efficacy of an MLP model is intrinsically linked to the training parameter values chosen for that specific model.
The optimal training parameter combinations for each model were cherry-picked based on the highest R2 value, computed for each MLP using the formula:
R 2 = 1 i = 1 N y i y i ^ 2 i = 1 N y i y ¯ 2
in   which
y ¯ = i = 1 N y i N
In the formulas above, N represents the number of steel compositions considered from the respective dataset. y i ^ ,   y i , and y ¯ denote the predicted properties for composition i by the MLP model, the values derived from the experimental results, and the mean of the values from the experimental results, respectively. The search parameters listed in Table 4 outline the parameters used for each MLP model, corresponding to their R2 values. Finally, the combination of parameters that gave the most appropriate R2 is summarized in Table 5. The learning rate was held constant for the models, utilizing the Adam optimization algorithm.
Before training the model, the bias and model weights (w) were initialized using the Glorot uniform initializer. The weights of neurons in every layer were initialized with random values from a uniform distribution, U[a, b], where a and b are the bounds of the distribution. The uniform distribution bounds for the neurons in layer k were dependent on the number of neurons in the previous layer. Specifically, with nk−1 neurons in the (k − 1)th layer, the initial weight values for the neurons in the kth layer were individually assigned via the following equation:
w k U 1 n k 1 , 1 n k 1
The weights and bias values were updated during model training via the appropriate optimization algorithm of each model (c.f. Table 4). The Adam optimization algorithm was applied to train the MLP models. The Adam algorithm uses the first (mt) and second (vt) order moments of the predicted cost gradient to update the values of weights and bias. This algorithm was applied to train the MLP models, using the parameters defined in Table 5. Following the best practices outlined by Kingma et al. [22], the first (β1) and second (β2) order moment bias values were set to 0.9 and 0.999, respectively. The Adam algorithm can train models with a higher learning rate and converge more quickly to a set of model weights and bias values, yielding highly accurate predictions [22]. The learning rate for the Adam algorithm was initialized to 1 × 10⁻³ and automatically optimized throughout training by the algorithm.
The cost function is defined by the mean square error (MSE) and includes the predicted potential energy values in the formulation. Thus, for N steels, MSE is defined as
M S E = 1 N i = 1 N y i y i ^
where N is the number of steels in the training set; and for the ith record in this dataset, y i ^ , and y i are the steel hardness or phase fraction predictions by the MLP model and the actual values obtained from the experiment, respectively.

3.7. Termination Criteria of the Training Algorithm

The final models were trained using the optimal parameters summarized in Table 5. All models used the same termination criteria. With an epoch being a single training iteration over all training configurations, the model training was terminated if:
  • The number of epochs reached 1000.
  • The MSE cost was below 1 × 10⁻³.
  • The MSE cost did not improve over the previous 40 epochs.
These termination criteria were set to limit model training time and prevent over training. Upon completion of training, the weights and bias values were recorded as the final values for the respective model.

4. Results and Discussion

In this study, feed-forward neural networks were used to determine steel’s hardness and microstructure volume fractions. In the sensitivity analysis, we varied individual metal compositions by 5% and observed the effect on predicted hardness.

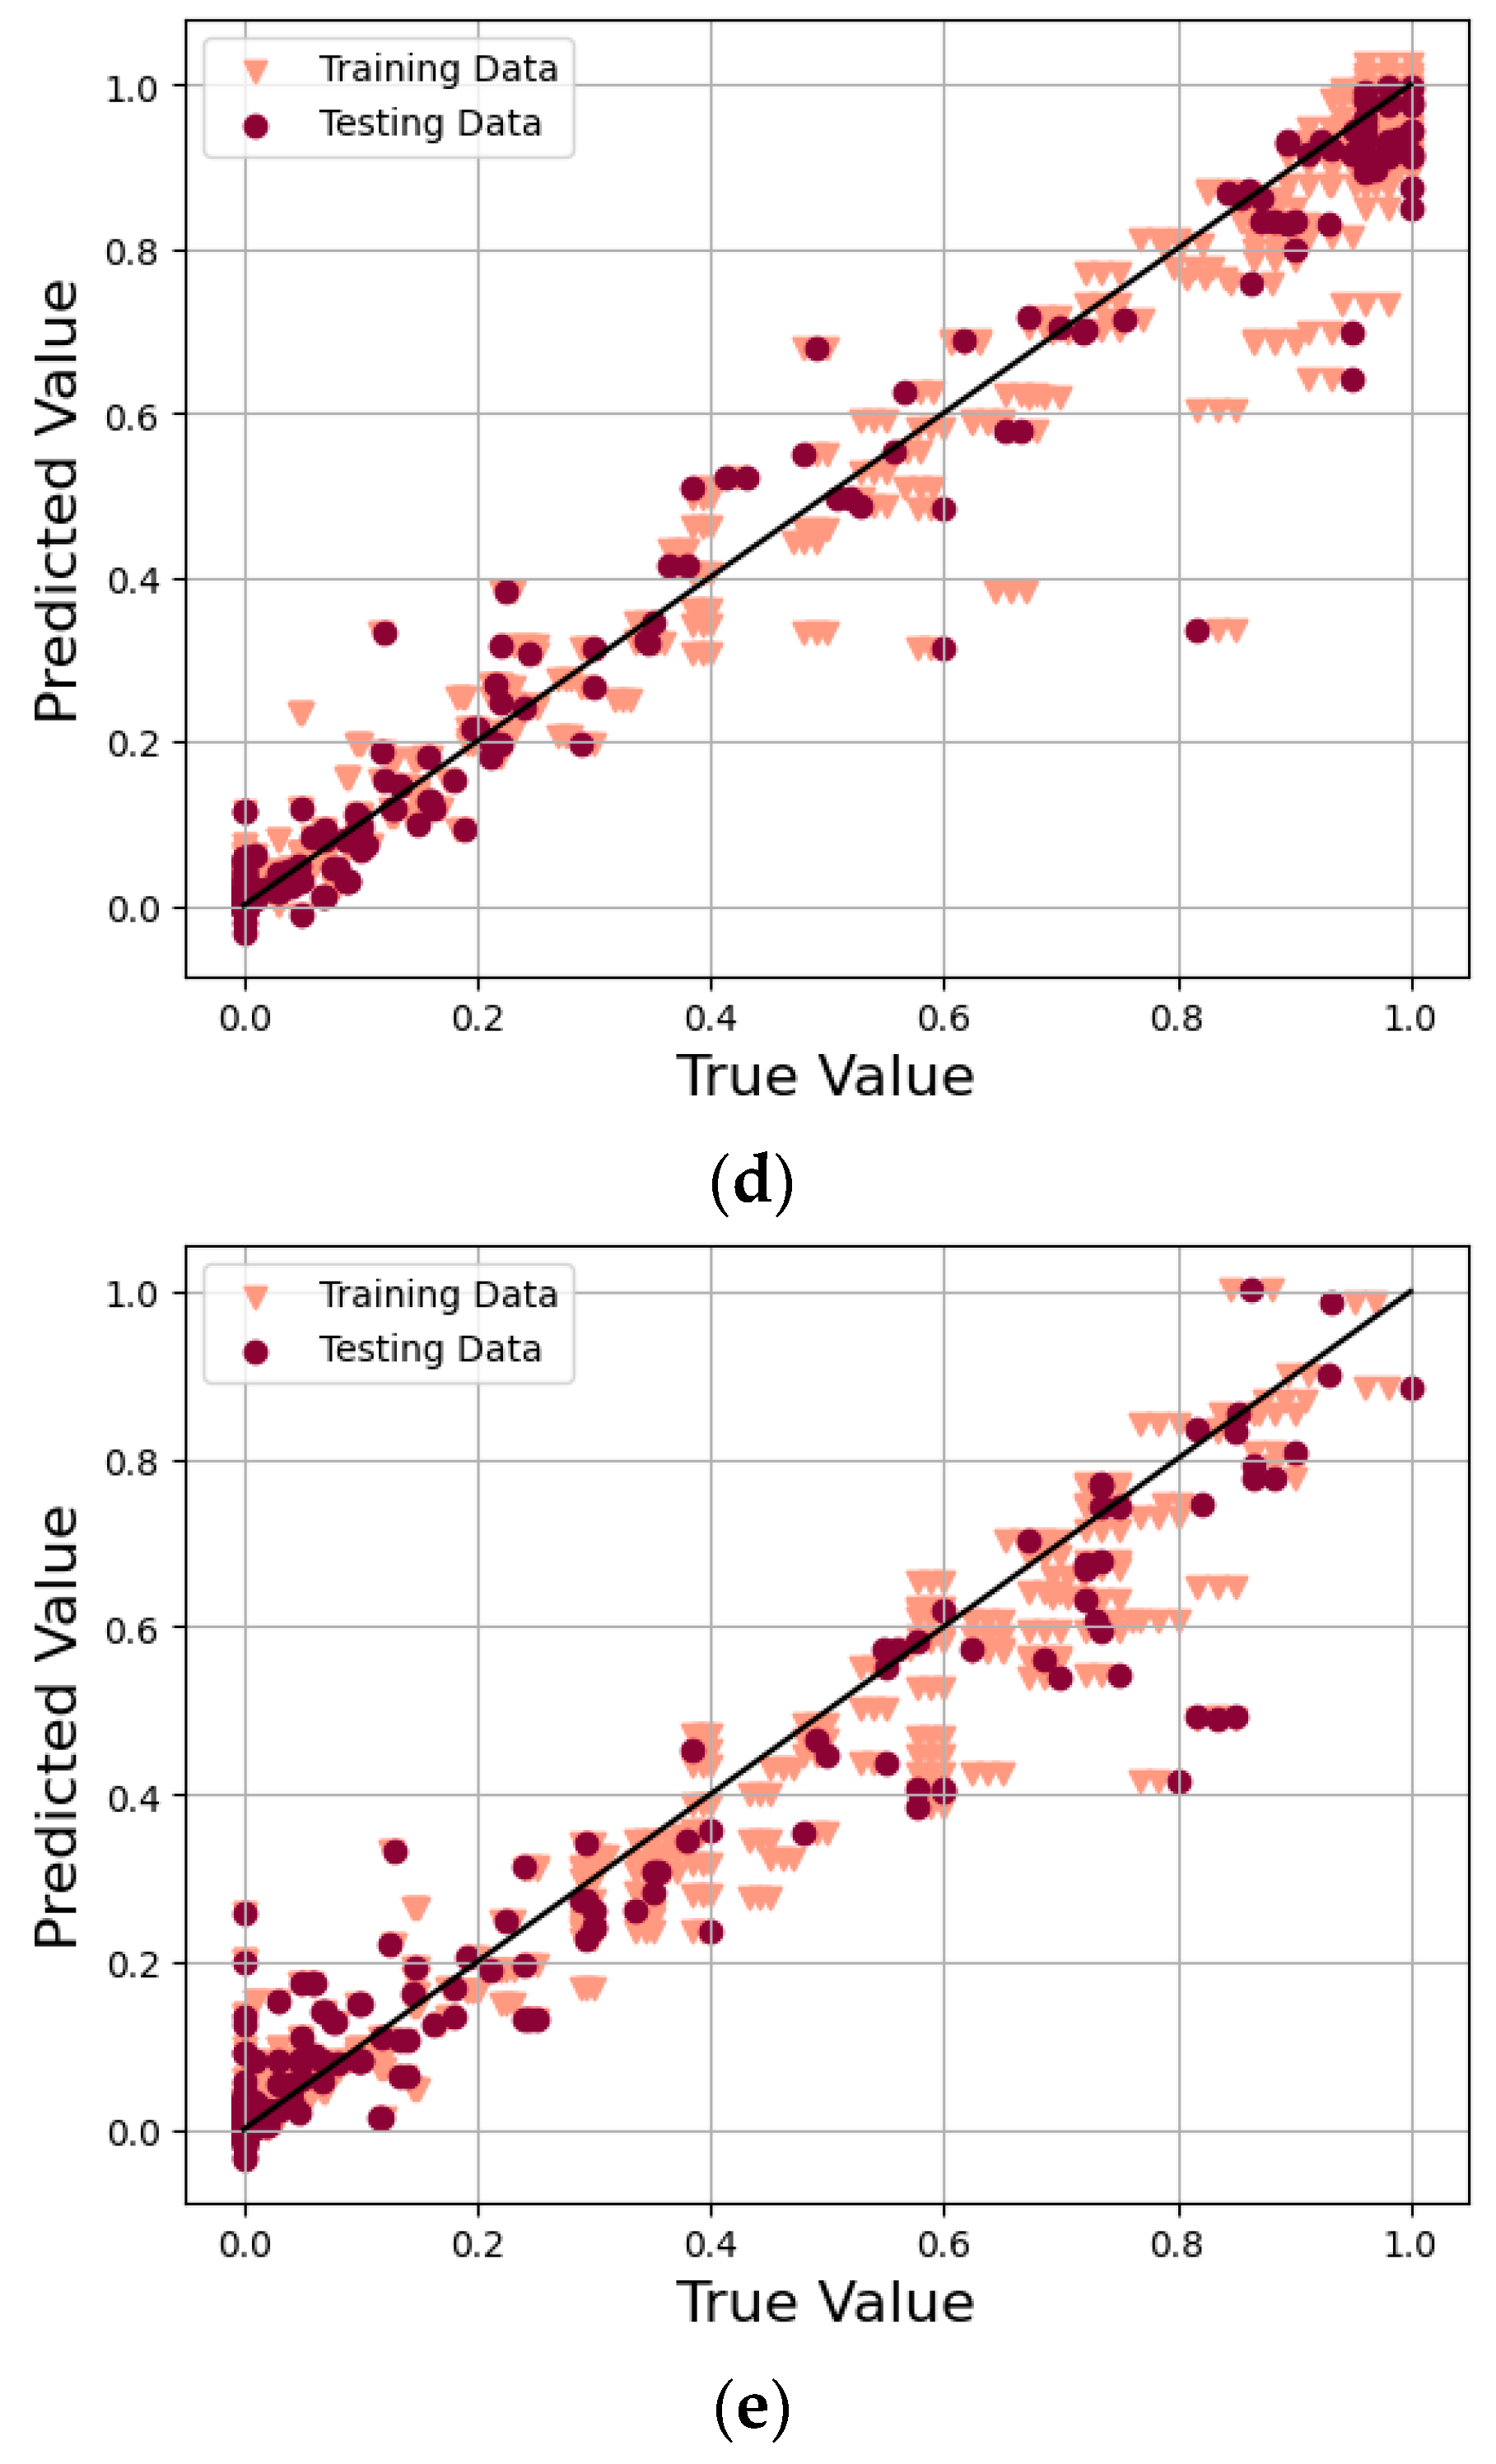
4.1. Evaluation of the Neural Network

For the 5 MLP models developed in this study, the coefficient of determination (R2), described by Equation (6), was the selected indicator of model performance. The coefficient of determination provides a ‘goodness of fit’ with the highest possible value being 1. Higher values of R2 are desirable as they indicate strong prediction performance. However, R2 values equal to or approaching 1 are undesirable as they are indicative of over-training and lack of generalization. R2 was computed based on the test dataset of each model (25% of the dataset), and the results are summarized in Table 6.
The results of the training and testing phases are also shown in Figure 3. As seen in Figure 3a, the hardness points appeared tightly knit, with the diagonal line indicating an R2 close to 1. This suggested that our model was well-trained and performed well on the testing set. In view of the fact that the test data for a variety of steels was also well-predicted, it could be said with confidence that the model was able to predict the hardness values for a variety of steels with a good level of accuracy.
Figure 3b shows the ferrite fraction of various steels. As seen in this figure, while there was good agreement with the experimental data, there was some scatter in the training as well as test data that showed a marked deviation from the experimental data. Nevertheless, the majority of data aligning along the diagonal was an indicator of good fit.
The prediction of the pearlite fraction for the various steels is shown in Figure 3c. As seen in this figure, the quality of prediction of the pearlite fraction was very similar to that of the ferrite fraction. In other words, there was excellent agreement with the experimental data. While there were a few outliers, the overall R2 value of 0.97 was an excellent indicator of the accuracy of the model in predicting the fraction of pearlite for a variety of steels.
A similar trend was seen for the prediction of the martensite content in steel. The results are shown in Figure 3d. As seen in this figure, the martensite fraction was well-predicted for a variety of steels. More precisely, the R2 value for the martensite fraction was 0.98. There was a slight increase in the scatter around the phase fraction of 0.4–0.8. This was expected because of the fewer points in the training and testing datasets for the fraction of martensite.
Finally, the prediction of the phase fraction of bainite is shown in Figure 3e. As seen in this figure, unlike the other phases and the hardness value, there was a larger error in predicting the bainitic phase fraction. Once again, this was attributed to the fewer data points available for steels with the bainitic phase fraction in the range of 0.4–0.8. Nevertheless, the R2 value in predicting the bainite fraction was 0.95, indicating a fairly accurate model for a large variety of steels.
In summary, based on these results, our models were accurate in predicting both the phase fractions and hardness. In all models, further enhancements of the models with additional training were avoided to prevent overfitting.

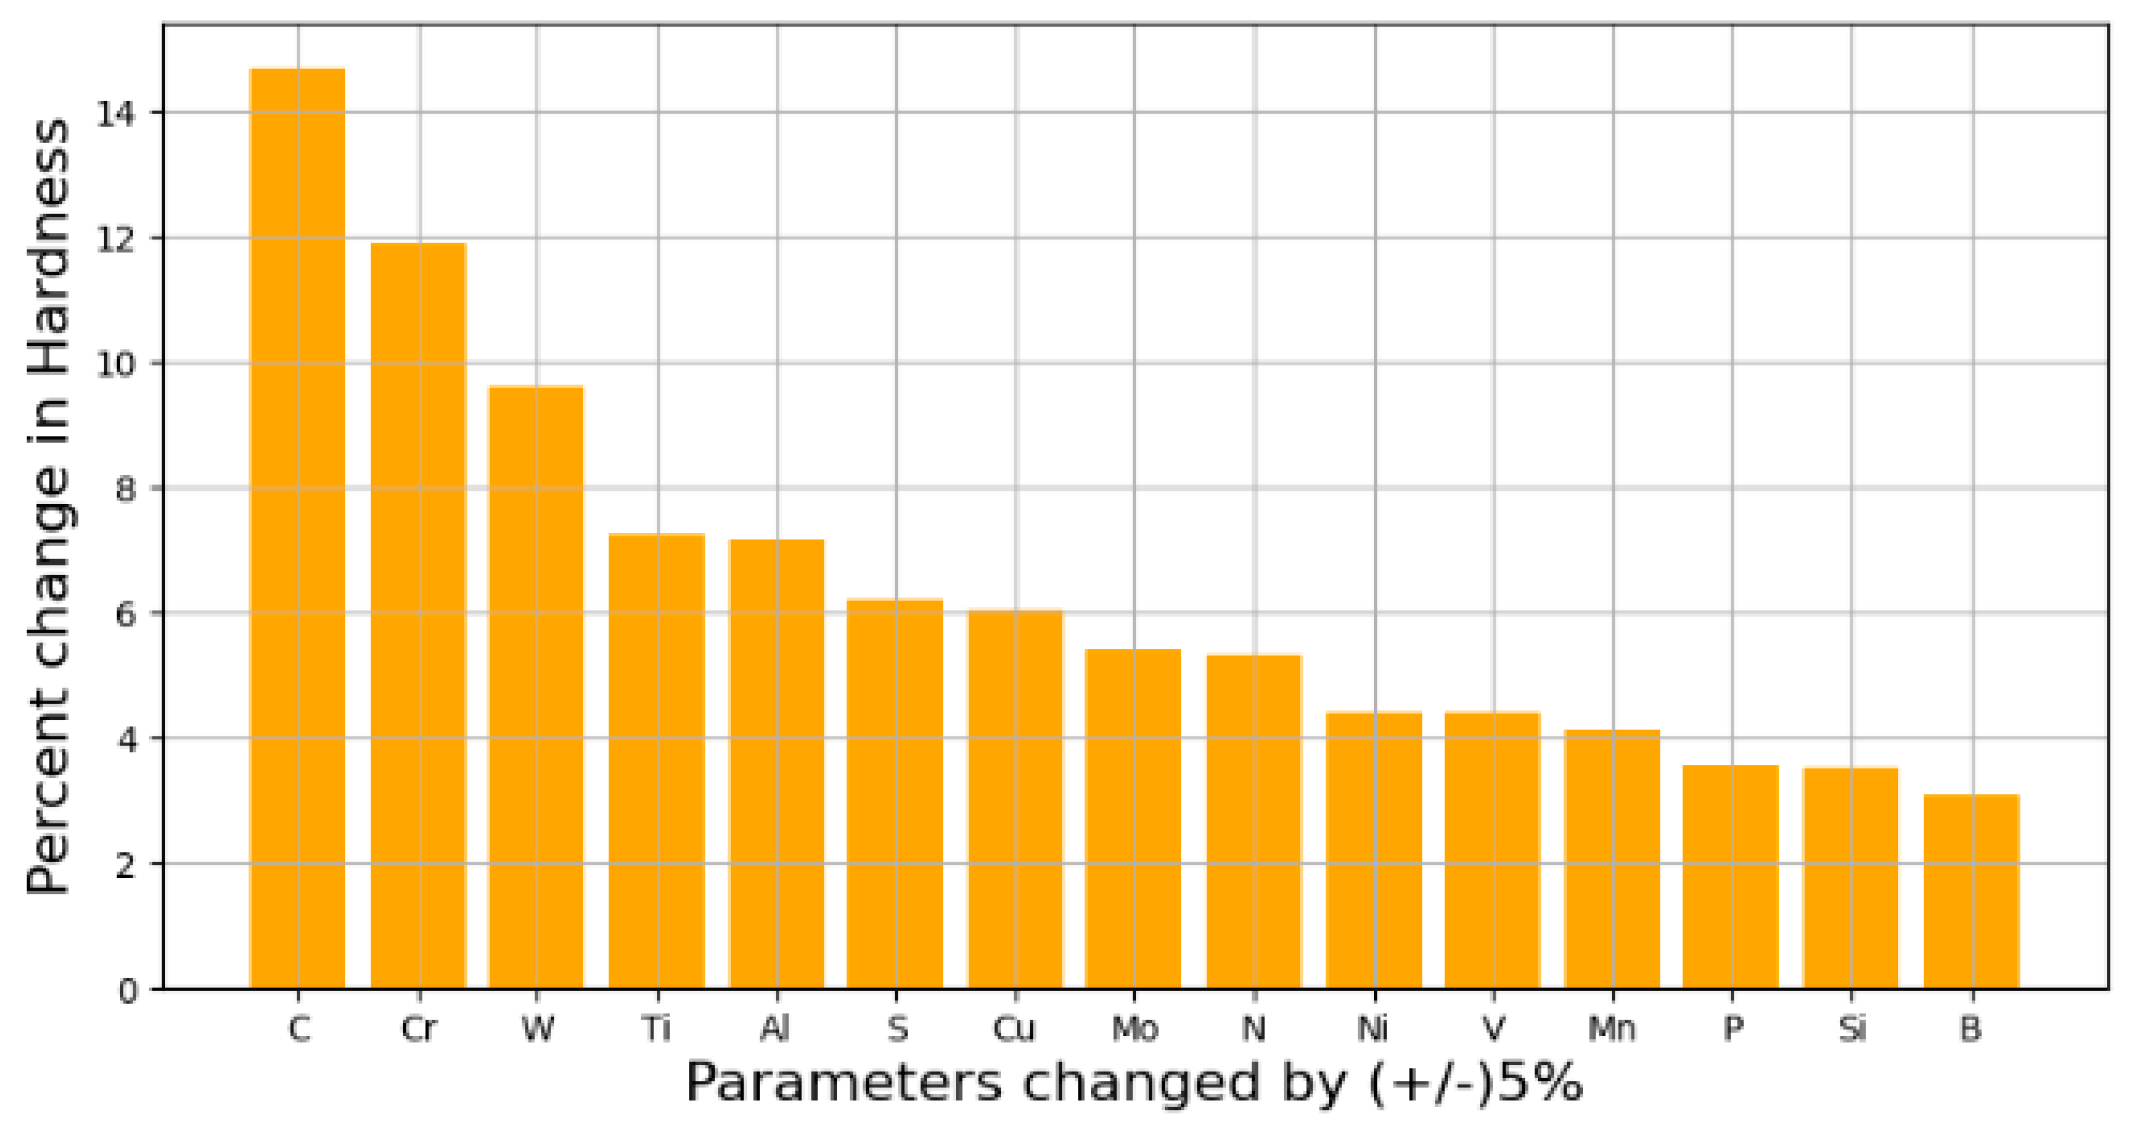
4.2. Sensitivity Analysis

The models developed in this work included numerous input parameters. In developing a reasonable model that is not mathematically ill-conditioned, it is essential to evaluate the parameters for their sensitivity. To determine this, a sensitivity analysis was conducted on 850 datasets, corresponding to the training data, from the database. For each steel, one parameter was varied by 5% on either side of its standard value and the effect on the hardness value was determined. The average effect of each parameter on the training dataset is shown in Figure 4. As seen in this figure, carbon and chromium had the most significant impacts on hardness. In the ensuing subsections, we study the impacts of these two elements in further detail.

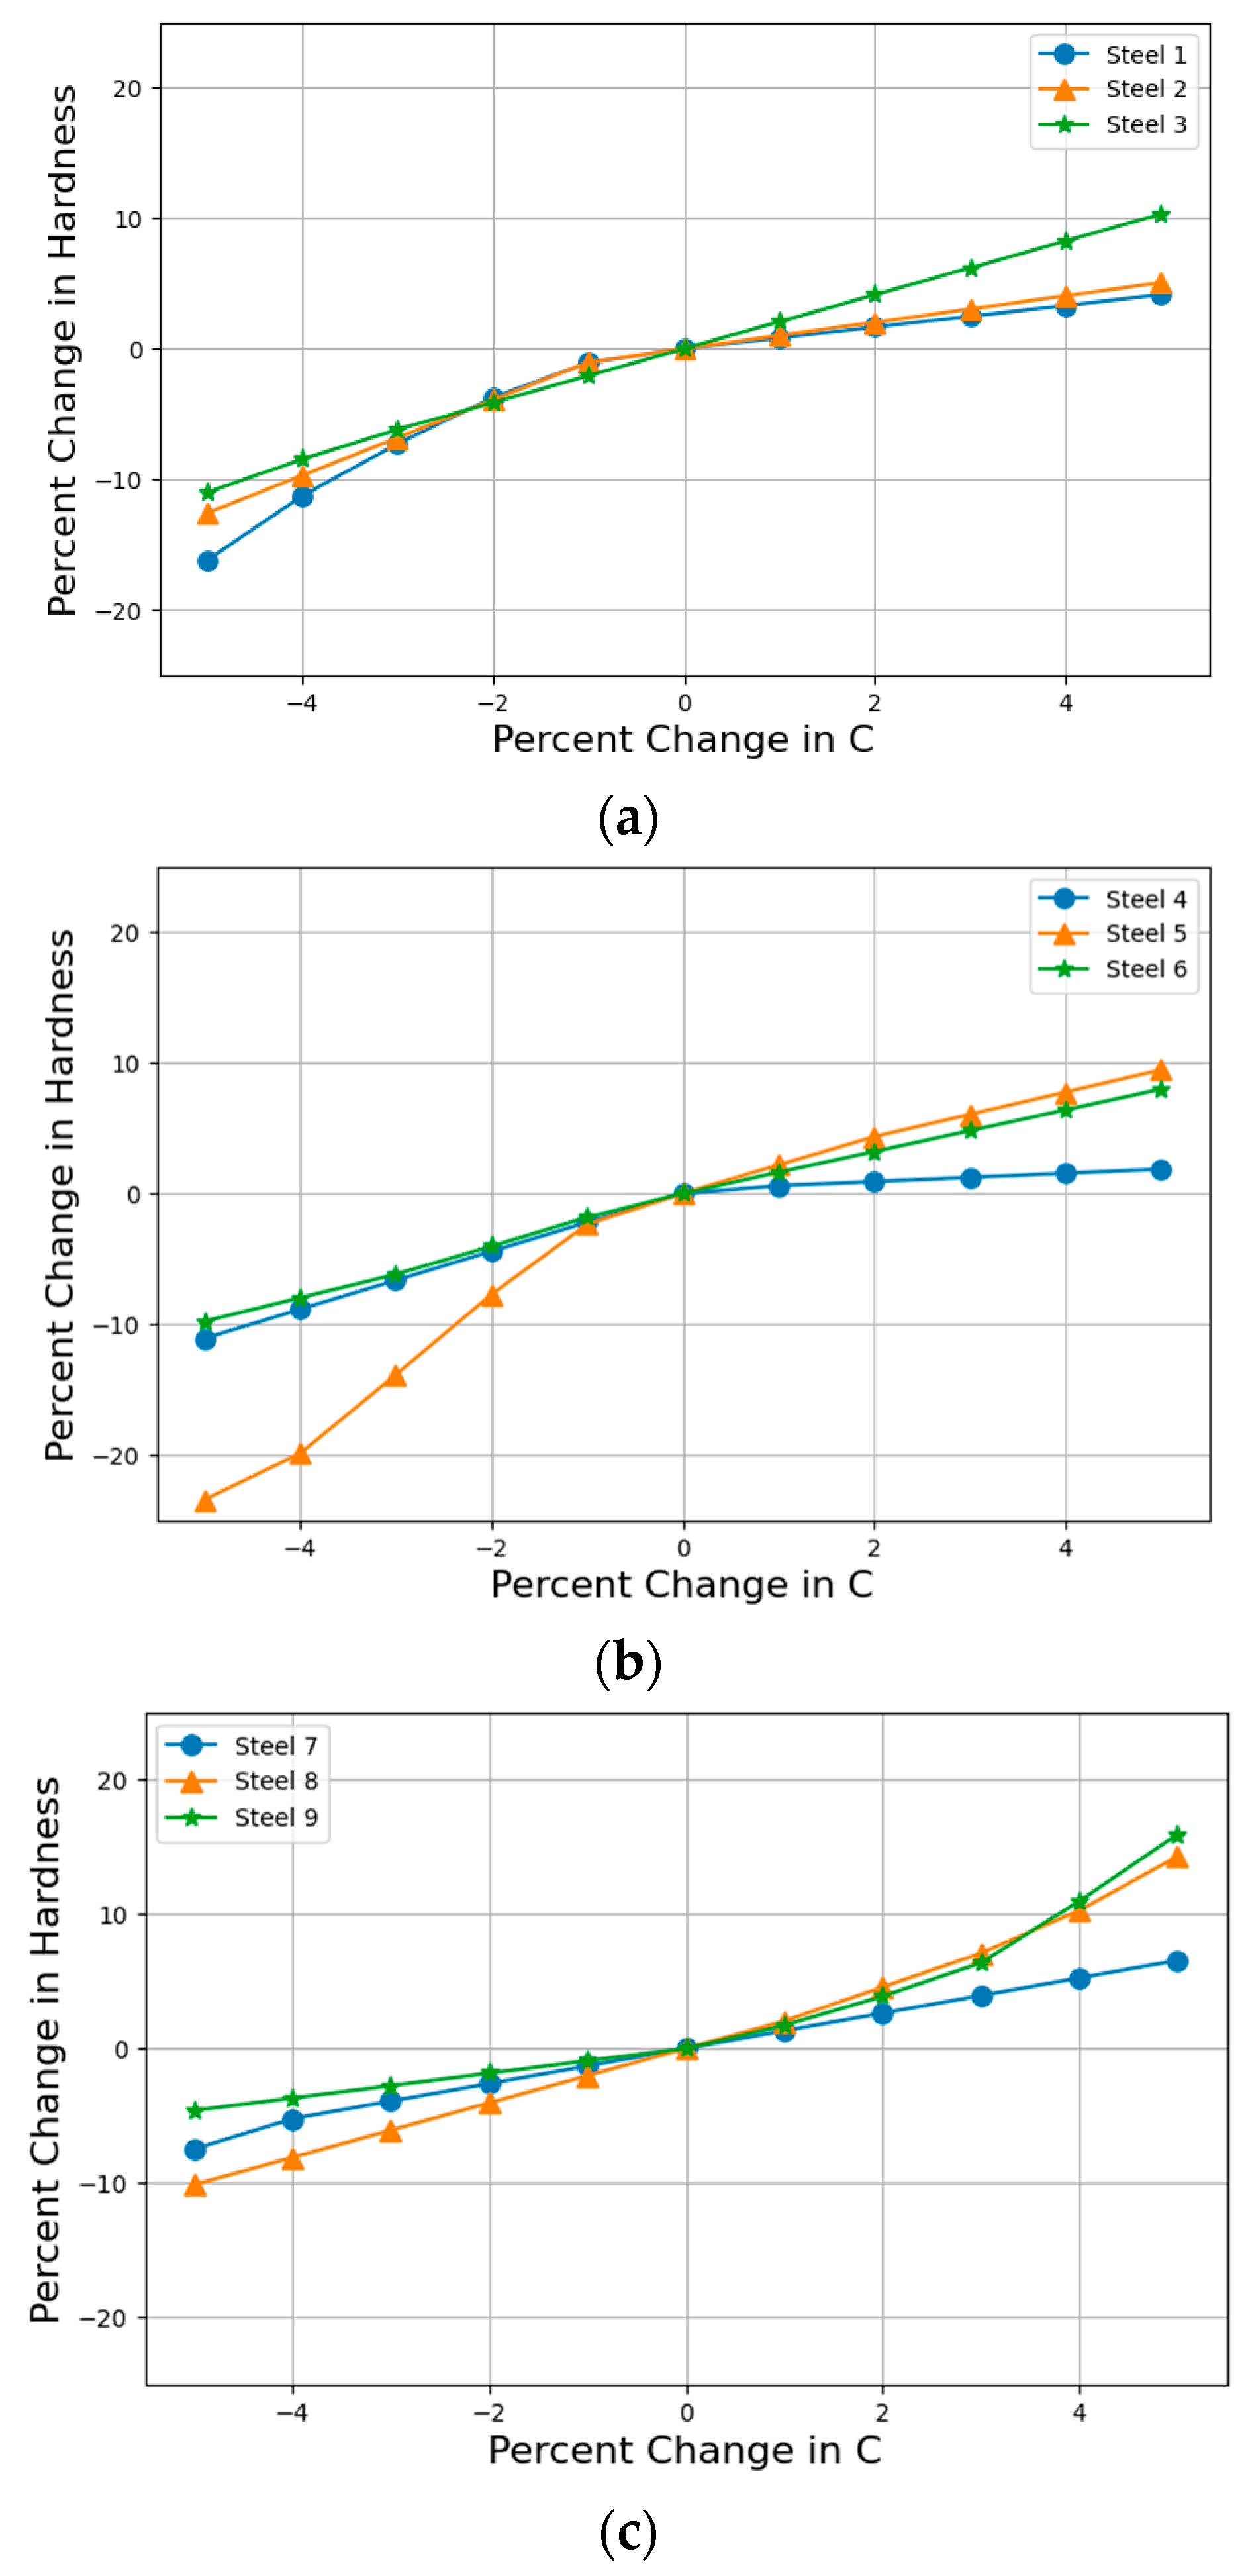
4.2.1. Analysis of the Impact of Carbon Content on the Hardness of Steel

Figure 5 shows the effect of increasing the carbon content on steel’s hardness. In understanding the trend, in Figure 5a, we observed a rising trend in hardness as the carbon content in the high-carbon steel increased. The calculated hardness values of the three standard steels were 885, 872, and 609, which were in excellent agreement with the experimental hardness values of 890, 885, and 633, respectively. Comparing the three steels, Steels 1 and 2 showed only a small increase in the hardness value when the carbon content was increased, indicating a saturation of the martensite content contributing to the maximum possible hardness values. On the other hand, Steel 3 showed a significant increase in hardness, as the martensite fraction of the steel was far from saturation.
Figure 5b displays interesting results for the medium-carbon steel. Steel 1 reached a plateau in hardness with an increase in carbon content. More precisely, when the carbon content was increased by 0.20%wt, the hardness value only increased from 467 to 475. This suggested that perhaps the other elements played a role in contributing to the hardness of this particular steel. Steels 2 and 3 showed a significant increase in hardness with an increase in carbon content. This was probably due to the higher manganese content in these steels. The original calculated hardness values for Steels 2 and 3 were 640 and 264, respectively. The maximum hardness values achieved when adding 0.20 wt% carbon were 643 and 188, respectively. Steel 3 exhibited a significant decrease in hardness when the carbon content was decreased. In fact, for this particular steel, a reduction in the carbon content put this steel in the low-carbon steel category.
In Figure 5c, it is particularly intriguing to observe the results for the low-carbon steel. The graph depicts the highest variation in the increase in hardness when the carbon content was increased. The experimental hardness values of the standard steels were 205, 294, and 339, respectively, which were a bit higher than the calculated hardness values of 110, 215, and 284, respectively, for the three steels. Steels 2 and 3 demonstrated considerable increases in hardness when the carbon content was raised by 0.20 wt%, resulting in hardness values of 246 and 329, respectively. Steel 1, on the other hand, showed a relatively lower impact from an increase in carbon content, indicating that other alloying elements (most likely the low chromium content) contributed to its hardness as well.
In general, our model predicted that hardness increases with the carbon content of steel, and this is consistent with the findings in the literature. For example, Wang et al. [23] found that with increasing carbon content in steel, the hardness increased and impact toughness distinctly decreased due to the increasing supersaturation of carbon and refinement of martensite [23]. Similarly, Sotoodeh et al. [24] found that increasing the carbon content increased the mechanical strength and hardness but decreased the ductility and weldability of carbon steel. According to another study, the level of carbon content impacted both martensite hardness and hardenability. As the carbon content and martensite fraction increased, so did the hardness and strength [25].

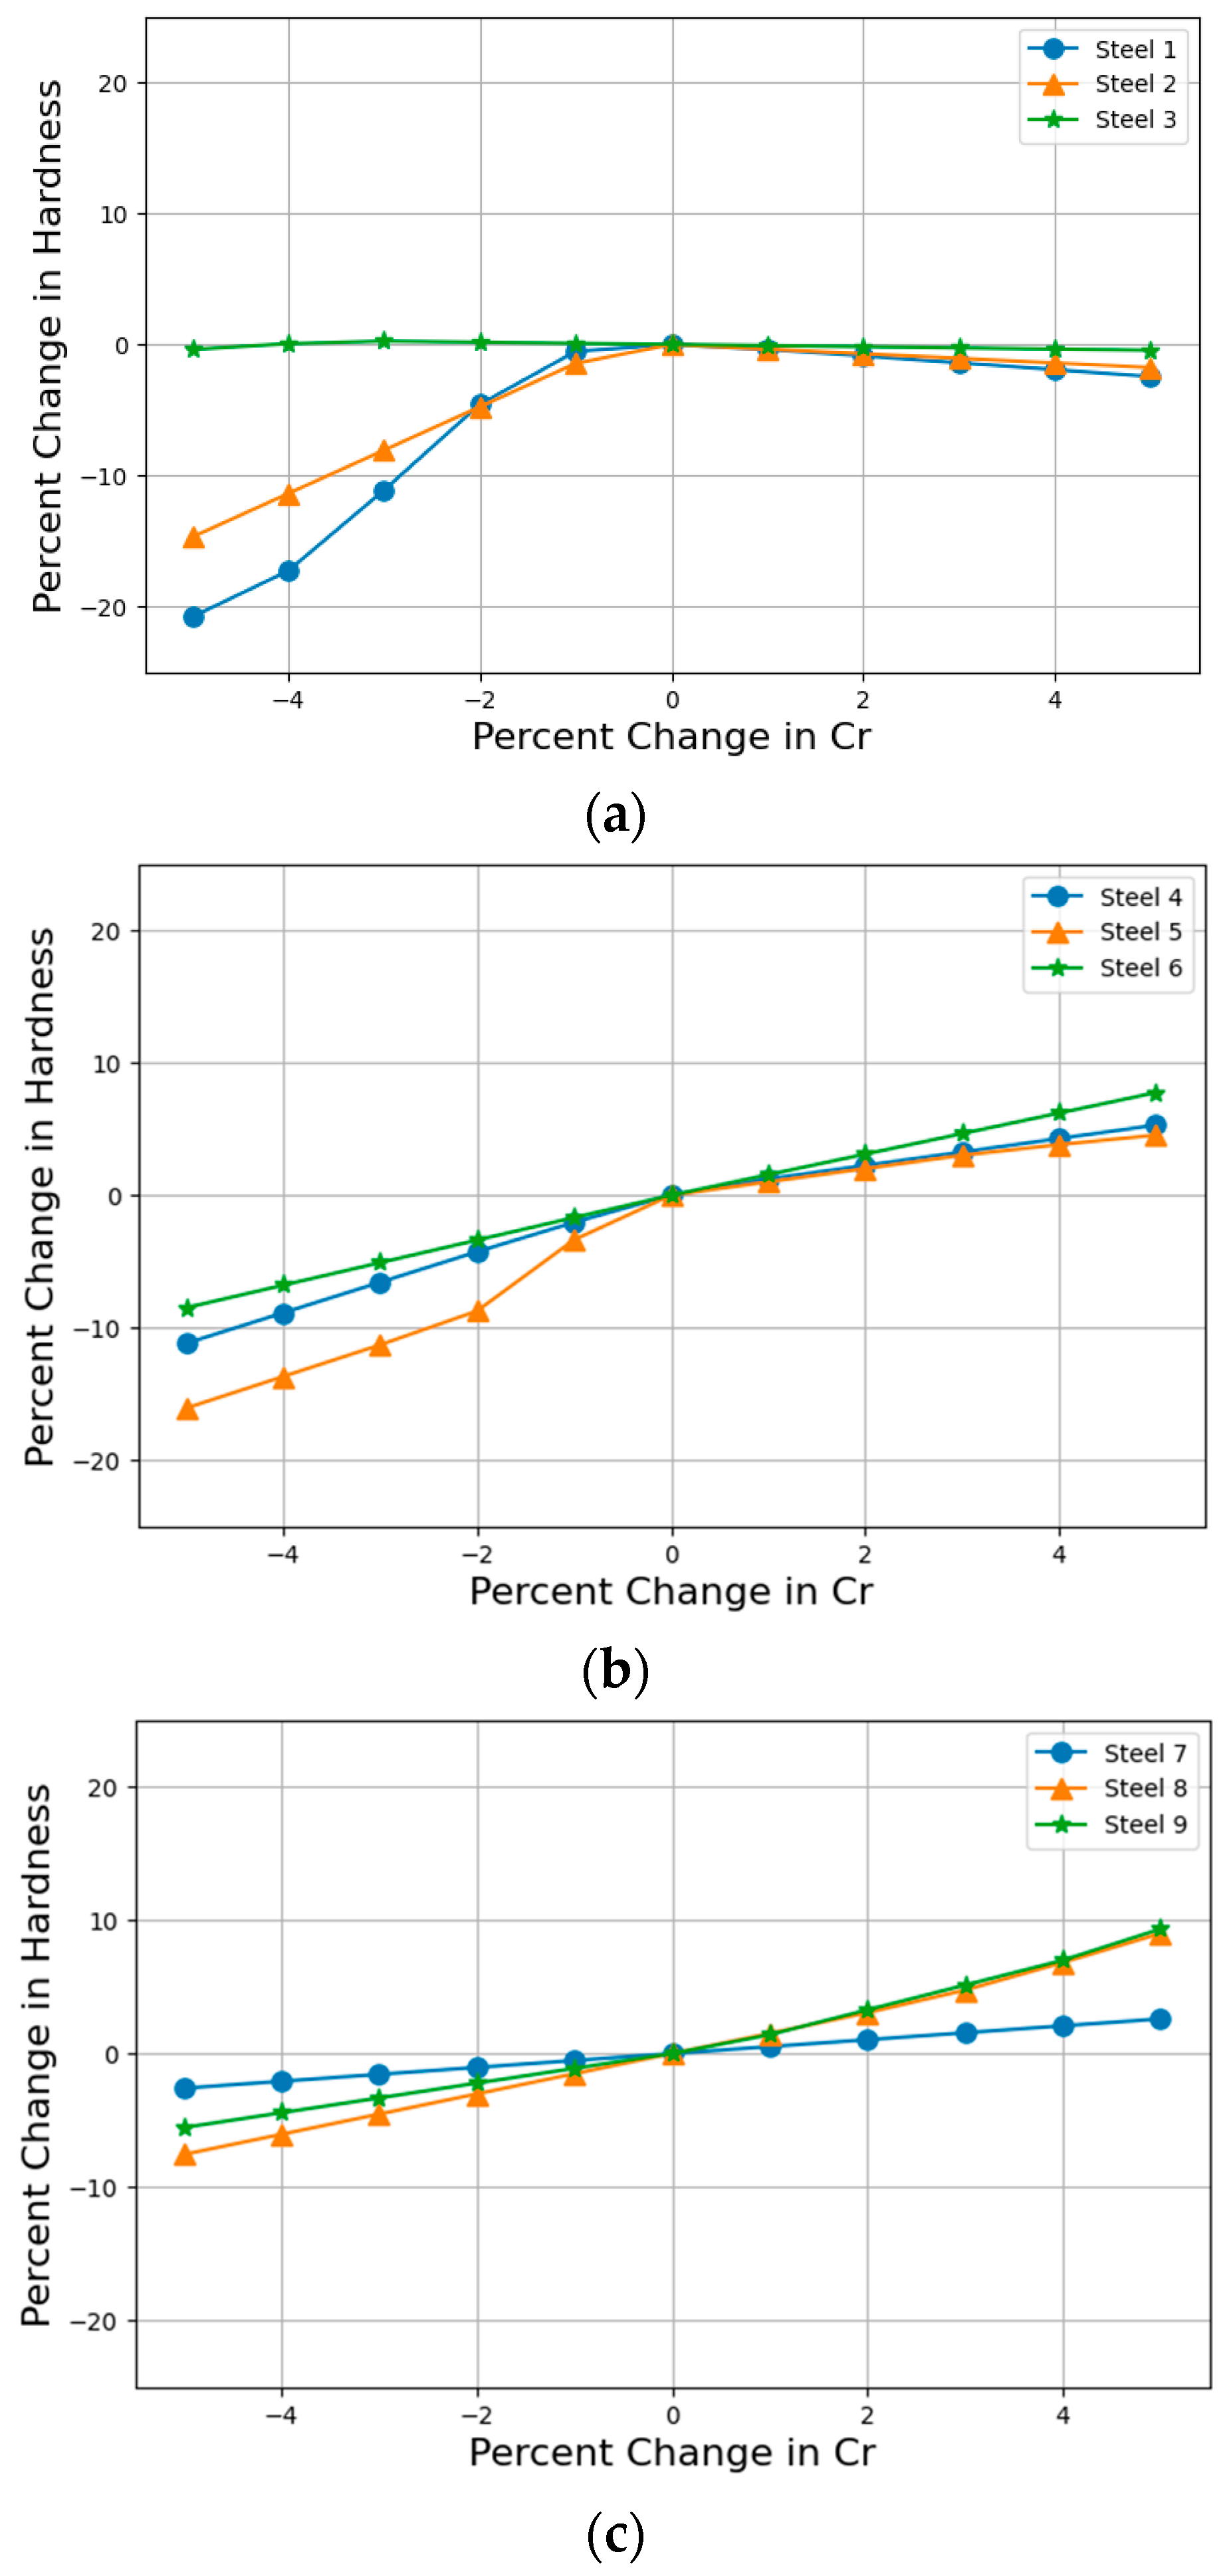
4.2.2. Analysis of the Impact of Chromium Content on the Hardness of Steel

As seen in Figure 6a, in the presence of high-carbon content, altering the fraction of chromium had almost no effect on the hardness of the first steel. When more chromium was added, the hardness of the three steels leveled off, indicating a saturation in hardness. With Steels 2 and 3, there was a slight decrease in hardness when the chromium content was decreased below the standard value of the steel. Specifically, the reductions in hardness values were 26, 28, and 26 for Steels 1, 2, and 3, respectively, which were not significantly different. This behavior was also observed by Khanh et al. [26] in high-manganese steel, wherein hardness did not change much when the chromium content increased from 2% to 2.5%. Interestingly, Steel 3, which had no chromium content, showed a change in hardness even when varying chromium in the range [0.13, 0.656] wt%, suggesting that the chromium content in that composition of metals had no effect on hardness. On the contrary, the hardness of Steels 2 and 3 decreased with a decrease in chromium content, indicating the contribution of chromium to hardness.
Figure 6b shows the hardness values for the medium-carbon steel. Once again, overall, there was a trend of increasing hardness with an increase in chromium content and vice versa. Steel 1 had the highest chromium content in the dataset at 13.12 wt%. We can observe that increasing the chromium content further by about 0.656 wt% resulted in a maximum positive change of around 5% from the original estimate of the hardness. On the other hand, reducing the chromium content by 0.656 wt% resulted in a decrease in the hardness percentage of around 10%. On the other hand, Steel 3 had zero chromium content and we can see that increasing the chromium content caused a significant increase in hardness, indicating that chromium affected the hardness of steel. In the case of Steel 2, the increase in hardness was not much, but it decreased quickly if we reduced the chromium content of the standard steel, showing that steel is sensitive to chromium content.
Finally, Figure 6c shows the hardness trends of three low-carbon steels. Steels 2 and 3 had interesting results, both showing similar percent changes in hardness when the chromium content was increased or decreased. Steel 2 had a chromium content of 0.97 wt% and carbon content of 0.22, while Steel 3 had a chromium content of 1.95 wt% and carbon content of 0.16.
In these steels, the hardness increased when the chromium content was increased by 0.6 wt%, and there was a decrease in hardness when the chromium content was reduced by 0.65 wt%. These results support Tian et al.’s [27] claim that adding the proper amount of chromium can significantly increase the micro-hardness of the matrix and macro-hardness of the alloy.
Our findings are in good agreement with the trends reported in the literature. For example, Khanh et al. [26] found that the hardness of high-manganese steel increased when the chromium content increased, but the hardness did not change much when the Cr content changed from 2% to 2.5% of the weight. Chromium tends to increase hardness penetration. This element has exciting effects on steel and improves the corrosion resistance of manganese steel. Chromium acts as a carbide former; thus, excess Cr in manganese steel will precipitate carbide at the grain boundary in the as-cast condition [28]. Similarly, Tian et al. [27] showed that when the proper amount of chromium element was added, the micro-hardness of the matrix and macro-hardness of the alloy were relatively high. The hardness of Fe-Cr-B alloy slightly decreased when the chromium content was more than 12 wt%.

4.2.3. Analysis of Other Alloying Elements

In the previous subsections, a detailed sensitivity analysis was conducted for carbon and chromium as their concentrations had significant impacts on hardness. In this subsection, we present a sensitivity analysis of the other elements that had much lower impacts on the hardness of steel. For this, we picked Steels 1, 5, and 8 from Table 7 as the baseline steels corresponding to low-, medium-, and high-carbon steels, respectively. The impacts on hardness due to varying the composition of each element by ± 5 % are shown in Figure 7.
As seen in Figure 7a, the hardness values varied non-linearly in the range [844, 886], [565, 597], and [214, 218] for the high-, medium-, and low-carbon steels, respectively, as concentrations were varied by ± 5 % . This corresponded to variations of 5%, 4%, and 1%, respectively, for the three steels from the baseline concentrations. In the case of phosphorus (Figure 7b), hardness varied in the range [877, 894] and [558, 601] for the high- and medium-carbon steels, respectively. Further, while the change was somewhat linear for the high-carbon steel, it was non-linear for the medium-carbon steel. On the other hand, there was almost no change in the hardness of the low-carbon steel. When the concentration of sulfur was changed in the steels (Figure 7c), we found that there was only a 2% change in the hardness of the high-carbon steel, i.e., [867, 896], from the baseline concentration of S. On the other hand, there was a larger change in the hardness of the medium-carbon steel, up to 7%, with the hardness varying in the range [549, 620] with respect to the baseline concentration. As in the case of phosphorus, there was no change in the hardness of the low-carbon steel. Variation in the concentration of Si had a very small impact on the hardness of the steels (Figure 7d). Specifically, the hardness of the three steels changed by only about 2% ([870, 889]), 3% ([573, 594]), and 1% ([213, 218]), respectively, from the baseline concentration of Si. A similar observation was made for the impact of Ni, as shown in Figure 7e. In this case, while there was almost no change in the hardness of the high- and low-carbon steels, the hardness of the medium-carbon steel varied by about 3% with respect to the baseline steel. In case of Mo (Figure 7f), the hardness varied by about 5% from the baseline high-carbon steel, with specific values in the range [837, 889]. For the medium-carbon steel, this variation was reduced to about 3%, with specific hardness values in the range [569, 592]. For the low-carbon steel, there was no impact from the change in Mo concentration on the hardness of the steel. Finally, as seen in Figure 7g, there was almost no change in the hardness of the high- and low-carbon steels when the concentration of Cu was changed by ± 5 % from the baseline concentration. On the other hand, there was about 4% variation in the hardness of the medium-carbon steel, with specific values in the range [563, 597].

5. Limitations of This Study

The main limitation of this work is the number of experimental datasets that were available for training the model. We extracted data from 39 different steels from the atlas and artificially expanded the database by assuming that the experimental error on the hardness was about 0.2%. This helped expand the database from 380 records to over 1100 records. As a result, the model training was based on a somewhat limited dataset. Another issue in training is that certain elements, such as N and B, were present in very low concentrations. Thus, the validity range of the model for these low concentrations was too narrow. In terms of data on the phase fractions of the steels, the values were obtained as reported in the diagrams in the atlas. In some instances, the values of phases that were very small were not reported and we assumed that they were the remaining fraction in the steel. These assumptions may have introduced a certain bias in training. To overcome these unavoidable sources of error, it is important to have a more expanded database, which will require more experimental data.

6. Conclusions

Our study successfully developed a predictive model using a feed-forward neural network to determine the hardness values and phase fraction percentages of steel during heat treatment under specific cooling conditions. The model incorporates input variables such as time and temperature pairs from the cooling profiles and chemical compositions of steel. The model demonstrates high accuracy, as assessed by the R2 values obtained during the training and testing phases. Sensitivity analysis revealed that carbon and chromium are among the key input variables with the most significant impacts on hardness.
The findings of this research align with existing theoretical knowledge and experimental data, highlighting the effectiveness of the developed model in predicting steel properties under varied cooling conditions. The accurate prediction of phase fractions could guide us toward the optimal time-temperature cooling rate for steel production. By determining the optimum chemical composition and thermomechanical processing schedule, we can tailor the manufacturing process to achieve the desired mechanical properties of steel. Not only does this enhance the quality and performance of the resulting product, but it also presents the potential for considerable cost reductions in the manufacturing process.

Author Contributions

Conceptualization, G.S. and S.S.; methodology, A.B., S.T.B. and S.S.H.; investigation, A.B., S.T.B. and S.S.H.; writing—original draft preparation, A.B., S.T.B. and S.S.H.; writing—review and editing, A.B., G.S. and S.S.; supervision, G.S. and S.S.; project administration, S.S. All authors have read and agreed to the published version of the manuscript.

Funding

This research received no external funding.

Data Availability Statement

The data used in this study has been obtained from the Steels Atlas cited in Ref. [12].

Acknowledgments

The authors are grateful to the reviewers for their constructive suggestions to improve the quality of this manuscript.

Conflicts of Interest

The authors declare no conflict of interest.

References

  1. Celada-Casero, C.; Huang, B.M.; Yang, J.R.; San-Martin, D. Microstructural mechanisms controlling the mechanical behaviour of ultrafine grained martensite/austenite microstructures in a metastable stainless steel. Mater. Des. 2019, 181, 107922. [Google Scholar] [CrossRef]
  2. Yin, W.; Peyton, A.J.; Strangwood, M.; Davis, C.L. Exploring the relationship between ferrite fraction and morphology and the electromagnetic properties of steel. J. Mater. Sci. 2007, 42, 6854–6861. [Google Scholar] [CrossRef]
  3. Shi, B.L.; Zhang, C.; Tang, Y.W.; Wei, G.J.; Li, Y.; He, C.; Xu, K. Investigation on the Microstructure and Mechanical Properties of T23 Steel during High Temperature Aging. Mater. Sci. Forum 2020, 993, 575–584. [Google Scholar] [CrossRef]
  4. Jung, I.D.; Shin, D.S.; Kim, D.; Lee, J.; Lee, M.S.; Son, H.J.; Reddy, N.; Kim, M.; Moon, S.K.; Kim, K.T.; et al. Artificial intelligence for the prediction of tensile properties by using microstructural parameters in high strength steels. Materialia 2020, 11, 100699. [Google Scholar] [CrossRef]
  5. Bok, H.H.; Kim, S.N.; Suh, D.W.; Barlat, F.; Lee, M.G. Non-isothermal kinetics model to predict accurate phase transformation and hardness of 22MnB5 boron steel. Mater. Sci. Eng. A 2015, 626, 67–73. [Google Scholar] [CrossRef]
  6. Van Bohemen, S.M.C. Exploring the correlation between the austenite yield strength and the bainite lath thickness. Mater. Sci. Eng. A 2018, 731, 119–123. [Google Scholar] [CrossRef]
  7. Huang, C.C.; Chen, Y.T.; Chen, Y.J.; Chang, C.Y.; Huang, H.C.; Hwang, R.C. The Neural Network Estimator for Mechanical Property of Rolled Steel Bar. In Proceedings of the 2009 Fourth International Conference on Innovative Computing, Information and Control (ICICIC), Kaohsiung, Taiwan, 7–9 December 2009; IEEE: Piscataway, NJ, USA, 2009; pp. 1216–1219. [Google Scholar]
  8. Monajati, H.; Asefi, D.; Parsapour, A.; Abbasi, S. Analysis of the effects of processing parameters on mechanical properties and formability of cold rolled low Carbon steel sheets using neural networks. Comput. Mater. Sci. 2010, 49, 876–881. [Google Scholar] [CrossRef]
  9. Sterjovski, Z.; Nolan, D.; Carpenter, K.R.; Dunne, D.P.; Norrish, J. Artificial neural networks for modelling the mechanical proper-ties of steels in various applications. J. Mater. Process. Technol. 2005, 170, 536–544. [Google Scholar] [CrossRef]
  10. Sidhu, G.; Bhole, S.D.; Chen, D.L.; Essadiqi, E. Determination of volume fraction of bainite in low Carbon steels using artificial neural networks. Comput. Mater. Sci. 2011, 50, 3377–3384. [Google Scholar] [CrossRef]
  11. Sidhu, G.; Bhole, S.D.; Chen, D.L.; Essadiqi, E. Development and experimental validation of a neural network model for predic-tion and analysis of the strength of bainitic steels. Mater. Des. 2012, 41, 99–107. [Google Scholar] [CrossRef]
  12. Voort, G.F.V. Atlas of Time-Temperature Diagrams for Irons and Steels; ASM International: Detroit, MI, USA, 1991. [Google Scholar]
  13. Sidhu, G.; Srinivasan, S.; Bhole, S. An algorithm for optimal design and thermomechanical processing of high Carbon bainitic steels. Int. J. Aerodyn. 2018, 6, 176. [Google Scholar] [CrossRef]
  14. Huang, X.; Wang, H.; Xue, W.; Xiang, S.; Huang, H.; Meng, L.; Ma, G.; Ullah, A.; Zhang, G. Study on time-temperature-transformation diagrams of stain-less steel using machine-learning approach. Comput. Mater. Sci. 2020, 171, 109282. [Google Scholar] [CrossRef]
  15. Geng, X.; Wang, H.; Xue, W.; Xiang, S.; Huang, H.; Meng, L.; Ma, G. Modeling of CCT diagrams for tool steels using different machine learning techniques. Comput. Mater. Sci. 2020, 171, 109235. [Google Scholar] [CrossRef]
  16. Zein, H.; Tran, V.; Abdelmotaleb Ghazy, A.; Mohammed, A.T.; Ahmed, A.; Iraqi, A.; Huy, N.T. How to Extract Data from Graphs using Plot Digitizer or Getdata Graph Digitizer. 2015. [Google Scholar] [CrossRef]
  17. Farmer, J. Lagrange’s Interpolat. Formula. Aust. Sr. Math. J. 2018, 32, 8–12. [Google Scholar]
  18. Pallavi; Joshi, S.; Singh, D.; Kaur, M.; Lee, H.N. Comprehensive Review of Orthogonal Regression and Its Applications in Dif-ferent Domains. Arch. Comput. Methods Eng. 2022, 29, 4027–4047. [Google Scholar] [CrossRef]
  19. Bhadeshia, H.K.D.H.; Dimitriu, R.C.; Forsik, S.; Pak, J.H.; Ryu, J.H. Performance of neural networks in materials science. Mater. Sci. Technol. 2009, 25, 504–510. [Google Scholar] [CrossRef]
  20. Rojas, R. Neural Networks; Springer: Berlin/Heidelberg, Germany, 1996. [Google Scholar]
  21. Geng, X.; Mao, X.; Wu, H.H.; Wang, S.; Xue, W.; Zhang, G.; Ullah, A.; Wang, H. A hybrid machine learning model for predicting continuous cooling transformation diagrams in welding heat-affected zone of low alloy steels. J. Mater. Sci. Technol. 2022, 107, 207–215. [Google Scholar] [CrossRef]
  22. Kingma, D.; Ba, J. Adam: A method for stochastic optimization. In Proceedings of the International Conference on Learning Representations. Banff, AB, Canada, 14–16 April 2014. [Google Scholar]
  23. Wang, X.; Chen, Y.; Wei, S.; Zuo, L.; Mao, F. Effect of Carbon Content on Abrasive Impact Wear Behavior of Cr-Si-Mn Low Alloy Wear Resistant Cast Steels. Front. Mater. 2019, 6, 153. [Google Scholar] [CrossRef]
  24. Sotoodeh, K. Corrosion study and material selection for cryogenic valves in an LNG plant. In Cryogenic Valves for Lique-Fied Natural Gas Plants; Elsevier: Amsterdam, The Netherlands, 2022; pp. 175–211. [Google Scholar]
  25. de la Concepción, V.L.; Lorusso, H.N.; Svoboda, H.G. Effect of Carbon Content on Microstructure and Mechanical Properties of Dual Phase Steels. Procedia Mater. Sci. 2015, 8, 1047–1056. [Google Scholar] [CrossRef]
  26. Khanh, P.M.; Nam, N.D.; Chieu, L.T.; Quyen, H.T.N. Effects of Chromium Content and Impact Load on Microstructures and Properties of High Manganese Steel. Mater. Sci. Forum 2014, 804, 297–300. [Google Scholar] [CrossRef]
  27. Tian, Y.; Ju, J.; Fu, H.; Ma, S.; Lin, J.; Lei, Y. Effect of Chromium Content on Microstructure, Hardness, and Wear Resistance ofAs-Cast Fe-Cr-B Alloy. J. Mater. Eng. Perform. 2019, 28, 6428–6437. [Google Scholar] [CrossRef]
  28. Mahlami, C.S.; Pan, X. An Overview on high manganese steel casting. In Proceedings of the 71st World Foundry Congress, Bilbao, Spain, 19–21 May 2014. [Google Scholar]
Figure 1. Red lines are examples of the cooling profiles extracted from the digitized images in the steel atlas [12].
Metals 14 00049 g001
Figure 2. The neural network architecture used in this study.
Metals 14 00049 g002
Figure 3. Predicted versus true values of: (a) hardness, (b) ferrite fraction, (c) pearlite fraction, (d) martensite fraction, and (e) bainite fraction.
Metals 14 00049 g003aMetals 14 00049 g003b
Figure 4. Sensitivity analysis for hardness value based on ( ± )5% change in each input composition.
Metals 14 00049 g004
Figure 5. Impact of carbon content on the hardness of: (a) high-carbon steel, (b) medium-carbon steel, (c) low-carbon steel.
Metals 14 00049 g005
Figure 6. Impact of chromium content on the hardness of: (a) high-carbon steel, (b) medium-carbon steel, (c) low-carbon steel.
Metals 14 00049 g006
Figure 7. Impact of varying the composition of (a) Mn (b) P (c) S (d) Si (e) Ni (f) Mo and (g) Cu on the hardness of the steel.
Metals 14 00049 g007aMetals 14 00049 g007b
Table 1. Range of input parameters, i.e., chemical composition and thermomechanical processing conditions.
Input ParameterRange
C (wt%)0.1–2.19
Si (wt%)0–1.05
Ni (wt%)0–3.03
Mn (wt%)0.2–1.98
Mo (wt%)0–0.56
Cr (wt%)0–13.12
V (wt%)0–0.31
Cu (wt%)0–0.91
Al (wt%)0–0.063
N (wt%)0–0.003
P (wt%)0–0.44
S (wt%)0–0.29
B (wt%)0–0.05
W (wt%)0–1.15
Ti (wt%)0–0.18
T (C)140.48–1774.62
t (s)0.100122–188,000
Table 2. Distribution of the output parameters, i.e., phase fractions.
OutputRange (%)
Austenite0–30
Ferrite0–92
Bainite0–100
Martensite0–100
Pearlite0–100
Table 3. Mean relative error (MRE) from the two cooling profile functionals.
Lagrange Interpolation MRELeast Squares Approximation MRE
Mode82.097512.9347
Mean5.65172.26397
Median2.77761.4660
Table 4. Different values tested for various hyper-parameters of the neural network.
ParametersValue
Hidden layers [1–3]
Neurons in each hidden layer [0–20]
OptimizerSGD, Adam
Activation function RELU, Sigmoid
Batch size64, 128, 256
Epochs100, 200, 500, 1000
Dropout[0.1–0.4]
Table 5. Final parameters used for training.
ParametersValue
Hidden layers2
Neurons in each layer(32, 20, 20, 1)
OptimizerAdam
Activation functionRELU
Batch size128
Epochs1000
Dropout0.1
Table 6. R2 values for hardness and phase fractions predicted by the MLP model.
MLP ModelR2 for TestingR2 for Training and Testing Data
Hardness0.990.99
Ferrite0.990.99
Martensite0.980.99
Pearlite0.980.99
Bainite0.960.98
Table 7. Composition of the 9 steels used to study the impact of the alloying element content on hardness.
ElementSteel 1Steel 2Steel 3Steel 4Steel 5Steel 6 Steel 7Steel 8Steel 9
High CarbonMedium CarbonLow Carbon
C1.041.030.980.440.410.390.30.220.16
Mn0.330.971.840.20.661.560.510.640.5
P0.230.0160.0230.0250.0080.010.0110.010.013
S0.0060.0180.0110.010.0240.0240.0070.0110.14
Si0.260.280.080.30.250.210.320.250.31
Ni0.310.1300.310.3103.030.332.02
Cr1.531.05013.121.0300.070.971.95
Mo0.010.0300.010.17000.230.03
Cu0.20.2500.090.28000.160
Al0000000.03200.03
V0.01000.020.01000.010.01
Ti0000000.0100
W01.150000000
HV890885633525640264205294339
Disclaimer/Publisher’s Note: The statements, opinions and data contained in all publications are solely those of the individual author(s) and contributor(s) and not of MDPI and/or the editor(s). MDPI and/or the editor(s) disclaim responsibility for any injury to people or property resulting from any ideas, methods, instructions or products referred to in the content.

