
Sensitivity Study of Surface Roughness Process Parameters in Belt Grinding Titanium Alloys

1
Advanced Mechanical Engineering, University of Leeds, Leeds LS2 9JT, UK
2
School of Mechatronic Engineering, Xi’an Technological University, Xi’an 710021, China
*
Author to whom correspondence should be addressed.
Metals 2023, 13(11), 1825; https://doi.org/10.3390/met13111825
Submission received: 22 September 2023
/
Revised: 23 October 2023
/
Accepted: 27 October 2023
/
Published: 30 October 2023
(This article belongs to the Special Issue Simulation and Optimization of Steel and Metal Manufacturing Processes)
Abstract
:In order to obtain the optimum range of process parameters for abrasive belt grinding of titanium alloys to achieve a surface roughness within a given range, titanium alloy TC4 was selected as the research object, and experiments on abrasive belt grinding surface roughness were conducted. Firstly, an empirical formula for the surface roughness of titanium alloys after abrasive belt grinding was constructed based on the balanced weight analysis of the process parameters for titanium alloy surface roughness. Sensitivity analysis was carried out to identify the process parameters with the greatest effect on surface roughness, and the stable and unstable domains of the process parameters were determined. Combined with range analysis in orthogonal experiments, the influence curves of the process parameters on surface roughness were obtained, and the optimal parameter ranges were selected. The research results showed that surface roughness is the most sensitive to changes in abrasive grain size and the least sensitive to changes in abrasive belt linear speed. The optimal ranges of abrasive grain size, abrasive belt linear speed, and grinding pressure were determined to be 120# to 150#, 15 m/s to 20 m/s, and 10 N to 15 N, respectively. This study provides a theoretical method and experimental basis for the control of surface roughness in abrasive belt grinding of titanium alloys.
1. Introduction
Surface roughness is one of the most crucial evaluation parameters for surface integrity, and its magnitude plays a significant role in determining the wear resistance, fatigue performance, stress corrosion performance, etc., of components [1]. Titanium alloys, as typical high-strength alloy materials, possess a range of advantages such as excellent corrosion resistance, low density, stable damping properties, and a high specific strength. Consequently, they have found extensive applications in the aerospace industry [2]. However, in the process of abrasive belt grinding of titanium alloy surfaces, plastic deformation, work hardening, and the formation of microcracks are prone to occur under the squeezing action of abrasive grains, which can negatively impact the surface quality. This phenomenon is closely related to grinding process parameters [3]. Scholars from around the world have conducted numerous studies on the surface integrity of titanium alloy processing.
Khellouli et al. [4] researched the wear mechanism of abrasive belt grinding and the elastic contact between the contact wheel and the workpiece and analysed the effect of process parameters on the surface roughness of the workpiece. Bigerelle et al. [5] established a model for the wear mechanism of abrasive belt grinding and investigated the effect of process parameters on the surface roughness. Jie Li et al. [6] established a prediction model of surface roughness based on BP neural networks and used genetic and particle swarm algorithms to optimise the process parameters to obtain the best combination of process parameters. Huang Jiefeng et al. [7] proposed a feature integration-based grinding surface roughness measurement method. It effectively solves the problem of weak feature information of grinding surface roughness, which is difficult to measure, and the model has high detection accuracy under different lighting environments. Pan Yuhang et al. [8] developed a real-time surface roughness prediction model based on multi-sensor signal fusion. Lu Enhui et al. [9] proposed a grinding surface roughness measurement method based on a combination of the full reference (FR) image quality algorithm visual saliency induced index (VSI) and a back propagation (BP) neural network. Zhang Guojun et al. [10] proposed a roughness measurement method based on generative adversarial and BP neural networks. The features in the image are automatically learned by GAN, eliminating the independent feature extraction step, and the measurement accuracy is improved by a BP neural network. Fang Runji et al. [11] proposed that the GC index has a strong correlation with the roughness of the grinding surface, and its regression fitting prediction model has a high prediction accuracy; in addition, the correlation between the GC index and roughness is relatively stable under different light intensities. Liu Yin et al. [12] conducted a large number of comparative tests on the surface roughness of the bottom surface of zirconium-based bulk metallic glass milled grooves using different machining materials, milling cutters with different coatings, milling cutters with different geometric parameters, and different machining conditions. The results show that zirconium-based bulk metallic glass has a good milling performance. Liang Xiaohu et al. [13] evaluated the effect of roughness on SAW dispersion and attenuation and reduction of bias in the assessment of machined surface damage. In order to investigate the surface integrity of titanium alloys at different roughness levels, Guiyun Jiang et al. [14] repeatedly ground the surfaces with the same and different types of abrasive belt models. The results showed that at roughness Ra levels of 0.4 μm to 0.2 μm, the compressive residual stresses decreased with increasing linear velocity and large surface morphological defects formed. At a roughness Ra of 0.2 μm or less, grinding improved the surface morphology, the compressive residual stress increased with increasing feed rate, and the surface hardness decreased with increasing linear velocity. Yun Huang et al. [15] studied the grinding degree (the effect of feed rate, linear speed, and initial grinding pressure on the grinding force) and the influence of the grinding force on the law of material removal and surface integrity.
The research discussed in these studies has focused on various aspects of abrasive belt grinding, particularly regarding the understanding of wear mechanisms, the influence of process parameters on surface roughness, and the development of innovative measurement and prediction methods. This collective research contributes to a deeper understanding of abrasive belt grinding processes and their implications. However, most of the above studies are aimed at analysing the effect of process parameters on surface roughness, and there are fewer adjustment ranges for the parameters of the belt grinding process that can be referred to.
Shao Biao and their colleagues [16] determined the best distribution method for the inerting system by utilising statistical theory to investigate the distribution of nitrogen-rich gases. They also established a comprehensive methodology for evaluating the oxygen concentration’s reduction rate characteristics and uniformity based on the entropy weighted improved TOPSIS theory. Zhong R et al. [17] used the Technique for Order of Preference by Similarity to an Ideal Solution (TOPSIS) method and expert scoring method to evaluate the management of energy efficiency in hydropower plants by scoring quantitative and qualitative indicators. Xianglin Zhan et al. [18] determined the weight coefficients for each index by combining the hierarchical analysis method and entropy weight method. They established a virtual simulation environment to calculate the quantitative indicators and utilised the improved TOPSIS method to evaluate the maintainability of various design schemes for aero engines in a comprehensive manner. To develop a safety risk assessment model for the construction of assembly buildings, Guo Zhen [19] incorporated the AHP and TOPSIS methods. The housing construction project was subjected to TOPSIS analysis for testing purposes. In order to further study the dynamics of water resources, and for the traditional TOPSIS evaluation of water resource carrying capacity problems, He Li [20] found that the use of D-S evidence theory can effectively reduce the loss of data variability, improve the integration of the objective results and accuracy advantages, and improve the TOPSIS method for water resource evaluation. Liang Yaodong et al. [21] devised an extensive evaluation model utilising the Hierarchical Analysis Method (AHP) and the TOPSIS method. The model employed AHP-TOPSIS and selected a total of 11 indicators from technological, economical, and safety aspects. These indicators were used to perform a comprehensive evaluation and determine the most suitable mining method. Rui Han and Xiaoxia Guo [22] used the TOPSIS model combined with the entropy weighting method to construct a vegetable quality evaluation model for different strains of vegetables. Zhu Jianzhen and Cui Xiwen [23] employed the entropy weight TOPSIS model to analyse and assess the overall intensity of the oceans and its dynamic variation trend using China’s ocean economy and related statistics. Li Yang [24] analysed the commonly used digital imaging technology for machining surface roughness detection to provide a reference. Yang Deyu et al. [25] used an orthogonal test method and response surface method to study the cutting force and surface roughness of coated cemented carbide tools after milling and machining 1J50 soft magnetic alloys; the influence laws of cutting parameters on cutting force and surface roughness were obtained through orthogonal analysis. Xiao Guijian et al. [26] conducted an experimental study on the surface finish quality of titanium alloys before and after abrasive belt wear using surface integrity as an evaluation index; they revealed the influence of abrasive belt wear on the surface roughness, residual stress, and surface hardness of grinding TC17 and the underlying mechanism. By adjusting the tilt direction of the grinding belt wheel to alter the normal contact force between the blade and wheel, Ren Hongzhang and Li Jing [27] maintained a constant load on the grinding belt wheel via the load system throughout the machining process. This achieved collaborative control of the grinding process that was independent of both the robotic and load systems. Song Weiwei et al. [28] conducted a series of experimental studies exploring the effect of various process parameters on the surface roughness of TC17 titanium alloys. Their investigation examined the effects of feed rate, abrasive belt line speed, and downward pressure on the surface roughness. Yuan Lujie [29] analysed the characteristics of belt grinding and the margin distribution of aircraft blades to address the challenge of quantitatively controlling the grinding pressure of aircraft blade belt grinding equipment. Tian Fengjie and Si Dasheng [30] established a surface profile model of abrasive belt grinding workpieces through the research and analysis of the trajectory of abrasive belt abrasive grains and verified the theoretical analysis by establishing a mathematical model of surface roughness regression and blade grinding tests using the one-factor test method. In order to investigate the material removal mechanism of metal workpieces in abrasive belt grinding processing, Wang Hang and Luo Minfeng [31] established a geometric model after simplifying the abrasive belt grinding system and set up the model parameters and motions to establish a discrete element dynamic simulation of abrasive belt grinding processing. Dong Haosheng et al. [32] carried out orthogonal experiments on screw rotor belt grinding using axial feeding of the workpiece, established a model for predicting the surface roughness value of the screw rotor after belt grinding, and predicted and analysed the surface quality of the workpiece after grinding. Duan Jihao et al. [33] revealed the influence laws of different contact wheel suppleness levels on blade surface grinding contact pressure distribution, contact normal force, blade processing deformation, and other states, combined with the contact wheel force–deformation curves. Hu Changhao [34] carried out the analysis of the removal mechanism of material elastic contact grinding, combined with the Hertzian contact theory of abrasive belt grinding, and further deduced a mathematical model for the material multi-body Coulomb friction factor. Kong Xianjun et al. [35] conducted an orthogonal test on TC11 titanium alloys to investigate the impact of each turning parameter on cutting temperature, cutting force, and surface roughness. Liu Cen et al. [36] applied mathematical statistics and probability theory to establish a direct method to analyse the degree of influence of processing methods or changes in the working conditions on the interval values of the distribution parameters of normally distributed random variables at a certain two-sided confidence level. Xia Wang [37] proposed a three-parameter interval grey number multi-attribute decision-making method based on an improved TOPSIS model for multi-attribute decision-making problems.
As a result, various studies have been conducted on different aspects of belt grinding, including evaluation methods, effects on surface quality, and material removal mechanisms. Researchers utilised various methods such as statistical analysis, mathematical modelling, and experimental testing to study different aspects of the grinding process and its impact on the workpiece surface.
However, currently, there is a relatively limited amount of literature available on the identification of key processing parameters in the blade grinding process. Moreover, the practical achievements in this area are not very prominent. Therefore, this study aimed to fill this gap by focusing on the current state of blade processing and its requirements. We aimed to identify the key processing parameters in the process of belt grinding blades. By integrating theoretical research with practical processing, we aimed to reduce the reliance on manual decision making, guide the selection of processing parameters, and ultimately improve the efficiency and quality of blade belt grinding processes.
The main content of this research project is as follows: Firstly, based on the analysis of the process parameters for belt grinding, we used a balanced weight approach to identify the process parameters that have a significant impact on the surface roughness of titanium alloys when subjected to belt grinding. In addition, we designed an orthogonal experiment based on these process parameters and established a mathematical model to estimate surface roughness. Secondly, we examined the effect of the process parameters within specific ranges, determining both stable and unstable domains for these parameters. Finally, we proposed a method for determining the optimum range of process parameters and ascertained the optimal range for these parameters.
This study is of great theoretical and practical importance to engineers and manufacturers for the following reasons.
- (1)
- In traditional belt grinding processes, the selection of grinding process parameters typically relies on the experience and skill level of the operators, making it difficult to ensure the quality of the finished workpieces. Therefore, this study conducted an in-depth investigation of the process parameters involved in belt grinding blades through theoretical analysis, with the aim of identifying critical process parameters and reducing the reliance on manual decision making.
- (2)
- By studying the effect of machining parameters on surface quality and categorising these parameter combinations into different intervals, it becomes possible to select machining parameters more quickly in actual production. This will help reduce preparation time, minimise the defect rate, and increase the utilisation efficiency of grinding machines.
- (3)
- By establishing a surface roughness prediction model that clarifies the relationship between surface roughness and processing parameters, it facilitates the setting of grinding process parameters. This is important for the rapid and rational selection of grinding process parameters.
In summary, controlling surface roughness not only helps enhance product quality and performance, but it also contributes to cost reduction, prolonging product lifespan, and reducing resource wastage. Therefore, it holds significant importance for industrial and engineering applications.
2. Experiment
2.1. Methods for Solving Indicator Weights
The resolution of indicator weights is a key step in multi-attribute integrated decision making, and the methods used in the relevant literature can be summarised in three categories: subjective assignment, objective assignment, and combined assignment.
(1) Subjective assignment method
The structure of the subordinating function of trapezoidal fuzzy numbers is more intricate, allowing it to convey specific and detailed information. Furthermore, it exhibits increased sensitivity and precision towards the subjective evaluations of decision makers. In practical applications, trapezoidal fuzzy numbers are commonly used in decision support systems and fuzzy reasoning due to the involvement of subjective views and judgment criteria from multiple decision makers, as well as a significant amount of uncertainty and ambiguity. This approach offers a wide range of prospects for applications.
(2) Objective weighting method
The coefficient of variation method is a statistical approach used to calculate the degree of variation for each system indicator, and it falls under the category of objective assignment methods. Unlike trapezoidal fuzzy numbers, it relies on objective data rather than expert evaluations, resulting in more accurate and rational outcomes. However, while it effectively reduces subjectivity, the weights calculated by this method represent the amount of useful information regarding the indicator values and may lack a certain degree of objectivity. Therefore, it is often combined with other empowerment methods to conduct a comprehensive empowerment evaluation.
(3) Combined assignment method
In this study, we combined the trapezoidal fuzzy number and the coefficient of variation method. The qualitative analysis employed the trapezoidal fuzzy number, while quantitative analysis was used on the coefficient of variation method. Subsequently, the combined assignment method comprehensively leverages expert knowledge and experience along with the objectivity of the coefficient of variation method to determine the weights for the evaluation indexes for comprehensive lean management. These comprehensive weights blend the characteristics of subjective and objective assignments, achieving a fusion of the two.
2.2. Comprehensive Evaluation Hierarchical Model
The scope of the research involves the evaluation of blade grinding surface roughness process parameters, which are influenced by five major factors: the operator, machine, material, method, and environment. After categorising these indicators, the “human” factor primarily takes into account the operator’s skills and proficiency. The “machine” factor mainly considers factors such as feed speed, grinding pressure, belt speed, and belt size. The “material” factors mainly involve considerations related to the type of abrasive used. The “method” factor encompasses the requirements of the various of processing techniques, such as dry processing, wet processing, and other methods. Lastly, the “environment” factor focuses on the processing environment requirements, including temperature, humidity, and cleanliness.
After simplifying to establish the evaluation hierarchical model PQW for blade grinding surface roughness process parameters, as shown in Figure 1, the model comprises the target layer A1, the five major influencing factors in A2, and the primary influencing factors for each factor in A3. This is formally described as follows: . Among them, denotes the set of all nodes in the PQW model: , , , and ; denotes the abstract semantic set of the association relationship between two nodes in the adjacent layer, where MS and NS denote the dominant and dominant relationship, respectively; , where is the predicate function on D, , and denotes the set of all nodes that have a relationship with d. For the actual relationships between the nodes, denotes the relative weight of the dominated by the dominant.
2.3. Solving for Equilibrium Weights
2.3.1. Subjective Weight Analysis Based on Rough Set Theory
Rough set (RS) theory is a mathematical tool used to handle imprecise, inconsistent, and incomplete information and knowledge through quantitative analysis. It provides a deeper understanding of decision makers’ real perceptions and has found extensive application in the fields of fault diagnosis, prediction and control, pattern recognition, and data mining.
In RS theory, U is a non-empty finite set of objects, called an argument domain; F is any object in U; and all objects in U belong to n divisions, such as . If these n divisions have order relations , then for any of these divisions , the set of upper and lower approximations can be defined as:
The form denotes the division of the indistinguishable relation of on .
For the fuzzy number rough boundary intervals, when the objects in the domain are all in fuzzy number form, any fuzzy division can be represented by its , i.e., :
The specific steps for determining the subjective weights are as follows.
Step 1: For the convenience of description, in the hierarchical model of Figure 1, the set of nodes governed by the general objective is denoted by (i.e., ) and the opinions of n () decision makers are investigated to obtain the fuzzy mutual-reversal judgement matrix . is the proportion of importance of equivalent to , which is given by decision maker O (O = 1, 2, …, n), which is denoted by the trapezoidal fuzzy scaled value, .
Step 2: Conduct individual consistency tests on and make appropriate adjustments to when it fails the consistency test.
Step 3: Construct the fuzzy number rough group decision matrix , where .
Step 4: Calculate the fuzzy number of rough boundary intervals for all elements in Q. For , from Equations (9) and (10), we can obtain , where
Step 5: Construct the fuzzy number rough pairwise comparison matrices , , and decompose into the lower bound matrix and the upper bound matrix .
Step 6: Given a trapezoidal fuzzy number (a, b, c, d) with a ≤ b ≤ c ≤ d, the centre of gravity is
The centre of gravity of the trapezoidal fuzzy number can give the most comprehensive representation of its characteristics. From Equation (13), and are mapped into real forms and , the eigenvectors corresponding to the largest eigenvalues of the two matrices are obtained as and , respectively, and the relative weight of on the upper node is calculated as (i.e., ), where
If the set of nodes dominated by the upper node is not empty, then ; otherwise, τ = 1. When , the relative weight of the unique element in is ; when , repeat steps 1 to 6 to find the relative weight of the element.
Step 7: Repeat steps 1 to 6 from top to bottom, as shown in Figure 1, to obtain the relative weight vector of all nodes on the k-th layer to the first node on the k − 1-th layer as , where the relative weight element corresponding to the node on the k-th layer that is not dominated by is 0. Let the number of nodes on the layer be ; then, the weight matrix of the nodes on the k layer in relation to the nodes on the layer can be expressed as and is the order matrix .
Therefore, the weight vector of the nodes on layer 3 with respect to the total objective can be obtained as ; is the subjective weight vector of the evaluation metrics in the PQW.
In the analysis process, the subjective weights of the factors involved in the blade grinding process were assessed across five dimensions: “human”, “machine”, “material”, “method”, and “environment”, involving three decision makers. The evaluation matrices were as follows:
After the tests meet the consistency conditions, they can be used to calculate the weights and construct the fuzzy rough group decision matrix , where . The fuzzy number of rough boundary intervals is calculated for all elements in X. Taking as an example, according to the rough set division, its upper rough set is , and the lower rough set is ; if divided according to the rough set , the upper rough set is , and the lower rough set is . The upper and lower approximations of the rough set can be calculated using Formulas (15) and (16). The rough interval can be obtained through Formula (17). The upper rough approximation for the division with set for is 1.5, and the lower rough approximation is 1. For the division with set , the upper rough approximation is 1.25, and the lower rough approximation is 0.83. In the end, the upper rough approximation for is 1.279, and the lower rough approximation is 0.85. The rough interval for is [0.85, 1.27].
Using Matlab to calculate the eigenvectors and eigenvalues, the maximum eigenvalues corresponding to and are 6.1015 and 4.8118, respectively. The eigenvectors corresponding to the maximum eigenvalues are [0.4124, −0.5012, 0.7384, 0.7384, 0.5788] and [−0.4075, 0.4632, 0.1653, 0.1653, 0.1653, −0.4250]. The weights can be obtained through Formulas (12) and (13). Here, represents the weight corresponding to the i eigenvector, denotes the eigenvalue corresponding to the i factor, and represents the final total weight. The total weight is [0.217, 0.262, 0.236, 0.152, 0.133].
After normalisation, the corresponding weights for each part are 11.7%, 9.9%, 5.9%, 9.27%, 10.9%, 23.6%, 6.7%, 8.5%, 6.9%, 5.9%.
2.3.2. Objective Weight Analysis Based on Coefficient of Variation Method
Commonly used methods include the entropy weight method and the coefficient of variation method. Among these, the entropy weight method indicates the relative importance of each index in a competitive sense within the set of evaluated objects. On the other hand, the coefficient of variation method posits that in the evaluation index system, the larger the difference in the values of the index, the more challenging it is to achieve, making it a better reflection of disparities among the evaluated objects. Therefore, this study employed the coefficient of variation method for calculations.
The data were sourced from the China Statistical Yearbook (2022) and government reports, and the results are presented in Table 1.
To quantify the evaluated parameters, positive (or negative) normalisation was performed using Formulas (14) and (15). Where represents the value of the indicator in i-th, j-th, and represents the outcome of the positive (or negative) treatment. Here, represents the value of the indicator in the i-th row and j-th column, while represents the result after positive (or negative) normalisation.
Next, Formulas (16) and (17) are utilised to calculate the mean and standard deviation of each indicator, respectively. Here, represents the mean value of the j indicator, and represents the standard deviation of the j indicator.
The resulting data were utilised in coefficient of variation calculations using Formula (18). We calculated the weights corresponding to each indicator using Equation (19). Here, represents the coefficient of variation for the j indicator, and represents the weight of the j indicator.
In summary, the weights calculated through the analysis using “human, machine, material, method, and environment” along with the coefficient of variation method are as follows: 13.9%, 12.3%, 6.25%, 9.1%, 11.5%, 21.5%, 6.3%, 7.9%, 6.1%, and 5.2%.
2.3.3. Weight Balance Model
The ranking result of the evaluation object depends on its weighted indicator value. When considering the weighted indicator value, it is important to achieve a balance between the contributions from subjective and objective weights. We define the balanced weight vector as
where and are the balancing coefficients for the principal objective weights and , respectively.
Total Deviation of Weight Contribution: According to Equation (20), the subjective and objective weight contribution values of evaluation object d (1 ≤ d ≤ n) for indicator dx (7 ≤ x ≤ 16) are represented by and , respectively. The deviation of the weight contribution for evaluation object d is .
Because each evaluation object is equal, the total deviation of the weight contribution is represented by .
is denoted as . Setting the first-order derivative of the objective function in the above equation to zero, we obtain
By the nature of the objective function, it can be seen that the minimum value of the objective function in Equation (21) is obtained in Equation (22) at . is calculated as 0.4732 using , and is 0.5268; then, the equilibrium weights are obtained using Equation (20). Table 2 shows Balancing weights for each item.
However, in the actual operational process, human factors are not considered. There-fore, excluding D1 and D2, the remaining influencing factors are ranked from the largest to the smallest, with the top three being the size of the abrasive belt, the abrasive belt line speed, and grinding pressure.
3. Test Conditions and Methods
3.1. Test Apparatus and Equipment
The structure of the constant pressure belt grinding test bench used for the experiments is shown in Figure 2.
The abrasive belt grinding test bench mainly consists of a belt sander with adjustable rotational speed, a clamping device, a pressure sensor, and a CNC guideway driven by a stepping motor. By adjusting the rotational speed of the drive wheel, you can change the linear speed of the abrasive belt. The pressure sensor can measure the pressure between the test piece and the contact wheel in real-time and provide feedback to the control software. This allows for the control of the CNC guideway to move forward or backward at a certain speed while maintaining a consistent contact pressure between the test piece and the contact wheel.
A ZeGage™ Optical Profiler(Middlefield, CT, USA, ZYGO Corporation) was used as a non-contact method of measuring the surface roughness of specimens.
3.2. Test Material
The test material was titanium alloy TC4, with dimensions of 15 mm × 40 mm (diameter × length). The parameters of the abrasive belt used are shown in Table 3.
3.3. Test Programme
The test programme was based on the conclusion from Section 2.3.3, which identified that the greatest influence on surface roughness (Ra in μm) is attributed to abrasive belt size P, abrasive belt line speed Vs (m/s), and grinding pressure F (N). As a result, the focus of this study was on these three factors. To analyse the interactions between these different process parameters, a three-factor, three-level orthogonal test was conducted. The test program and results are presented in Table 4.
4. Test Results and Analysis
Firstly, to establish an empirical formula for surface roughness, we analysed the impact of process parameters on abrasive belt grinding surface roughness. This analysis allows us to determine the relationship between grinding surface roughness and process parameters, enabling us to calculate the effects of key process parameters. Subsequently, we determine the interval of process parameters for achieving a smooth change in surface roughness.
4.1. The Establishment of Empirical Formula for Surface Roughness
The exponential model between surface roughness and process parameters is represented as follows:
In Formula (23), Ra represents surface roughness, P stands for abrasive grit size, Vs represents belt speed, F is the grinding pressure, K is the proportionality coefficient, and represent the exponents corresponding to the respective parameter.
By combining Equation (23) with the orthogonal test results in Table 3 and applying the multiple linear regression analysis method, the empirical formula for surface roughness of titanium alloy after abrasive belt grinding is determined as
The significance of Formula (24) was tested using both the F-test and the correlation coefficient test. F = 35.137, which is greater than F0.05(3, 9) = 3.86. Additionally, the correlation coefficient R^2 was 0.9547. Generally, when the absolute value of the correlation coefficient falls within the range of 0.8 to 1, it can be concluded that there is a strong linear relationship between the regression independent variables and the dependent variable. The results of both tests indicate that the established empirical model for surface roughness is significant.
4.2. Analysis of Surface Roughness Process Parameters
4.2.1. Sensitivity Model Calculation
We analysed the degree of sensitivity of surface roughness to variations in individual process parameters.
According to the mathematical definition of sensitivity, the sensitivity model of surface roughness to process parameters (abrasive grit size, belt speed, and grinding pressure) is represented as
Since Equation (24) is derived from orthogonal experiments, the initially set combinations of process parameters are discrete points. Therefore, when calculating , the value of is the average value of the parameters selected in the experiment, which is represented as .
Within the range of parameters selected in the orthogonal experiments, , , and ; substituting these values into Equation (26), the sensitivity models are as follows:
4.2.2. Sensitivity Curve Analysis
The sensitivity curves of surface roughness to abrasive grit, abrasive belt line speed, and grinding pressure obtained from Equation (27) are shown in Figure 3.
From Figure 3a, it can be observed that the sensitivity value in the abrasive grain size interval [80#, 120#] is greater than that in the interval [120#, 150#]. In other words, when the abrasive grain size changes from 120# to 150#, the change in surface roughness is relatively smooth. Similarly, in Figure 3b, it is evident that the sensitivity value in the abrasive belt line speed interval [10 m/s, 15 m/s] is greater than that in the [15 m/s, 20 m/s] interval. This implies that when the sanding belt linear velocity changes from 15 m/s to 20 m/s, the change in surface roughness is smooth. Likewise, in Figure 3c, it is noticeable that the sensitivity value in the grinding pressure interval [5 N, 10 N] is greater than that in the interval [10 N, 15 N]. This suggests that when the grinding pressure varies from 10 N to 15 N, the change in surface roughness is smooth.
4.2.3. Stable and Unstable Domains of Process Parameters
The stable domain of a surface roughness process parameter refers to the range in which the surface roughness is insensitive to changes, and the unstable domain refers to the range in which changes in surface roughness are sensitive to changes in process parameters.
For the orthogonal test with n factors (N1, N2, …, Nn) and m levels (M1, M2, …, Mm), a method for determining the stable and unstable domains of the process parameters was proposed as follows: (1) calculate the sensitivity value for factor Np (p = 1, 2, …, n) within each of the m − 1 level intervals, such as [M1, M2], [M2, M3], denoted as A1, A2, …, Am−1; (2) compute the average of the sensitivity values A1, A2, …, Am−1 as ; (3) define Aj (j = 1, 2, …, m − 1) > as the unstable domain, and the region where Aj < as the stable domain [7].
Using the sensitivity curves of surface roughness to abrasive grain size, abrasive belt line speed, and grinding pressure, the stable and unstable domains for these parameters were obtained and are shown in Table 5.
5. Process Parameter Interval Selection
Based on the sensitivity analysis of surface roughness to process parameters and combined with the polar analysis of the original orthogonal test data, the process parameter interval optimisation steps for titanium alloy surface roughness after belt grinding are as follows.
(1) From the surface roughness sensitivity model in Equation (23), we determined that the surface roughness is most sensitive to changes in abrasive grain size, followed by changes in grinding pressure and abrasive belt linear speed.
(2) We determined the stable and unstable domains of abrasive grain size and grinding pressure, as shown in Table 5.
(3) Using the orthogonal test with the extreme difference analysis method, we identified the stable and unstable domains of the process parameters (abrasive grain size and grinding pressure; shown in Figure 4) for surface roughness sensitivity. Additionally, we determined the process parameters (abrasive belt line speed) that surface roughness is not sensitive to within the tested range.
Finally, in order to obtain a stable grinding surface roughness, the preferred interval for the process parameters for belt grinding of titanium alloy TC4 was selected as shown in Table 6 below. The range of surface roughness fluctuation for abrasive grit sizes in the unstable domain is smaller than that in the stable domain, so the preferred interval for abrasive grit size was the unstable domain. If the parameter values are adjusted, their stable and unstable domains need to be further calculated. The two sets of data chosen within the stable domain, specifically P = 150#, V = 20 m/s, and F = 10 N, produced an Ra value of 0.484. Furthermore, the data set consisting of P = 120#, F = 15 N, and V = 10 m/s produced an Ra value of 0.469. The difference between these two sets is small, within 0.015. However, a larger difference of Ra value, 0.71, was observed in the data set taken in unstable domain with P = 80#, F = 10 N, and V = 5 m/s.
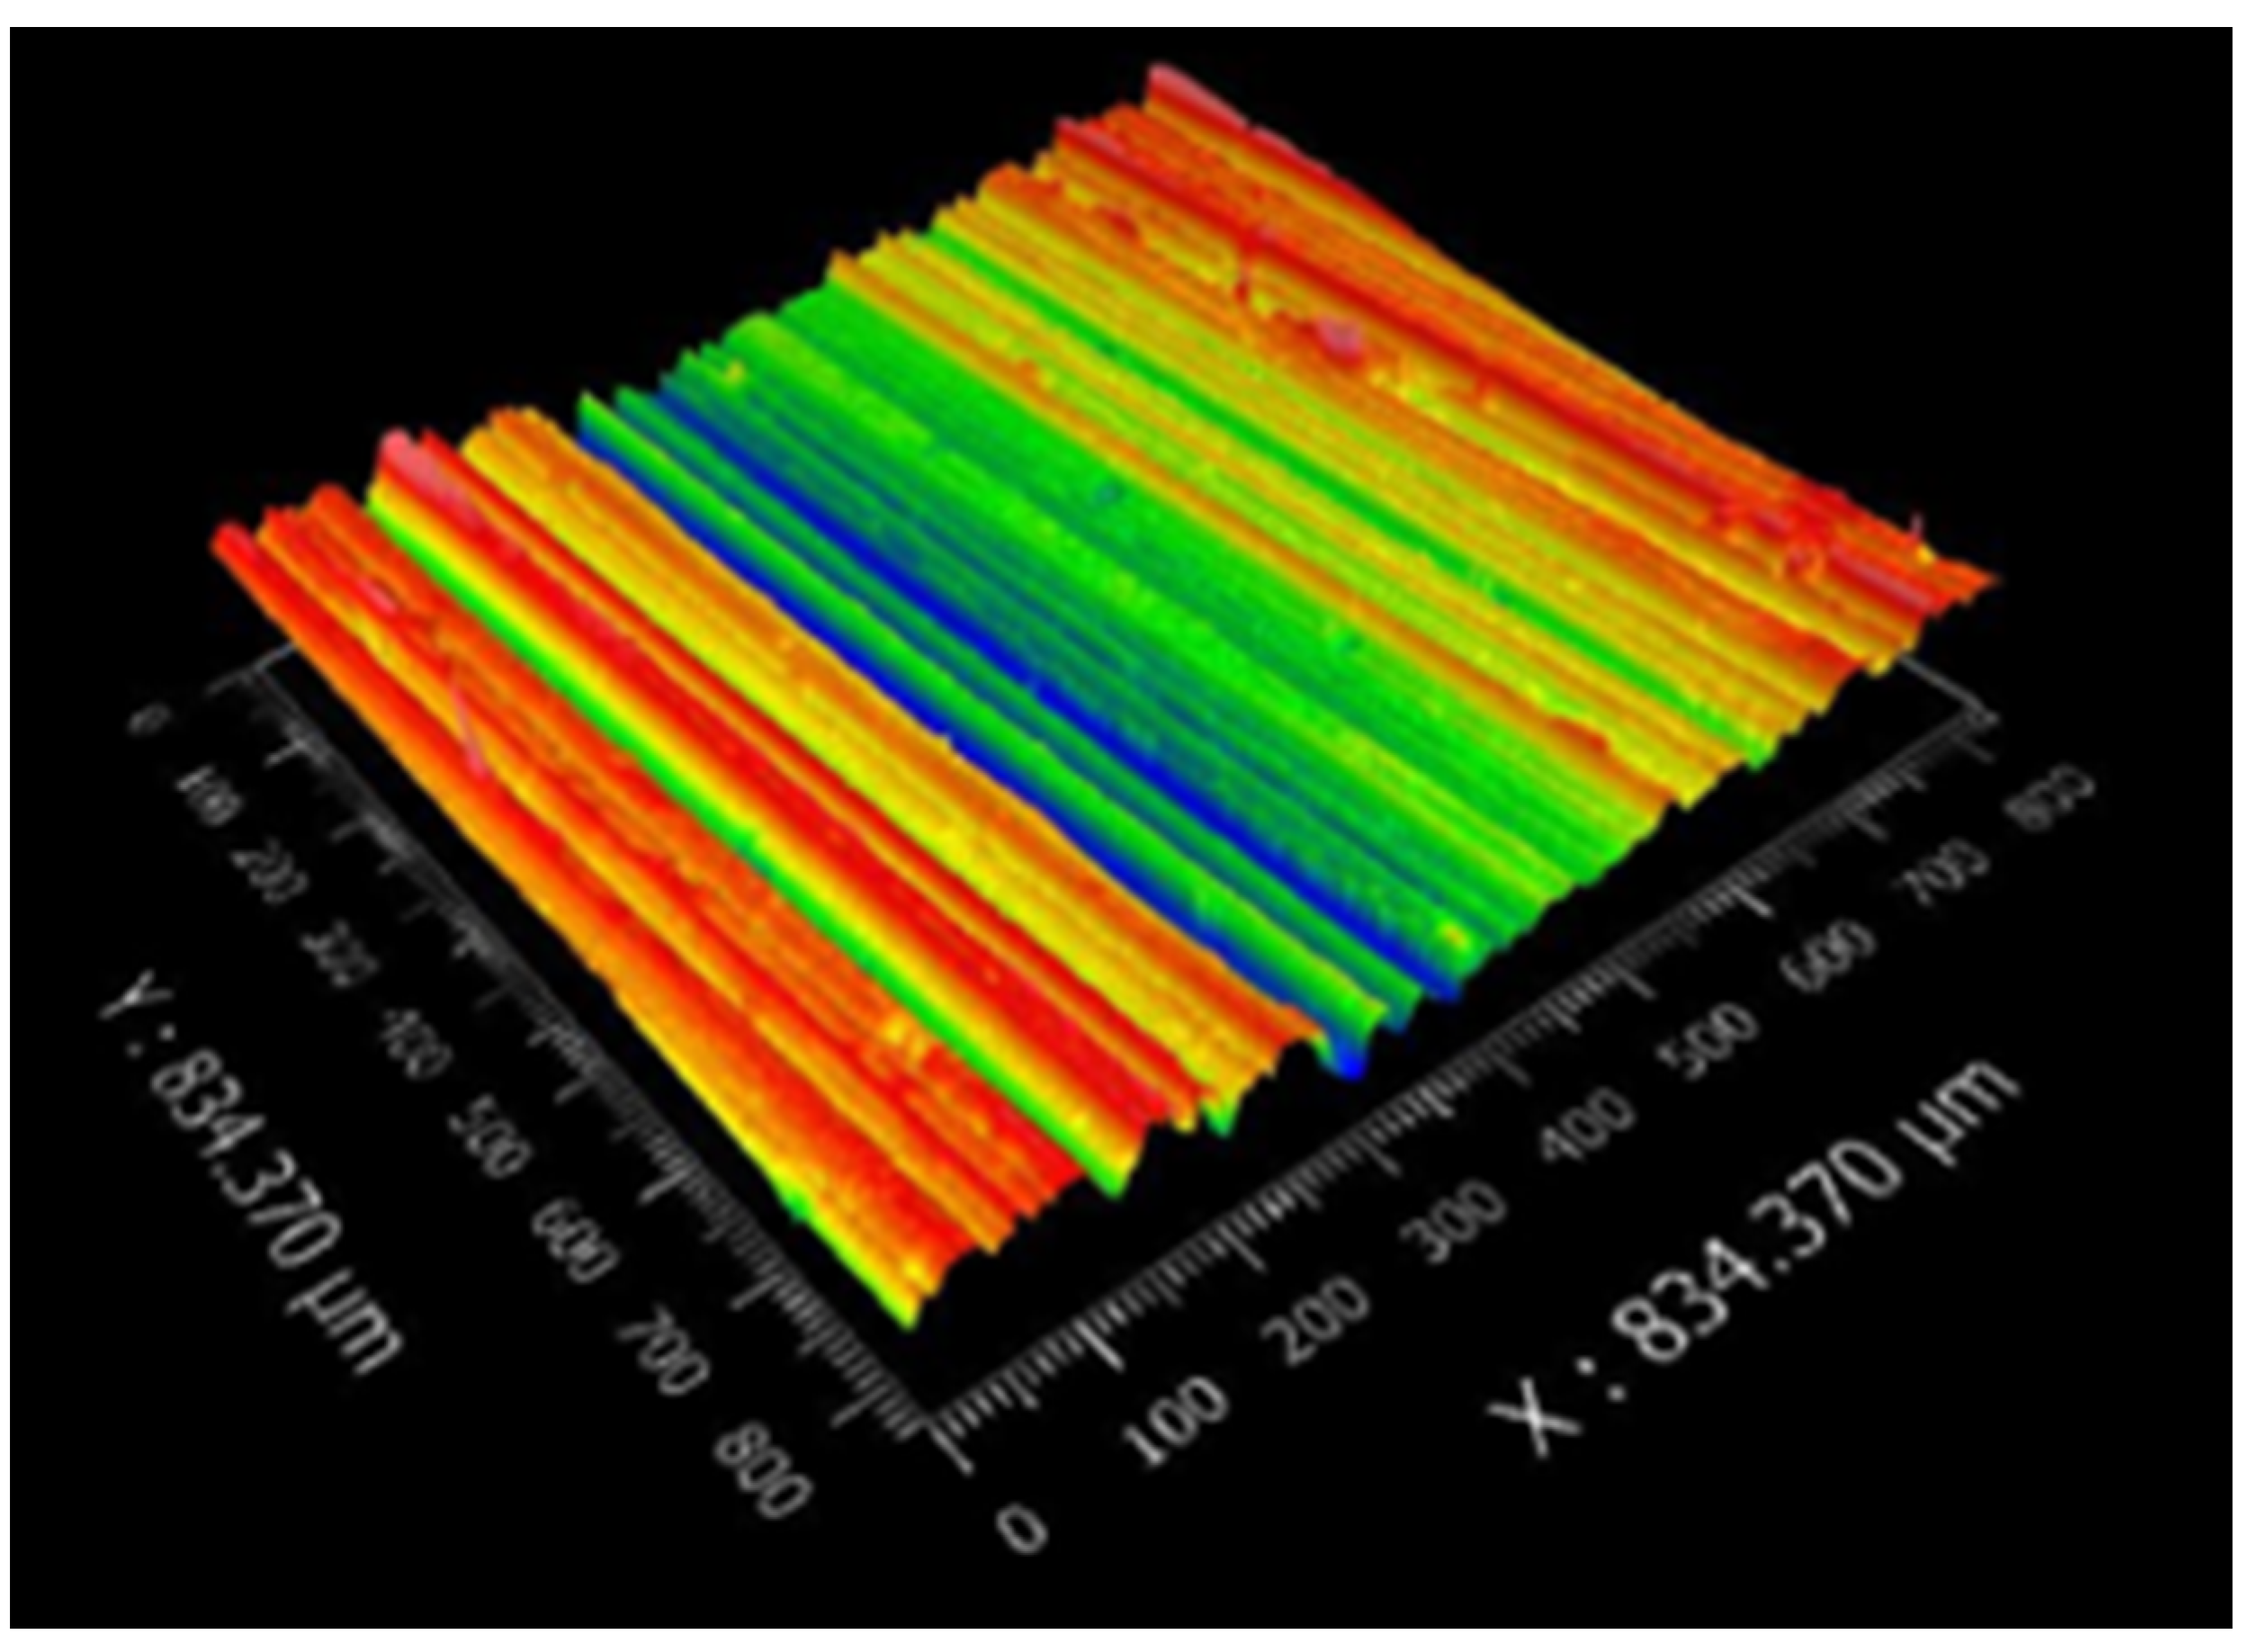
Our research team conducted experiments within the optimal parameter values of P = 150#, V = 20 m/s, and F = 10 N and achieved the ideal surface machining quality for TC4 titanium alloy blade (Ra = 0.484). An image of the blade surface is displayed in Figure 5, Three-dimensional topography of a TC4 titanium alloy blade after the grinding process in Figure 6.
Changing the experimental parameters to P = 120#, F = 15 N, and V = 10 m/s, we obtained an Ra value of 0.469. An image of the blade surface is shown in Figure 7. Three-dimensional topography of a TC4 titanium alloy blade after the grinding process in Figure 8.
However, changing the experimental parameters to those outside the preferred range (P = 80#, F = 10 N, and V = 5 m/s) produced an Ra value of 0.71. An image of the blade surface is shown in Figure 9. Three-dimensional topography of a TC4 titanium alloy blade after the grinding process in Figure 10.
By comparing the images, we can clearly see that the Ra values of the products processed by selecting parameter values in the stable interval meet the requirements and the processing quality is good. However, when the parameter values are outside the interval for the processing experiment, the Ra value of the processed product is too large and the quality is poor.
6. Conclusions
- From the test of significance, it can be seen that the confidence level of the established model for the surface roughness index of titanium alloy after belt grinding was above 95%, and the correlation coefficient was 0.9547; therefore, the constructed model is accurate and reliable.
- The surface roughness of titanium alloy TC4 after abrasive belt grinding is most sensitive to changes in abrasive grain size, followed by grinding pressure and abrasive belt line speed.
- The preferred intervals for the grinding parameters were obtained: for abrasive belt grain size, the interval is from 120# to 150#; for abrasive belt line speed, it is from 15 m/s to 20 m/s; and for grinding pressure, it is from 10 N to 15 N. These intervals can control the surface roughness to be within 0.57 μm.
Author Contributions
Conceptualisation, Y.S., S.H. and H.Q.; Methodology, S.H.; Validation, Y.S. and H.Q.; Investigation, Y.S. and H.Q.; Writing—review and editing, H.Q.; Visualisation, Y.S. and S.H.; Supervision, H.Q. All authors have read and agreed to the published version of the manuscript.
Funding
This research was funded by the Key R&D plan of Shaanxi Province [Grant no. 2021NY-171] and grant number [2021PT-006] for Open Sharing Platform for Science and Technology Resources respectively.
Data Availability Statement
Not applicable.
Conflicts of Interest
The authors declare no conflict of interest.
References
- Huang, X.; Zhang, D.; Yang, Z.; Ren, J.; Yao, X. Study on sensitivity of GH4169 grinding surface roughness influencing parameters. Aerosp. Manuf. Technol. 2012, 55, 83–86+91. [Google Scholar]
- Shen, X.; Zhang, D.; Yao, X.; Tan, L. Research progress on surface integrity formation mechanism of titanium alloy machining. J. Aeronaut. Mater. 2021, 41, 1–16. [Google Scholar]
- Gao, C.; Wang, S.; Wang, H.; Liu, G.; Wu, G. Theoretical prediction and sensitivity analysis of surface roughness of abrasive belt grinding. Surf. Technol. 2018, 47, 295–305. [Google Scholar]
- Khellouki, A.; Rech, J.; Zahouani, H. The effect of abrasive grain’s wear and contact conditions on surface texture in belt finishing. Wear 2006, 263, 81–87. [Google Scholar]
- Bigerelle, M.; Gautier, A.; Hagege, B.; Favergeon, J.; Bounichane, B. Roughness characteristic length scales of belt finished surface. J. Mater. Process. Tech. 2009, 209, 6103–6116. [Google Scholar]
- Li, J.; Shi, Y.; He, X. Optimization of polishing process parameters of abrasive belt of aero-engine blades. Aerosp. Manuf. Technol. 2016, 59, 60–65+75. [Google Scholar]
- Tian, R.; Yao, X.; Huang, X.; Ren, J.; Zhang, D. Interval sensitivity and optimization of high-speed milling process parameters of titanium alloy for machining surface roughness. J. Aeronaut. 2010, 31, 2464–2470. [Google Scholar]
- Huang, J.; Yi, H.; Shu, A.; Tang, L.; Song, K. Visual measurement of grinding surface roughness based on feature fusion. Meas. Sci. Technol. 2023, 34, 105019. [Google Scholar] [CrossRef]
- Pan, Y.; Qiao, Y.; Wang, Y.; Liu, X.; Zhou, P. Real-time prediction of grinding surface roughness based on multi-sensor signal fusion. Int. J. Adv. Manuf. Technol. 2023, 127, 5847–5861. [Google Scholar] [CrossRef]
- Lu, E.; Guo, Y.; Zhu, X.; Wang, Y.; Ren, W.; Yang, Y. A new grinding surface roughness measurement method based on image quality algorithm and BP neural network. Surf. Topogr. Metrol. Prop. 2022, 10, 045024. [Google Scholar] [CrossRef]
- Fang, R.; Yi, H.; Shu, A.; Lv, X. Evaluation of grinding surface roughness based on gradient similarity and color similarity. Surf. Topogr. Metrol. Prop. 2022, 10, 035041. [Google Scholar] [CrossRef]
- Liu, Y.; Song, Z.; Liang, Z.; Cui, X.; Gong, Y.; Sun, X.; Dong, Z.; Yang, H.; Liu, W. Experimental investigations into groove bottom surface roughness for Zr-based bulk metallic glass by using milling. Int. J. Adv. Manuf. Technol. 2023, 125, 855–872. [Google Scholar] [CrossRef]
- Liang, X.; Lin, B.; Liu, Z.; Ma, X. Study on dispersion and attenuation of laser-induced surface acoustic wave by grinding surface roughness. Appl. Acoust. 2022, 199, 109028. [Google Scholar] [CrossRef]
- Jiang, G.; Zhao, Z.; Xiao, G.; Li, S.; Chen, B.; Zhuo, X.; Zhang, J. Study of Surface Integrity of Titanium Alloy (TC4) by Belt Grinding to Achieve the Same Surface Roughness Range. Micromachines 2022, 13, 1950. [Google Scholar] [CrossRef]
- Huang, Y.; Liu, G.; Xiao, G.; Xu, J. Abrasive belt grinding force and its influence on surface integrity. Mater. Manuf. Process. 2022, 38, 888–897. [Google Scholar] [CrossRef]
- Shao, B.; Peng, Y.; Zhang, C.; Lu, X.; Yang, W.; Huang, X. Research on the optimal allocation method of nitrogen-rich gas based on entropy weight improved TOPSIS theory. J. Aerodyn. 2023, 1–9. [Google Scholar] [CrossRef]
- Zhong, R.; Qin, X.; Lai, M.; Hu, W.; Xia, C.; Lu, N.; Xiao, Z. Research on the evaluation method of energy efficiency management level of hydropower station based on AHP and TOPSIS. China Rural. Water Conserv. Hydropower 2023, 1–11. [Google Scholar] [CrossRef]
- Zhan, X.; Shu, L.; Liu, T.; Fan, Z. An aero-engine maintainability assessment method based on improved TOPSIS. Comput. Meas. Control 2023, 117, 1–9. [Google Scholar] [CrossRef]
- Guo, Z.; Zhang, Z. Safety risk evaluation of assembly building construction based on AHP-TOPSIS. Chongqing Constr. 2022, 21, 67–70. [Google Scholar]
- He, L.; Du, M.; Zhang, J.; Du, Y. Dynamic evaluation of water resources carrying capacity based on improved TOPSIS. China Rural Water Conserv. Hydropower 2023, 1–6. [Google Scholar] [CrossRef]
- Liang, Y.; Gao, G.; Li, X.; Luo, Z.; Song, S.; Huang, S. Optimisation of mining methods for deep thick and large ore bodies based on AHP-TOPSIS comprehensive evaluation. Mod. Min. Ind. 2022, 38, 85–88. [Google Scholar]
- Han, R.; Guo, X.; Liu, X.; He, L.; Li, G.; Wang, X. Application of entropy weight-based TOPSIS method in comprehensive evaluation of Perilla frutescens. Mol. Plant Breed. 1–13. Available online: http://kns.cnki.net/kcms/detail/46.1068.S.20221009.1420.026.html (accessed on 26 October 2023).
- Zhu, J.; Cui, X. Evaluation of China’s comprehensive marine strength based on entropy weight TOPSIS model. Sci. Ind. 2022, 22, 283–289. [Google Scholar]
- Li, Y. Application of digital image technology in machining surface roughness detection. Foshan Ceram. 2023, 33, 54–56. [Google Scholar]
- Yang, D.; Yu, J.; Gao, M.; Wu, J.; Tu, L.; An, Q. Optimisation of machining parameters of 1J50 soft magnetic alloy based on milling force and surface roughness. Tool Technol. 2022, 56, 49–54. [Google Scholar]
- Xiao, G.; Chen, S.; Li, S.; Chen, B.; Zhuo, X.; Huang, Y. Study on the effect of abrasive wear on the surface integrity of TC17 by abrasive belt grinding. Aerosp. Manuf. Technol. 2022, 65, 26–33. [Google Scholar]
- Ren, H.; Li, J.; Xie, L. Inclined feed method for robotic belt grinding of aero-engine blades. Form. Technol. Prod. Mod. 2021, 38, 42–49. [Google Scholar]
- Song, W.-W.; Huang, Y.; Xiao, G.-J.; Song, S.-Y.; Zhang, Y.-D. Study on the formation of surface topography and its prediction in TC17 titanium alloy belt grinding. Aviat. Manuf. Technol. 2021, 64, 56–62. [Google Scholar]
- Yuan, L. Quality and Efficiency Improvement Method and Experimental Research On Aircraft Blade Abrasive Belt Grinding. Master’s Thesis, Chongqing University, Chongqing, China, 2021. [Google Scholar]
- Tian, F.; Si, D.; Li, L. Prediction and validation of surface roughness in abrasive belt grinding. Tool Technol. 2021, 55, 96–100. [Google Scholar]
- Wang, H.; Luo, M. Influence of abrasive belt grinding parameters on the depth of material removal. J. Fujian Eng. Coll. 2021, 19, 524–531. [Google Scholar]
- Dong, H.; Yang, H.; Sun, X.; Dong, Z.; Liu, Y. Prediction of surface roughness of screw belt grinding based on improved neural network algorithm. Surf. Technol. 2022, 51, 275–283. [Google Scholar]
- Duan, J.; Zhou, Z.; An, J.; Gao, F.; Li, Y.; Huai, W. Study on contact characteristics of blade belt grinding based on contact wheel flexibility regulation. J. Mech. Eng. 2023, 59, 354–365. [Google Scholar]
- Hu, C. Research on Diamond Belt Grinding Mechanism and Surface Quality of SiCp/Al composites. Master’s Thesis, Chongqing University, Chongqing, China, 2021. [Google Scholar]
- Kong, X.; Hu, G.; Liu, B.; Dong, Z.; Ci, Y.; Wang, M. Optimisation analysis of cutting force and surface roughness in titanium alloy turning. Tool Technol. 2022, 56, 20–25. [Google Scholar]
- Liu, C.; Wu, L.; Yang, F.; Hong, K.; Zhang, F.; Liu, X. Conditional impact analysis method based on the comparison of interval values of distribution parameters. J. Wuhan Eng. Vocat. Tech. Coll. 2021, 33, 1–7. [Google Scholar]
- Wang, X. A three-parameter interval grey number multi-attribute decision-making method based on improved TOPSIS. Syst. Sci. Math. 2021, 41, 1328–1338. [Google Scholar]
- Qiao, H.; Hu, S.; Xiang, Y.; Liu, S.; Zhang, L. Research on the Analysis and Prediction Model of Machining Parameters of Titanium Alloy by Abrasive Belt. Metals 2023, 13, 1085. [Google Scholar] [CrossRef]
Figure 1.
The evaluation hierarchical model of factors influencing surface roughness in grinding.
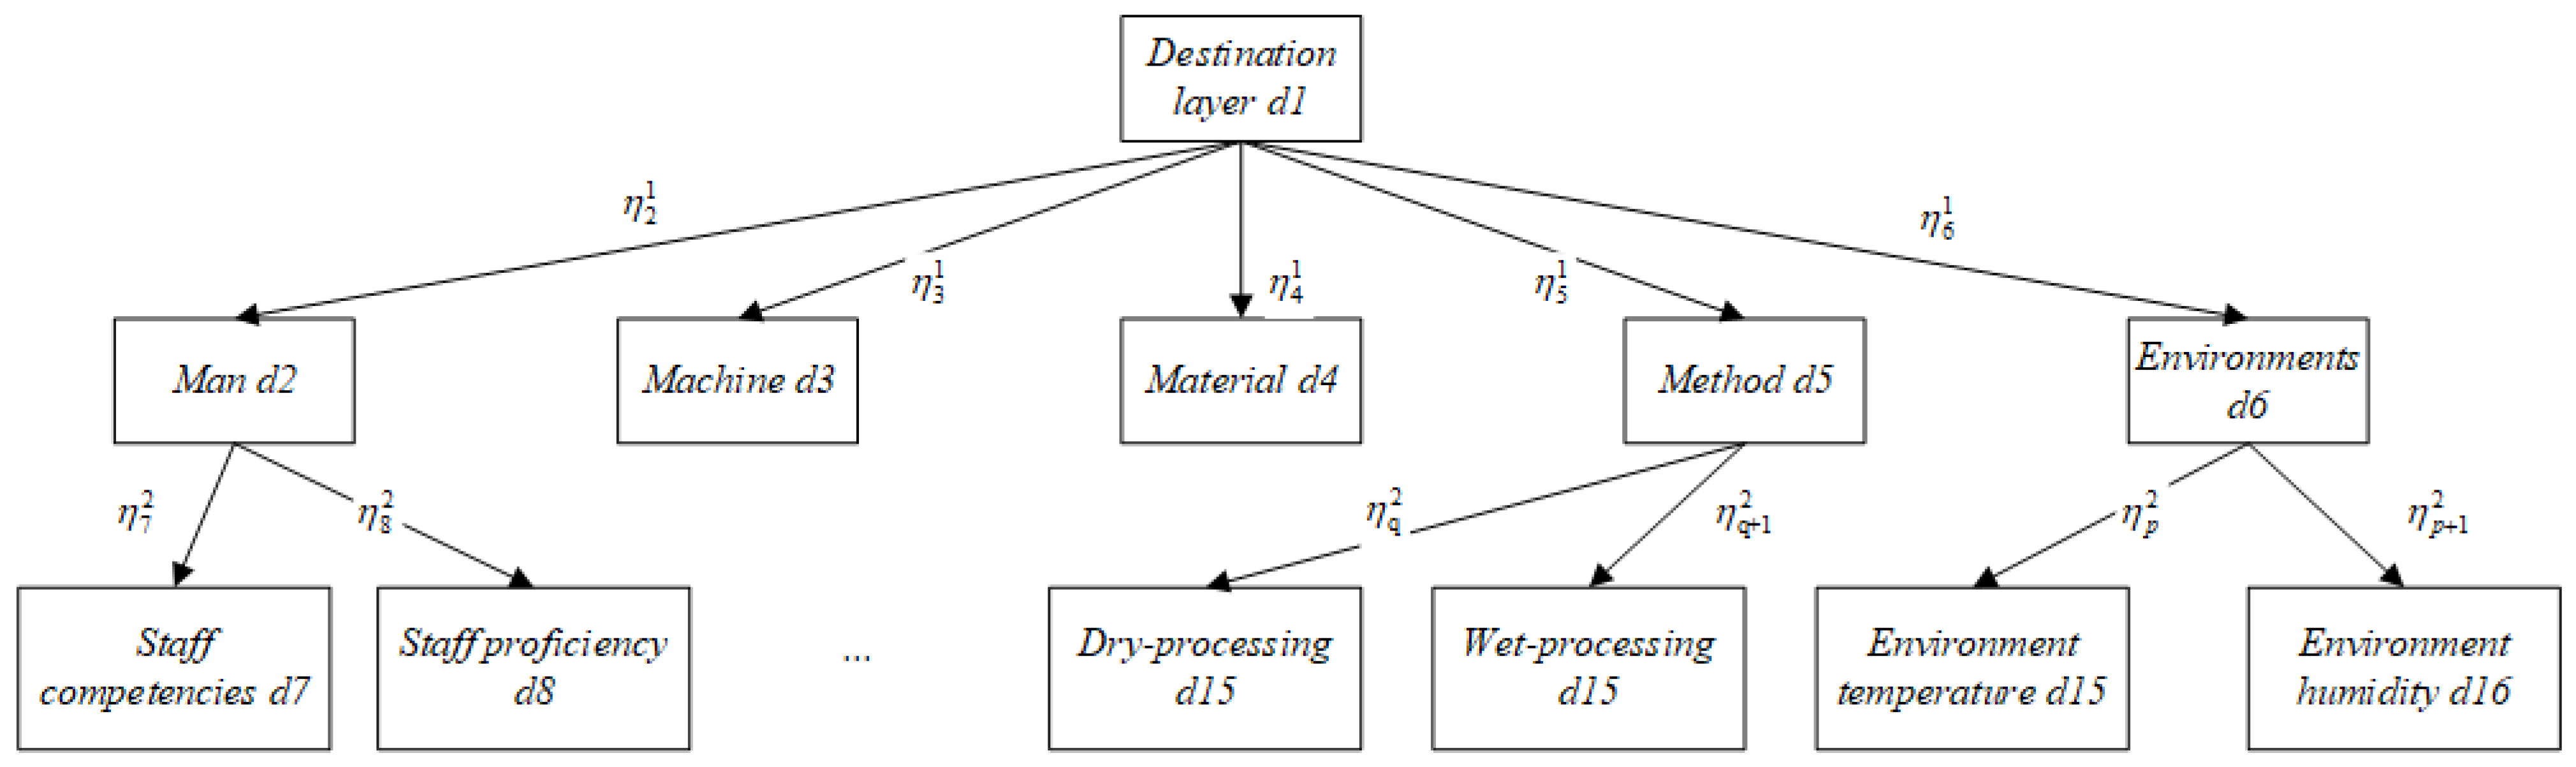
Figure 2.
Belt grinding experiment platform [38].
Figure 2.
Belt grinding experiment platform [38].

Figure 3.
Sensitivity curves of surface roughness to process parameters. (a) Abrasive grit size; (b) Belt line speed; (c) Grinding pressure.
Figure 3.
Sensitivity curves of surface roughness to process parameters. (a) Abrasive grit size; (b) Belt line speed; (c) Grinding pressure.
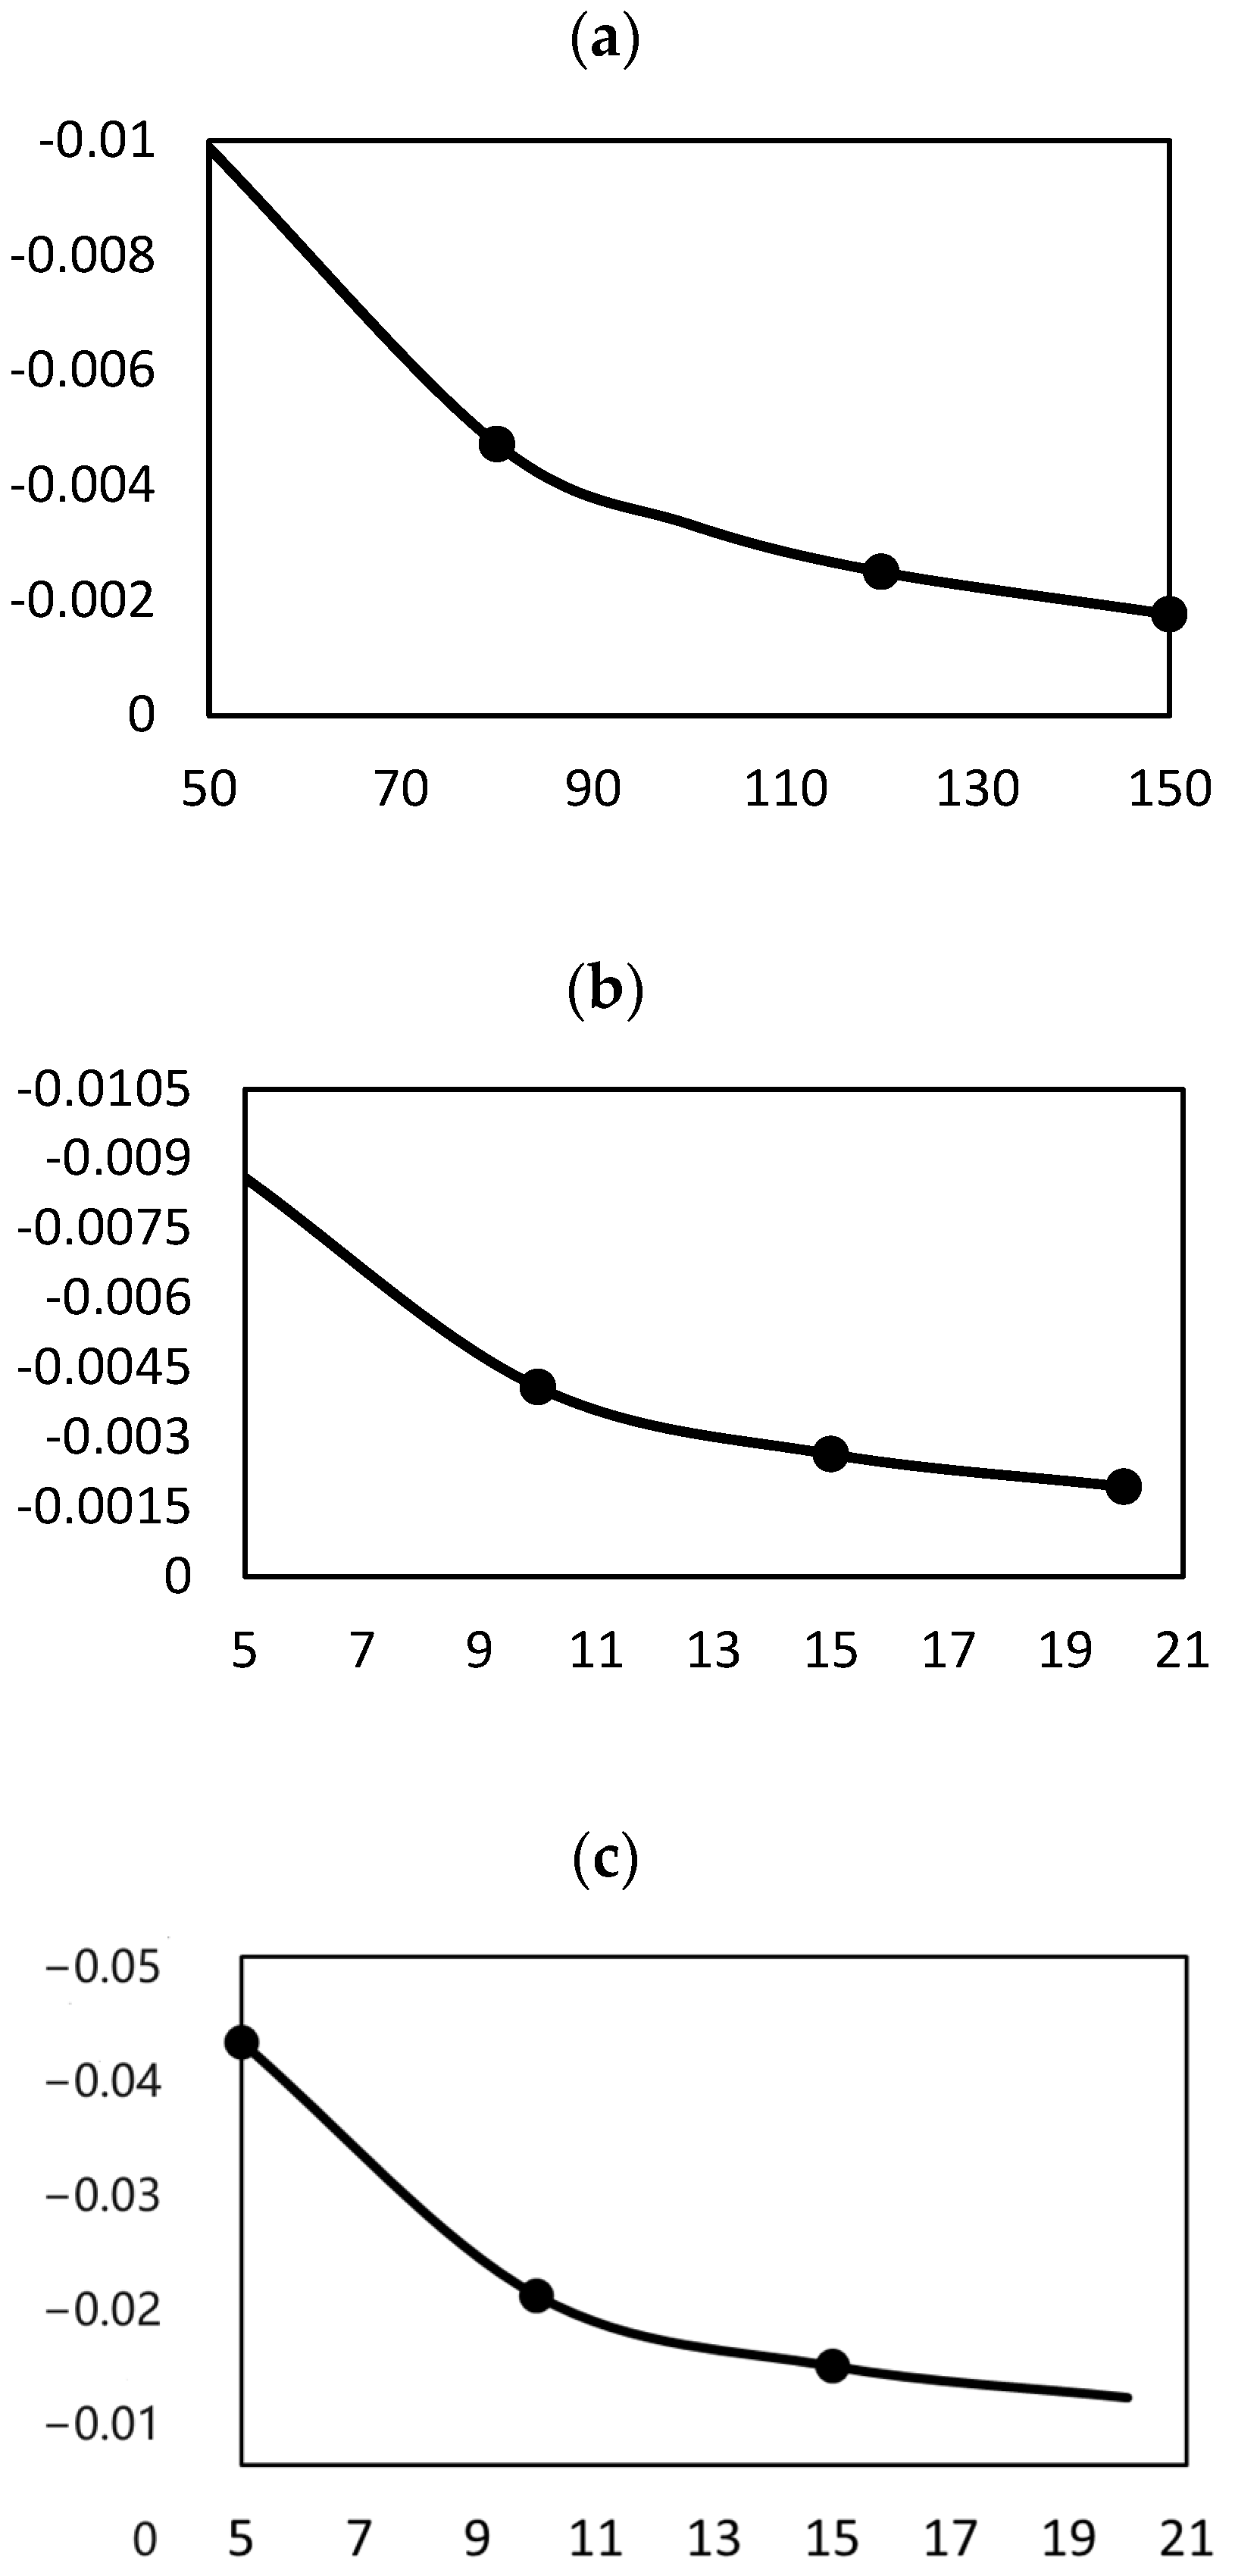
Figure 4.
(a) Effect of abrasive grain size on surface roughness. (b) Effect of abrasive belt line speed on surface roughness. (c) Effect of grinding pressure on surface roughness.
Figure 4.
(a) Effect of abrasive grain size on surface roughness. (b) Effect of abrasive belt line speed on surface roughness. (c) Effect of grinding pressure on surface roughness.

Figure 5.
Microscope images of a TC4 titanium alloy blade after the grinding process (P = 150#, V = 20 m/s, and F = 10 N).
Figure 5.
Microscope images of a TC4 titanium alloy blade after the grinding process (P = 150#, V = 20 m/s, and F = 10 N).
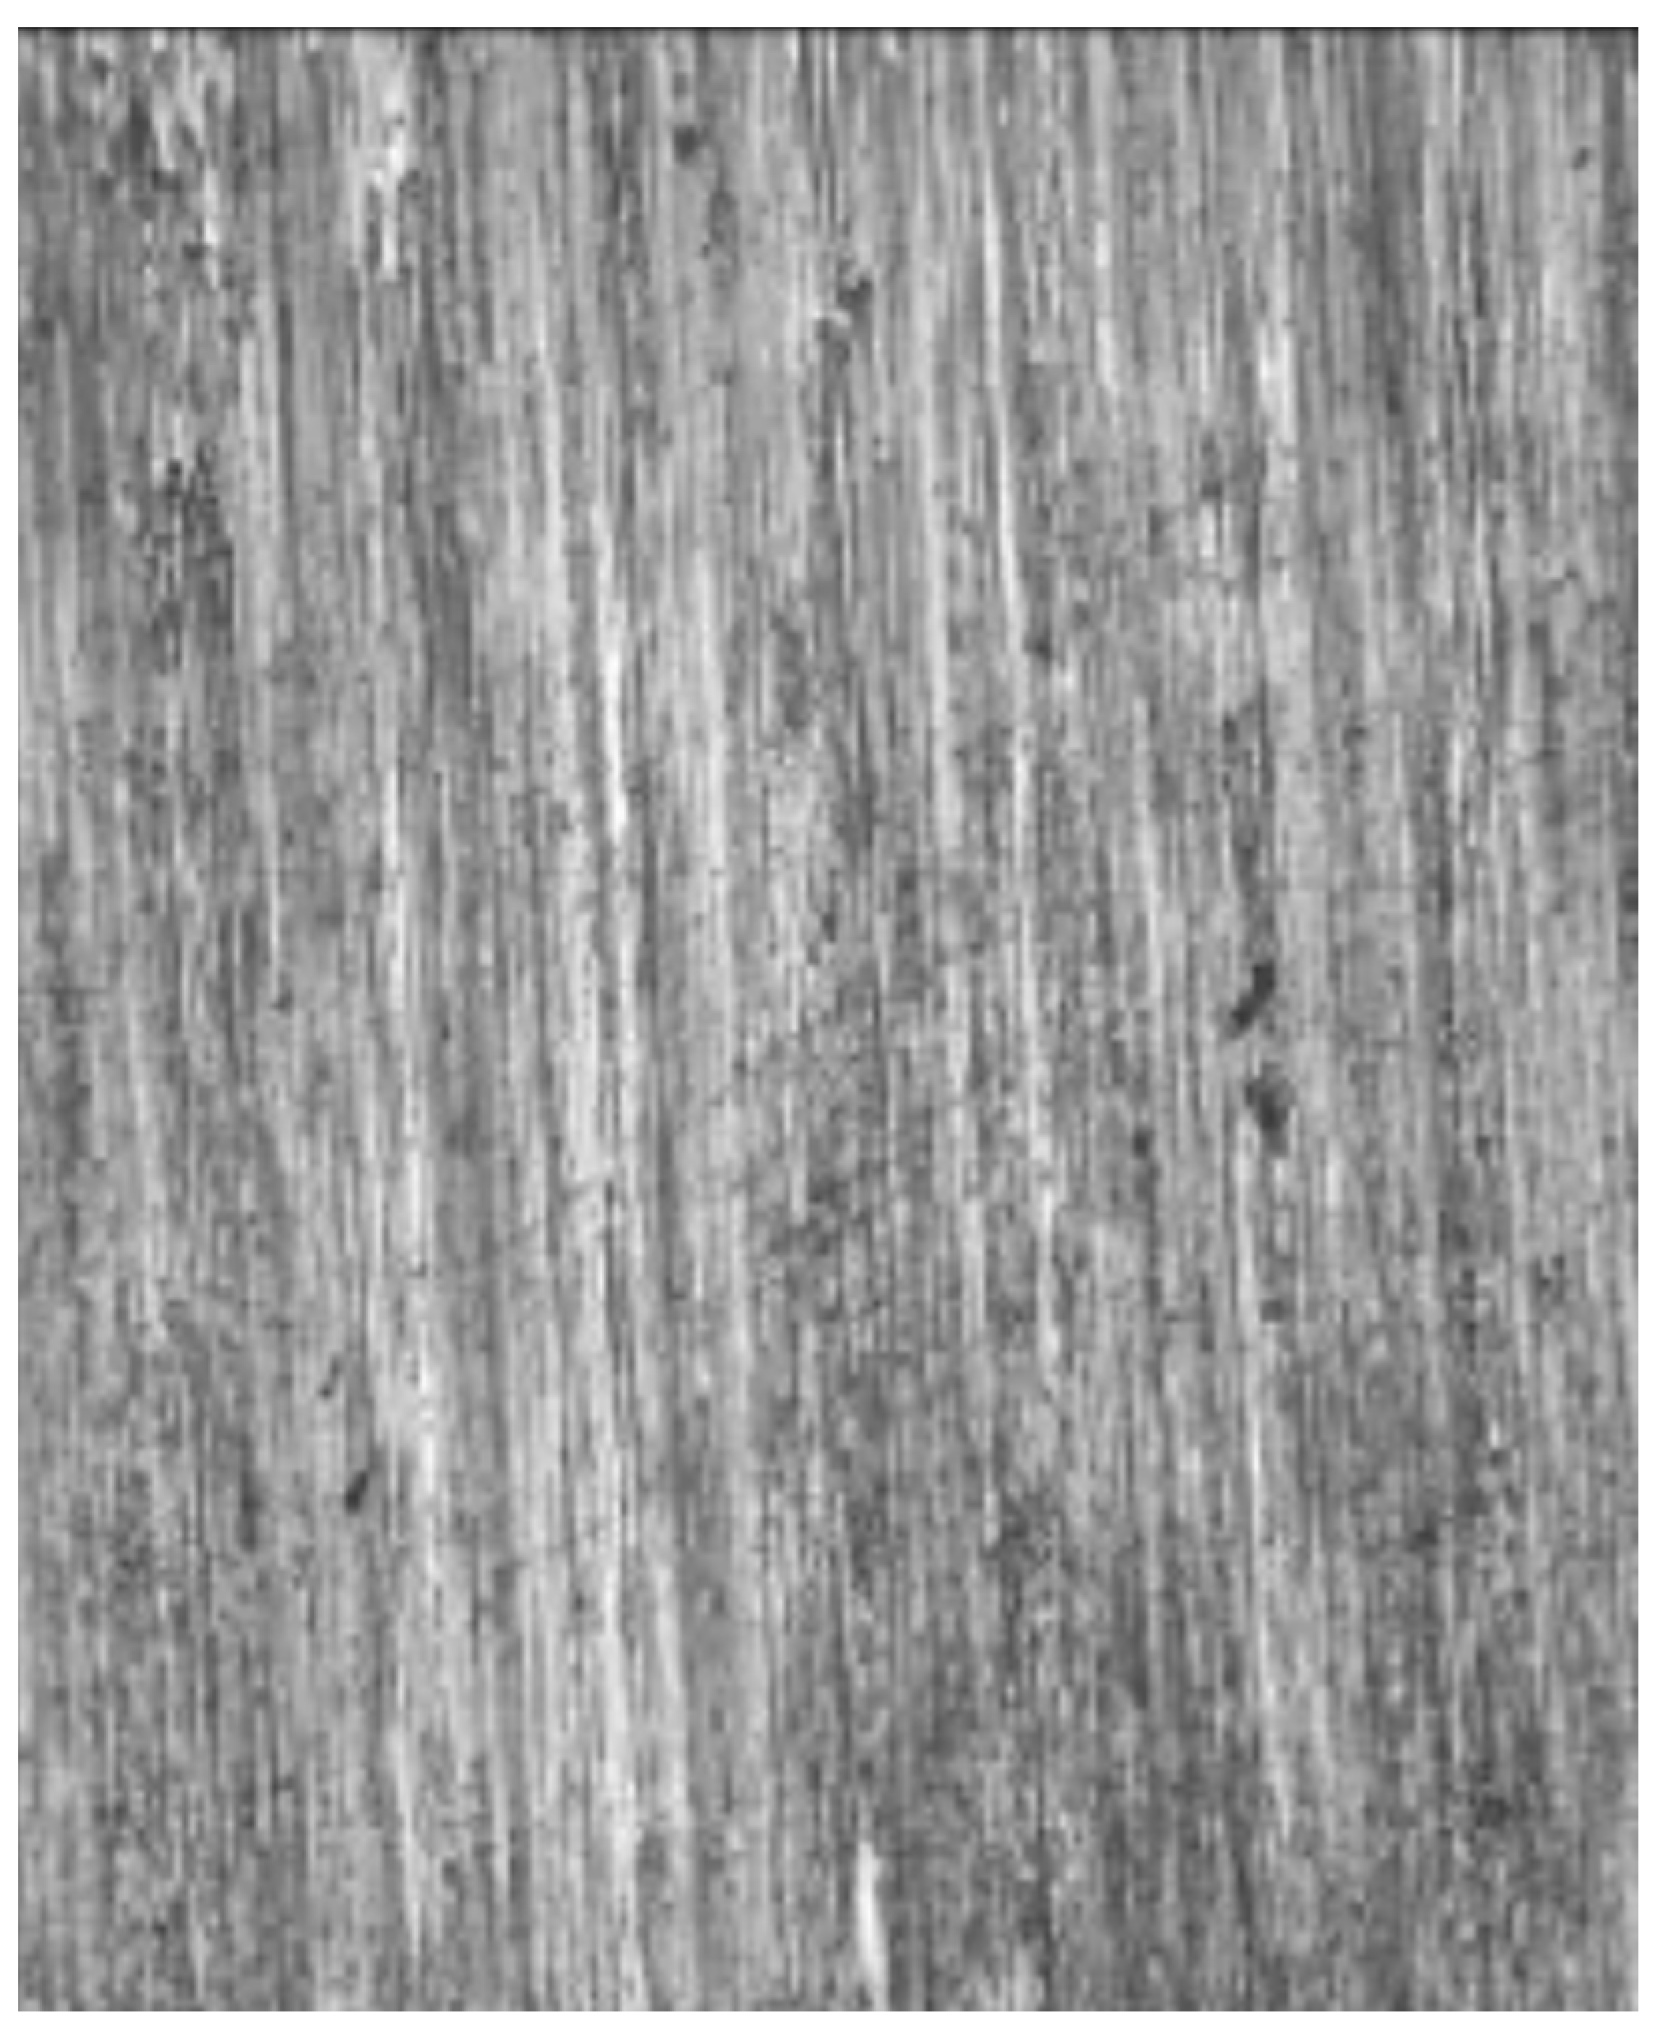
Figure 6.
Three-dimensional topography of a TC4 titanium alloy blade after the grinding process (P = 150#, V = 20 m/s, and F = 10 N).
Figure 6.
Three-dimensional topography of a TC4 titanium alloy blade after the grinding process (P = 150#, V = 20 m/s, and F = 10 N).
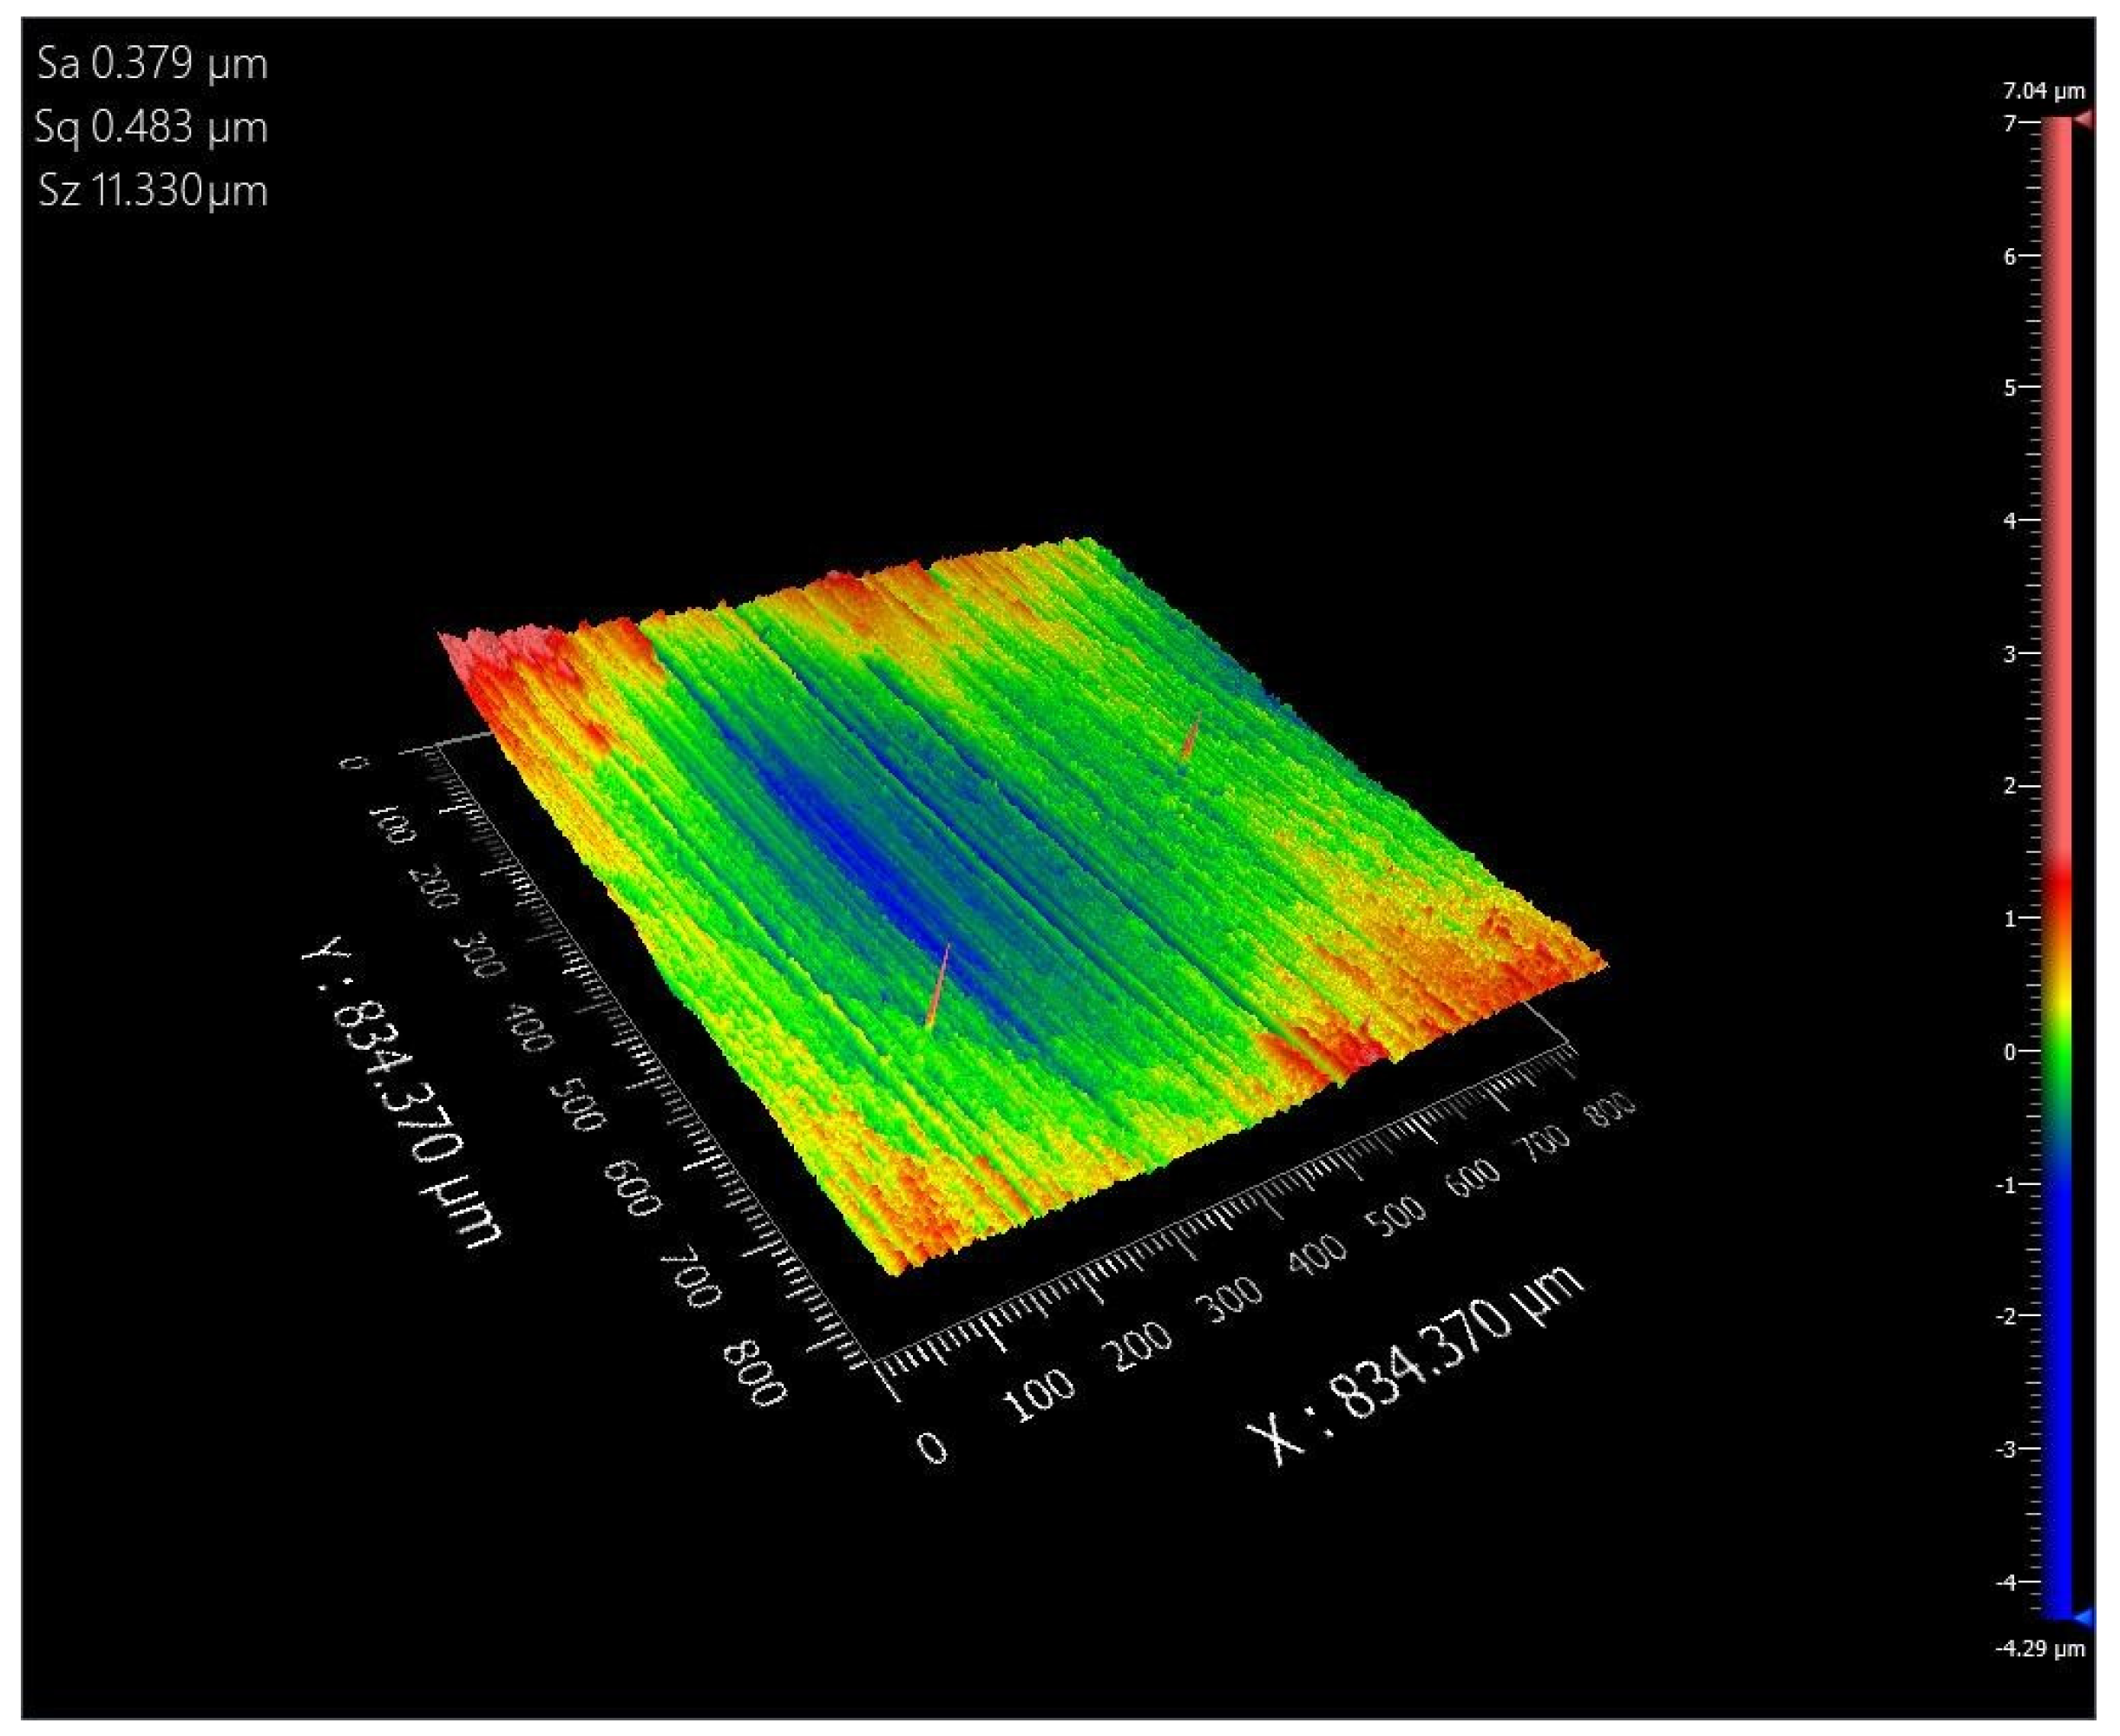
Figure 7.
Microscope images of a TC4 titanium alloy blade after the grinding process (P = 120#, V = 15 m/s, and F = 10 N).
Figure 7.
Microscope images of a TC4 titanium alloy blade after the grinding process (P = 120#, V = 15 m/s, and F = 10 N).
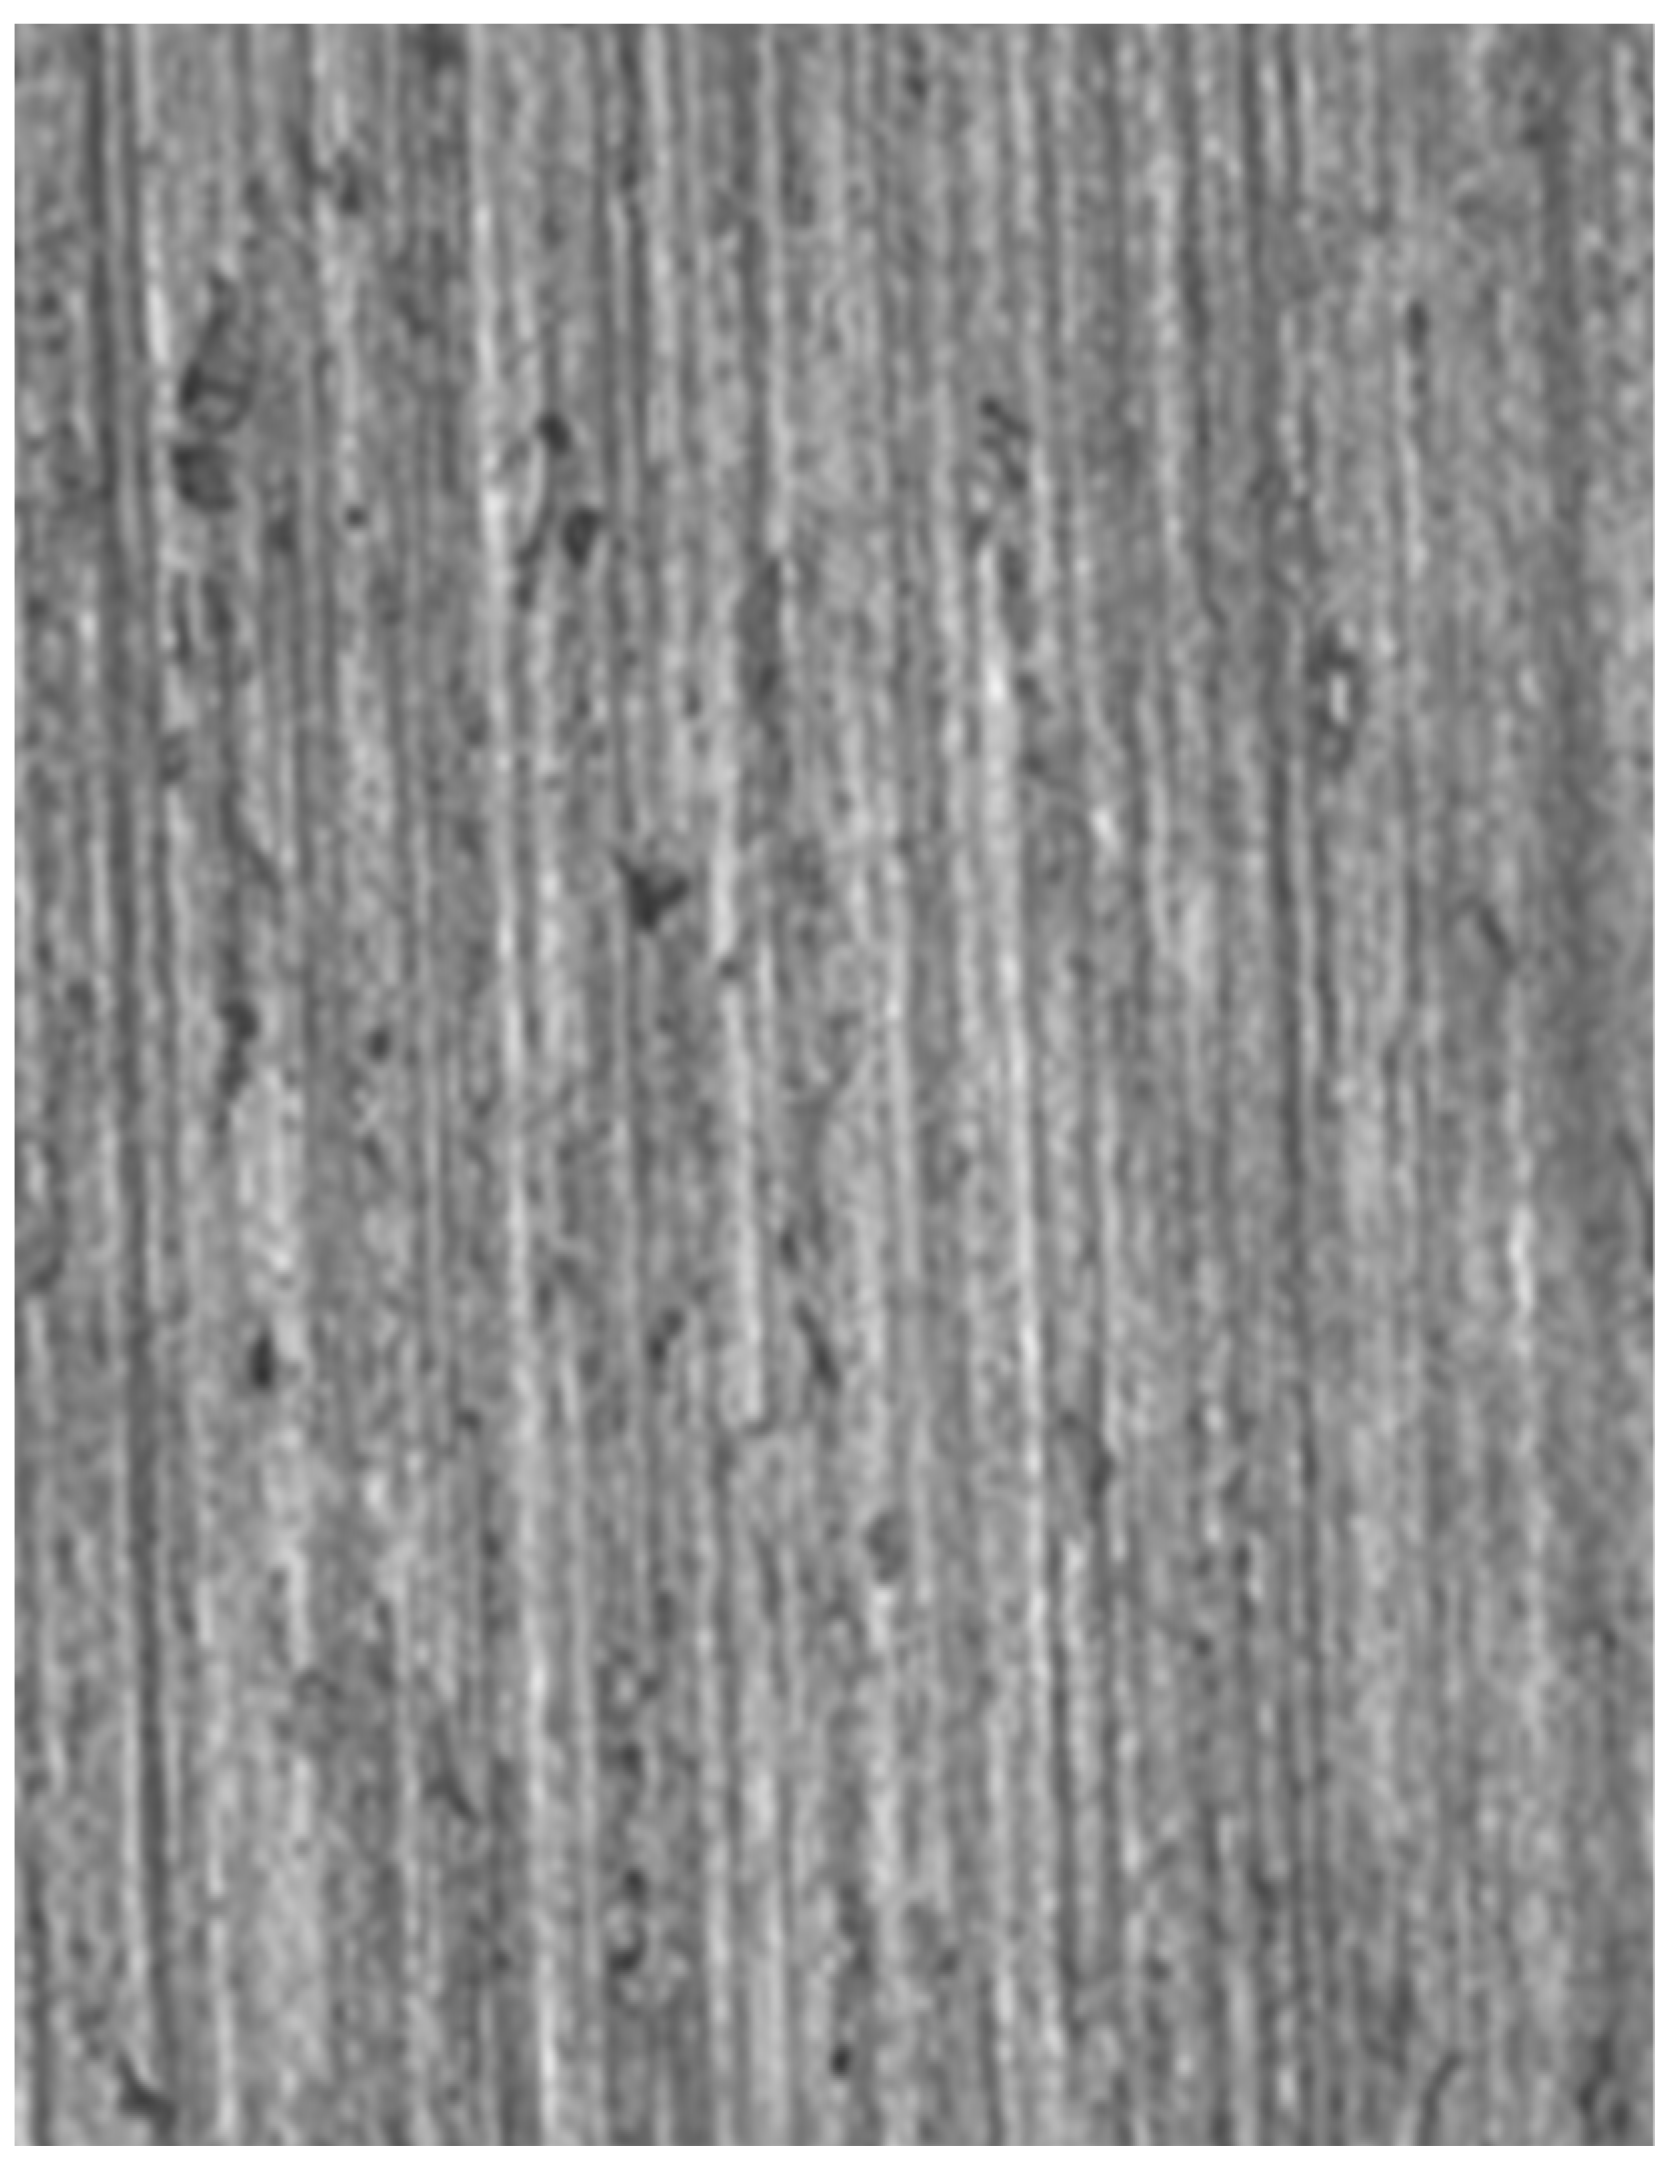
Figure 8.
Three-dimensional topography of a TC4 titanium alloy blade after the grinding process (P = 120#, V = 15 m/s, and F = 10 N).
Figure 8.
Three-dimensional topography of a TC4 titanium alloy blade after the grinding process (P = 120#, V = 15 m/s, and F = 10 N).

Figure 9.
Microscope images of a TC4 titanium alloy blade after the grinding process (P = 80#, F = 10 N, and V = 5 m/s).
Figure 9.
Microscope images of a TC4 titanium alloy blade after the grinding process (P = 80#, F = 10 N, and V = 5 m/s).
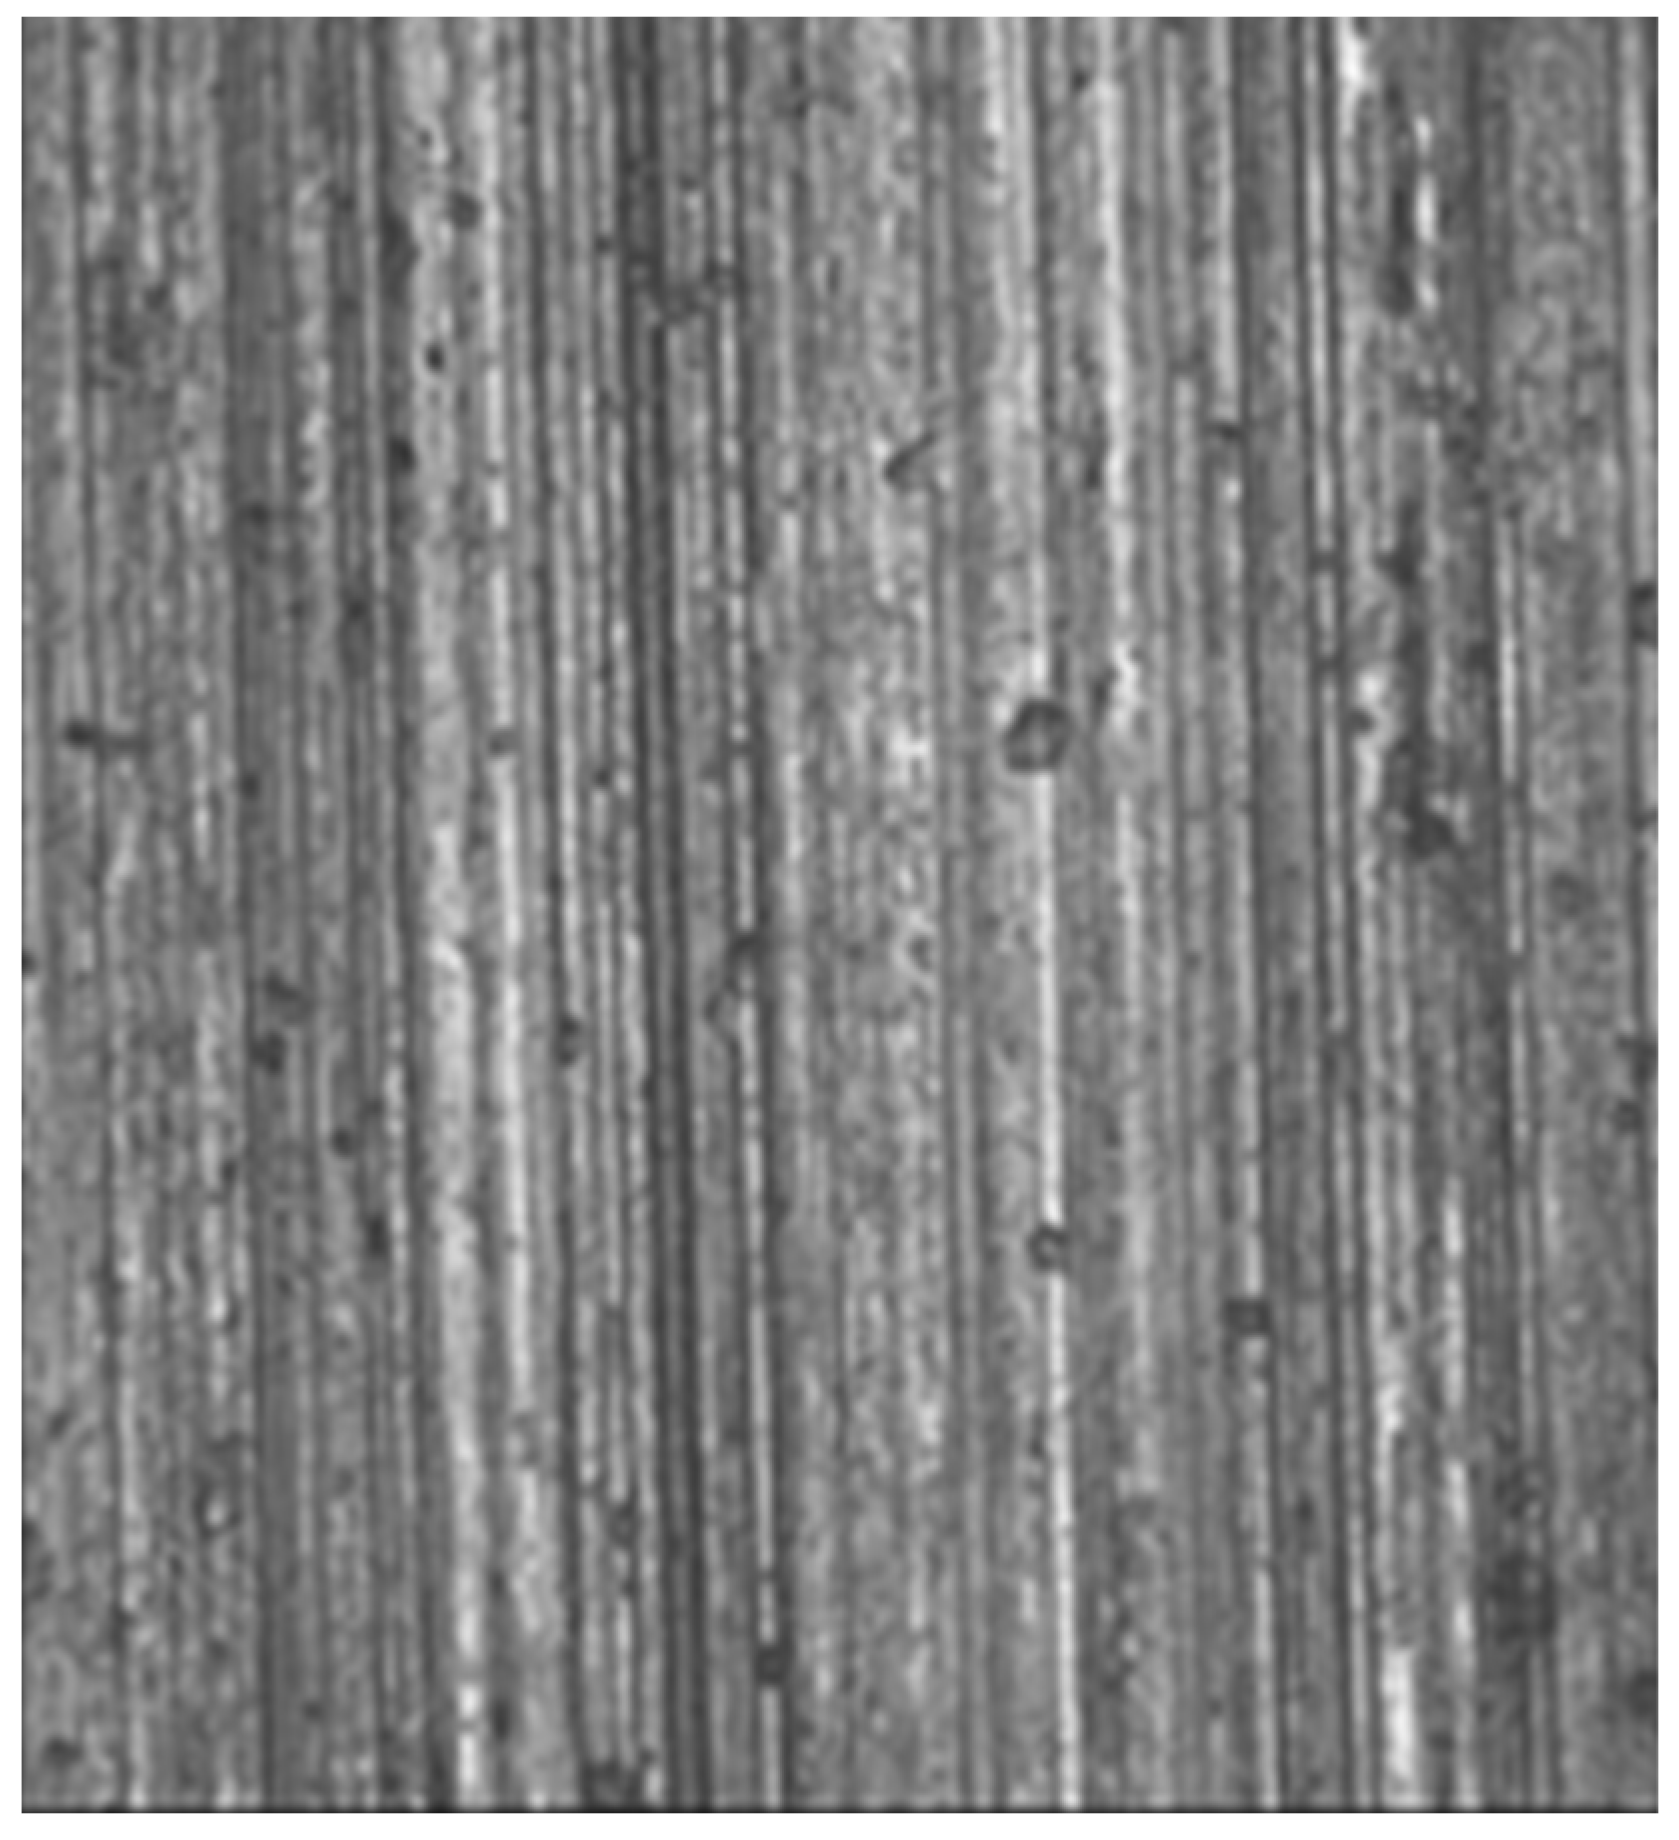
Figure 10.
Three-dimensional topography of a TC4 titanium alloy blade after the grinding process (P = 80#, F = 10 N, and V = 5 m/s).
Figure 10.
Three-dimensional topography of a TC4 titanium alloy blade after the grinding process (P = 80#, F = 10 N, and V = 5 m/s).

Table 1.
Manual evaluation form.
| Factor | Man | Machine | Material | Method | Environment | |||||
|---|---|---|---|---|---|---|---|---|---|---|
| Employee Skills (D1) | Employee Proficiency (D2) | Feed Rate (D3) | Grinding Pressure (D4) | Belt Line Speed (D5) | Grit Size of Abrasive Belts (D6) | Dry Processing (D7) | Wet Processing (D8) | Processing Environment Temperature (D9) | Processing Environment Humidity (D10) | |
| Norm | 60% | 80% | 50% | 90% | 80% | 60% | 60% | 50% | 70% | 50% |
Table 2.
Balancing weights for each item.
| Factor | Human | Machine | Material | Method | Environment | |||||
|---|---|---|---|---|---|---|---|---|---|---|
| Employee Skill (D1) | Employee Proficiency (D2) | Feed Rate (D3) | Grinding Pressure (D4) | Belt Line Speed (D5) | Grit Size of Abrasive Belts (D6) | Dry Processing (D7) | Wet Processing (D8) | Processing Environment Temperature (D9) | Processing Environment Humidity (D10) | |
| Norm | 11.3% | 10.1% | 6.1% | 9.1% | 10.6% | 22.6% | 6.2% | 8.3% | 6.4% | 5.4% |
Table 3.
Sand belt parameters.
| Abrasive Belt Model | Abrasive Material | Abrasive Grain Size | Abrasive Belt Size (Circumference × Width) |
|---|---|---|---|
| TJ113 | Aluminium oxide | 80# | 1510 mm × 25 mm |
| TJ113 | Aluminium oxide | 120# | 1510 mm × 25 mm |
| TJ113 | Aluminium oxide | 150# | 1510 mm × 25 mm |
Table 4.
Orthogonal test plan and results.
| No. | P | Vs | F | Ra |
|---|---|---|---|---|
| 1 | 80# | 10 | 5 | 0.863 |
| 2 | 80# | 15 | 10 | 0.662 |
| 3 | 80# | 20 | 15 | 0.573 |
| 4 | 120# | 10 | 10 | 0.491 |
| 5 | 120# | 15 | 15 | 0.469 |
| 6 | 120# | 20 | 5 | 0.658 |
| 7 | 150# | 10 | 15 | 0.452 |
| 8 | 150# | 15 | 5 | 0.579 |
| 9 | 150# | 20 | 10 | 0.434 |
Table 5.
Stable and unstable domains of process parameters.
| Process Parameters | Stable Domain | Unstable Domain |
|---|---|---|
| Abrasive particle size P(#) | [120, 150] | [80, 120] |
| Abrasive belt line speed Vs (m/s) | [15, 20] | [10, 15] |
| Grinding pressure F(N) | [10, 15] | [5, 10] |
Table 6.
Preferred intervals for process parameters.
| Process Parameter | Preferred Interval for Process Parameters | Stable or Unstable Domains | Surface Roughness Variation Range |
|---|---|---|---|
| Abrasive particle size, P(#) | [120, 150] | Stable domain | 0.488~0.539 |
| Abrasive belt line speed, Vs (m/s) | [15, 20] | Stable domain | 0.555~0.570 |
| Grinding pressure, F(N) | [10, 15] | Stable domain | 0.498~0.529 |
Disclaimer/Publisher’s Note: The statements, opinions and data contained in all publications are solely those of the individual author(s) and contributor(s) and not of MDPI and/or the editor(s). MDPI and/or the editor(s) disclaim responsibility for any injury to people or property resulting from any ideas, methods, instructions or products referred to in the content. |
© 2023 by the authors. Licensee MDPI, Basel, Switzerland. This article is an open access article distributed under the terms and conditions of the Creative Commons Attribution (CC BY) license (https://creativecommons.org/licenses/by/4.0/).
Share and Cite
MDPI and ACS Style
Shang, Y.; Hu, S.; Qiao, H. Sensitivity Study of Surface Roughness Process Parameters in Belt Grinding Titanium Alloys. Metals 2023, 13, 1825. https://doi.org/10.3390/met13111825
AMA Style
Shang Y, Hu S, Qiao H. Sensitivity Study of Surface Roughness Process Parameters in Belt Grinding Titanium Alloys. Metals. 2023; 13(11):1825. https://doi.org/10.3390/met13111825
Chicago/Turabian StyleShang, Yueru, Sibo Hu, and Hu Qiao. 2023. "Sensitivity Study of Surface Roughness Process Parameters in Belt Grinding Titanium Alloys" Metals 13, no. 11: 1825. https://doi.org/10.3390/met13111825
Note that from the first issue of 2016, this journal uses article numbers instead of page numbers. See further details here.