Article

The Influence of Centerline Segregation on Impact Toughness in Welding Heat-Affected Zone of X70 Pipeline Steel

1
School of Materials Science and Engineering, Guangdong Ocean University, Yangjiang 529500, China
2
Yangjiang Advanced Alloys Laboratory, Yangjiang 529500, China
3
School of Mechanical Engineering, University of Jinan, Jinan 250022, China
4
Collaborative Innovation Center of Steel Technology, University of Science and Technology Beijing, Beijing 100083, China
*
Author to whom correspondence should be addressed.
Metals 2024, 14(2), 209; https://doi.org/10.3390/met14020209
Submission received: 12 December 2023 / Revised: 2 February 2024 / Accepted: 5 February 2024 / Published: 7 February 2024

Abstract

:
The influence of centerline segregation on the low-temperature impact toughness of the heat-affected zone (HAZ) of welded joints was studied by welding experiments on X70 steel plates rolled from continuous casting slabs with segregation grades of class 2 and class 3. The experimental results show that the impact toughness at HAZ from class 2 slab steel plate is more stable and has excellent low-temperature toughness than that of class 3 slab steel plate. The impact toughness of the HAZ of the class 3 slab steel plate is low to 100 J at −40 °C and has a severe fluctuation range (~150 J), and the delamination phenomenon is also observed in the fracture cross-section. The reason for this phenomenon is due to the enrichment of C and Mn elements in the centerline segregation zone. The formation of abnormal microstructure (martensite/bainite) in the segregation zone leads to stress concentration, which easily weakens the low-temperature toughness of the joint.

1. Introduction

With the rapid development of the global economy, oil and gas resources are increasingly scarce. At the same time, with the increase in the demand for oil and gas resources, the amount of oil and gas transmission is rising, and the pipe diameter and wall thickness are also increasing [1]. Because the Super-large Transportation Capacity pipeline often passes through the alpine region, fault, and seismic activity area, the pipeline must meet the requirements of low-temperature toughness and longitudinal large strain performance [2]. It is more difficult to meet these requirements while the wall thickness increases significantly. The construction of oil and gas pipelines in alpine regions puts forward higher and more stringent requirements for the low-temperature toughness and service stability of pipeline steel [3,4]. At present, the typical example in the world is the natural gas pipeline project of Pavniankovo-Ucha in Russia, which requires that the impact energy of the steel pipe at −40 °C is not less than 200 J and the impact energy of the weld metal and HAZ at −40 °C is not less than 60 J [5]. In addition, the China-Russia Eastern Gas Pipeline, which was completed in 2019, also requires low-temperature mechanical properties of −40 °C. At the same time, the project adopts super large diameter, high steel grade, and high-pressure pipeline steel.
The welded joint of pipeline steel is easy to crack due to the effect of the welding thermal cycle, which is often the weak link of fracture. A lot of research work has been conducted on the welding performance of the welding process and method [6,7,8,9,10,11,12]. Domestic pipeline welding has experienced manual welding, semi-automatic welding, and automatic welding [13]. At present, the commonly used pipeline welding methods mainly include fibrin electrode/low hydrogen electrode manual arc welding, STT gas shielded welding/flux cored wire semi-automatic welding, self-shielded flux cored wire semi-automatic welding, solid cored wire gas shielded automatic welding, etc. [14,15,16,17]. The weldability is mainly evaluated through two aspects. One is the process weldability [18,19]. Under certain welding process conditions, defects such as pores and cracks easily appear. The second is the use of weldability [19,20], that is, whether the welded joint can meet the use requirements, such as strength, toughness, hardness, etc. At present, the research on the weldability of pipeline steel mainly focuses on welding methods and processes, while the influence of center segregation of base metal (BM) on weldability is rarely reported. At the same time, center segregation will increase the cold crack sensitivity and hardenability of HAZ and will also deteriorate toughness [21,22]. Therefore, based on the requirements of low-temperature service performance of pipeline steel, this study combines the double-sided submerged arc automatic welding experiment to study the influence of center segregation on the microstructure and mechanical properties of the HAZ of the welded joint and provides ideas for the design and development of pipeline steel in a low-temperature environment.

2. Experimental Materials and Methods

The steel plate (18 mm) welding experiment of X70 pipeline steel (API 5L) was carried out by using industrial welding wire to verify the influence of centerline segregation of continuous casting slab on actual welding performance. The BM plate material has different segregation degrees, and its chemical composition is shown in Table 1. The welding experiment was completed on a four-wire automatic multifunctional steel pipe welding test machine, and the matrix opens the X-shaped groove. According to the actual welding process requirements of pipeline steel, the two ends of the weld were fixed by single-wire carbon dioxide gas-shielded welding. The welding current was 500 A, the voltage was 22 V, and the welding rate was 50 cm/min. After welding, double-sided four-wire submerged arc filling welding is carried out; the welding wire is H08C (0.086C-0.18Si-1.54Mn-0.32 Mo-0.03Ti-0.0048B) (Tianjin Golden Bridge Welding Materials Group Co., Ltd., Tianjin, China), with SJ101 flux (Tianjin Golden Bridge Welding Materials Group Co., Ltd., Tianjin, China). Firstly, the group pair is pre-welded, and the oil stain on the groove of the test plate is removed before welding. Rust, the welding current is 500 A, the voltage is 22 V, the welding rate is 50 cm/min; after the welding, the internal and external welding, before welding, adjust the inclination, spacing, extension length and linearity of the center of each welding wire; the center line of the welding wire should be parallel to the groove center line of the test piece, the surface composed of the center of the welding wire should also be perpendicular to the surface of the test plate, the internal welding current is 600 A, the voltage is 36 V, the welding rate is 65 cm/min, the external welding current is 700 A, the voltage is 38 V, the welding rate is 60 cm/min, and the welding process is shown in Table 2.
Figure 1 shows the macroscopic morphology and Charpy impact test position of typical four-wire double-sided submerged arc welded joints. The black frame line in the transverse direction is the sampling position of the impact specimen of the welded joint, and the black line in the longitudinal direction is the opening position of the impact specimen, that is, in the HAZ of the welded joint. After observation and detection, no macroscopic defects such as cracks, pores, and slag were found in the joint, and the inner and outer surfaces of the weld were good. In order to study the influence of centerline segregation on welding performance, two steel plates with different grades of centerline segregation were selected and re-welded after cutting. Sample 1# is a steel plate rolled from a continuous casting slab with centerline segregation class 3, while sample 2# is a steel plate rolled from a continuous casting slab with centerline segregation class 2. However, from the macroscopic morphology of the welded joints, the difference between the two samples in the centerline zone is almost not observed; the standard of class 2 and 3 is just for the continuous casting slab; the difference of slabs was published by Guo et al. [21], depending on Mannesmann Standard Charts [23].
The Charpy V-notch sample (55 mm × 10 mm × 10 mm) was used for the impact test. According to the ISO148-1 standard [24], samples were taken from the welded joint position (marked in Figure 1) for processing and then tested at temperatures of −20, −40, and −60 °C according to the test standard, three identical samples were performed at each temperature for both grades. At the welding joint (marked position in Figure 1), metallographic samples are machined through cutting and standard mechanical polishing procedures. Both the optical microscope (OM) and the scanning electron microscope (SEM) observed samples were made by etching with 3% nitrate alcohol. The fraction of abnormal microstructure (martensite/bainite and ferrite) was tested by Electron back-scattered diffraction (EBSD); the samples of EBSD were made by electrolytic etching, the proportion of the electrolyte is glycerol: perchloric acid: alcohol 0.5:1:8.5, EBSD data acquisition was based on orientation imaging microscopy (OIM), and its setting conditions: step size—0.15 µm; tilt angle—70°; working distance- 15 mm; acceleration voltage- 20 kV. The post-processing orientation data of EBSD was obtained through the software Channel 5 from Oxford-HKL. Electron probe micro-analysis (EPMA) microprobe was used to analyze segregated behavior. The segregation band in the microstructure was etched by a hydrochloric acid solution (hydrochloric acid:water = 1:1, 80 °C), marked by a microhardness tester, and then polished for EPMA test.

3. Experimental Results and Analyses

3.1. Low Temperature Impact Toughness and Fracture Morphology

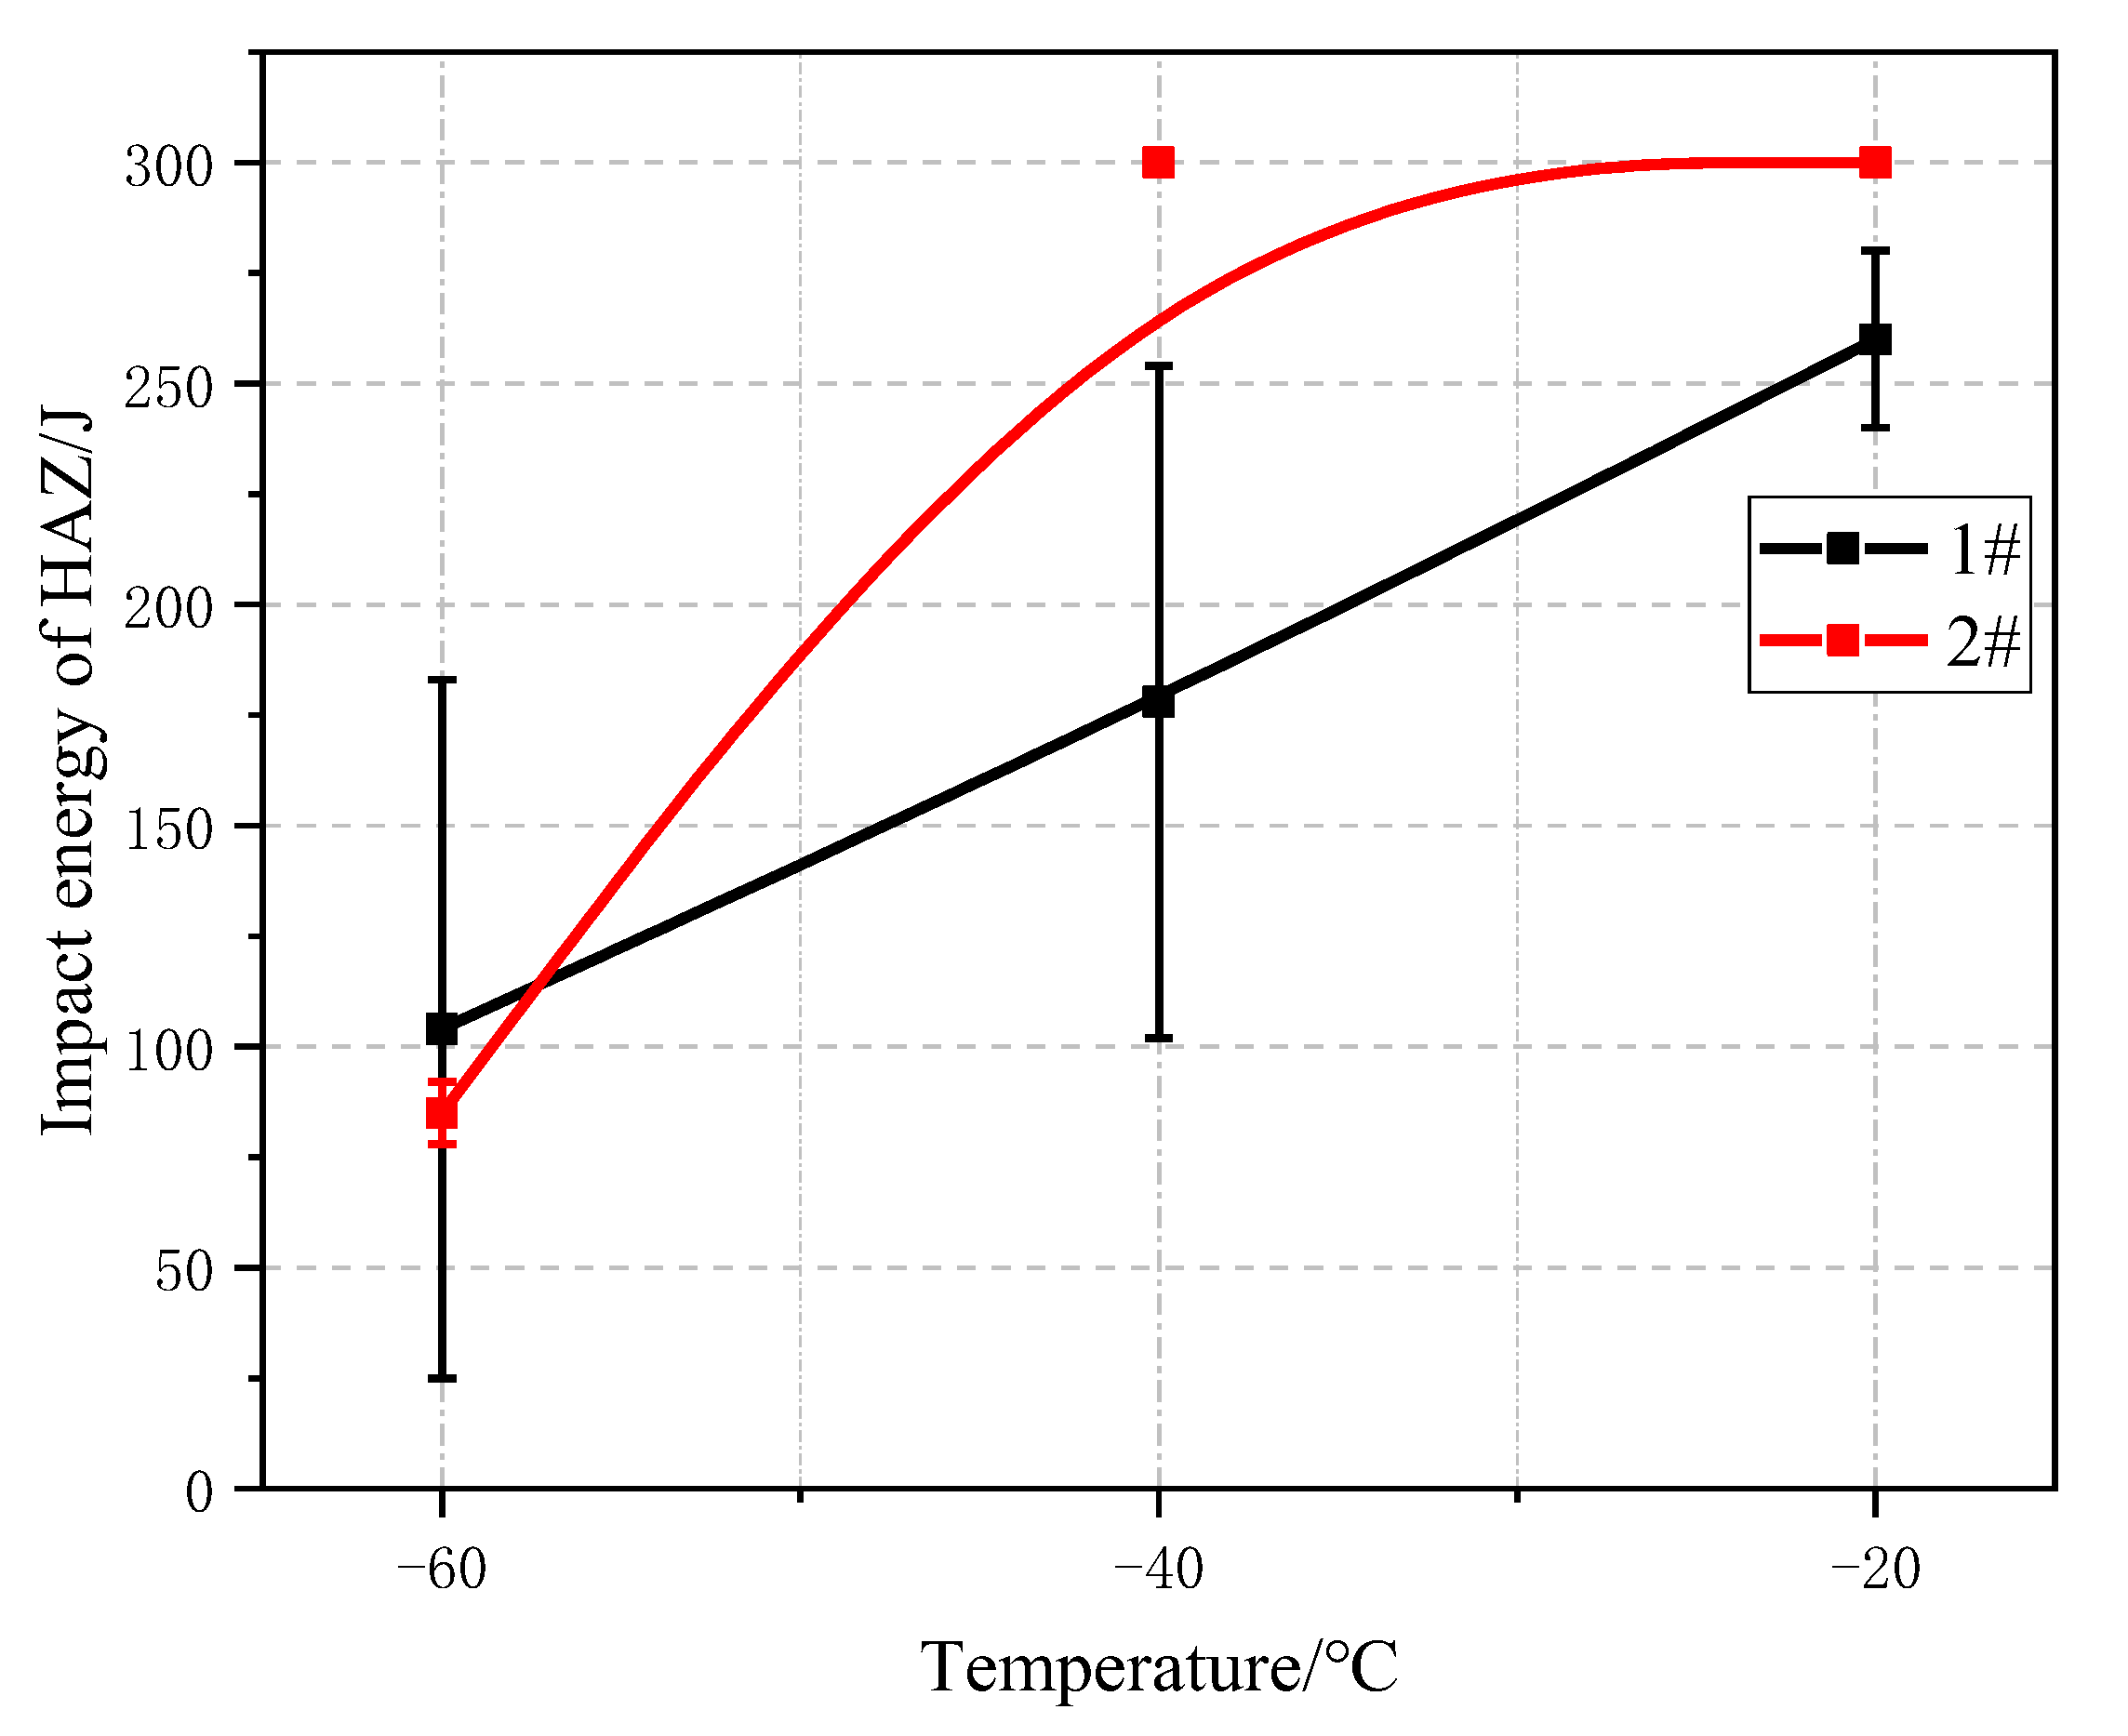
The results after the low-temperature impact test are shown in Figure 2. At −20 °C, the samples all showed good impact toughness, but the impact energy of sample 2# was slightly higher than that of sample 1#. At −40 °C, the impact energy of sample 2# is significantly higher than that of sample 1#. At −60 °C, the impact toughness of the two samples is almost the same. However, an interesting phenomenon is that under all test temperature conditions, the impact energy fluctuation of sample 1# is significantly higher than that of sample 2#, especially as the test temperature decreases and the impact energy fluctuation increases significantly.
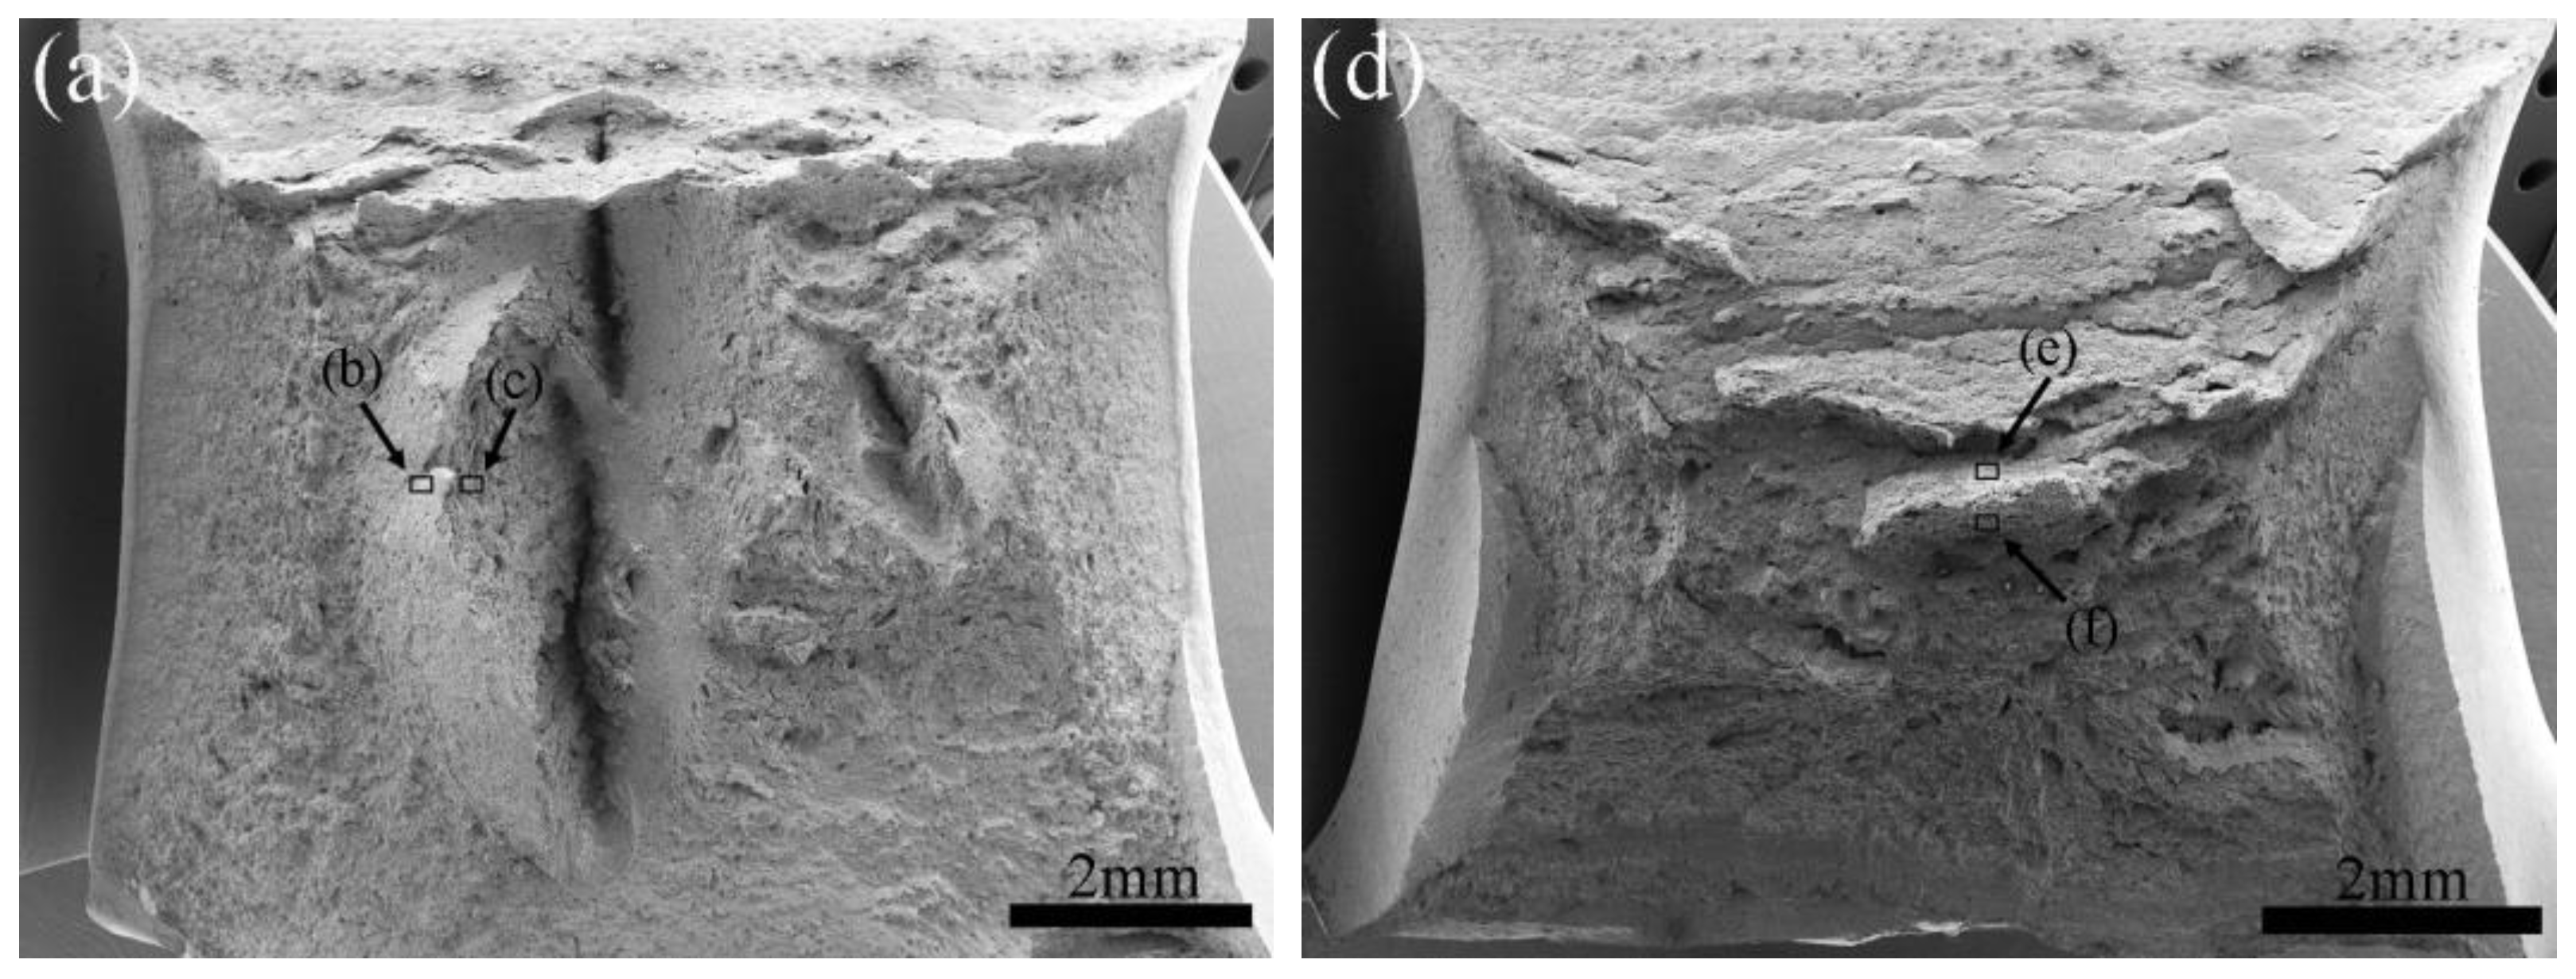
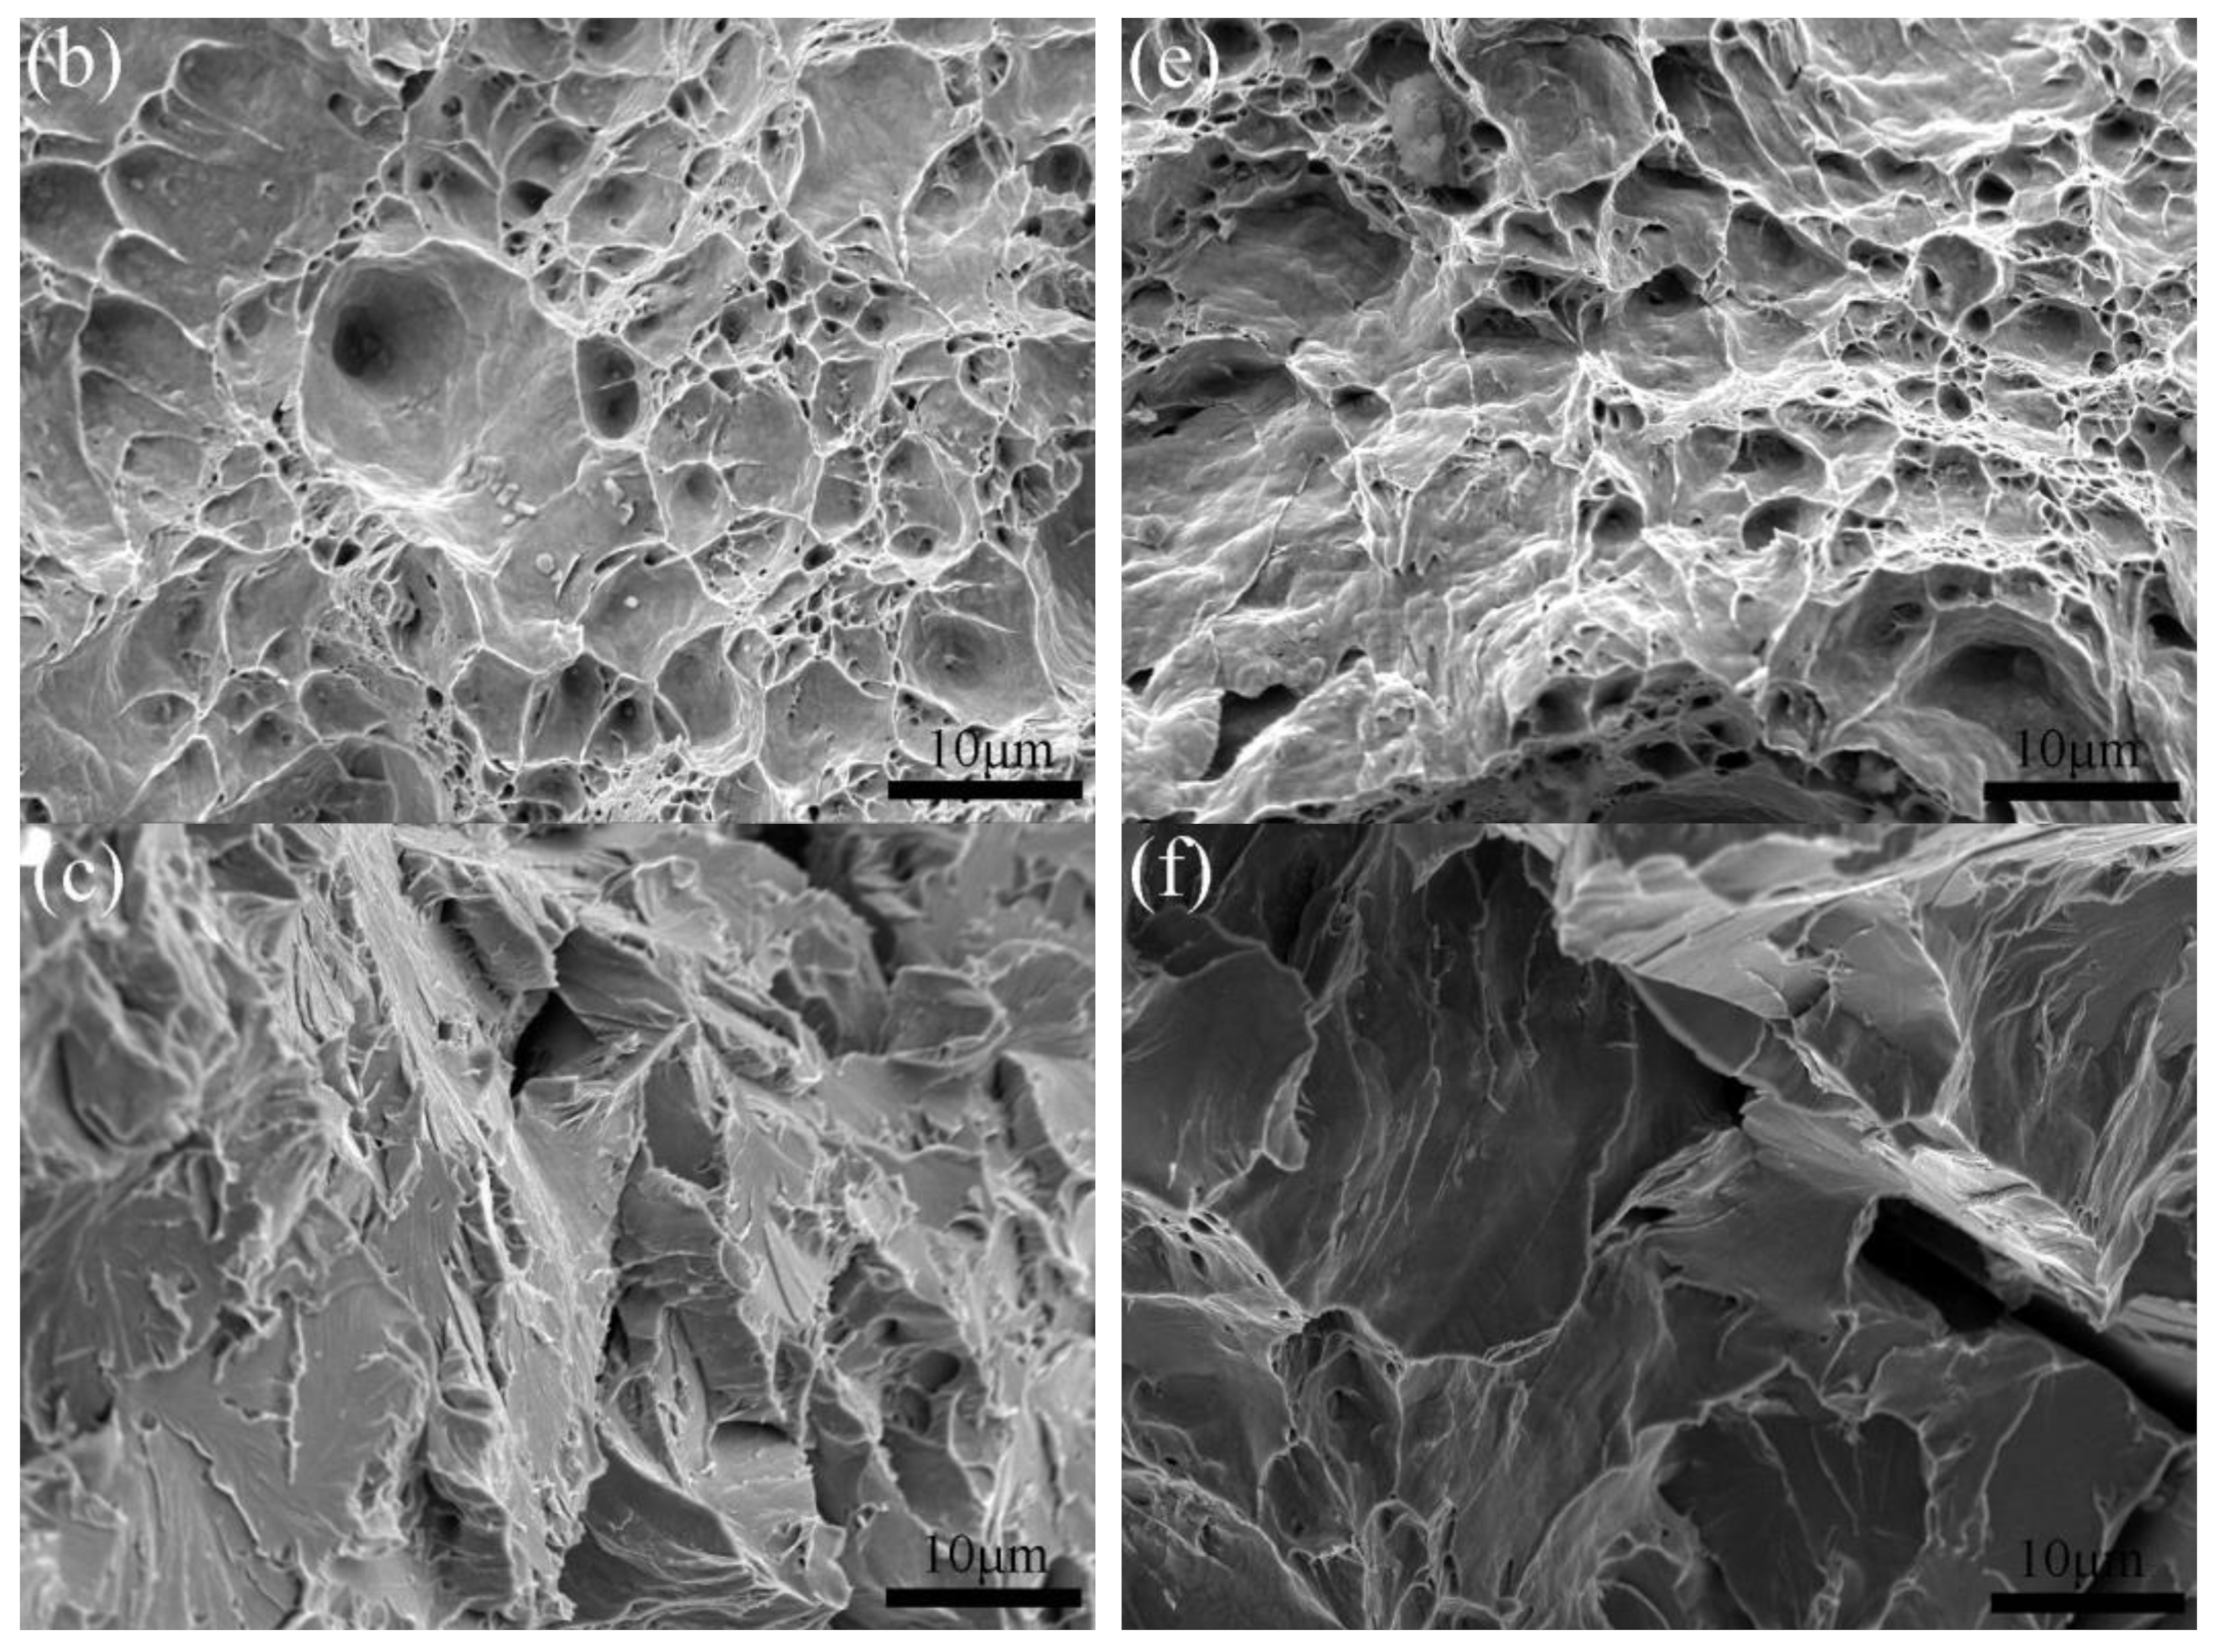
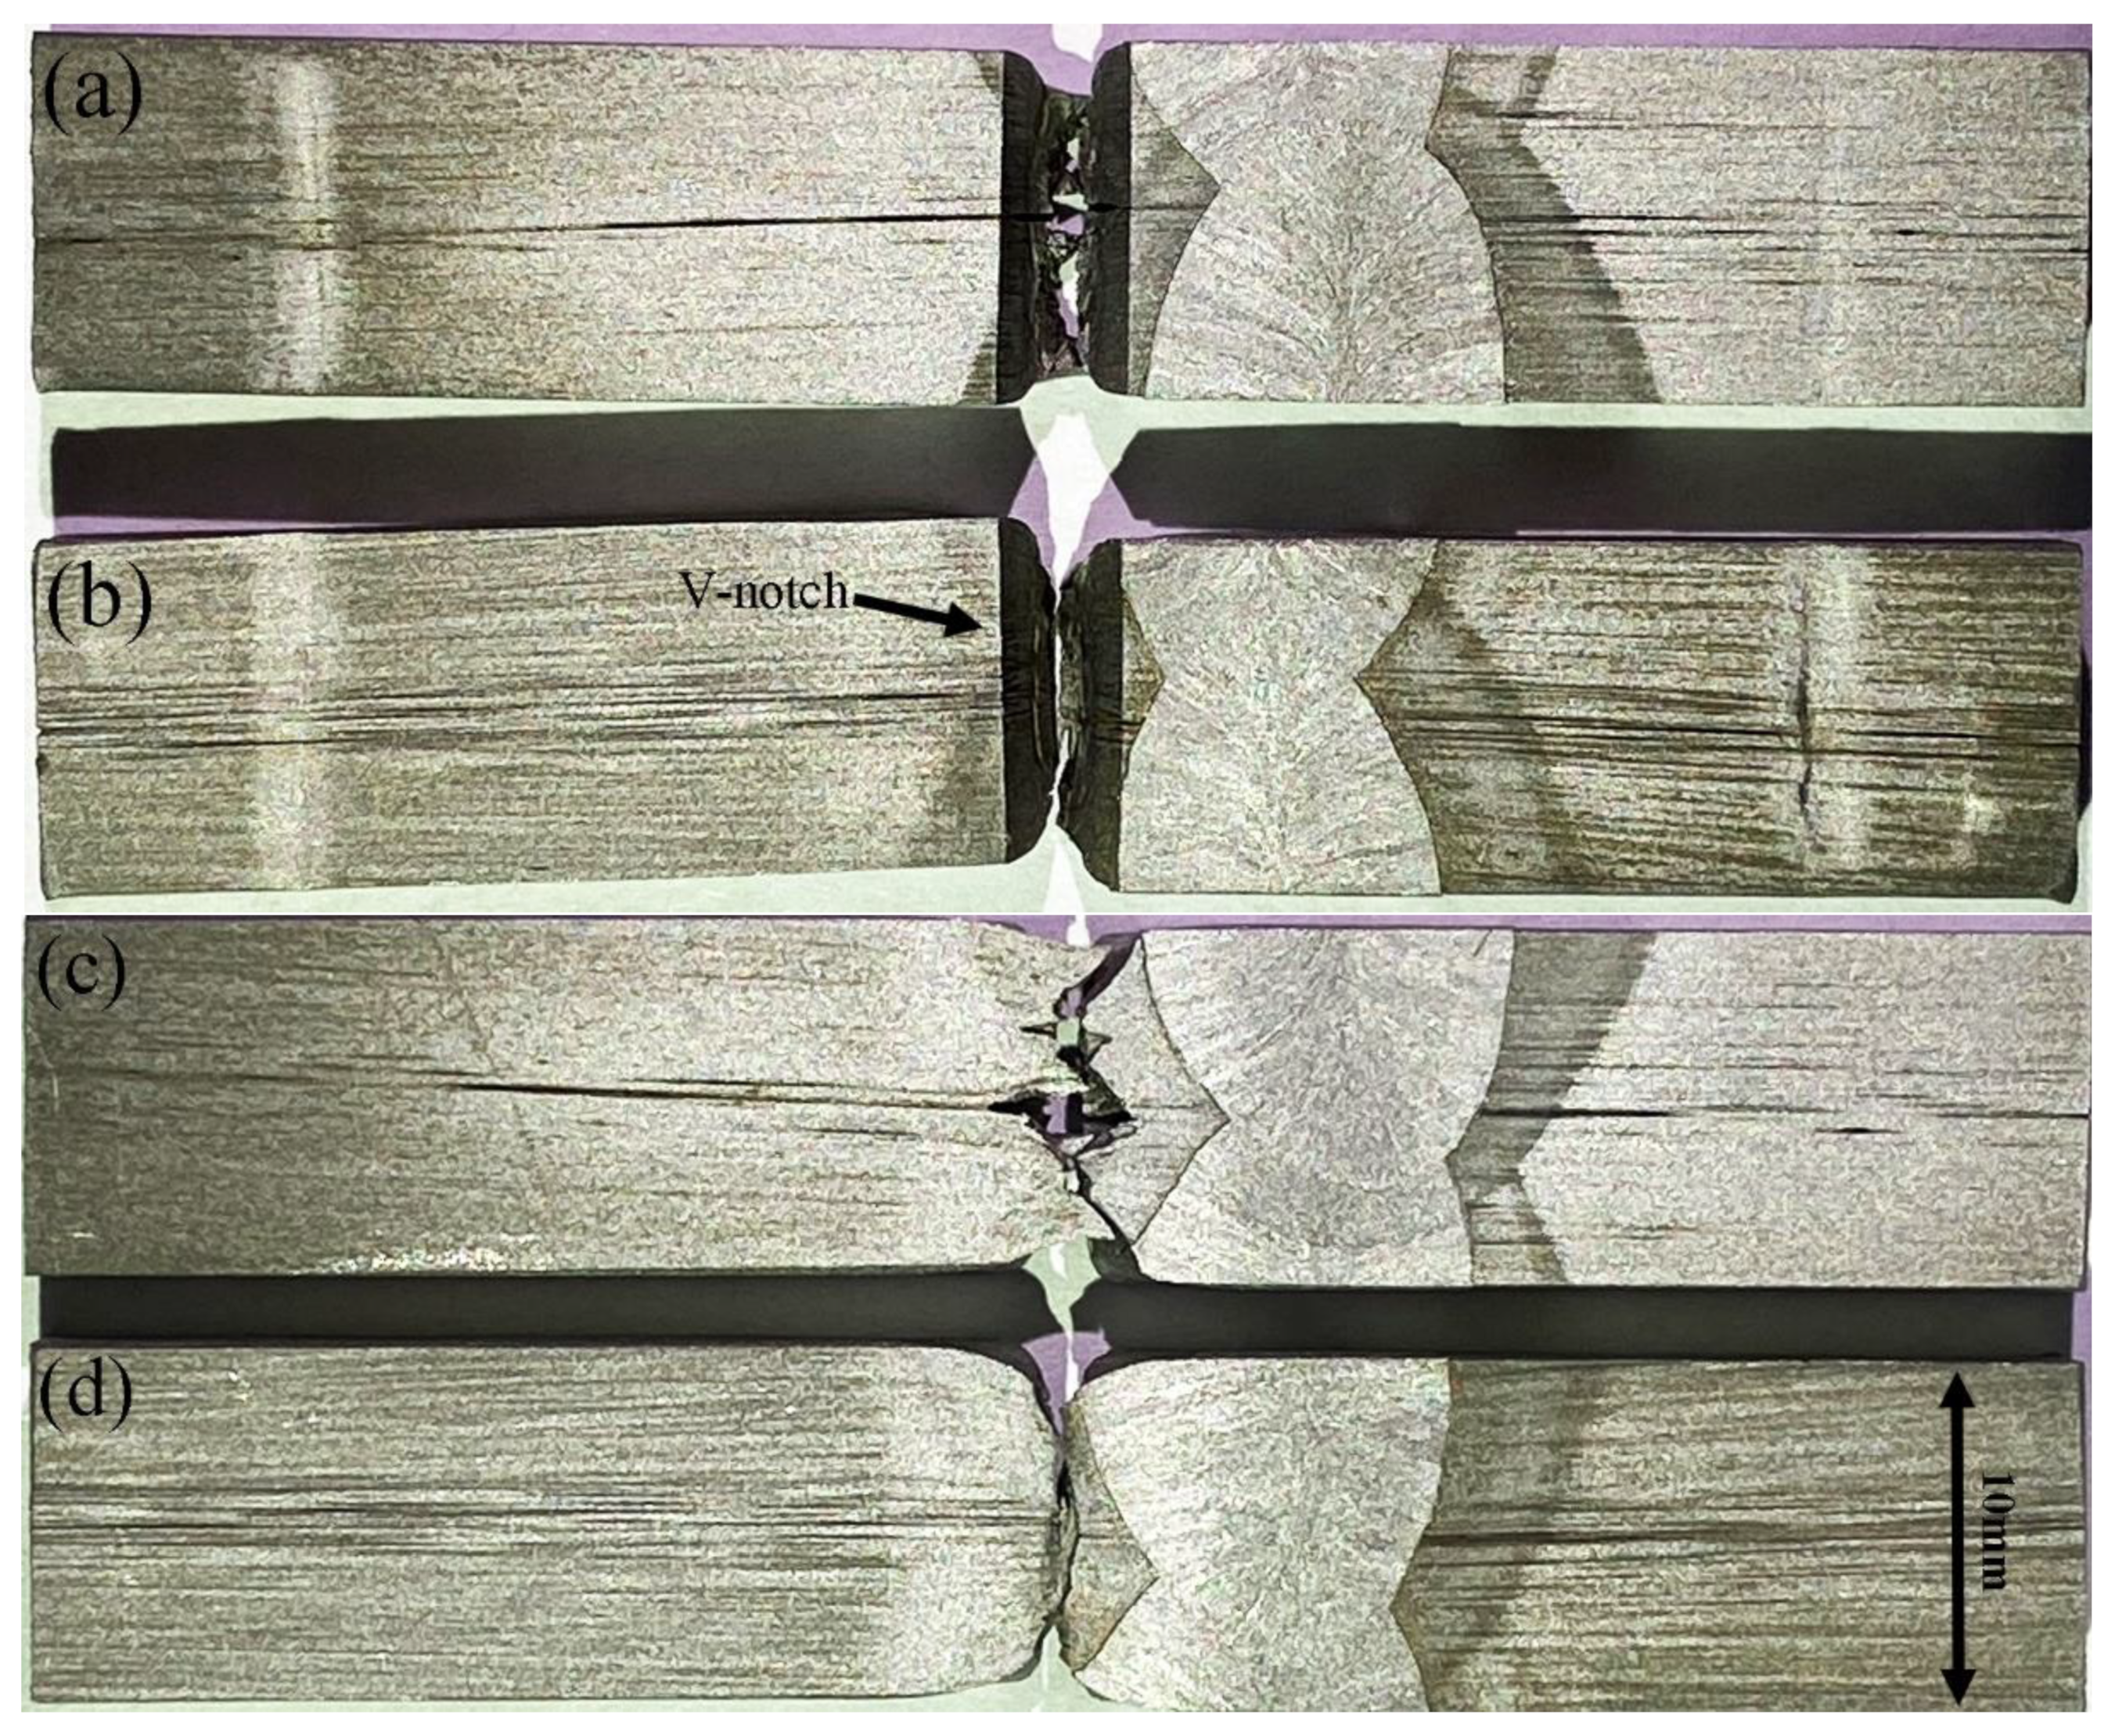
In the low-temperature impact specimens of sample 1# and sample 2#, almost all the impact specimens of sample 1# have delamination (Figure 3a), while all the impact specimens of sample 2# have no delamination. The fracture morphology of the impact specimens of sample 1# and sample 2# was analyzed. From the fracture of sample 1#, it was observed that the delamination was almost connected from the starting position to the opening position of the V-notch and ran through the whole fracture. The inclined plane adjacent to the crack in the middle depression was a cleavage fracture (Figure 3c), while the section marked by (b) was a ductile fracture (Figure 3b). The sample 2# is completely different. From the V-notch position to the (e) mark position, it is all ductile fracture (Figure 3e), while below the (f) mark position, it is all cleavage fracture (Figure 3f). This is the reason why the impact energy of sample 1# is lower than that of sample 2#, and the fluctuation of impact energy of sample 1# is much larger than that of sample 2#.

3.2. Microstructure of Centerline Segregated Area at HAZ

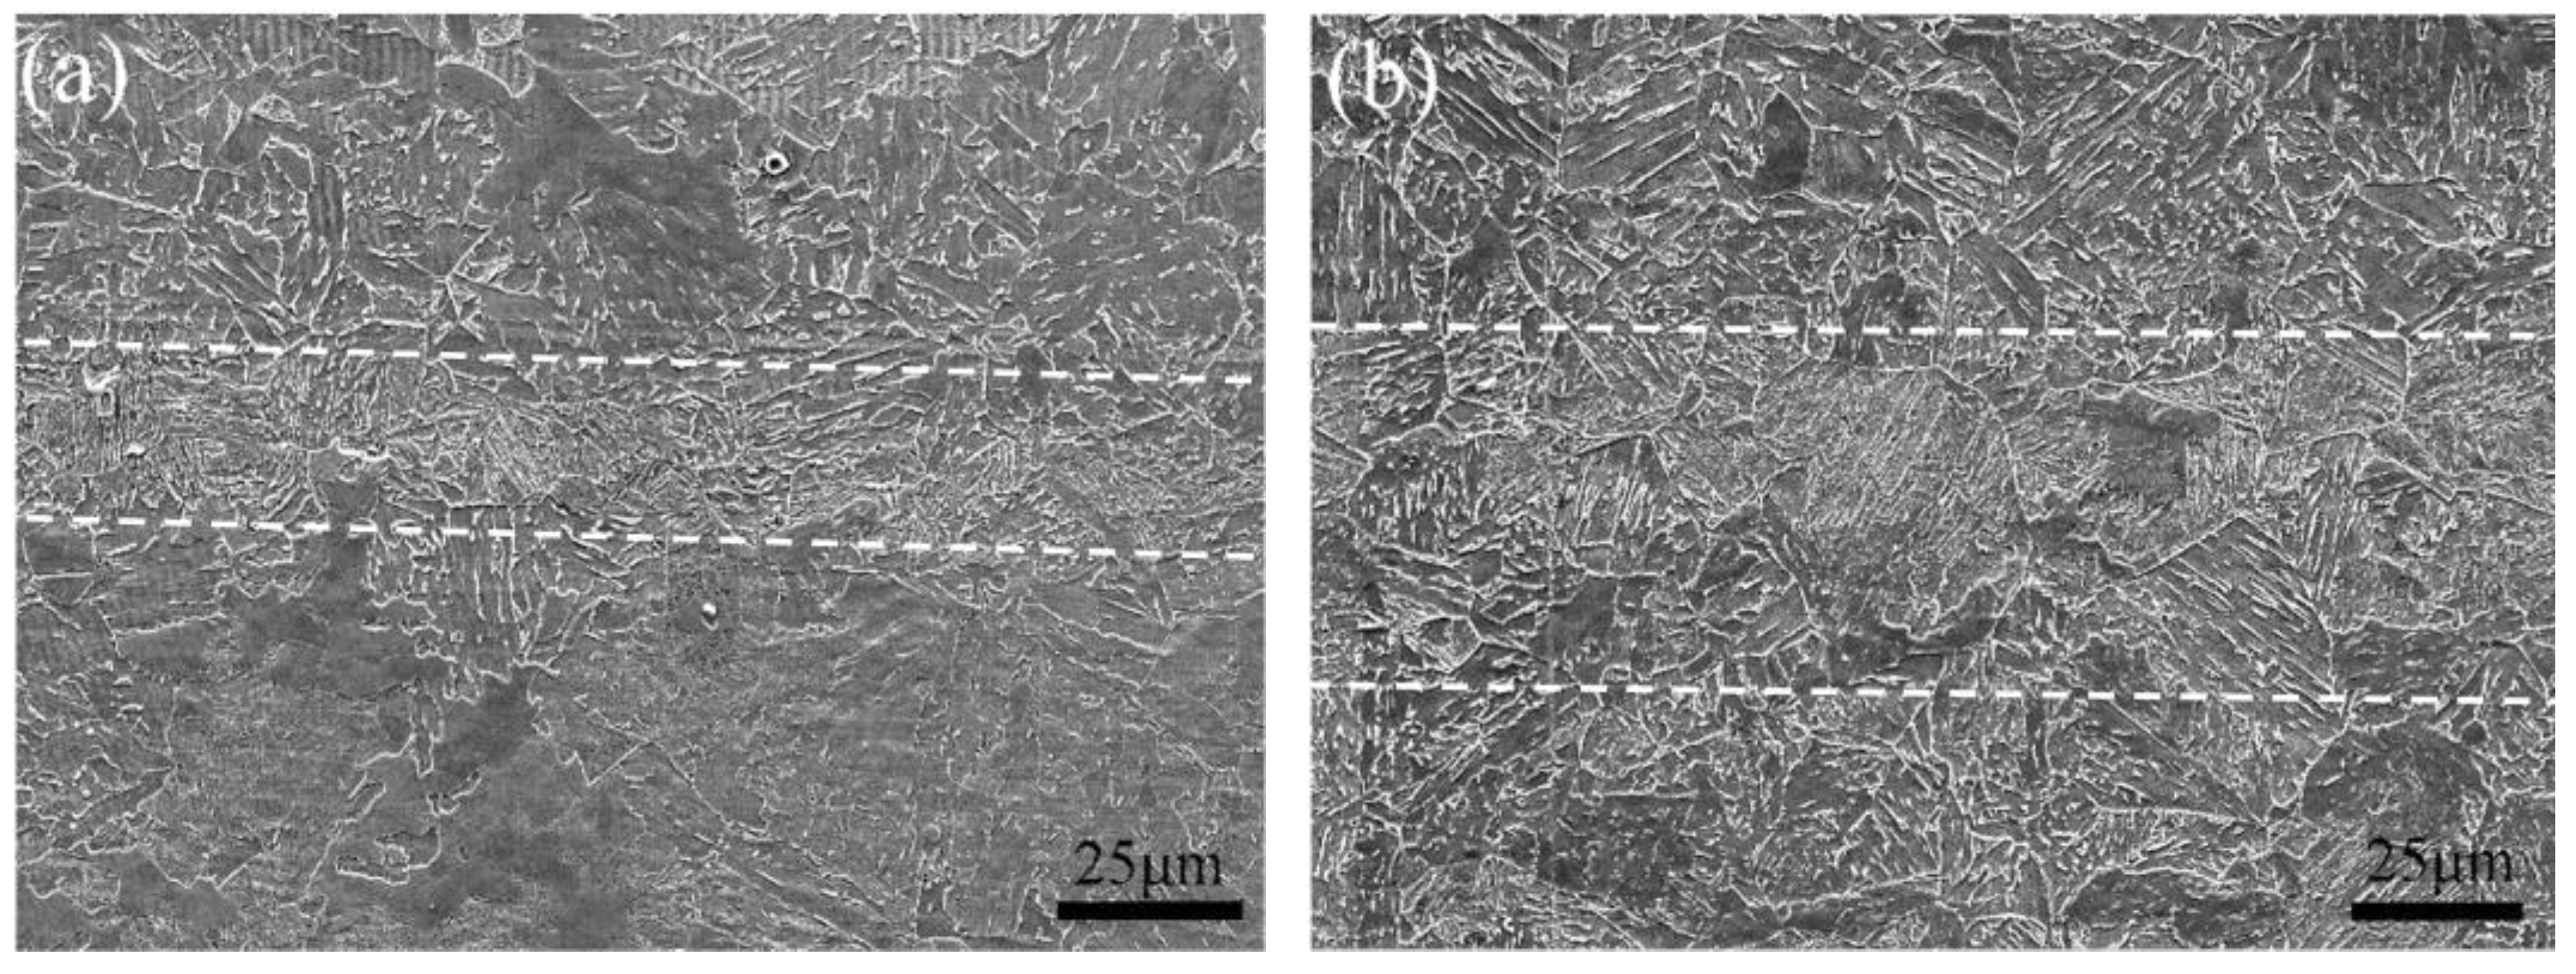
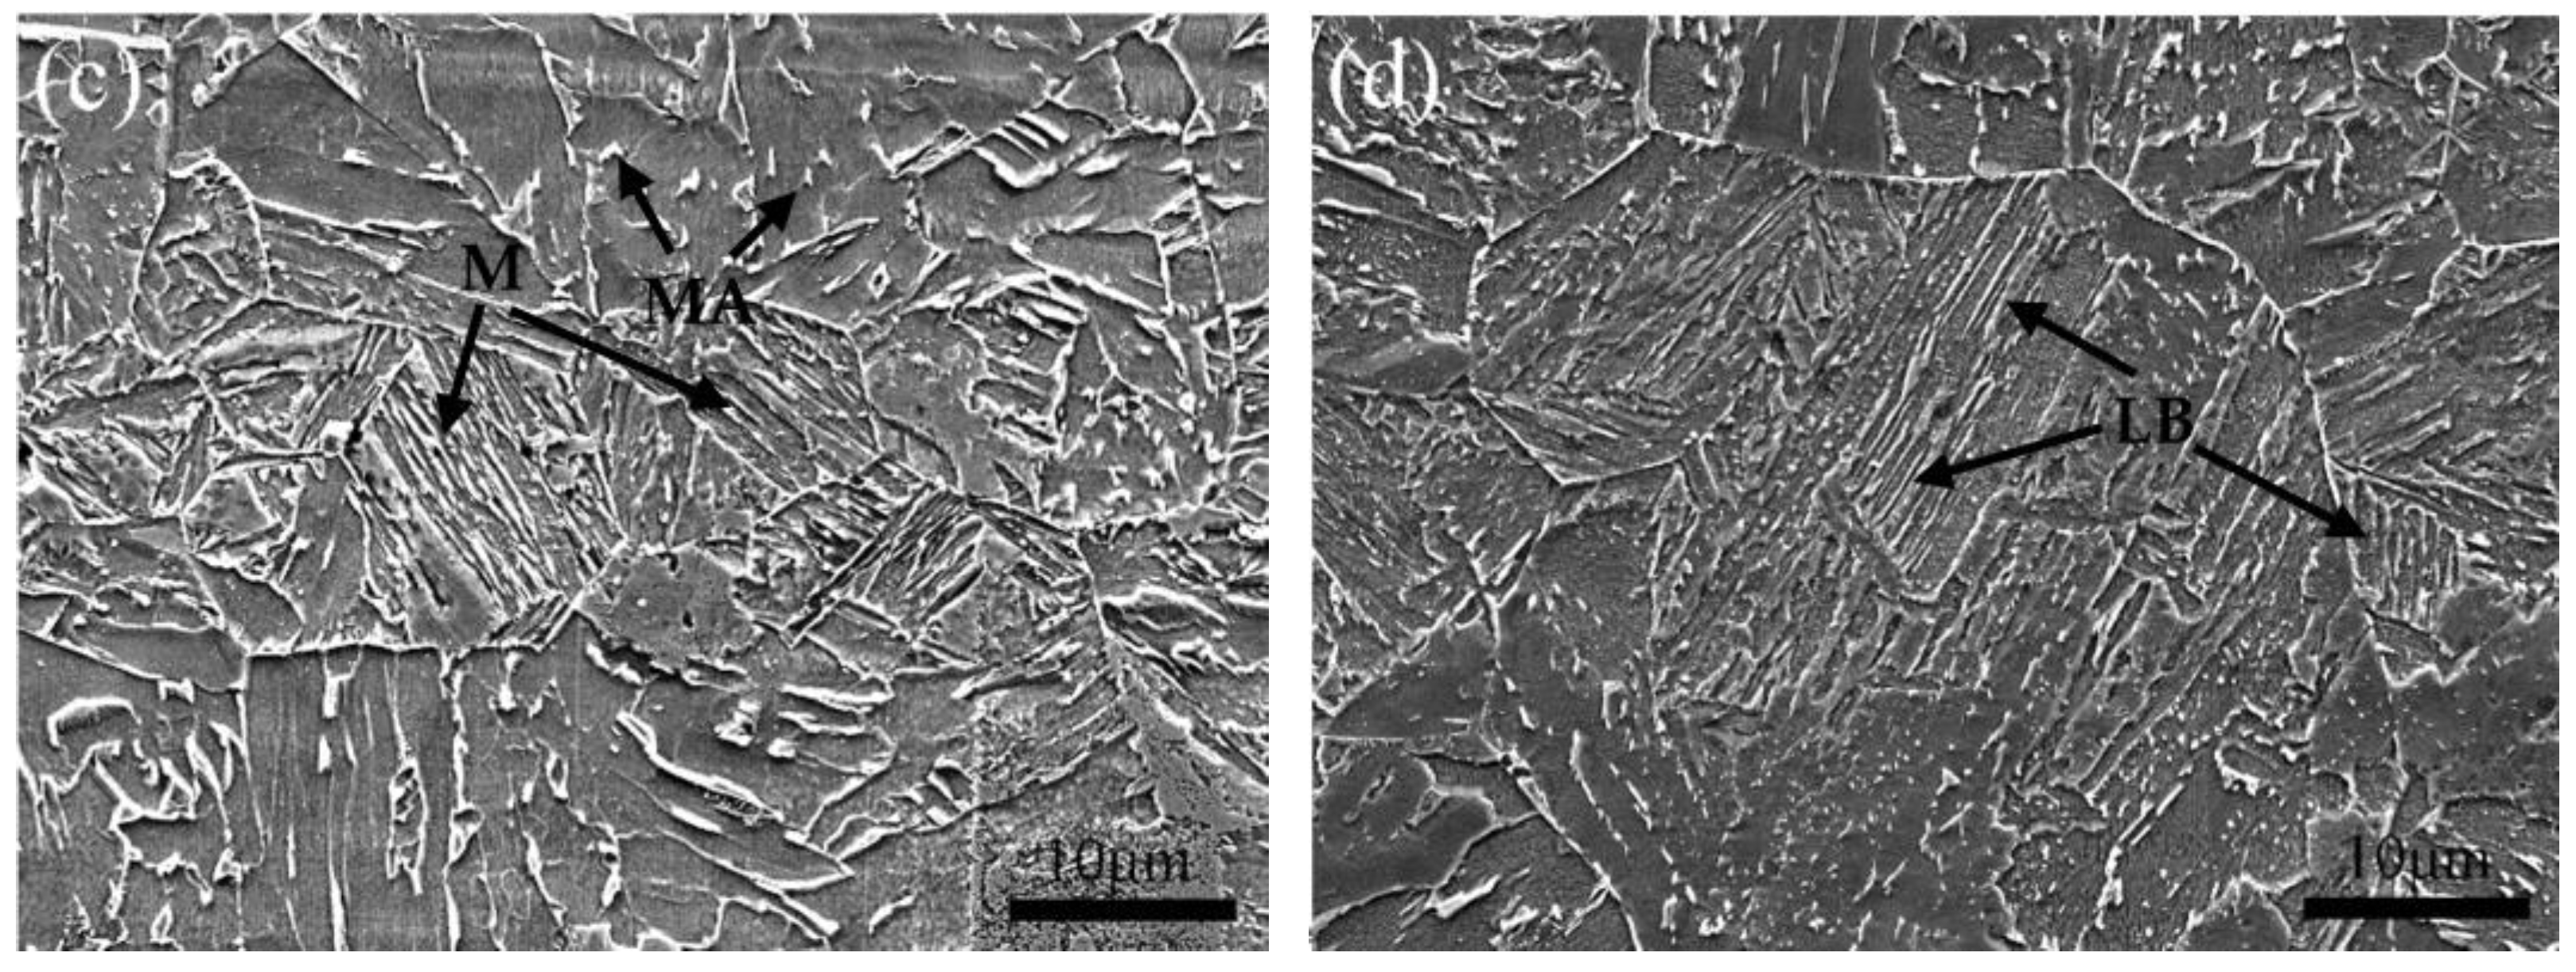
The microstructure is characterized at the centerline of plate thickness to the fusion line, and the SEM scanning results are shown in Figure 4. The microstructure uniformity of sample 1# and sample 2# is significantly different, and the microstructure uniformity of sample 2# is better. There is almost no difference between the microstructure of the 2# segregation zone and the surrounding BM, which is lath bainite (LB). The microstructure uniformity of sample 1# is poor, and the grains in the segregation zone are much smaller than the surrounding BM. The grain size in the segregation zone of sample 1# is abnormally small due to the high segregation content.
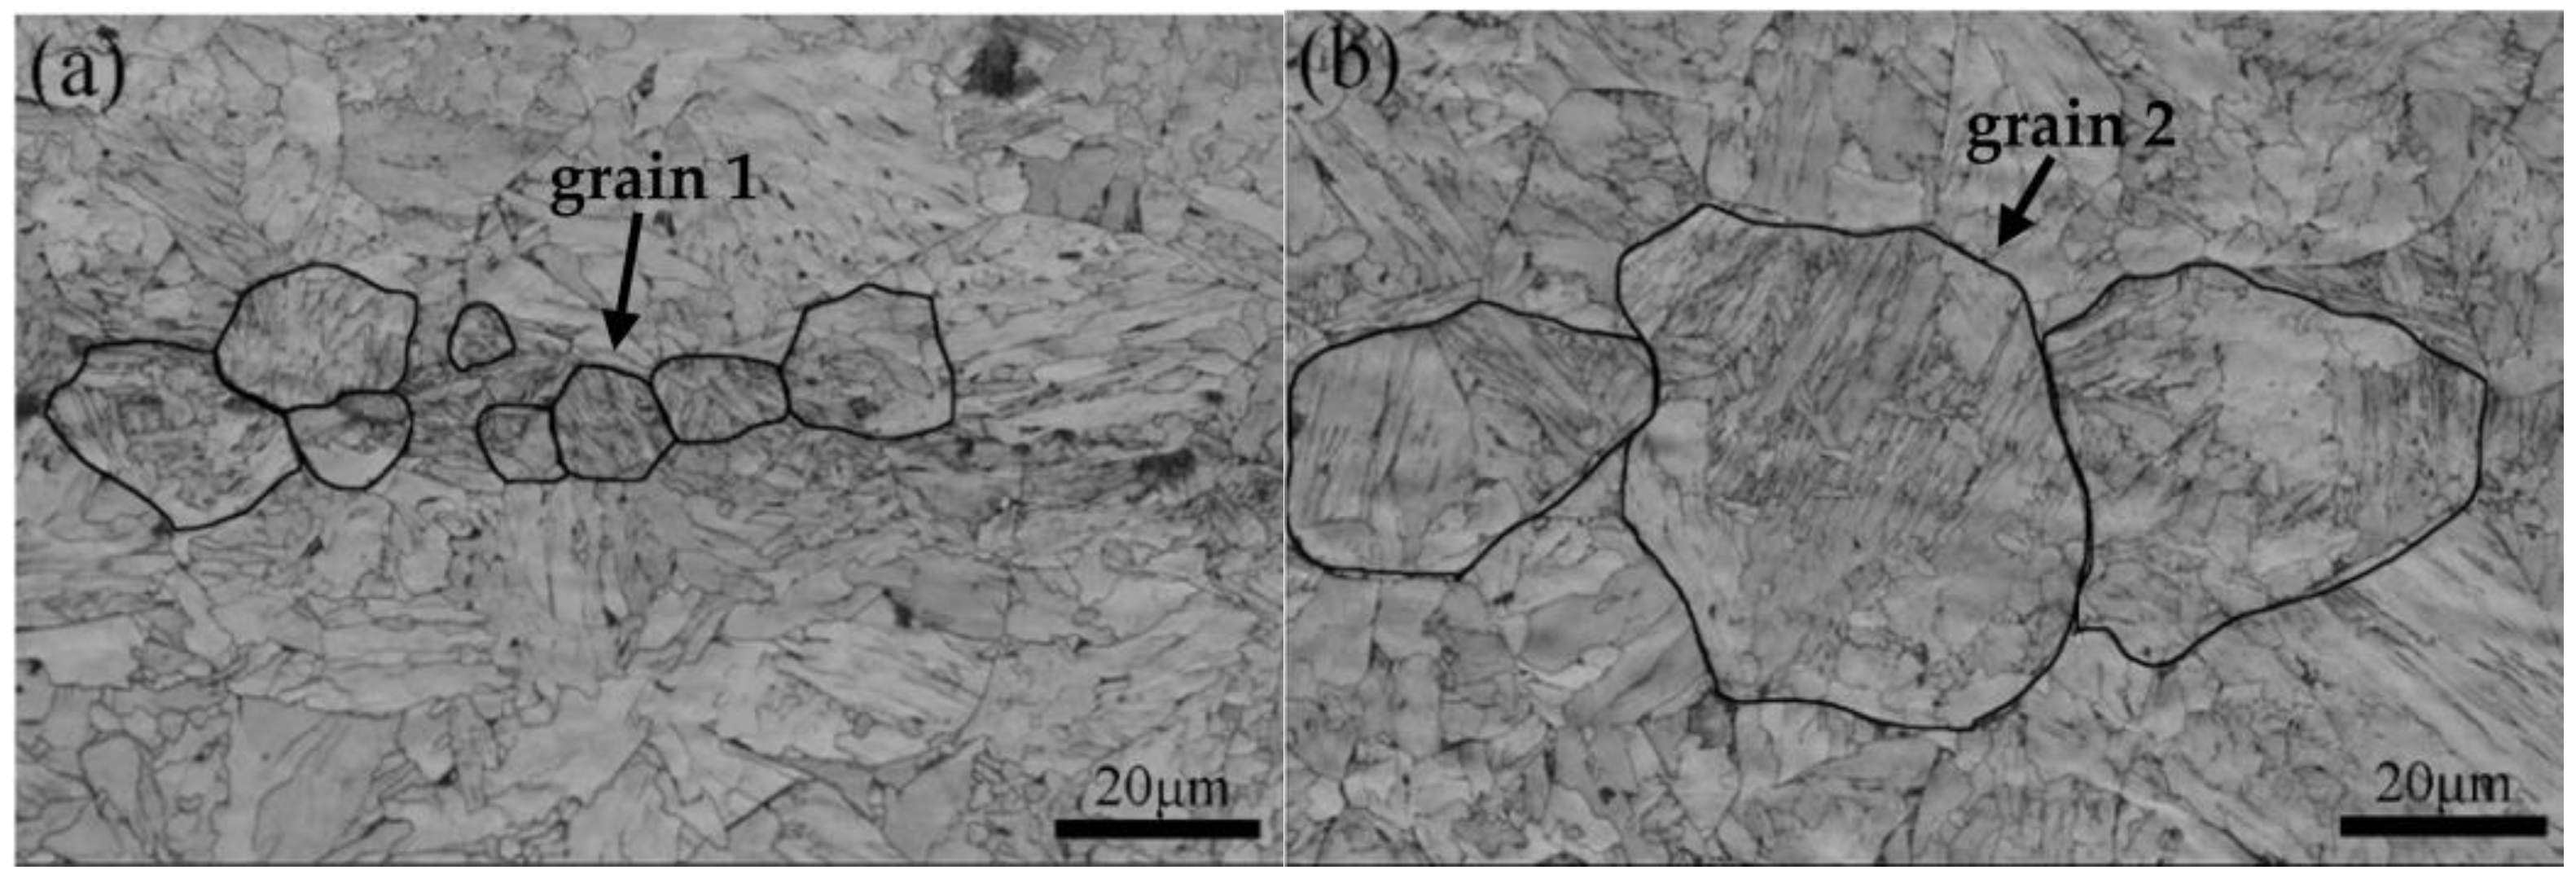
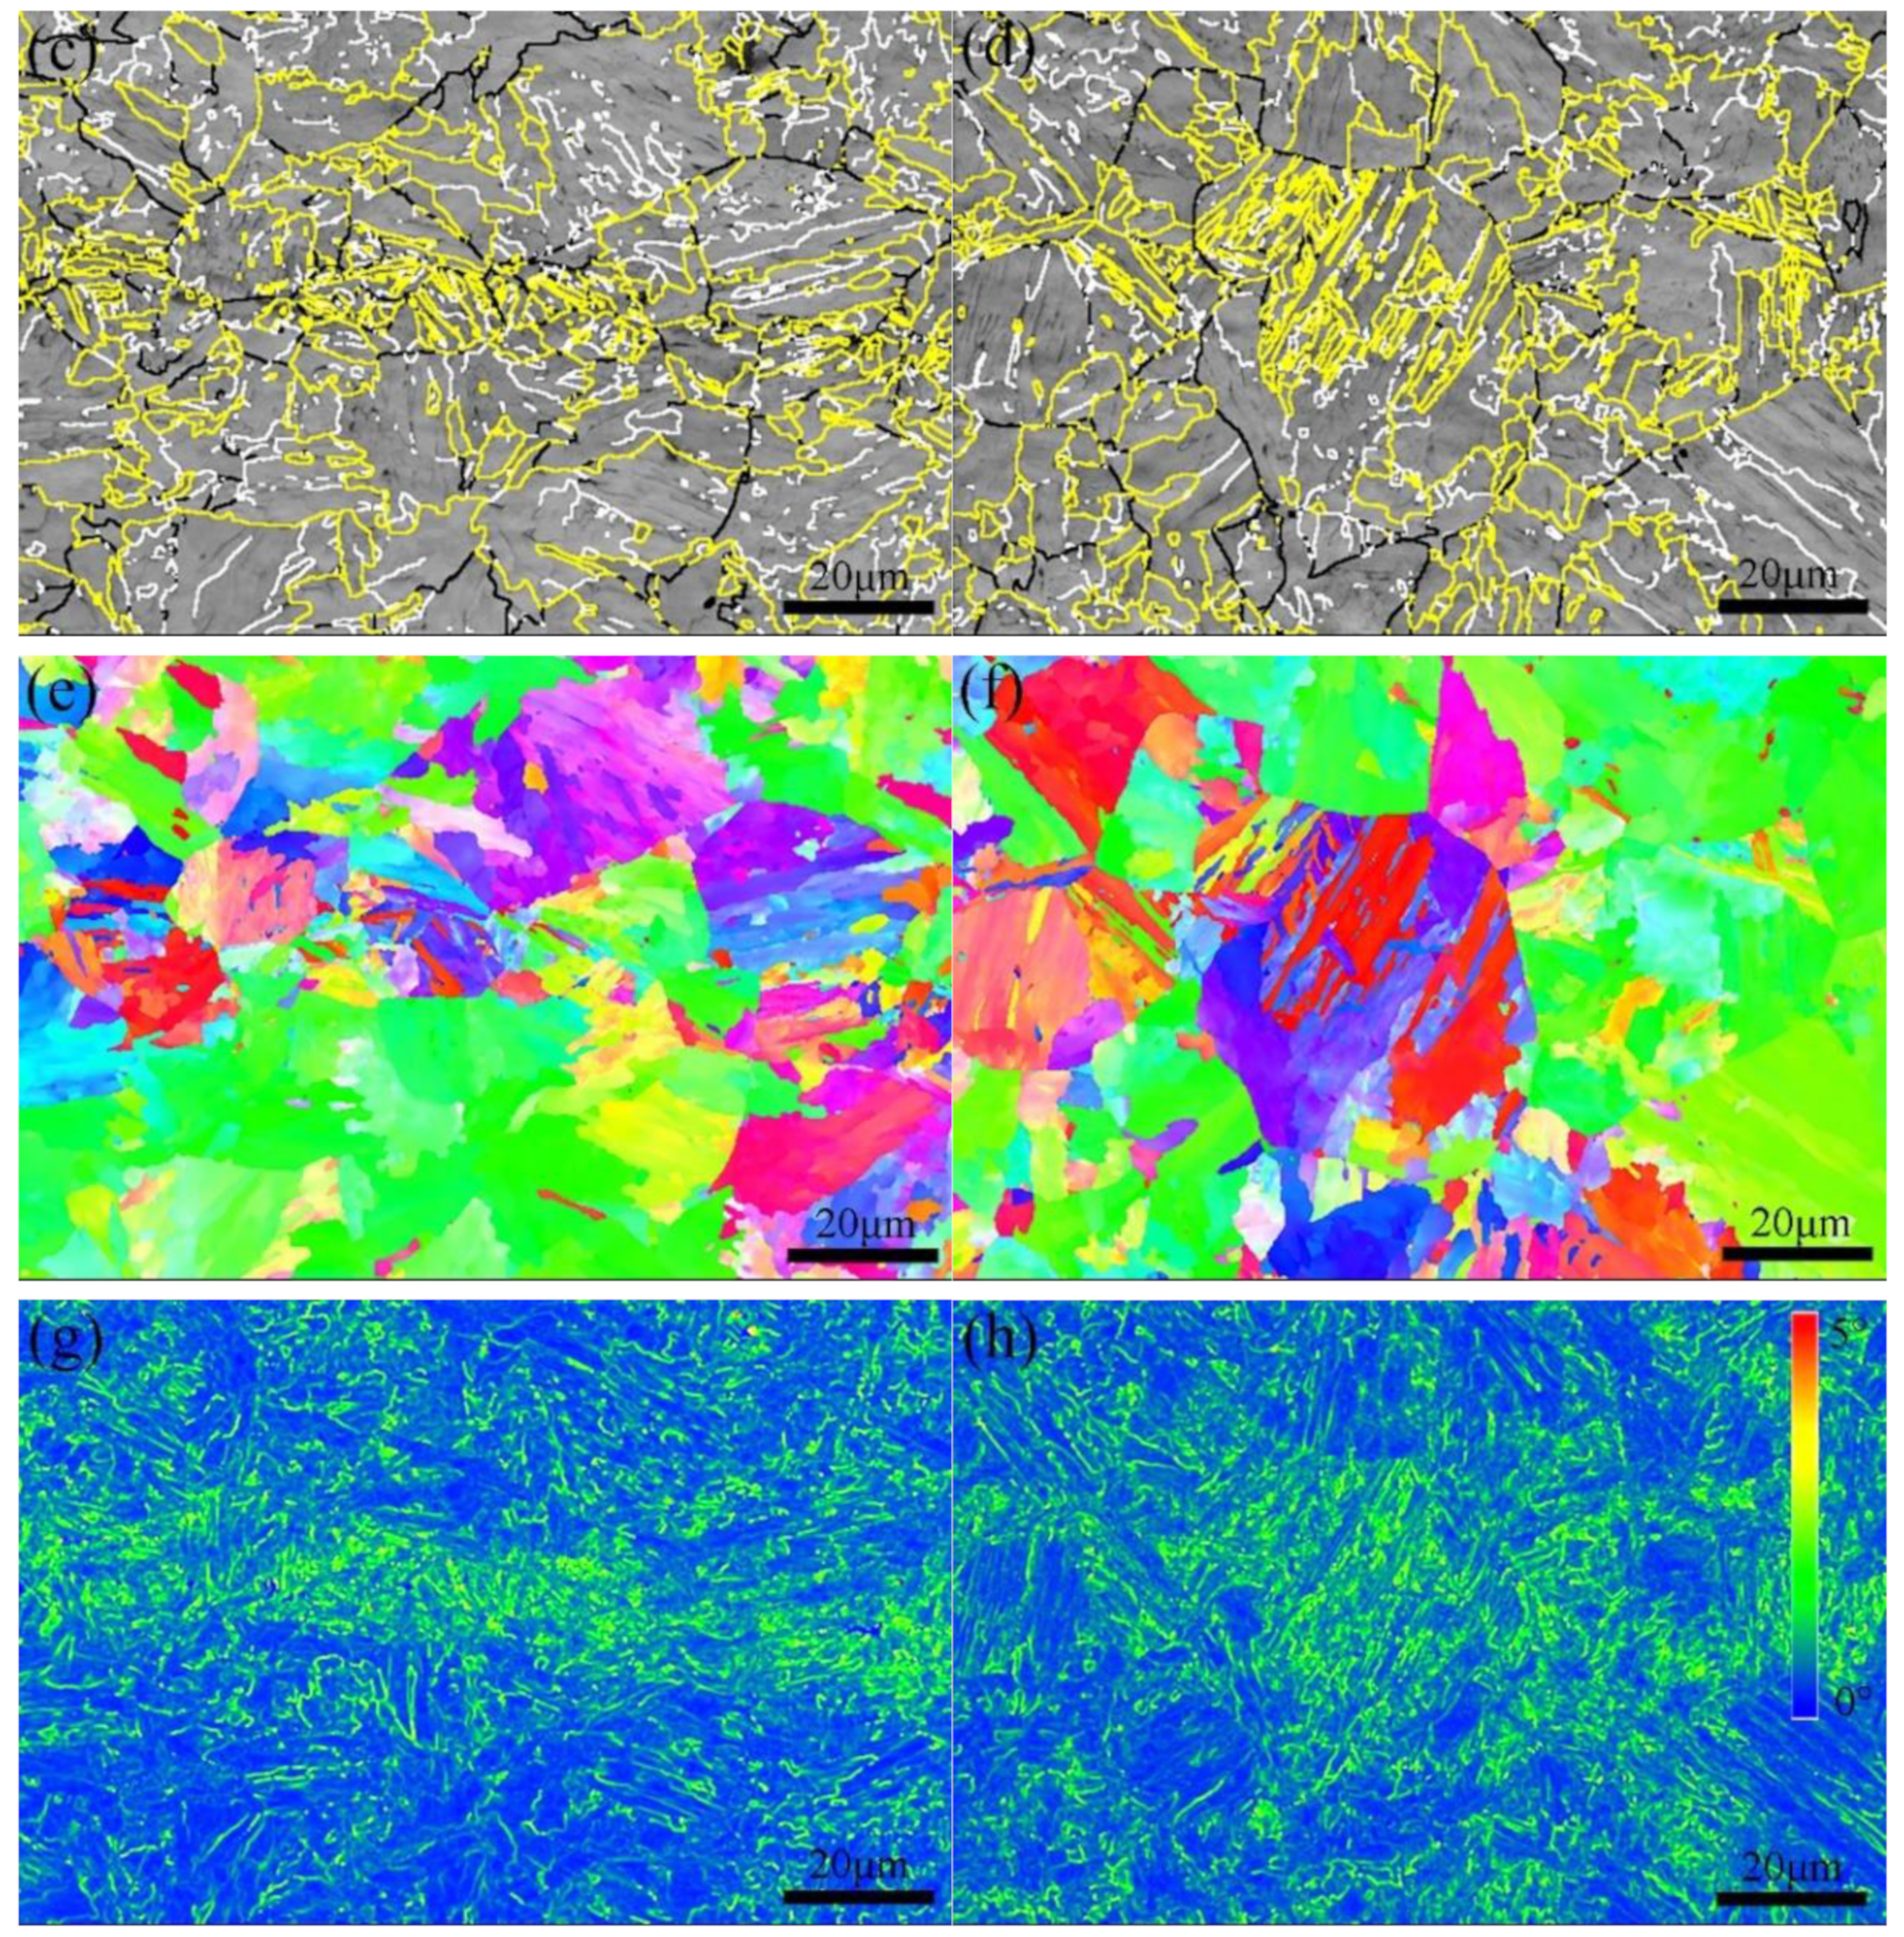
The above microstructure is further characterized by EBSD, and the BC diagram (Figure 5a,b) can better present the interface between microstructures, especially the interface between grain boundaries and variants. Through the regression of the original austenite, it is found that the original austenite size on the segregation zone of sample 1# is small, which is quite different from the original austenite size of the surrounding BM microstructure. The original austenite size on the segregation zone of sample 2# is almost the same as that of the surrounding BM. In order to more clearly characterize the morphology of the variant and the original austenite, the grain boundaries with different orientations are outlined by different color lines (Figure 5c,d). The white line represents the interface with an orientation difference of 5–15°, the black line represents the interface with an orientation difference of 15–45°, and the yellow line represents the interface with an orientation difference of more than 45°. It can be seen from the grain boundary distribution that the high-angle grain boundary has a higher distribution density in the segregation zone. The high-angle grain boundary is the interface between specific variants. The density of high-angle grain boundaries at the segregation zone is higher, especially in sample 1# with more serious segregation, which indicates that the microstructure at the segregation zone appears to be a variant selection. The high-angle grain boundaries are more concentrated in the packet arrangement position and less distributed in the block position. From the IPF (Inverse pole figure) (Figure 5e,f), it can be seen that the orientation of the microstructure at the segregation zone is significantly different from that of the surrounding BM. The KAM (Kernel average misorientation) diagram (Figure 5g,h) is an image presented according to the orientation of each point on the microstructure. The larger the orientation difference is, the larger the deviation angle is, indicating that the stress distribution is more concentrated. The segregation zone of sample 1# is narrow, and the stress distribution in the segregation zone is significantly different from that in the BM microstructure. The stress distribution in the segregation zone of sample 2# is less different from that in the BM microstructure, which is due to the wide segregation zone and the low content of segregation elements.
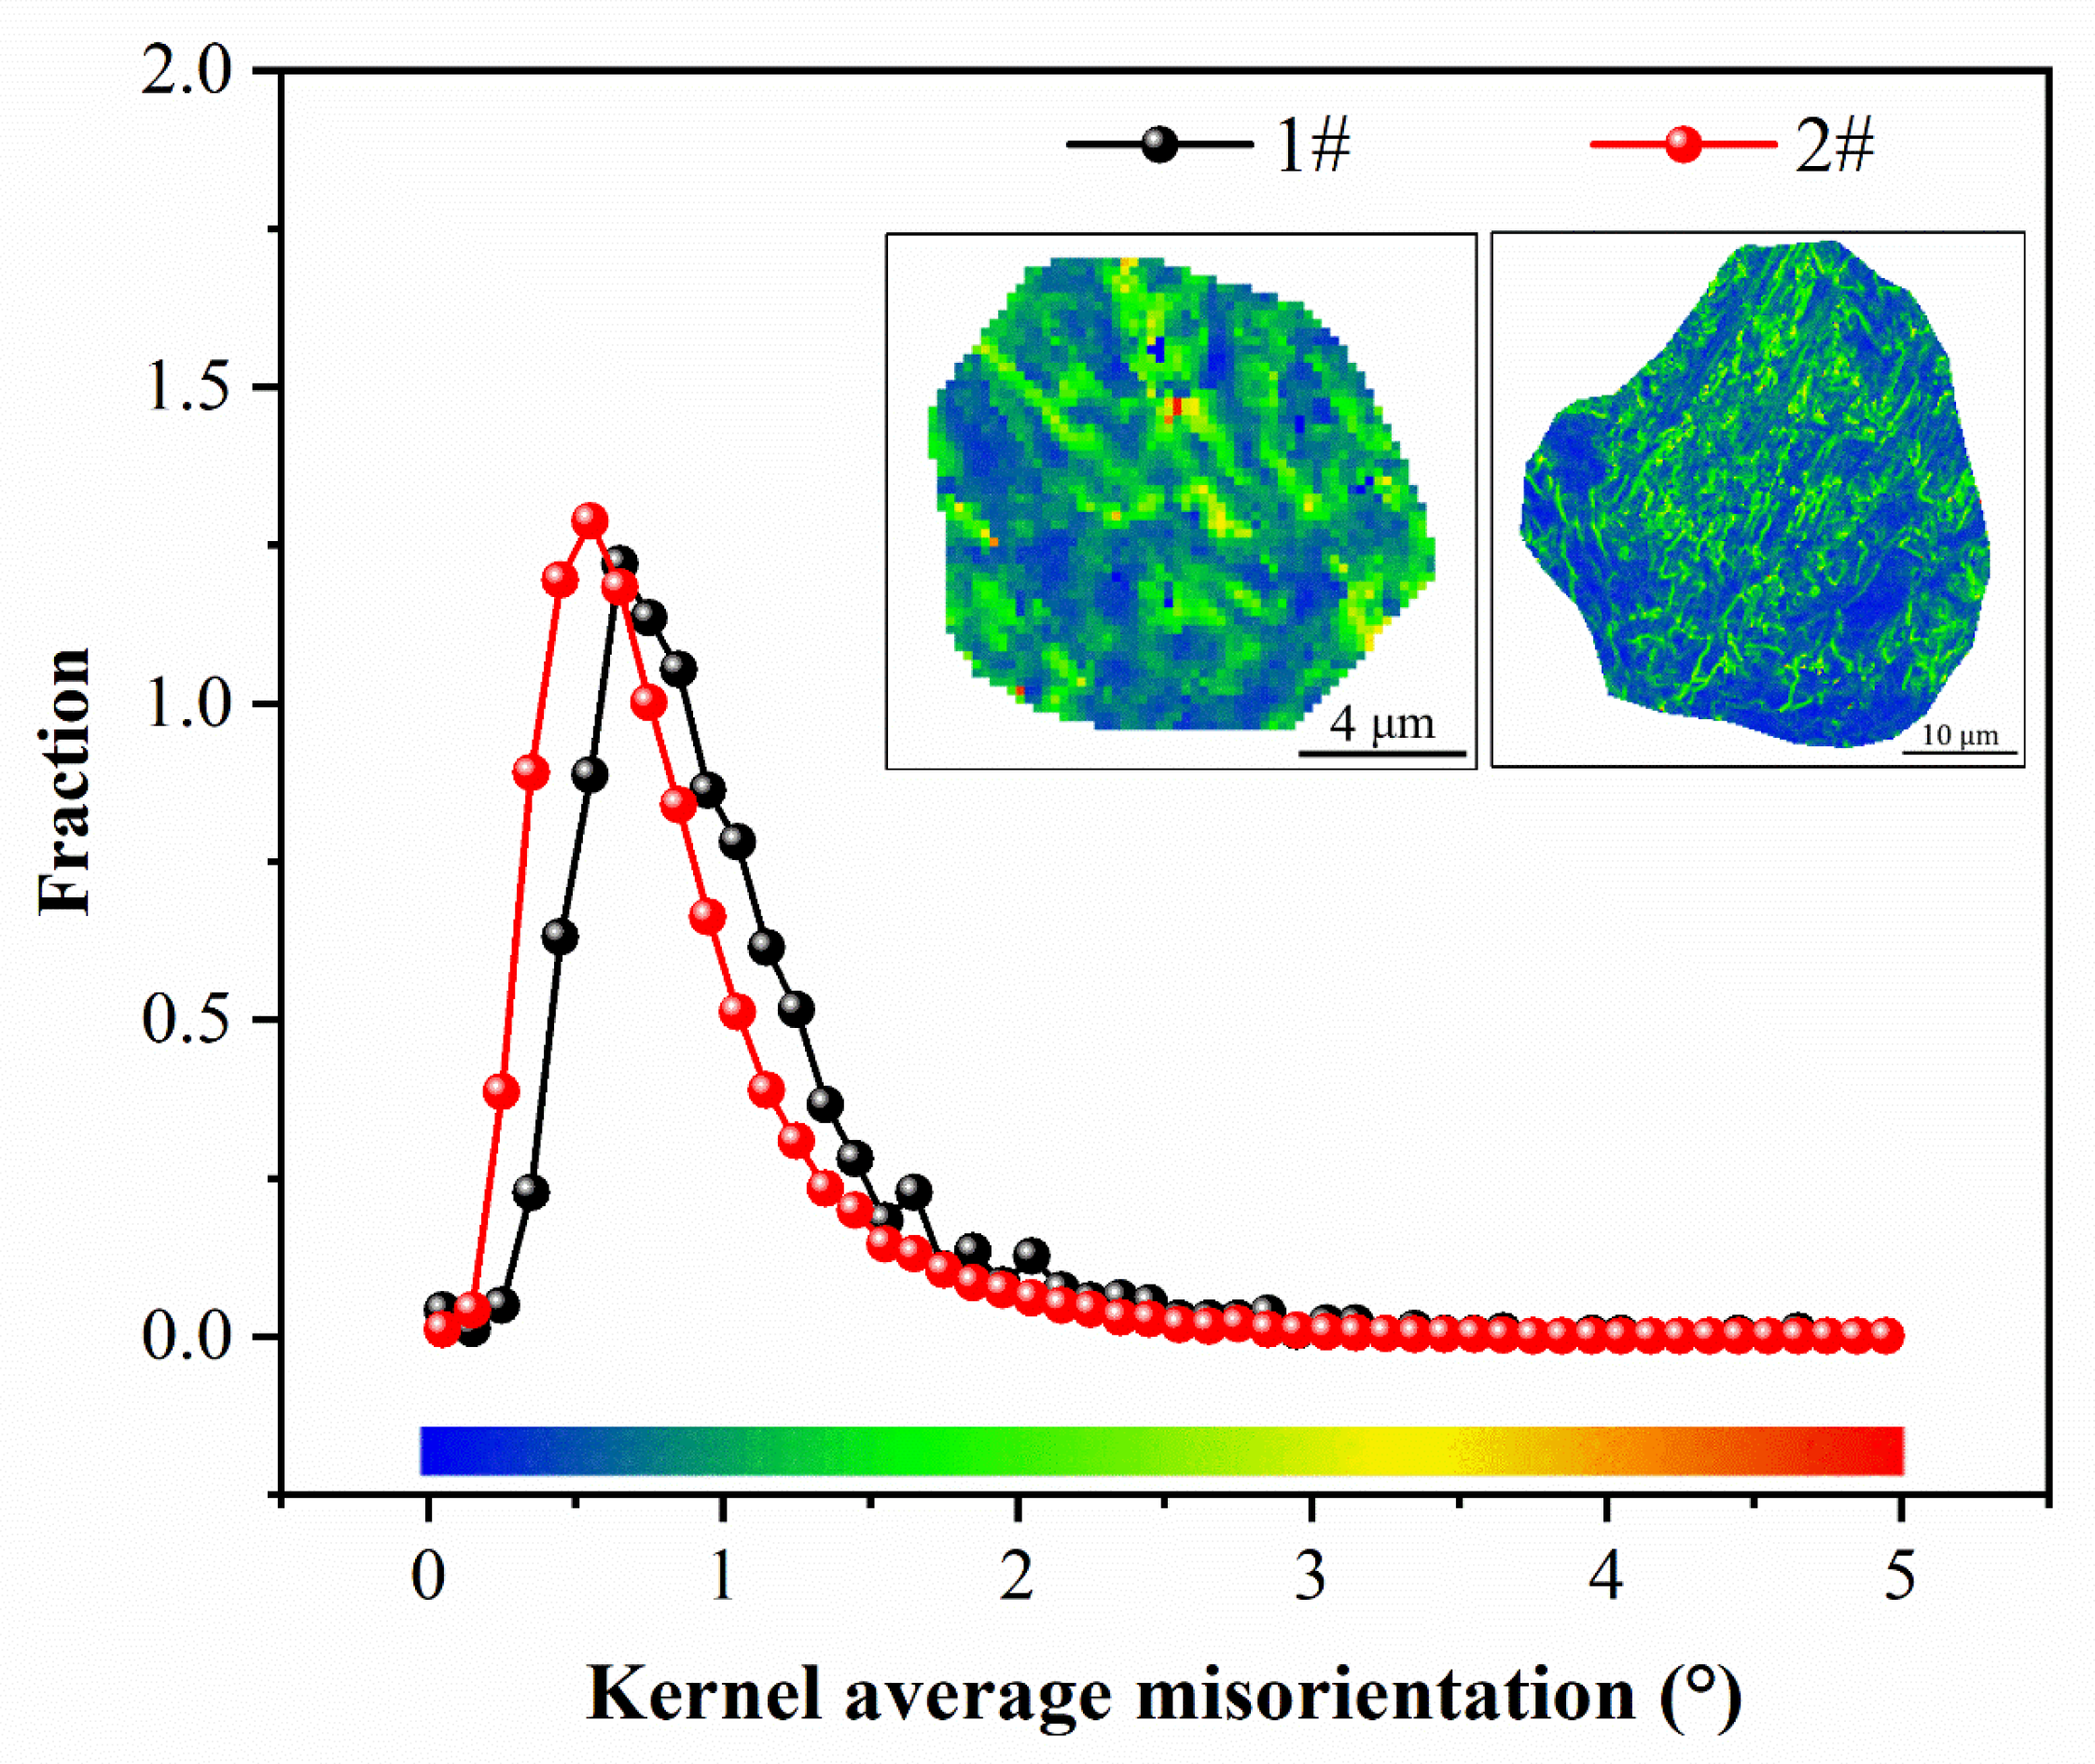
The grains 1# and 2# (Figure 5a,b) in the HAZ segregation area were selected to compare the detailed stress distribution of a single grain, as shown in Figure 6. Yellow and red represent stress concentration due to high KAM value, and KAM maps show that the highest value is in the location of martensite/bainite. Furthermore, the stress distribution of martensite in the segregation area is higher than that in bainite.

3.3. HAZ Segregation Distribution

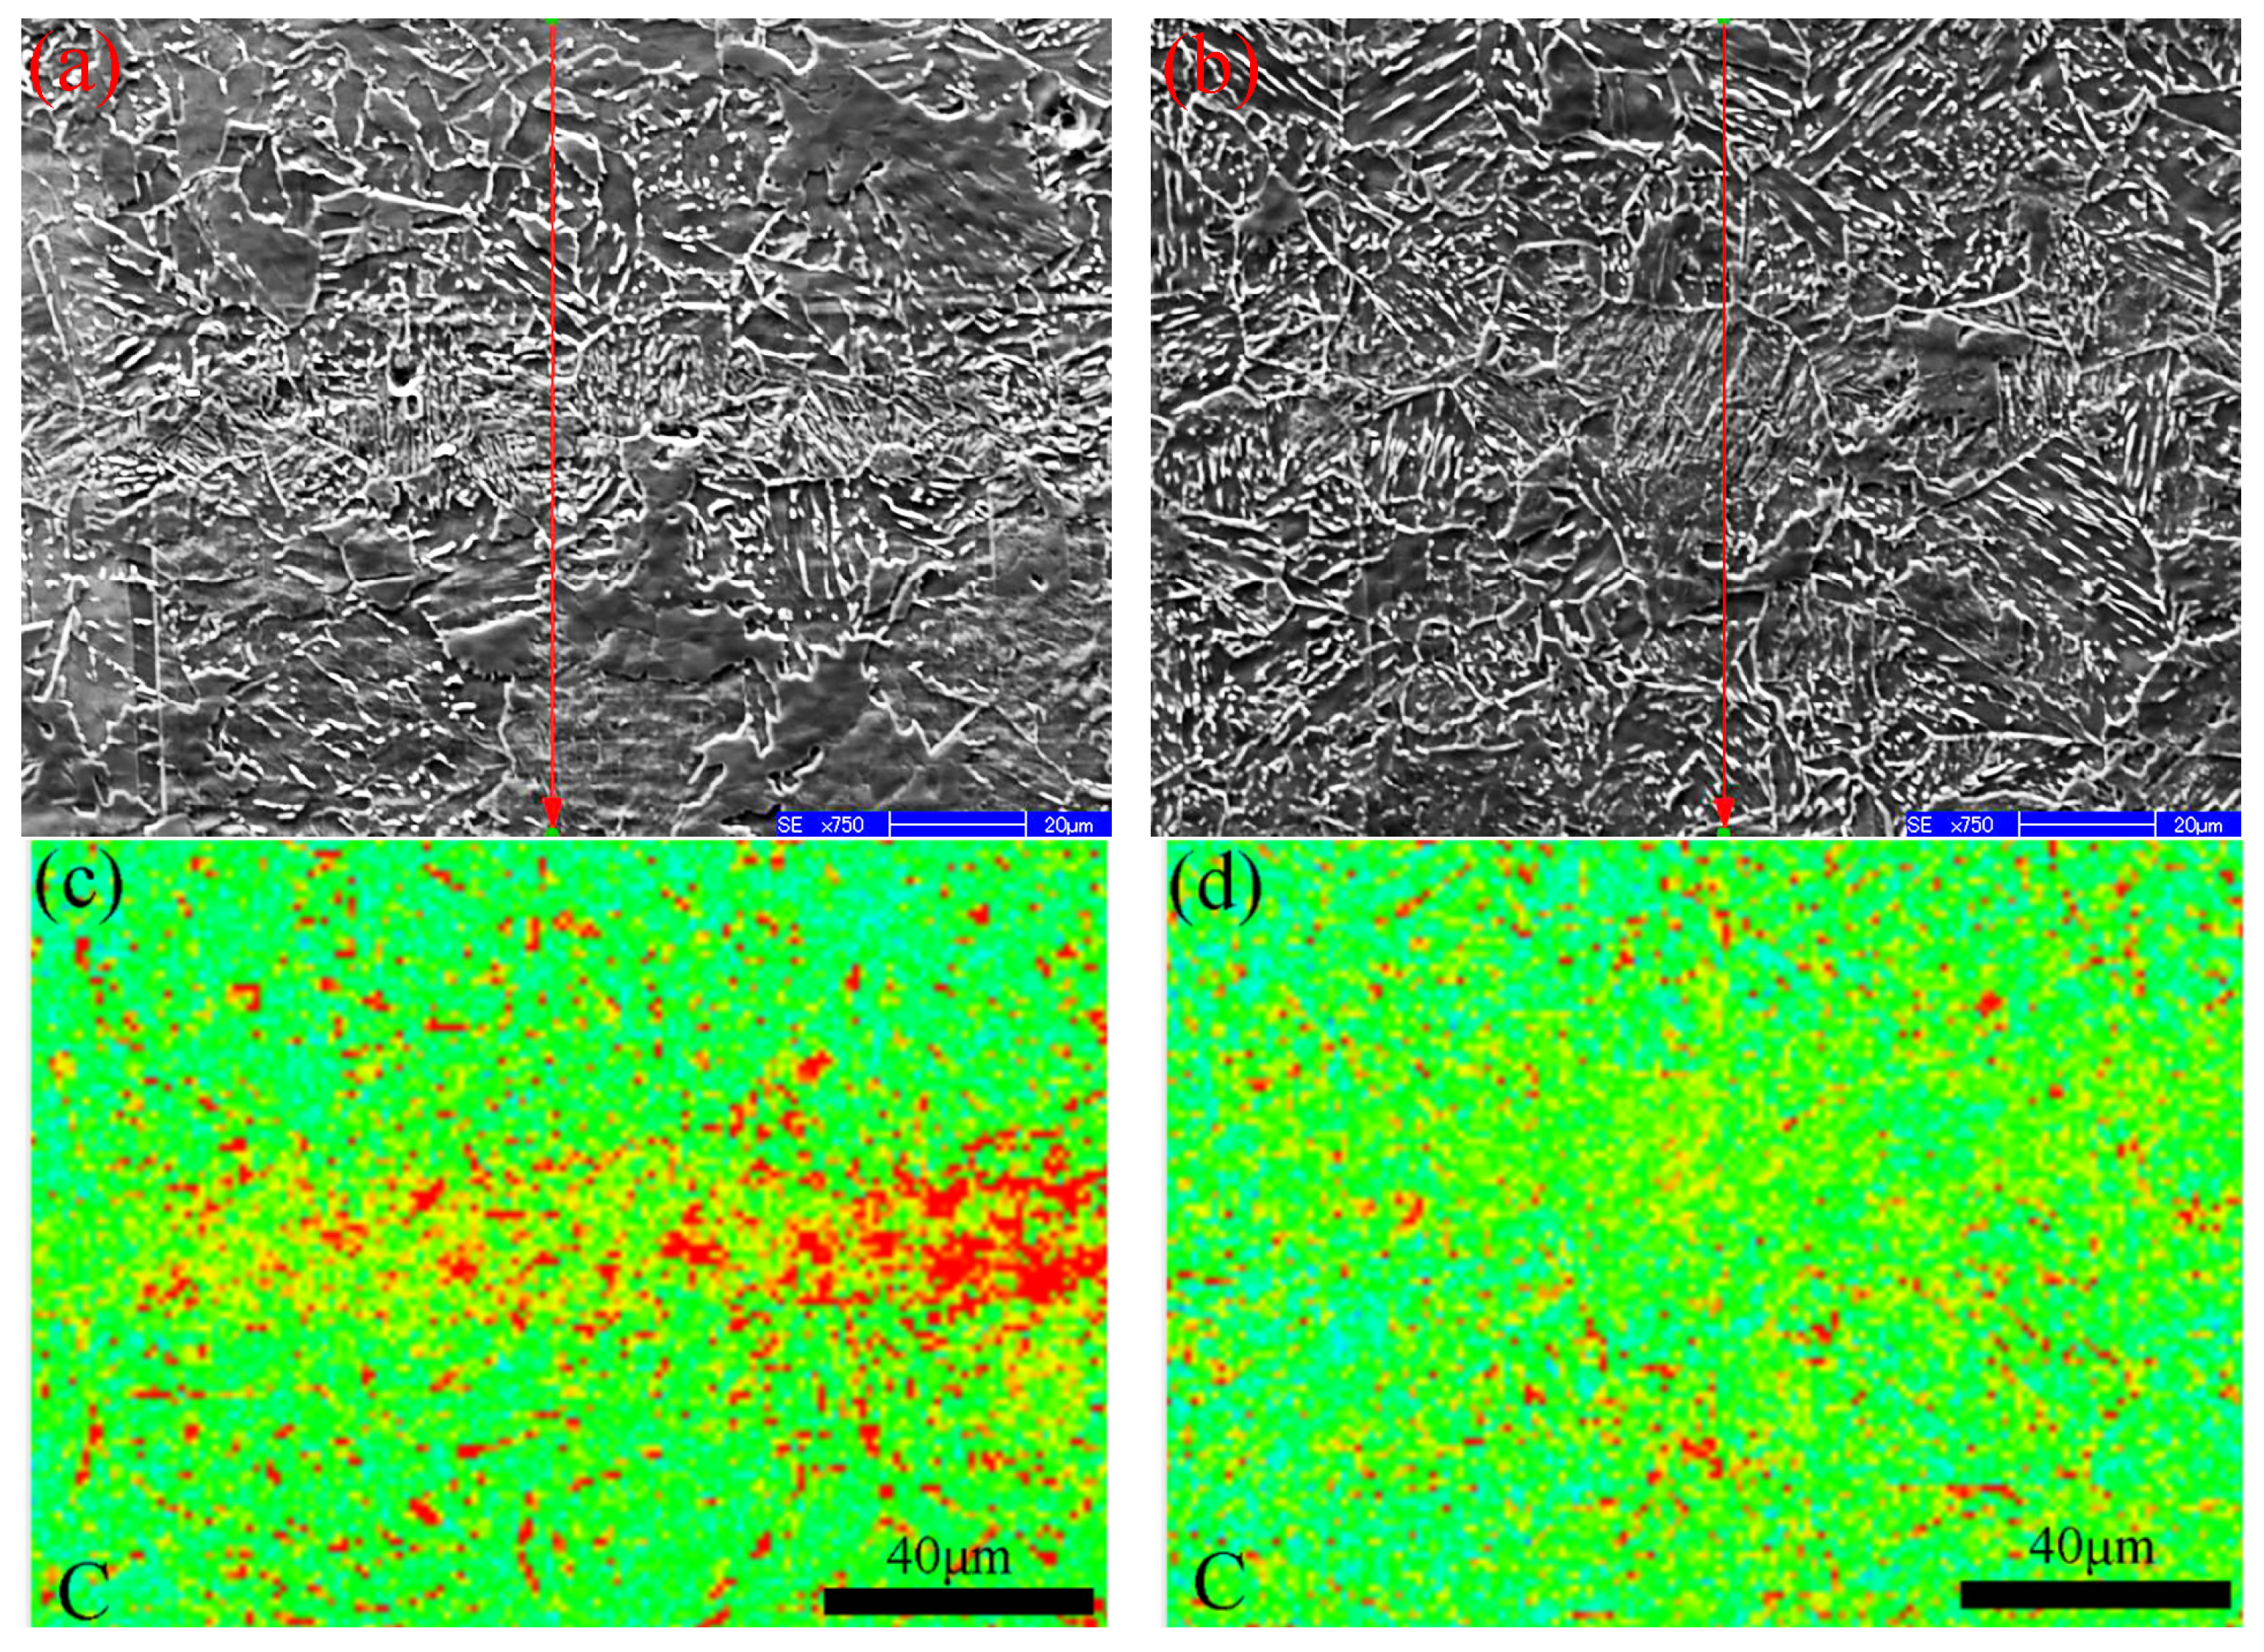
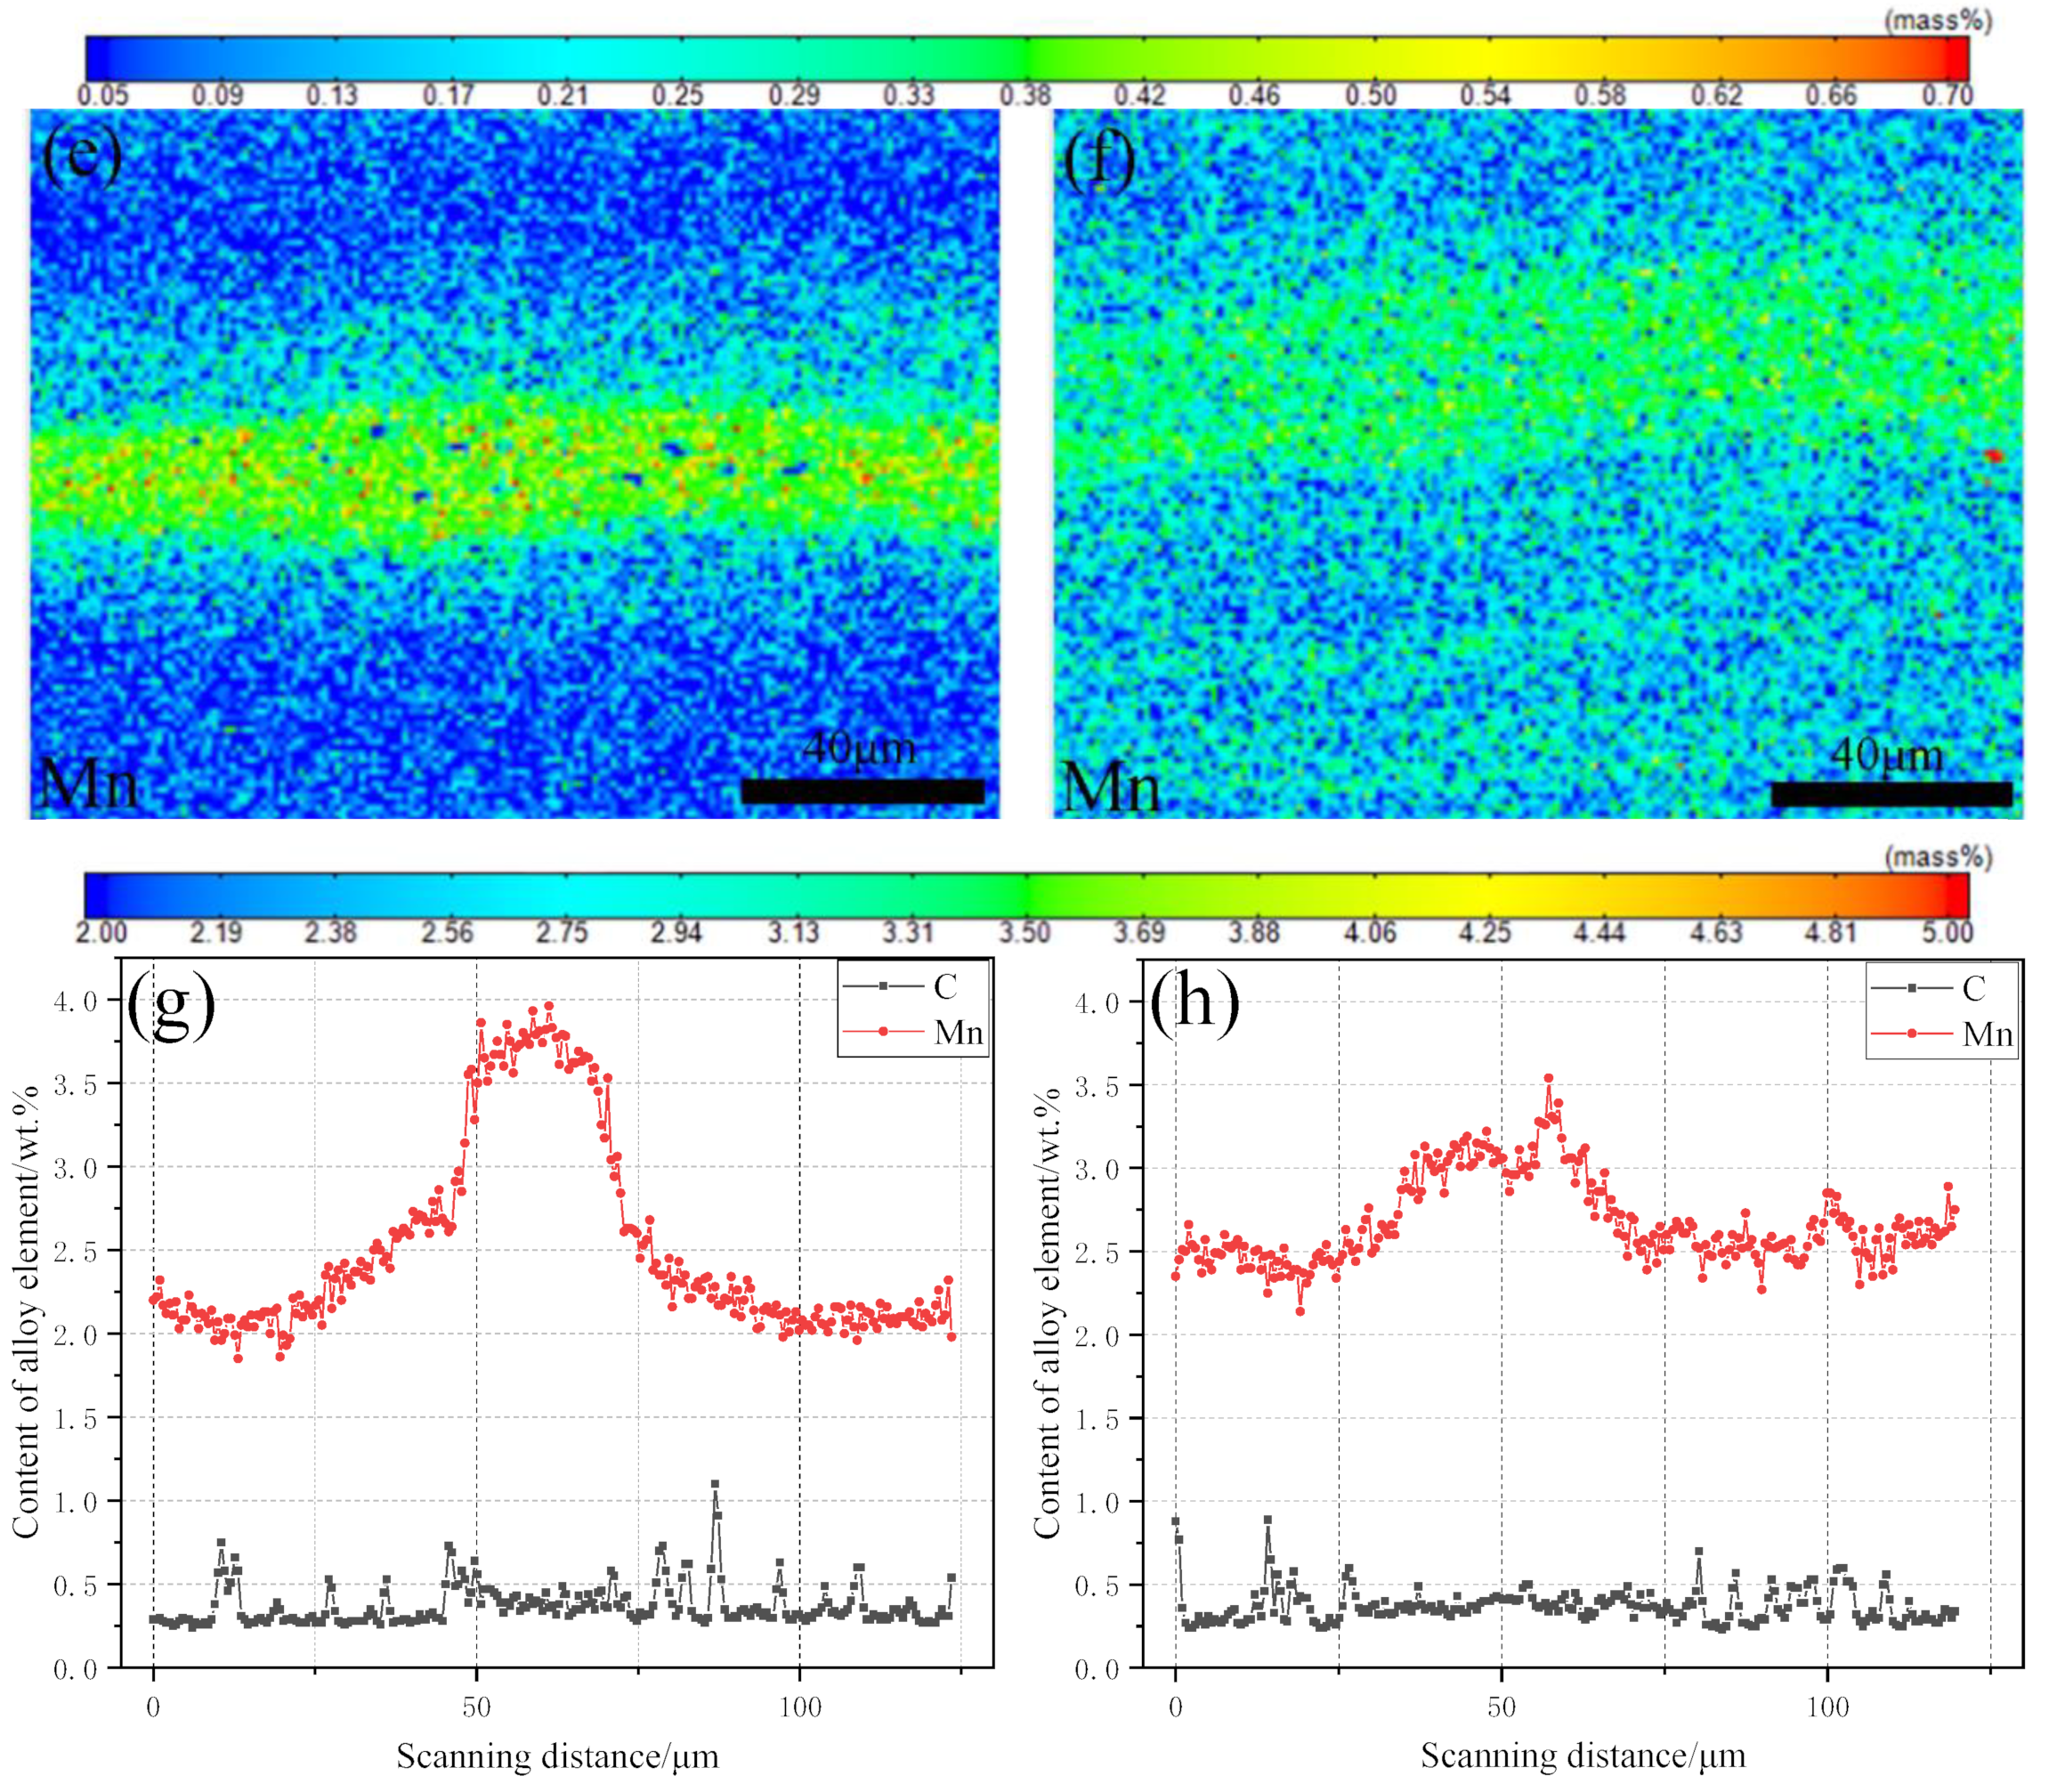
The sample was taken at the red frame position in Figure 1 for the detection of segregation elements in the coarse-grained zone of the HAZ. The EPMA results are shown in Figure 7. From the EPMA secondary electron imaging pictures (Figure 7a,b), it is observed that the microstructure at the center line of the field of view is more inclined to the lath microstructure. In order to explore the distribution of segregation elements in this zone, surface scanning was carried out. The results show that C and Mn are enriched in the segregation line of sample 1#, while only Mn is enriched in sample 2#. In addition, the enrichment degree of Mn in sample 1# is significantly higher than that in sample 2#. In order to quantitatively analyze the enrichment content of C and Mn elements in the segregation zone, the vertical segregation zone was quantitatively detected by line scanning. The red lines of Figure 7a,b are line scanning paths. The results are shown in Figure 7g,h. The peak value of Mn content in the segregation zone of sample 1# is close to 4 wt. %, while the peak value of Mn content in the segregation zone of sample 2# is 3 wt. %. In addition, the Mn content outside the 1# segregation zone of the sample is less than 2.5 wt. %, while the Mn content outside the 2# segregation zone of the sample is slightly higher than 2.5 wt. %. The difference in solute elements between the segregation zone and the BM of sample 1# is larger than that of sample 2#.

3.4. Discussion

In order to explore the cause of the fracture delamination of the impact specimen, the sample used to analyze the fracture was cut along the direction and position of the red line in Figure 8, and then the cutting surface was ground and etched with 80 °C 1:1 hydrochloric acid solution for 10 min to reveal the position of the segregation zone on the impact specimen.
The results of thermal acid etching of the impact sample are shown in Figure 8. On the groove surface of the impact sample (Figure 8 Side A), sample 1# has a more obvious segregation zone, while sample 2# has a trace of segregation zone, but it is not obvious. In the cutting surface of the vertical fracture of the impact specimen (Figure 8 Side B), sample 1# also has a more obvious segregation zone, while sample 2# is not observed. Comparing Figure 3a and Figure 9a, the position of the segregation zone from sample 1# is consistent with the position of the fracture delamination. Therefore, the delamination of the impact fracture in the HAZ of the welded joint is caused by the centerline segregation. In addition, the decrease in impact energy and the increase in fluctuation may also be caused by the central segregation.
The above experimental results show that the low-temperature impact fluctuation of the HAZ of the pipeline steel welded joint is large, and the delamination of the impact fracture is closely related to the central segregation. The steel plates of welded joints 1# and 2# are from the slab with central segregation grades of 3 and 2, respectively. EPMA results show that there is not only C enrichment in the core of sample 1# but also Mn enrichment, which is significantly higher than that of sample 2#. Therefore, it can be seen that the grade of segregation of the centerline segregation at the center of the steel plate is consistent with that of the slab, and even in the welding HAZ, the distribution of elements in the segregation zone is not affected by the welding thermal cycle. The enrichment of C in sample 1# is not redissolved, and the enrichment of Mn is abnormal and significantly higher than that of sample 2#. Once the content of Mn in the segregation zone of abnormal microstructure is enriched to a certain concentration, bainite or martensite can be produced under normal hot rolling or air cooling conditions. The content and distribution of segregation alloy directly affect the formation of abnormal microstructure (martensite or bainite). The bainitic and martensitic transformations can easily occur in the C-Mn segregated area. Therefore, the segregated behavior of the continuous casting slab with severe segregation would provide thermodynamic conditions for the formation of abnormal microstructure (martensite or bainite). Due to the genetic influence of center segregation, when the center segregation level reaches or exceeds class 3, lath bainite/martensite will be formed in the center of the normal rolled plate.
In the welding process of pipeline steel, the HAZ is rapidly cooled after large heat input, and the cooling rate is higher than that in the production process of steel plate, so the segregation zone of the HAZ is easier to form hard phases such as martensite. The experimental results also confirm this point. The segregation zone of sample 1# is finer, and the stress distribution is more concentrated. When the external force is applied, the crack is easy to nucleate at the hard phase formed in the segregation zone. In addition, due to the large difference between the hard phase and the BM microstructure, the uniformity of the microstructure is poor, which is more likely to cause the crack to propagate along the hard phase. This also explains the reason why the sample 1# impact fracture has stratification and impact energy fluctuation.

4. Conclusions

(1)
The HAZ of pipeline steel with centerline segregation of class 2 has good low-temperature toughness.
(2)
When the centerline segregation of the slab reaches class 3, the fracture of the impact specimen in the HAZ of the rolled plate welding appears delamination, and the fluctuation of the impact energy increases. As the test temperature decreases, the fluctuation of impact energy increases significantly.
(3)
The content and distribution of C and Mn elements enriched in the center segregation of pipeline steel plate are not affected by the welding thermal cycle.
(4)
The delamination of impact fracture and the large fluctuation of impact energy in the welding HAZ of pipeline steel is caused by the enrichment of C and Mn elements in the segregation zone. The phase transition point of the segregation zone decreases, and the cooling rate of the HAZ after welding is faster, which promotes the formation of martensite with a smaller grain size in the segregation zone. The stress distribution concentration is formed at the position of the segregation zone, which makes it easy to form the crack source and the crack propagation path.

Author Contributions

Methodology, X.W. and C.S.; Formal analysis, W.L.; Data curation, H.Z.; Writing—original draft, F.G.; Supervision, C.S. All authors have read and agreed to the published version of the manuscript.

Funding

This work was funded by the Scientific Research Start-up Project of Guangdong Ocean University (360302032201) and the Basic Research and Application Basic Research Foundation of Guangdong Province (2022A1515240016).

Data Availability Statement

The original contributions presented in the study are included in the article, further inquiries can be directed to the corresponding author.

Conflicts of Interest

The authors declare no conflict of interest.

References

  1. Liu, Y.; Zhang, L.Z.; Gao, W.X. Historical development and future prospects of pipeline steel. Oil Gas Storage Transp. 2022, 41, 1355–1362. [Google Scholar]
  2. Gao, X.H.; Li, J.; Yang, Y.D.; Li, H. Development of High Deformability Pipeline Steel. Rare Met. Mater. Eng. 2011, 40, 273–275. [Google Scholar]
  3. Wang, X.X. Development progress of pipeline steel with Extra-high strength. Welded Pipe Tube 2010, 33, 5–12. [Google Scholar]
  4. Sharma, L. Study of weld bead chemical, microhardness & microstructural analysis using submerged arc welding fluxes for linepipe steel applications. Ceram. Int. 2020, 46, 24615–24623. [Google Scholar]
  5. Zhang, Z.Y. Application of Key Technologies in Design of X80 Φ1422 mm Pipeline Engineering of China-Russia East Natural Gas Pipeline Project. Welded Pipe Tube 2019, 41, 64–71. [Google Scholar]
  6. Li, B.; Liu, Q.; Jia, S.; Ren, Y.; Yang, P. Effect of V content and heat input on HAZ softening of deep-sea pipeline steel. Materials 2022, 15, 794. [Google Scholar] [CrossRef] [PubMed]
  7. Wang, X.; Wang, D.; Dai, L.; Deng, C.; Li, C.; Wang, Y.; Shen, K. Effect of Post-Weld Heat Treatment on Microstructure and Fracture Toughness of X80 Pipeline Steel Welded Joint. Materials 2022, 15, 6646. [Google Scholar] [CrossRef]
  8. Qi, X.N.; Huan, P.C.; Wang, X.N.; He, J. Study on the mechanism of heat input on the grain boundary distribution and impact toughness in CGHAZ of X100 pipeline steel from the aspect of variant. Mater. Charact. 2021, 179, 111344. [Google Scholar] [CrossRef]
  9. Han, Y.D.; Fei, J.Y.; Xin, P.; Wang, R.; Xu, L. Microstructure and properties of intercritically reheated coarse-grained heat affected zone in pipeline steel after secondary thermal cycle. Int. J. Hydrogen Energy 2021, 05, 131. [Google Scholar] [CrossRef]
  10. Peng, Y.; Song, L.; Zhang, L.; Ma, C.Y.; Zhao, H.Y.; Tian, Z.L. Research Status of Weldability of Advanced Steel. Acta Metall. Sin. 2020, 56, 601–618. [Google Scholar]
  11. Zuo, Z.; Haowei, M.; Yarigarravesh, M.; Assari, A.H.; Tayyebi, M.; Tayebi, M.; Hamawandi, B. Microstructure, Fractography, and Mechanical Properties of Hardox 500 Steel TIG-Welded Joints by Using Different Filler Weld Wires. Materials 2020, 15, 8196. [Google Scholar] [CrossRef] [PubMed]
  12. Pouraliakbar, H.; Khalaj, G.; Jandaghi, M.R.; Khalaj, M.J. Study on the correlation of toughness with chemical composition and tensile test results in microalloyed API pipeline steels. J. Min. Metall. B Metall. 2015, 51, 173–178. [Google Scholar] [CrossRef]
  13. Sharma, S.K.; Maheshwari, S. A review on welding of high strength oil and gas pipeline steels. J. Nat. Gas Sci. Eng. 2017, 38, 203–217. [Google Scholar] [CrossRef]
  14. Zeng, H.L.; Zhang, Y.; Pi, Y.D.; Zou, Y.F. Research on laser-arc hybrid welding technology for long-distance pipeline. Met. Work. 2017, 04, 10–13. [Google Scholar]
  15. Zhang, Y.; Shuai, J.; Ren, W.; Lv, Z. Investigation of the tensile strain response of the girth weld of high-strength steel pipeline. J. Constr. Steel Res. 2022, 188, 107047. [Google Scholar] [CrossRef]
  16. Wu, K.; Zhang, H.; Yang, Y.; Liu, X. Strength matching factor of pipeline girth weld designed by reliability method. J. Pipeline Sci. Eng. 2021, 1, 298–307. [Google Scholar] [CrossRef]
  17. Nguyen, T.T.; Tak, N.; Park, J.; Nahm, S.H.; Beak, U.B. Hydrogen embrittlement susceptibility of X70 pipeline steel weld under a low partial hydrogen environment. Int. J. Hydrogen Energy 2020, 45, 23739–23753. [Google Scholar] [CrossRef]
  18. Frantov, I.I.; Velichko, A.A.; Bortsov, A.N.; Utkin, I.Y. Weldability of niobium-containing high-strength steel for pipelines. Weld. J. 2014, 93, 23–29. [Google Scholar]
  19. Taban, E.; Kaluc, E.; Ojo, O.O. Properties, weldability and corrosion behavior of supermartensitic stainless steels for on-and offshore applications. Mater. Test. 2016, 58, 501–518. [Google Scholar] [CrossRef]
  20. Tas, Z. Mechanical properties of pipeline steel welds. Mater. Test. 2017, 59, 295–301. [Google Scholar] [CrossRef]
  21. Guo, F.; Liu, W.; Wang, X.; Misra, R.D.K.; Shang, C. Controlling variability in mechanical properties of plates by reducing centerline segregation to meet strain-based design of pipeline steel. Metals 2019, 9, 749. [Google Scholar] [CrossRef]
  22. Guo, F.; Wang, X.; Liu, W.; Shang, C.; Misra, R.D.K.; Wang, H.; Zhao, T.; Peng, C. The influence of centerline segregation on the mechanical performance and microstructure of X70 pipeline steel. Steel Res. Int. 2018, 89, 1800407. [Google Scholar] [CrossRef]
  23. No. SN 960: 2009; Classification of Defects in Materials-Standard Charts and Sample Guide. SMS Demag AG Mannesmann: Düsseldorf, Germany, 2009.
  24. ISO148-1; Metallic Materials—Charpy Pendulum Impact Test—Part 1: Test Method. ISO: Geneva, Switzerland, 2016.
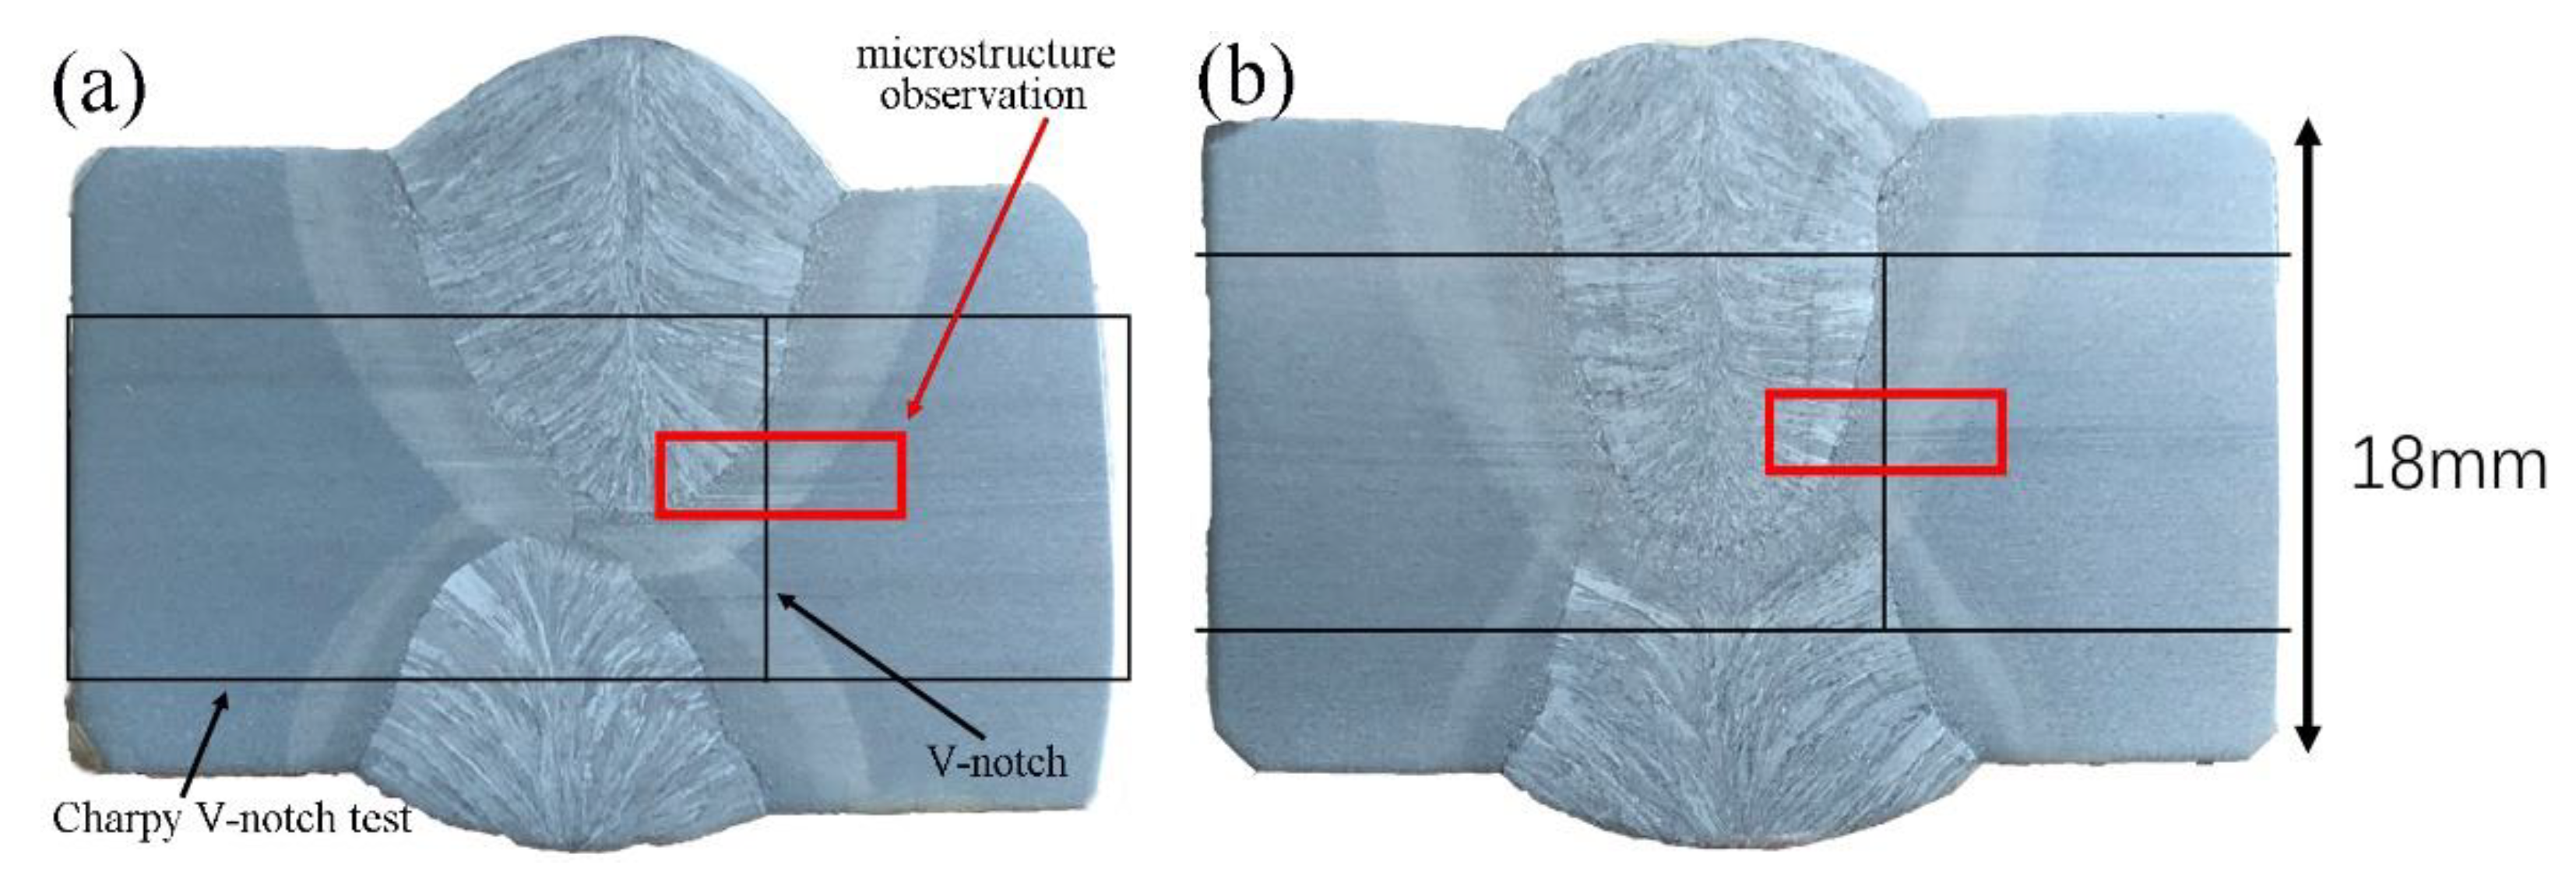
Figure 1. Macro morphology of welded joint and Charpy impact test position:(a) sample 1#; (b) sample 2#.
Metals 14 00209 g001
Figure 2. Low temperature impacts the toughness of HAZ.
Metals 14 00209 g002
Figure 3. Impact fracture of HAZ: (a,c,e) sample 1#, (b,d,f) sample 2# (tested at −40 °C).
Metals 14 00209 g003aMetals 14 00209 g003b
Figure 4. HAZ microstructure morphology at 5 mm from the center of plate thickness to the fusion line: (a,c) Sample 1#, (b,d) Sample 2#.
Metals 14 00209 g004aMetals 14 00209 g004b
Figure 5. EBSD microstructure morphology at 5 mm from the center of the plate thickness to the fusion line: (a,c,e,g) sample 1#, (b,d,f,h) sample 2#. (a,b) BC map, (c,d) BC map with GB, (e,f) IPF map, (g,h) KAM map.
Metals 14 00209 g005aMetals 14 00209 g005b
Figure 6. Kernel average misorientation by EBSD showing the stress distribution of samples.
Metals 14 00209 g006
Figure 7. EPMA results at the position of 5 mm from the center of the plate thickness to the fusion line: (a,c,e,g) Sample 1#, (b,d,f,h) Sample 2#.
Metals 14 00209 g007aMetals 14 00209 g007b
Figure 8. Schematic diagram of Charpy-V impact test sample.
Metals 14 00209 g008
Figure 9. Charpy-V impact test sample after hot acid etching: (a,c) Sample 1#, (b,d) Sample 2#, (a,b) A surface, (c,d) B surface.
Metals 14 00209 g009
Table 1. Chemical composition of BM.
CSiMnCrPSMo + V + Ti + NbFe
BM0.070.191.650.20.010.0020.124Bal.
Table 2. Welding process parameters.
Current/AVoltage/VWelding Speed cm/minHeat Input kJ/cm
Outside welding700386026
Inside welding600366520
Disclaimer/Publisher’s Note: The statements, opinions and data contained in all publications are solely those of the individual author(s) and contributor(s) and not of MDPI and/or the editor(s). MDPI and/or the editor(s) disclaim responsibility for any injury to people or property resulting from any ideas, methods, instructions or products referred to in the content.