
Electrochemical Behavior of Niobium Oxide and Titanium Oxide in NaF–Na3AlF6 Molten Salt
1
State Key Laboratory of Baiyunobo Rare Earth Resource Researches and Comprehensive Utilization, Baotou Research Institute of Rare Earths, Baotou 014030, China
2
Key Laboratory for Ecological Metallurgy of Multimetallic Ores (Ministry of Education), Northeastern University, Wenhua Road, Heping District, Shenyang 110819, China
3
School of Metallurgy, Northeastern University, Wenhua Road, Heping District, Shenyang 110819, China
*
Author to whom correspondence should be addressed.
Metals 2024, 14(3), 297; https://doi.org/10.3390/met14030297
Submission received: 21 January 2024
/
Revised: 25 February 2024
/
Accepted: 28 February 2024
/
Published: 1 March 2024
(This article belongs to the Special Issue Advances in Slag Metallurgy—Second Edition)
Abstract
:The Bayan Obo ore deposit is a world-renowned polymetallic coexistence mine that integrates important elements, such as rare earths, iron, niobium, and titanium. The chemical properties of niobium and titanium are similar, and the two often coexist in the Bayan Obo deposit as isomorphs, making them difficult to separate. Therefore, the separation of niobium and titanium is crucial for the efficient utilization of niobium resources in the Bayan Obo ore deposit of China. To discuss the feasibility of separating niobium and titanium by selective electrolysis, cyclic voltammetry and square wave voltammetry were used to study the reduction mechanism of niobium oxide and titanium oxide in NaF–Na3AlF6 molten salt. The results revealed significant differences in the diffusion coefficients and reduction steps of Nb5+ and Ti4+ during reduction at a molybdenum cathode. At 950 °C, the diffusion coefficient of Nb5+ during reduction at a molybdenum cathode was 3.57 × 10⁻⁶ cm2/s. Also, in the NaF–Na3AlF6 system, Nb5+ underwent a three-step reduction as follows: Nb(V)→Nb(IV)→Nb(I)→Nb. The diffusion coefficient of Ti4+ during reduction at the molybdenum cathode was 9.92 × 10⁻⁷ cm2/s, and Ti4+ underwent a two-step reduction in the NaF–Na3AlF6 system: Ti(IV)→Ti(I)→Ti. When Nb2O5 and TiO2 were both present in the NaF–Na3AlF6 system, the deposition potential of niobium metal (−0.64 V) differed from that of titanium metal (−0.77 V). These differences in diffusion coefficient, reduction step, and deposition potential enabled selective electrolytic separation of niobium and titanium.
1. Introduction
The Bayan Obo mine in China is a globally significant polymetallic symbiotic ore deposit. It encompasses rare earths, iron, niobium, titanium, and other essential elements. Notably, niobium, which has an important role in material properties, has a resource amount of 6.6 million tons [1]. However, exploitation of the Bayan Obo mineral resource has primarily focused on the extraction of iron and rare earths, and the utilization rate of niobium resources has been almost zero. The low utilization rate of niobium is mainly because the niobium is low-grade, there are diverse niobium-containing minerals, and there is a fine embedded grain size in the Bayan Obo mine [2]. These characteristics have made the beneficiation and metallurgy of niobium resources extremely difficult; thus, most of the niobium resources have ended up in tailings.
The grade of niobium coexistence ore in the Bayan Obo mine is about 0.10%, and there are as many as 20 types of niobium-bearing mineral phases, including niobite (FeNb2O6), aeschynite ((Ce,Nd)(Ti,Nb)2O6), pyrochlore ((Ca,Na,Ce)2 (Nb,Ti)2O6(F,OH)), ilmenorutile ((Fe,Ti,Nb)O2), fersmitem (CaNb2O6), etc. These niobium-bearing phases contain multiple metal elements in coexistence with one another, and they typically have particle sizes that do not exceed 20 μm. Often, they are symbiotic or encapsulated with other minerals, and this makes their separation and extraction exceedingly difficult. Furthermore, niobium and titanium have similar chemical properties and ionic radii (Ti4+ = 0.64 Å and Nb5+ = 0.69 Å), and they coexist extensively in various niobium-bearing phases; thus, they are inherited into the beneficiation and metallurgy processes of niobium resources. This significantly affects the concentrate grade and product quality. In niobium-containing alloys that are produced via pyrometallurgical processes [3,4] and in niobium oxide that is produced via hydrometallurgical processes [5,6,7,8,9] using Bayan Obo mine materials, the difficulty in separating niobium and titanium leads to low product quality. This severely limits the range of product applications. Therefore, the deep separation of niobium and titanium becomes key to overcoming the challenges of achieving comprehensive utilization of Bayan Obo niobium resources.
Molten salt electrolysis has the advantages of a short process flow, low cost, continuous production, and high product purity; thus, it has been widely applied in industrial production. It is especially effective in the production of high-purity metals, such as high-purity niobium and titanium. Many researchers have studied the electrochemical behavior of niobium ions or titanium ions in fluoride and chloride molten salts. However, niobium and titanium ions in molten salts have multiple valence states, and hence, their electrochemical reduction processes are quite complex.
He et al. [10] proposed that the electrolytic reduction of K2NbF7 proceeds via the following steps: Nb(V)→Nb(IV)→Nb. The second step is quasi-reversible and controlled by a diffusion process. Li et al. [11] found that the electrode reduction process of niobium ions at 750 °C in KCl–NaCl molten salt is the following quasi-reversible three-step reaction: Nb(V)→Nb(III)→Nb(I)→Nb. Wang et al. [12] found that the electrode reduction reaction of Nb(V) in LiF–NaF–KF–Na2O melts is a two-step electrochemical reaction process that involves one and four electrons, respectively, and is as follows: Nb(V)→Nb(IV)→Nb. Matthiesen et al. [13] used cyclic voltammetry to study the electrochemical behavior of F–Nb complexes at 700 °C in LiF–NaF–KF melts. When K2NbF7 was added, the fluorine complex NbF72– was introduced into the melt, and its electrochemical reduction process was as follows: Nb(V)→Nb(IV)→Nb. Bailey et al. [14] used cyclic voltammetry and chronopotentiometry to study the electrochemical behavior of Nb(V) in molten LiF–NaF–KF melts; they showed that Nb(V) is reduced in two steps, which are as follows: Nb(V)→Nb(III)→Nb. S. A. Kuznetsov [15] investigated the electroreduction of niobium in chloride fluoride electrolytes used for preparing zirconium powder, and determined the limit density of the cathode diffusion current of niobium discharge and the diffusion coefficient of Nb (V) and Nb (IV) fluoride complexes as a function of temperature. The optimal electrolysis parameters were determined by studying the effects of cathode current density, niobium concentration, and temperature on the current efficiency of cathode electrodeposition.
According to Lantelem’s research [16], the cathodic process of tetravalent titanium ions in the NaCl–KCl molten salt system undergoes three reduction stages: Ti(IV)→Ti(III)→Ti(II)→Ti. Chen et al. [17] investigated the cathodic process of Ti4+ in the NaCl–KCl eutectic salt system, and they concluded that Ti4+ undergoes the following processes on a platinum electrode: Ti(IV)→Ti(III)→Ti(II)→Ti. This is essentially consistent with Lantelem’s findings. Robin et al. [18] concluded that during the cathodic reduction process of TiF62– it is first reduced to TiF63− regardless of the type of metal cathode and that the cathodic reduction process of TiF63− varies greatly depending on the type of cathode metal. Li et al. [19] determined the cathodic process of tetravalent titanium ions at 700 °C in the molten LiF–NaF–KF–K2TiF6 system on platinum metal, and this could be represented as Ti(IV)→Ti(III)→Ti. They concluded that the nucleation process of titanium on the platinum electrode is instantaneous nucleation. Jiao et al. [20] studied the electrochemical behavior of titanium ions in chloride melts, such as NaCl–KCl–TiClx and NaCl–KCl–LiCl–TiClx. From the results of electrochemical research on low-valent titanium ions on metal cathodes, Zhou et al. [21] prepared high-purity titanium that had different morphologies. Zhao et al. [22] comprehensively evaluated the electrochemical process of Ti deposition using cyclic voltammetry and square wave voltammetry. The electrode reaction mechanisms and particle evolution principles in molten salt during this electrolysis process were discussed. It indicated that titanium chloride in lower valence (TiCl3) with a more productive advantage could exist as an intermediate, and Ti3+ ions were reduced to Ti metal by a two-step mechanism corresponding to the following pathway: Ti3+ → Ti2+ → Ti.
The abovementioned literature focused only on electrochemical research of niobium ions or titanium ions and proved that molten salt electrolysis is an effective method for preparing high-purity niobium and titanium metals. However, systematic studies on the electrochemical behavior of niobium and titanium oxides in molten salts, especially in cases where niobium and titanium are both present, have not yet been reported. Developing technology for molten salt electrolytic separation of niobium and titanium has yet to be explored. In this work, niobium oxide and titanium oxide in the NaF–Na3AlF6 molten salt system were systematically studied using electrochemical testing, and the evolution of niobium and titanium states during molten salt electrolysis, and the potential conditions for selective electrolytic separation between niobium and titanium were explored. This research provides a theoretical basis for developing technology for molten salt electrolytic separation of niobium and titanium in the Bayan Obo coexistence mine.
2. Experimental Methods
Reagents used for electrochemical testing included niobium pentoxide (Nb2O5), titanium dioxide (TiO2), sodium fluoride (NaF), and cryolite (Na3AlF6), which were analytical grade and were produced by Shanghai Macklin Biochemical Co., Ltd. (Shanghai, China). The experimental setup (Figure 1) included an electrochemical workstation (Aut 84847), a tubular high-temperature furnace, and an electrolytic cell. The electrolytic cell used a molybdenum wire as the working electrode (WE), a graphite crucible as the counter electrode (CE), and a molybdenum wire as the reference electrode (RE). The molybdenum wire was sheathed in a protective alumina sheath.
Before electrochemical tests were conducted, molten salt electrolysis (42 wt% NaF–58 wt% Na3AlF6) was subjected to vacuum drying. Pre-electrolysis was carried out using the constant potential electrolysis method to remove impurities. The electrolyte was mixed with niobium oxide and titanium oxide, and the mixture was placed in a crucible in the electrolytic cell. The electrolytic cell was then placed in a tubular heating furnace. The temperature was increased while argon gas (purity ≥ 99.99%) was introduced at a flow rate of 0.5 L/min. When the temperature reached 950 °C and the materials were completely melted, the electrolytic cell was set up and connected to the electrochemical workstation. After the workstation was started and the control software Nova 1.0 was initiated, the open circuit potential (OCP) of the electrolysis cell was tested, and electrode potentials were adjusted. Subsequent tests were conducted using a three-electrode system for cyclic voltammetry (CV) and square wave voltammetry (SWV). The test schemes are listed in Table 1.
3. Results and Discussion
3.1. Electrochemical Behavior of NaF–Na3AlF6 Molten Salt
Figure 2 shows the cyclic voltammetry curve of NaF–Na3AlF6 molten salt. No oxides were added to the system, and hence, there should be no elemental electrodeposition. However, a reduction peak can be observed at point A (−0.50 V) in the figure. This is likely because Al2O3 from the protective alumina sheath around the molybdenum wire electrode dissolved into the molten salt.
3.2. Electrochemical Behavior of the NaF–Na3AlF6–2 wt% Nb2O5 Molten Salt System
Figure 3 shows the cyclic voltammetry curve of the NaF–Na3AlF6–2 wt% Nb2O5 molten salt system on a Mo electrode. There are four reduction peaks in the negative scan from 0.5 V to −1.5 V. Compared to the cyclic voltammetry curve of the NaF–Na3AlF6 molten salt system, additional reduction peaks (A, B, and D) are observed after TiO2 was added. The corresponding potential of reduction peak C (−0.50 V) is consistent with the peak potential that is observed in the cyclic voltammetry curve of the NaF–Na3AlF6 molten salt system. It is believed that this is caused by dissolution of the alumina tube, corresponding to the reduction peak of Al3+. The reduction peaks at A, B, and D have potentials of 0.09 V, −0.38 V, and −0.68 V, respectively, and this indicates that the reduction process of Nb5+ is divided into three steps.
Figure 4 shows cyclic voltammetry curves of NaF–Na3AlF6–2 wt% Nb2O5 obtained at different scan rates. It is observed that both the cathodic peak current density and the corresponding cathode peak potential vary with respect to the scan rate. The absolute value of the ratios of each reduction peak current density to the corresponding oxidation peak current density is not equal to one. Both the oxidation and reduction peak current densities increase with the scan rate. The reduction peak potential shifts to a lower potential, and the oxidation peak potential shifts to a higher potential.
Figure 5 shows the relationship between the reduction peak potential of Nb5+ and the logarithm of the scan rate. The data indicate that there is a nearly linear relationship between the reduction peak potential and the logarithm of the scan rate. By combining data for the changes in oxidation–reduction peak current density and potential with respect to the scan rate, it is deduced that the first step in the reduction of Nb5+ is an irreversible process. For an irreversible electrochemical reaction process, the difference in values between the peak potential and the half-peak potential, which is expressed as , should satisfy Equation (1) [23]. According to Equation (1), the charge transfer coefficient (α) of the reduction of Nb5+ at the Mo cathode is calculated to be approximately 0.97.
where represents the peak potential (V), is the half-peak potential (V), R is the gas molar constant [8.314 J/(mol·K)], T is the temperature (K), α is the charge transfer coefficient, n is the number of electron transfers, and F is Faraday’s constant (96,485 C/mol) [24]. n is calculated as nA = 3 and is based on the electron transfer number at this potential, as obtained in the following text.
Figure 6 shows the relationship between the reduction peak A current density and the square root of the scan rate. As seen in the figure, the current density value of the reduction peak for Nb5+ increases with an increase in the scan rate, and there is a linear relationship with the square root of the scan rate. This indicates that the reaction is controlled by the diffusion of Nb5+ in the system [25]. At this point, the relationship between the peak current density and the scan rate can be calculated using the Randles–Sevcik equation, which can be expressed as Equation (2) [26].
where Ip represents the peak current density (A), D is the diffusion coefficient (cm2/s), v is the scan rate (V/s), A is the electrode working area (cm2), and C0 is the initial concentration of Ti4+ (mol/cm3).
Using the previously obtained charge transfer coefficient (α) of 0.97 and assuming complete ionization of Nb2O5 in the molten salt, the diffusion coefficient D of Nb5+ in the NaF–Na3AlF6 system at 950 °C is calculated to be approximately 3.57 × 10⁻⁶ cm2/s.
Figure 7 shows the square wave voltammetry curve of the NaF–Na3AlF6–2 wt% Nb2O5 molten salt system on the Mo electrode. Four reduction peaks (RI, RII, RIII, and RIV) are observed. Among them, the reduction potential of peak RIII corresponds to the reduction potential of Al3+, whereas the reduction potentials of RI, RII, and RIV correspond to niobium ions. After Gaussian fitting of the square wave voltammetry curve and combining Equation (3) [27], which relates the half-peak width W1/2 of the reduction peak to the number of electrons transferred in the reduction reaction, the number of electrons transferred for different reduction peaks can be calculated as follows:
where W1/2 represents the half-peak width (V), F is Faraday’s constant (96,485 C/mol), T is the Kelvin temperature (K), and R is the gas constant (8.314 J/(mol·K)).
The following are found from the calculations: nI = 0.82 ≈ 1, nII = 3.36 ≈ 3, nIII = 3.41 ≈ 3, and nIV = 1.37 ≈ 1. Therefore, it is inferred that the pentavalent niobium ion undergoes a three-step reduction in the NaF–Na3AlF6 system, and these steps are as follows: Nb(V)→Nb(IV)→Nb(I)→Nb. The reduction of Al3+ [Al(III)→Al] occurs at −0.5V. The results for square wave voltammetry and cyclic voltammetry agree well in terms of the measured reduction potentials.
3.3. Electrochemical Behavior of the NaF–Na3AlF6–2 wt% TiO2 Molten Salt System
Figure 8 shows the cyclic voltammetry curve of the NaF–Na3AlF6–2 wt% TiO2 molten salt system on a Mo electrode. There are three reduction peaks in the negative scan from 0.5 V to −1.2 V. The corresponding potential of reduction peak B is consistent with the peak potential that is observed in the cyclic voltammetry curve of the NaF–Na3AlF6 molten salt system, corresponding to the reduction peak of Al3+. The reduction peaks at A and C have potentials of −0.43 V and −0.84V, respectively, and this indicates that the reduction process of Ti4+ is divided into three steps. There is a current density disturbance at C, which should be caused by metal phase precipitation.
Figure 9 shows cyclic voltammetry curves of NaF–Na3AlF6–2 wt% TiO2 obtained at different scan rates. Figure 10 shows the relationship between the reduction peak potential of Ti4+ and the logarithm of the scan rate. There is a nearly linear relationship between the reduction peak potential and the logarithm of the scan rate. By combining data for the changes in oxidation–reduction peak current density and potential with respect to the scan rate, it is deduced that the first step in the reduction of Ti4+ is an irreversible process. According to Equation (1), the charge transfer coefficient (α) of the reduction of Ti4+ at the Mo cathode is calculated to be approximately 0.28.
Figure 11 shows the relationship between the reduction peak A current density and the square root of the scan rate. The current density value of the reduction peak for Ti4+ increases with an increase in the scan rate, and there is a linear relationship with the square root of the scan rate. This indicates that the reaction is controlled by the diffusion of Ti4+ in the system. Using the previously obtained charge transfer coefficient (α) of 0.28 and assuming complete ionization of TiO2 in the molten salt, the diffusion coefficient D of Ti4+ in the NaF–Na3AlF6 system at 950 °C is calculated to be approximately 9.92 × 10⁻⁷ cm2/s, which is much less than the diffusion coefficient D of Nb5+.
Figure 12 shows the square wave voltammetry curve of the NaF–Na3AlF6–2 wt% TiO2 molten salt system on the Mo electrode. Three reduction peaks (RI, RII, and RIII) are observed. Among them, the reduction potential of peak RII corresponds to the reduction potential of Al3+, whereas the reduction potentials of RI and RIII correspond to titanium ions. After Gaussian fitting of the square wave voltammetry curve and combining Equation (3), the following are found: nI = 3.36 ≈ 3, nII = 2.85 ≈ 3, and nIII = 0.77 ≈ 1. Therefore, it is inferred that the reduction of Al3+ [Al(III)→Al] occurs at –0.5V, and the tetravalent titanium ion undergoes a two-step reduction: Ti(IV)→Ti(I)→Ti.
3.4. Electrochemical Behavior of the NaF–Na3AlF6–2 wt% Nb2O5–2 wt% TiO2 Molten Salt System
Figure 13 shows the cyclic voltammetry curve of the NaF–Na3AlF6–2 wt% Nb2O5–2 wt% TiO2 molten salt system. By combining this with the cyclic voltammetry curve of the NaF–Na3AlF6–2 wt% Nb2O5 system (Figure 3), the reduction processes and corresponding reduction potentials of the NaF–Na3AlF6–2 wt% Nb2O5–2 wt% TiO2 system are obtained and listed in Table 2. There are noticeable differences between the reduction potentials of TiO2 and Nb2O5 in NaF–Na3AlF6 molten salt. When both TiO2 and Nb2O5 are present, the deposition potential of niobium metal (−0.64 V) differs from the deposition potential of titanium metal (−0.77 V). This difference in deposition potentials enables the selective electrolytic separation of the two.
4. Conclusions
The separation of niobium and titanium is crucial for the efficient utilization of niobium resources in the Bayan Obo polymetallic coexistence mine. Using selective electrolysis on molten salts offers a promising approach for achieving this separation. However, systematic studies on the electrochemical behavior of Nb2O5, TiO2, and their mixtures in NaF–Na3AlF6 molten salt have been lacking. In this paper, cyclic voltammetry and square wave voltammetry were used to study the reduction mechanism of niobium oxide and titanium oxide in NaF–Na3AlF6 molten salt. The results revealed significant differences in the diffusion coefficients and reduction steps of Nb5+ and Ti4+ during reduction at a molybdenum cathode. At 950 °C, the diffusion coefficient of Nb5+ during reduction at a molybdenum cathode was 3.57 × 10⁻⁶ cm2/s. Also, in the NaF–Na3AlF6 system, Nb5+ underwent a three–step reduction as follows: Nb(V)→Nb(IV)→Nb(I)→Nb. The diffusion coefficient of Ti4+ during reduction at the molybdenum cathode was 9.92 × 10⁻⁷ cm2/s, and Ti4+ underwent a two–step reduction in the NaF–Na3AlF6 system: Ti(IV)→Ti(I)→Ti. When Nb2O5 and TiO2 were both present in the NaF–Na3AlF6 system, the deposition potential of niobium metal (–0.64 V) differed from that of titanium metal (–0.77 V). These differences in diffusion coefficient, reduction step, and deposition potential enabled selective electrolytic separation of niobium and titanium.
In future work, we plan to use selective electrolysis to produce high-purity niobium metal from mixtures of niobium oxide and titanium oxide based on the differences in their electrochemical behaviors.
Author Contributions
Conceptualization, B.Z. and M.J.; methodology, B.Z.; investigation, B.Z., S.Y. and Y.L.; resources, M.J.; data collection and analysis, B.Z., S.Y. and Y.L.; writing—original draft preparation, S.Y. and Y.L.; writing—review and editing, B.Z.; supervision, B.Z. and M.J.; project administration, B.Z.; funding acquisition, B.Z. and M.J. All authors have read and agreed to the published version of the manuscript.
Funding
This research was funded by the National Key R&D Program of China [grant number 2021YFC2901200]; National Natural Science Foundation of China [grant number 52174383, 52374412]; Liaoning Provincial Natural Science Foundation of China [grant number 2022–YQ–09]; and Open Project of State Key Laboratory of Baiyunobo Rare Earth Resource Research and Comprehensive Utilization [grant number GZ–2022–DK–003].
Data Availability Statement
The original contributions presented in the study are included in the article, further inquiries can be directed to the corresponding author.
Conflicts of Interest
The authors declare no conflict of interest.
References
- She, H.D.; Fan, H.R.; Yang, K.F.; Li, X.C.; Yang, Z.F.; Wang, Q.W.; Zhang, L.F.; Wang, Z.J. Complex, multi-stage mineralization processes in the giant Bayan Obo REE-Nb-Fe deposit. Ore Geol. Rev. 2021, 139, 104461. [Google Scholar] [CrossRef]
- Zhang, B.; Ma, C.; Wang, R.; Liu, C.; Jiang, M. Selective Smelting Reduction of Metal Oxides in REE-Nb-Fe Deposit. JOM 2022, 74, 993–1001. [Google Scholar] [CrossRef]
- Zhang, S.; Rao, M.; Xiao RYou, J.; Li, G. Beneficiation of Nb and Ti carbides from pyrochlore ore via carbothermic reduction followed by magnetic separation. Miner. Eng. 2022, 180, 107492. [Google Scholar] [CrossRef]
- Zhang, S.H.; Rao, M.J.; Xiao, R.D.; You, J.X.; Li, G.H.; Jiang, T. Enrichment of Nb and Ti from carbonatite pyrochlore ore via calcining-slaking followed by gravity separation. Int. J. Min. Sci. Technol. 2022, 32, 615–626. [Google Scholar] [CrossRef]
- Zhang, B.; Xue, X.; Yang, H. A novel process for recovery of scandium, rare earth and niobium from Bayan Obo tailings: NaCl-Ca(OH)2-coal roasting and acid leaching. Miner. Eng. 2022, 178, 107401. [Google Scholar] [CrossRef]
- Zhang, B.; Liu, C.J.; Li, C.L.; Jiang, M.F. A novel approach for recovery of rare earths and niobium from Bayan Obo tailings. Miner. Eng. 2014, 65, 17–23. [Google Scholar] [CrossRef]
- Sun, L.; Yu, H.; Meng, F.; Qi, T.; Zheng, S.; Peng, Y.; Wang, L. A novel method for the separation of niobium and titanium from sulfuric acid-oxalate solutions using N235 and MIBK. Hydrometallurgy 2021, 205, 105748. [Google Scholar] [CrossRef]
- Sun, L.; Yu, H.; Meng, F.; Qi, T.; Wang, L.; Peng, Y. Recovery of niobium and titanium from ilmenorutile by NaOH roasting-H2SO4 leaching process. J. Mater. Res. Technol. 2021, 15, 2575–2583. [Google Scholar] [CrossRef]
- Sun, L.; Zhang, X.; Wang, L. Separation and extraction of niobium from H2SO4 solution containing titanium and iron impurities. Sep. Purif. Technol. 2022, 295, 121207. [Google Scholar] [CrossRef]
- Li, H.E.; Lu, X.G.; Chen, C.Y.; Li, Q.; Li, C.H.; Zhong, Q.D. Metal niobium by solid oxygen-ion membrane. Chin. J. Nonferrous Met. 2008, 18, 1336–1341. [Google Scholar]
- Li, C.; Li, S.; Che, Y.; Li, J.; Shu, Y.; He, J.; Song, J. Electrochemical behavior of niobium ions in molten KCl-NaCl. J. Mater. Res. Technol. 2020, 9, 9341–9347. [Google Scholar] [CrossRef]
- Christensen, E.; Wang, X.D.; Barner JH, V.; Ostfold, T.; Bjerrum, N.J. The Influence of Oxide on the Electrodeposition of Niobium from Alkali Fluoride Melts. Cheminform 2010, 25, 141. [Google Scholar] [CrossRef]
- Matthiessen, F.; Christensen, E. The Redox Chemistry of Niobium(V) Fluoro and Oxofluoro Complexes in LiF-NaF-KF Melts. J. Electrochem. Soc. 1996, 143, 1793–1799. [Google Scholar] [CrossRef]
- Bailey, R.A.; Yoko, T. High-temperature electroplating of chromium from molten FLINAK. J. Appl. Electrochem. 1986, 16, 737–744. [Google Scholar] [CrossRef]
- Kuznetsov, S.A. Electrolytic production of niobium powder from chloride—Fluoride melts containing compounds of niobium and zirconium. Russ. J. Electrochem. 2000, 36, 509–515. [Google Scholar] [CrossRef]
- Lantelme, F.; Salmi, A. Electrochemistry of Titanium in NaCl - KCl Mixtures and Influence of Dissolved Fluoride Ions. J. Electrochem. Soc. 1995, 142, 3451–3456. [Google Scholar] [CrossRef]
- Chen, G.S.; Masazumi, O.; Takeo, O. Electrochemical studies of titanium ions (Ti4+) in equimolar KCl-NaCl molten salts with 1 wt% K2TiF6. Electrochim. Acta 1987, 32, 1637–1642. [Google Scholar] [CrossRef]
- Robin, A.; Lepinay, J.D. Determination of the apparent standard potential of the Ti/Ti(III) system in the LiF-NaF-KF eutectic using voltammetry, chronopotentiometry and open-circuit potentiometry. Electrochim. Acta 1991, 36, 1009–1012. [Google Scholar] [CrossRef]
- Jun, L.; Bing, L. Electrochemical reduction and electrocrystallization process of B(III) in the LiF-NaF-KF-KBF4 molten salt. Rare Met. Mater. Eng. 2007, 36, 15–19. [Google Scholar] [CrossRef]
- Jiao, H.; Zhang, L.; Jiao, S. Electrochemical Behavior of Titanium Ions at Liquid Metal Cathodes in Molten Salts. In Proceedings of the 13th World Conference on Titanium; VenkateshVenkatesh, V., Pilchak, A.L., Allison, J.E., Eds.; John Wiley & Sons: San Diego, CA, USA, 2016; Volume 28, pp. 183–186. [Google Scholar]
- Yuan, T.C.; Weng, Q.G.; Zhou, Z.H.; Li, J.; He, Y.H. Preparation of High-Purity Titanium by Molten-Salt Electrolysis Process. Adv. Mater. Res. 2011, 284–286, 1477–1482. [Google Scholar] [CrossRef]
- Ma, M.; Wang, D.; Wang, W. Extraction of titanium from different titania precursors by the FFC Cambridge process. J. Alloys Compd. 2019, 25, 6107–6114. [Google Scholar] [CrossRef]
- Wei, Y.; Yang, W.; Guo, H. Functional COFs for Electrochemical Sensing: From Design Principles to Analytical Applications. ChemistrySelect 2023, 8, 2365–6549. [Google Scholar] [CrossRef]
- Pogliano, U.; Durbiano, F.; Serazio, D. A system for controlling electrical and chemical parameters in the Faraday constant determination by dissolution of silver. Meas. Sci. Technol. 2011, 22, 055102. [Google Scholar] [CrossRef]
- Su, C.; An, M.; Yang, P.; Gu, H.; Guo, X. Electrochemical behavior of cobalt from 1-butyl-3-methylimidazolium tetrafluoroborate ionic liquid. Appl. Surf. Sci. 2010, 256, 4888–4893. [Google Scholar] [CrossRef]
- He, X.; Hou, B.; Li, C.; Zhu, Q.; Jiang, Y.; Wu, L. Electrochemical mechanism of trivalent chromium reduction in 1-butyl-3-methylimidazolium bromide ionic liquid. Electrochem. Acta 2014, 130, 245–252. [Google Scholar] [CrossRef]
- Halford, G.C.; Personick, M.L. Bridging Colloidal and Electrochemical Nanoparticle Growth with In Situ Electrochemical Measurements. Acc. Chem. Res. 2023, 56, 1228–1238. [Google Scholar] [CrossRef] [PubMed]
Figure 1.
Schematic diagram of the experimental system. 1—Stainless steel bar; 2—working electrode; 3—reference electrode; 4—graphite crucible (counter electrode); 5—molten salt; 6—tubular high-temperature furnace; 7—electrochemical workstation.
Figure 1.
Schematic diagram of the experimental system. 1—Stainless steel bar; 2—working electrode; 3—reference electrode; 4—graphite crucible (counter electrode); 5—molten salt; 6—tubular high-temperature furnace; 7—electrochemical workstation.
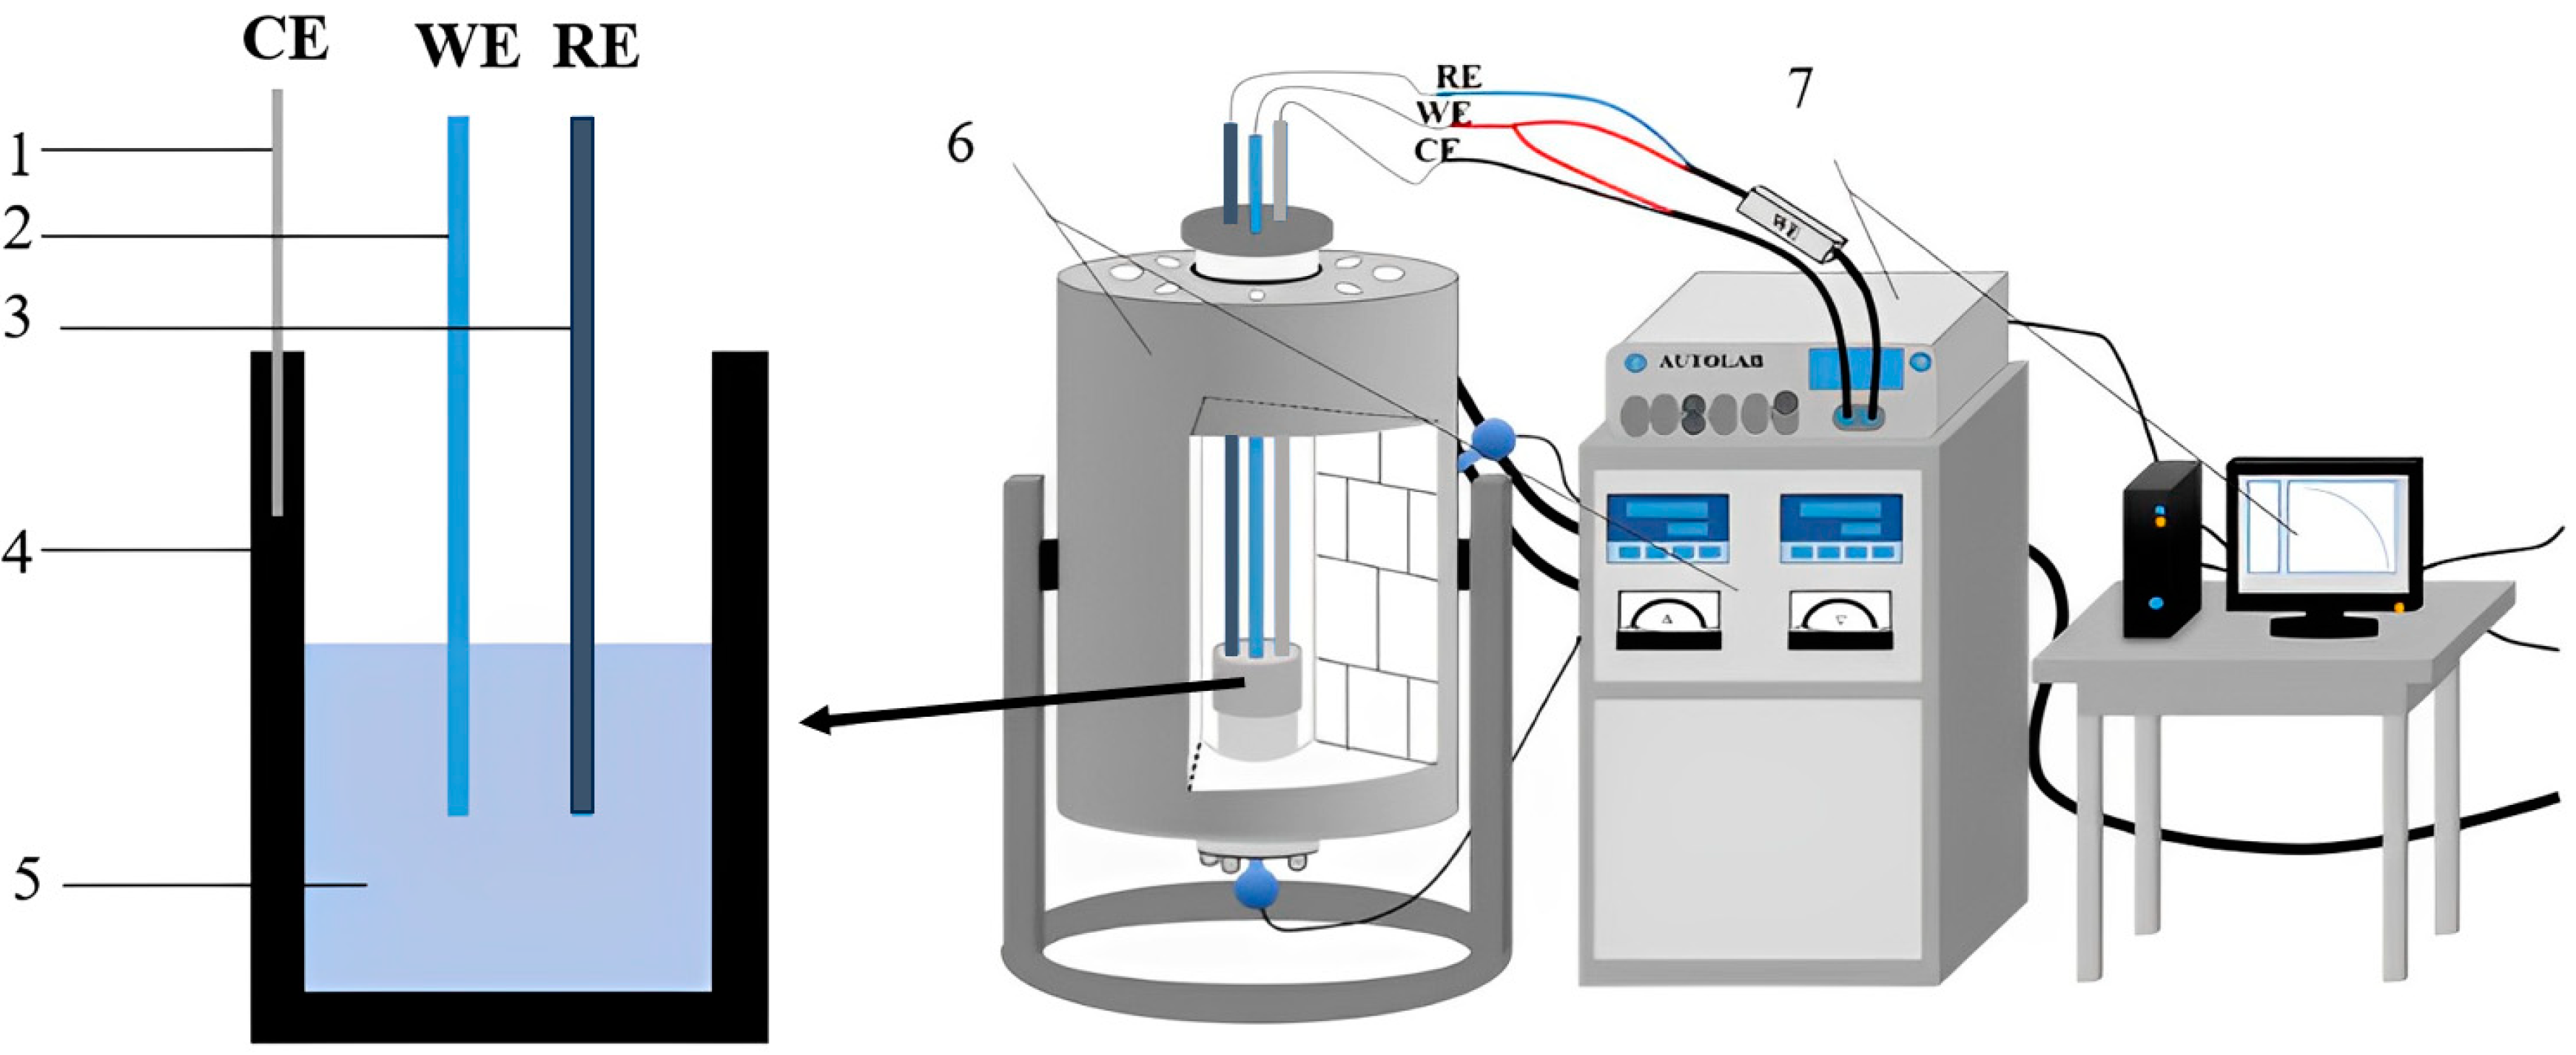
Figure 2.
Cyclic voltammetry curve of NaF–Na3AlF6 molten salt (scan rate: 50 mV/s; temperature: 1223 K).
Figure 2.
Cyclic voltammetry curve of NaF–Na3AlF6 molten salt (scan rate: 50 mV/s; temperature: 1223 K).
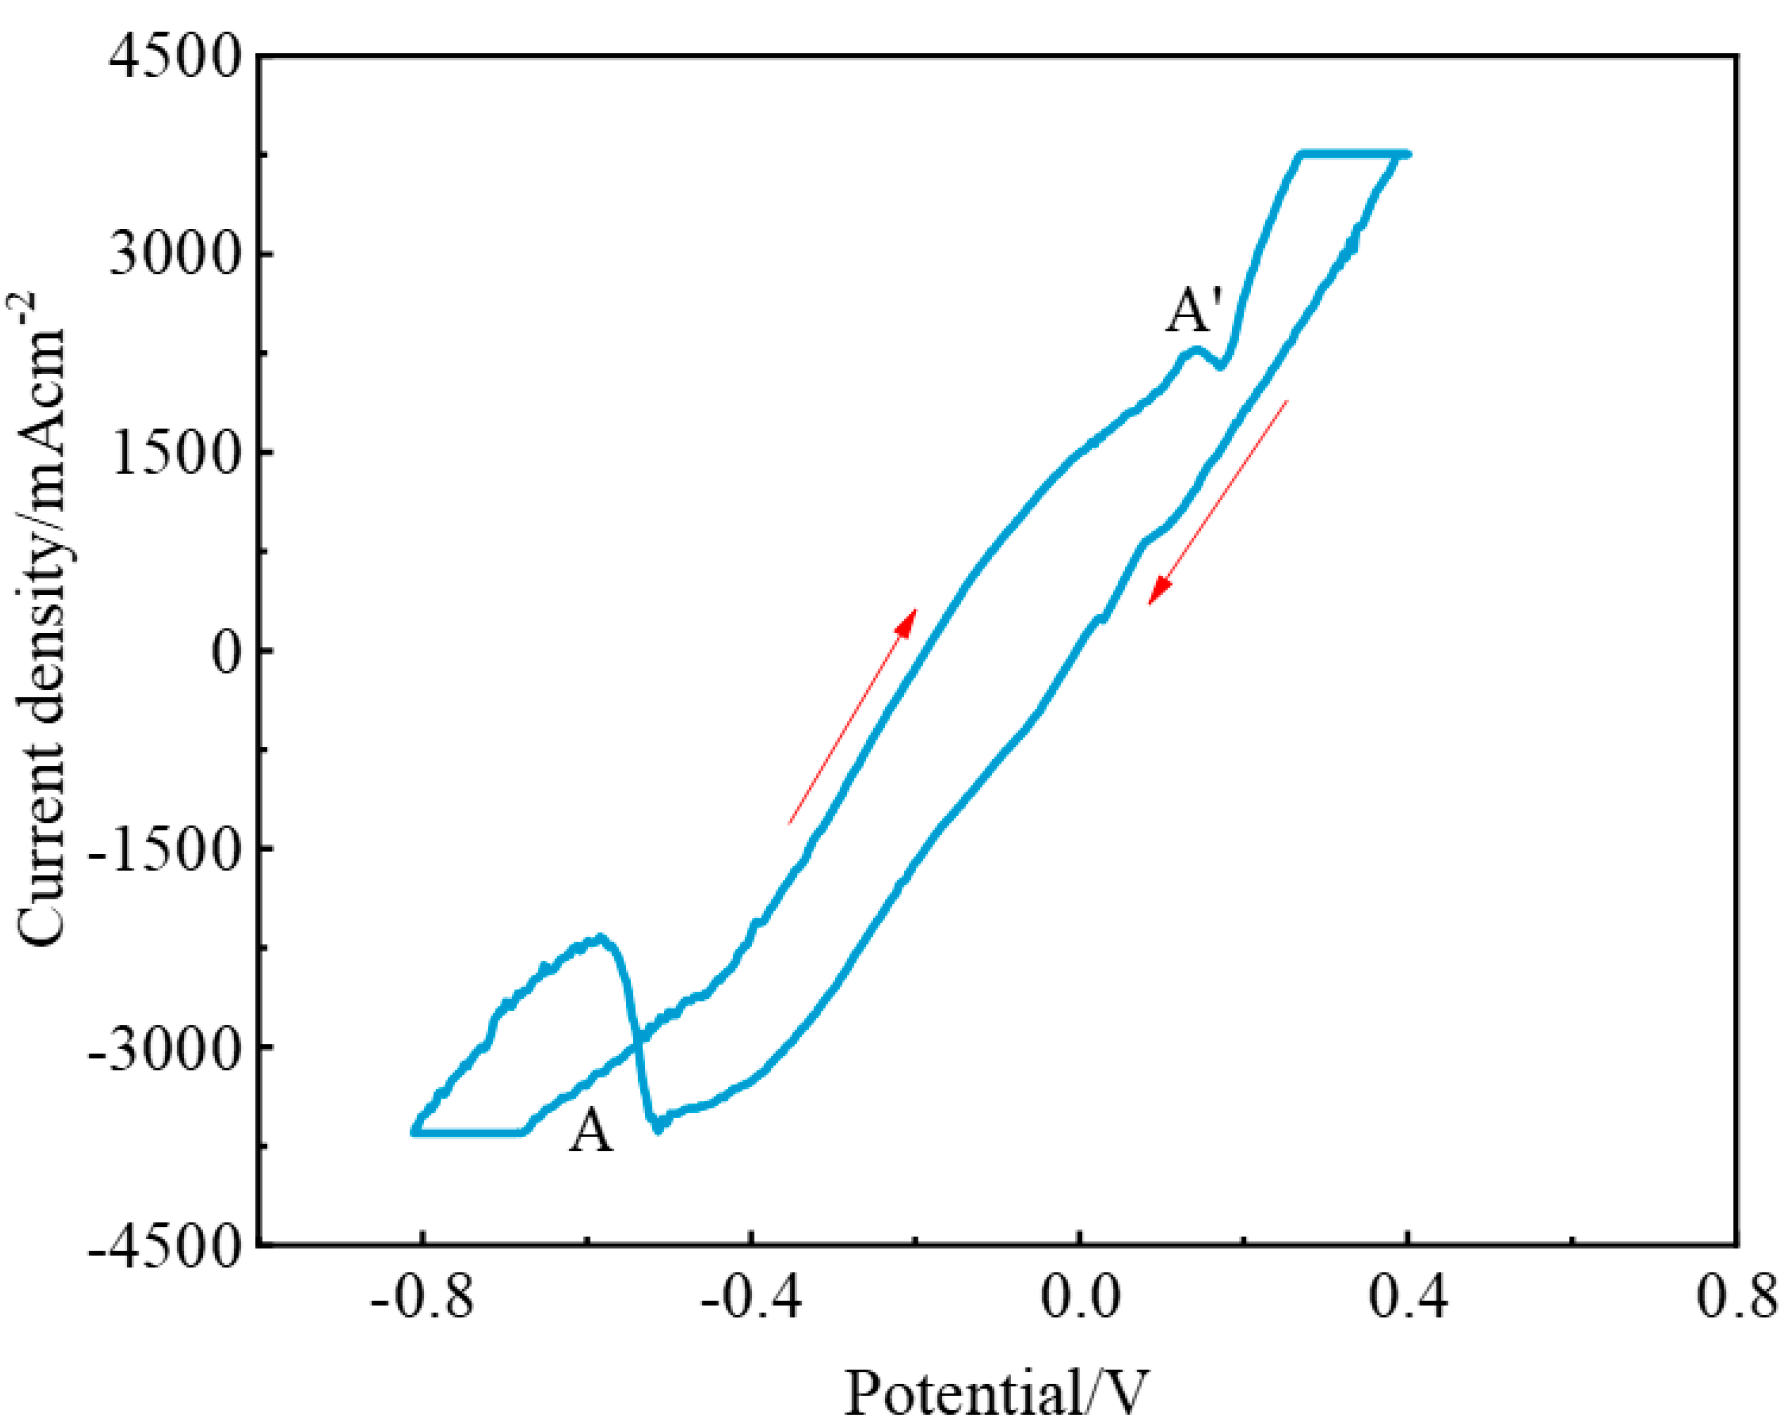
Figure 3.
Cyclic voltammetry curve of the NaF–Na3AlF6–2 wt% Nb2O5 molten salt system on the Mo electrode (scan rate: 50 mV/s; temperature: 1223 K).
Figure 3.
Cyclic voltammetry curve of the NaF–Na3AlF6–2 wt% Nb2O5 molten salt system on the Mo electrode (scan rate: 50 mV/s; temperature: 1223 K).
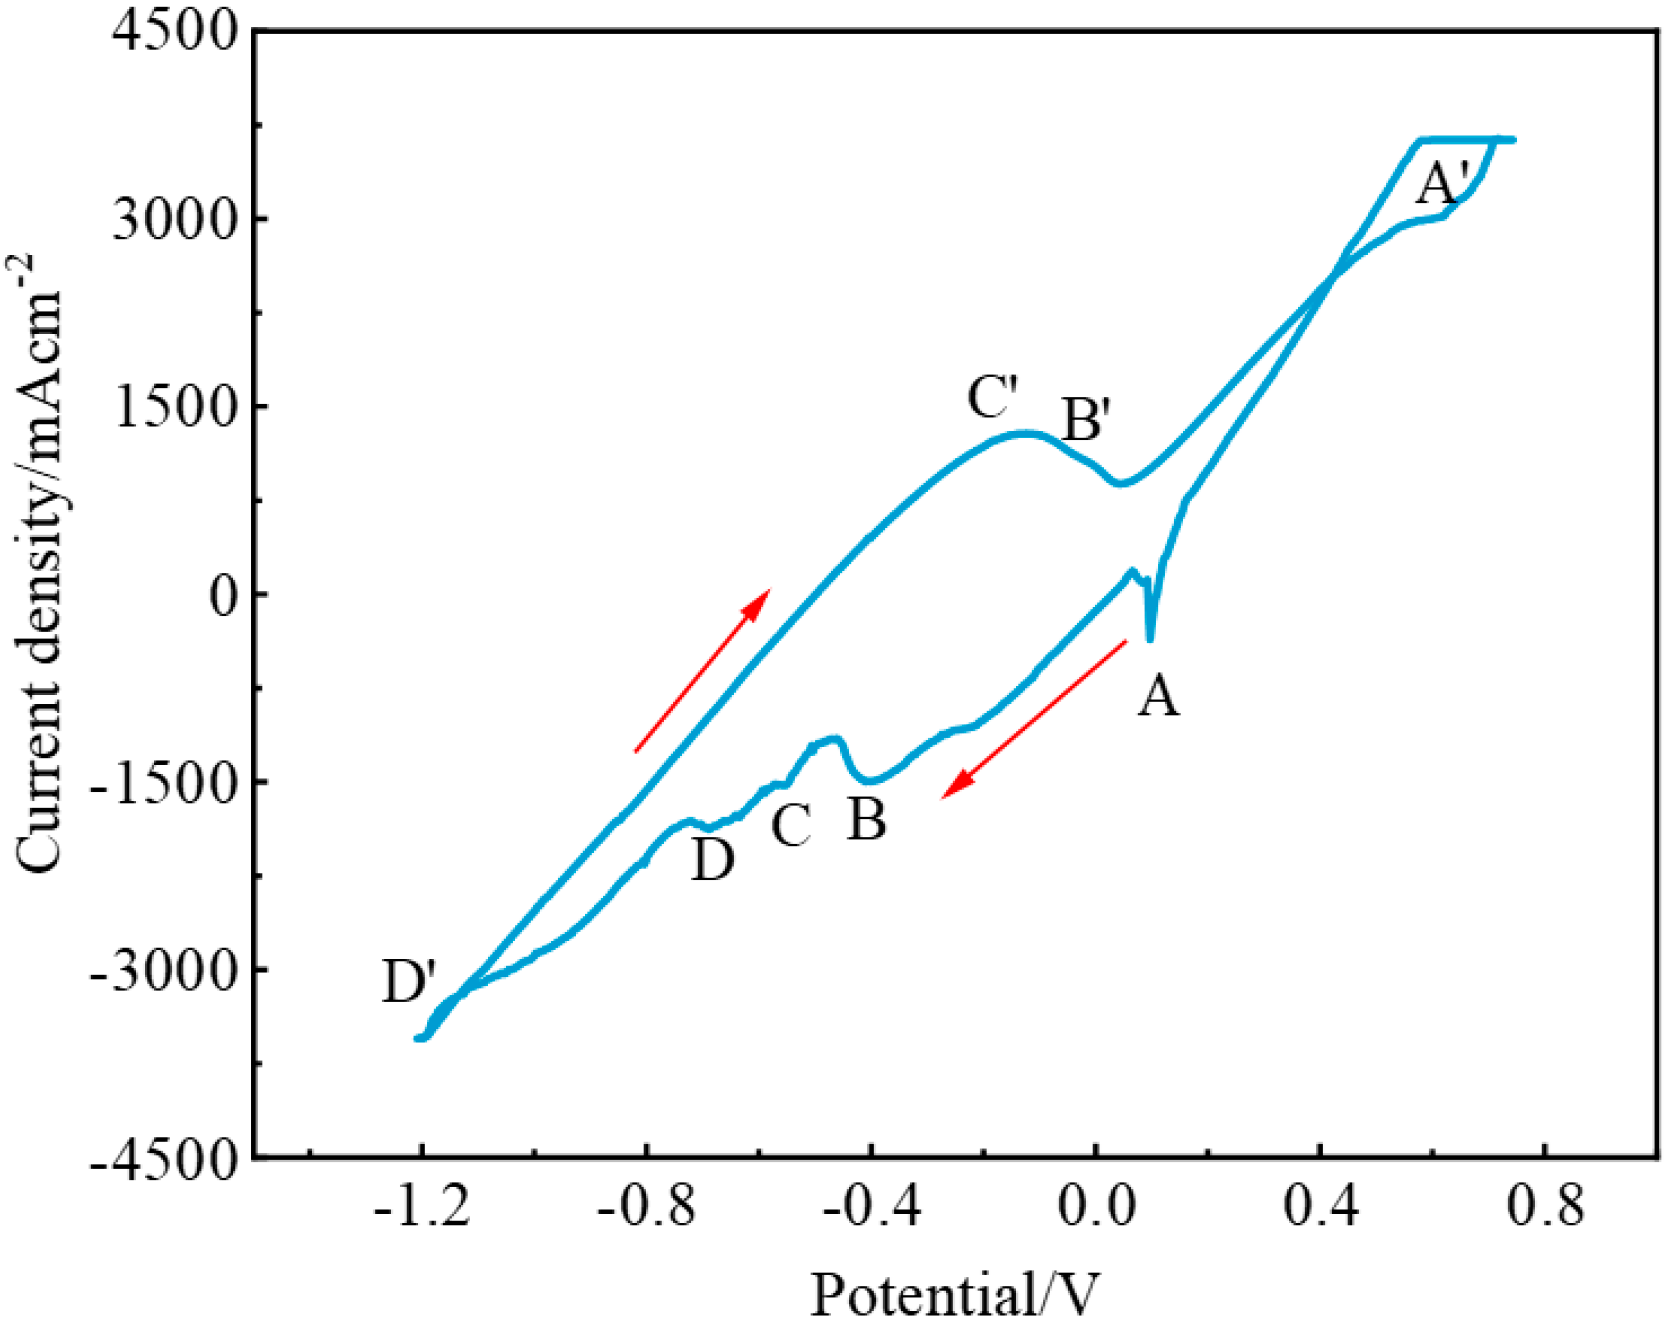
Figure 4.
Cyclic voltammetry curves of the NaF–Na3AlF6–2 wt% Nb2O5 molten salt system at different scan rates (scan rate: 50 mV/s, 75 mV/s, and 100 mV/s; temperature: 1223 K).
Figure 4.
Cyclic voltammetry curves of the NaF–Na3AlF6–2 wt% Nb2O5 molten salt system at different scan rates (scan rate: 50 mV/s, 75 mV/s, and 100 mV/s; temperature: 1223 K).
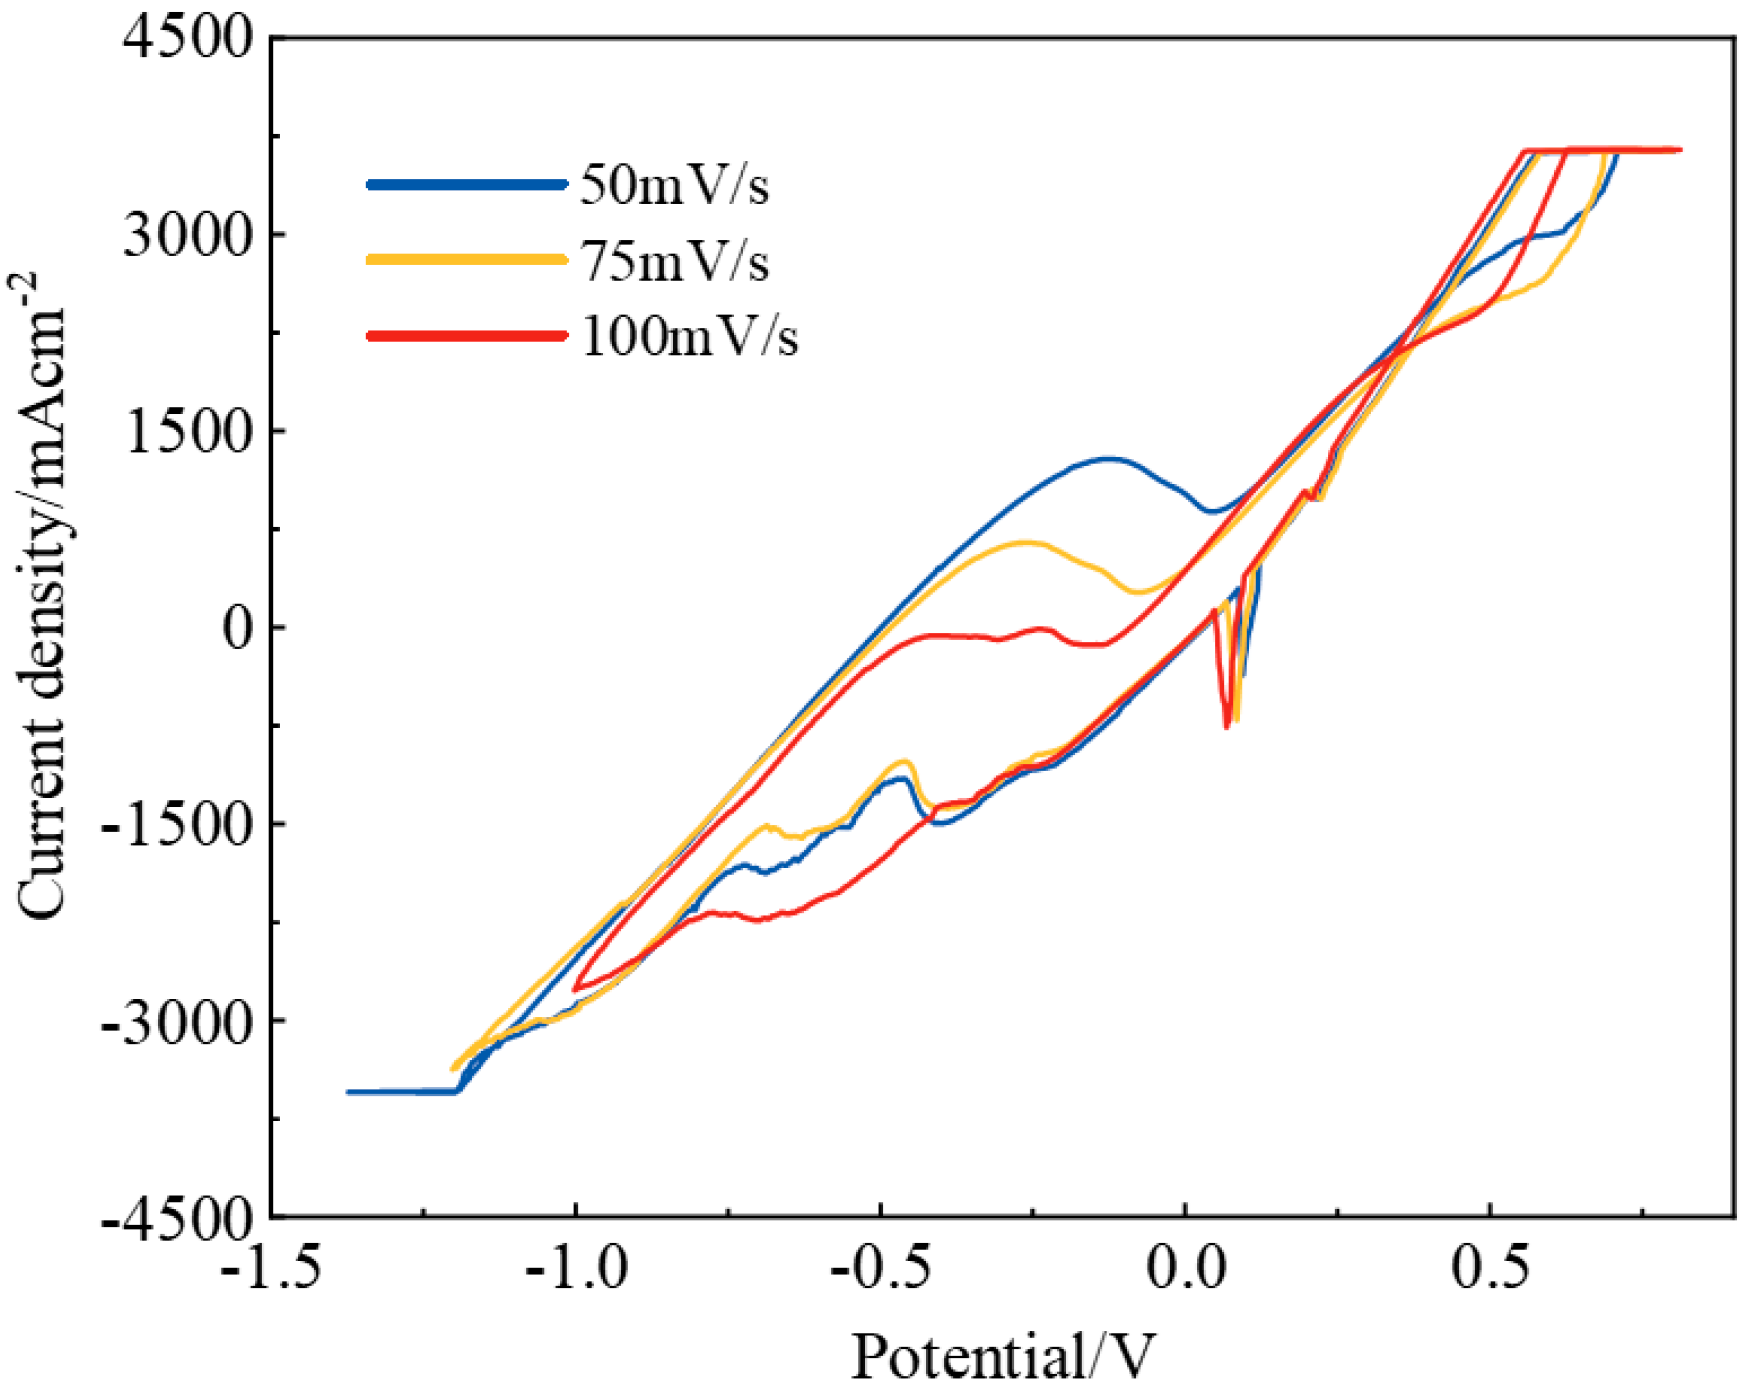
Figure 5.
Relationship between the reduction peak A potential and the logarithm of the scan rate in the NaF–Na3AlF6–2 wt% Nb2O5 molten salt system.
Figure 5.
Relationship between the reduction peak A potential and the logarithm of the scan rate in the NaF–Na3AlF6–2 wt% Nb2O5 molten salt system.
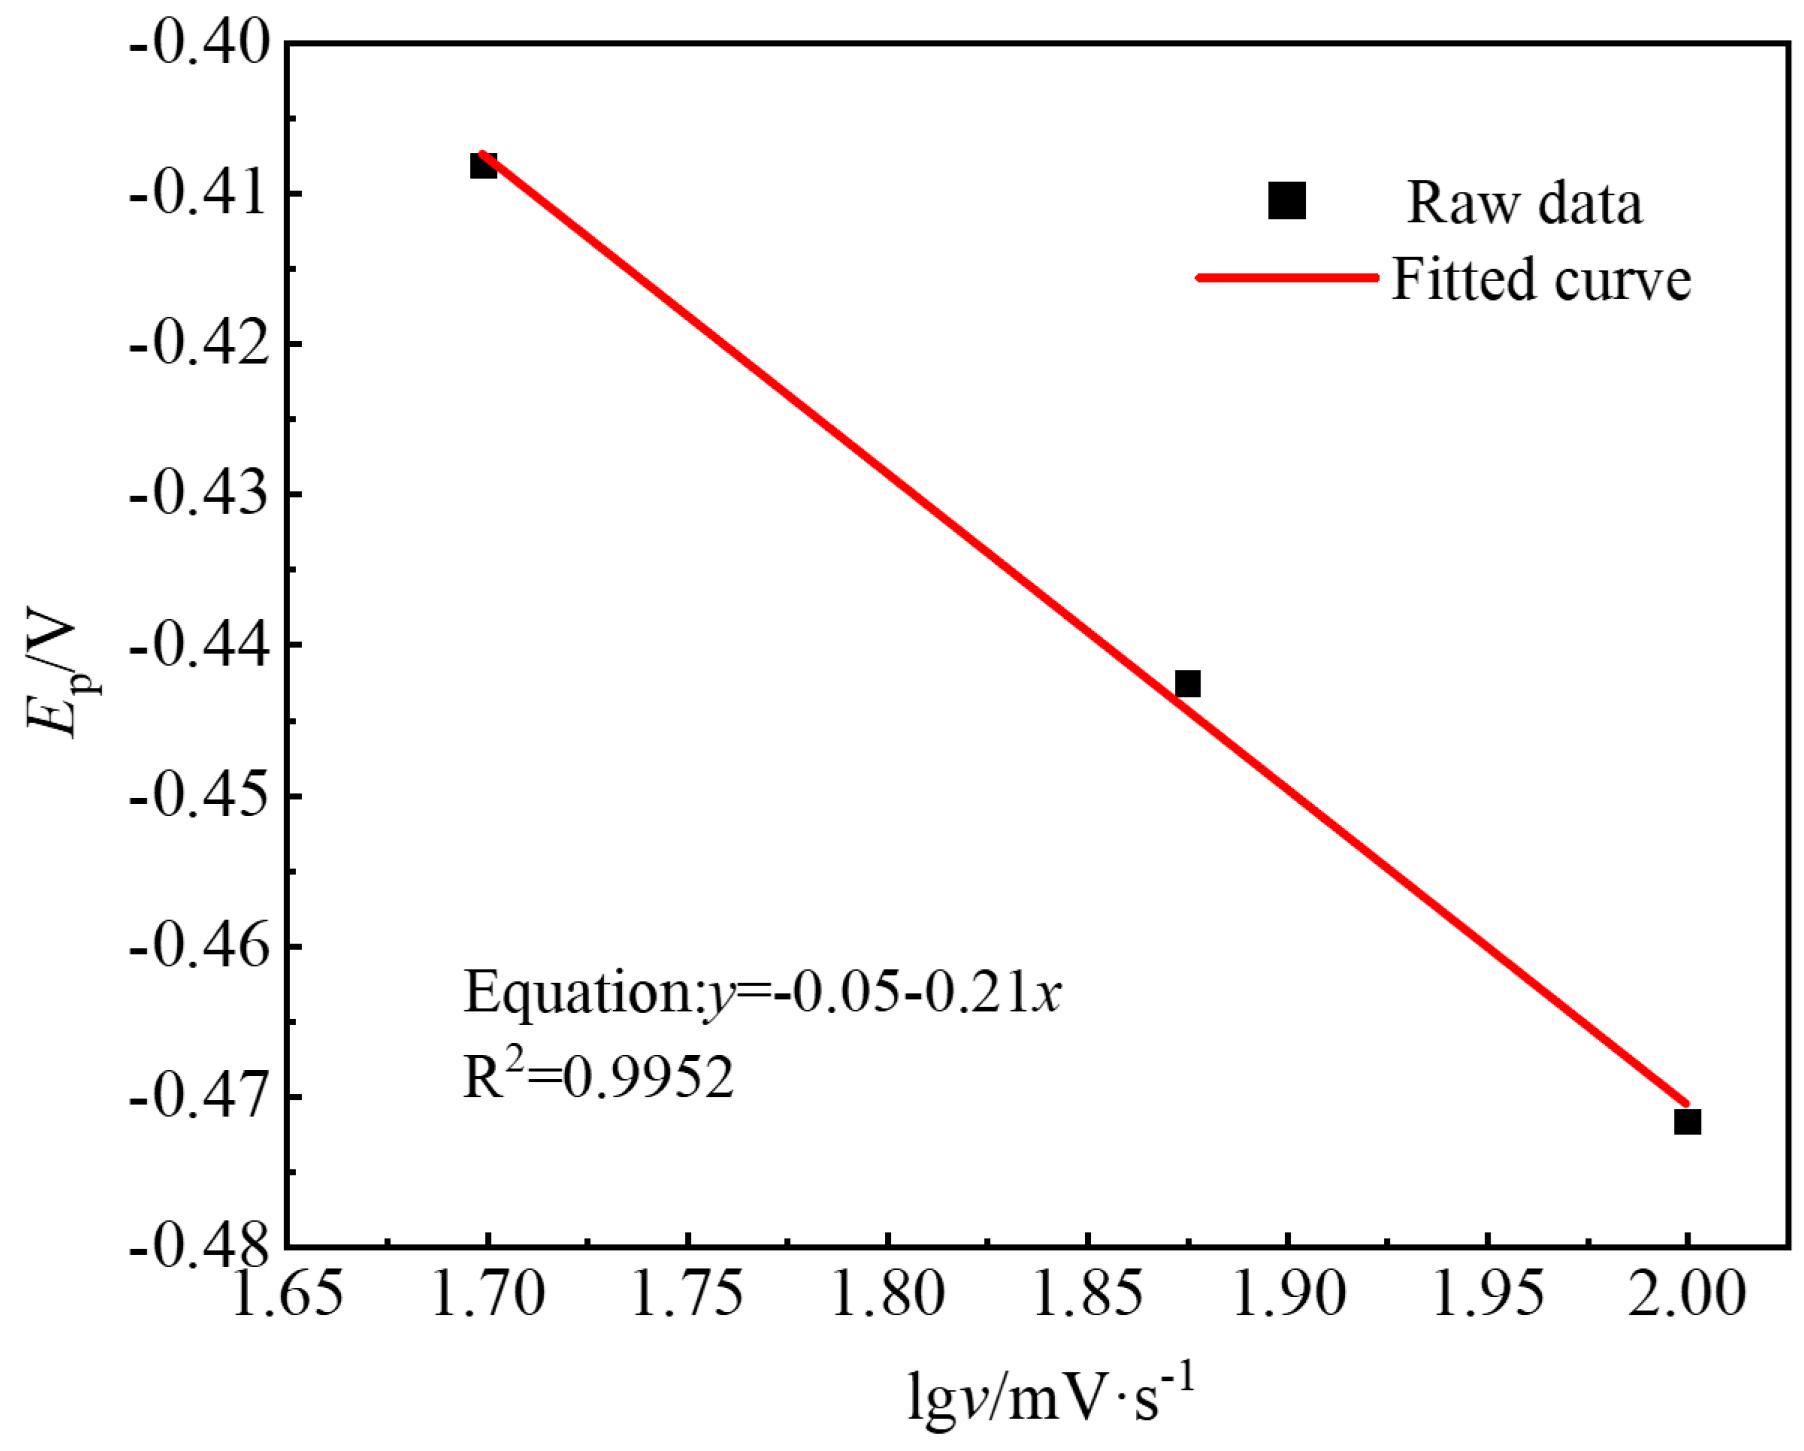
Figure 6.
Relationship between the reduction peak A current density and the square root of the scan rate in the NaF–Na3AlF6–2 wt% Nb2O5 molten salt system.
Figure 6.
Relationship between the reduction peak A current density and the square root of the scan rate in the NaF–Na3AlF6–2 wt% Nb2O5 molten salt system.
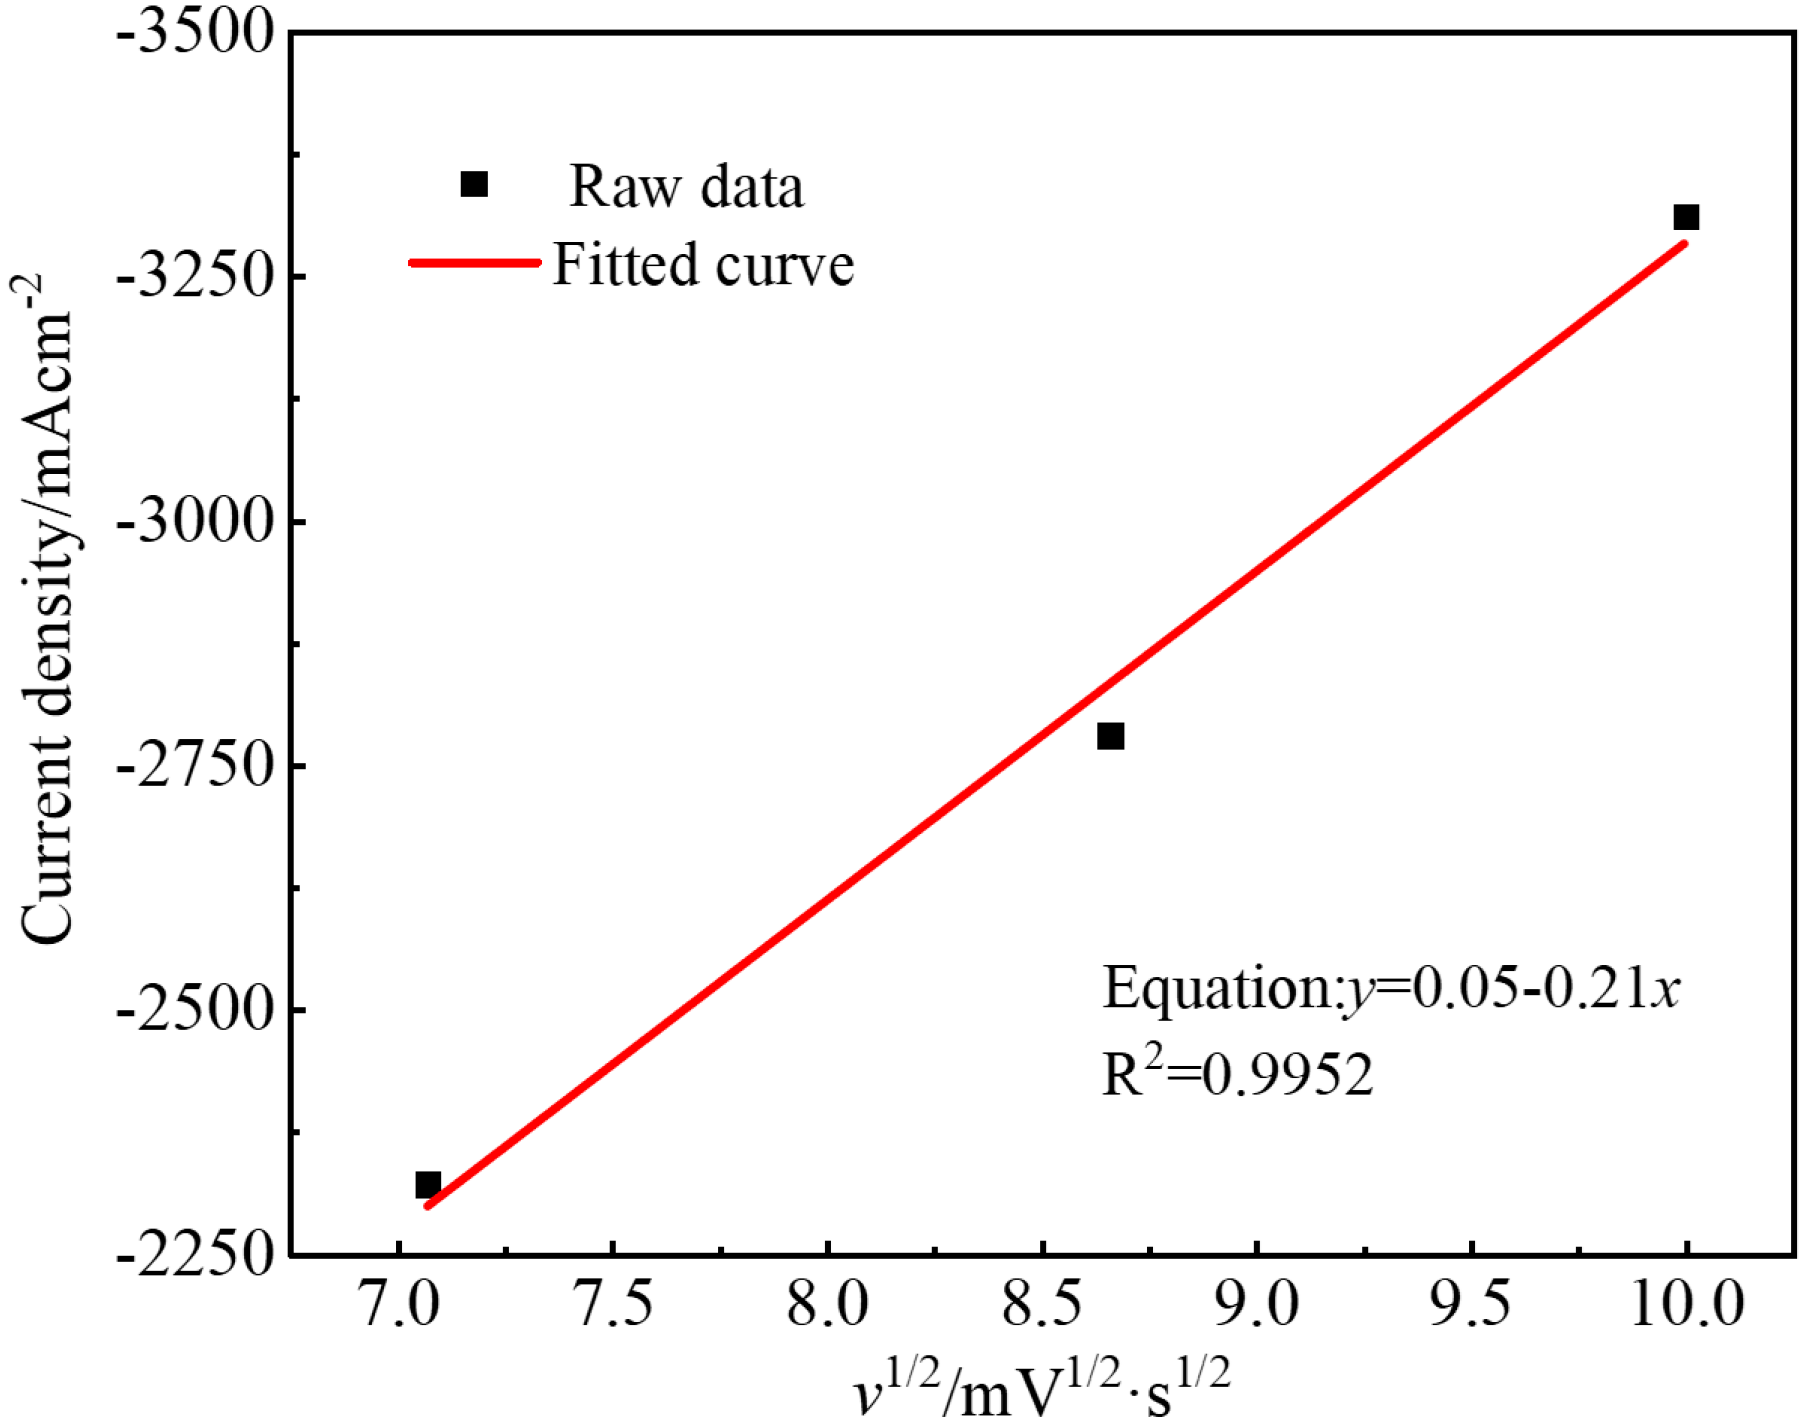
Figure 7.
Square wave voltammetry curve of the NaF–Na3AlF6–2 wt% Nb2O5 molten salt system on the Mo electrode (frequency: 25 Hz; temperature: 1223 K).
Figure 7.
Square wave voltammetry curve of the NaF–Na3AlF6–2 wt% Nb2O5 molten salt system on the Mo electrode (frequency: 25 Hz; temperature: 1223 K).

Figure 8.
Cyclic voltammetry curve of the NaF–Na3AlF6–2 wt% TiO2 molten salt system on the Mo electrode (scan rate: 50 mV/s; temperature: 1223 K).
Figure 8.
Cyclic voltammetry curve of the NaF–Na3AlF6–2 wt% TiO2 molten salt system on the Mo electrode (scan rate: 50 mV/s; temperature: 1223 K).
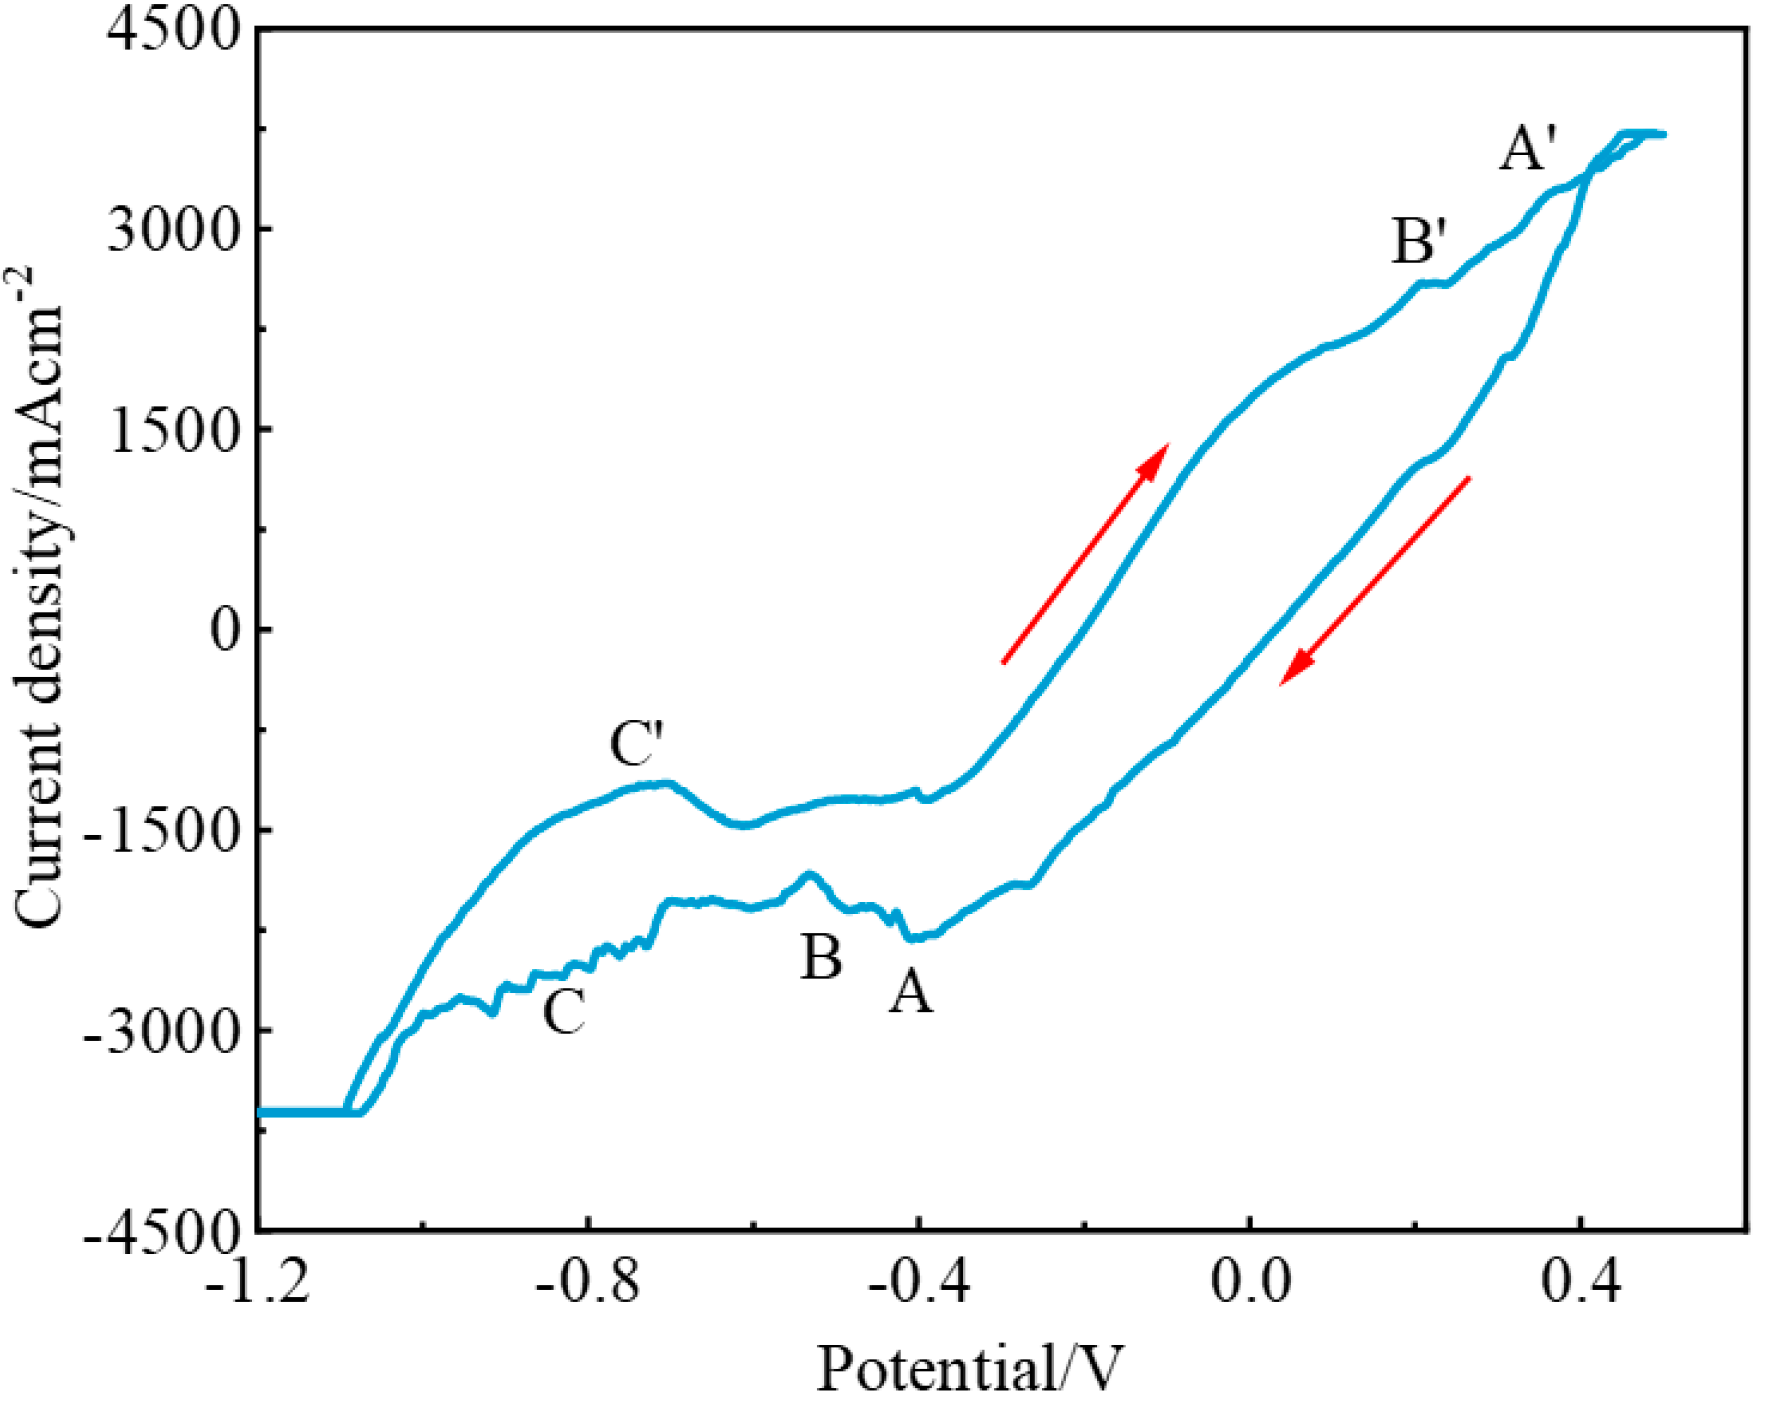
Figure 9.
Cyclic voltammetry curves of the NaF–Na3AlF6–2 wt% TiO2 molten salt system at different scan rates (scan rate: 50 mV/s, 75 mV/s, and 100 mV/s; temperature: 1223 K).
Figure 9.
Cyclic voltammetry curves of the NaF–Na3AlF6–2 wt% TiO2 molten salt system at different scan rates (scan rate: 50 mV/s, 75 mV/s, and 100 mV/s; temperature: 1223 K).

Figure 10.
Relationship between the reduction peak A potential and the logarithm of the scan rate in the NaF–Na3AlF6–2 wt% TiO2 molten salt system.
Figure 10.
Relationship between the reduction peak A potential and the logarithm of the scan rate in the NaF–Na3AlF6–2 wt% TiO2 molten salt system.

Figure 11.
Relationship between the reduction peak A current density and the square root of the scan rate in the NaF–Na3AlF6–2 wt% TiO2 molten salt system.
Figure 11.
Relationship between the reduction peak A current density and the square root of the scan rate in the NaF–Na3AlF6–2 wt% TiO2 molten salt system.

Figure 12.
Square wave voltammetry curve of the NaF–Na3AlF6–2 wt% TiO2 molten salt system on the Mo electrode (frequency: 25Hz; temperature: 1223K).
Figure 12.
Square wave voltammetry curve of the NaF–Na3AlF6–2 wt% TiO2 molten salt system on the Mo electrode (frequency: 25Hz; temperature: 1223K).
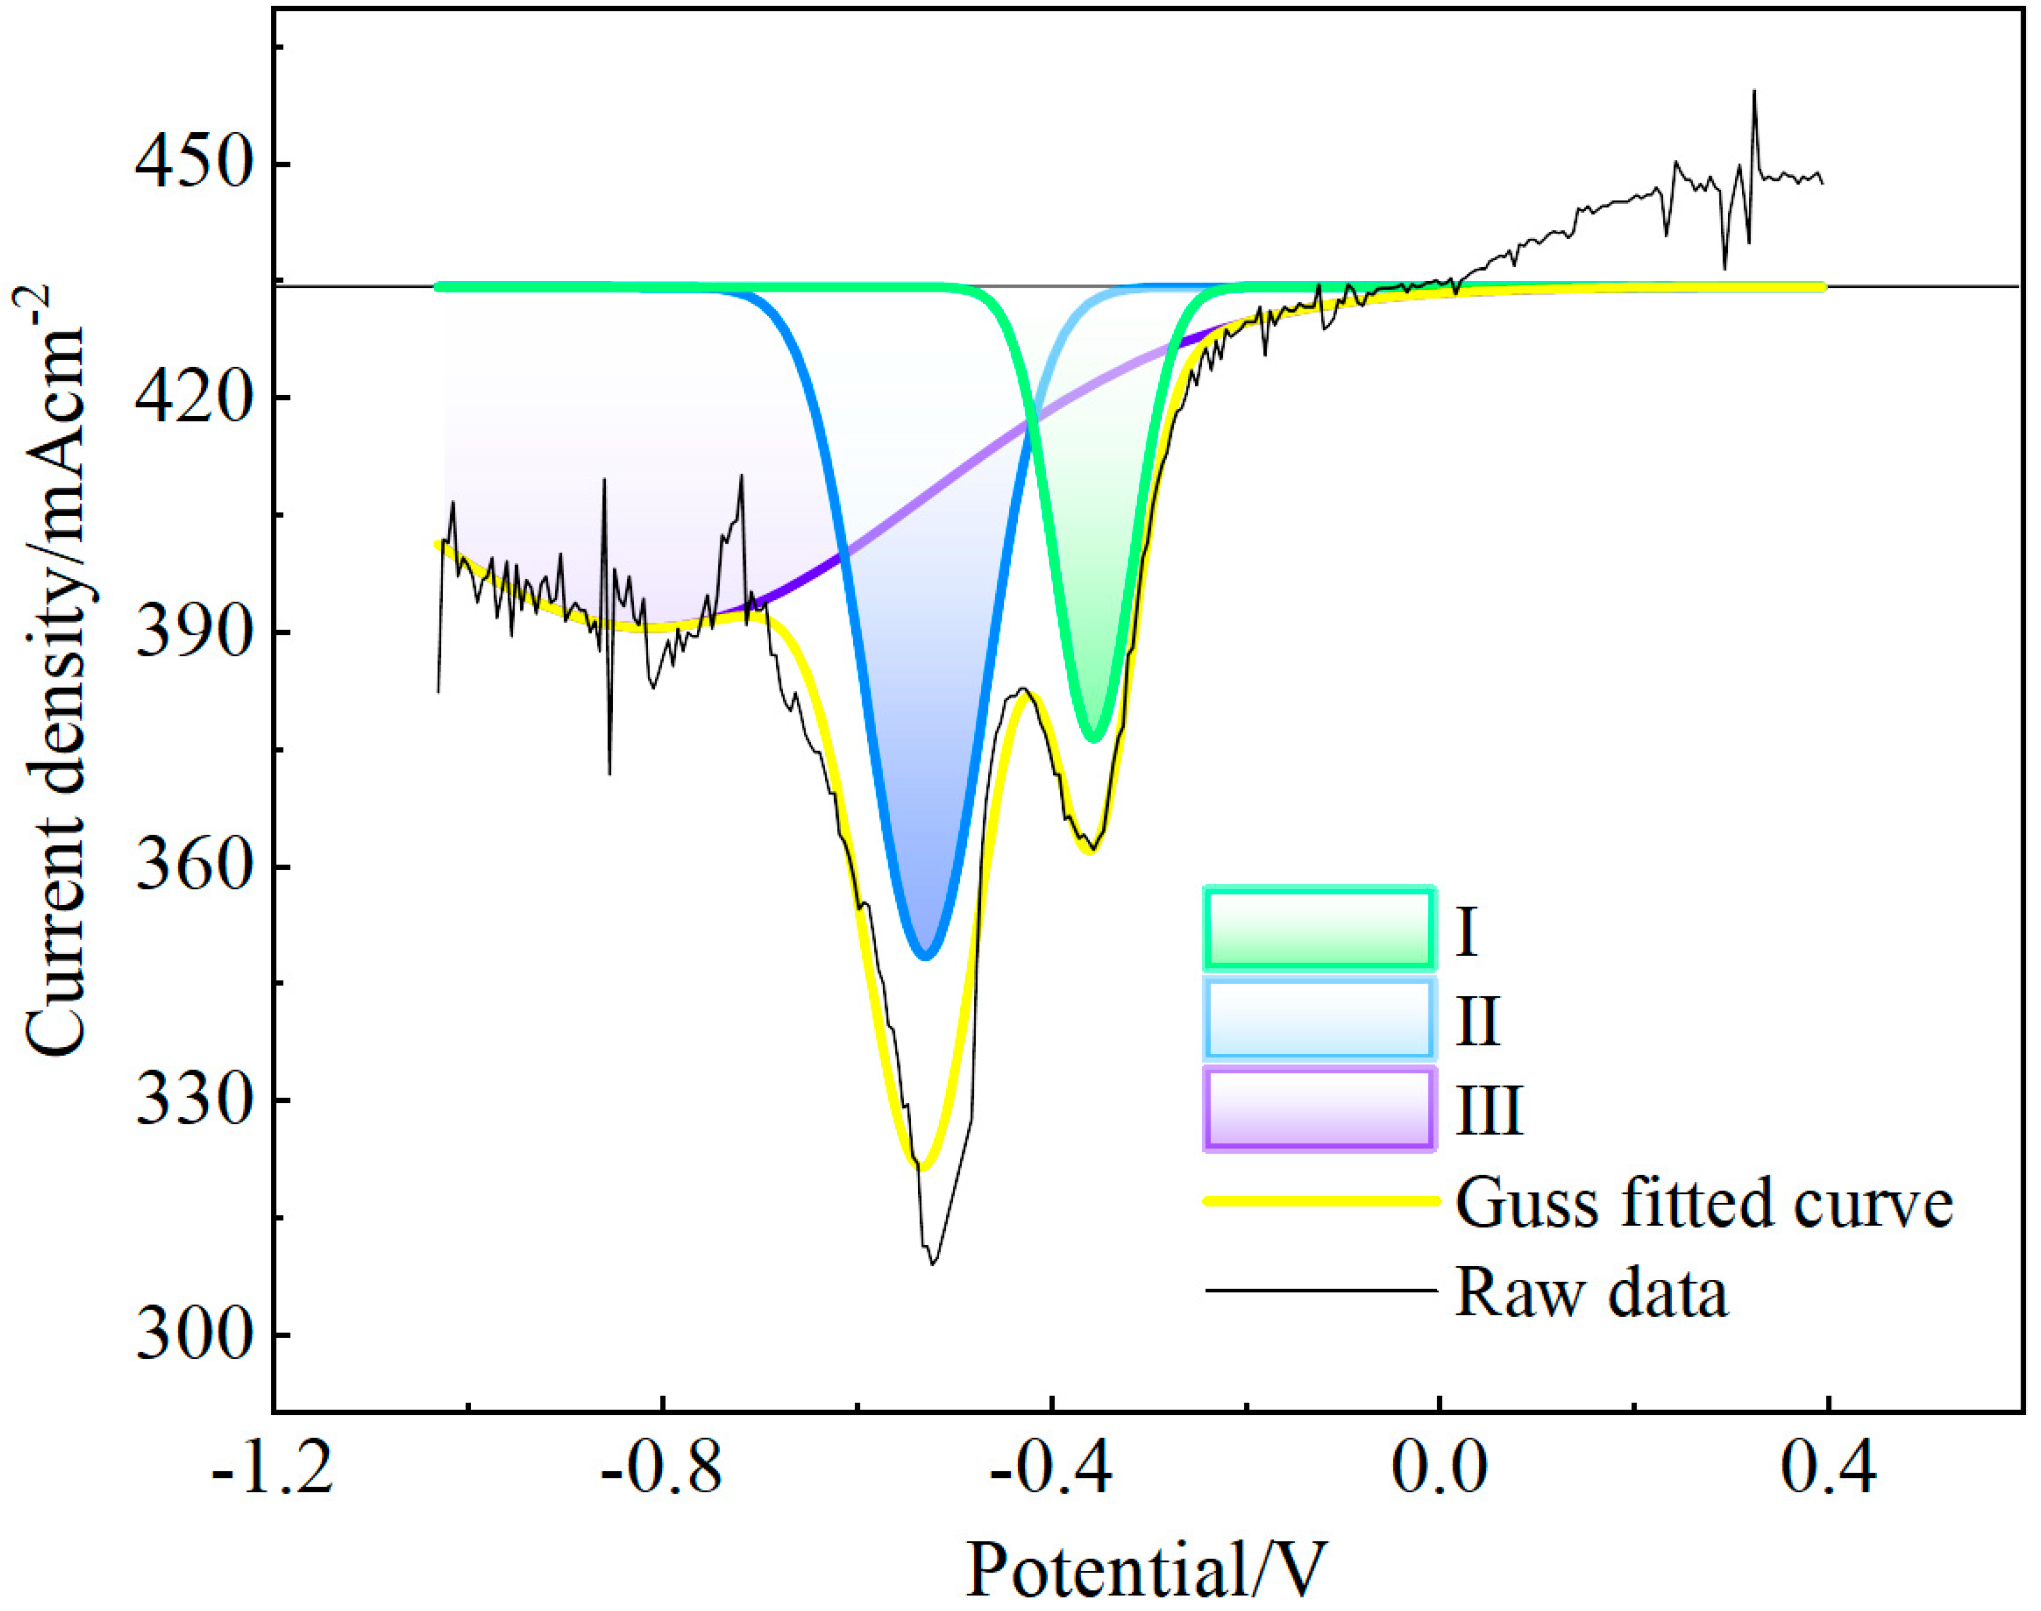
Figure 13.
Cyclic voltammetry curve of the NaF–Na3AlF6–2 wt% Nb2O5–2 wt% TiO2 molten salt system (scan rate: 50mV/s; temperature: 1223K).
Figure 13.
Cyclic voltammetry curve of the NaF–Na3AlF6–2 wt% Nb2O5–2 wt% TiO2 molten salt system (scan rate: 50mV/s; temperature: 1223K).


Table 1.
Experimental scheme.
| Electrolyte System | Test Method | Scan Rate |
|---|---|---|
| NaF–Na3AlF6 | CV | 50 mV/s |
| NaF–Na3AlF6–2 wt% Nb2O5 | CV, SWV | 50 mV/s, 75 mV/s, 100 mV/s |
| NaF–Na3AlF6–2 wt% TiO2 | CV, SWV | 50 mV/s, 75 mV/s, 100 mV/s |
| NaF–Na3AlF6–2 wt% Nb2O5–2 wt% TiO2 | CV | 50 mV/s |
Table 2.
Reduction processes and corresponding reduction potentials of Nb2O5 and TiO2 in different molten salts.
Table 2.
Reduction processes and corresponding reduction potentials of Nb2O5 and TiO2 in different molten salts.
| Reduction Process | Reduction Potential | ||
|---|---|---|---|
| NaF–Na3AlF6– 2 wt% Nb2O5 | NaF–Na3AlF6– 2 wt% TiO2 | NaF–Na3AlF6– 2 wt% Nb2O5–2 wt% TiO2 | |
| Nb (Ⅴ)→Nb (Ⅳ) | 0.09 V | – | −0.07 V |
| Ti (Ⅳ)→Ti (Ⅰ) | – | −0.43 V | −0.43 V |
| Nb (Ⅳ)→Nb (Ⅰ) | −0.38 V | – | −0.46 V |
| Nb (Ⅰ)→Nb | −0.68 V | – | −0.64 V |
| Ti (Ⅰ)→Ti | – | −0.84 V | −0.77 V |
Disclaimer/Publisher’s Note: The statements, opinions and data contained in all publications are solely those of the individual author(s) and contributor(s) and not of MDPI and/or the editor(s). MDPI and/or the editor(s) disclaim responsibility for any injury to people or property resulting from any ideas, methods, instructions or products referred to in the content. |
© 2024 by the authors. Licensee MDPI, Basel, Switzerland. This article is an open access article distributed under the terms and conditions of the Creative Commons Attribution (CC BY) license (https://creativecommons.org/licenses/by/4.0/).
Share and Cite
MDPI and ACS Style
Zhang, B.; Yu, S.; Liang, Y.; Jiang, M. Electrochemical Behavior of Niobium Oxide and Titanium Oxide in NaF–Na3AlF6 Molten Salt. Metals 2024, 14, 297. https://doi.org/10.3390/met14030297
AMA Style
Zhang B, Yu S, Liang Y, Jiang M. Electrochemical Behavior of Niobium Oxide and Titanium Oxide in NaF–Na3AlF6 Molten Salt. Metals. 2024; 14(3):297. https://doi.org/10.3390/met14030297
Chicago/Turabian StyleZhang, Bo, Shuiqing Yu, Yudong Liang, and Maofa Jiang. 2024. "Electrochemical Behavior of Niobium Oxide and Titanium Oxide in NaF–Na3AlF6 Molten Salt" Metals 14, no. 3: 297. https://doi.org/10.3390/met14030297
Note that from the first issue of 2016, this journal uses article numbers instead of page numbers. See further details here.