
CO–H2 Gas-Based Reduction Behavior of Cr-Rich Electroplating Sludge Mixed with Iron Ore Powder

School of Minerals Processing and Bioengineering, Central South University, Changsha 410083, China
*
Author to whom correspondence should be addressed.
Metals 2024, 14(3), 325; https://doi.org/10.3390/met14030325
Submission received: 22 January 2024
/
Revised: 21 February 2024
/
Accepted: 22 February 2024
/
Published: 12 March 2024
(This article belongs to the Special Issue Recovery and Utilization of Metallurgical Solid Wastes)
Abstract
:Cr-rich electroplating sludge (CRES) is a complicated solid waste with high contents of chromium and iron. It can be used as a main feed of the FINEX ironmaking process, which requires gas-based reduction before smelting reduction to produce molten iron with the proper addition of iron ore powder. In this study, the CO–H2 gas-based reduction behavior of CRES mixed with iron ore powder was evaluated between 700 °C and 850 °C, with a focus on the variations of key components containing Fe, Cr, and S with reduction temperature and time. It was found that the iron oxides in CRES had stepwise conversions to metallic iron as the reduction reaction proceeded. The iron metallization degree of the mixture of CRES and iron ore powder increased obviously below 750 °C and then grew minorly with the further increase of temperature. Moreover, this index varied similarly with an extension of reduction time up to 80 min. After reduction at 750 °C for 60 min with the volume concentration of H2 of 30% and flow rate of 160 mL/min, the iron metallization degree reached 79.08%. The rate in the process was limited by a chemical reaction with an activation energy of 41.32 kJ/mol. Along with the stepwise reduction of iron oxides to metallic iron, the chromium hydroxide and sulfates in CRES were reduced to Cr2O3 and sulfites and sulfides, respectively.
1. Introduction
Electroplating sludge is a hazardous waste generated in the electroplating industry with complex compositions [1,2]. Its improper disposal in landfills may cause serious problems, such as contamination of soil and groundwater, which will affect the health of animals and plants via chemical cycles and food [3]. After chromium in the sludge migrates to the environment, it may oxidize into highly toxic hexavalent chromium [4]. Moreover, as the waste usually has more abundant multiple valuable metals, such as chromium and iron, than natural minerals, its direct disposal in landfills will waste these resources [5]. Hence, it is urgent to seek suitable methods for processing of electroplating sludge.
Currently, the main methods for recycling electroplating sludge include functional materials preparation [6,7], hydrometallurgical processing [8,9], and pyrometallurgical processing [10,11,12]. In the area of preparation of functional materials, electroplating sludge has been used to prepare catalysts with high conversion percentage (8.6%) and high selectivity (73.3%) for formaldehyde production [6] and battery materials with high reversible coulomb efficiency (>99%) [7]. Electroplating sludge was also used for the preparation of flocculants [13], adsorbents [14], and pigments [15]. In the area of hydrometallurgy, valuable metals from the sludge are separated using various approaches, including extraction [8,9], adsorption [16], selective chlorination roasting and water immersion [17], and bioleaching [18,19]. Although the recoveries of valuable metals are generally above 90%, many hydrometallurgical processes suffer from long processing time and difficult treatment of wastewater.
Compared with the reports on the preparation of functional materials and hydrometallurgical processing, there were few reports on the pyrometallurgical processing of electroplating sludge. A previous study showed that after a two-stage carbothermic reduction process at 1200 °C, various valuable metals in the sludge were successfully recovered [10]. In specific, 90.77% of Pb, 95.14% of Sn, and 99.92% of Zn were recovered in the reduction flue gas and 96.40% of Cu and 85.00% of Ni were enriched in the resulting anode copper plate, which could be used for producing electrolytic copper. At higher temperatures, such as 1500 °C, electroplating sludge could be melted together with copper slag and waste cathode carbon to extract valuable metals. It was demonstrated that 75.56% of Cr, 98.41% of Ni, and 99.25% of Cu were recovered without the formation of highly toxic slag because the concentrations of Cr, Cu, F, and Ni in the leachate of slag were only 0.57 mg/L, 4.45 mg/L, 1.52 mg/L, and 1.85 mg/L, respectively [11]. Most recently, Cr-rich electroplating sludge (CRES) was employed for producing Fe–Cr–Si alloy at 1550 °C with recovery percentages of 98.9% for Cr and 98.7% for Fe by silicothermic reduction [12]. The sludge was also used for the production of molten matte, achieving recovery percentages of over 90% for both Cu and Ni, despite only about 10% for Fe [20,21]. In addition, efficient extraction of valuable metals from the sludge could be achieved through chlorination and volatilization below 1000 °C. Specifically, more than 93% of Cu and Ni were extracted, despite only 31% of Cr [22,23].
Considering the high contents of chromium (>30%) and iron (>4%) in CRES, it has the potential to be used for producing chromium-containing molten iron to replace high-carbon ferrochrome alloy for manufacturing stainless steel [24]. The traditional blast furnace (BF) ironmaking process is not suitable for this purpose as the sludge has an extremely high moisture content, up to 60 wt% [25], and a small particle size, which pose a great difficulty in its agglomeration before BF smelting.
Among non-BF ironmaking processes, the FINEX process can use powdered raw materials directly for ironmaking via gas-based reduction followed by smelting [26,27]. It uses a multi-stage fluidized bed to complete the preliminary reduction process between 400 °C and 800 °C using the gas containing 22.2 vol% H2, 2.3 vol% H2O, 65.3 vol% CO, and 10.2 vol% CO2. By modifying the composition of CRES via adding iron ore powder for reduction at a comparable temperature to that of the FINEX process, chromium-containing molten iron is expected to be obtained after smelting. Obviously, the reduction performance of the mixture of CRES and iron ore powder is crucial. From this perspective, the CO–H2 gas-based reduction behavior of CRES mixed with iron ore powder was explored for the first time in this study, with an emphasis on the effects of reduction temperature and time.
2. Experimental Section
2.1. Raw Materials
The main raw materials in this study included CRES, iron ore power, and a few additives. The CRES sample was obtained from a Cr(VI)-containing wastewater purification plant using sodium pyrosulfite (Na2S2O5), sodium hydroxide (NaOH), and other additives. The chemical composition of CRES after drying is shown in Table 1. The sludge contained two primary heavy metals, namely Cr and Fe, accounting for over 98% of heavy metals. Note that it had low contents of gangue oxides (CaO, MgO, Al2O3, and SiO2). For successful slagging after gas-based reduction, it was necessary to increase their contents properly, which could be easily achieved by controlling the composition of the mixture of raw materials for reduction.
The particle size distribution of CRES is shown in Table 2. It can be seen that the sludge was mainly concentrated in the particle size range 0.5–1 mm, within the required range 0.2–1 mm in the FINEX process [26].
The phase composition of CRES is shown in Figure 1. According to its X-ray diffraction (XRD) pattern, CRES had a very low crystallinity, as described in the literature [28]. The main crystalline phases of CRES were found to be CrO(OH) and Cr(OH)3∙3H2O. According to the previous study [29], it also contained minor amounts of Cr2O3, Fe(OH)2, Fe(OH)3, CaSO3, and CaSO4. The microstructure of CRES was characterized by scanning electron microscopy (SEM), as shown in Figure 1. It was clear that CRES consisted of particles with different sizes. Note that a large number of small particles accumulated on the surfaces of large particles.
The iron ore powder was taken from the sintering plant of Baoshan Iron & Steel Co., Ltd. in Shanghai, China. The as-received iron ore powder was screened manually to ensure a particle size close to that of CRES before determination of chemical composition and particle size distribution, as summarized in Table 3 and Table 4, respectively. It had the iron content (TFe) of 59.59 wt% and FeO content of only 2.82 wt%. Its particle size was mainly distributed in the range 0.15–0.5 mm, which was a little smaller than that of CRES, meeting the size requirement of the FINEX process [26].
The XRD and SEM image of iron ore powder are shown in Figure 2. The iron ore powder was mainly constituted by hematite, with small amounts of goethite, magnetite, and silica, in agreement with its chemical composition analysis in Table 3. Like CRES, the iron ore powder was constituted by particles with variable sizes. Many fine particles were found to adhere to the surfaces of large ones.
Except CRES and iron ore powder, a flux constituted by 43 wt% CaO, 36 wt% SiO2, 8 wt% MgO, and 13 wt% Al2O3 was prepared by adding chemical reagents. It was used because the feed composition should be close to the requirement of the FINEX process to guarantee subsequent smelting performance although the present study only focused on the gas-based reduction stage.
2.2. Experimental Procedure
After the sample was prepared by mixing CRES, iron ore powder, and flux, its gas-based reduction experiments were conducted in a horizontal tube furnace (OTF-1200X, Hefei Kejing Materials Technology Co., Ltd., Hefei, China). The tube furnace was equipped with a quartz tube (outer diameter: 50 mm and wall thickness: 3 mm) and a set of electronic gas mass flowmeter with an accuracy of 1 mL/min, as shown in Figure 3. When the tube furnace was heated to the given reduction temperature at a ramp rate of 10 °C/min in N2, in each test, 10 g of the sample—containing 3.270 g of dried CRES, 5.811 g of iron ore powder, 0.492 g of CaO, 0.266 g of SiO2, 0.083 g of MgO, and 0.078 g of Al2O3—was loaded into the furnace. After the gas was switched to a mixed reducing gas containing both H2 and CO with the concentration required by the FINEX process [26], the reduction process was started. After its completion, the reduction products were cooled in N2 for determination of properties.
2.3. Characterizations
For analysis of the reduction process, the variations of standard Gibbs free energy changes of possible reactions of the components of CRES with temperature and the Cr–Fe binary phase diagram were calculated using the software FactSage 8.0 (Thermfact/CRCT, Montreal, Canada and GTT-Technologies, Aachen, Germany). The thermodynamic analysis of the decomposition reaction of chromium hydroxide was carried out using HSC Chemistry 9 with relevant thermodynamic data. The methods for determination of chemical compositions of CRES and the reduction products included chemical titration, nephelometry (for Cl), and inductively coupled plasma spectroscopy (ICP-AES, AVIO 500, PerkinElmer, Waltham, MA, USA, and ICP-AAS, Pinaade 900T, PerkinElmer, Waltham, MA, USA). The total iron content and metallic iron content in the reduction products were determined by the potassium dichromate titration method according to the Chinese National Standard Test Methods GB/T 6730.5-2022 [30] and GB/T 38812.2-2020 [31]. The iron metallization degree was calculated using the equation as follows:
where ηFe is the iron metallization degree, %; TFe is the total iron content, wt%; and MFe is the metallic iron content, wt%. The phase compositions, chemical valences, and microstructures of the reduction products were determined by XRD (D8 ADVANCE, Brooke Corporation, Werther, Germany), XPS (Nexsa, Thermo Fisher Scientific, Brno, Czech Republic), and SEM (MIRA LMS, TESCAN, Brno, Czech Republic), respectively.
2.4. Kinetic Calculations
The reduction fractions of the samples were calculated using the following equation:
where X is the reduction fraction, dimensionless, and ηFe,max is the maximum iron metallization degree obtained in this study, %. Ignoring the reduction reactions other than FeO in the iron ore, the reaction equilibrium constant k (mol/s) of chemical reaction model could be determined by
where r0 is radius of iron ore particles, which is about 2.5 × 10⁻⁴ m; ρB is the density of iron ore particles, which is 3.947 × 10³ kg/m3; b is the stoichiometric number, dimensionless; t is the time, s; cA is the concentration of reducing gas, which is 22,400 mol/m3; MB is the mass of iron ore particles corresponding to 1 mol of reactant, which is 0.094 kg; and δ is the slope of the fitted line, dimensionless.
3. Results and Discussion
3.1. Thermodynamic Calculations
The possible reactions of the main components of CRES and the variations of corresponding standard Gibbs free energy changes with temperature during the reduction process are shown in Table 5 and Figure 4. In view of the variations of standard Gibbs free energy changes with temperature, it was found that CrO(OH) and Cr(OH)3∙3H2O will decompose easily to Cr2O3 upon heating, which, however, cannot be reduced by CO or H2 below 1100 °C. As expected, the iron oxides are transformed to wüstite and then metallic iron, depending on the reduction temperature. For sulfates and sulfites, they can be reduced to sulfides at proper temperatures.
To determine the proper addition of iron ore powder for the reduction of CRES, the Cr–Fe binary phase diagram was calculated, as shown in Figure 5. Considering the initial decrease and then increase of the melting point of ferrochromium alloy with increasing proportion of chromium, to ensure a low melting point and relatively high chromium content of the reduction product, the proper mass ratio of Fe/(Fe + Cr) for reduction was found to be 0.25. Correspondingly, the mass ratio of CRES to iron ore powder was 0.56.
To determine the proper temperature range and reducing gas composition for the reduction of CRES, the gas-phase equilibrium diagram concerning the reduction of iron oxides using CO and H2 was calculated, as shown in Figure 6. When the temperature increased, the reduction potential required for CO and H2 to reduce FeO showed an opposite changing trend. By referring to the reduction conditions of the FINEX fluidized bed, the temperature range for this study was selected to be 700–850 °C [27]. Within this temperature range, the average reduction potential required for CO reduction was lower than that for H2 reduction. By considering this finding and preliminary experimental results, the reducing gas composed of mainly CO and auxiliary H2 with the volume ratio of 7/3 (i.e., 30 vol% H2) was chosen for the subsequent reduction. This ratio was close to the technical parameters of the FINEX process.
3.2. Effects of Temperature and Time on the Gas-Based Reduction Behavior
The effects of reduction temperature and time on the iron metallization degree of the reduction product were investigated and the results are shown in Figure 7. It was evident that the reduction temperature significantly affected the reduction process when the temperature increased from 700 °C to 750 °C. With further increase of temperature to 850 °C, there were only minor growths of iron metallization degree. It was also found that the effect of the reduction temperature depended on the reduction progress. In the first 10 min, the iron metallization degrees remained very low after reduction at all temperatures and there was no evident influence of reduction temperature. It indicated pretty limited reduction in the examined temperature range. When the time increased from 10 min to 40 min, the iron metallization degree increased significantly. By further increasing the time to over 60 min, the iron metallization degree increased slightly. Considering the required metallization degree with energy conservation, the suitable temperature was chosen to be 750 °C. After reduction at this temperature for 60 min, the iron metallization degree reached 79.08%, within the standard range 70–85% in the FINEX process [27].
To further explore the reduction process, the experimental results were fitted with different kinetic models, namely diffusion-controlled model (plot of 1 − 3(1 − X)2/3 + 2(1 − X) vs. time), chemical reaction-controlled model (plot of 1 − (1 − X)1/3 vs. time), and mixed diffusion-chemical-reaction-controlled model (plot of a[1 − 3(1 − X)2/3 + 2(1 − X)] + b[1 − (1 − X)1/3] vs. time where a and b are non-negative constants). As shown in Figure 7, the chemical reaction-controlled model had the best fitting results for the experimental data. In other words, the rate was limited by chemical reaction during the reduction process in the temperature range. In the first 10 min, the main product of the reduction reaction was wüstite, so the experimental data at 10 min and 20 min were smaller than those on the fitted curve. After calculation using the well-known Arrhenius equation, the activation energy for the reduction process was found to be 41.32 kJ/mol, as shown in Figure 8.
When the temperature was 750 °C and the time was 60 min, the weight loss of the sample was 23.6 wt%. The chemical composition of the product is shown in Table 6. After comparison with the compositions of raw materials, it was found that the chromium content increased significantly to 15.26 wt%, which would be favorable to the production of chromium-containing molten iron by subsequent smelting. Unlike chromium, the iron content decreased minorly, mainly attributed to the addition of iron ore powder and flux for reduction. In addition, there were no evident losses of S, Zn, and Pb.
In order to clarify the phase transformation in the reduction process of CRES and iron ore powder, the XRD patterns of the reduction products obtained at different temperatures for variable time are shown in Figure 9 and Figure 10. It was observed that the peak intensity of metallic iron and Cr2O3 increased clearly when the reduction temperature increased from 700 °C to 750 °C. The significant decrease of the diffraction peaks between 18.201° and 19.981° indicated that most of CrO(OH) and Cr(OH)3∙3H2O had decomposed to Cr2O3 [32,33]. According to the thermodynamic calculation results, the residual diffraction peaks should not belong to CrO(OH) or Cr(OH)3∙3H2O. With continuous increase of temperature to 850 °C, there were no evident changes, agreeing with the changing trend of iron metallization degree in Figure 7. Considering the influence of reduction time when the temperature was maintained at 750 °C, it was demonstrated that some iron oxides were converted to magnetite and wüstite in the first 10 min. No metallic iron was found, except a bit of Cr2O3. The findings were consistent with the low iron metallization degree of the product in the initial reduction stage. When the reduction time was extended to 20 min, magnetite disappeared. Instead, metallic iron and more Cr2O3 were formed. With further extension of the time, the diffraction peaks of metallic iron became stronger, indicating better reduction performance in the later reduction stage. The decomposition reactions of CrO(OH) and Cr(OH)3∙3H2O mainly occurred within 40 min, which corresponded to the variation of crystallinity degree of the product.
In the reduction process, the chemical valences of chromium and sulfur should be taken into consideration. Figure 11 shows the XPS spectra of the chromium and sulfur of the products obtained by reduction at different temperatures. The peak at 576.4–576.5 eV (Cr2p3/2) and 585.5–585.9 eV (Cr2P1/2) in Figure 11a was related to Cr2O3. It was confirmed that CrO(OH) and Cr(OH)3∙3H2O decomposed to Cr2O3 during the reduction process, reducing the binding energy of the Cr–O bond, which was beneficial for subsequent smelting. When the temperature increased from 750 °C to 800 °C, the binding energy of the Cr–O bond increased by 0.1 eV, indicating higher activity of Cr2O3 with increasing temperature. According to the XPS spectra of sulfur, as shown in Figure 11b, it was deduced that the sulfates in CRES were converted to sulfites or sulfides after reduction. When the temperature increased from 700 °C to 750 °C, the peak intensity of the S2p3/2 orbital related to sulfites (166.6–167.0 eV) increased significantly, while that related to sulfides (161.2–161.7 eV) decreased. It revealed that when the temperature changed from 700 °C to 750 °C, there existed a greater effect of temperature on the generation of sulfites than sulfides. When the temperature increased from 750 °C to 850 °C, there was no significant change in the peak intensity of the S2P3/2 orbital related to sulfates, sulfites, and sulfides, showing little effect of reduction temperature on the generation of sulfites and sulfides within the temperature range. The binding energy of S2p3/2 related to sulfides increased with temperature, indicating better stability of sulfides at higher temperatures.
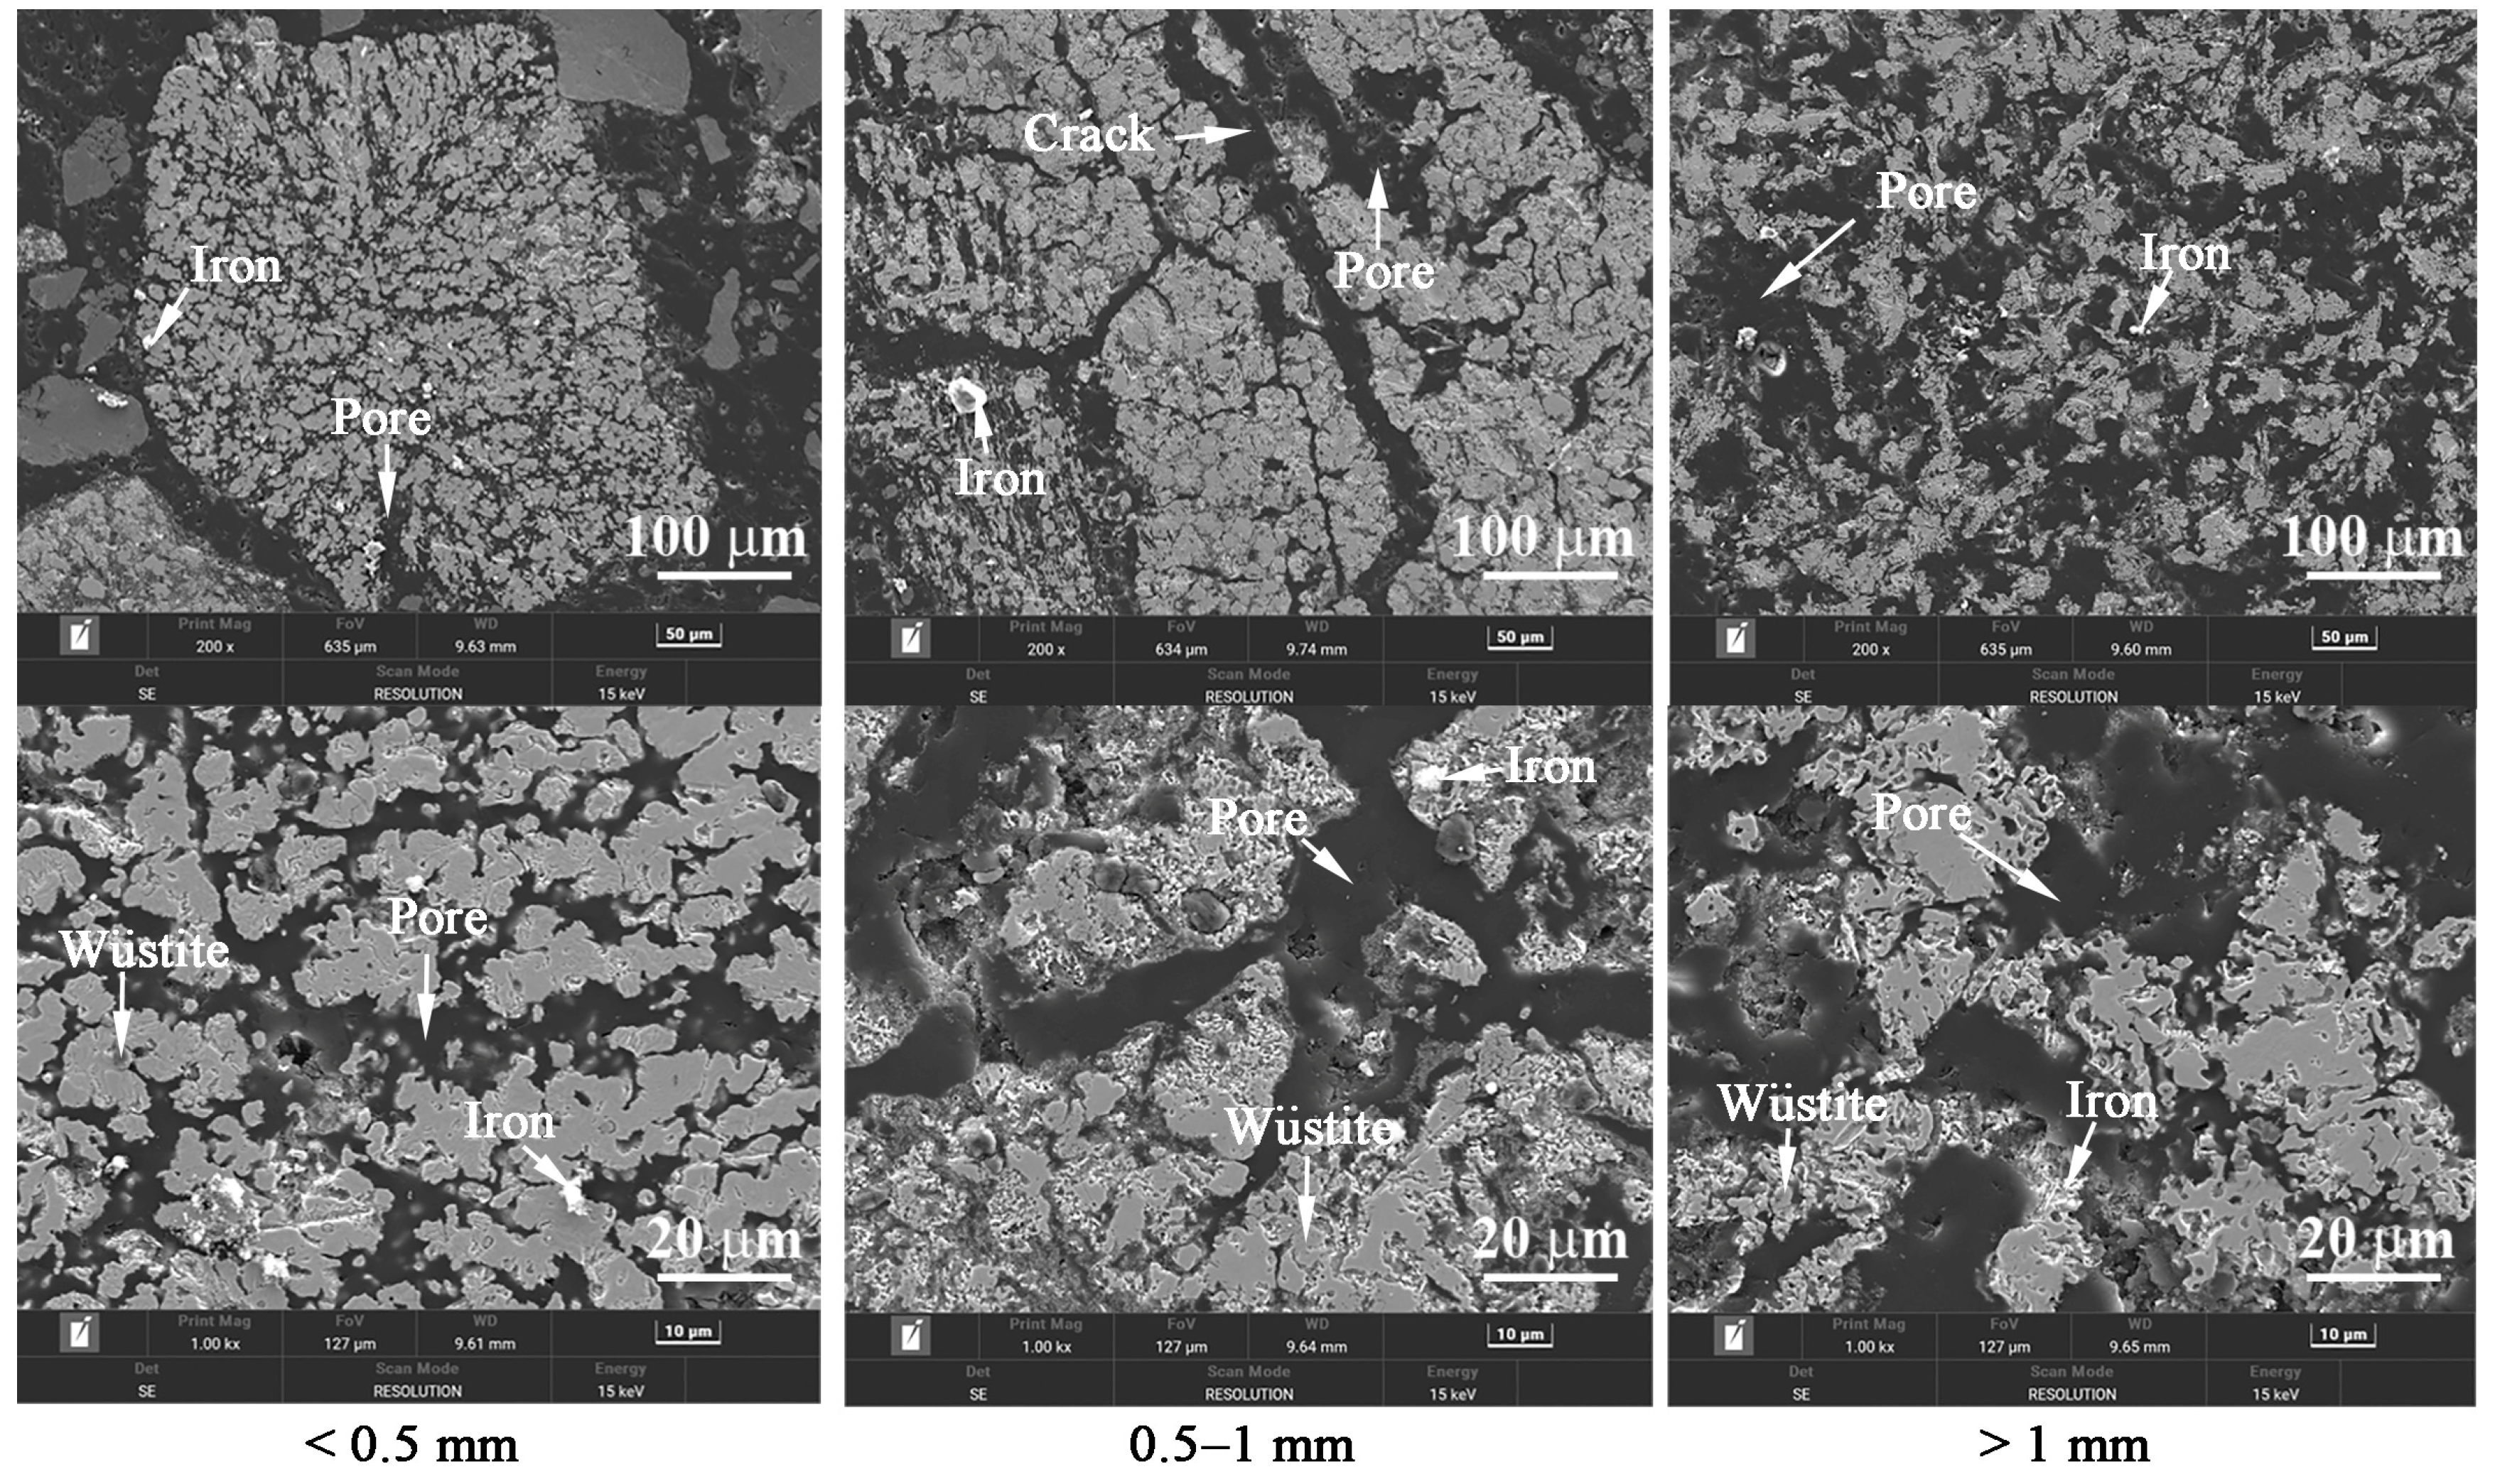
The microstructures of the products obtained by reduction at different temperatures are shown in Figure 12, Figure 13, Figure 14 and Figure 15. The pores inside small product particles (<0.5 mm) corresponding to iron ore particles were well-developed and evenly distributed because small particles provided good kinetic conditions for the diffusion of gas reactants. Due to the low iron content (4.64 wt%) of CRES, no pores were observed in the reduced sample. For medium iron ore particles (0.5–1 mm), there existed numerous cracks because of the excessive stress due to limited gas diffusion. For large particles (>1 mm), there were larger pores with lower uniformity. As expected, when the particle size further increased, the internal stress of the particles increased. During the reduction process, most areas inside the iron ore particles underwent severe damage, producing larger pores. By comparing the microstructures at different temperatures, it was obvious that increasing temperature facilitated the generation of pores and cracks, which further promoted gas–solid reactions during the reduction process. The above changing trend of the microstructure agreed with those of the iron metallization degree and phase composition of the reduction product.
4. Conclusions
The CO–H2 gas-based reduction behavior of CRES mixed with iron ore powder was investigated in the temperature range from 700 °C to 850 °C. It was demonstrated that the reduction temperature significantly affected the reduction process. The iron metallization degree increased rapidly with the increase of temperature from 700 °C to 750 °C and then grew slowly with the further increase of temperature to 850 °C. This index increased significantly with the extension of the reduction time to 60 min, after which it changed slightly. It could reach 79.08% after reduction at 750 °C for 60 min with the volume concentration of H2 of 30% and flow rate of 160 mL/min. In the process, the reduction rate was limited by chemical reaction between 700 °C and 850 °C with an activation energy of 41.32 kJ/mol. The phase transformation analysis proved that the iron oxides in the CRES underwent stepwise reduction to magnetite, and then wüstite, and finally metallic iron, depending on both reduction temperature and time. The chromium hydroxide in CRES was converted to Cr2O3 after reduction, in agreement with the thermodynamic analysis. Increasing the reduction temperature could enhance the activity of Cr2O3. The sulfates in CRES were reduced to sulfites and sulfides. When the temperature increased from 700 °C to 750 °C, there existed a greater effect of temperature on the generation of sulfites than sulfides. When the temperature increased further to 850 °C, there was no evident effect of temperature on the formation of sulfites and sulfides. The rapid reduction of CRES mixed with iron ore powder was also attributed to the development of pores and cracks whose quantity increased with increasing temperature.
Author Contributions
Conceptualization, formal analysis, investigation, writing—original draft, visualization, J.Z.; resources, writing—review and editing, supervision, Z.P.; formal analysis, methodology, L.Y.; formal analysis, validation, M.R. All authors have read and agreed to the published version of the manuscript.
Funding
This work was partially supported by the Hunan Provincial Natural Science Foundation of China under Grant 2023JJ10073, the Fundamental Research Funds for the Central Universities of Central South University under Grant 2022zzts0426, and the China Baowu Low Carbon Metallurgy Innovation Foundation under Grant BWLCF202103.
Data Availability Statement
The raw data supporting the conclusions of this article will be made available by the authors on request.
Conflicts of Interest
The authors declare that they have no known competing financial interest or personal relationships that could have appeared to influence the work reported in this paper.
References
- Yue, Y.; Zhang, J.; Sun, F.; Wu, S.; Pan, Y.; Zhou, J.; Qian, G. Heavy metal leaching and distribution in glass products from the co-melting treatment of electroplating sludge and MSWI fly ash. J. Environ. Manag. 2019, 232, 226–235. [Google Scholar] [CrossRef] [PubMed]
- Wang, H.; Liu, X.; Zhang, Z. Approaches for electroplating sludge treatment and disposal technology: Reduction, pretreatment and reuse. J. Environ. Manag. 2023, 349, 119535. [Google Scholar] [CrossRef]
- Wang, Y.; Liu, Y.; Zhan, W.; Zheng, K.; Wang, J.; Zhang, C.; Chen, R. Stabilization of heavy metal-contaminated soils by biochar: Challenges and recommendations. Sci. Total Environ. 2020, 729, 139060. [Google Scholar] [CrossRef]
- Zhou, Z.; Zhang, L.; Yan, B.; Wu, J.; Kong, D.; Romanovski, V.; Ivanets, A.; Li, H.; Chu, S.; Su, X. Removal of chromium from electroplating sludge by roasting-acid leaching and catalytic degradation of antibiotics by its residue. J. Environ. Chem. Eng. 2023, 12, 111754. [Google Scholar] [CrossRef]
- Zhou, W.; Zhang, L.; Peng, J.; Ge, Y.; Tian, Z.; Sun, J.; Cheng, H.; Zhou, H. Cleaner utilization of electroplating sludge by bioleaching with a moderately thermophilic consortium: A pilot study. Chemosphere 2019, 232, 345–355. [Google Scholar] [CrossRef] [PubMed]
- Hou, H.; Xu, S.; Ding, S.; Lin, W.; Yu, Q.; Zhang, J.; Qian, G. Electroplating sludge-derived metal and sulfur co-doping catalyst and its application in methanol production by CO2 catalytic hydrogenation. Sci Total Environ. 2022, 838, 156032. [Google Scholar] [CrossRef] [PubMed]
- Wu, S.; Ke, Y.; Tang, J.; Lei, X.; Deng, H.; Lin, Z. Upcycling of electroplating sludge into Fe3C-decorated N,P dual-doped porous carbon via microalgae as efficient sulfur host for lithium-sulfur batteries. Surf. Interfaces 2022, 30, 101869. [Google Scholar] [CrossRef]
- Zhang, Y.; Su, T.; Chen, H.; Zhang, Y.; Geng, Z.; Zhu, S.; Xie, X.; Zhang, H.; Gao, Y.; Huo, Y. Stepwise recycling of Fe, Cu, Zn and Ni from real electroplating sludge via coupled acidic leaching and hydrothermal and extraction routes. Environ. Res. 2023, 216, 114462. [Google Scholar]
- Qu, Z.; Su, T.; Zhou, S.; Chen, Y.; Yu, Y.; Xie, X.; Yang, J.; Huo, M.; Bian, D. Stepwise extraction of Fe, Al, Ca, and Zn: A green route to recycle raw electroplating sludge. J. Environ. Manag. 2021, 300, 113700. [Google Scholar] [CrossRef]
- Tian, L.; Chen, L.; Gong, A.; Wu, X.; Cao, C.; Liu, M.; Chen, Z.; Xu, Z.; Liu, Y. Separation and extraction of valuable metals from electroplating sludge by carbothermal reduction and low-carbon reduction refining. JOM 2020, 72, 4149. [Google Scholar] [CrossRef]
- Yu, Y.; Wang, H.; Hu, J. Co-treatment of electroplating sludge, copper slag, and spent cathode carbon for recovering and solidifying heavy metals. J. Hazard. Mater. 2021, 417, 126020. [Google Scholar]
- Wang, H.; Jiao, S.; Zhang, G. Preparation of ferrosilicochromium by silicothermic reduction of Cr-bearing electroplating sludge. J. Sustain. Metall. 2023, 9, 303–313. [Google Scholar] [CrossRef]
- Chen, Y.; Zhang, Y.; Liu, Y.; Zhu, S.; Liang, D.; Sun, T.; Xie, X.; Wang, X. Resource utilization of hazardous Cr/Fe-rich sludge: Synthesis of erdite flocculant to treat real electroplating wastewater. J. Environ. Health Sci. Eng. 2022, 20, 509–519. [Google Scholar]
- Tran, T.H.; Tran, Q.M.; Le, T.V.; Pham, T.T.; Le, V.T.; Nguyen, M.K. Removal of Cu (II) by calcinated electroplating sludge. Heliyon 2022, 7, e07092. [Google Scholar] [CrossRef]
- Matović, L.; Vujasin, R.; Kumrić, K.; Krstić, S.; Wu, Y.; Kabtamu, D.M.; Devečerski, A. Designing of technological scheme for conversion of Cr-rich electroplating sludge into the black ceramic pigments of consistent composition, following the principles of circular economy. J. Environ. Chem. Eng. 2021, 9, 105038. [Google Scholar] [CrossRef]
- Wang, J.; Zhou, R.; Yu, J.; Wang, H.; Guo, Q.; Liu, K.; Chen, H.; Chi, R. Sequential recovery of Cu(II), Cr(III), and Zn(II) from electroplating sludge leaching solution by an on-line biosorption method with dosage controlling. J. Clean. Prod. 2022, 337, 130427. [Google Scholar] [CrossRef]
- Huang, Q.; Yu, Y.; Zheng, J.; Zhou, J.; Wu, Z.; Deng, H.; Wu, X.; Lin, Z. Understanding and controlling the key phase transformation for selective extracting Ni and Cu from Cr-containing electroplating sludge. Surf. Interfaces 2021, 24, 101090. [Google Scholar] [CrossRef]
- Tian, B.; Cui, Y.; Qin, Z.; Wen, L.; Li, Z.; Chu, H.; Xin, B. Indirect bioleaching recovery of valuable metals from electroplating sludge and optimization of various parameters using response surface methodology (RSM). J. Environ. Manag. 2022, 312, 114927. [Google Scholar] [CrossRef] [PubMed]
- Wu, P.; Zhang, L.; Lin, C.; Xie, X.; Yong, X.; Wu, X.; Zhou, J.; Jia, H.; Wei, P. Extracting heavy metals from electroplating sludge by acid and bioelectrical leaching using Acidithiobacillus ferrooxidans. Hydrometallurgy 2022, 191, 105225. [Google Scholar] [CrossRef]
- Wang, H.; Li, Y.; Jiao, S.; Zhang, G. Recovery of Cu-Fe-S matte from electroplating sludge via the sulfurization-smelting method. J. Environ. Chem. Eng. 2022, 10, 108266. [Google Scholar] [CrossRef]
- Xiao, H.; Chen, P.; Chen, L.; Zhang, D.; Liu, W.; Yang, T. Recovery of Cu and Ni in electroplating sludge by a low-temperature alkaline smelting technique. J. Sustain. Metall. 2022, 8, 1026–1040. [Google Scholar] [CrossRef]
- Yu, Y.; Ge, J.; Wu, Z.; Lin, J.; Zhu, Z.; Yang, Q.; Liu, X. One-step extraction of CuCl2 from Cu-Ni mixed electroplating sludge by chlorination-mineralization surface-interface phase change modulation. Surf. Interfaces 2023, 37, 102535. [Google Scholar] [CrossRef]
- Gong, J.; Tan, R.; Wang, B.; Wang, Z.; Gong, B.; Mi, X.; Deng, D.; Liu, X.; Liu, C.; Deng, C.; et al. Process and mechanism of strengthening chlorination cascade recovery of valuable metals from electroplating sludge. J. Clean. Prod. 2022, 376, 134330. [Google Scholar] [CrossRef]
- Shibata, E.; Egawa, S.; Nakamura, T. Reduction behavior of chromium oxide in molten slag using aluminum, ferrosilicon and graphite. ISIJ Int. 2002, 42, 609–613. [Google Scholar] [CrossRef]
- Guo, B.; Tan, Y.; Wang, L.; Chen, L.; Wu, Z.; Sasaki, K.; Mechtcherine, V.; Tsang, D.C.W. High-efficiency and low-carbon remediation of zinc contaminated sludge by magnesium oxysulfate cement. J. Hazard. Mater. 2021, 408, 124486. [Google Scholar] [CrossRef]
- Plaul, F.J.; Böhm, C.; Schenk, J.L. Fluidized-bed technology for the production of iron products for steelmaking. J. S. Afr. Inst. Min. Metall. 2009, 109, 121–128. [Google Scholar]
- Schenk, J.L. Recent status of fluidized bed technologies for producing iron input materials for steelmaking. Particuology 2011, 9, 14–23. [Google Scholar] [CrossRef]
- Ma, J.; Li, C.; Hu, L.; Kong, W.; Lu, Q.; Zhang, J. Structural regulation of electroplating sludge by a meta-organic framework synthesis method for an enhanced denitrification activity. J. Mater. Cycles Waste 2021, 23, 614–621. [Google Scholar] [CrossRef]
- Zhang, J.; Peng, Z.; Tian, R.; Tang, H.; Ye, L.; Rao, M.; Li, G. Assessment of thermal stability of chromium-rich electroplating sludge. J. Therm. Anal. Calorim. 2023, 148, 10335–10344. [Google Scholar] [CrossRef]
- GB/T 6730.5-2022; Iron Ores—Determination of Total Iron Content—Titrimetric Methods after Titanium (III) Chloride Reduction. Standardization Administration of the People’s Republic of China: Beijing, China, 2022.
- GB/T 38812.2-2020; Direct Reduced Iron—Determination of Metallic Iron Content—The Potassium Dichromate Titrimetric Method after Decomposition of Sample by Ferric Chloride. Standardization Administration of the People’s Republic of China: Beijing, China, 2020.
- Yang, J.; Martens, W.N.; Frost, R.L. Transition of chromium oxyhydroxide nanomaterials to chromium oxide: A hot-stage Raman spectroscopic study. J. Raman Spectrosc. 2010, 42, 1142–1146. [Google Scholar] [CrossRef]
- Huang, Z.; Chen, C.; Xie, J.; Wang, Z. The evolution of dehydration and thermal decomposition of nanocrystalline and amorphous chromium hydroxide. J. Anal. Appl. Pyrol. 2016, 118, 225–230. [Google Scholar] [CrossRef]
Figure 1.
(a) XRD pattern and (b) SEM image of CRES.
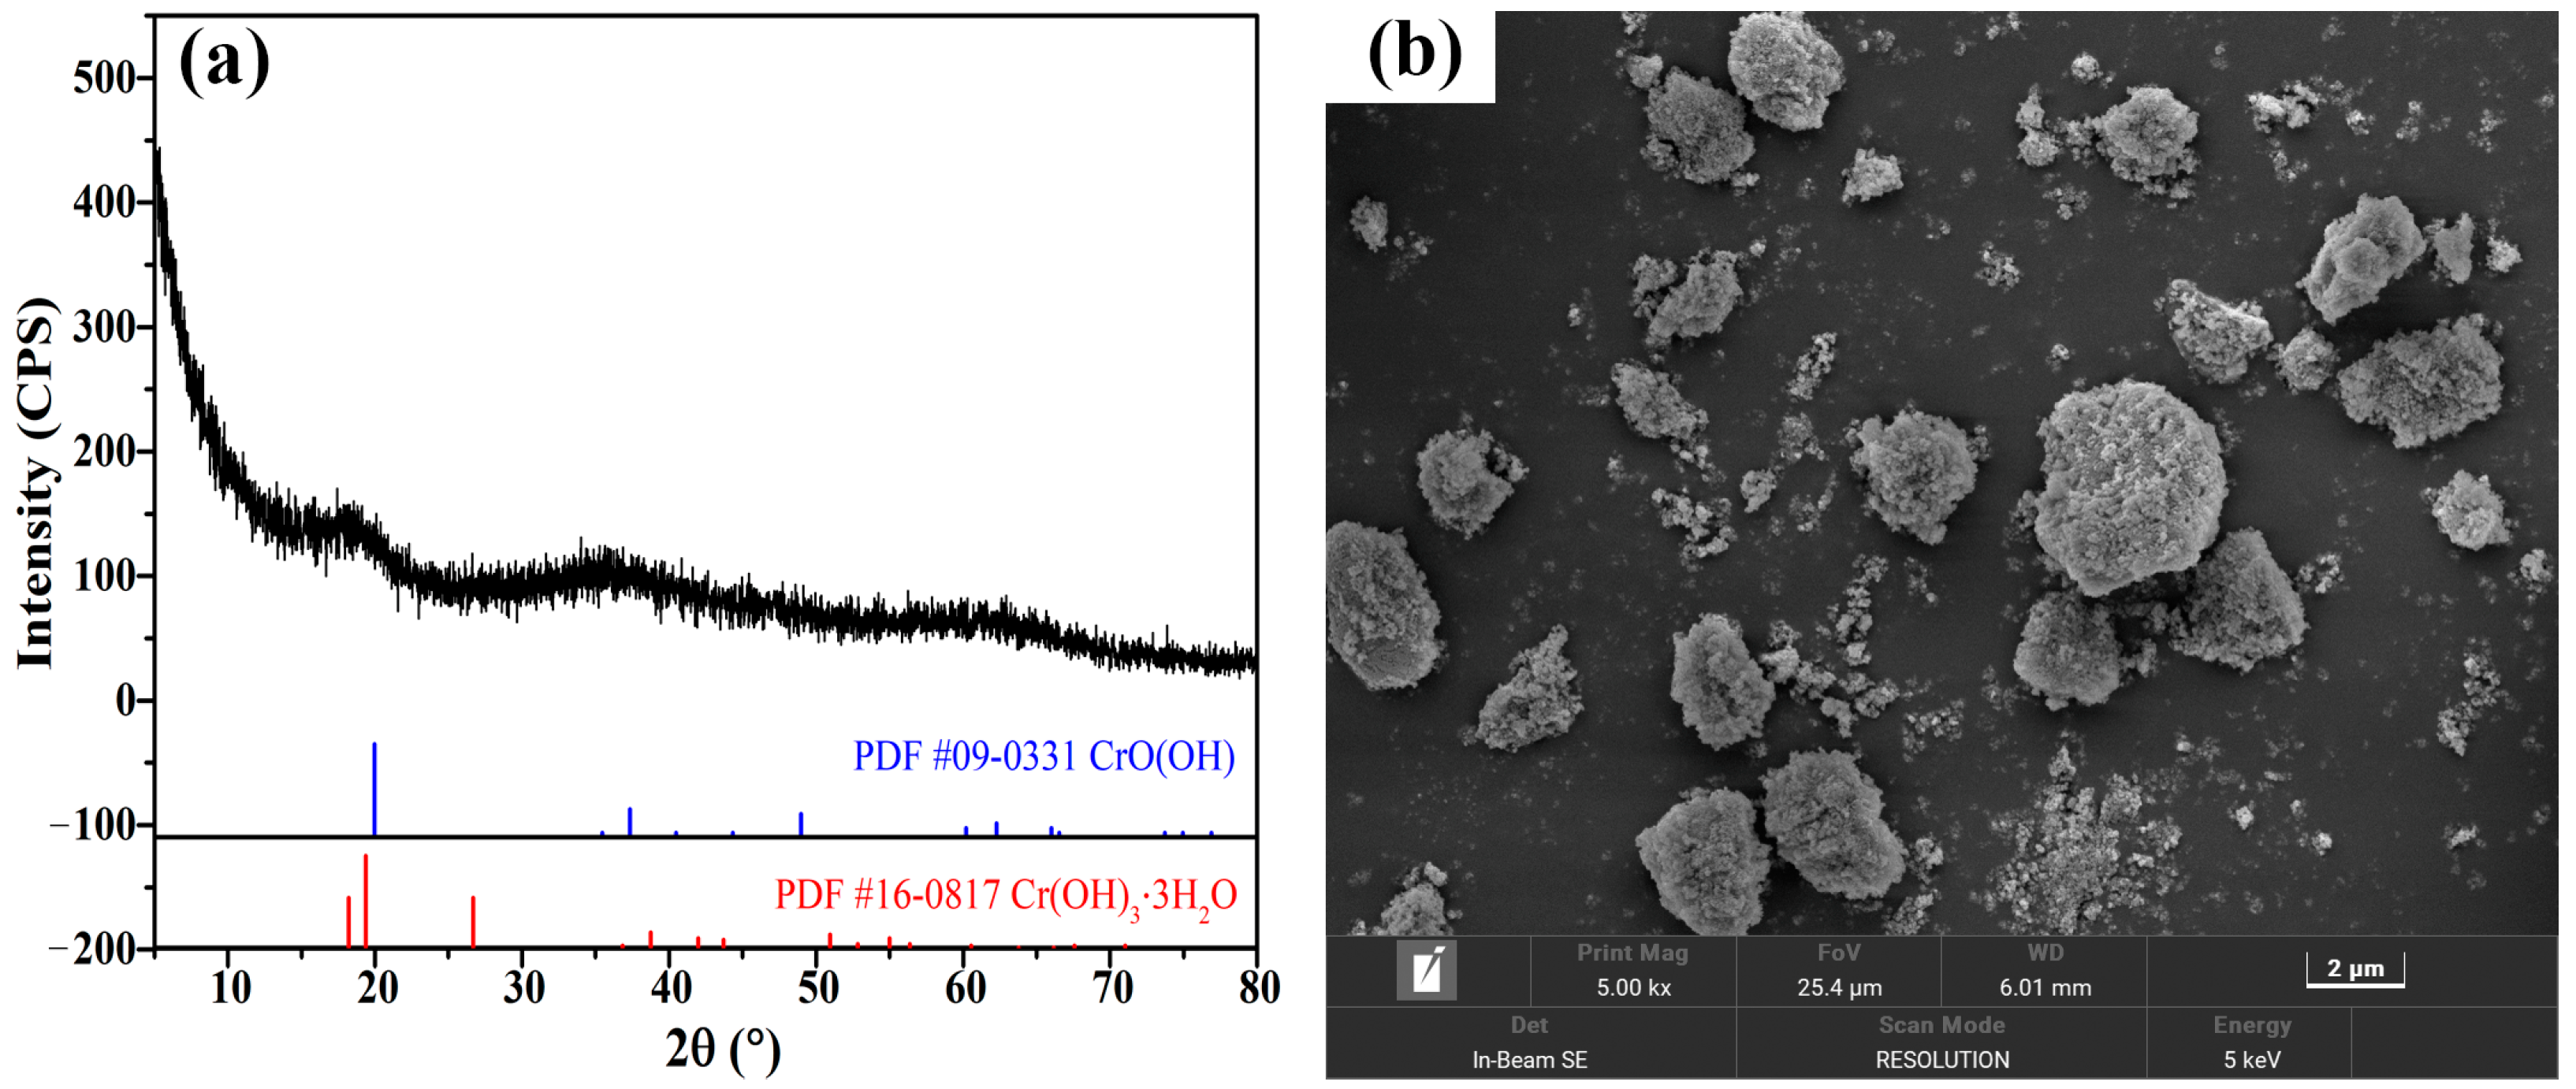
Figure 2.
(a) XRD pattern and (b) SEM image of iron ore powder.
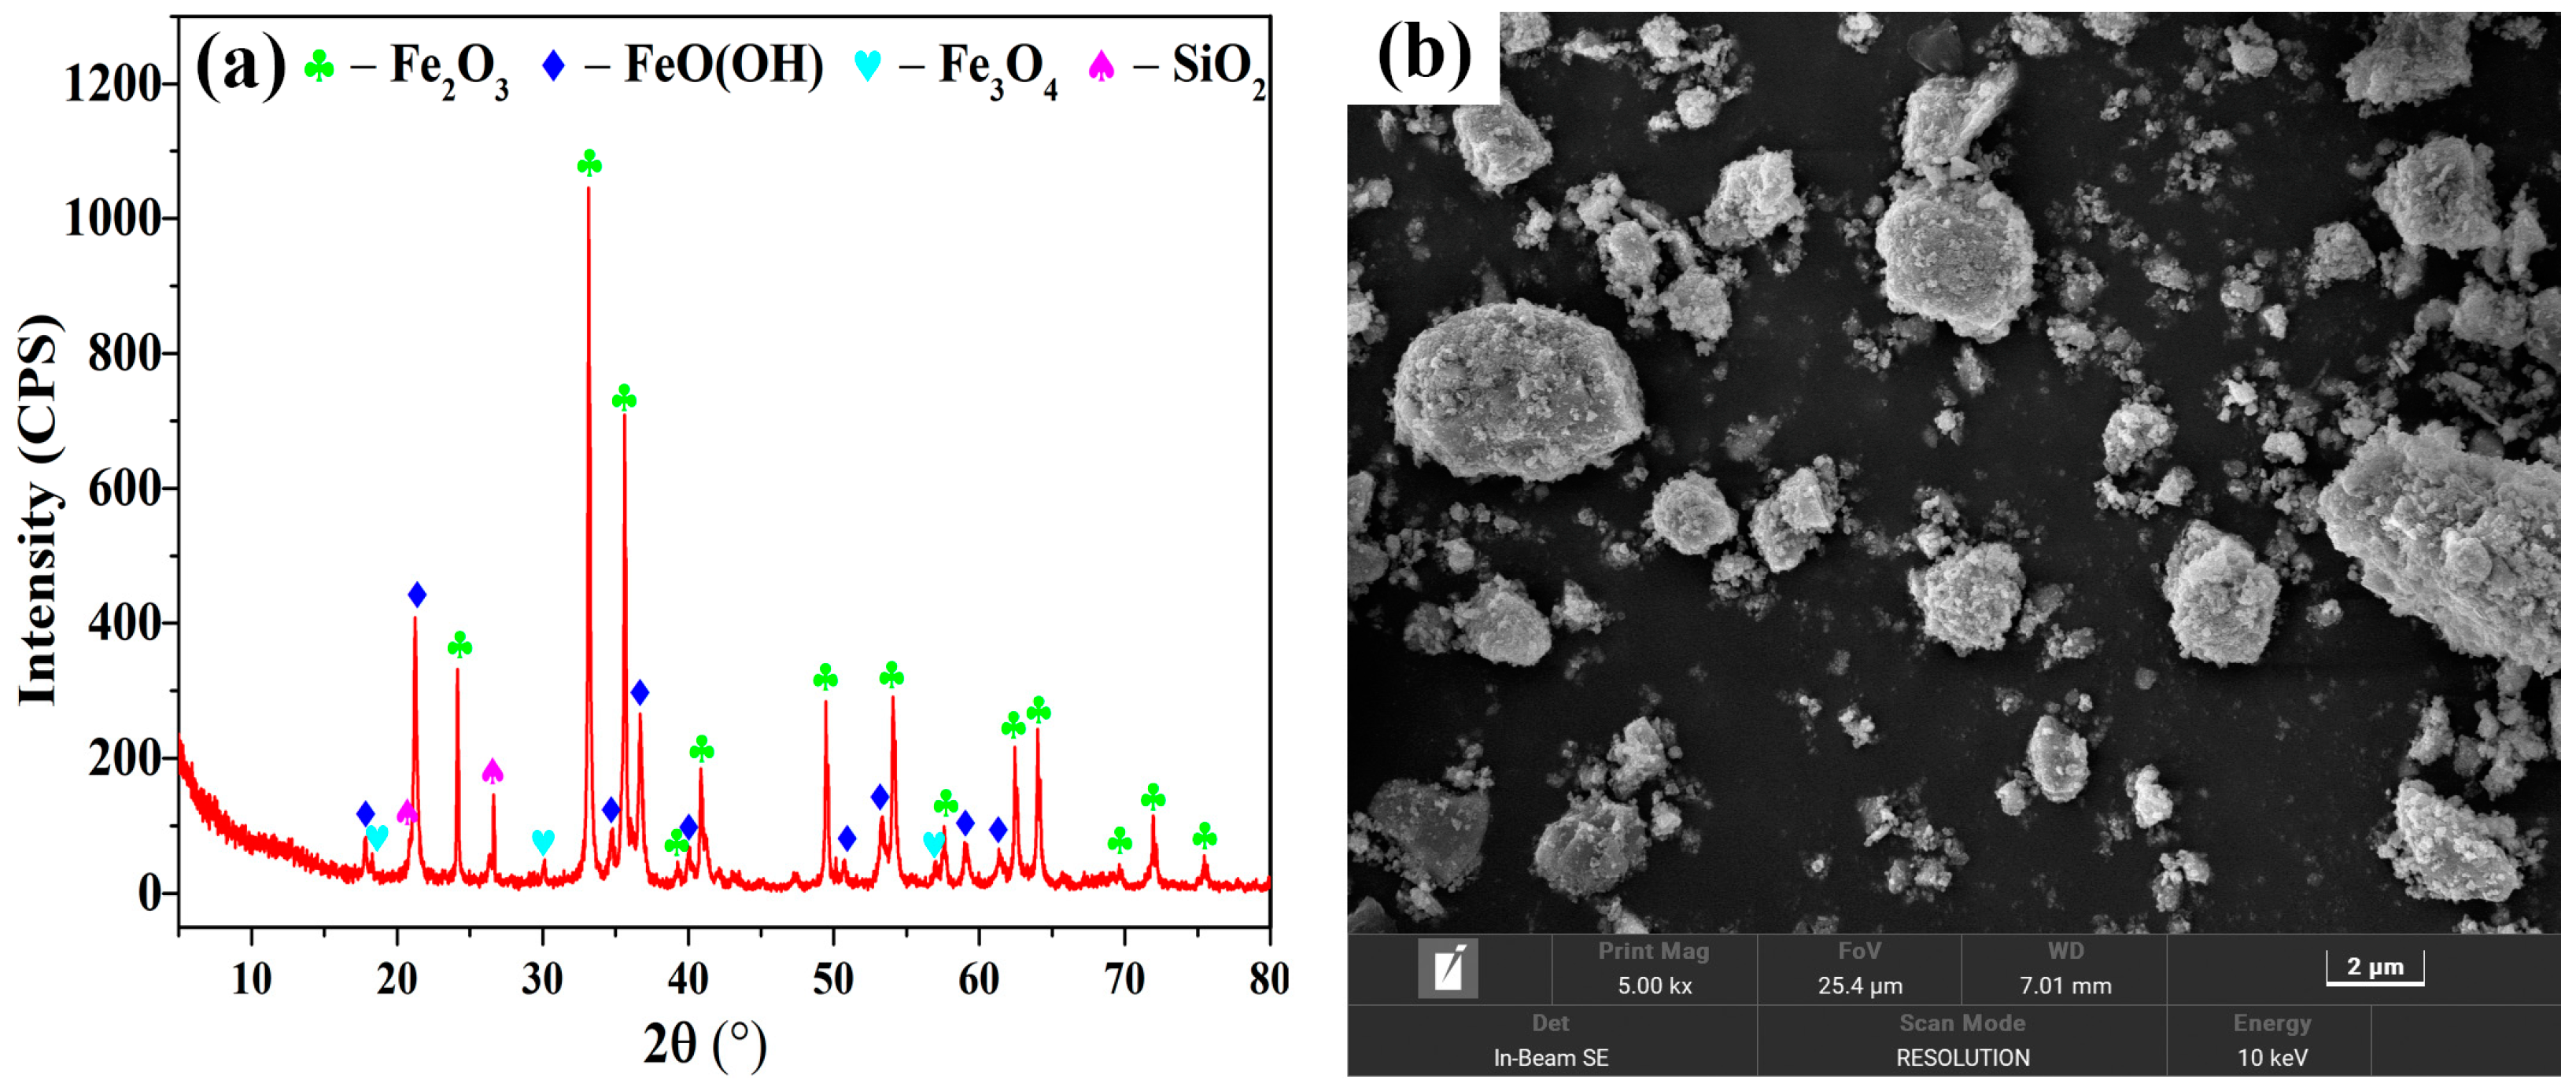
Figure 3.
Illustration of the reduction apparatus.
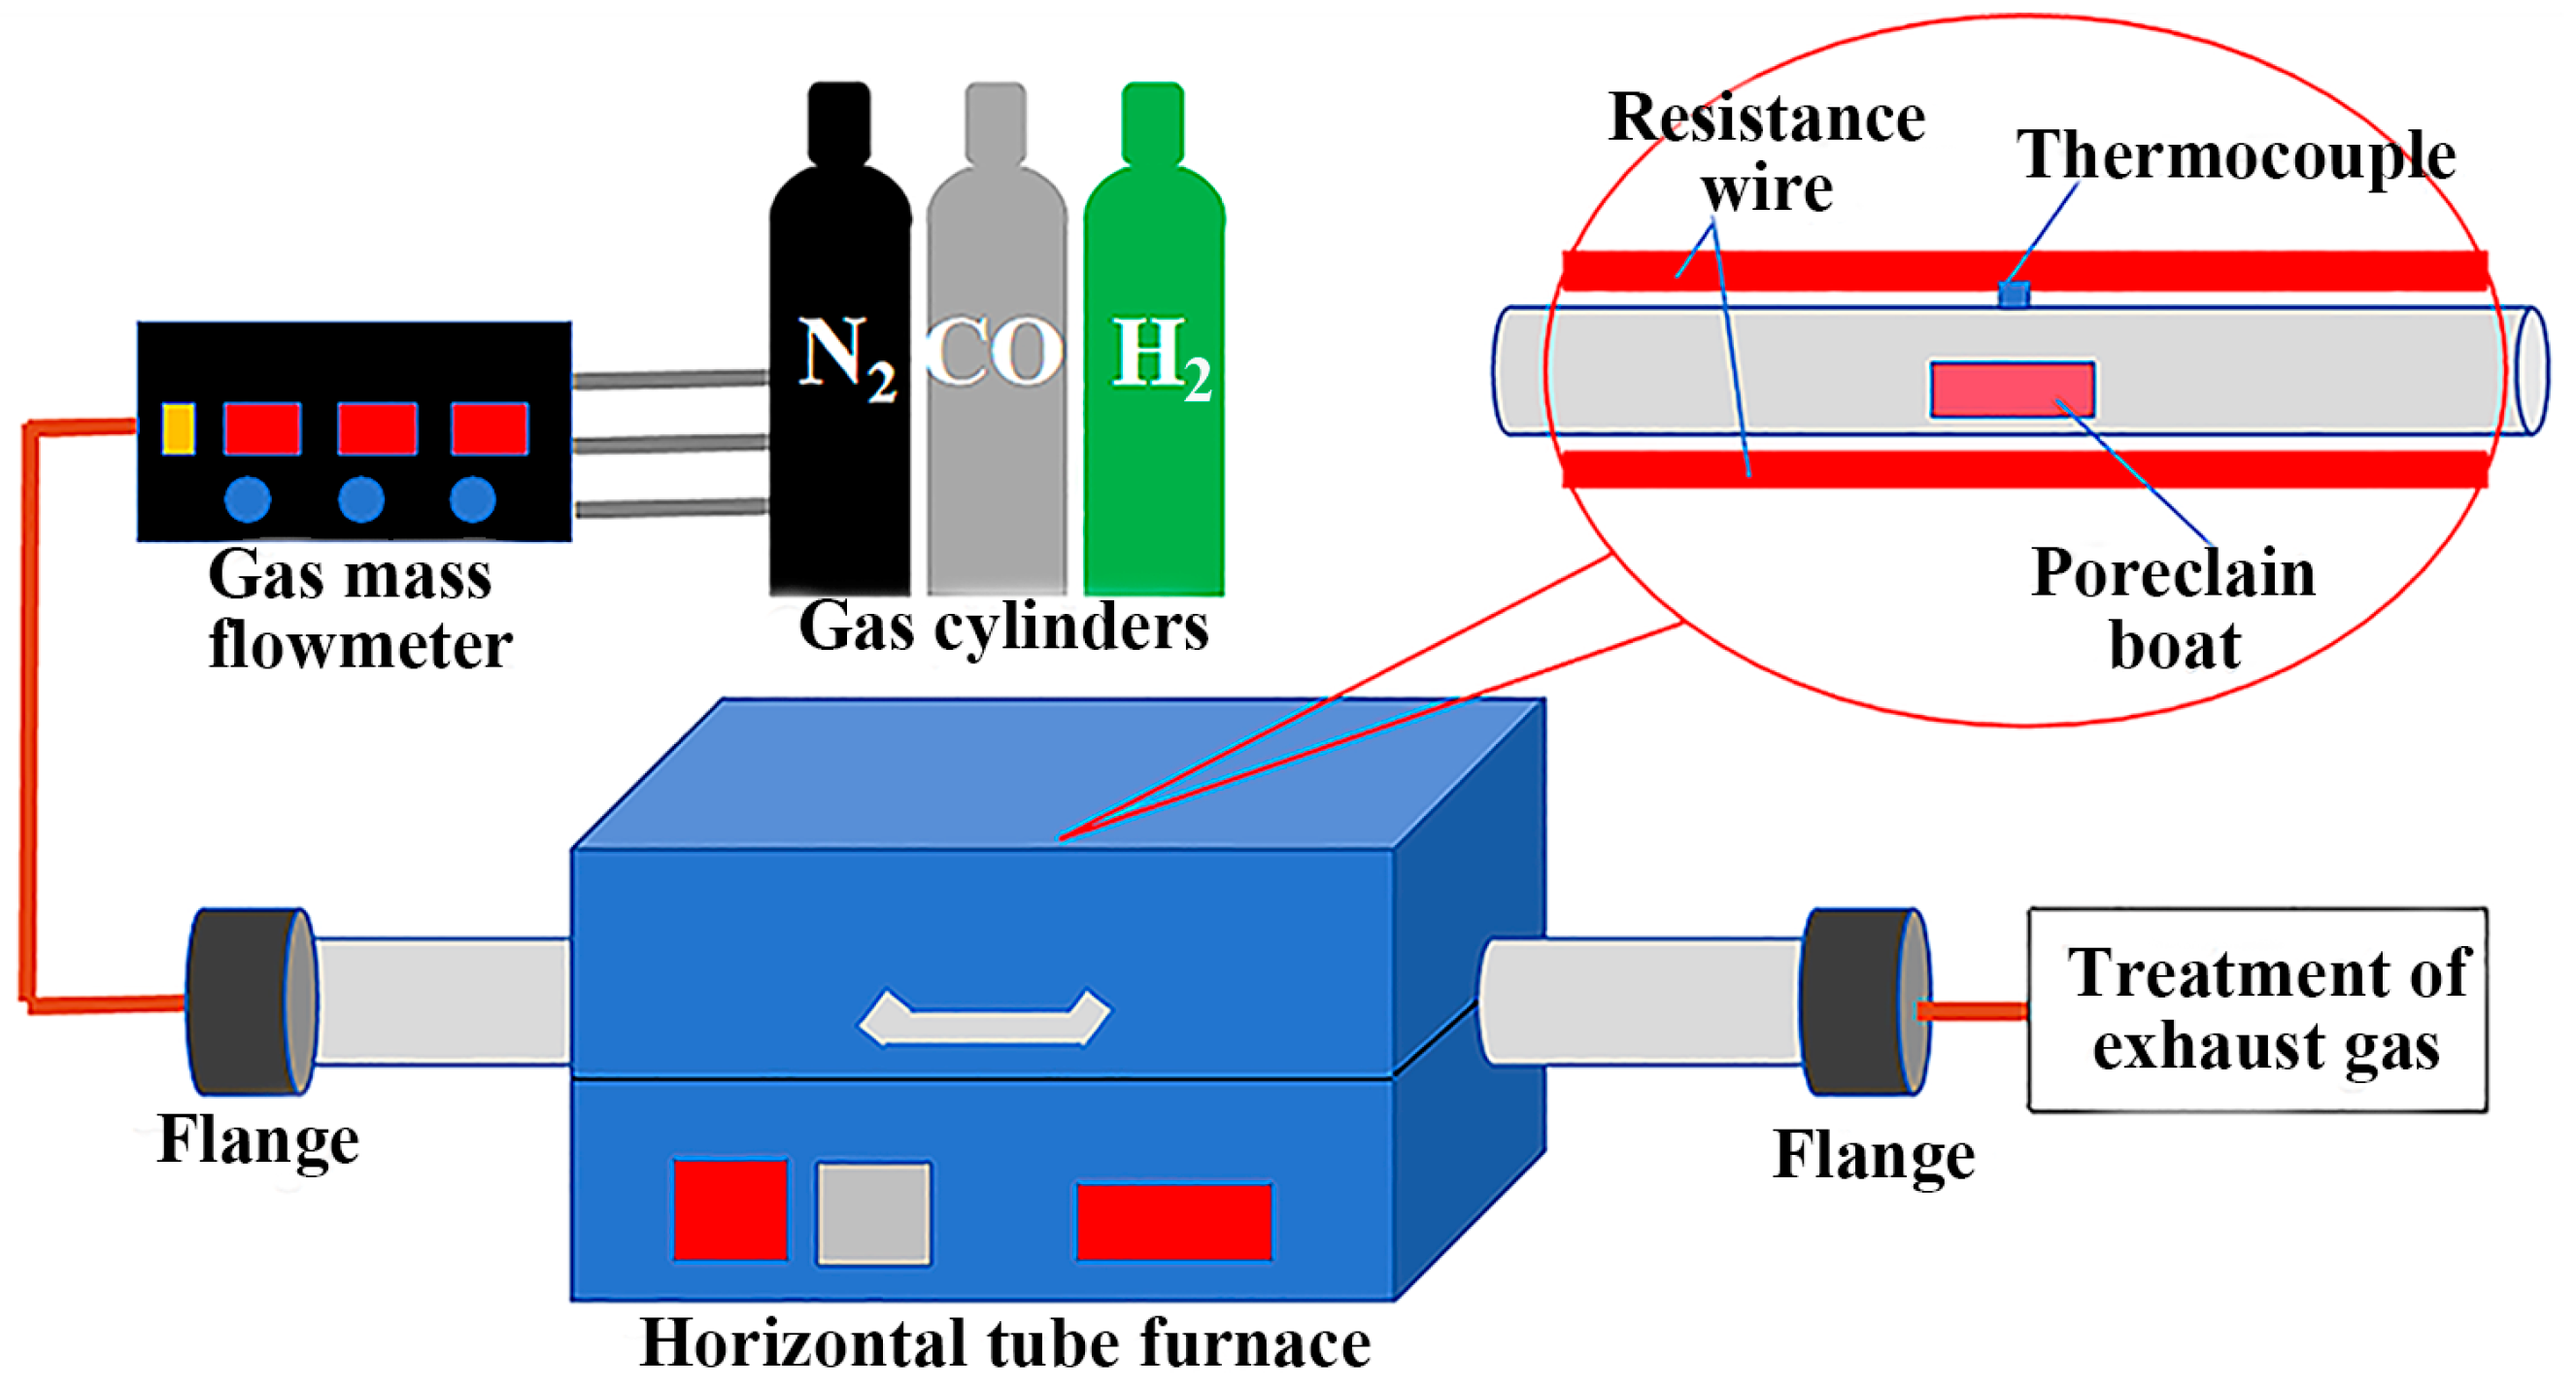
Figure 4.
Variations of standard Gibbs free energy changes of the main reactions with temperature.
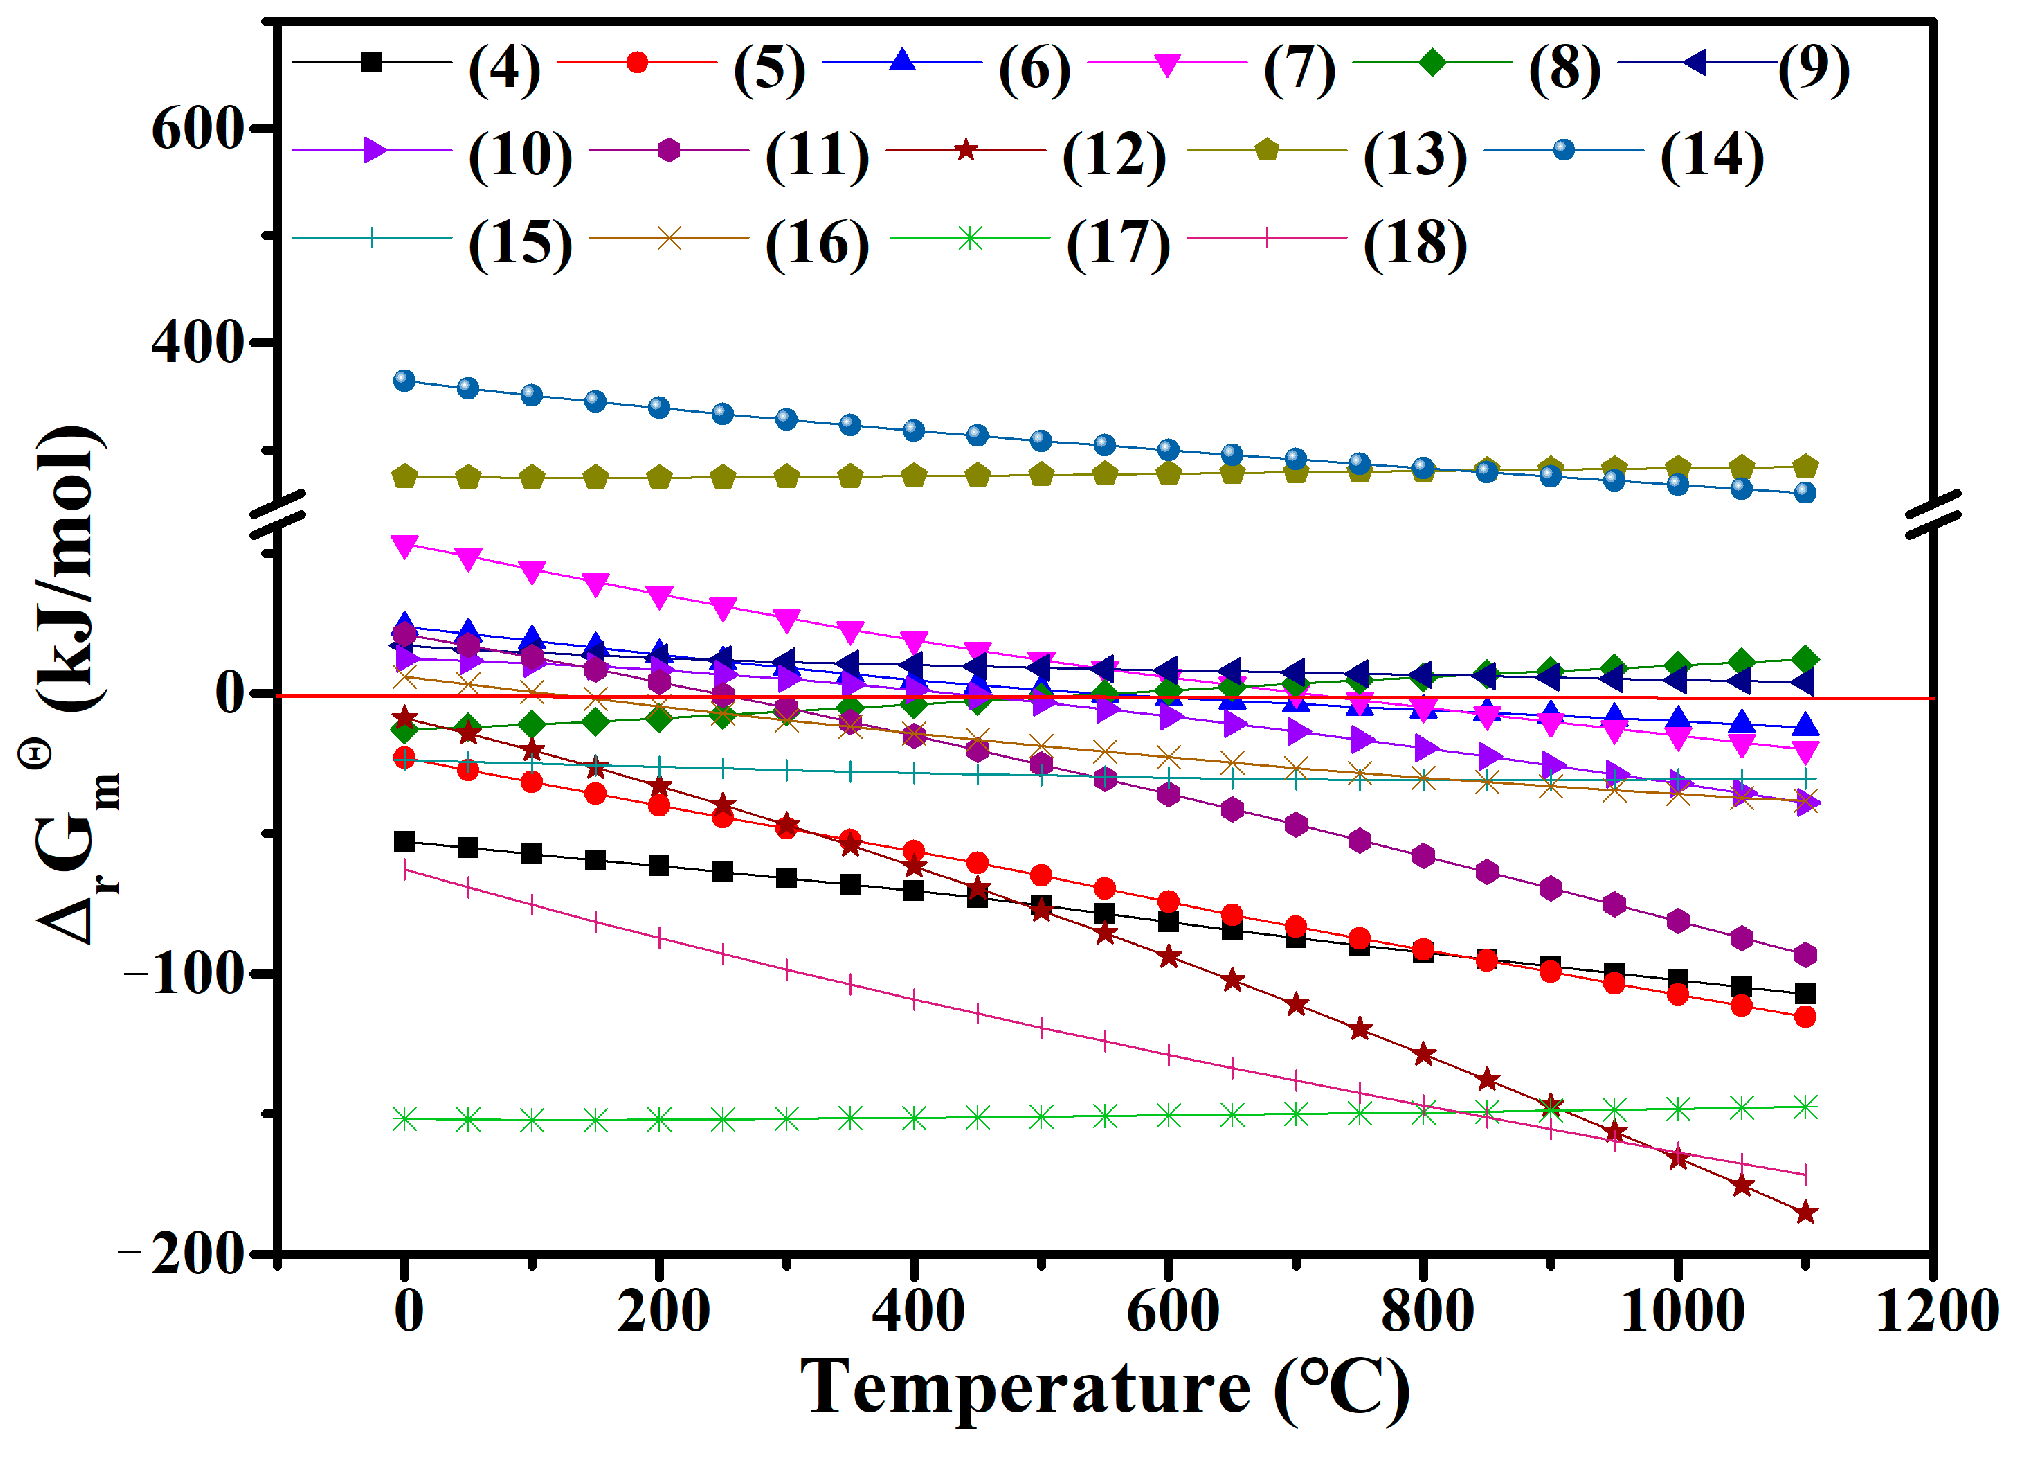
Figure 5.
Cr–Fe binary phase diagram.
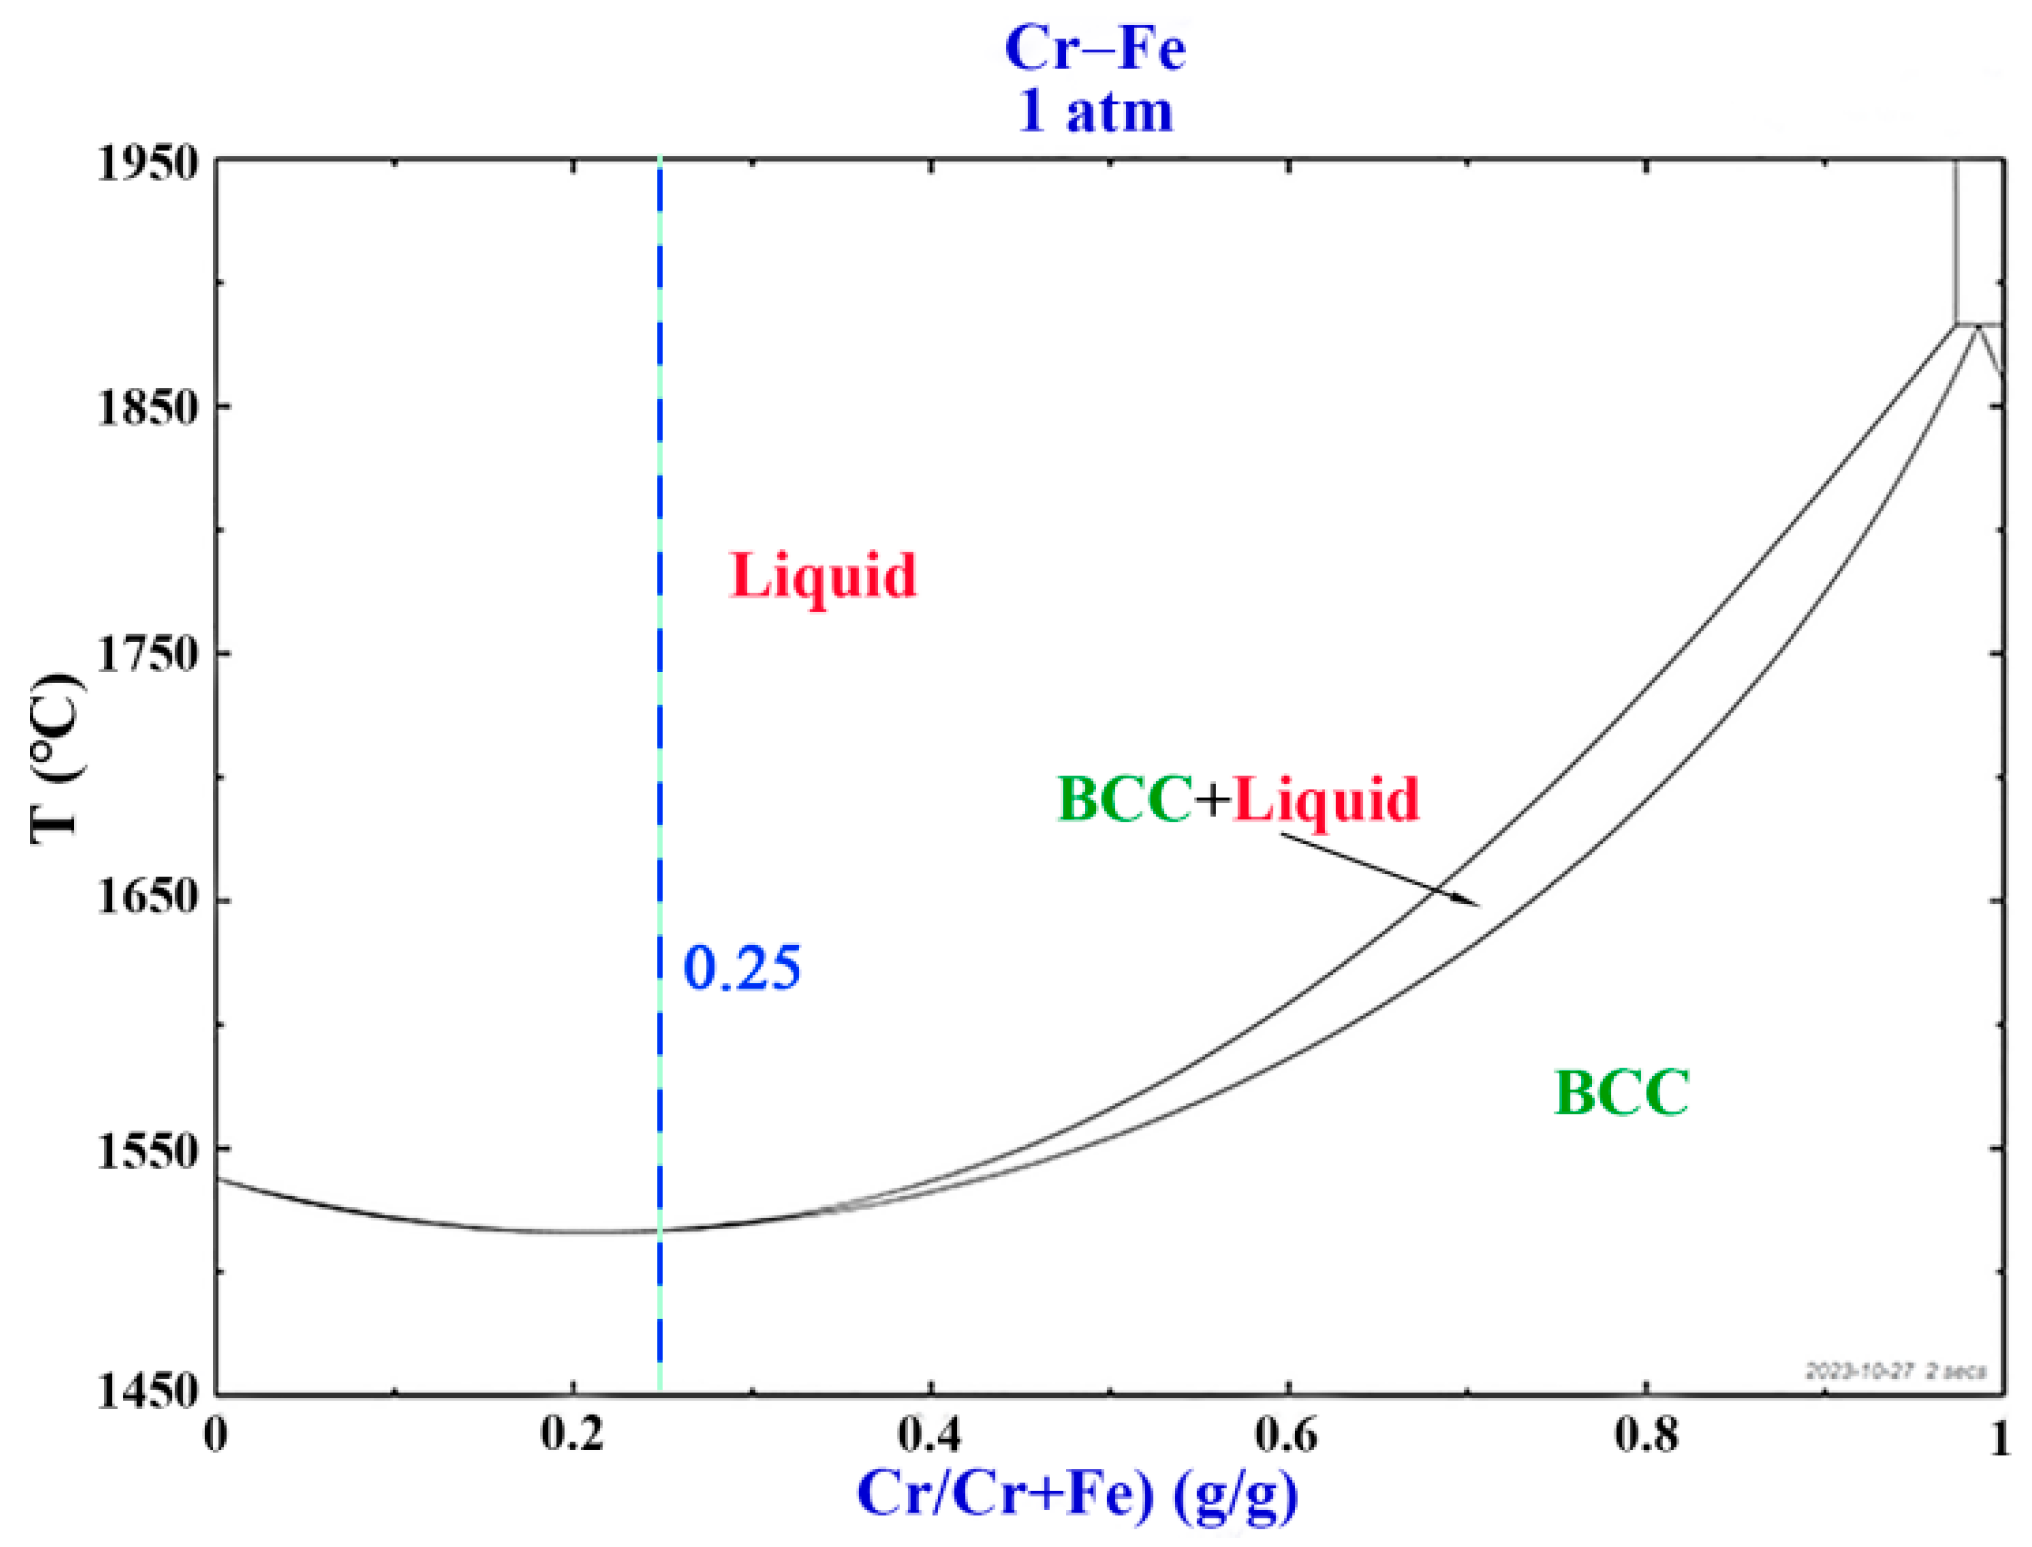
Figure 6.
Gas-phase equilibrium diagram concerning the reduction of iron oxides using CO and H2.

Figure 7.
(a) Variation of iron metallization degree of the reduction product with temperature and (b–d) fitting results of different kinetic models.
Figure 7.
(a) Variation of iron metallization degree of the reduction product with temperature and (b–d) fitting results of different kinetic models.
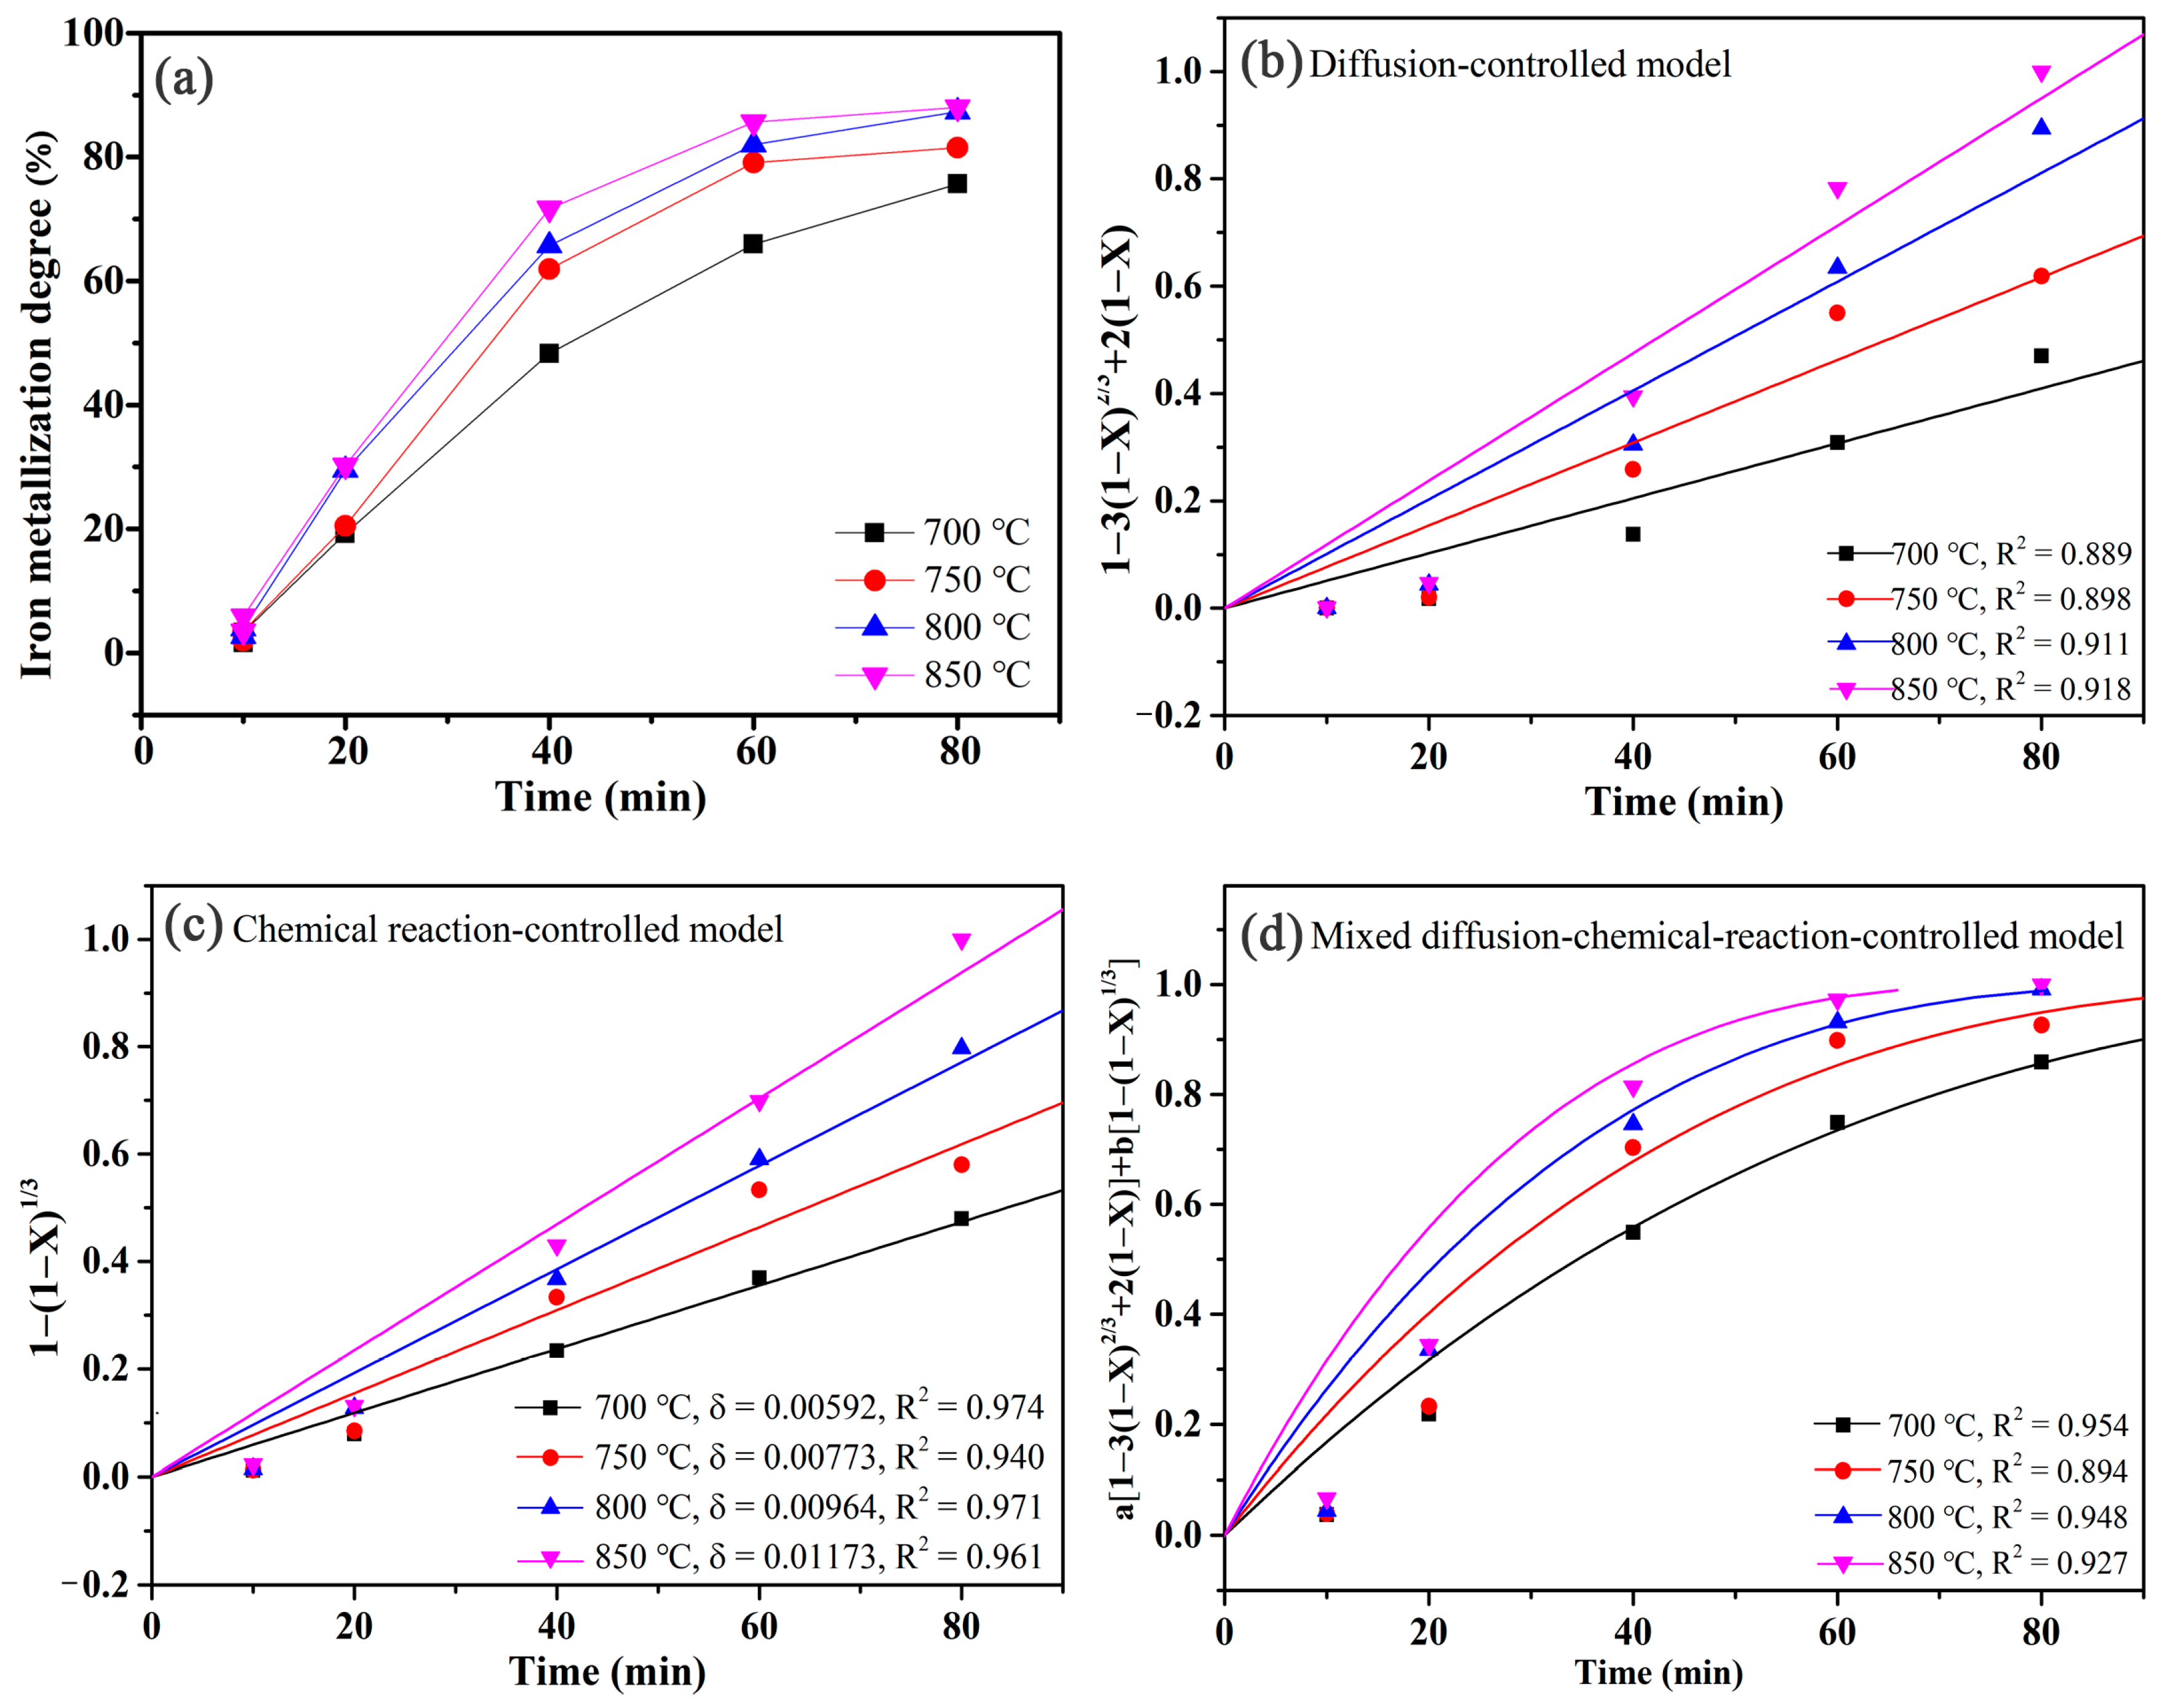
Figure 8.
Fitting result of the Arrhenius equation for the rate limited by chemical reaction.
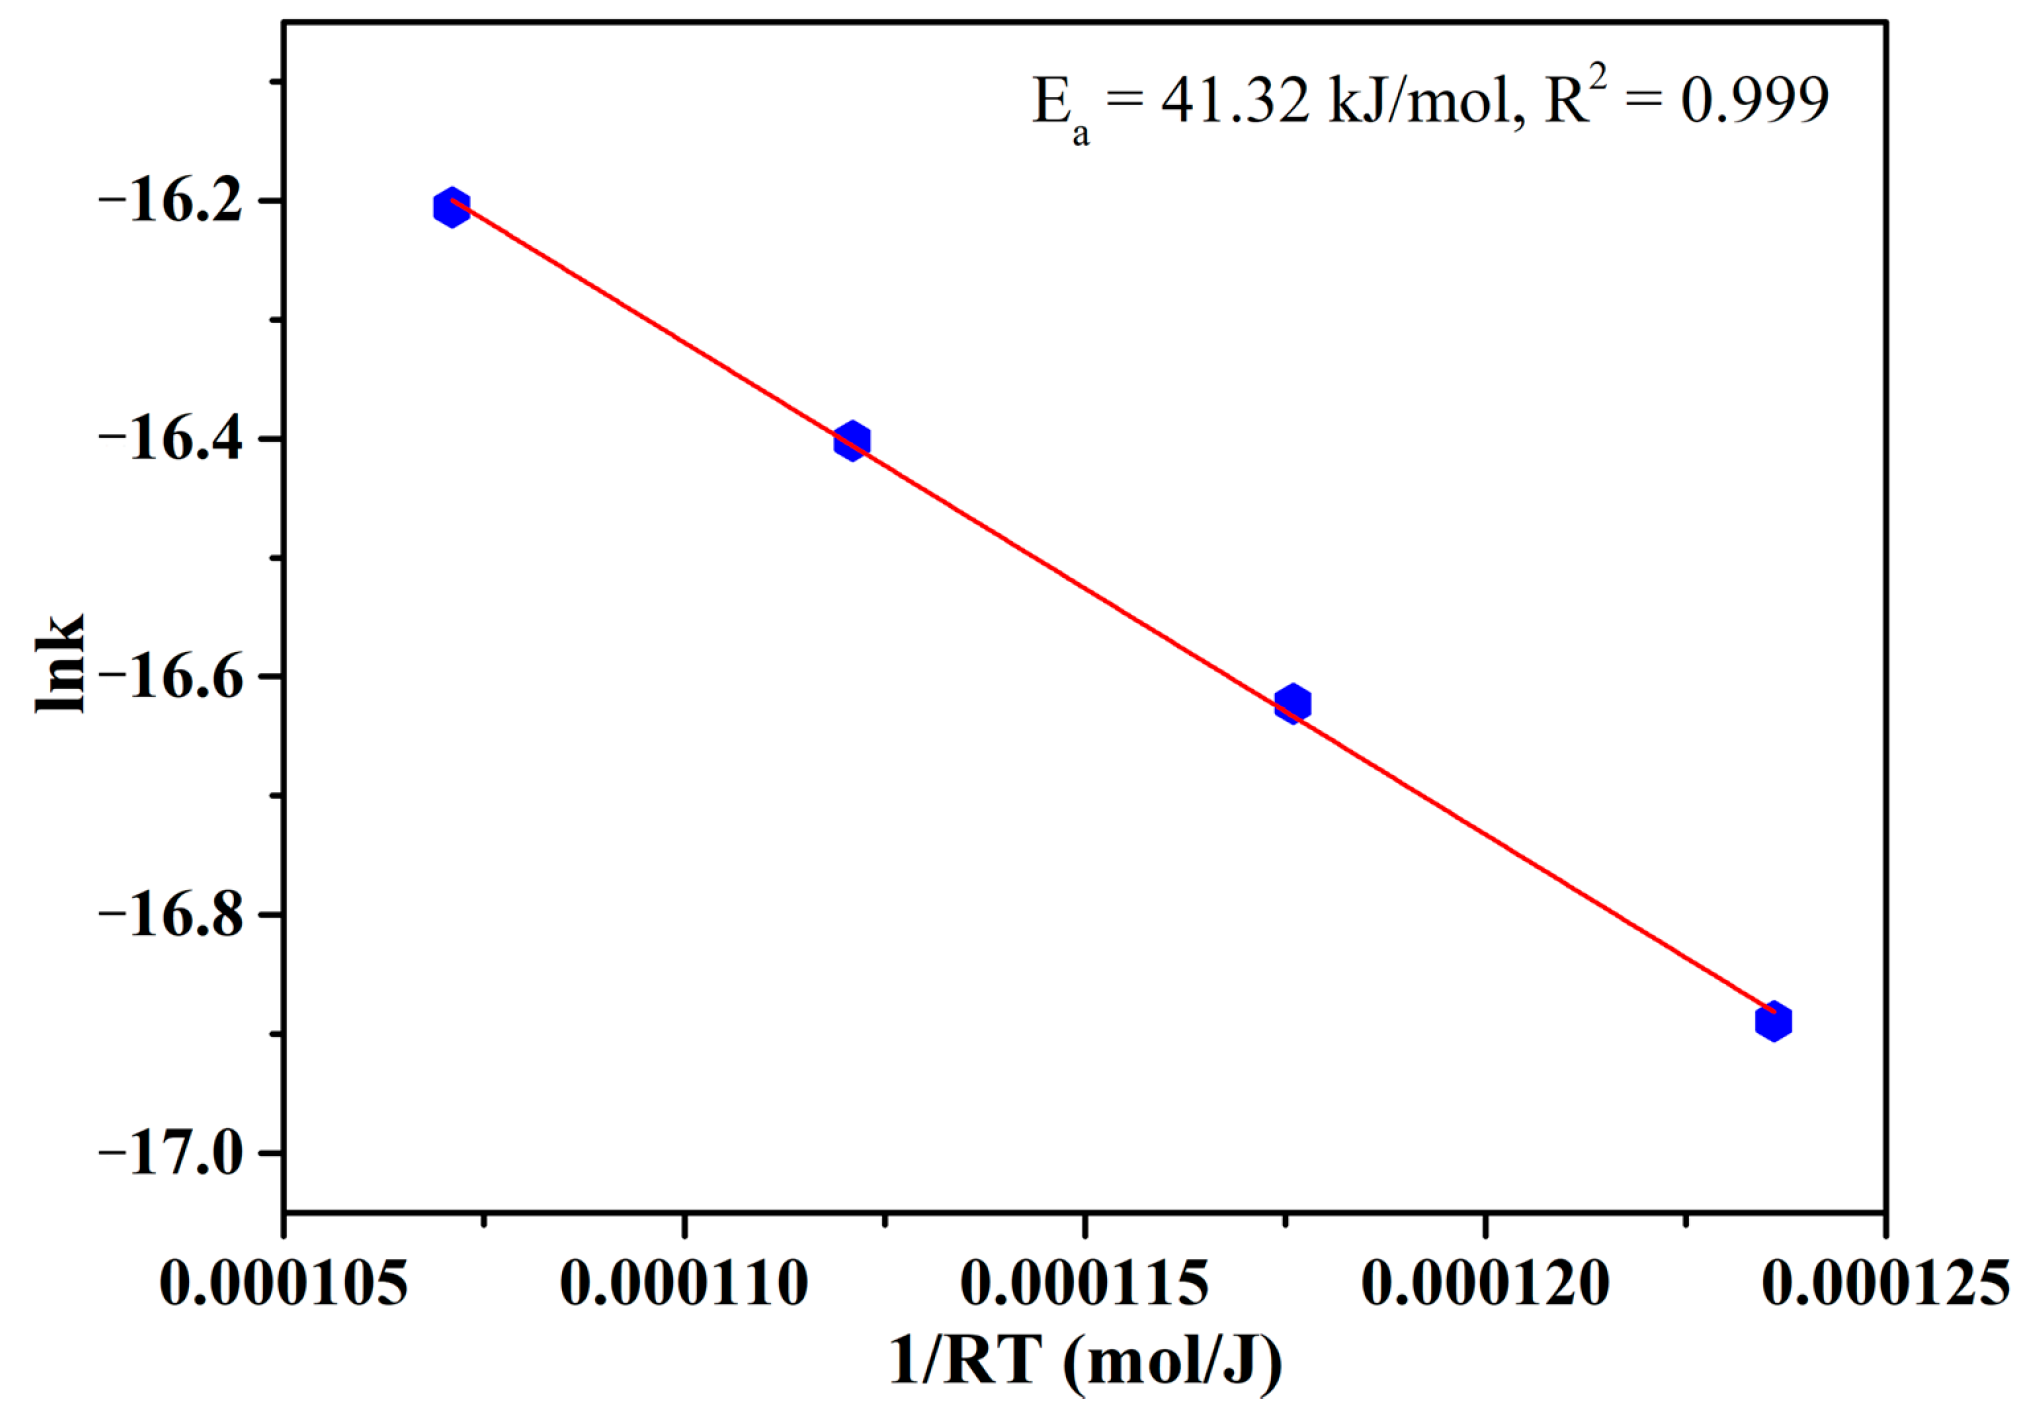
Figure 9.
XRD patterns of the products obtained by reduction at different temperatures for 60 min.
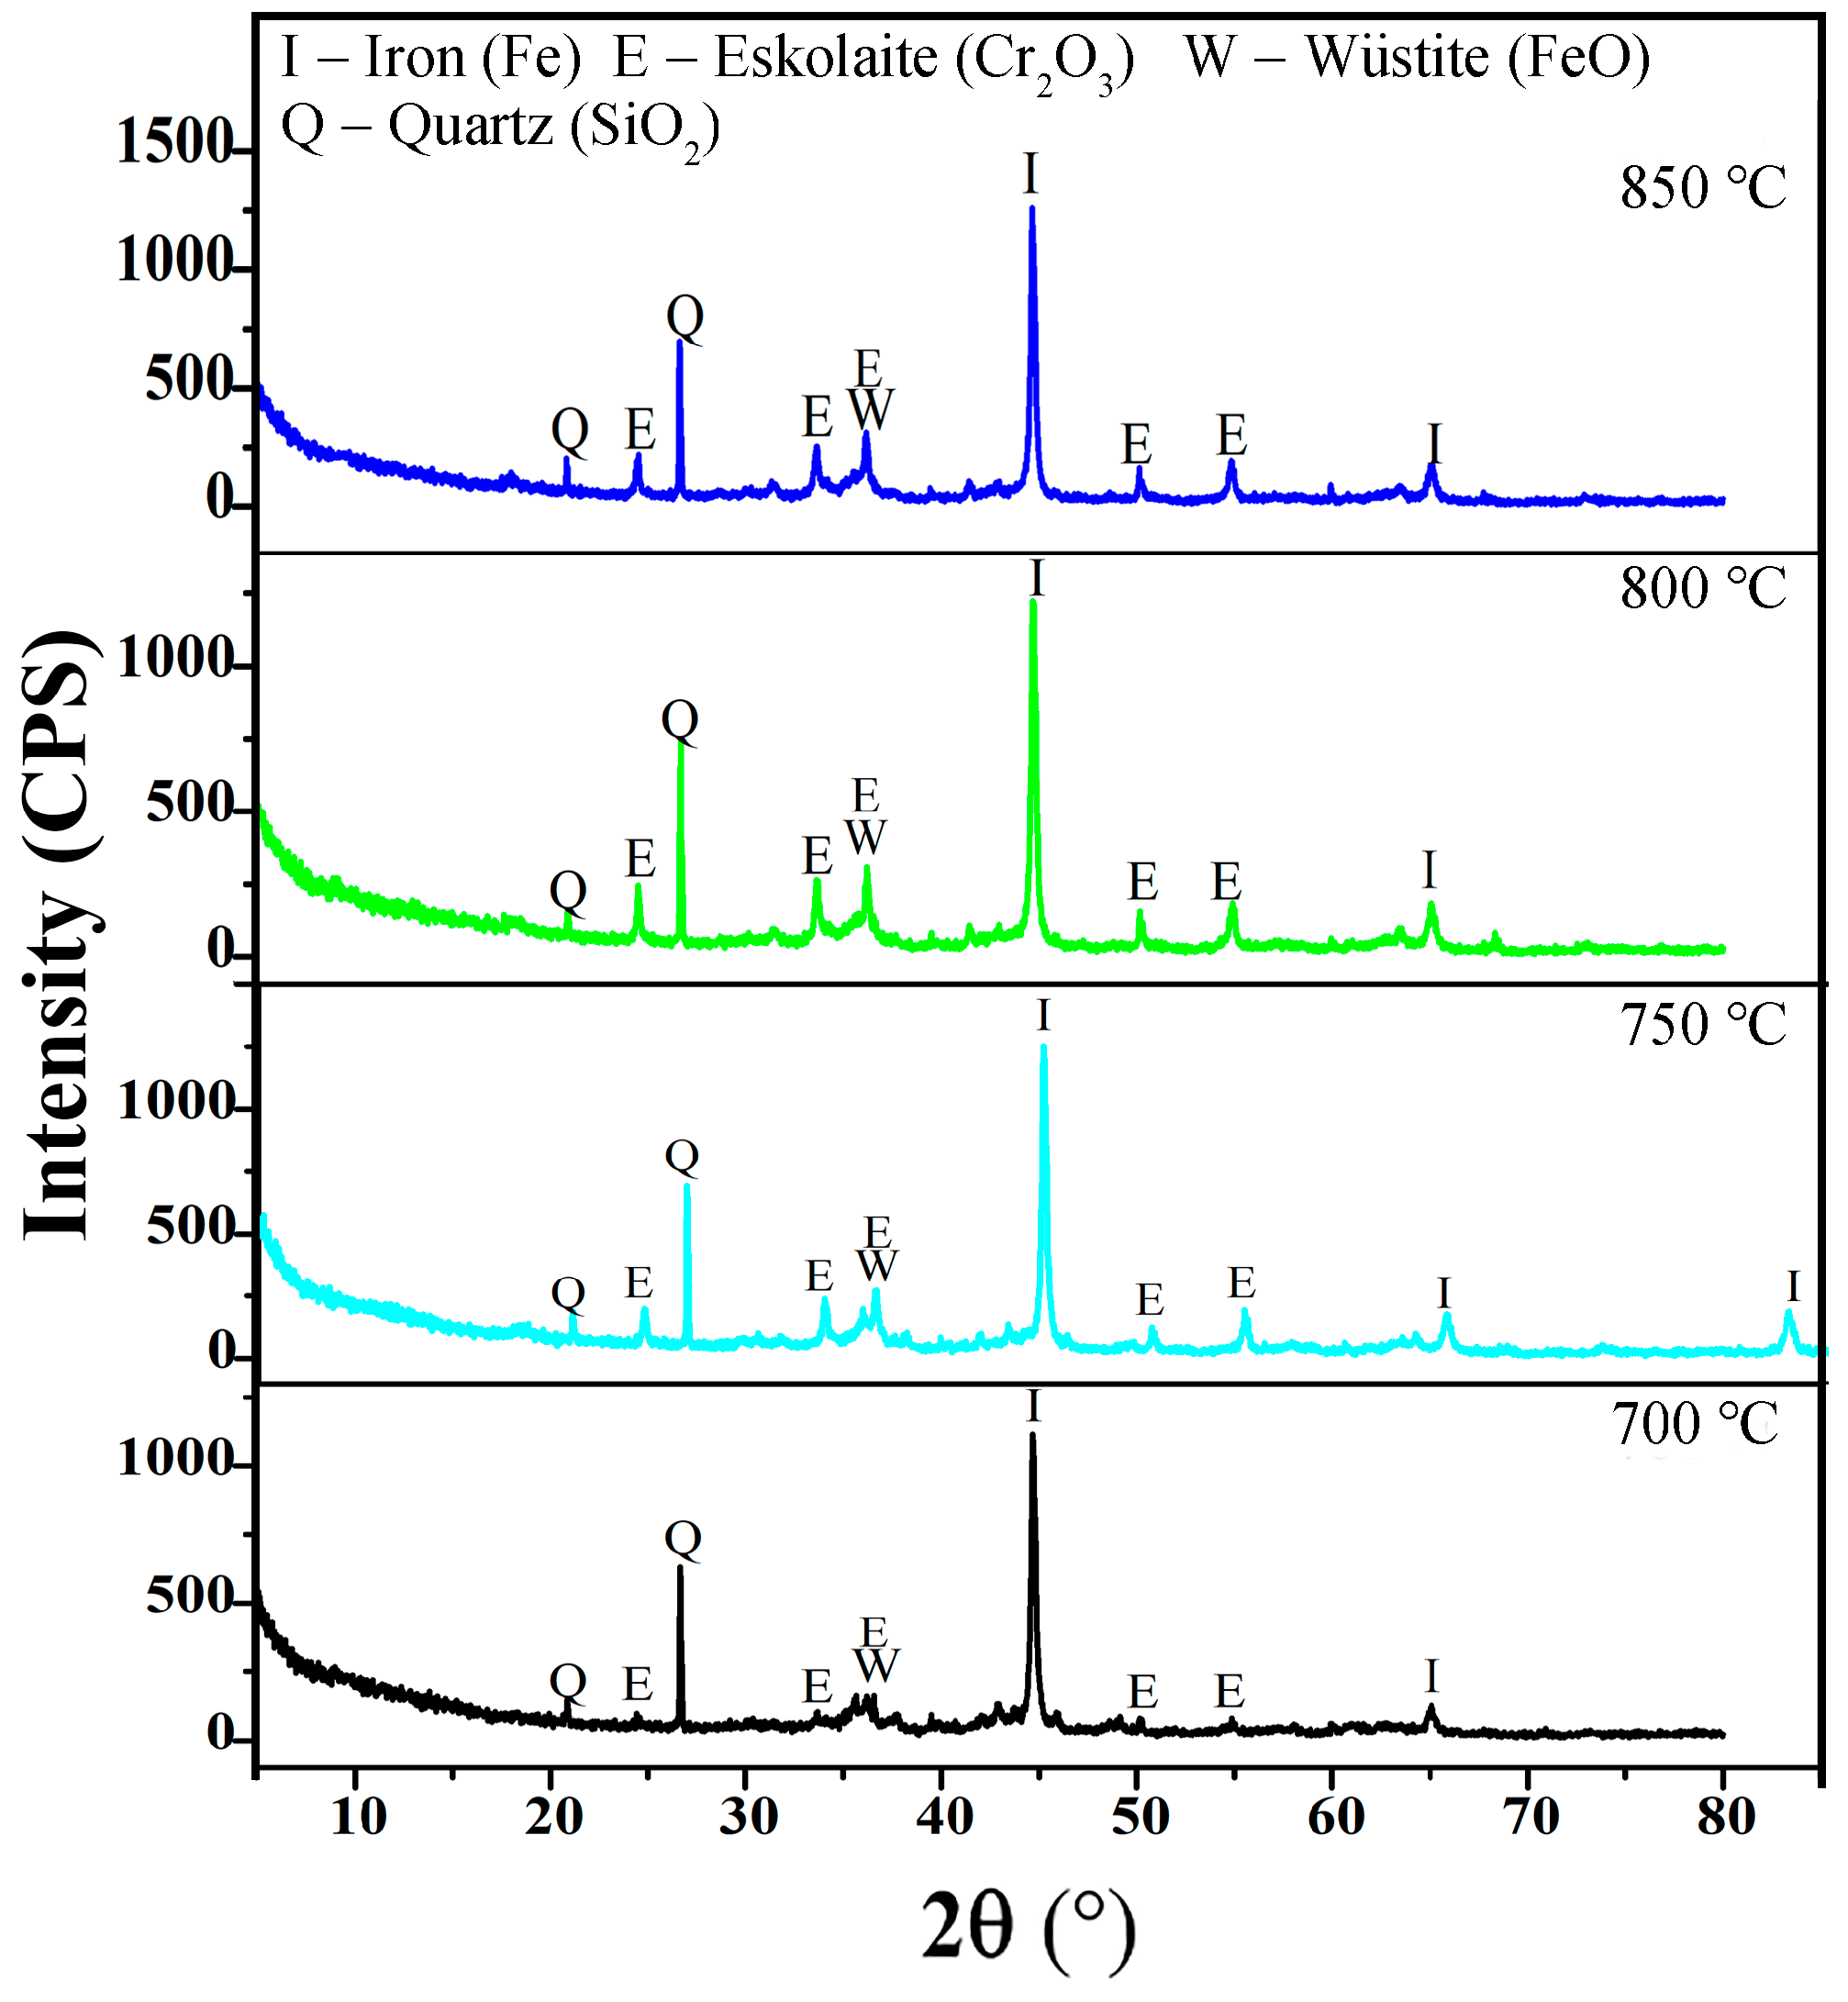
Figure 10.
XRD patterns of the products after reduction at 750 °C for different time.
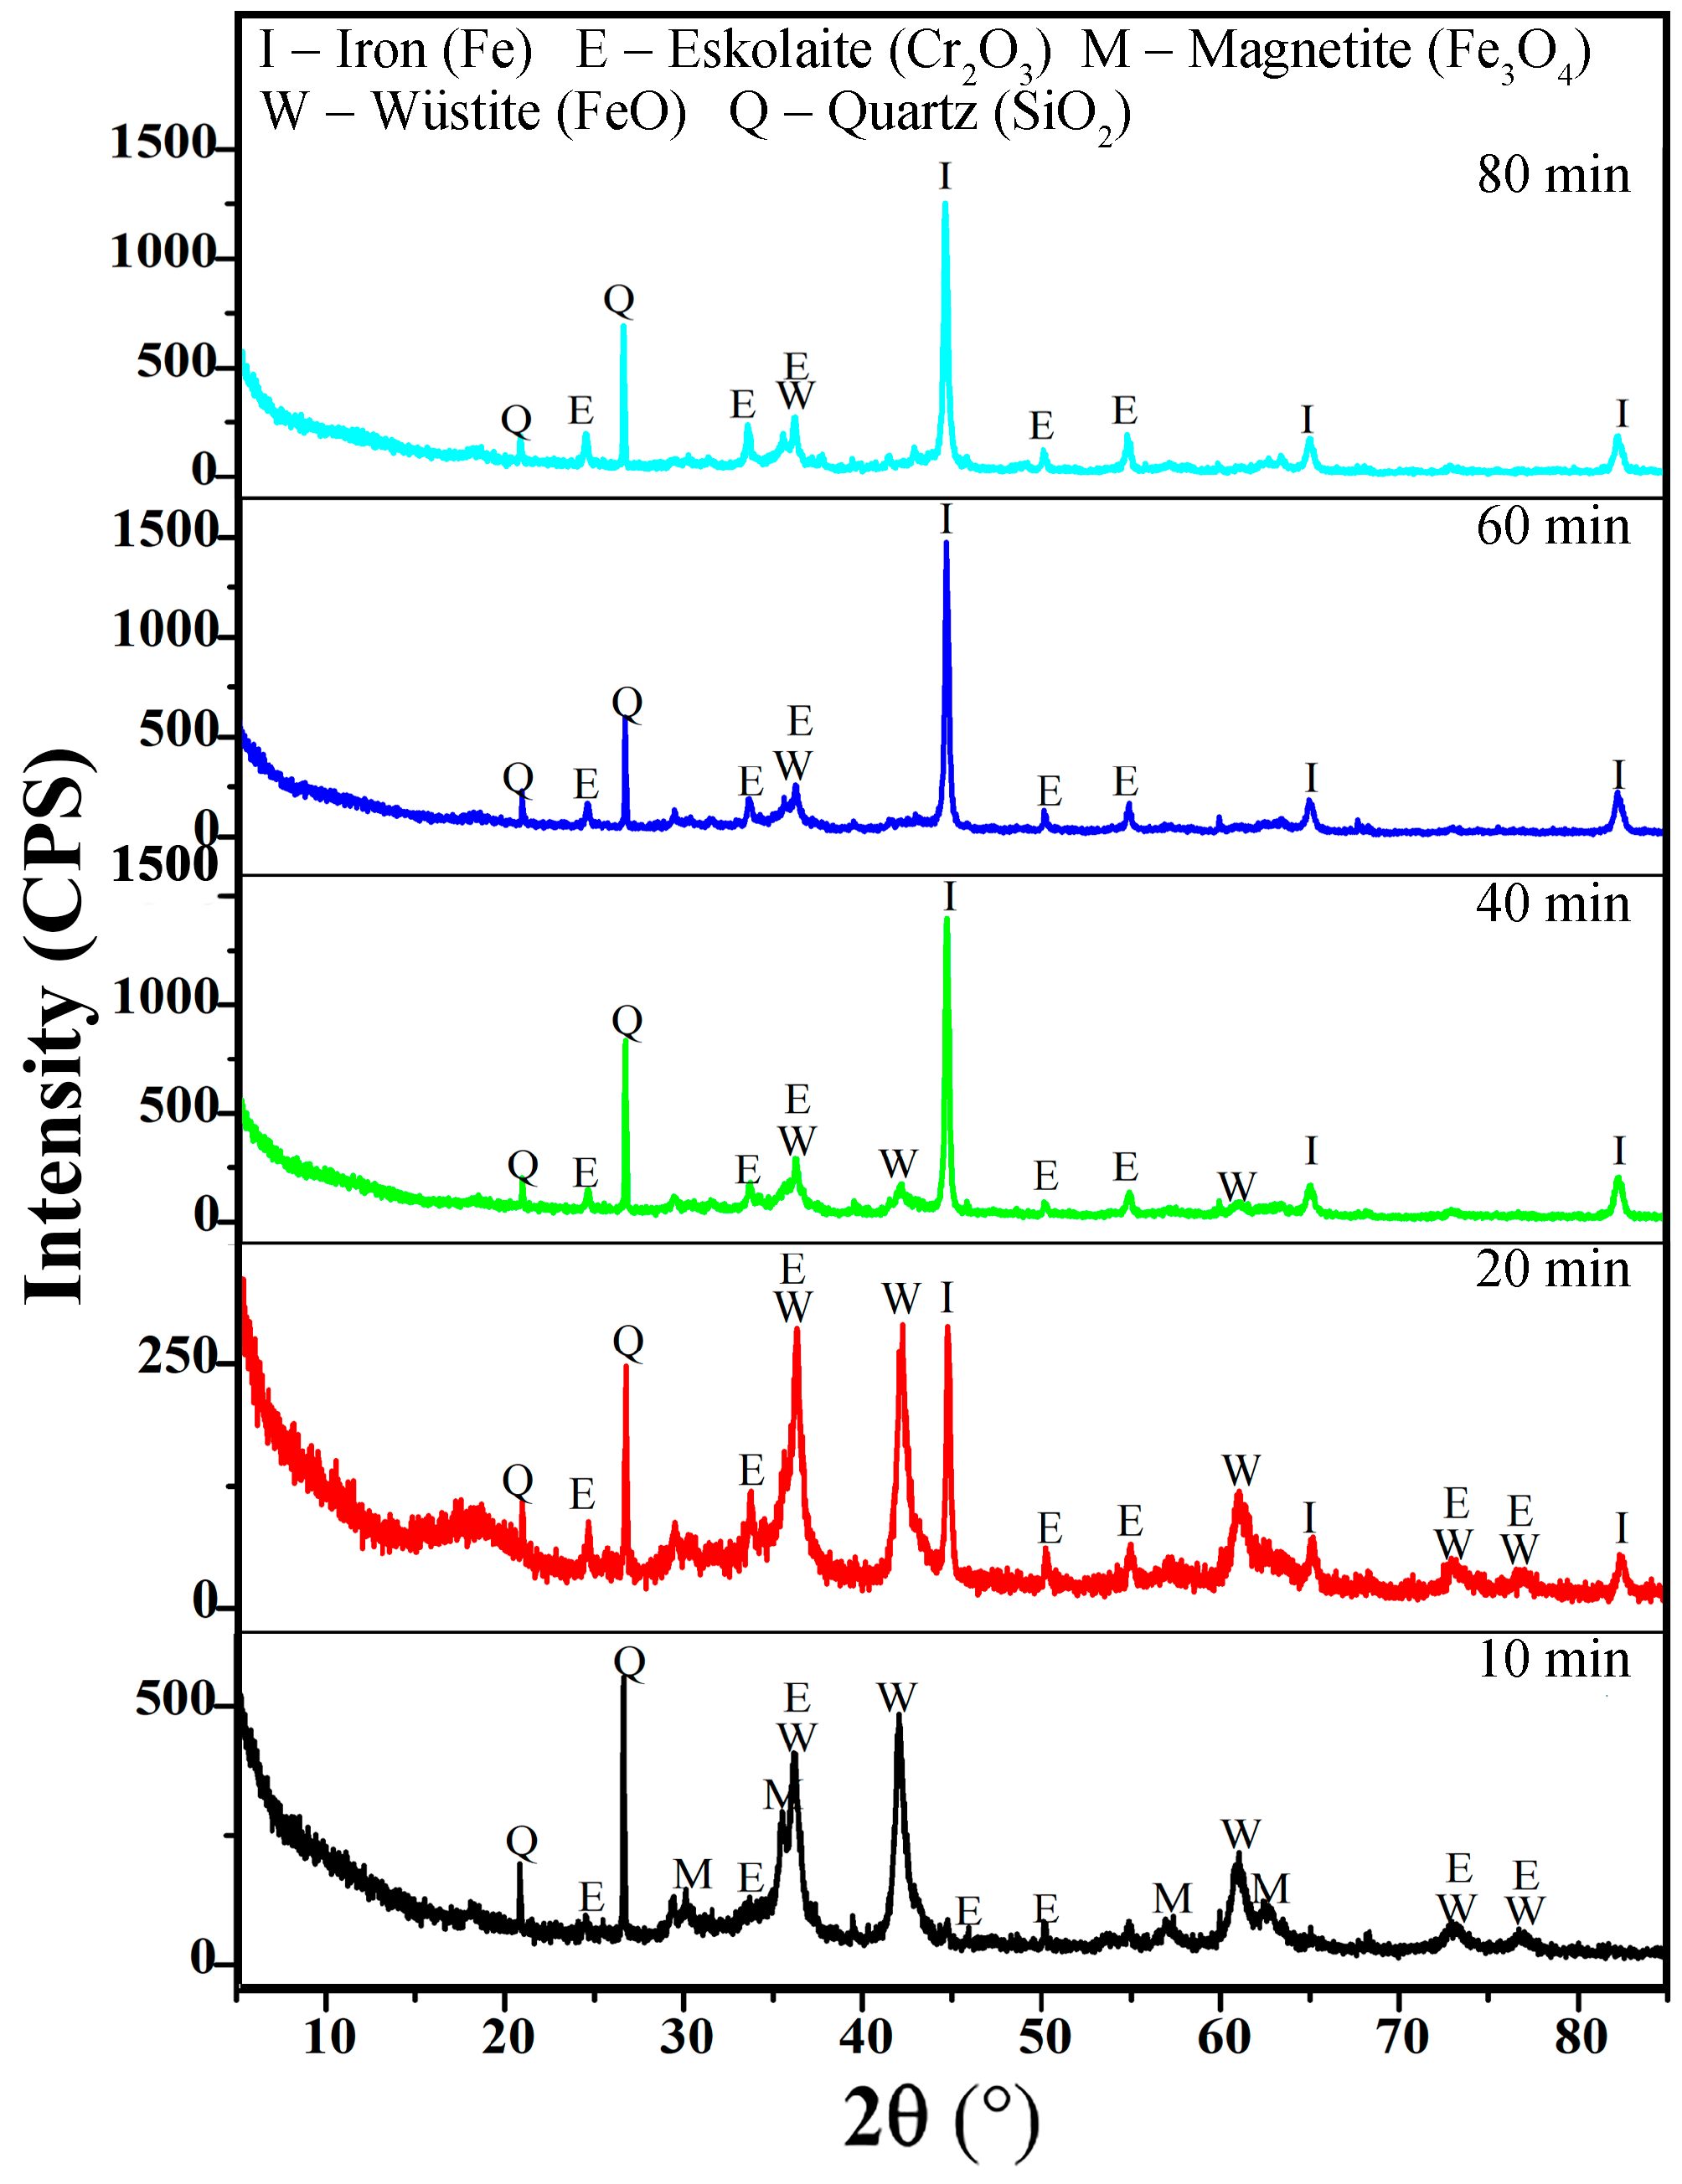
Figure 11.
XPS spectra of (a) chromium and (b) sulfur of the products obtained by reduction at different temperatures.
Figure 11.
XPS spectra of (a) chromium and (b) sulfur of the products obtained by reduction at different temperatures.
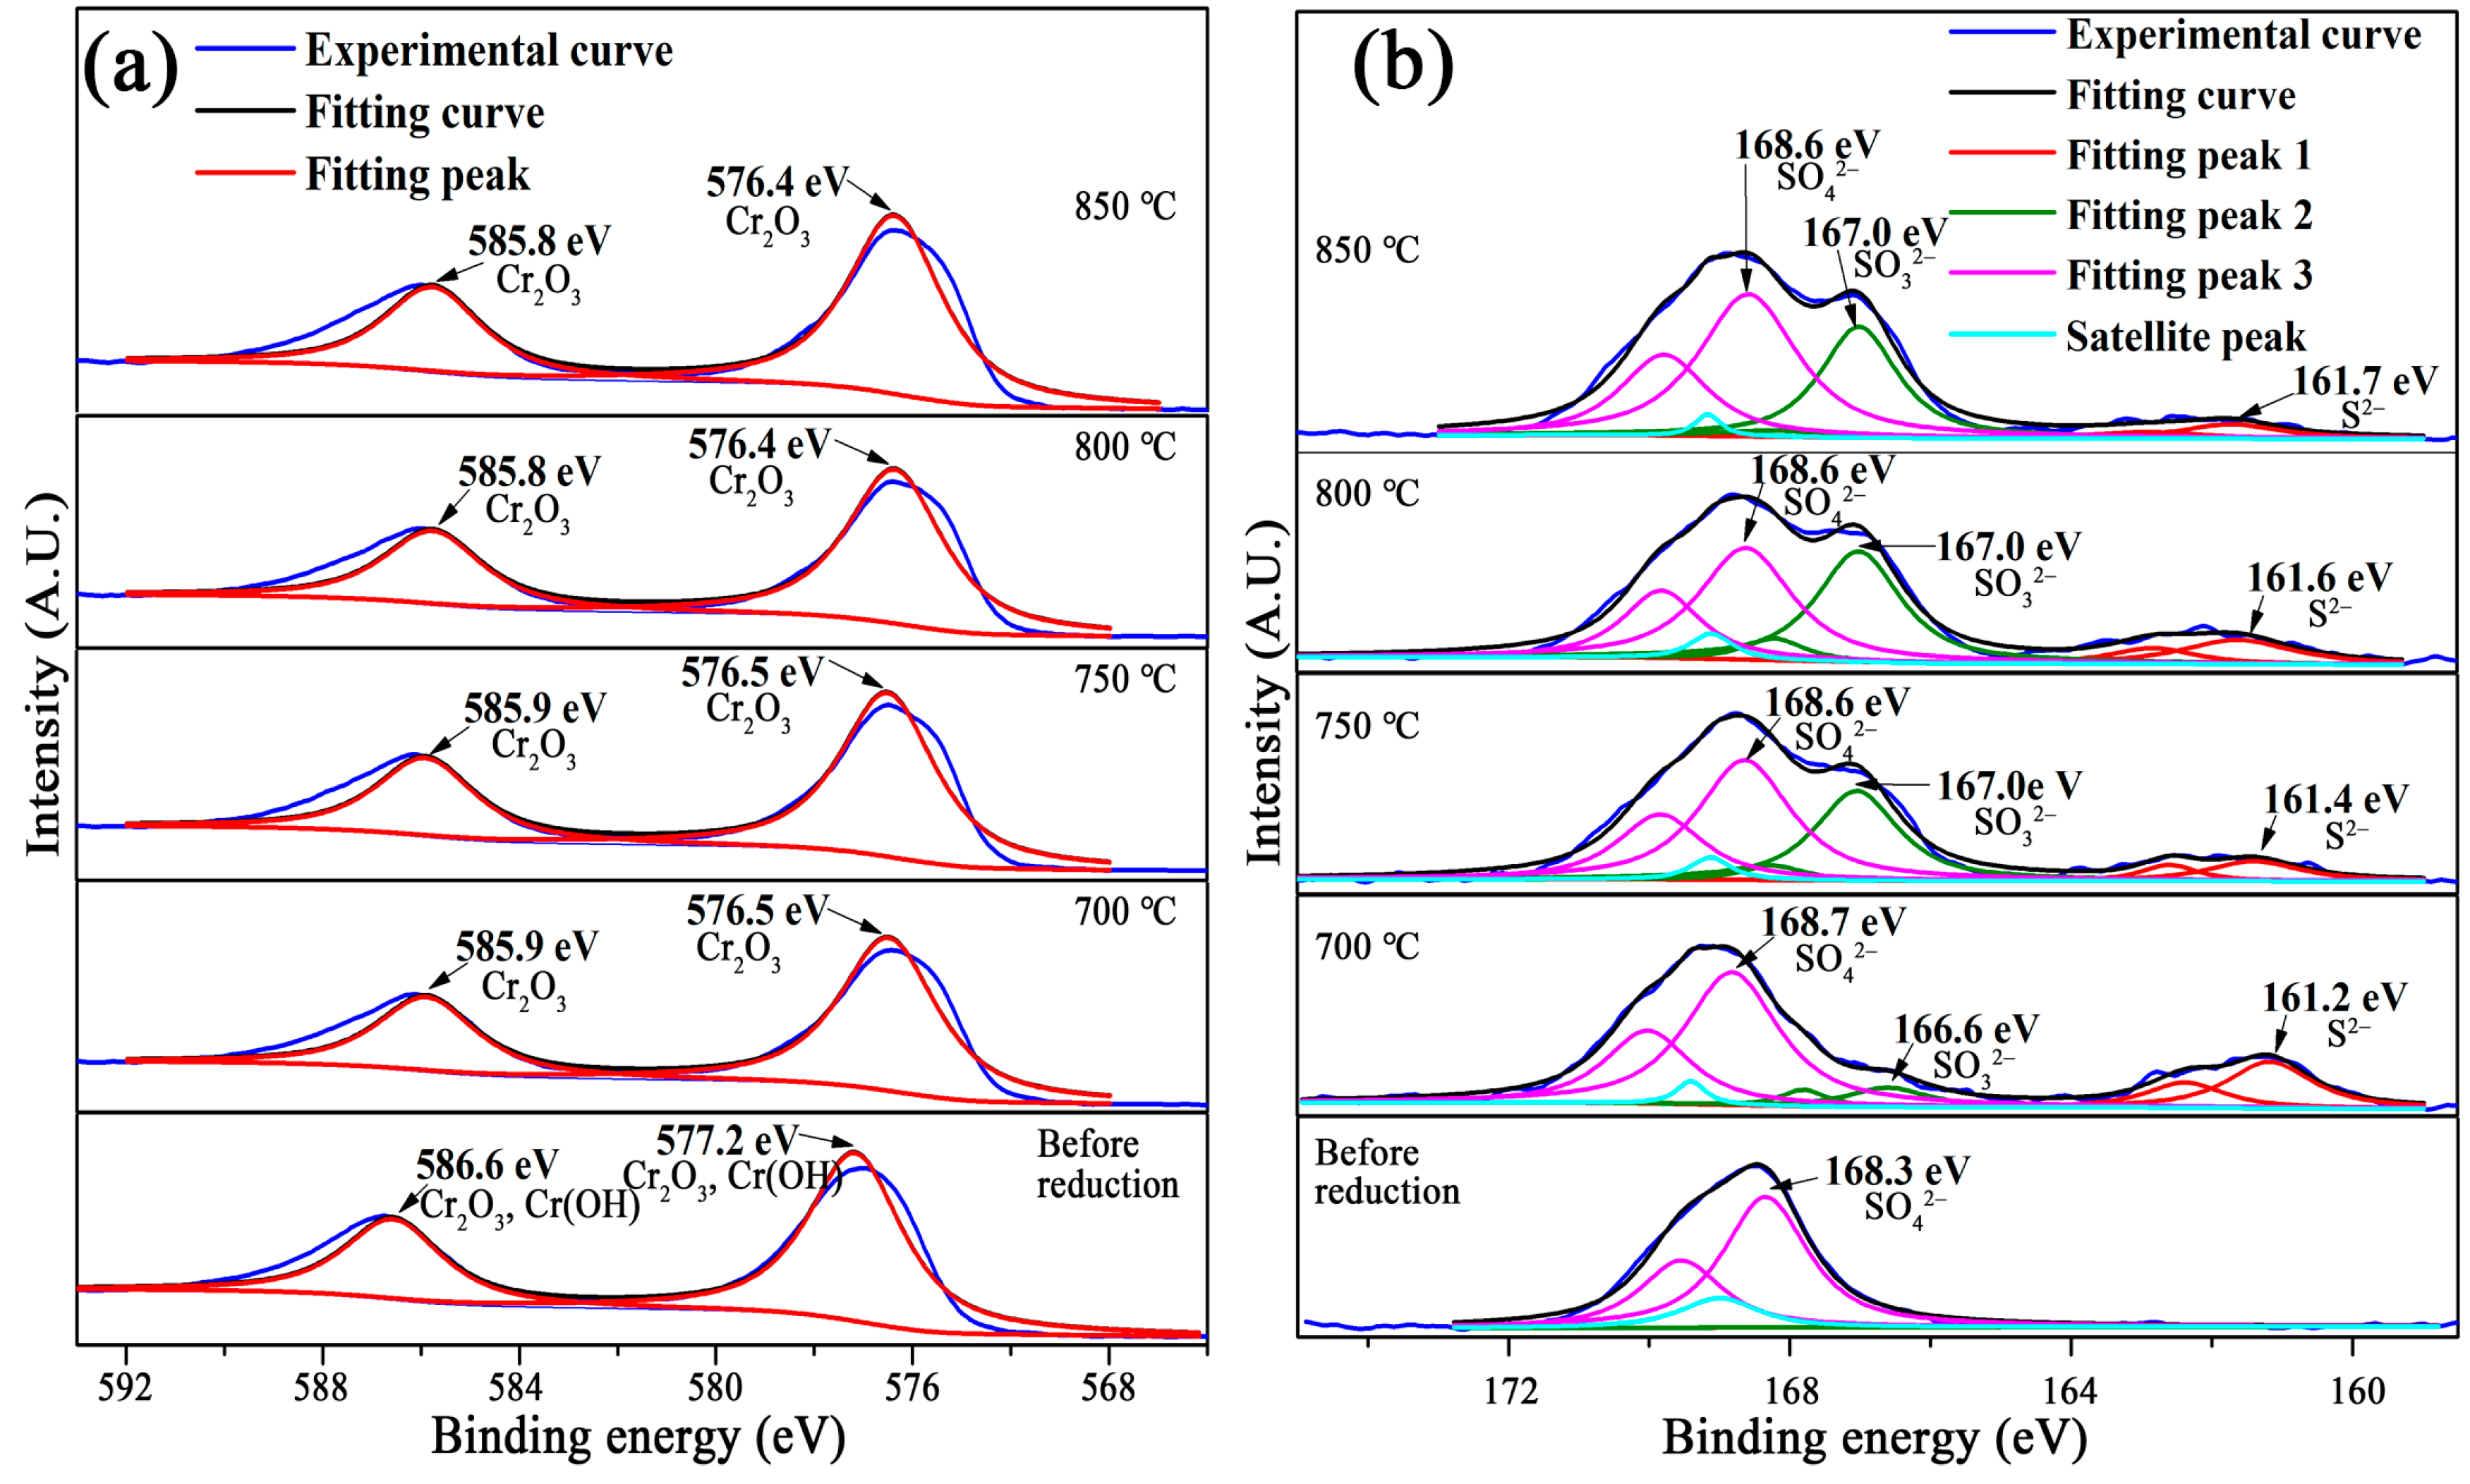
Figure 12.
Microstructures of the product obtained by reduction at 700 °C.
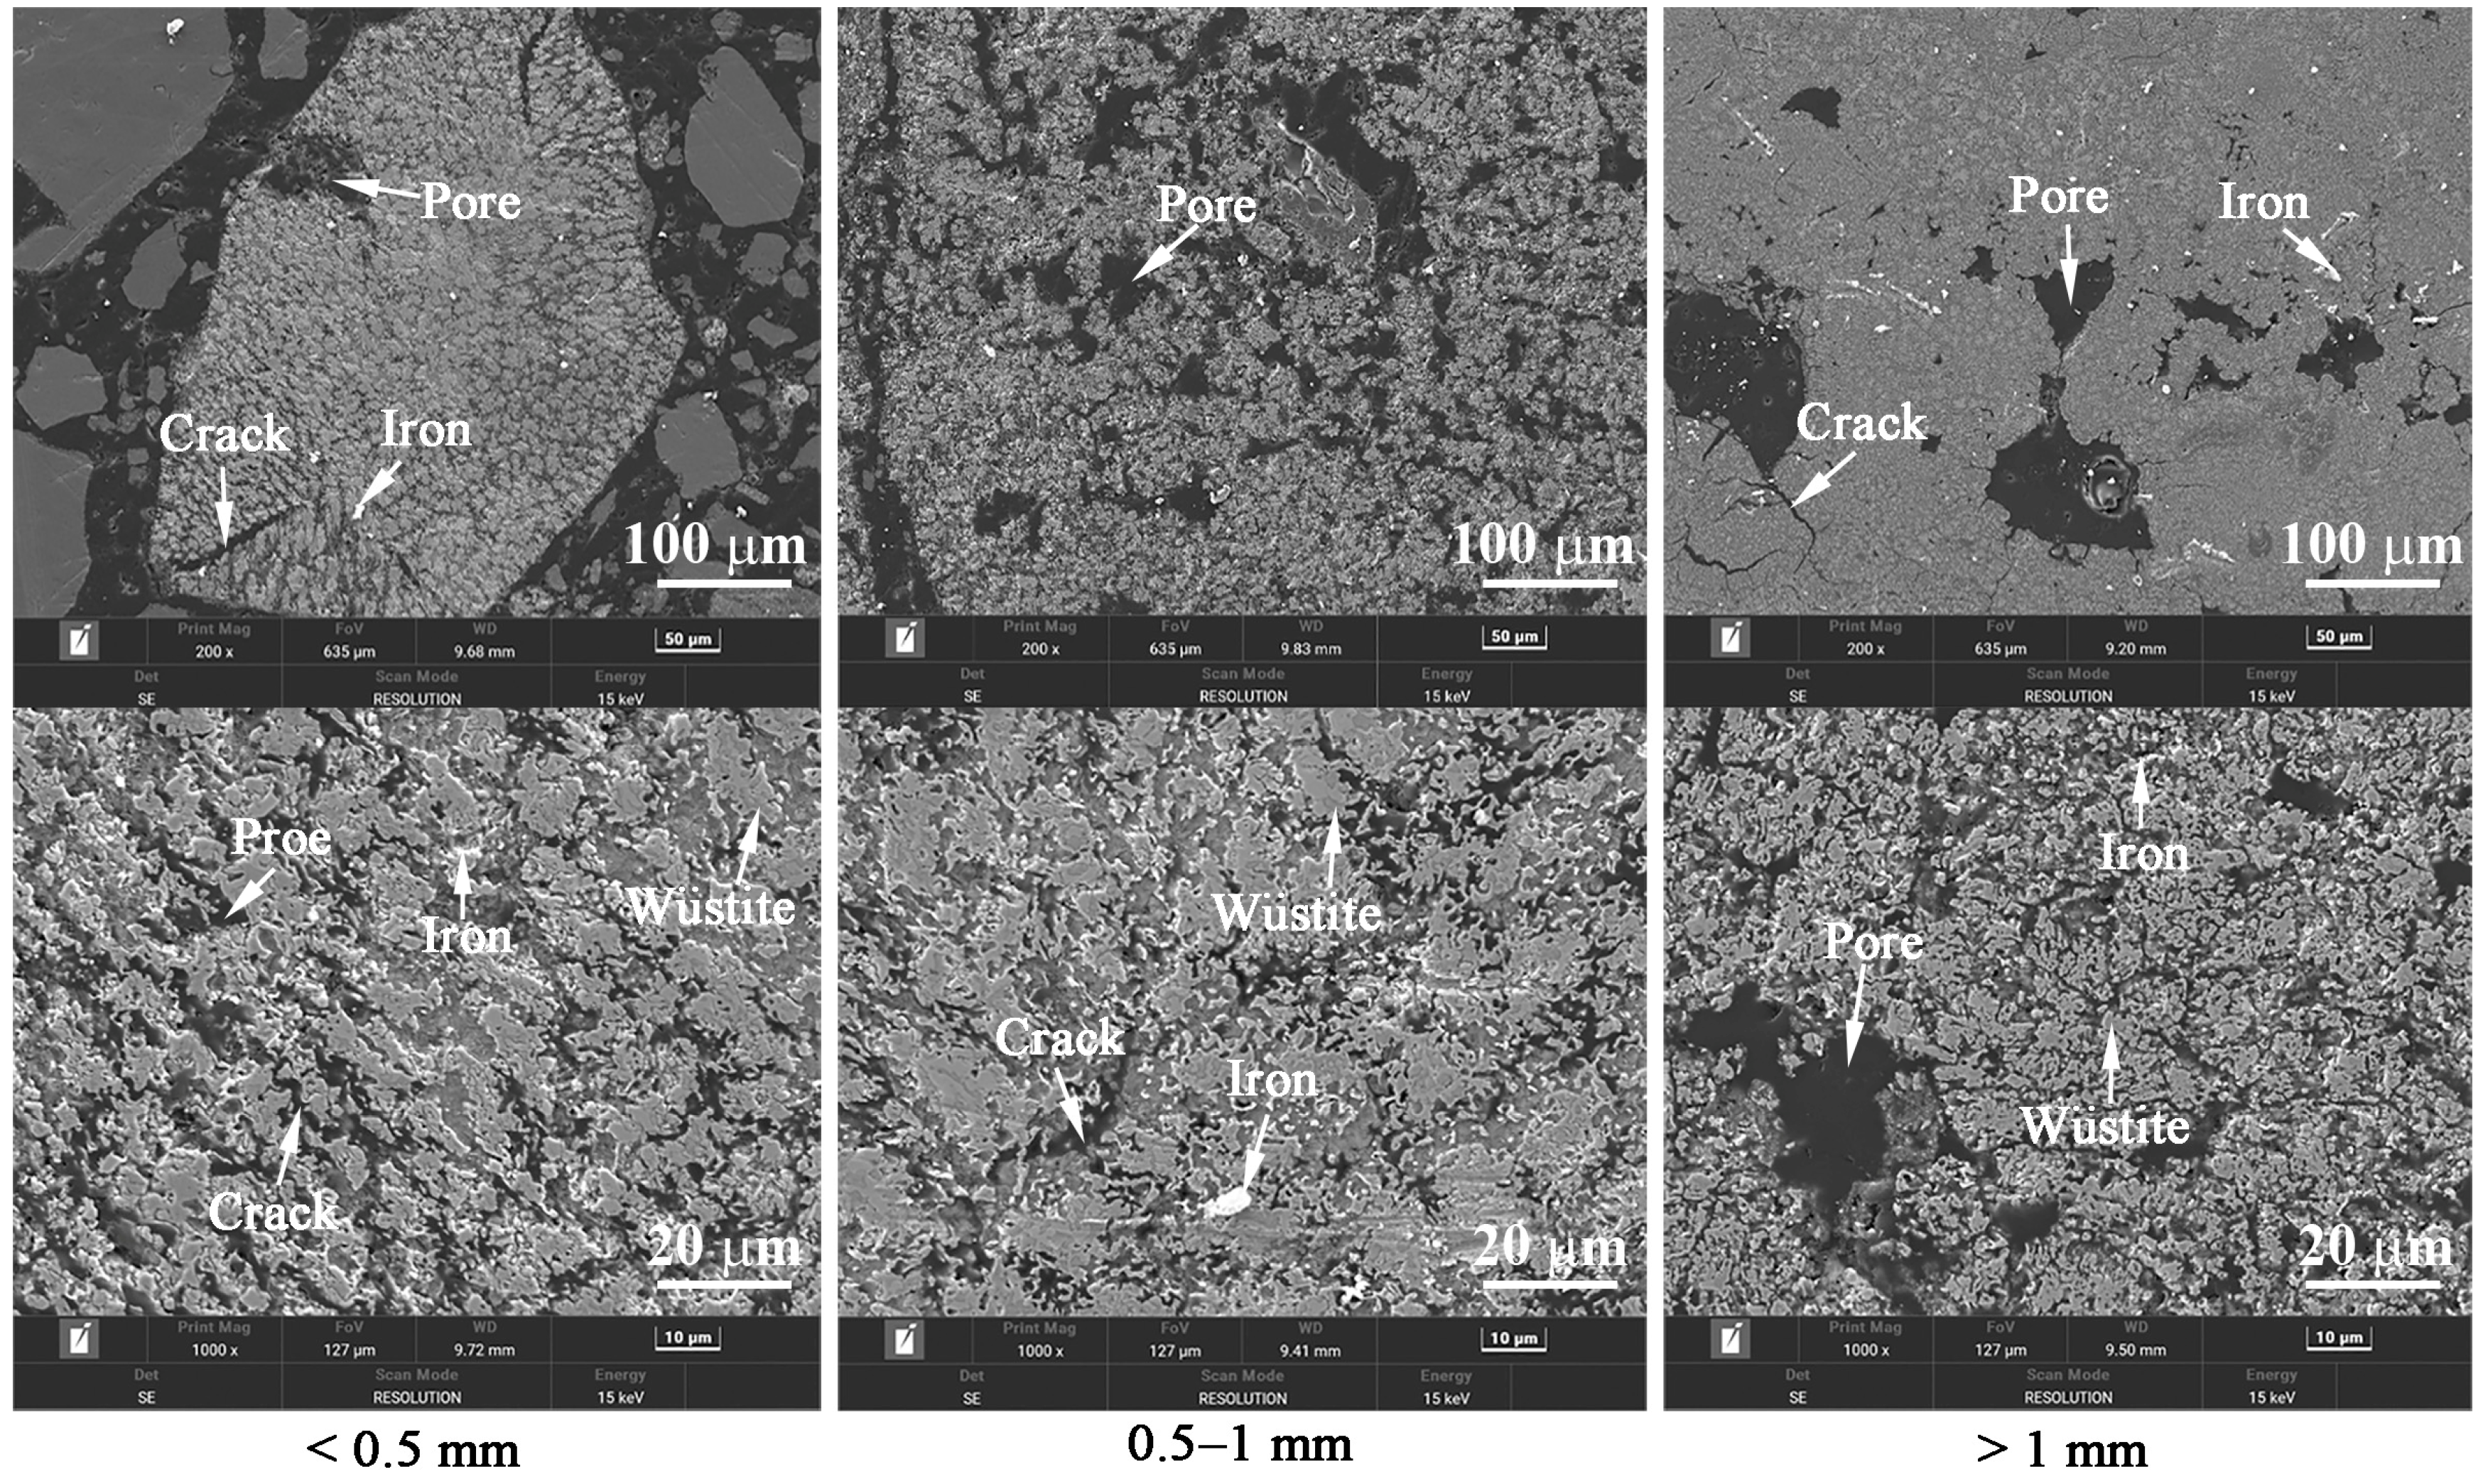
Figure 13.
Microstructures of the product obtained by reduction at 750 °C.
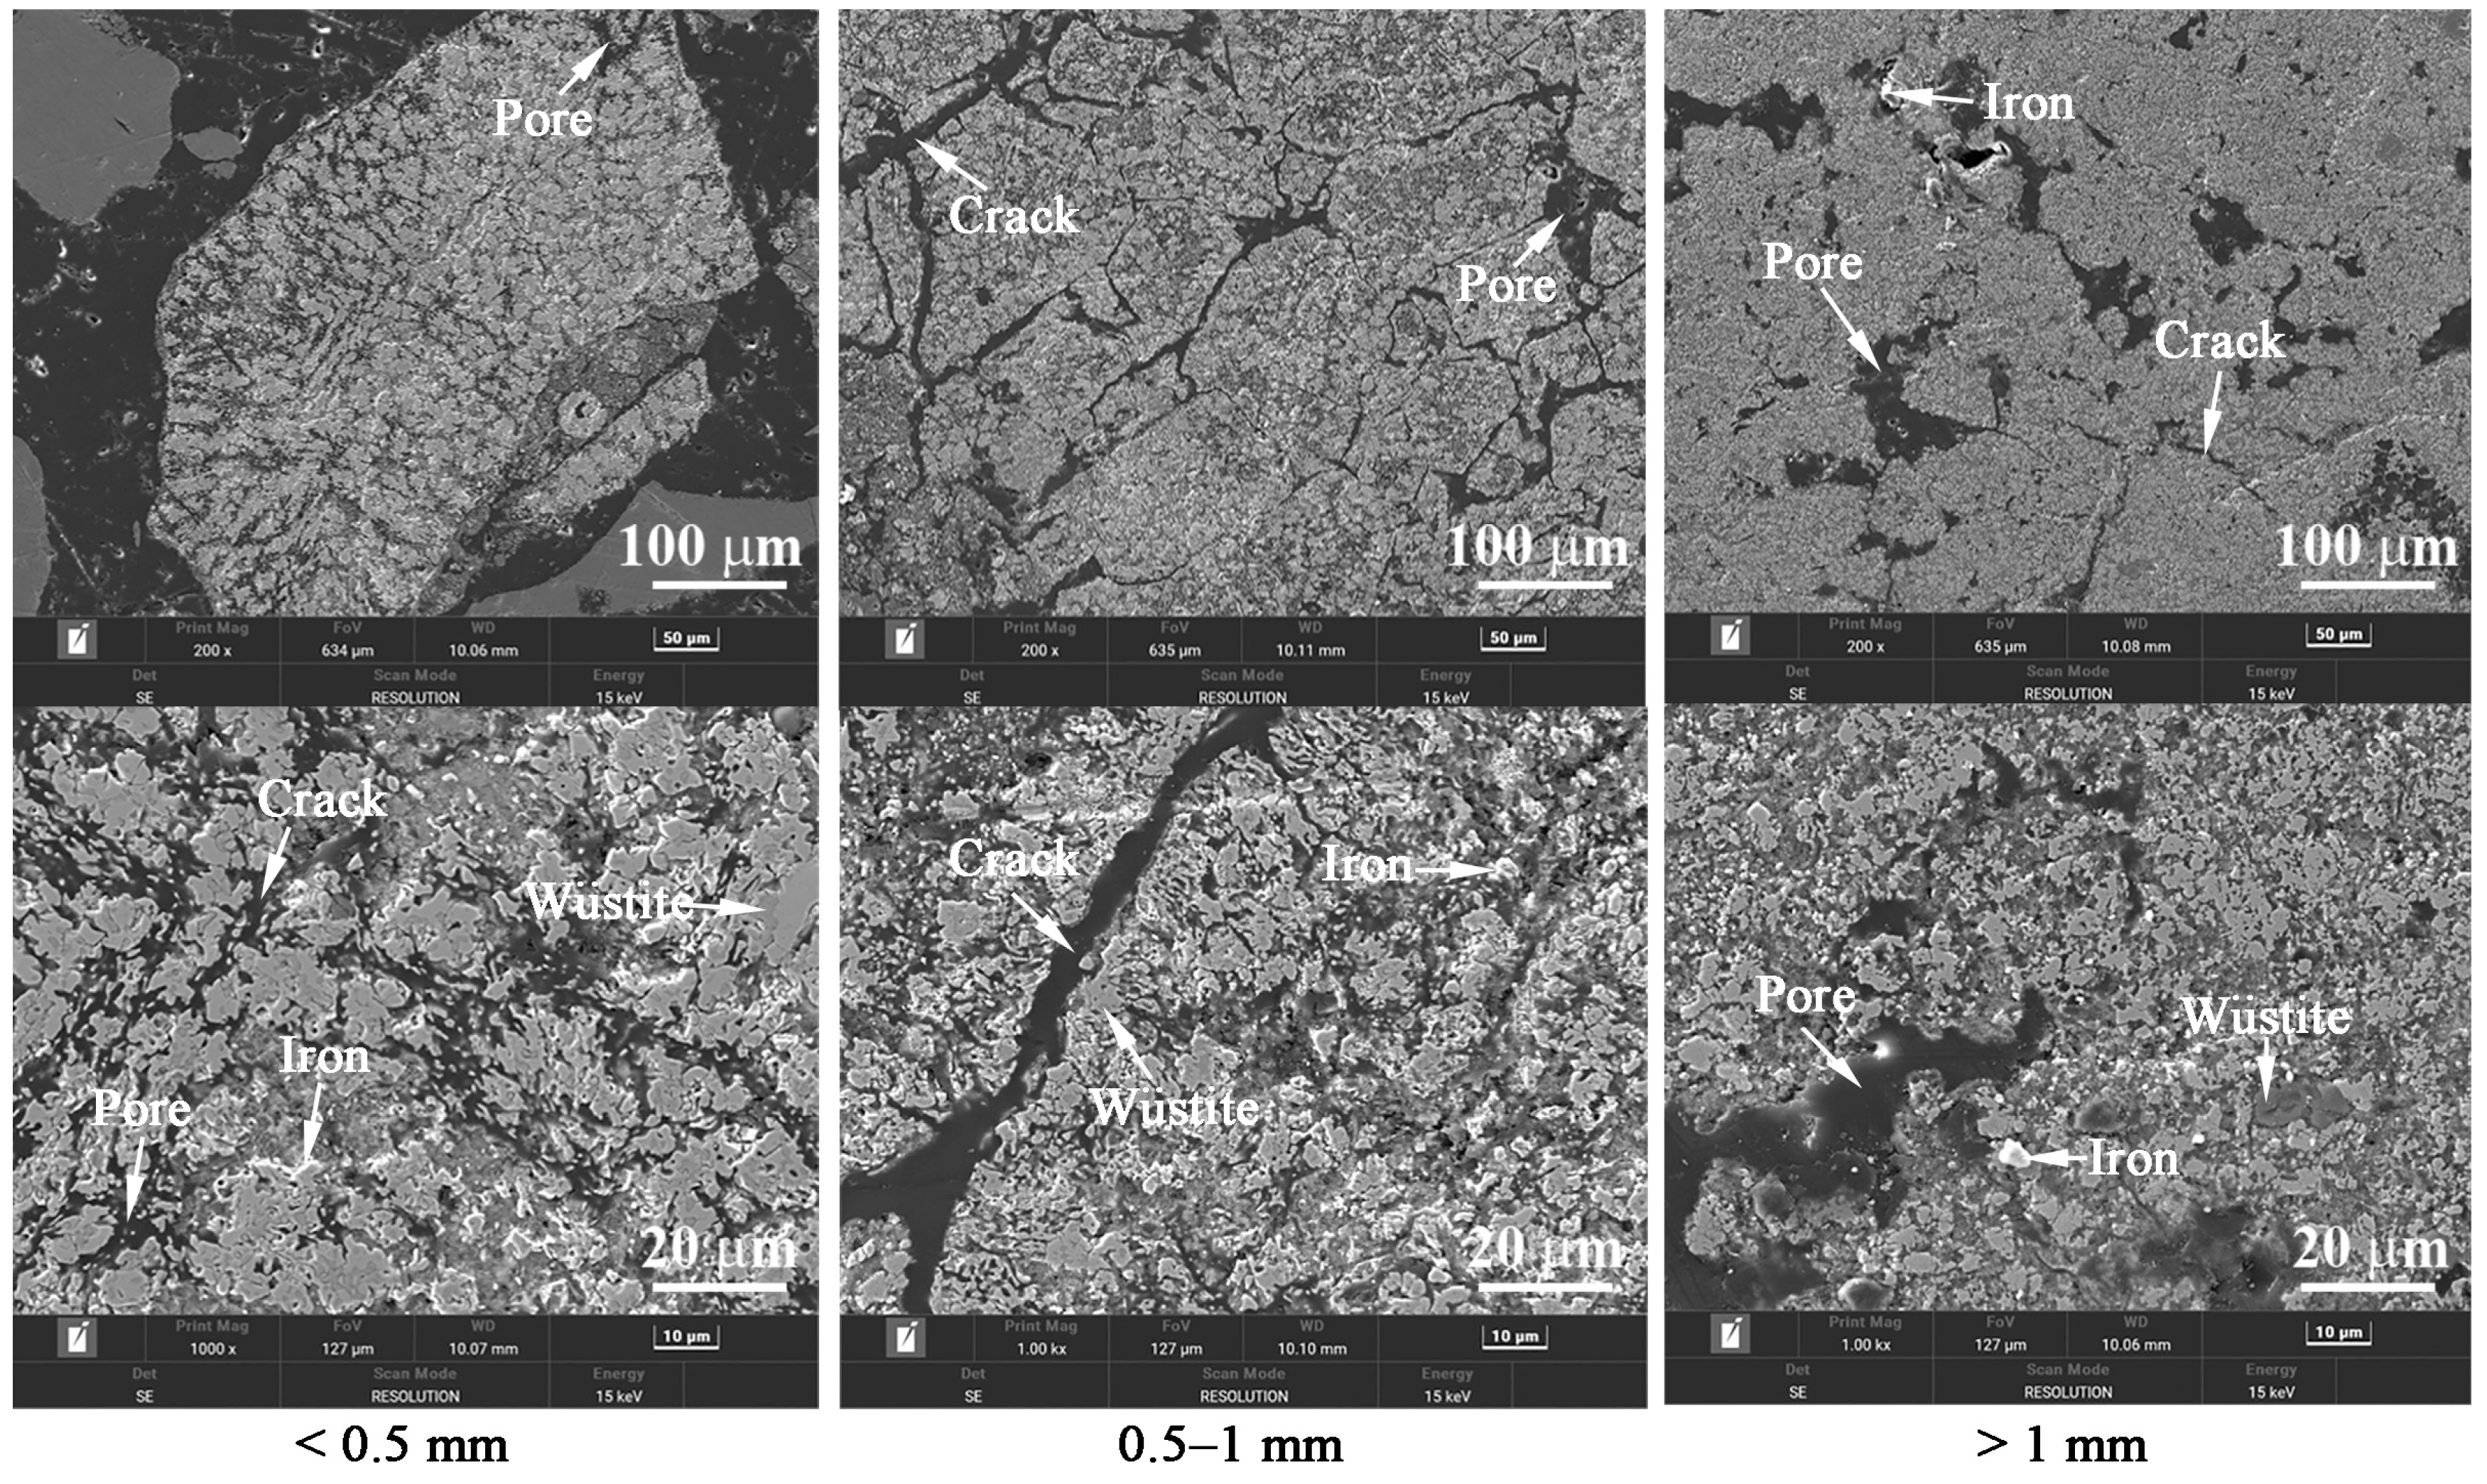
Figure 14.
Microstructures of the product obtained by reduction at 800 °C.
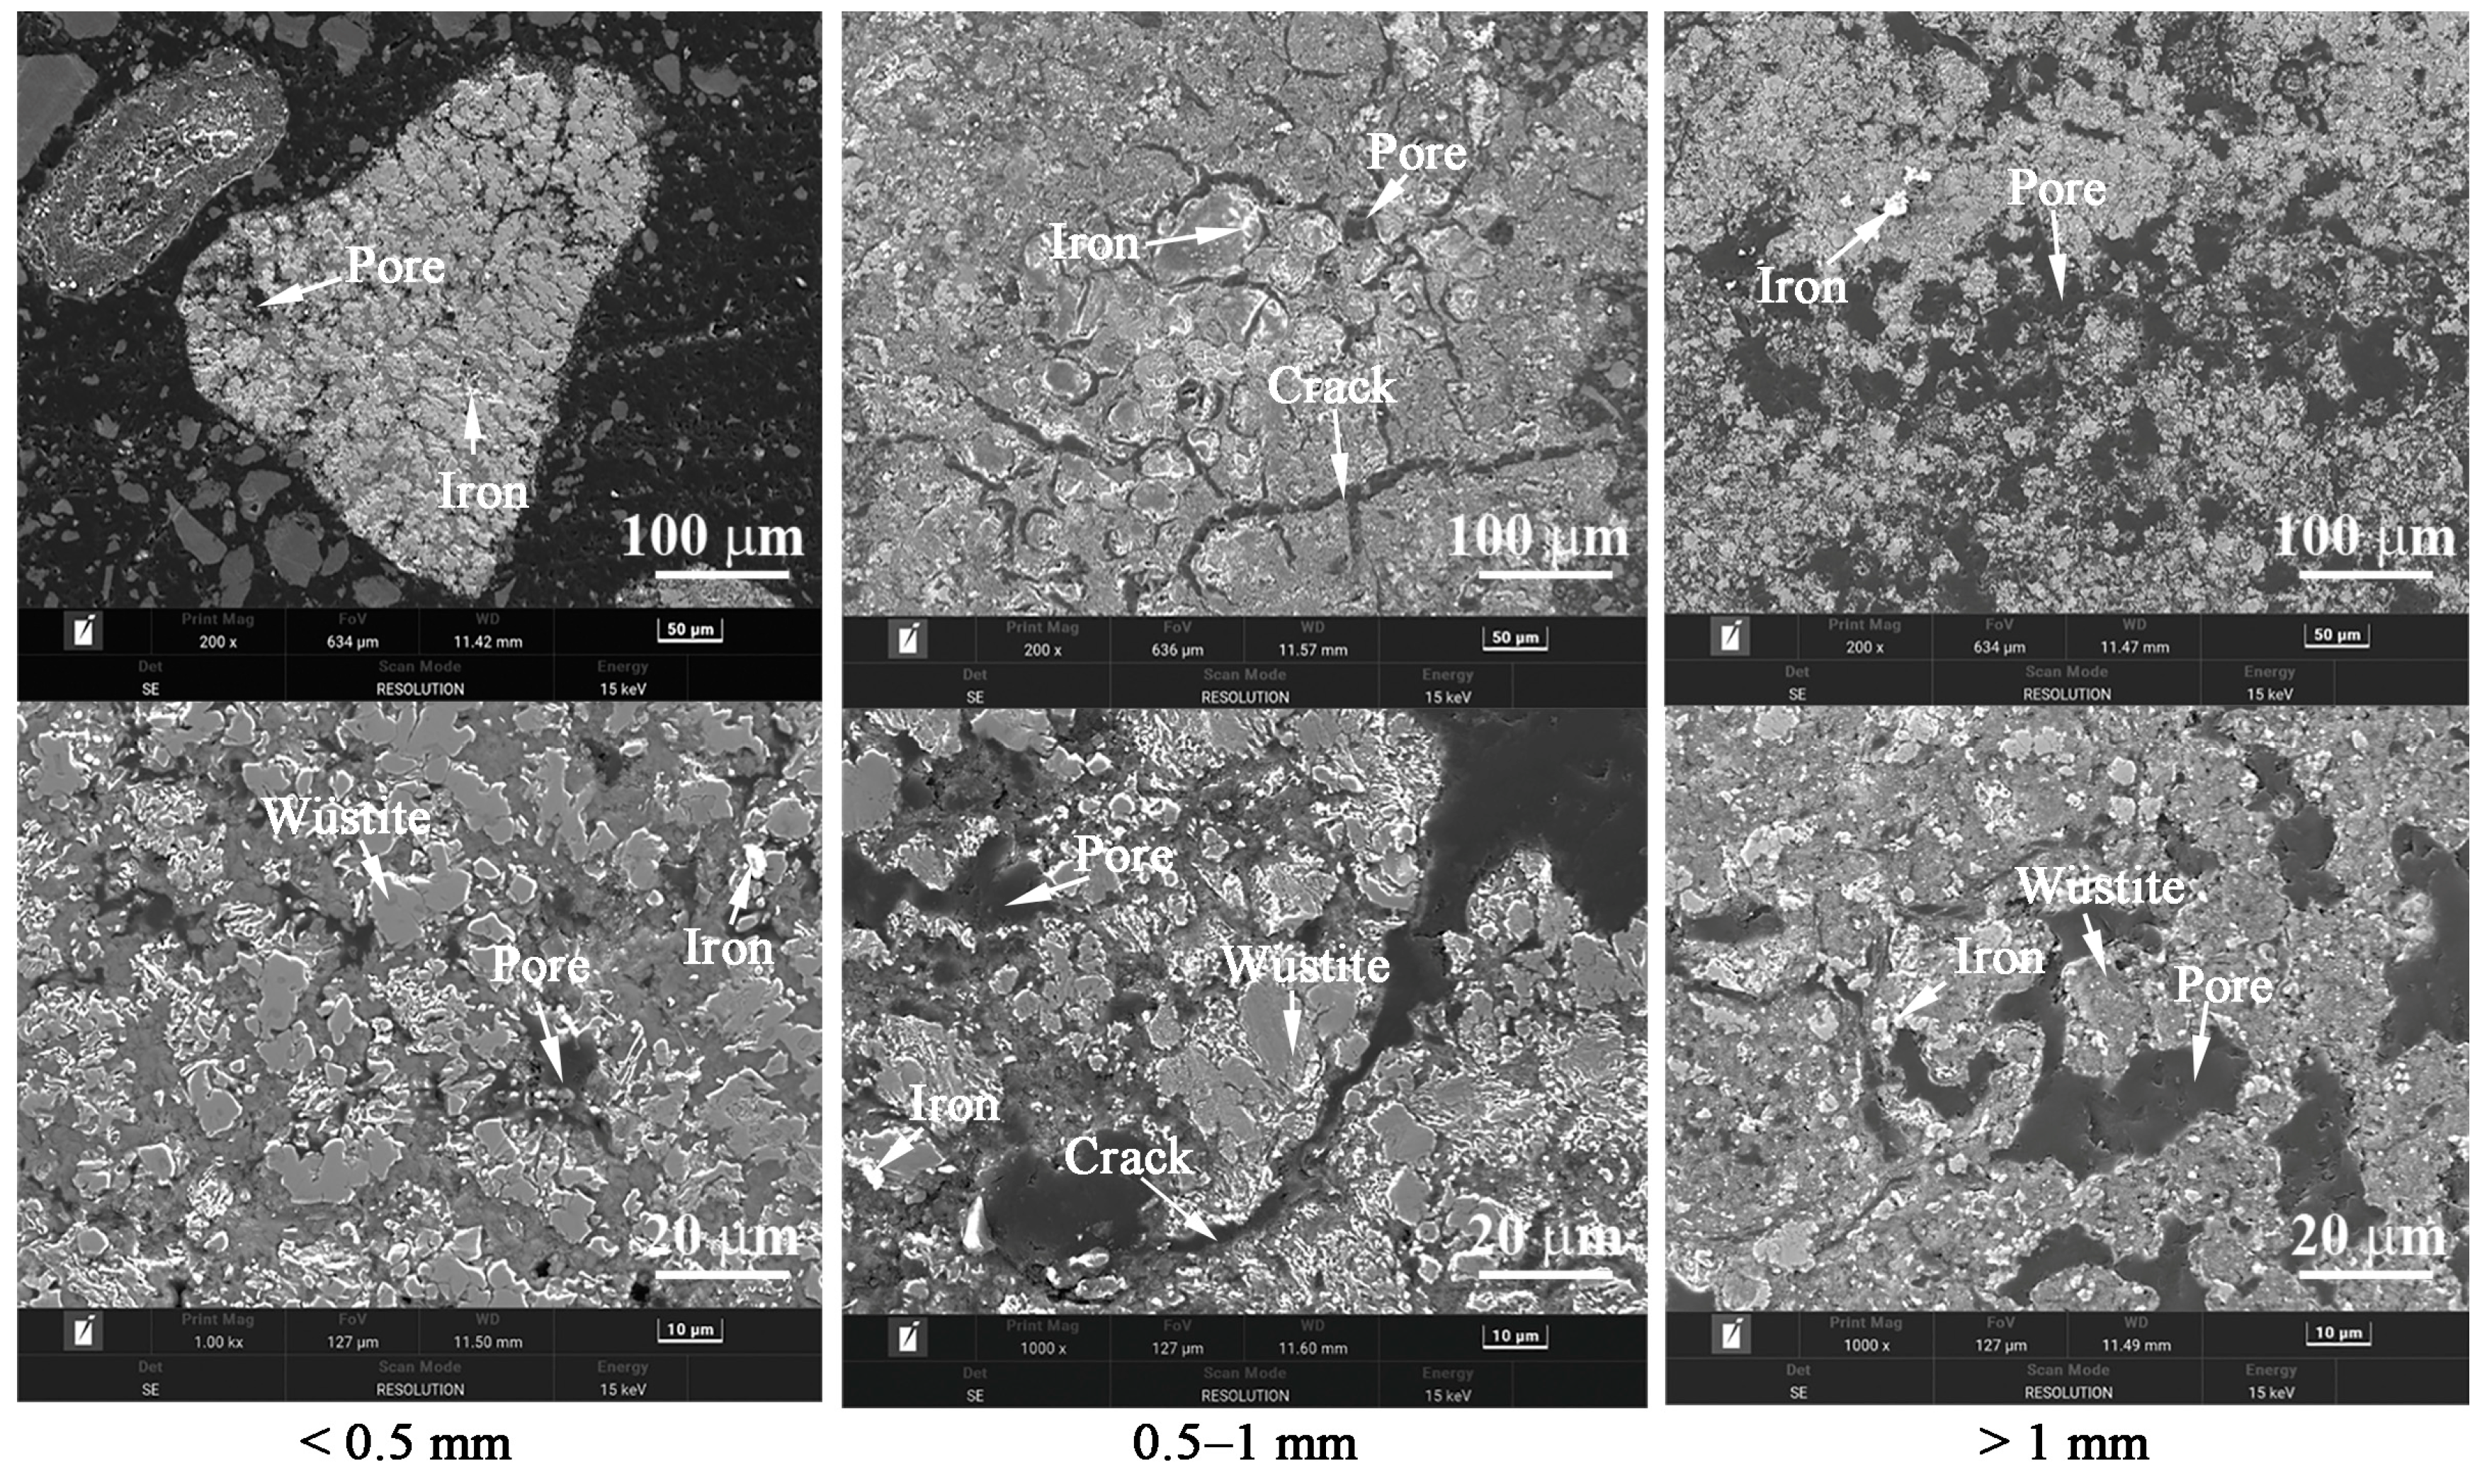
Figure 15.
Microstructures of the product obtained by reduction at 850 °C.

Table 1.
Chemical composition of CRES (wt%).
| Component | Cr | Fe | Ca | S | Cu | Zn | Pb | Ni |
| Content | 36.85 | 4.64 | 2.32 | 2.03 | 0.24 | 0.24 | 0.22 | 0.03 |
| Component | Mg | Al | Si | P | Cl | Na | K | LOI * |
| Content | 0.31 | 0.17 | 0.22 | 0.08 | 0.01 | 0.03 | 0.01 | 25.48 |
* LOI—loss on ignition.
Table 2.
Particle size distribution of CRES (wt%).
| Particle Size (mm) | <0.075 | 0.075–0.15 | 0.15–0.5 | 0.5–1 | 1–3 | >3 |
| Proportion | 9.22 | 14.06 | 15.48 | 34.27 | 15.95 | 11.05 |
Table 3.
Chemical composition of iron ore powder (wt%).
| Component | TFe | FeO | Ca | Mg | Al | Si | Cr | Cu |
| Content | 59.59 | 2.82 | 0.29 | 0.16 | 0.91 | 1.92 | 0.058 | 0.042 |
| Component | Zn | Pb | K | Na | S | P | LOI | |
| Content | 0.034 | 0.008 | 0.022 | 0.019 | 0.063 | 0.051 | 5.72 |
Table 4.
Particle size distribution of iron ore powder (wt%).
| Particle Size (mm) | <0.15 | 0.15–0.5 | 0.5–1 | 1–3 | >3 |
| Proportion | 10.52 | 43.20 | 24.27 | 15.89 | 6.12 |
Table 5.
Standard Gibbs free energy changes of possible reduction reactions of the main components of CRES.
Table 5.
Standard Gibbs free energy changes of possible reduction reactions of the main components of CRES.
| No. | Reaction Equation | Standard Gibbs Free Energy Change |
|---|---|---|
| (4) | ||
| (5) | ||
| (6) | ||
| (7) | ||
| (8) | ||
| (9) | ||
| (10) | ||
| (11) | ||
| (12) | ||
| (13) | ||
| (14) | ||
| (15) | ||
| (16) | ||
| (17) | ||
| (18) |
Table 6.
Chemical composition of the reduction product (wt%).
| Component | Cr | Fe | Ca | Si | Al | Mg | S | Zn | Pb |
| Content | 15.26 | 45.84 | 5.52 | 2.93 | 1.24 | 0.84 | 0.879 | 0.123 | 0.101 |
Disclaimer/Publisher’s Note: The statements, opinions and data contained in all publications are solely those of the individual author(s) and contributor(s) and not of MDPI and/or the editor(s). MDPI and/or the editor(s) disclaim responsibility for any injury to people or property resulting from any ideas, methods, instructions or products referred to in the content. |
© 2024 by the authors. Licensee MDPI, Basel, Switzerland. This article is an open access article distributed under the terms and conditions of the Creative Commons Attribution (CC BY) license (https://creativecommons.org/licenses/by/4.0/).
Share and Cite
MDPI and ACS Style
Zhang, J.; Peng, Z.; Yi, L.; Rao, M. CO–H2 Gas-Based Reduction Behavior of Cr-Rich Electroplating Sludge Mixed with Iron Ore Powder. Metals 2024, 14, 325. https://doi.org/10.3390/met14030325
AMA Style
Zhang J, Peng Z, Yi L, Rao M. CO–H2 Gas-Based Reduction Behavior of Cr-Rich Electroplating Sludge Mixed with Iron Ore Powder. Metals. 2024; 14(3):325. https://doi.org/10.3390/met14030325
Chicago/Turabian StyleZhang, Jian, Zhiwei Peng, Lingyun Yi, and Mingjun Rao. 2024. "CO–H2 Gas-Based Reduction Behavior of Cr-Rich Electroplating Sludge Mixed with Iron Ore Powder" Metals 14, no. 3: 325. https://doi.org/10.3390/met14030325
Note that from the first issue of 2016, this journal uses article numbers instead of page numbers. See further details here.