
Mechanism of Crystallographic Orientation and Texture Evolution of Ti60 Alloy during Plane Strain Compression

1
State Key Laboratory of Solidification Processing, School of Materials and Engineering, Northwestern Polytechnical University, Xi’an 710072, China
2
Western Titanium Technologies Co., Ltd., Xi’an 710201, China
3
Northwest Institute for Nonferrous Metal Research, Xi’an 710016, China
*
Authors to whom correspondence should be addressed.
Metals 2024, 14(3), 359; https://doi.org/10.3390/met14030359
Submission received: 1 February 2024
/
Revised: 6 March 2024
/
Accepted: 8 March 2024
/
Published: 20 March 2024
(This article belongs to the Special Issue Design, Phase Transformation and Mechanical Properties of Titanium Alloy)
Abstract
:The crystallographic orientation and texture evolution mechanism of equiaxed Ti60 alloy plates were investigated in this study through plane strain compression tests. The EBSD analysis revealed that the received plate contained two characteristic textures that were perpendicular to each other, i.e., c-axis//TD (Component 1) and c-axis//RD (Component 2), with the latter being caused by the change in direction of the TD texture that was generated during the previous unidirectional rolling process into an RD direction in the cross-rolling process. The results demonstrated that, with increasing the deformation temperature from 930 °C to 960 °C and 990 °C, the intensity of the c-axis//TD texture (Component 1) initially rose to a peak value of 5.07, which then—subsequently—decreased significantly to 2.96 at 960 °C and 3.11 at 990 °C. Conversely, the intensity of the c-axis//RD texture (Component 2) remained relatively unchanged. These texture changes were correlated with slip system activity and the spheroidization of the primary alpha phase. For the c-axis//TD texture, the initial intensity of the texture components during compression at lower temperatures could be attributed to the incomplete dynamic spheroidization process of the α phase, which leads to the reinforcement of the c-axis//TD due to prismatic slip. As the deformation temperature increased, the dynamic spheroidization process became more prominent, thereby leading to a significant reduction in the intensity of the c-axis//TD texture. In contrast, the c-axis//RD texture exhibited difficulty in activating the prismatic slip and basal slip; in addition, it also encountered resistance to dynamic spheroidization, thus resulting in negligible changes in the texture intensity.
1. Introduction
Near-α titanium alloys are extensively used in jet engines as compressor discs and blades because of their light weight, as well as their superior fatigue and creep properties, at elevated temperatures of up to 600 °C [1,2]. The high-temperature performance of Ti60 alloy is closely related to its composition, hot working capabilities, and heat treatment progression [1,3,4]. In recent decades, a large amount of research has focused on the effect of hot working and heat treatment on the microstructures and properties of the bars and forgings of near-α titanium alloys [3,4,5]. Therefore, the thermomechanical processing route of titanium alloys determines its microstructures and crystallographic texture, and it must be controlled to achieve the optimum combination of mechanical properties [5,6,7,8,9,10].
In recent years, there has been extensive research on the microstructure evolution and slip deformation mechanisms of titanium alloys during deformation [11,12,13,14,15,16]. Researchers have found that due to the HCP structure of α grains, prismatic slip and basal slip systems are more likely to be activated than pyramidal <c+a> slip systems during the hot compression process, which will lead to the development of a texture with specific orientations (particularly with respect to the c-axis//TD texture during the plate rolling processes [7,17,18]). The evolution of textures during rolling processes has a significant impact on their performance. Scholars have begun to focus on the influence of factors such as temperature, strain rate, and the strain on texture formation to further enhance the performance of plates [19,20,21,22]. Wu et al. [19] conducted hot compression experiments on the Ti55531 alloy in the dual-phase region. They found that the texture intensity initially decreased and then increased with increasing deformation, and they explained these phenomena through deformation heat, dynamic phase transformation, and other mechanisms. Li et al. [20] found that the mechanical performance anisotropy was related to factors such as the T-type texture effects on Schmid factor distribution and dislocation slips. Sahoo et al. [21] discovered that unidirectional and multi-directional rolling affects the texture evolution of pure titanium plates, with basal textures being dominant. Therefore, different rolling methods have resulted in different basal or transverse texture components, thus weakening the texture intensity. These studies provide valuable insights into the plate rolling processes for titanium alloys, thereby emphasizing the profound research value of various process parameters for Ti60 plates.
Additionally, in the thermal processing and heat treatment of titanium alloys, processes such as holding, deformation, and cooling are commonly encountered. These processes involve the initiation of slip systems, spheroidization, etc., and they also significantly affect the formation and evolution of microstructural textures [22,23,24,25,26,27,28]. For instance, Wang et al. [26] employed a crystal plasticity model to analyze non-uniform deformation and orientation evolution during the compression of a TA15 alloy, and they also explained the non-uniform grain spheroidization behavior from the perspective of crystal orientation angles and the linked orientation spreading to the activation of slip systems, dynamic spheroidization, and other microstructural phenomena. Xu et al. [27] used various heat treatment methods on dual-phase titanium alloys to describe how grain boundary separation is a transformation process from low-angle grain boundaries to high-angle grain boundaries, which then proceeds to separation. The rolling process of equiaxed structure plates involves the dynamic spheroidization of α laths, a phenomenon known as dynamic spheroidization during rolling. The mechanism typically involves sub-boundaries converging along the transverse boundaries of the α laths, which is followed by the diffusion of the β phase into the transverse interfaces, thereby forming thermally induced grooves. In the final stage of dynamic spheroidization, interface separation occurs, thus leading to the fragmentation of the laths and the formation of equiaxed α grains [28]. The above findings mean that there is a better understanding of the orientation evolution of titanium alloys in thermal processing. In particular, the regulation of the texture of Ti60 plates is crucial and significantly affects the mechanical properties of the plates. The objective of this paper was to investigate the crystal orientation and texture evolution mechanisms in equiaxed Ti60 alloys during the cross-rolling process under different temperature conditions. While there has been extensive discussion on the slip behavior and spheroidization mechanisms of lamellar structures during deformation, research in the field of cross-rolling for plates, especially for equiaxed Ti60 alloys, is relatively lacking. Therefore, this study helps to reveal the crystal orientation and texture evolution mechanism of equiaxed Ti60 alloy plates during the rolling process, and it can also provide possibilities for obtaining reasonable processing temperature conditions. In this study, we discussed the difference in the texture evolution of the primary α-phase and secondary α-phase under different temperature conditions; in addition, the texture weaking and evolutions of typical texture components have also been reasonably analyzed. Moreover, we applied plane strain compression to simulate the rolling process, which is an excellent method to simulate the plate rolling process. Compared to uniaxial compression, plane strain compression is a more suitable deformation method. It is commonly used for predictive research on the rolling process because the rolling process is, in actuality, a plane strain state. The plate is subjected to compressive stress that is parallel to the compression direction, and the shear stress is parallel to the rolling direction without being subjected to external force in the transverse direction, which is completely different from the stress state of uniaxial compression process. In addition, compared to actual rolling production, the use of plane strain compression experiments greatly reduces research costs, and the results can provide valuable insights for optimizing the parameters in the processing of near-α titanium alloy plates.
2. Materials and Experiments
The original material used in this study was derived from a Ti60 plate that underwent unidirectional rolling in the α+β dual-phase region, which was followed by a subsequent cross-rolling process. The above two processes were the processing history of the original material. The plane strain compression experiment in this paper was conducted to simulate the second cross-rolling process on the original material (the detail of the processes is shown in Figure 1). The nominal composition of the alloy was Ti-5.7Al-4Sn-3.5Zr-0.4Mo-0.4Si-0.4Nd-1Ta-0.05C. The initial microstructure of the plate was equiaxed, and the β transformation temperature was around 1040 °C. To ensure uniformity in the microstructures of the samples, the samples were selected from the same positions of the Ti60 plate. The sample dimensions were 20 mm × 15 mm × 10 mm. Prior to the compression experiments, the samples were polished to minimize the influence of friction during compression. The samples were heated to 930 °C, 960 °C, and 990 °C at a heating rate of 5 °C/s (which was held for 5 min). After the holding period, compression was carried out at a strain rate of 1 s−1 with a deformation of 50%. Since this compression experiment simulates the second cross-rolling process, the compression direction was in a normal direction (ND), and the angle between the first cross-rolling direction and the second rolling direction (RD) was 90°. The samples were air-cooled after the compression. A schematic of the compression process and the EBSD observation area are shown in Figure 2.
The samples taken from the central region of the compression area were collected for microstructure characterization using a scanning electron microscope (SEM). More detailed crystal orientation information was collected using electron backscatter diffraction (EBSD) for the texture analysis. For both the SEM and EBSD analyses, all of the samples underwent sanding with 2000-P abrasive papers and mechanical polishing using SiO2 polishing liquid. The samples for SEM imaging were etched using Kroll’s reagent (2% HF, 6% HNO3, and 92% H2O). The EBSD samples were then electro-polished in a solution of 5% perchloric acid, 35% butanol, and 60% methanol at approximately −30 °C. The EBSD analysis was conducted with a step size of 1 μm on a Tescan Mira 3 scanning electron microscope. As for the EBSD treatment in this study, a cleaning procedure was used to optimize the quality of the orientation maps. To further analyze the different microstructures in the material, primary α (αp) grains were separated from the secondary α (αs) grains using optical images captured from the corresponding EBSD scan areas, and this was based on the morphological differences between the αp and αs grains. Additionally, the different typical textures corresponding to specific grains were distinguished by selecting PF-specific regions, and these were then subjected to statistical analysis.
3. Results and Analysis
3.1. Microstructure Characterization
The original microstructure of the initial plate and the samples after compression at different temperature conditions are depicted in Figure 3. It can be observed that varying the processing temperature did not significantly alter the microstructure type. Due to the phase content of the β phase being very low in Ti60 alloys (i.e., less than 1%), it appeared in the primary α-phase and transformed β-phase (βt) after compression.
The statistical results of the phase constitution and the average size of the phase under different conditions were obtained through Image-Pro Plus (IPP) 6.0 software, as respectively shown in Table 1. As the processing temperature increased, the volume fraction of the primary α-phase decreased from 68.1% to 52.3%. This was due to the fact that, during the isothermal stage of the plane compression in the dual-phase region, the primary α-phase underwent a phase transition toward the β phase, thus resulting in varying degrees of dissolution [29].
Since the initial plate had undergone multiple rolling processes, the original microstructure contained equiaxed and elongated morphologies of the primary α-phase, which was caused by the rolling procession and the αs lamellar presenting a short rod shape (Figure 3a). In addition, the aspect ratio of the grains increased while the number of equiaxed α phase grains decreased, with most grains appearing flattened in the microstructure after deformation. The secondary α-phase precipitated from the β phase during the cooling process appeared thinner than the original microstructure, and this was found to be related to the cooling rate. At 930 °C, the primary α-phase grains were relatively dissolved when compared to the original microstructure, and the average grain size was about 27.8 μm (Figure 3b). At 960 °C, the content of the primary α-phase decreased, and the average grain size further reduced to about 26.1 μm (Figure 3c). When the processing temperature was 990 °C, which was closer to the phase transition temperature, the dissolution of the primary α-phase was more pronounced and the volume fraction decreased to 52.3%. The proportion of the equiaxed morphology decreased, and the average grain size was smaller than at lower temperatures (Figure 3d). Additionally, by comparing the primary α grains with larger aspect ratios, it could be observed that the new grain boundaries perpendicular to the elongation direction were formed after compression under higher temperature conditions, such as 960 °C and 990 °C (Figure 3c–e).
3.2. EBSD Analysis of the Orientation and Texture Evolution
3.2.1. Characterization of the Typical Texture
The inverse pole figure (IPF) and pole figure obtained are shown in Figure 4. Two predominant crystal orientation textures were observed. They were characterized as having the c-axis//TD (Component 1 texture) and c-axis//RD (Component 2 texture). The presence of these two texture types in the original microstructure resulted from the initial rolling process. During the cross-rolling process, the formation of Component 1 with c-axis//TD [30] was observed. Meanwhile, Component 2 was found to be caused by the change in direction of the TD texture, which was generated during the previous unidirectional rolling process into the RD direction and was retained in the cross-rolling process. Consequently, the combination of unidirectional rolling and cross-rolling processes led to two different types of textures with mutually perpendicular orientations.
The plane strain compression experiment was conducted to simulate the secondary cross-rolling of the initial plate. Following this, crystal orientation information under different temperature conditions was obtained. Under these different conditions, TD-IPF and Kernel average misorientation (KAM) maps and pole figures were constructed, as shown in Figure 4. It should be noted that, for ease of comparison with the pole figures of the classic direction of the plate in the literature, the normal direction of the TD in the pole figures in this paper was adjusted from the center to be vertically upward. The detailed coordinates of the adjusted pole figures are indicated on the right side of the figures for reference. Additionally, it can be observed that some of the grains exhibited a significant c-axis//TD crystal orientation distribution. The distinguishing feature was found to be the precise c-axis//TD orientation (indicated in red) and the presence of slightly deviated similar orientations (indicated in pink). By comparing the original microstructure and the three different processing temperature microstructures shown in the pole figures (where the pole figure coordinate system corresponds to the cross-rolling coordinate system), it was found that none of the four conditions showed the presence of the basal texture with c-axis//ND orientation (Figure 4). This suggested that the formation of a basal texture was not favorable in this material during the simulated plate rolling, and it was also found that the original microstructure and different temperature conditions exhibited the same texture types. When examining the distribution in the pole figures, the orientation of the grains in the original microstructure was more scattered (Figure 4a), thus indicating the presence of both Component 1 and Component 2 textures but with relatively low intensity. In the microstructures observed under 930 °C conditions, the distribution of the crystal orientations was more focused on TD (Figure 4b). Additionally, it was observed that the intensity of the Component 1 texture relative to the Component 2 texture increased. When comparing the maximum values in the pole figures (Figure 4), it was found that when the compression temperature was 930 °C, the maximum values were higher than in the original microstructure and in the other two compression temperature conditions. Under the 960 °C and 990 °C conditions, the orientation distribution in the pole figures became more dispersed and uniform than under 930 °C conditions. This phenomenon indicated that there are evident differences in the intensity of a texture under different compression temperature conditions.
3.2.2. Textures of the αp Grain and αs Lamellar Microstructures
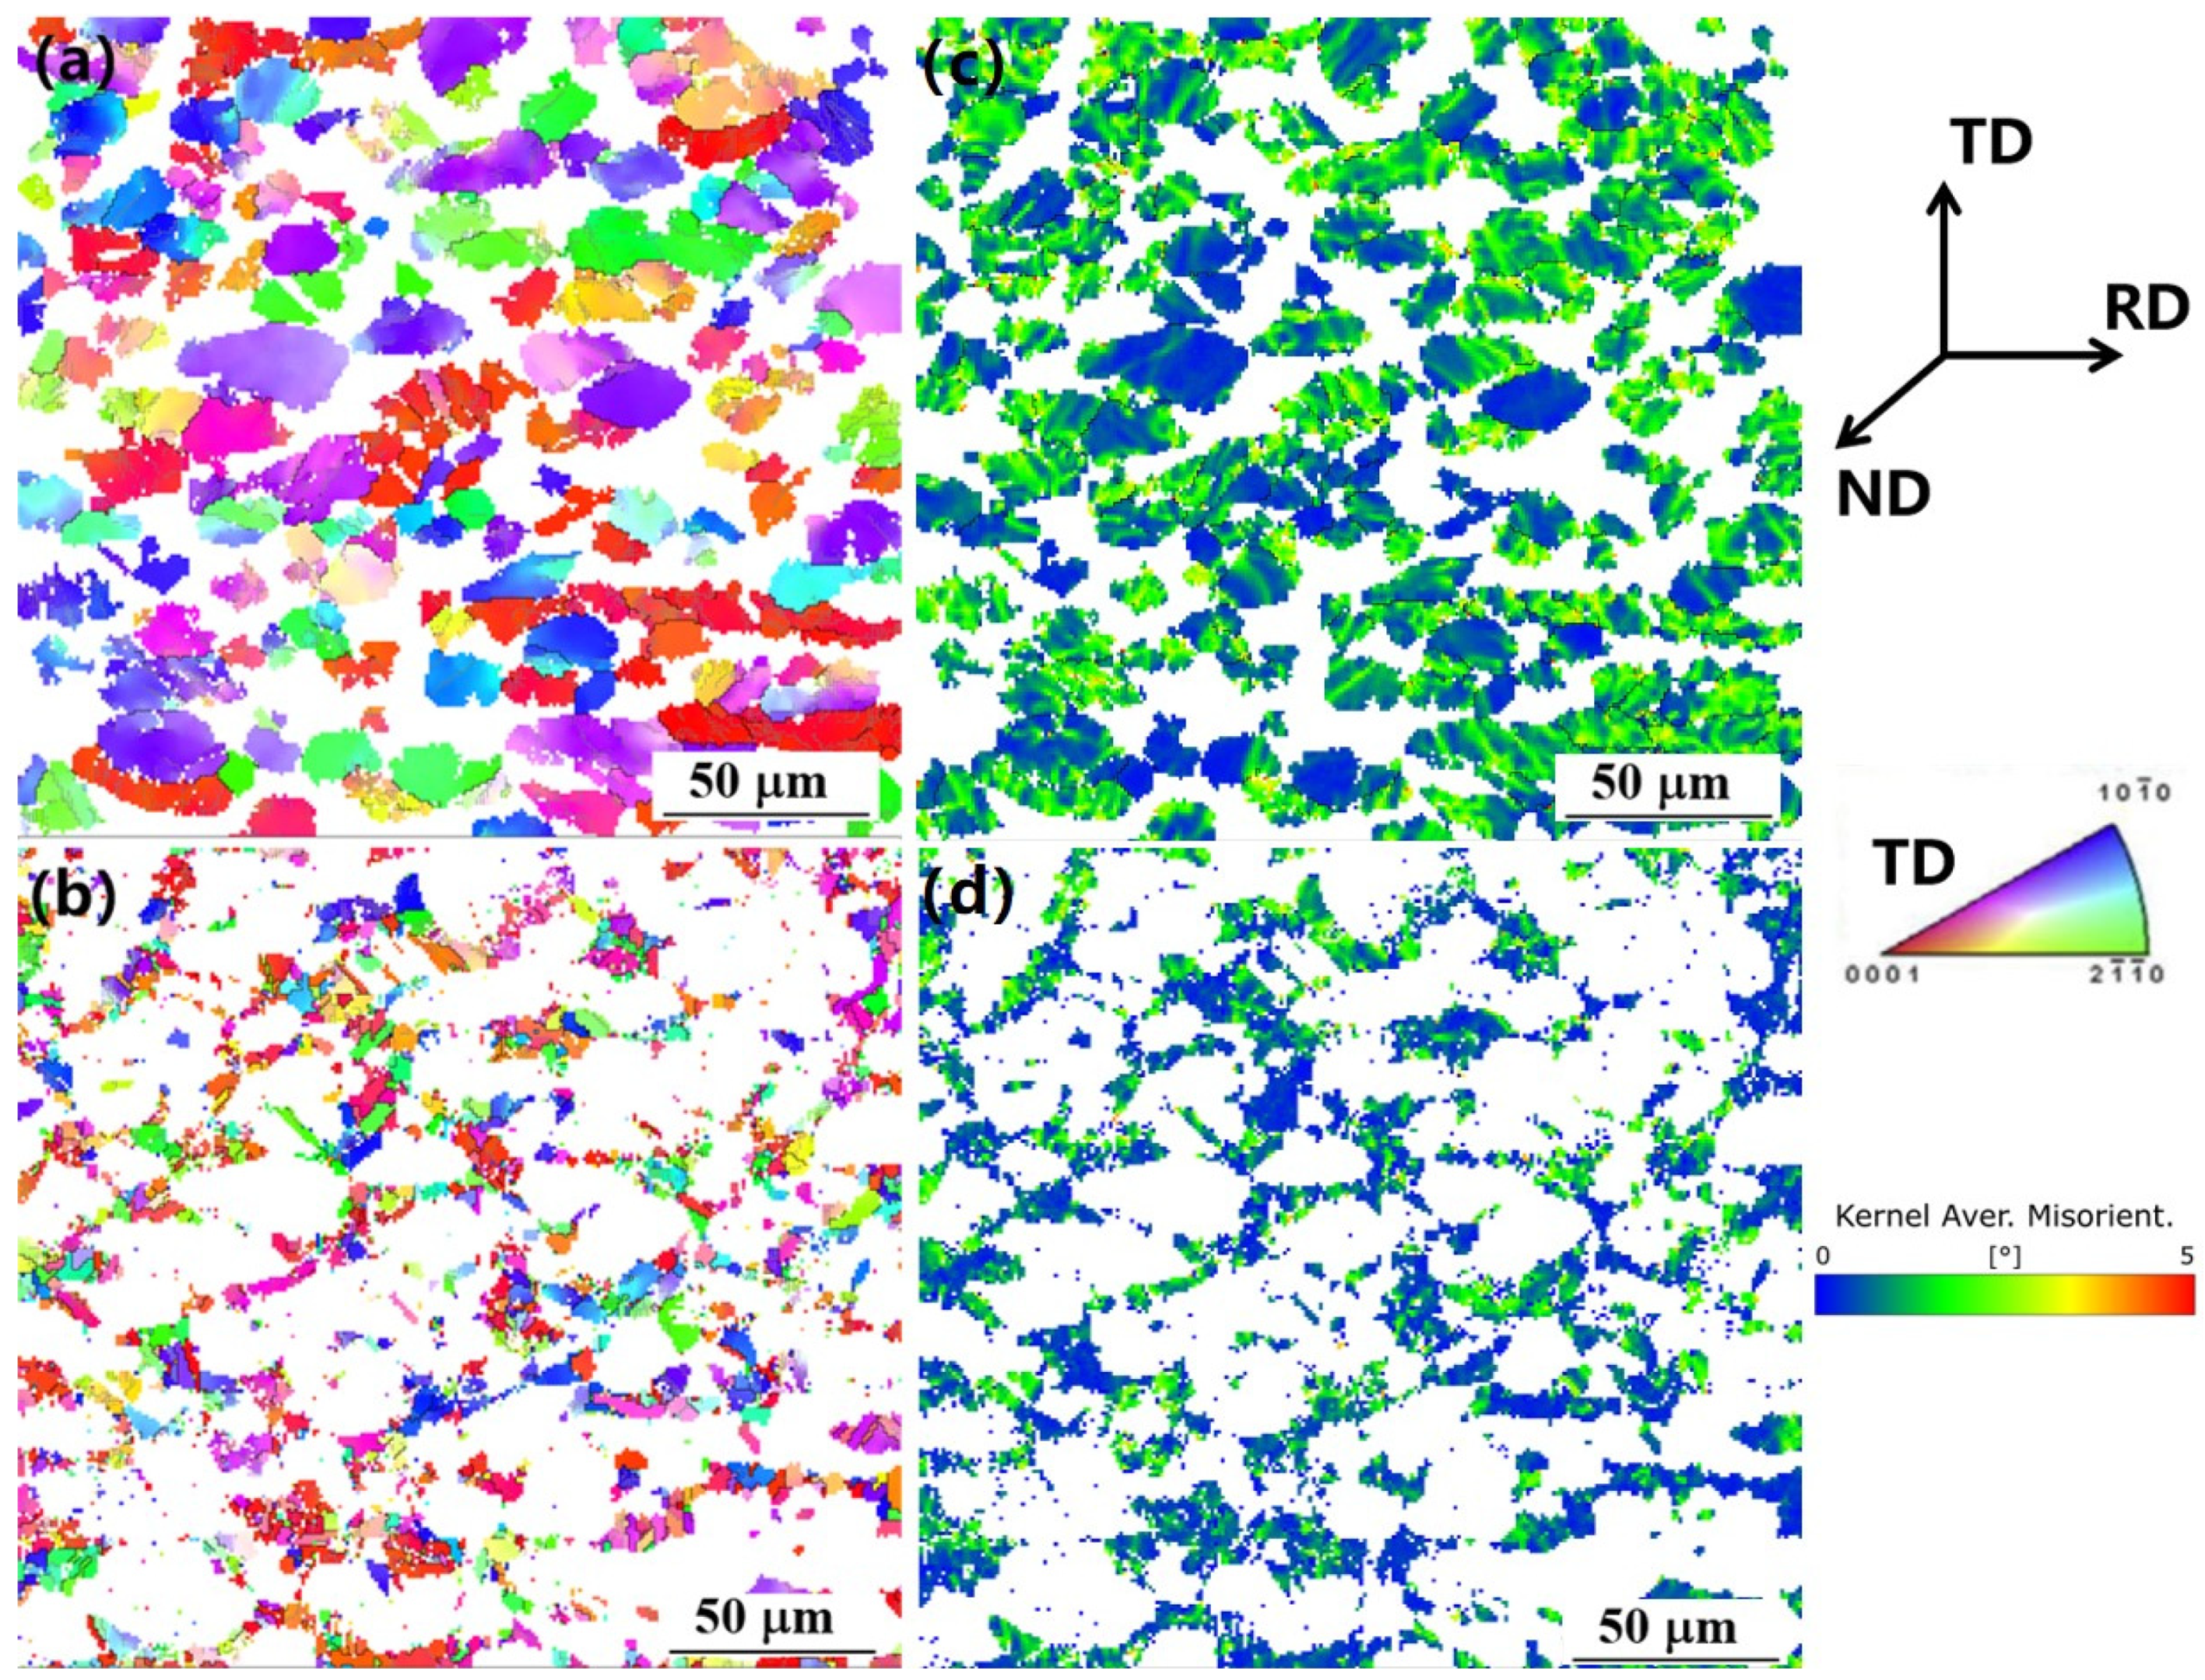
There were differences found in the αp volume fraction of the dual-phase components under various processing temperature conditions. Therefore, it was essential to investigate the behavior of the texture evolution in the primary and secondary α-phases during plane strain compression simulations. By utilizing Aztec Crystal 2.1 software, specific regions in the IPF maps that closely approximated the overall crystal orientation distribution were selected to differentiate between the primary α-phase and the secondary α-phase. A comparative analysis of the IPF maps and KAM maps for different phases was conducted, as shown in Figure 5. It was observed in the IPF map of the original microstructure that the grains of the secondary α-phase exhibited a dispersed orientation distribution without any clear orientation concentration (Figure 5b). This was due to the prior β-phase also having been affected by the compression as its grain orientation was dispersed. The orientation of the secondary α-phase might be attributed to the variant selection that was influenced by the prior β-phase and the primary α-phase during the cooling process after compression; in addition, the content of the β phase at different temperatures was also related [31]. Moreover, Figure 5c,d show the alloy’s KAM maps of the primary and secondary α-phases. It can be observed that most of the grains in the primary α-phase had high dislocation density. There are also a few grains with low dislocation density, thereby indicating that such grains are less prone to deformation during the compression process. As for grains in the secondary α-phase, there is generally a lower dislocation density inside the grains, which is because the secondary α-phase precipitates from the prior β-phase during the cooling process. The dislocation density of these grains was minimally affected by the compression process.
The pole figures corresponding to the original microstructure and the microstructure obtained after compression at 930 °C are depicted in Figure 6. The pole figure for the primary α-phase closely matched the overall pole figure distribution, while the pole figure for the secondary α-phase lacked any significant orientation concentration as the grain orientation distribution was more scattered. In observing the plane strain compression results at 930 °C conditions, it was evident that the maximum intensity of the pole figure for the primary α-phase significantly increased and surpassed the maximum intensity of the pole figure for the secondary α-phase; in addition, it also resembled the characteristics of the pole figure for the entire microstructure. The morphological characteristics of the primary α-phase, the proportion of the phase composition, the crystal orientation transitions, etc., were closely associated with the texture that was produced during rolling, as well as with the macroscopic material performance.
After undergoing the compression processes at different temperatures, the primary α-phase exhibited a trend of dispersion as the temperature increased to 960 and 990 °C, as shown in the <0001> pole figure (Figure 4). This phenomenon was particularly evident in Regions A and B of the <100> pole figure (Figure 6e). Based on these observations, it is believed that the dispersion of the primary α-phase orientation may result from the change in microstructures during the deformation processes as the temperature increases.
The texture index was considered for estimating the scattering of the pole figure. We defined the ratio of the texture intensity after the elimination of background ghost at the standard position to the maximum scale of the pole figure as the texture index, as shown in Table 2. A higher texture index implies a more concentrated orientation distribution within the microstructure. Upon further comparison of the texture index changes under different conditions, it was evident that for both the primary α-phase and the secondary α-phase, the texture index was highest at 930 °C and decreased as the temperature rose. Moreover, the texture index of the primary α-phase was found to be clearly higher than that of the secondary α-phase and the entire process. This observation suggested that, after undergoing the plane strain compression process, certain grain orientations become concentrated in specific directions during compression at 930 °C conditions. In contrast, the changes in the texture index of the pole figures under the 960 °C and 990 °C compression conditions were found to be relatively small. According to a previous study on the spheroidization process of Ti-55511 alloy during hot compression [32], the grain orientation changes in the temperature range of 960–990 °C are due to the possible spheroidization process, which offsets the increase in the texture intensity caused by deformation. Thus, the change in texture intensity during simulated compression might be influenced by the synergistic effect of spheroidization and deformation. In considering the trends in the maximum intensity of the overall pole figures, it can be inferred that the study of the changes in the intensity of different texture types may help explain the variations in microstructures under different compression temperatures.
3.2.3. Texture Evolution of αp during Plane Strain Compressions
Considering that there was mainly the primary α-phase in the microstructures of the experimental materials, as has been found in previous analyses, it can be considered that the primary α-phase plays a dominant role in microstructure evolution during compression. To investigate the specific intensity of the Component 1 and 2 textures in the primary α-phase in the original and different processing temperature conditions, we distinguished the grains with these two texture components and obtained the misorientation of the different types of grains. The grains with the corresponding orientations could be identified by selecting the region containing the concentration points of the two orientations in the pole figure. Since the texture intensity can be approximated by the volume fraction of particles with the same orientation, the image pixel statistics from Image-Pro Plus (IPP) 6.0 software were used to determine the percentage of the pixels of particles with the c-axis parallel to the TD and RD directions throughout the scan area.
The statistical data indicated that both the Component 1 and 2 textures coexisted in the initial microstructure but with varying intensity, as illustrated in Figure 7a. The PF maps of the two ideal components are shown in Figure 7b,c. Combined with the analysis of the formation of Component 1 and 2 (which was mentioned in Section 3.2.1), it can be inferred that, during the initial rolling process, a certain intensity of the Component 1 (Figure 7b) texture was obtained through the cross-rolling process, while the Component 2 texture (Figure 7c) that was formed during the unidirectional rolling process was retained. When comparing the statistical results of the original microstructures with the microstructures after plane strain compression, the changes in the percentage of pixels in the Component 1 texture corresponded well with the earlier observations regarding the maximum values in the pole figures. Specifically, these values were found to be significantly increased after compression at 930 °C, whereas they were decreased after compression at 960 °C and 990 °C (which are conditions approaching the levels of the initial microstructure). Regarding the Component 2 texture, the statistics exhibited minor fluctuations under different temperature conditions during the compression process, but these fluctuations were not significantly different from the initial microstructure.
3.3. Analysis of Slip Deformation Behavior
To investigate the reasons underlying the differences in the pixel changes in these texture types during compression at different temperatures, the influences of the grain slip deformation and dynamic spheroidization mechanisms on the crystallographic orientation changes were analyzed during the compression process. The αp-IPF maps and KAM maps of the initial temperature and 930 °C compression conditions are shown in Figure 8. In the deformation process during forging or rolling, the grain orientation changes were often closely related to the slip rotation processes. From the αp phase IPF map of the initial microstructure, circled in Figure 8a, it could be found that most of the nearly equiaxed grains contained few sub-boundaries or almost no discernible sub-boundaries, thus indicating that these grains had undergone limited deformation [33]. However, for the grains with a higher aspect ratio that had been flattened, there was an increase in the number of sub-boundaries within these grains along with some instances of grain boundary separation and grain fracturing. In the microstructure after compression at 930 °C, most of the grains were noticeably flattened, and a significant increase in the number of sub-boundaries was observed within some of the grains, circled in Figure 8. Furthermore, grain boundary separations were more prevalent. It can be clearly observed from the KAM maps (Figure 8c,d) that when there were many sub-boundaries inside the grains, the dislocation density of the grains was higher. On the contrary, if there were grain boundary separations inside the grains, the dislocation density decreased. By distinguishing the grains with different orientations using color differences in the IPF map, it was apparent that the grains oriented with c-axis//RD (shown as blue in the TD-IPF) exhibited fewer sub-boundaries and predominantly equiaxed grain morphologies. This suggests that this type of grain is less prone to deformation during the compression process and accumulates less internal energy compared to grains with the c-axis//TD orientation, thus demonstrating significant differences in their characteristics [7].
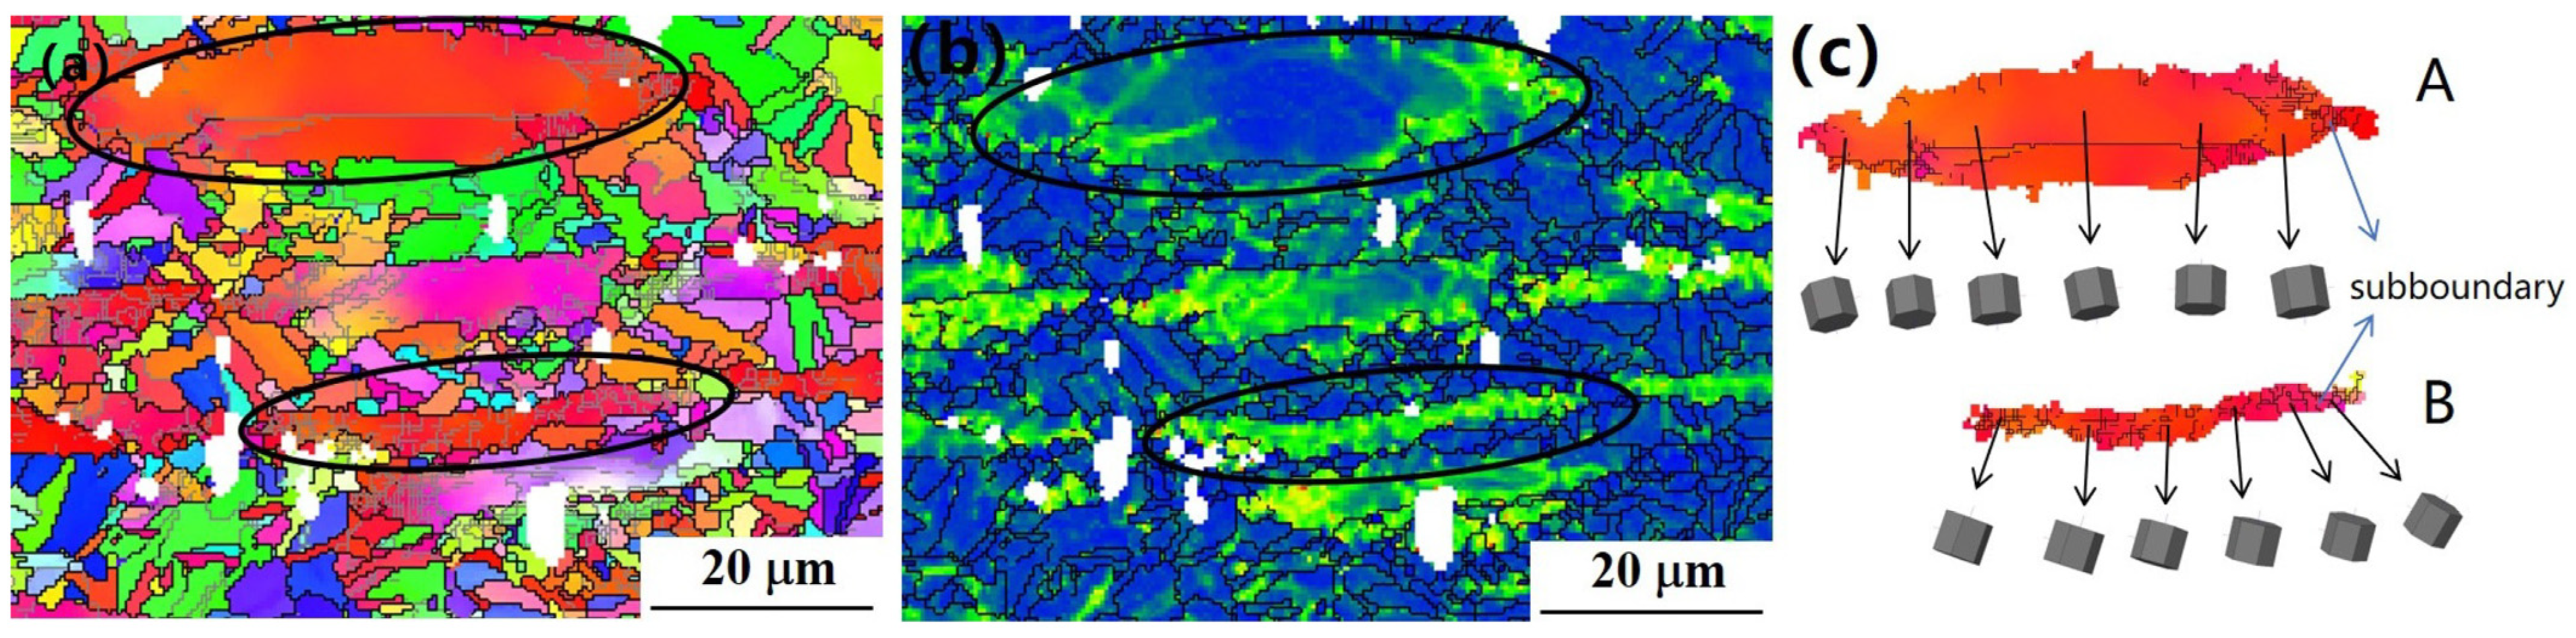
In order to understand the significant change in texture intensity during compression at 930 °C, more detailed EBSD scans were performed on the microstructure at these conditions. The focus was on the two types of grains, A and B, which have Component 1 texture orientations. The IPF map and KAM map of the characteristic grains are shown in Figure 9. From Figure 9a,b, it can be observed that not all flattened grains had a significant number of sub-boundaries or exhibited fracturing. Moreover, the KAM map shows that the misorientation density of Grain A was evidently lower than Grain B. (Figure 9c) Grains A and B both belonged to Component 1, but the mechanisms leading to their current orientations differed. Grain A exhibited a flattened shape with only a few sub-boundaries, thereby indicating that it experienced minimal deformation during the compression process. This phenomenon might be related to the crystal orientation of Grain A, and it could be inferred that the basal Schmid factor for Grain A was close to zero (thus making basal slips unlikely) with the prismatic slip being the primary mode. This implies that a prismatic slip in Grain A can only cause a rotation of its crystallographic orientation around the c-axis without significantly altering the c-axis direction [34]. Based on a comprehensive analysis of its deformation history, it can be deduced that the c-axis orientation of Grain A did not change in the second cross-rolling pass as it remained consistent with Component 1 in the original plate. In other words, the orientation of Grain A was formed and preserved during the first cross-rolling pass. Conversely, the flattened Grain B had a more significant presence of sub-boundaries, thereby indicating that it underwent a substantial deformation during the compression process. The orientation of Grain B was made with an average 20° angle with the c-axis orientation of Component 1, which suggests that Grain B was in the process of its c-axis rotating toward that of Component 1. This could be the result of Grain B undergoing an activation of the slip systems, thus leading to this orientation change.
By comparing the <0001> pole figures between the original microstructure and the microstructure after compression at 930 °C (Figure 6), it was observed that most non-characteristic orientations in the original pole figure experienced a reduction in intensity or even disappearance in the pole figure at 930 °C. Therefore, it can be reasonably assumed that the grains that showed orientations like Grain B are more prone to activate the slip systems during a compression process. This resulted in a c-axis rotation toward TD, thereby leading to an increase in the intensity of the Component 1 texture. As the grains went through slip via certain slip systems, they stored the distortion energy created by deformation at sub-boundaries [35]. This type of grain tends to have more sub-boundaries that are internal when compared with the other type of grains. In the figure labeled as (b), Grain A exhibited minimal orientation changes within its interior. However, in Grain B, the continuous orientations of the grains were clearly observed, and the sub-boundary distribution was denser.
3.4. Analysis of Dynamic Spheroidization Mechanisms
When observing the grain morphology of the original microstructure, it was evident that there were differences between the two types of grains with characteristic orientations, i.e., between c-axis//TD (Component 1) and c-axis//RD (Component 2). The specific differences were reflected in the first type of grain, which had a Component 1 texture orientation and where there was a significantly higher number of sub-boundaries within the grains. Some of these sub-boundaries had accumulated to form more obvious grain boundaries, which could also be found in the SEM images (Figure 3). Additionally, these grains often appeared flattened, thus indicating that they had undergone substantial deformation. As a result, a significant amount of distortion energy was accumulated within the grains of this type.
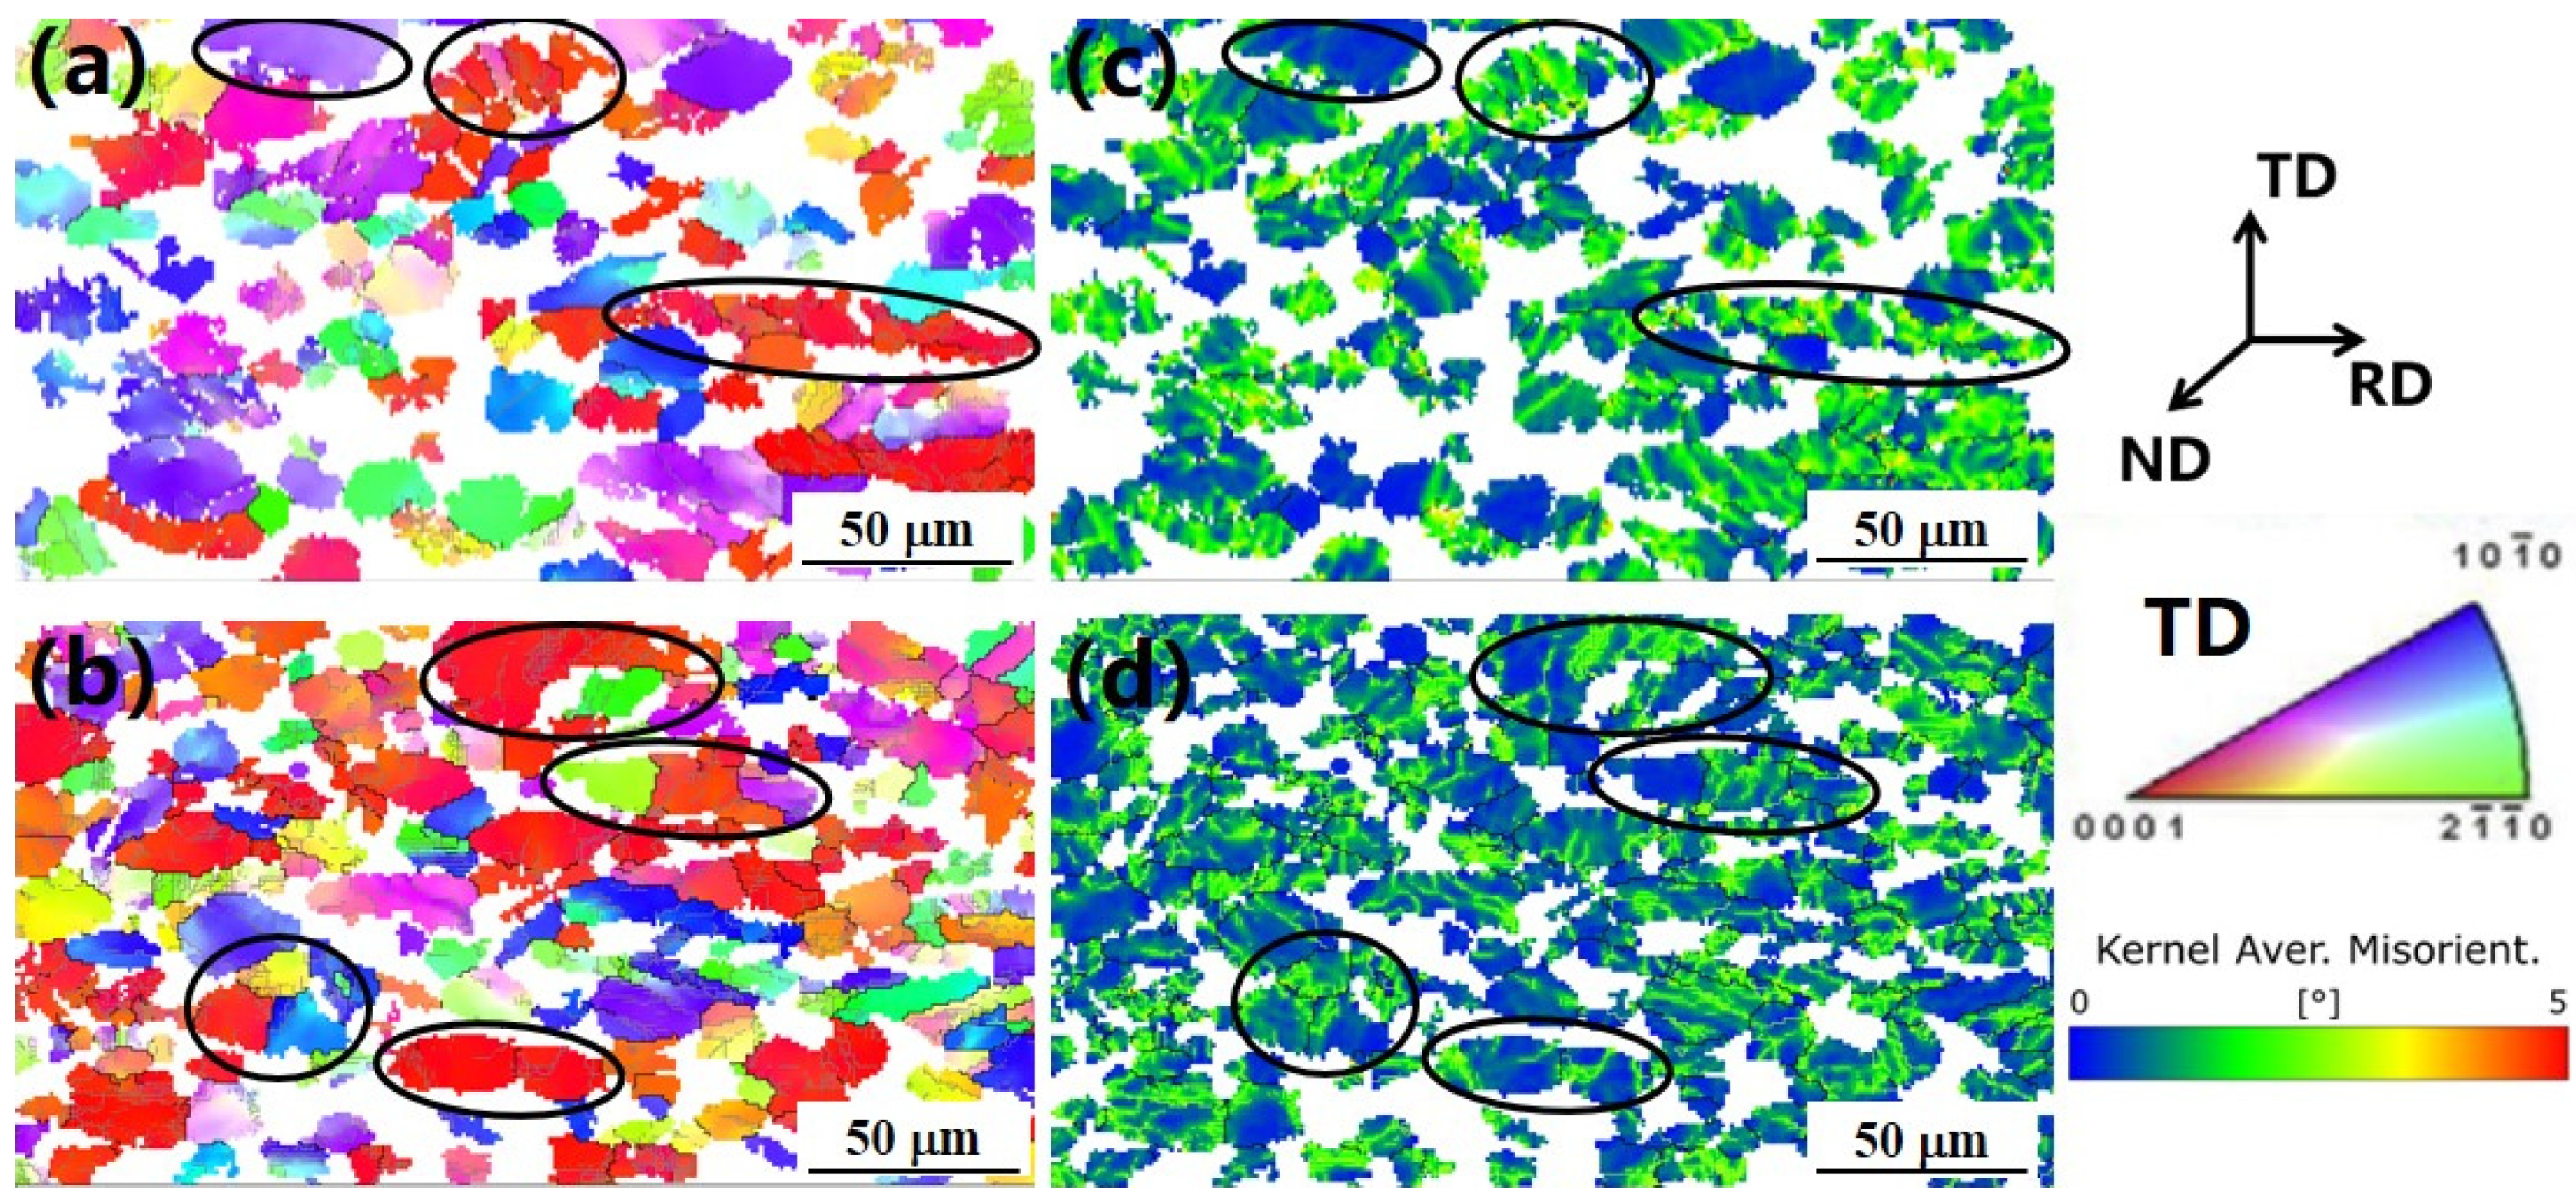
In contrast, the second type of grain, which had Component 2 texture orientation features, i.e., c-axis//RD, exhibited a noticeably lower number of sub-boundaries within the grains. Furthermore, these grains were less frequently flattened when compared to the first type of grains. Therefore, it can be inferred that the second type of grains had undergone less deformation and had accumulated lower levels of distortion energy within their interiors. This description was visually confirmed by comparing the two types of grains using the grain orientation spread (GOS) maps. In the GOS maps, it could be observed that the first type of grains had a significantly higher percentage of high GOS values compared to the second type of grains (Figure 10a,c). This suggested that, under the deformation effects of the unidirectional and cross-rolling processes in the initial microstructure, the two types of grains had experienced varying degrees of deformation. The first type of grains had undergone more deformation than the second type of grains, thus indicating that the first type of grains had accumulated more deformation-induced distortion energy [36]. By observing the KAM maps of the two types of grains (Figure 10b,d), the same conclusion could be drawn that the misorientation density of the first type of grain was higher than the second type of grain, which was consistent with the results drawn from the GOS maps.
The process of grain spheroidization was primarily a result of the combined effects of the dynamic spheroidization within the grains and grain boundary migration. Grain spheroidization plays a crucial role in reducing the accumulation of distortion energy within the grains and decreasing the number of sub-boundaries, thus leading to dynamic softening during the deformation process [37]. Since the first type of grain had accumulated higher levels of deformation-induced distortion energy, they had a greater driving force for undergoing the grain spheroidization during the simulated compression process. Consequently, the first type of grain was more likely to experience grain spheroidization at different temperatures compared to the second type of grain. In the field of magnesium alloys, it has been proposed that the spheroidization during hot deformation leads to a reduction in texture intensity and grain refinement [38]. Therefore, it is reasonable to conclude that the presence of dynamic spheroidization during deformation has caused the differences in texture intensity changes for Component 1 and Component 2 textures at different compression temperatures. The grains belonging to the Component 2 texture were found to be less prone to deformation and were less likely to be influenced by the dynamic spheroidization process.
After simulating plane strain compression processes at various temperature conditions, we observed common characteristics in the grains exhibiting clear dynamic spheroidization features. These grains displayed an average GOS lower than the overall average, thereby indicating that the dynamic spheroidization process mitigates the effects of deformation. It is worth noting that there were variations among the grains undergoing dynamic spheroidization. In the post-compression microstructures at different temperature conditions, we observed different numbers of grains that had been flattened. Within these grains, we noted distinct grain boundary separation phenomena. Some of the grains exhibited continuous grain orientations, while others showed significant orientation disparities. Additionally, there were grains that did not exhibit distinct orientation features. We believe that these grains reflect the different states of dynamic spheroidization during plane strain compression.
To further investigate the dynamic spheroidization process leading to crystal orientation changes, specific grains were chosen for discussion. The IPF maps and GOS maps for the flattened grains, which exhibited internal grain boundary separation but continuous grain orientation, are depicted in Figure 11. In the TD-IPF map, the grains are predominantly colored in a similar shade of red, thereby indicating a characteristic orientation where the grains align with the c-axis//TD. However, in the other two directions, there are discernible color variations, thus suggesting that some of grains rotated around the c-axis orientations. The GOS maps display differences in the colors of various grains, with some of the grains having lower numerical values. The kernel average misorientation (KAM) map revealed that certain grains maintain a relatively high dislocation density near the grain boundaries. Since the spheroidization process significantly reduced the accumulation of the sub-boundaries and dislocation energy within the grains, it can be inferred that the distribution of the dislocation density shown in the KAM map will exhibit markable variations as the spheroidization process progresses. For grains that have undergone spheroidization but have not shown significant crystal orientation changes, it can be inferred that dynamic spheroidization is to a lower degree. While these grains had undergone dynamic spheroidization, the orientations of the spheroidized grains near the grain boundaries did not change significantly. This observation was insufficient in explaining the reason for the reduced intensity of the Component 1 texture mentioned earlier. Additionally, we identified grains with pronounced spheroidization, which were characterized by large orientation differences. Of course, these grains exhibited varying orientation features due to the different degrees of spheroidization.
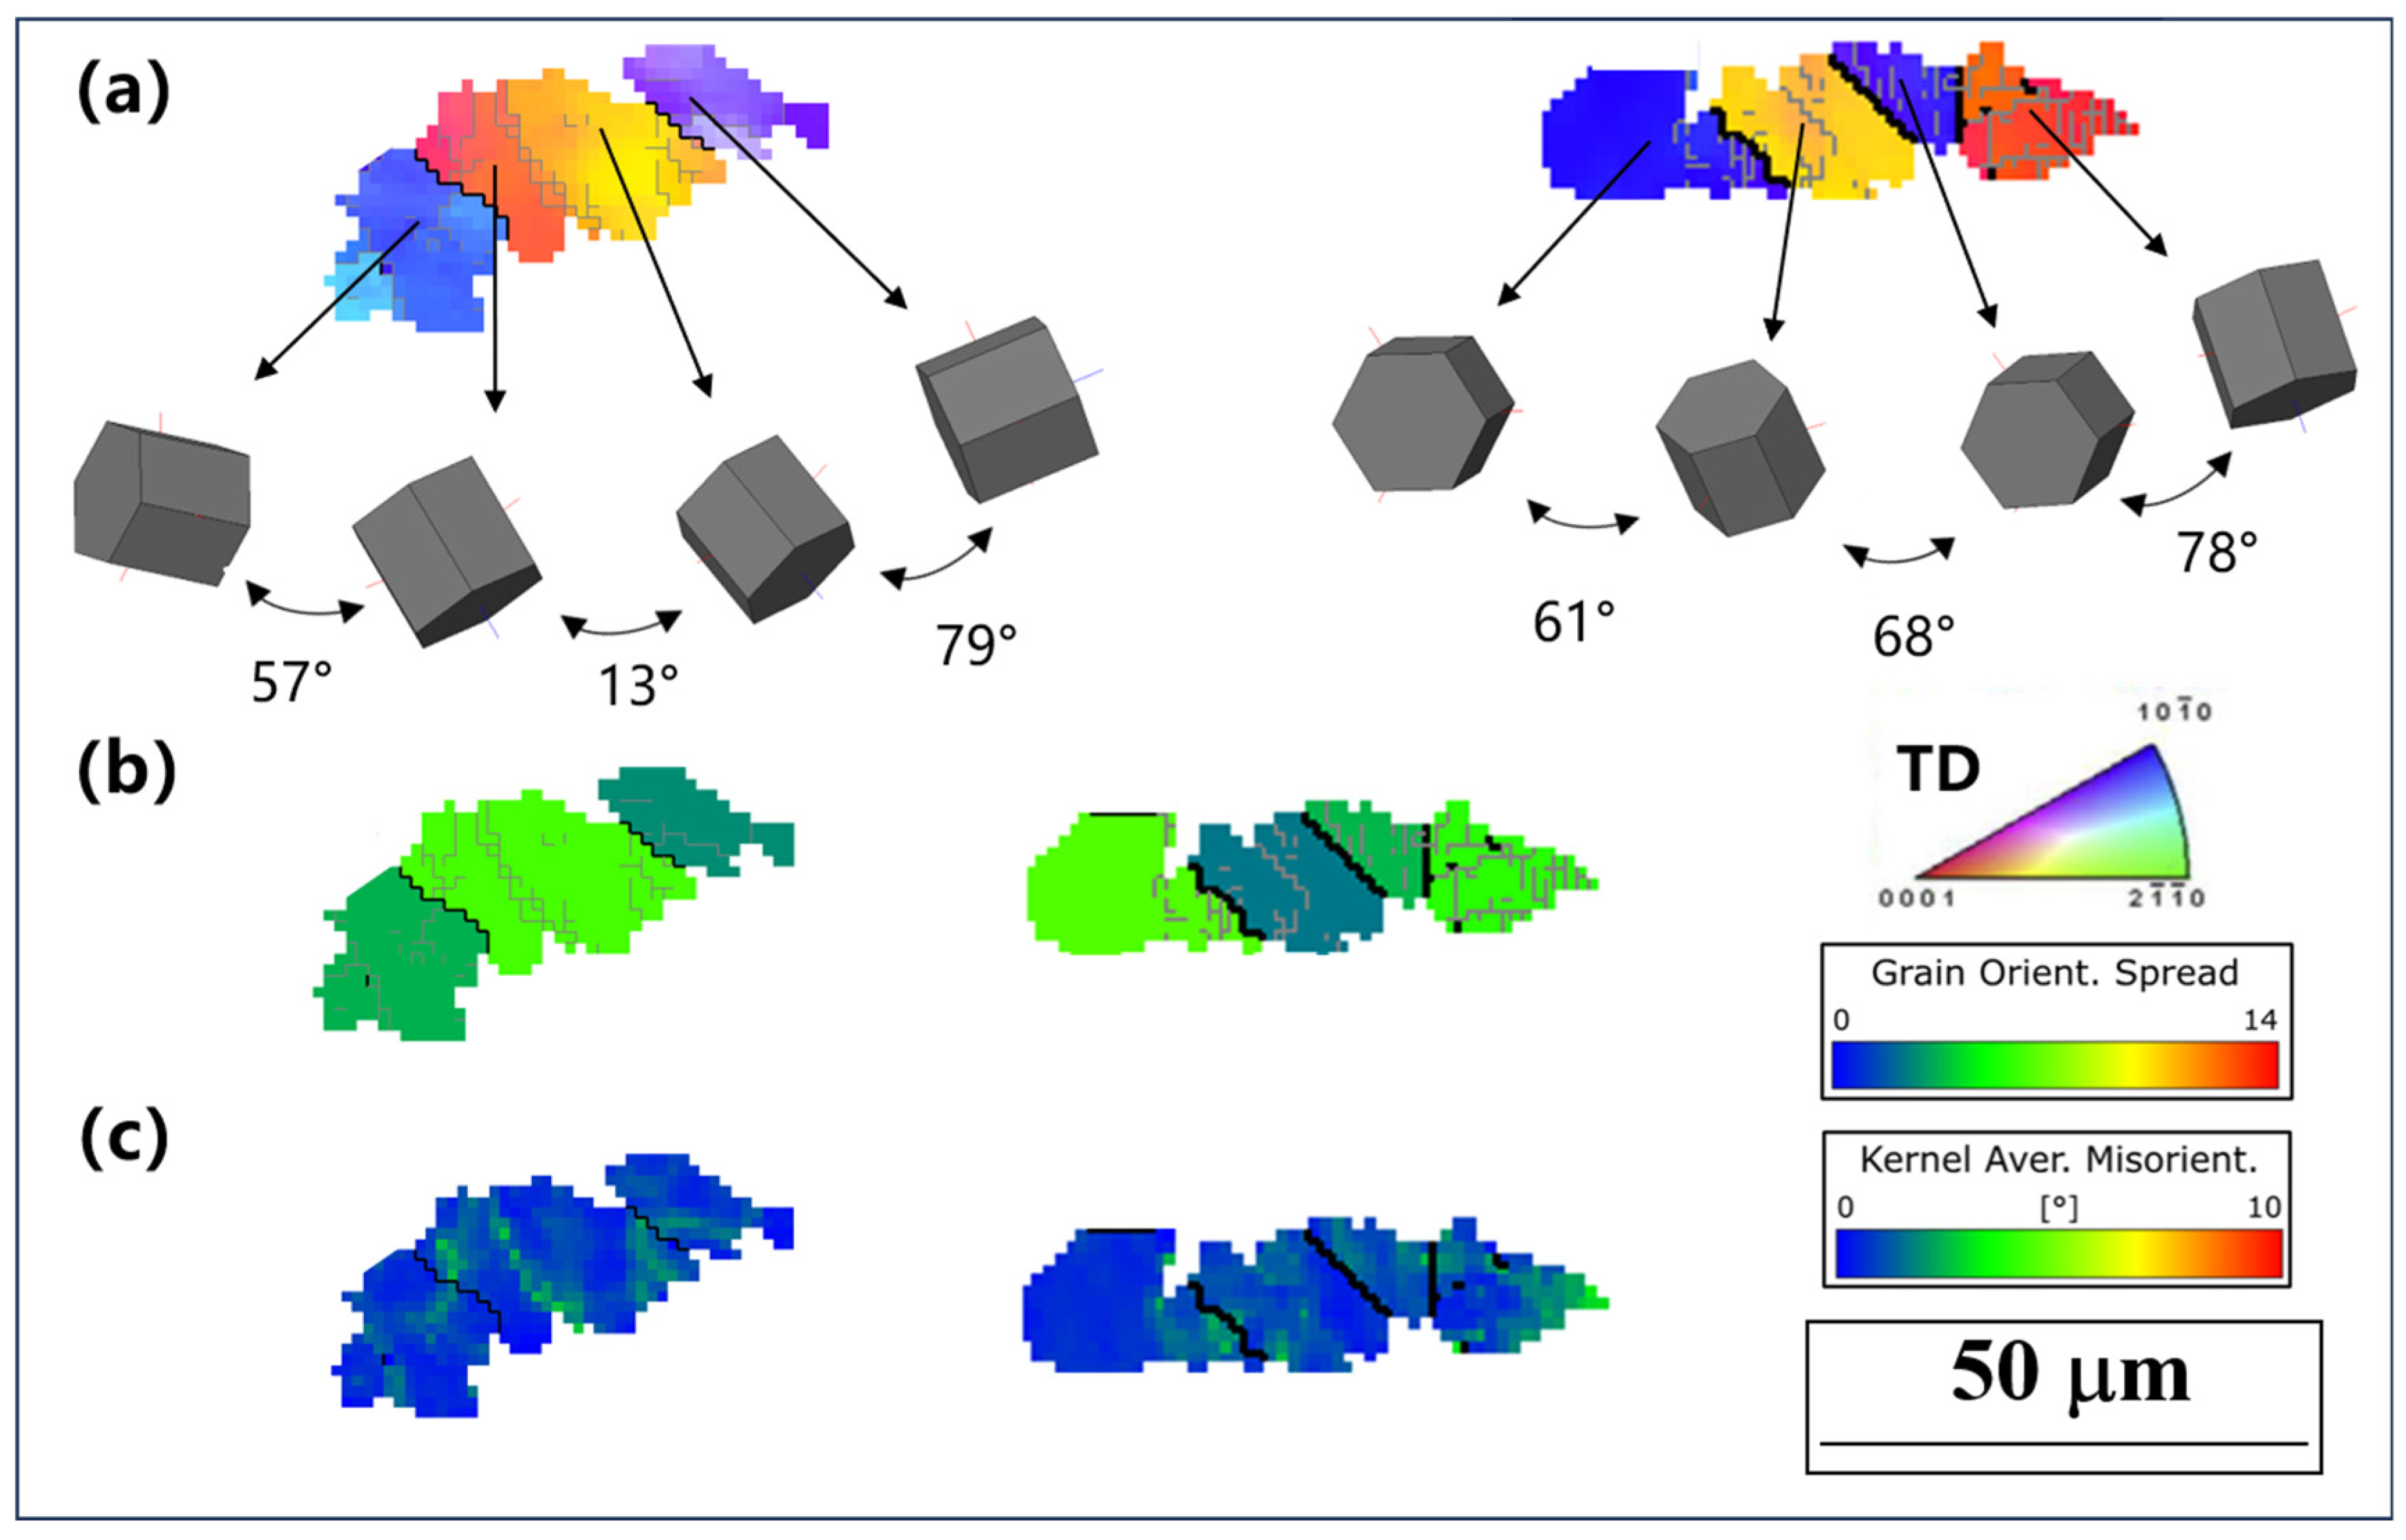
As further occurrences of the process took place, the spheroidized grain orientations began to exhibit noticeable differences. The second typical grains of the dynamic spheroidization process, as represented by the IPF maps and GOS maps, are illustrated in Figure 12. In the IPF maps, it can be observed that some of the spheroidized grains still maintained their c-axis//TD orientation, which is characteristic of the Component 1 texture. However, other grains underwent significant orientation changes. The GOS maps for these grains resembled those of the initial microstructure, and they exhibited smaller average orientation differences when compared to the grains that had not undergone spheroidization and had been heavily influenced by deformation, thus indicating that these grains had experienced a significant reduction in deformation after undergoing the spheroidization process. The KAM map revealed that the grains in the mid-stage of dynamic spheroidization had experienced a reduction in their dislocation density within the grains and near the grain boundaries. In this case, there was almost no noticeable accumulation of dislocations, thereby suggesting that the dynamic spheroidization process can effectively reduce the effects caused by deformation.
In addition to the previously mentioned characteristic grains, we could also identify some of the grains undergoing spheroidization with significant orientation differences and the absence of any specific texture. These grains were more likely to appear when compressing at 960 °C and 990 °C. It was found that, as the compression temperature increased, the grains with higher stored deformation energy were more likely to undergo dynamic spheroidization. The third typical grains of the spheroidization process, as indicated in Figure 13 by their IPF maps and GOS maps, were characterized by distinct grain boundaries that were formed through the accumulation of sub-boundaries. From the IPF maps, it was evident that after undergoing extensive dynamic spheroidization, the grain orientations became more random, which is expected when spheroidization has progressed significantly. Additionally, the GOS values for these grains were notably lower, further confirming the significant role of spheroidization in reducing the level of the deformation experienced by the grains. The typical grains in this stage exhibited a substantial reduction in the concentration of dislocations, as evident in the KAM map. There were only small regions of higher dislocation density near the sub-boundaries. In summary, after undergoing extensive dynamic spheroidization, the grain orientations underwent a pronounced rotation, thereby resulting in a significant reduction in the intensity of specific texture types. Furthermore, this process effectively reduced the presence of sub-boundaries within the grains, as well as the accumulated strain energy from the deformation process.
A comprehensive comparison of the characteristics of the different typical grains of dynamic spheroidization revealed that, as the dynamic spheroidization process progressed, the differences in grain orientations between the grains gradually increased and even demonstrated notably high orientation differences. This phenomenon further underscored the significant impact of the dynamic spheroidization process on the weakening of the initial Component 1 texture. Therefore, it can be inferred that the reason for the lack of a significant increase in intensity after compression at 960 °C and 990 °C was that the grains with the initial Component 1 texture—where the c-axis was oriented along TD direction—underwent extensive dynamic spheroidization, thus resulting in random and dispersed grain orientations. In contrast, during compression at the lower temperature of 930 °C, the driving force for the dynamic spheroidization was not as pronounced as at higher temperatures, and the changes in texture intensity were primarily dominated by the deformation process, thus leading to a significant enhancement of the Component 1 texture intensity. Indeed, through an observation of the IPF maps, the second and third typical grains were more easier find after higher temperature compression.
4. Conclusions
This study employed plane strain compression experiments to simulate the effects of temperature on microstructures and the texture evolution that occurs during the directional rolling of Ti60 alloy plates. The following conclusions were determined:
- After subjecting Ti60 plates to plane strain compression at different temperature conditions to simulate directional rolling, the internal structure exhibits two characteristic texture components that are perpendicular to each other. Additionally, there are variations in the intensity of these different texture components.
- For the equiaxed microstructure of the Ti60 samples, differences were observed in the distribution of the αp and αs orientations. The αp orientation underwent the primary deformation during compression, thus contributing significantly to the texture. With increasing compression temperature, the αp pole figures exhibited a scattered trend, while the αs pole figures showed a concentrated trend.
- The intensity of the c-axis//RD texture is not sensitive to the compression temperatures. An analysis of the GOS maps and the distribution of sub-boundaries within the grains revealed that the grains with c-axis//RD orientation were less prone to slip activation, thereby resulting in minimal orientation changes and lower internal stored dislocation energy. Consequently, the driving force for spheroidization was weak such that the texture intensity was less affected.
- This study explained the reason for the significantly higher c-axis//TD texture intensity at 930 °C compared to other conditions through an analysis of slip deformation mechanisms and the dynamic spheroidization process. At lower compression temperatures, the weak driving force for dynamic spheroidization allows for slip deformation behavior to play a dominant role in crystal orientation changes. As the compression temperature increases, dynamic spheroidization becomes more prevalent, thus significantly impacting the intensity of the c-axis//TD texture.
Author Contributions
Conceptualization, Y.D.; Methodology, R.J.; Formal analysis, Y.D., Y.X. and R.J.; Investigation, Y.X. and W.J.; Resources, W.Z.; Data curation, Y.D.; Writing—original draft, Y.D.; Writing—review and editing, Y.D.; Supervision, W.Z. and W.J. All authors have read and agreed to the published version of the manuscript.
Funding
This research was funded by the Qin Chuangyuan “Scientist + Engineer” team building Project of Shaanxi Province (2022KXJ-079) and the National Major Science and Technology Project (J2019-VI-0005-0119).
Data Availability Statement
The raw data supporting the conclusions of this article will be made available by the authors on request.
Conflicts of Interest
Author Yi Dai was employed by the company Western Titanium Technologies Co., Ltd. The remaining authors declare that the research was conducted in the absence of any commercial or financial relationships that could be construed as a potential conflict of interest.
References
- Zhao, Z.; Liu, Z.; Wang, Q.; Liu, J.; Yang, R. Analysis of local crystallographic orientation in an annealed Ti60 billet. J. Mater. Sci. Technol. 2019, 35, 591–595. [Google Scholar] [CrossRef]
- Li, J.; Xu, Y.Q.; Xiao, W.L.; Ma, C.L.; Huang, X. Development of Ti-Al-Ta-Nb-(Re) near-α high temperature titanium alloy: Microstructure, thermal stability and mechanical properties. J. Mater. Sci. Technol. 2022, 109, 1–11. [Google Scholar] [CrossRef]
- Gao, X.; Zeng, W.; Zhang, S.; Wang, Q. A study of epitaxial growth behaviors of equiaxed alpha phase at different cooling rates in near alpha titanium alloy. Acta Mater. 2017, 122, 298–309. [Google Scholar] [CrossRef]
- Wang, B.; Zeng, W.; Zhao, Z.; Jia, R.; Xu, J.; Wang, Q. Effect of micro-texture and orientation incompatibility on the mechanical properties of Ti60 alloy. Mater. Sci. Eng. A 2023, 881, 145419. [Google Scholar] [CrossRef]
- Li, W.; Chen, Z.; Liu, J.; Zhu, S.; Sui, G.; Wang, Q. Rolling texture and its effect on tensile property of a near-α titanium alloy Ti60 plate. J. Mater. Sci. Technol. 2019, 35, 790–798. [Google Scholar] [CrossRef]
- Gey, N.; Bocher, P.; Uta, E.; Germain, L.; Humbert, M. Texture and microtexture variations in a near-α titanium forged disk of bimodal microstructure. Acta Mater. 2012, 60, 2647–2655. [Google Scholar] [CrossRef]
- Jia, R.; Zeng, W.; Zhao, Z.; Wang, B.; Xu, J.; Wang, Q. In situ EBSD/HR-DIC-based investigation on anisotropy mechanism of a near α titanium plate with strong transverse texture. Mater. Sci. Eng. A 2023, 867, 144743. [Google Scholar] [CrossRef]
- Zhang, B.; Zhao, Z.; Wang, Q.; Liu, J.; Yang, R. The effect of deformation temperature on the microstructure and crystallographic orientation evolution of Ti60 alloy after annealing. Mater. Sci. Eng. A 2023, 880, 145360. [Google Scholar] [CrossRef]
- Yu, Y.; Yan, H.; Zhu, H.; Chen, J.; Xia, W.; Sun, Y.; Su, B.; Deng, Y.; Song, M. Dynamic recrystallization behavior and mechanism of bimodal TC17 titanium alloy during high strain rate hot compression. Mater. Today Commun. 2023, 34, 105255. [Google Scholar] [CrossRef]
- Li, C.M.; Huang, L.; Zhao, M.J.; Guo, S.Q.; Li, J.J. Hot deformation behavior and mechanism of a new metastable β titanium alloy Ti–6Cr–5Mo–5V–4Al in single phase region. Mater. Sci. Eng. A 2021, 814, 141231. [Google Scholar] [CrossRef]
- Singh, B.K.; Kumar, V.A.; Gupta, R.K.; Kanjarla, A.K. Evolution of microstructure in niobium rich (α2+γ) based titanium aluminide alloy during hot compression. Mater. Sci. Eng. A 2019, 754, 708–718. [Google Scholar] [CrossRef]
- Roy, S.; Suwas, S. The influence of temperature and strain rate on the deformation response and microstructural evolution during hot compression of a titanium alloy Ti–6Al–4V–0.1B. J. Alloy. Compd. 2013, 548, 110–125. [Google Scholar] [CrossRef]
- Singh, G.; Souza, P.M. Hot deformation behavior of a novel alpha + beta titanium alloy TIMETAL®407. J. Alloy. Compd. 2023, 935, 167970. [Google Scholar] [CrossRef]
- Fan, X.; Zheng, H.; Zhang, Y.; Zhang, Z.; Gao, P.; Zhan, M.; Liu, J. Acceleration of globularization during interrupted compression of a two-phase titanium alloy. Mater. Sci. Eng. A 2018, 720, 214–224. [Google Scholar] [CrossRef]
- Li, S.; Han, Y.; Zhou, H.; Huang, G.; Le, J.; Wang, X.; Lu, W. Optimizing the local microstructure and mechanical properties of variable section particulate reinforced titanium matrix composites component based on numerical simulation and isothermal forming. Mater. Sci. Eng. A 2022, 829, 142161. [Google Scholar] [CrossRef]
- Lunt, D.; Thomas, R.; Atkinson; Smith, A.; Sandala, R.; da Fonseca, J.Q.; Preuss, M. Understanding the role of local texture variation on slip activity in a two-phase titanium alloy. Acta Mater. 2021, 216, 117111. [Google Scholar] [CrossRef]
- Deng, Y.; An, Y.; Xiao, Y.; Zhan, X.; Zhang, X.; Wang, B. Deformation mechanism diagram and deformation instability of a Ti-5Al-5Mo-5V-1Cr-1Fe titanium alloy during the hot compression. J. Alloy. Compd. 2023, 966, 171446. [Google Scholar] [CrossRef]
- Zhao, Q.; Yang, F.; Torrens, R.; Bolzoni, L. Comparison of hot deformation behaviour and microstructural evolution for Ti-5Al-5V-5Mo-3Cr alloys prepared by powder metallurgy and ingot metallurgy approaches. Mater. Des. 2019, 169, 107682. [Google Scholar] [CrossRef]
- Wu, C.; Huang, L.; Li, C.M. Experimental investigation on dynamic phase transformation and texture evolution of Ti55531 high intensity titanium alloy during hot compression in the α+β region. Mater. Sci. Eng. A 2020, 773, 138851. [Google Scholar] [CrossRef]
- Li, W.; Chen, Z.; Liu, J.; Wang, Q.; Sui, G. Effect of texture on anisotropy at 600 °C in a near-α titanium alloy Ti60 plate. Mater. Sci. Eng. A 2017, 688, 322–329. [Google Scholar] [CrossRef]
- Sahoo, S.; Sabat, R.; Sahni, S.; Suwas, S. Texture and microstructure evolution of commercially pure titanium during hot rolling: Role of strain-paths. Mater. Des. 2016, 91, 58–71. [Google Scholar] [CrossRef]
- Jia, Z.; Zhao, Q.; Zhang, Y.; Xu, Y.; Chen, Y.; Deng, X.; Zhang, F.; Wang, L.; Guo, D. Hot and cold rolling of a novel near-α titanium alloy: Mechanical properties and underlying deformation mechanism. Mater. Sci. Eng. A 2023, 863, 144543. [Google Scholar] [CrossRef]
- Wang, X.; Zhan, M.; Gao, P.; Ma, P.; Yang, K.; Lei, Y.; Li, Z. Deformation mode dependent mechanism and kinetics of dynamic recrystallization in hot working of titanium alloy. Mater. Sci. Eng. A 2020, 772, 138804. [Google Scholar] [CrossRef]
- Balachandran, S.; Kumar, S.; Banerjee, D. On recrystallization of the α and β phases in titanium alloys. Acta Mater. 2017, 131, 423–434. [Google Scholar] [CrossRef]
- Xu, S.; Gao, C.; Xiao, N.; Zhang, H.; Cui, Z. Sensitivity of heterogeneous microstructure evolution and preferential variant selection to thermomechanical conditions in a near α titanium alloy. J. Alloy. Compd. 2023, 947, 169623. [Google Scholar] [CrossRef]
- Wang, L.; Fan, X.; Zhan, M.; Jiang, X.; Zeng, X.; Liang, Y.; Zheng, H.; Zhao, A. The heterogeneous globularization related to crystal and geometrical orientation of two-phase titanium alloys with a colony microstructure. Mater. Des. 2020, 186, 108338. [Google Scholar] [CrossRef]
- Xu, J.W.; Zeng, W.D.; Zhang, X.Y.; Zhou, D.D. Analysis of globularization modeling and mechanisms of alpha/beta titanium alloy. J. Alloy. Compd. 2019, 788, 110–117. [Google Scholar] [CrossRef]
- Stefansson, N.; Semiatin, S.L. Mechanisms of globularization of Ti-6Al-4V during static heat treatment. Met. Mater. Trans. A 2003, 34, 691–698. [Google Scholar] [CrossRef]
- Huang, Z.R.; Xiao, H.; Yu, J.X.; Zhang, H.Y.; Huang, H.G.; Yu, K.; Zhou, R.F. Effects of different annealing cooling methods on the microstructure and properties of TA10 titanium alloys. J. Mater. Res. Technol. 2023, 27, 3041–3053. [Google Scholar] [CrossRef]
- Bache, M.R.; Evans, W.J. Dwell Sensitive Fatigue Response of Titanium Alloys for Power Plant Applications. J. Eng. Gas Turbines Power 2003, 125, 241–245. [Google Scholar] [CrossRef]
- Zhao, Z.; Wang, Q.; Liu, J.; Yang, R. Effect of heat treatment on the crystallographic orientation evolution in a near-α titanium alloy Ti60. Acta Mater. 2017, 131, 305–314. [Google Scholar] [CrossRef]
- Lin, Y.; Xiao, Y.-W.; Jiang, Y.-Q.; Pang, G.-D. Spheroidization and dynamic recrystallization mechanisms of Ti-55511 alloy with bimodal microstructures during hot compression in α+β region. Mater. Sci. Eng. A 2020, 782, 139282. [Google Scholar] [CrossRef]
- Zhao, Z.; Zhu, G.; Kang, Y.; Peng, L. Analysis of the formation of sub-grain boundaries in commercially pure titanium compressed at elevated temperature. Mater. Sci. Eng. A 2020, 771, 138680. [Google Scholar] [CrossRef]
- Zaefferer, S. A study of active deformation systems in titanium alloys: Dependence on alloy composition and correlation with deformation texture. Mater. Sci. Eng. A 2003, 344, 20–30. [Google Scholar] [CrossRef]
- Roy, S.; Suwas, S. Orientation dependent spheroidization response and macro-zone formation during sub β-transus processing of Ti-6Al-4V alloy. Acta Mater. 2017, 134, 283–301. [Google Scholar] [CrossRef]
- Xu, S.; Zhang, H.M.; Xiao, N.M.; Qiu, R.S.; Cui, Z.S.; Fu, M.W. Mechanisms of macrozone elimination and grain refinement of near α Ti alloy via the spheroidization of the Widmannstätten structure. Acta Mater. 2023, 260, 119339. [Google Scholar] [CrossRef]
- Li, L.; Luo, J.; Yan, J.J.; Li, M.Q. Dynamic globularization and restoration mechanism of Ti–5Al–2Sn–2Zr–4Mo–4Cr alloy during isothermal compression. J. Alloy. Compd. 2015, 622, 174–183. [Google Scholar] [CrossRef]
- Zhang, W.; Pan, J.; Wang, S.; Yang, J. Texture weakening and grain refinement behavior of the extruded Mg-6.03Zn-0.55Zr alloy during hot plane strain compression. J. Mater. Res. Technol. 2023, 27, 3041–3053. [Google Scholar] [CrossRef]
Figure 1.
Schematic diagram of the unidirectional, cross-rolling process and plane strain compression.
Figure 1.
Schematic diagram of the unidirectional, cross-rolling process and plane strain compression.
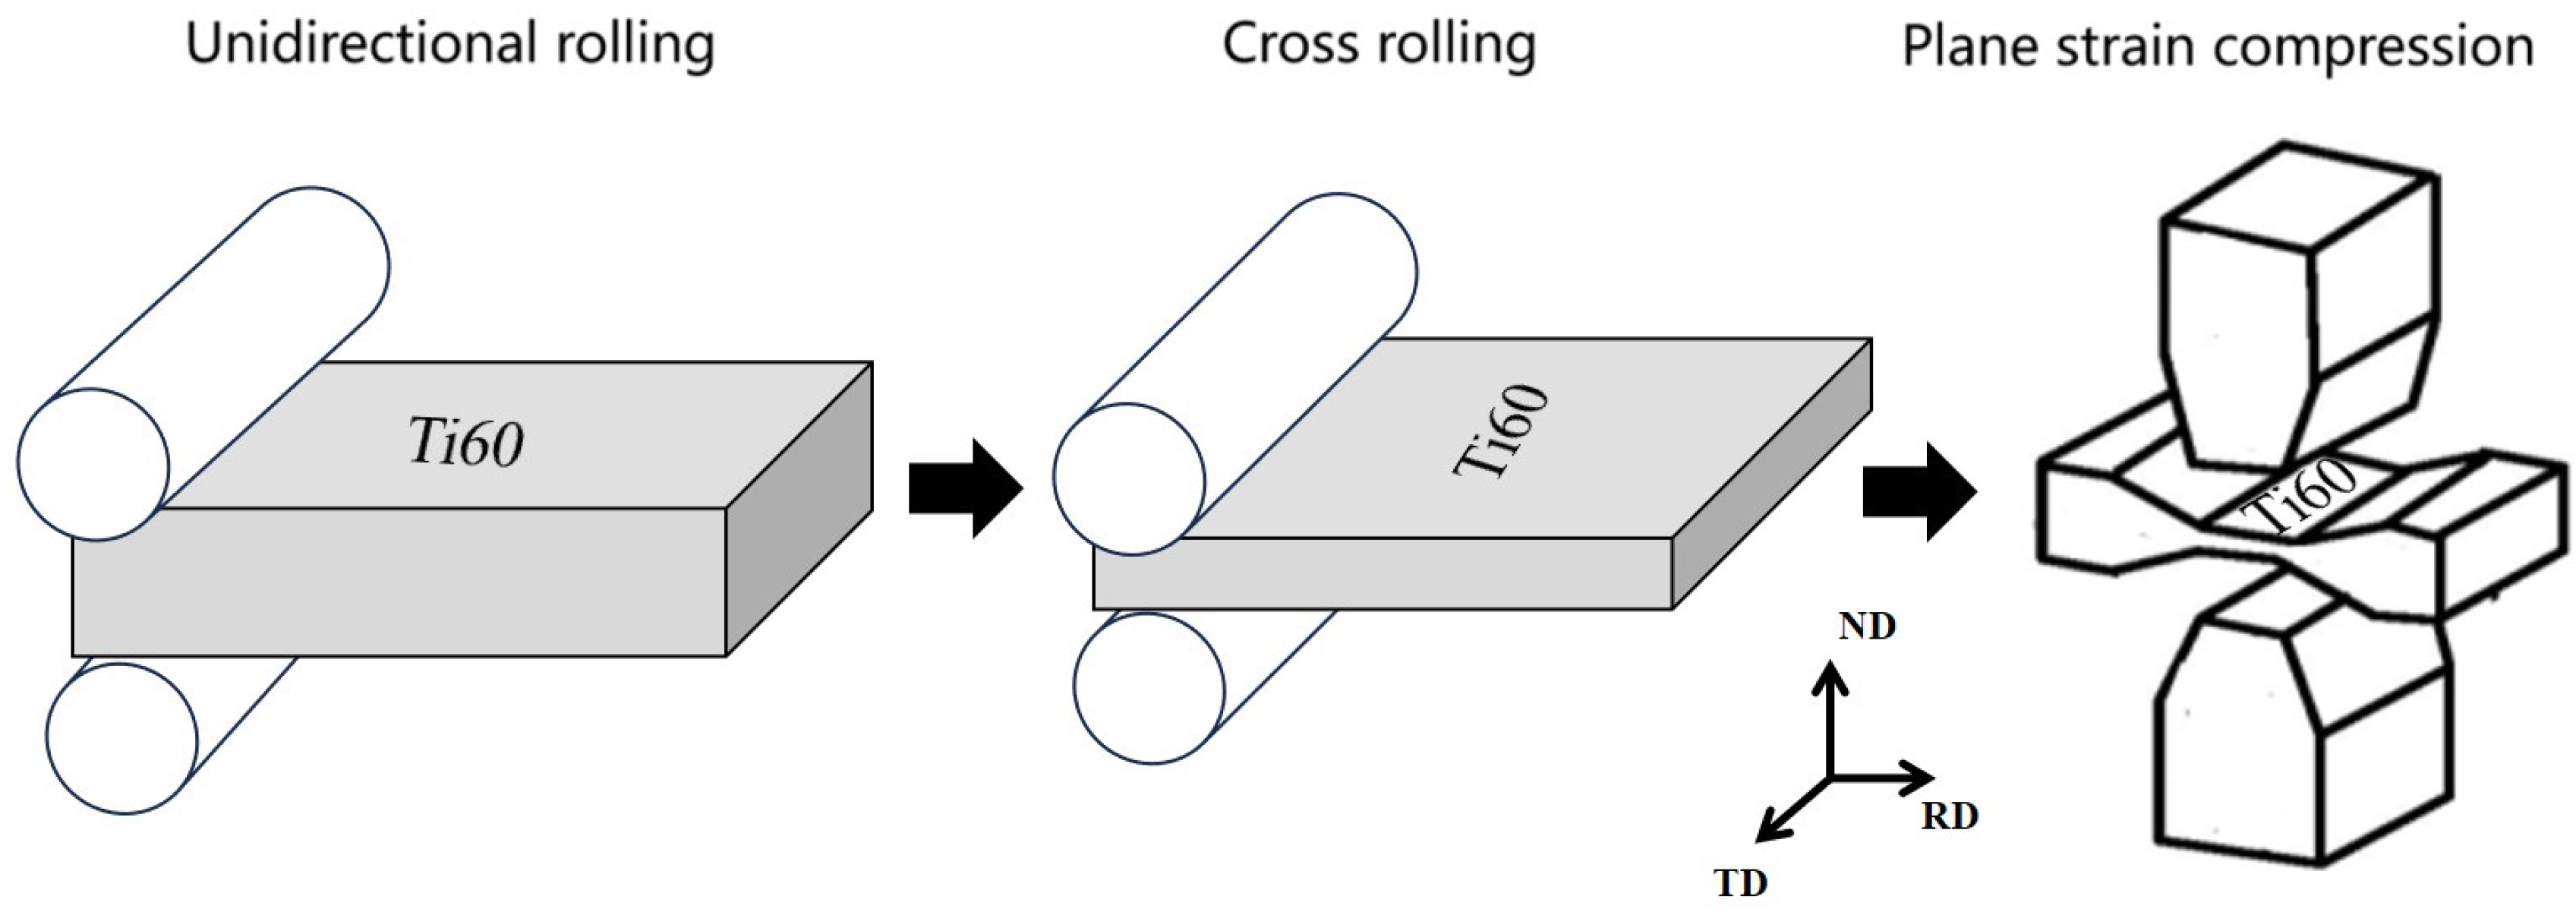
Figure 2.
Schematic diagram of the compression process, as well as of the SEM and EBSD observation areas.
Figure 2.
Schematic diagram of the compression process, as well as of the SEM and EBSD observation areas.
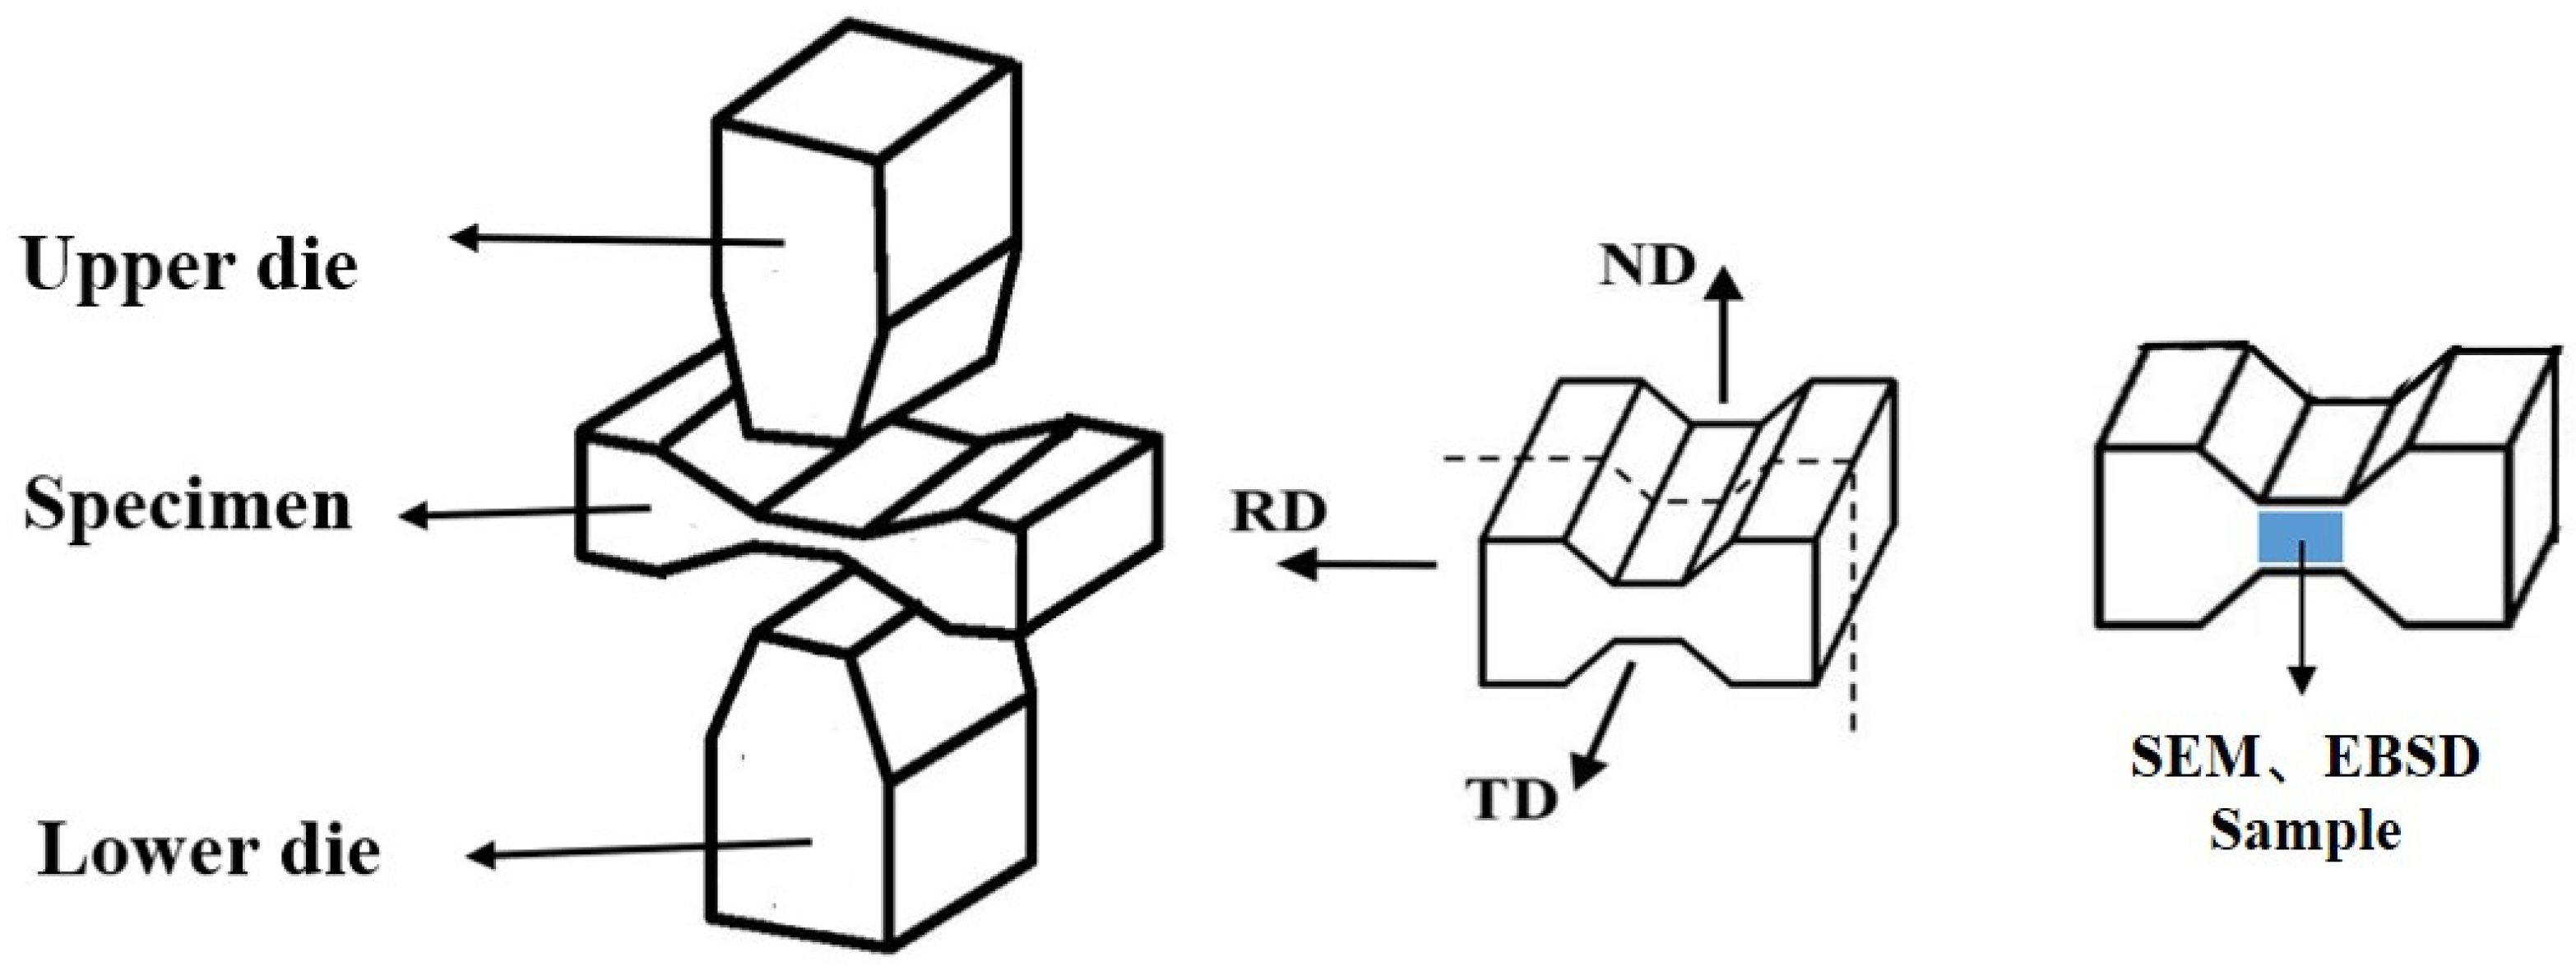
Figure 3.
SEM microstructural images under different conditions: (a) original; (b) 930 °C; (c) 960 °C; (d) 990 °C; and (e) new grain boundaries at a higher magnification.
Figure 3.
SEM microstructural images under different conditions: (a) original; (b) 930 °C; (c) 960 °C; (d) 990 °C; and (e) new grain boundaries at a higher magnification.
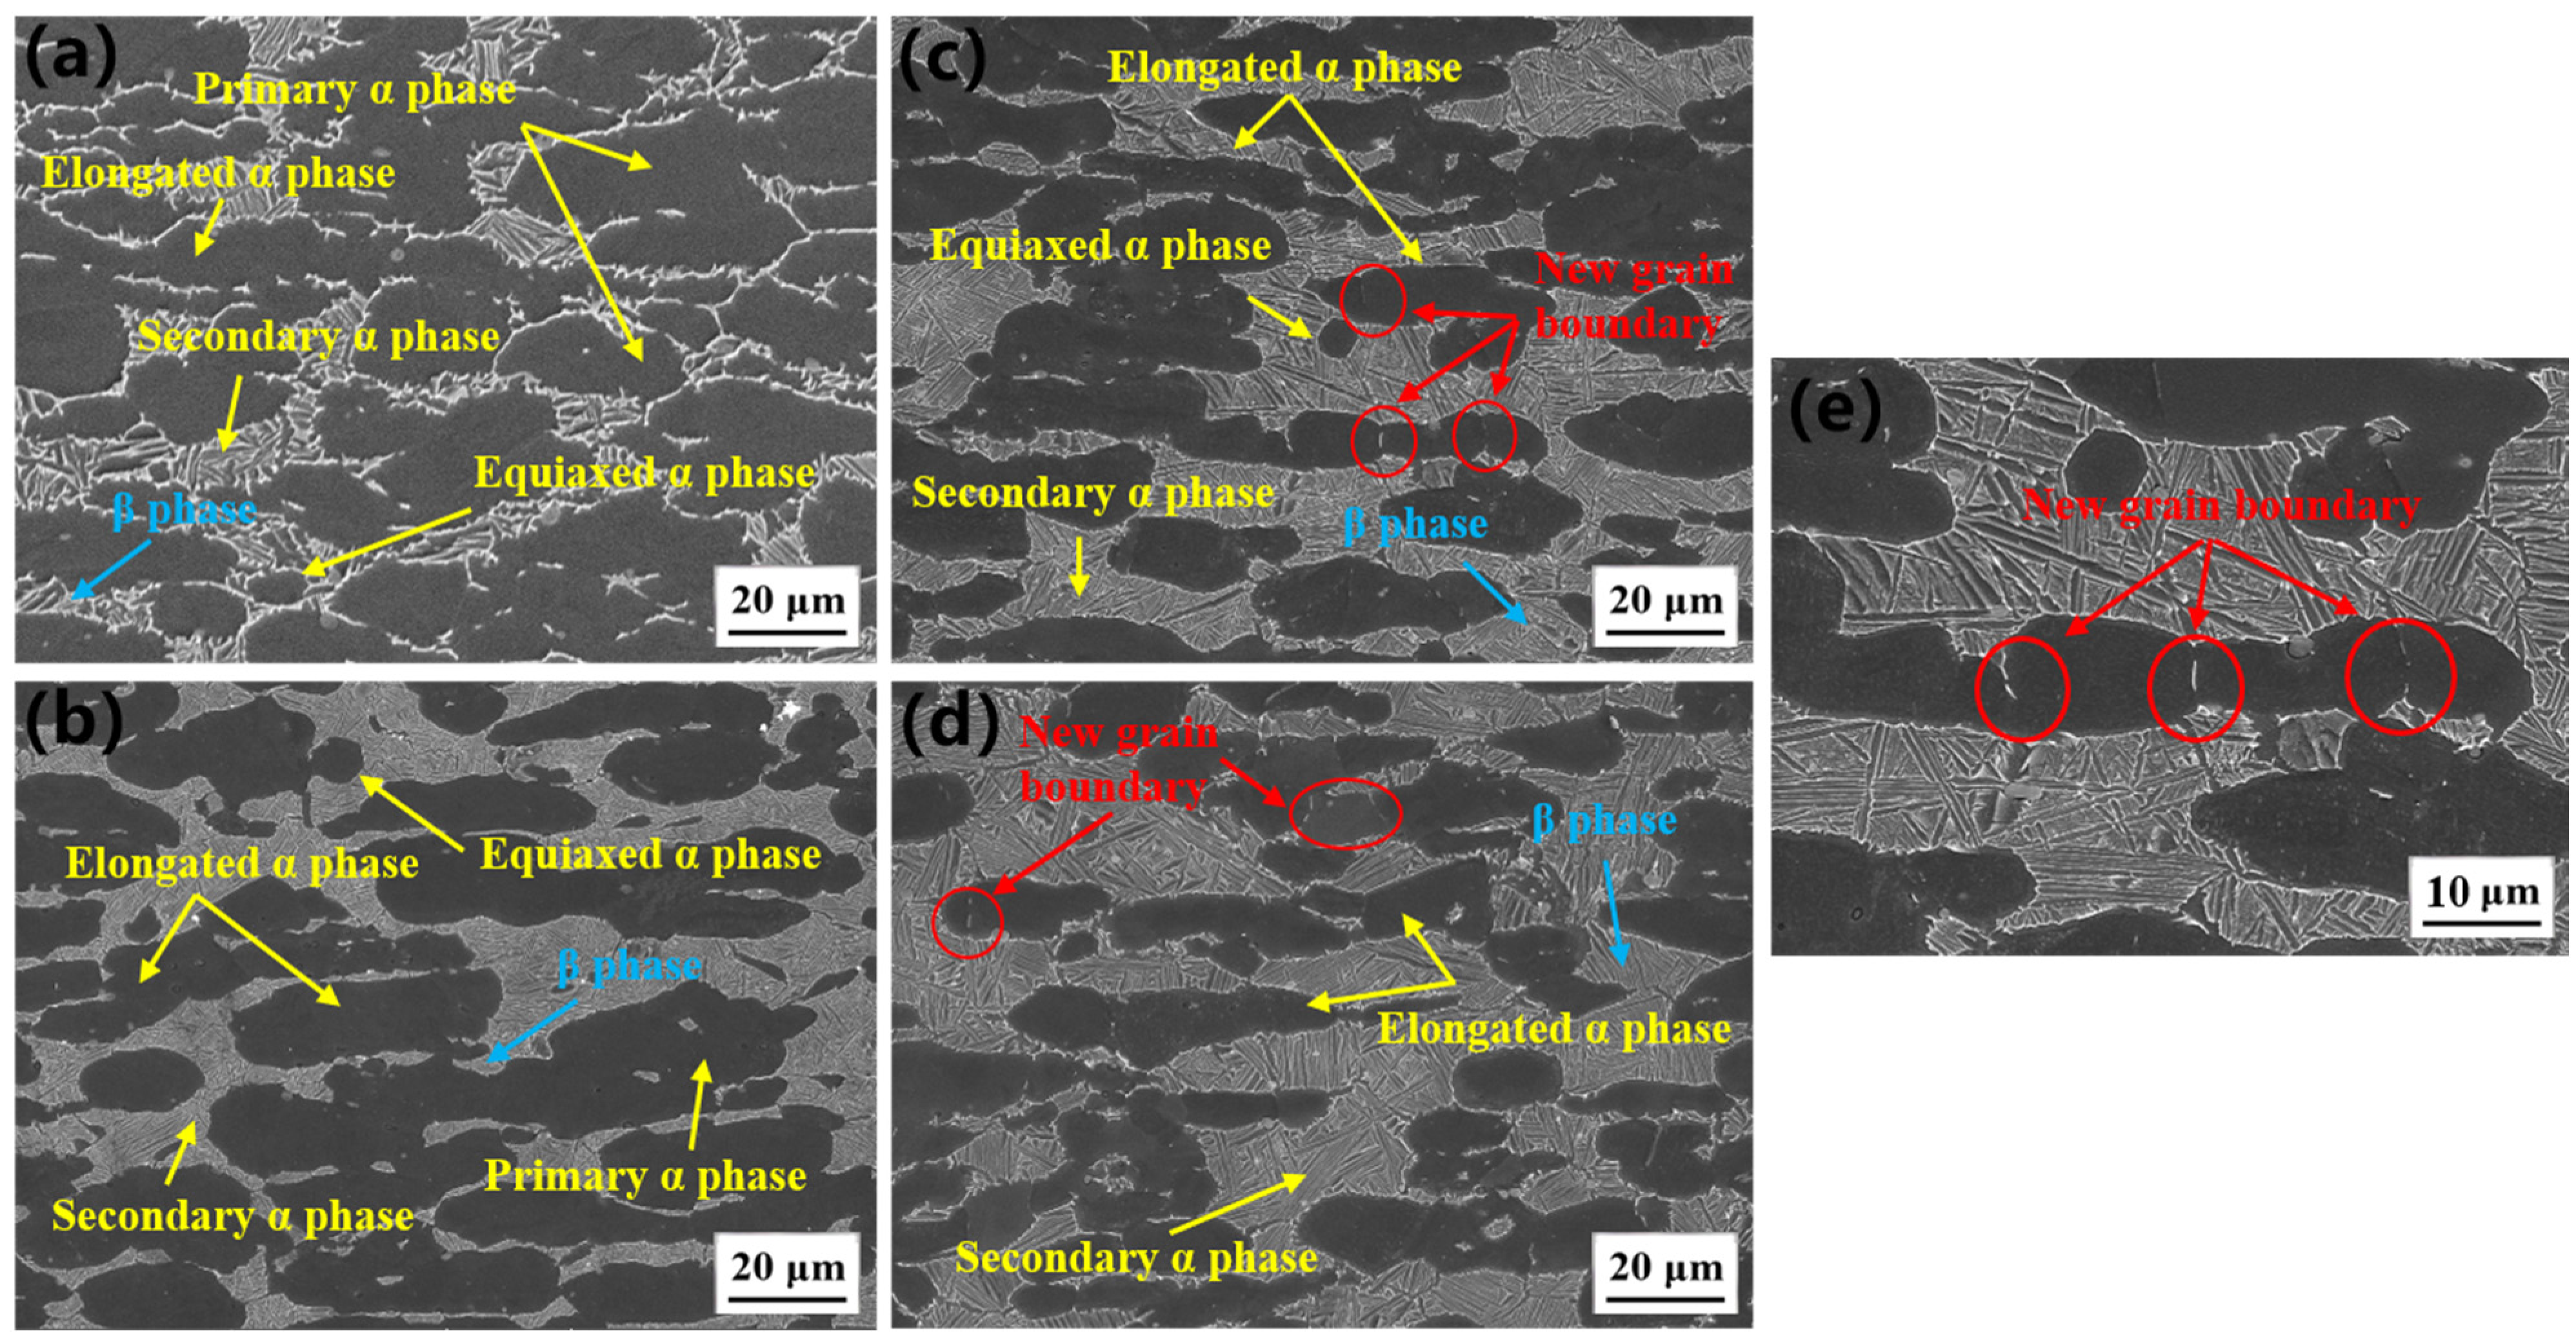
Figure 4.
The inverse pole figure, KAM figure, and pole figure maps of the microstructures under different conditions: (a) the initial temperature; (b) 930 °C; (c) 960 °C; and (d) 990 °C.
Figure 4.
The inverse pole figure, KAM figure, and pole figure maps of the microstructures under different conditions: (a) the initial temperature; (b) 930 °C; (c) 960 °C; and (d) 990 °C.
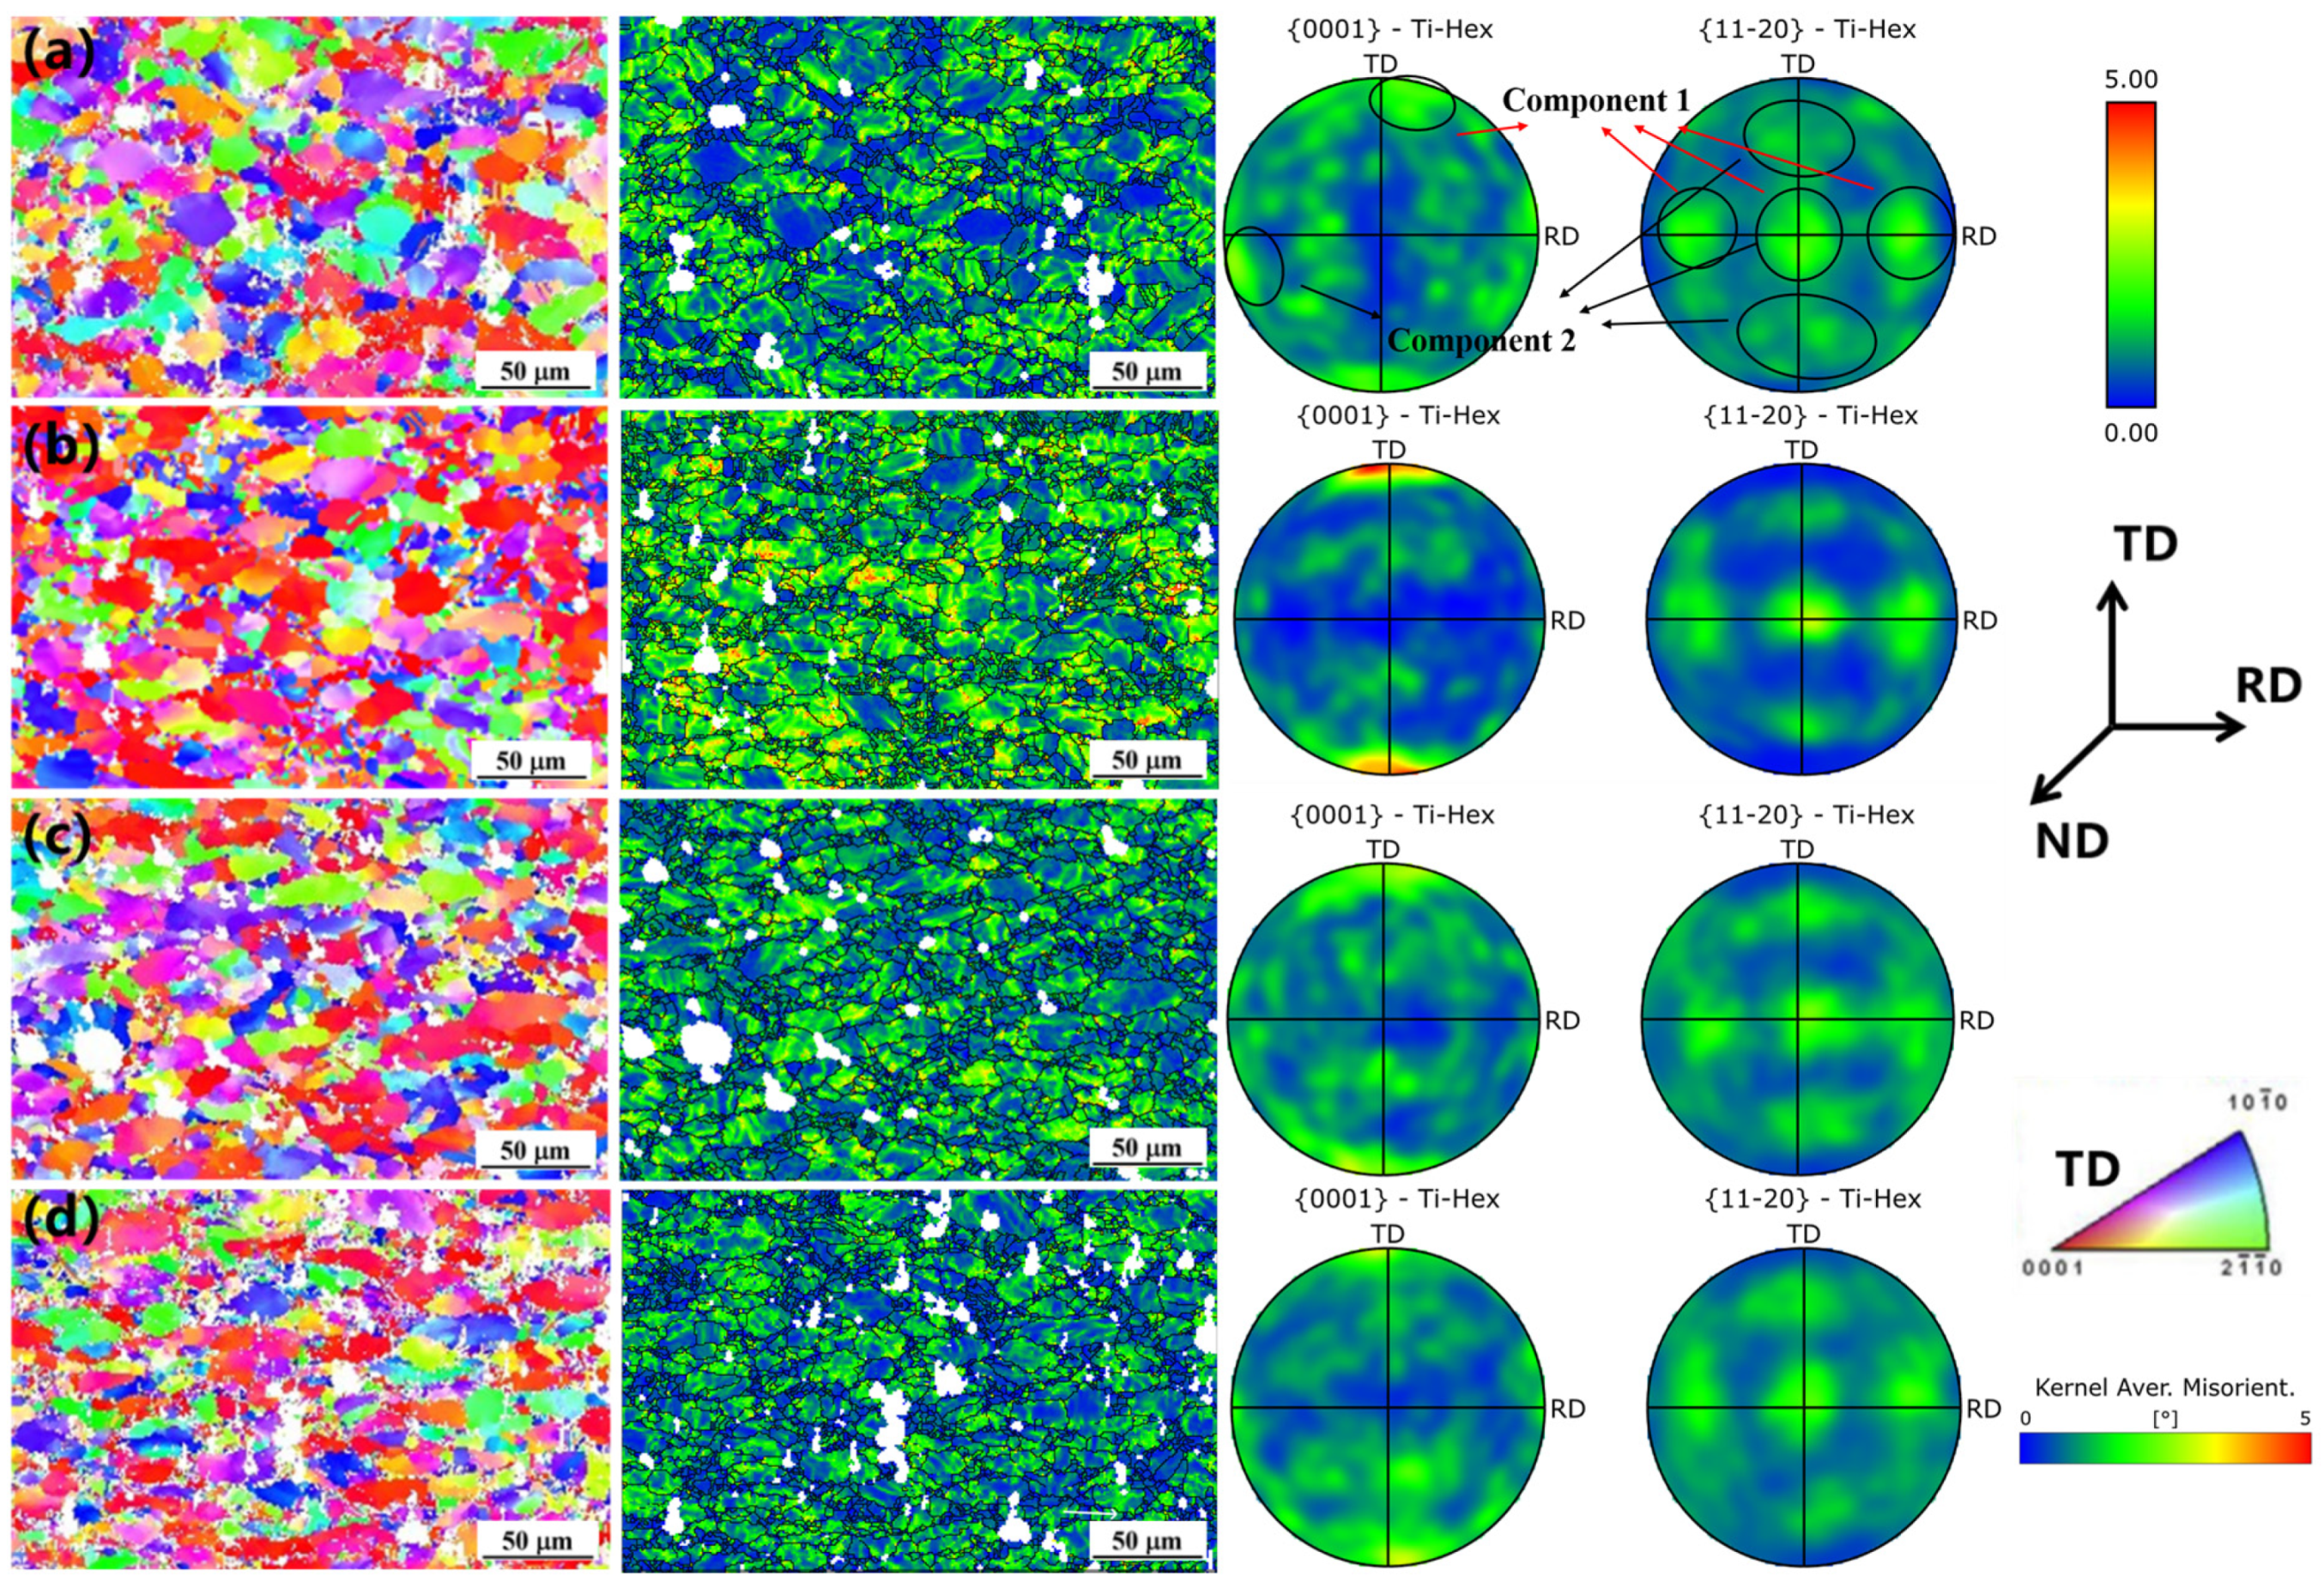
Figure 5.
Inverse pole figure map of the (a) primary α-phase αp; (b) secondary α-phase αs; KAM maps of (c) primary α-phase αp; and (d) secondary α-phase αs.
Figure 5.
Inverse pole figure map of the (a) primary α-phase αp; (b) secondary α-phase αs; KAM maps of (c) primary α-phase αp; and (d) secondary α-phase αs.

Figure 6.
Pole figure maps of both the original and compression microstructures: original pole figure map of (a) the primary α-phase αp and (b) secondary α-phase αs. A 930 °C pole figure map of (c) the primary α-phase αp; (d) secondary α-phase αs; and (e) the primary α-phase under different compression temperatures at the initial temperature, 930 °C, 960 °C, and 990 °C.
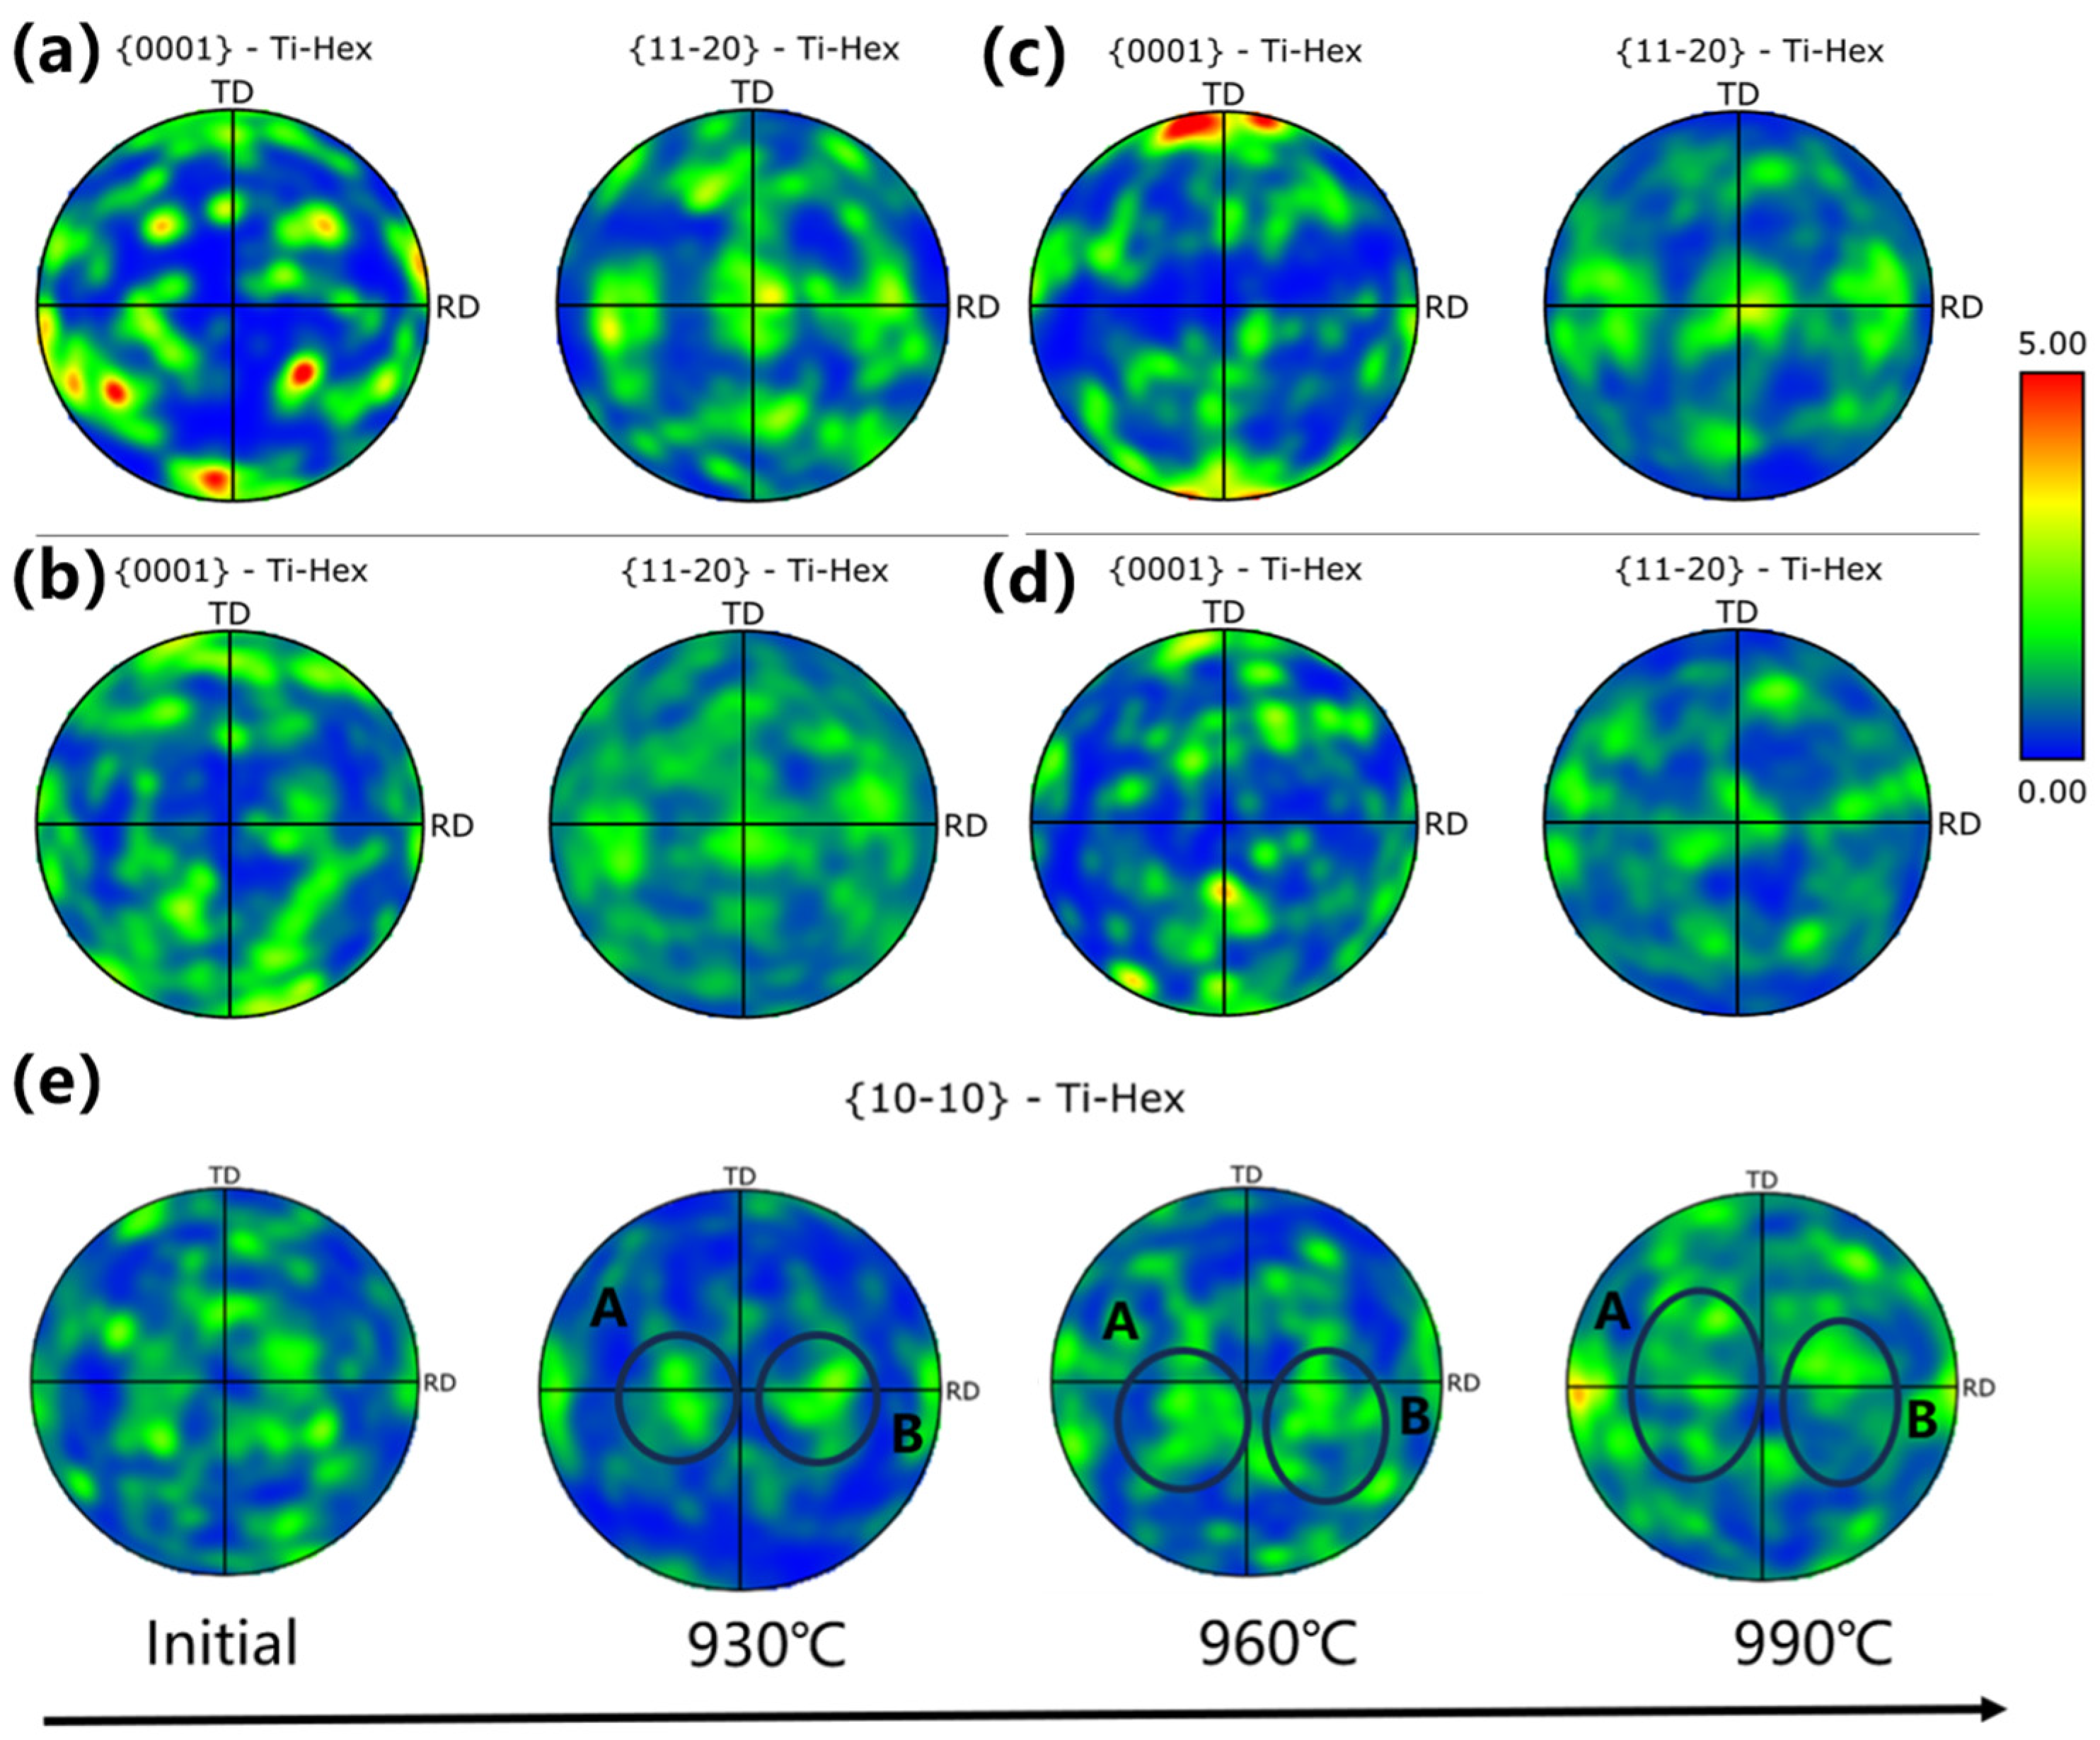
Figure 7.
(a) Percentages of the texture components under different compression temperatures: the initial temperature, 930 °C, 960 °C, and 990 °C. PF maps of the ideal texture component: (b) the <0001>//TD texture and (c) the <0001>//RD texture.
Figure 7.
(a) Percentages of the texture components under different compression temperatures: the initial temperature, 930 °C, 960 °C, and 990 °C. PF maps of the ideal texture component: (b) the <0001>//TD texture and (c) the <0001>//RD texture.
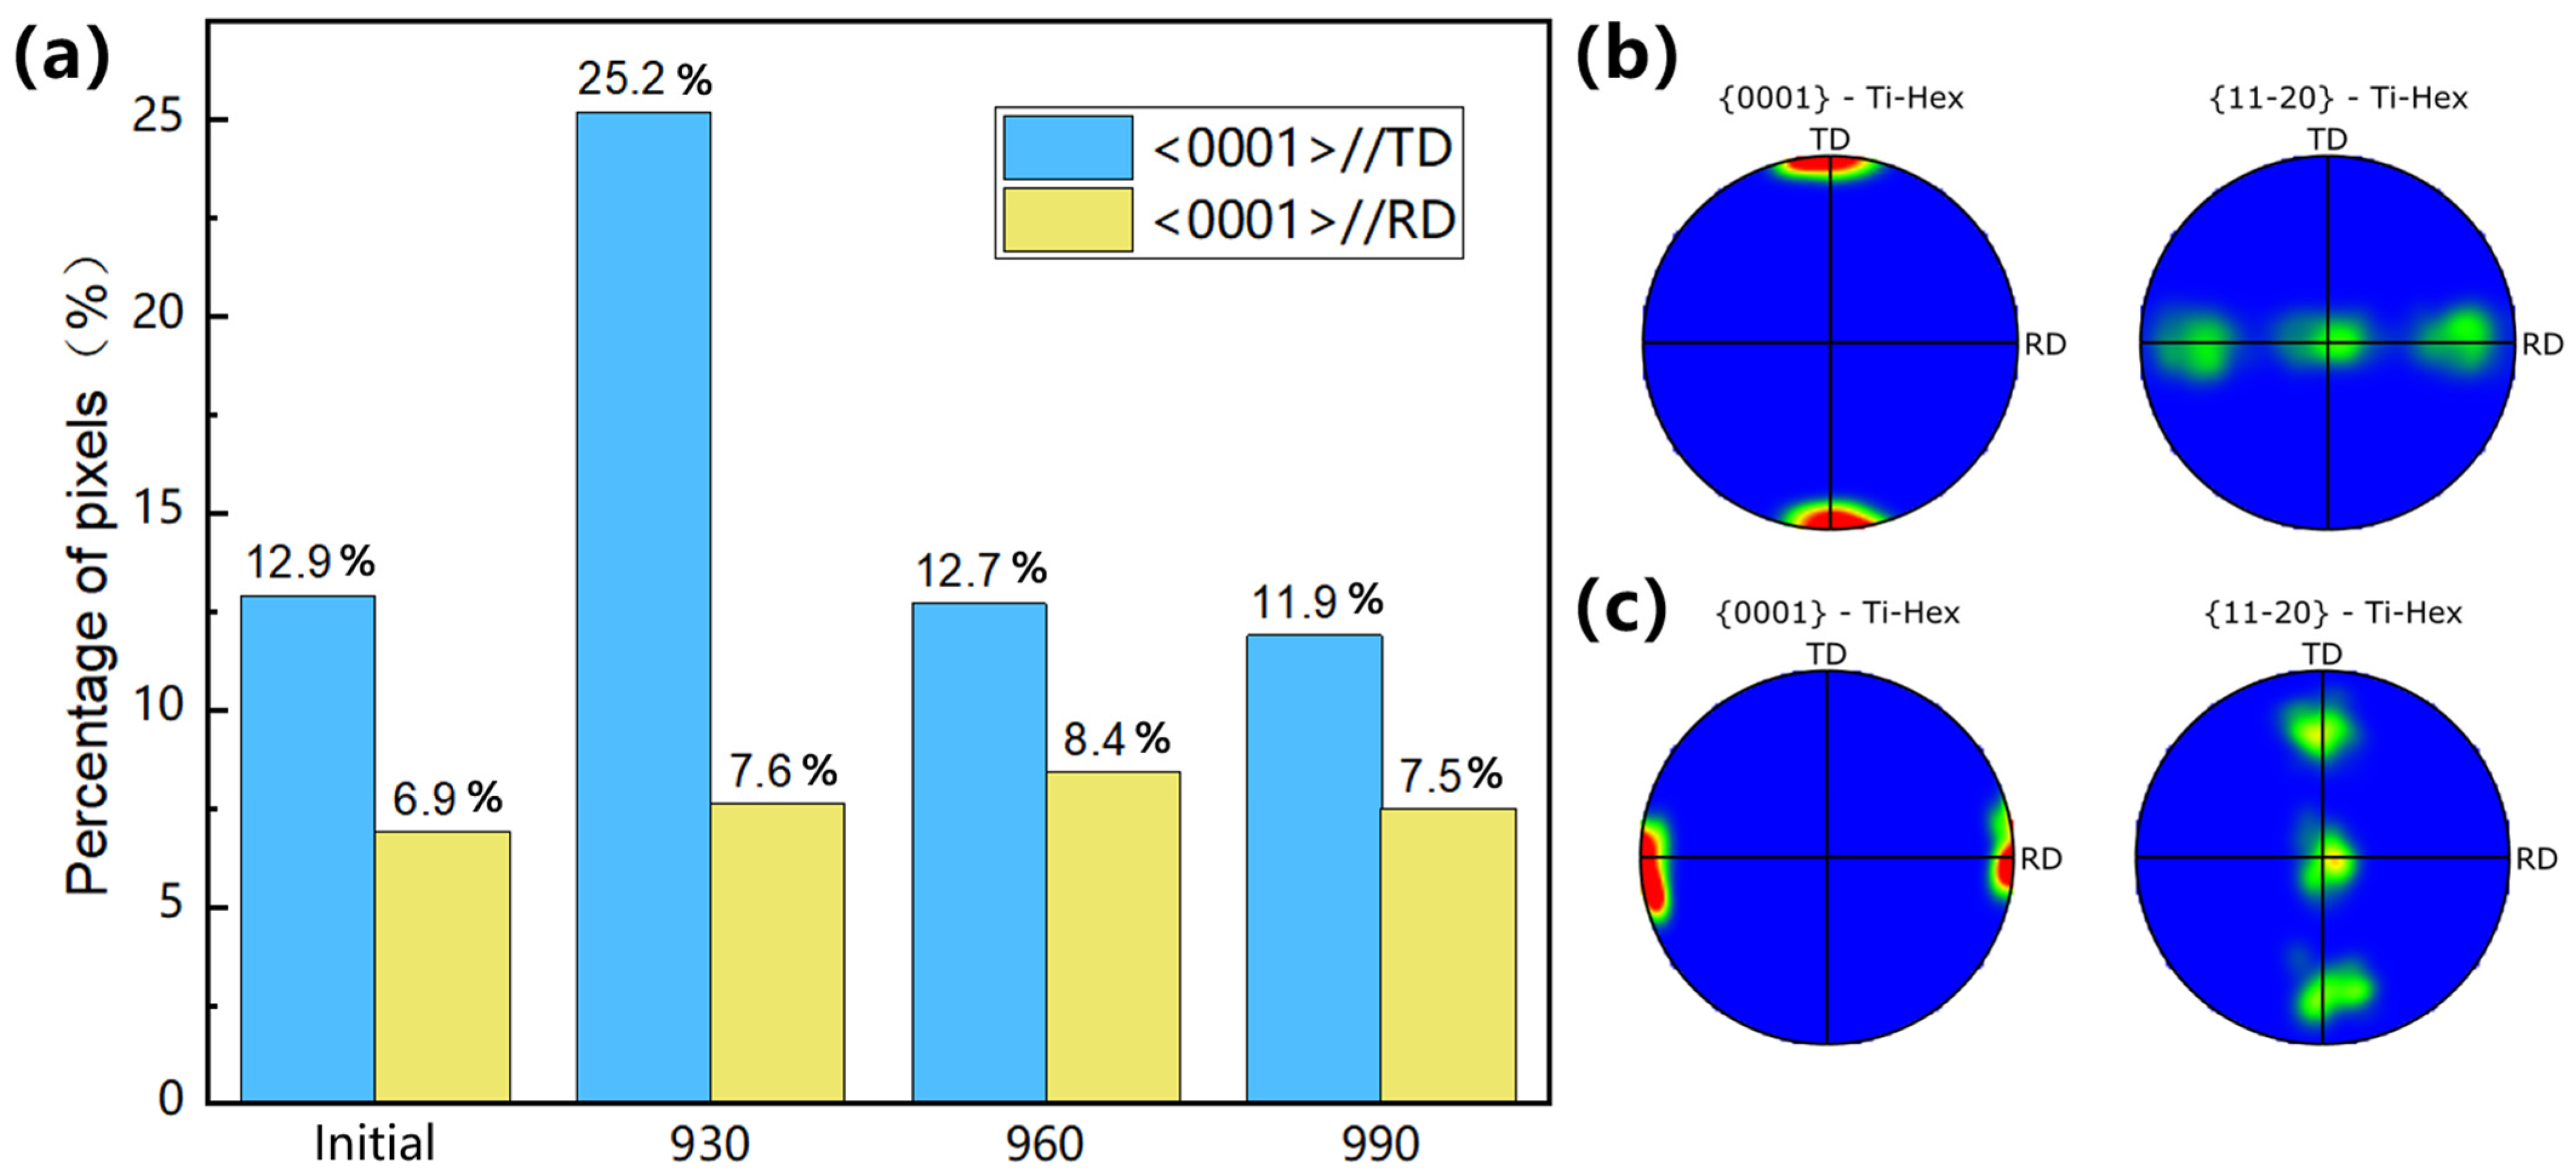
Figure 8.
Inverse pole figure maps of the primary α-phase αp of (a) the initial temperature and (b) 930 °C. KAM maps of the primary α-phase αp of (c) the initial temperature and (d) 930 °C.
Figure 8.
Inverse pole figure maps of the primary α-phase αp of (a) the initial temperature and (b) 930 °C. KAM maps of the primary α-phase αp of (c) the initial temperature and (d) 930 °C.

Figure 9.
(a) Inverse pole figure map of 930 °C; (b) KAM map of 930 °C; and (c) the characteristic Grain A and Grain B.
Figure 9.
(a) Inverse pole figure map of 930 °C; (b) KAM map of 930 °C; and (c) the characteristic Grain A and Grain B.

Figure 10.
The characteristic grains from the two typical texture components in the original microstructure: (a) grain orientation spread map of Component 1 and (c) of Component 2, as well as the (b) the KAM maps of Component 1 and (d) of Component 2.
Figure 10.
The characteristic grains from the two typical texture components in the original microstructure: (a) grain orientation spread map of Component 1 and (c) of Component 2, as well as the (b) the KAM maps of Component 1 and (d) of Component 2.
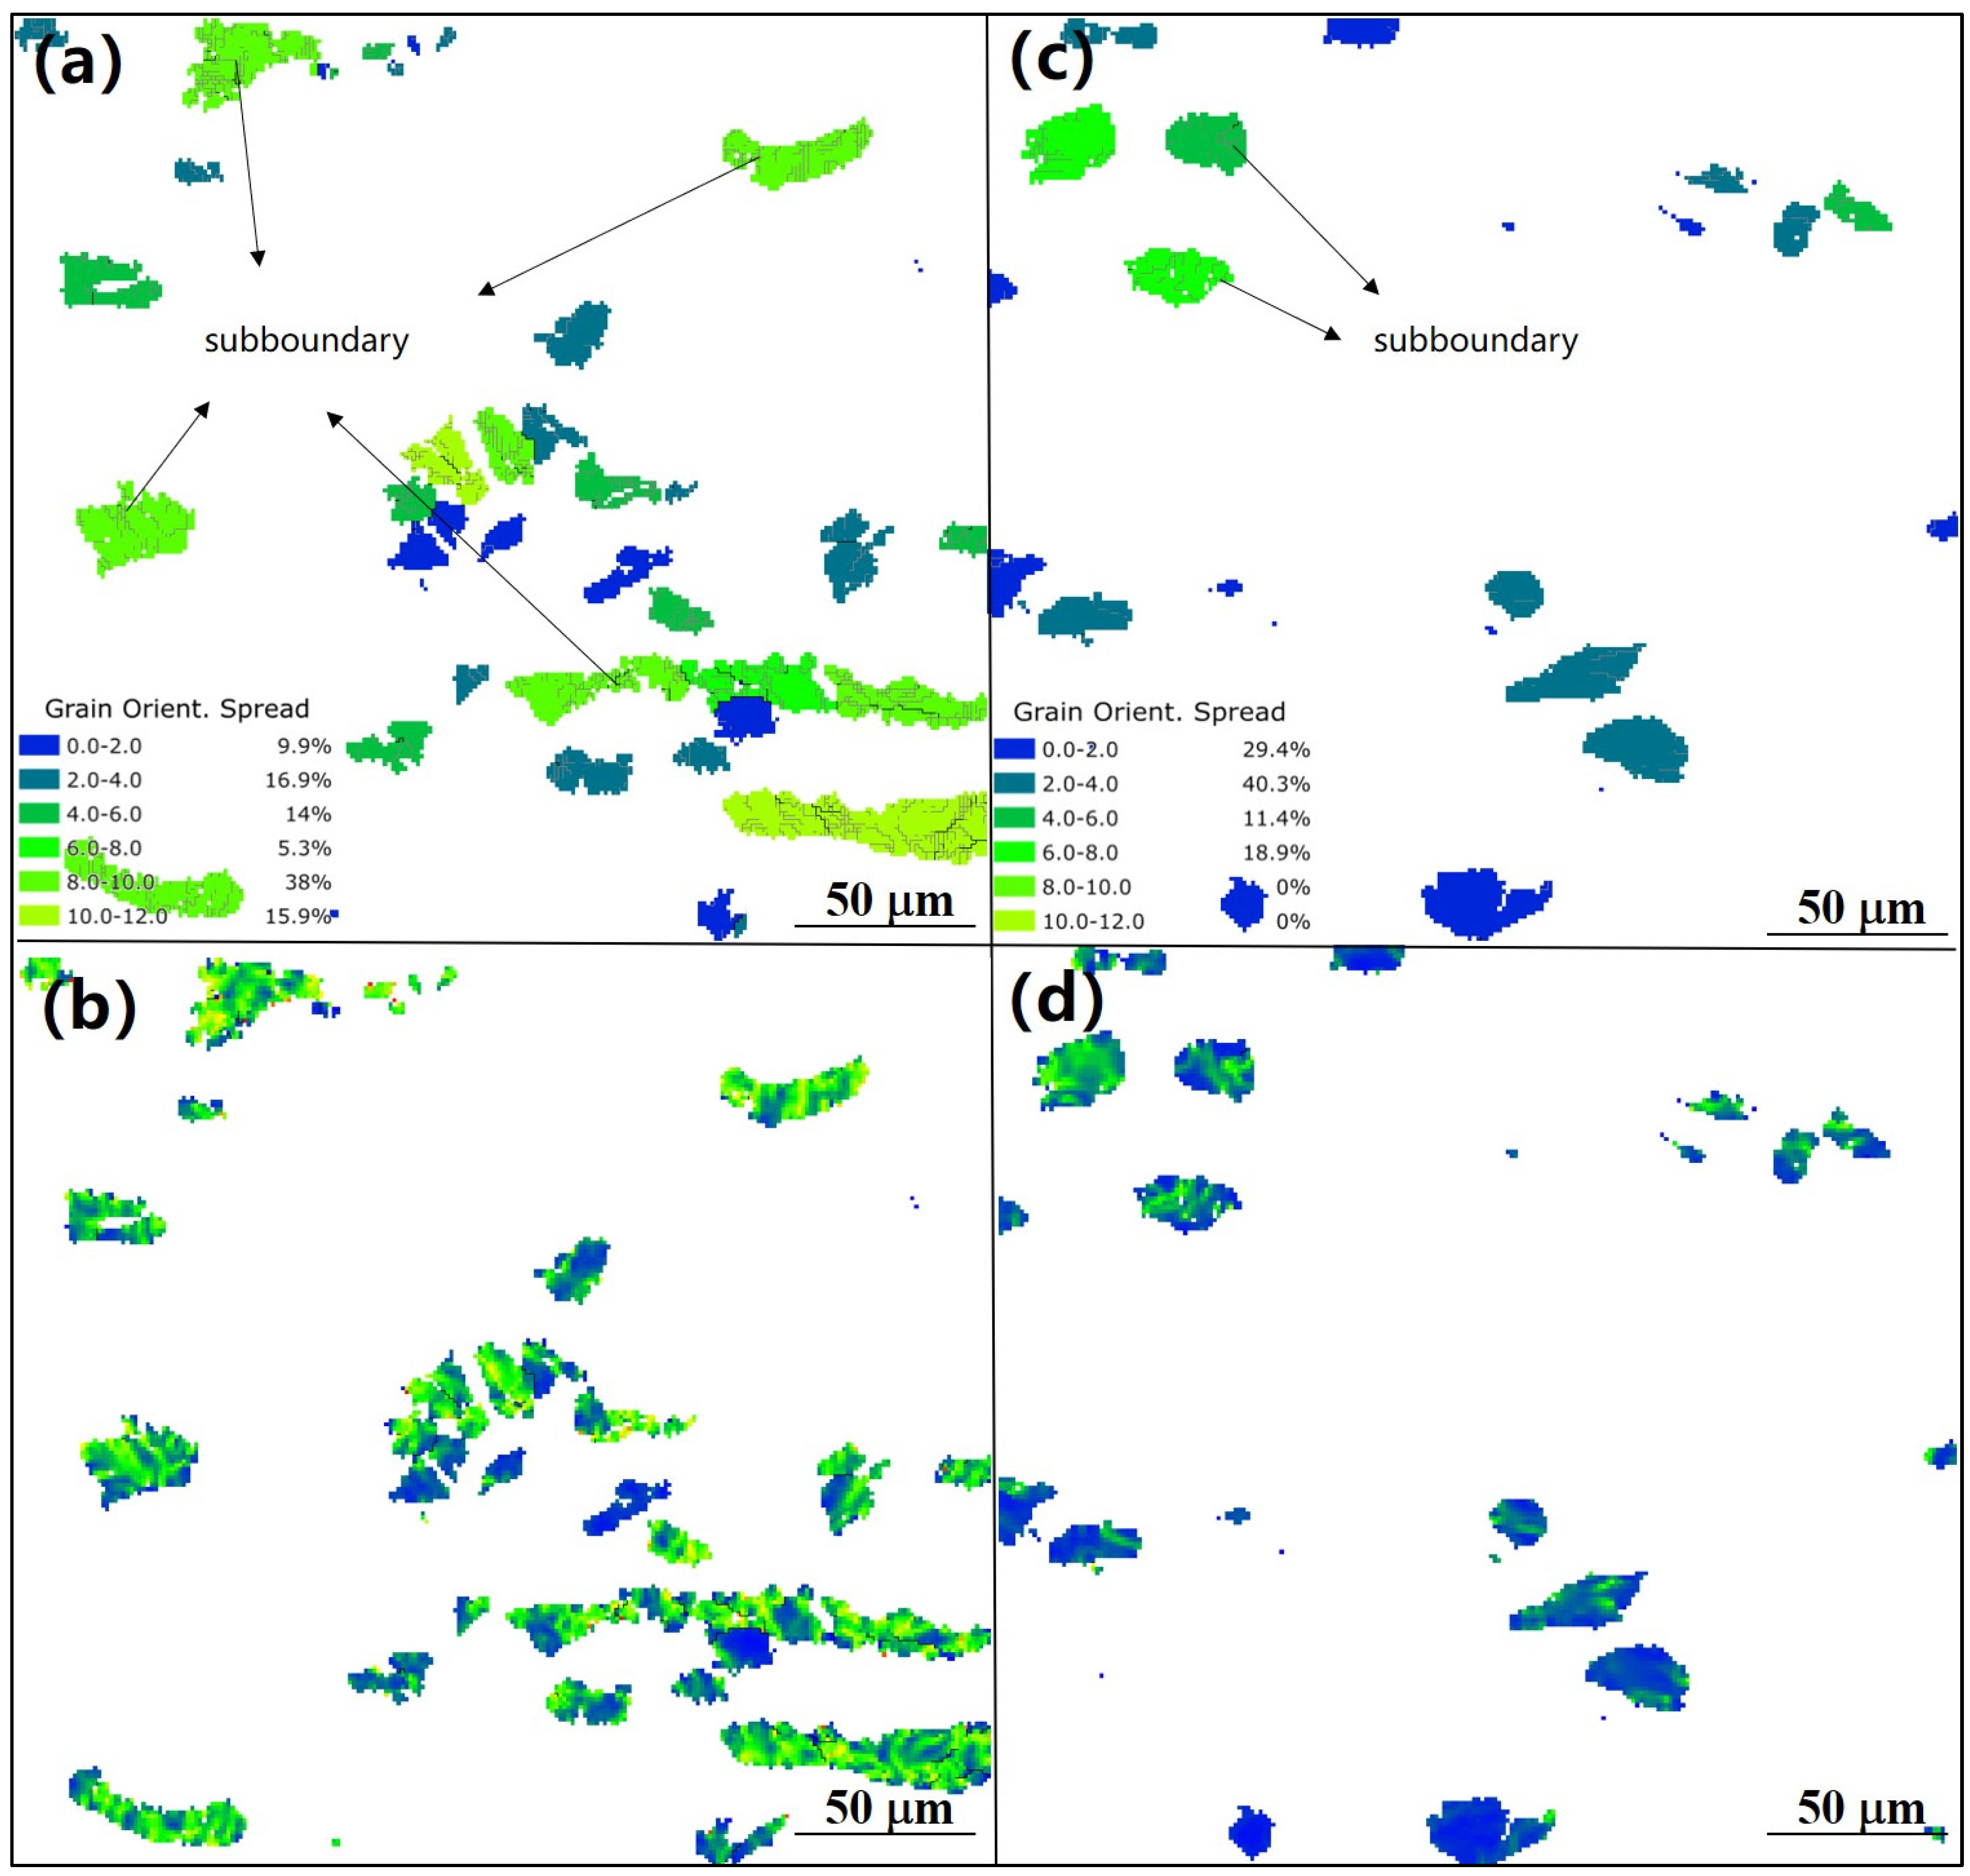
Figure 11.
The first typical grain diagram of dynamic spheroidization: (a) grain orientation; (b) the GOS map; and (c) the KAM map.
Figure 11.
The first typical grain diagram of dynamic spheroidization: (a) grain orientation; (b) the GOS map; and (c) the KAM map.
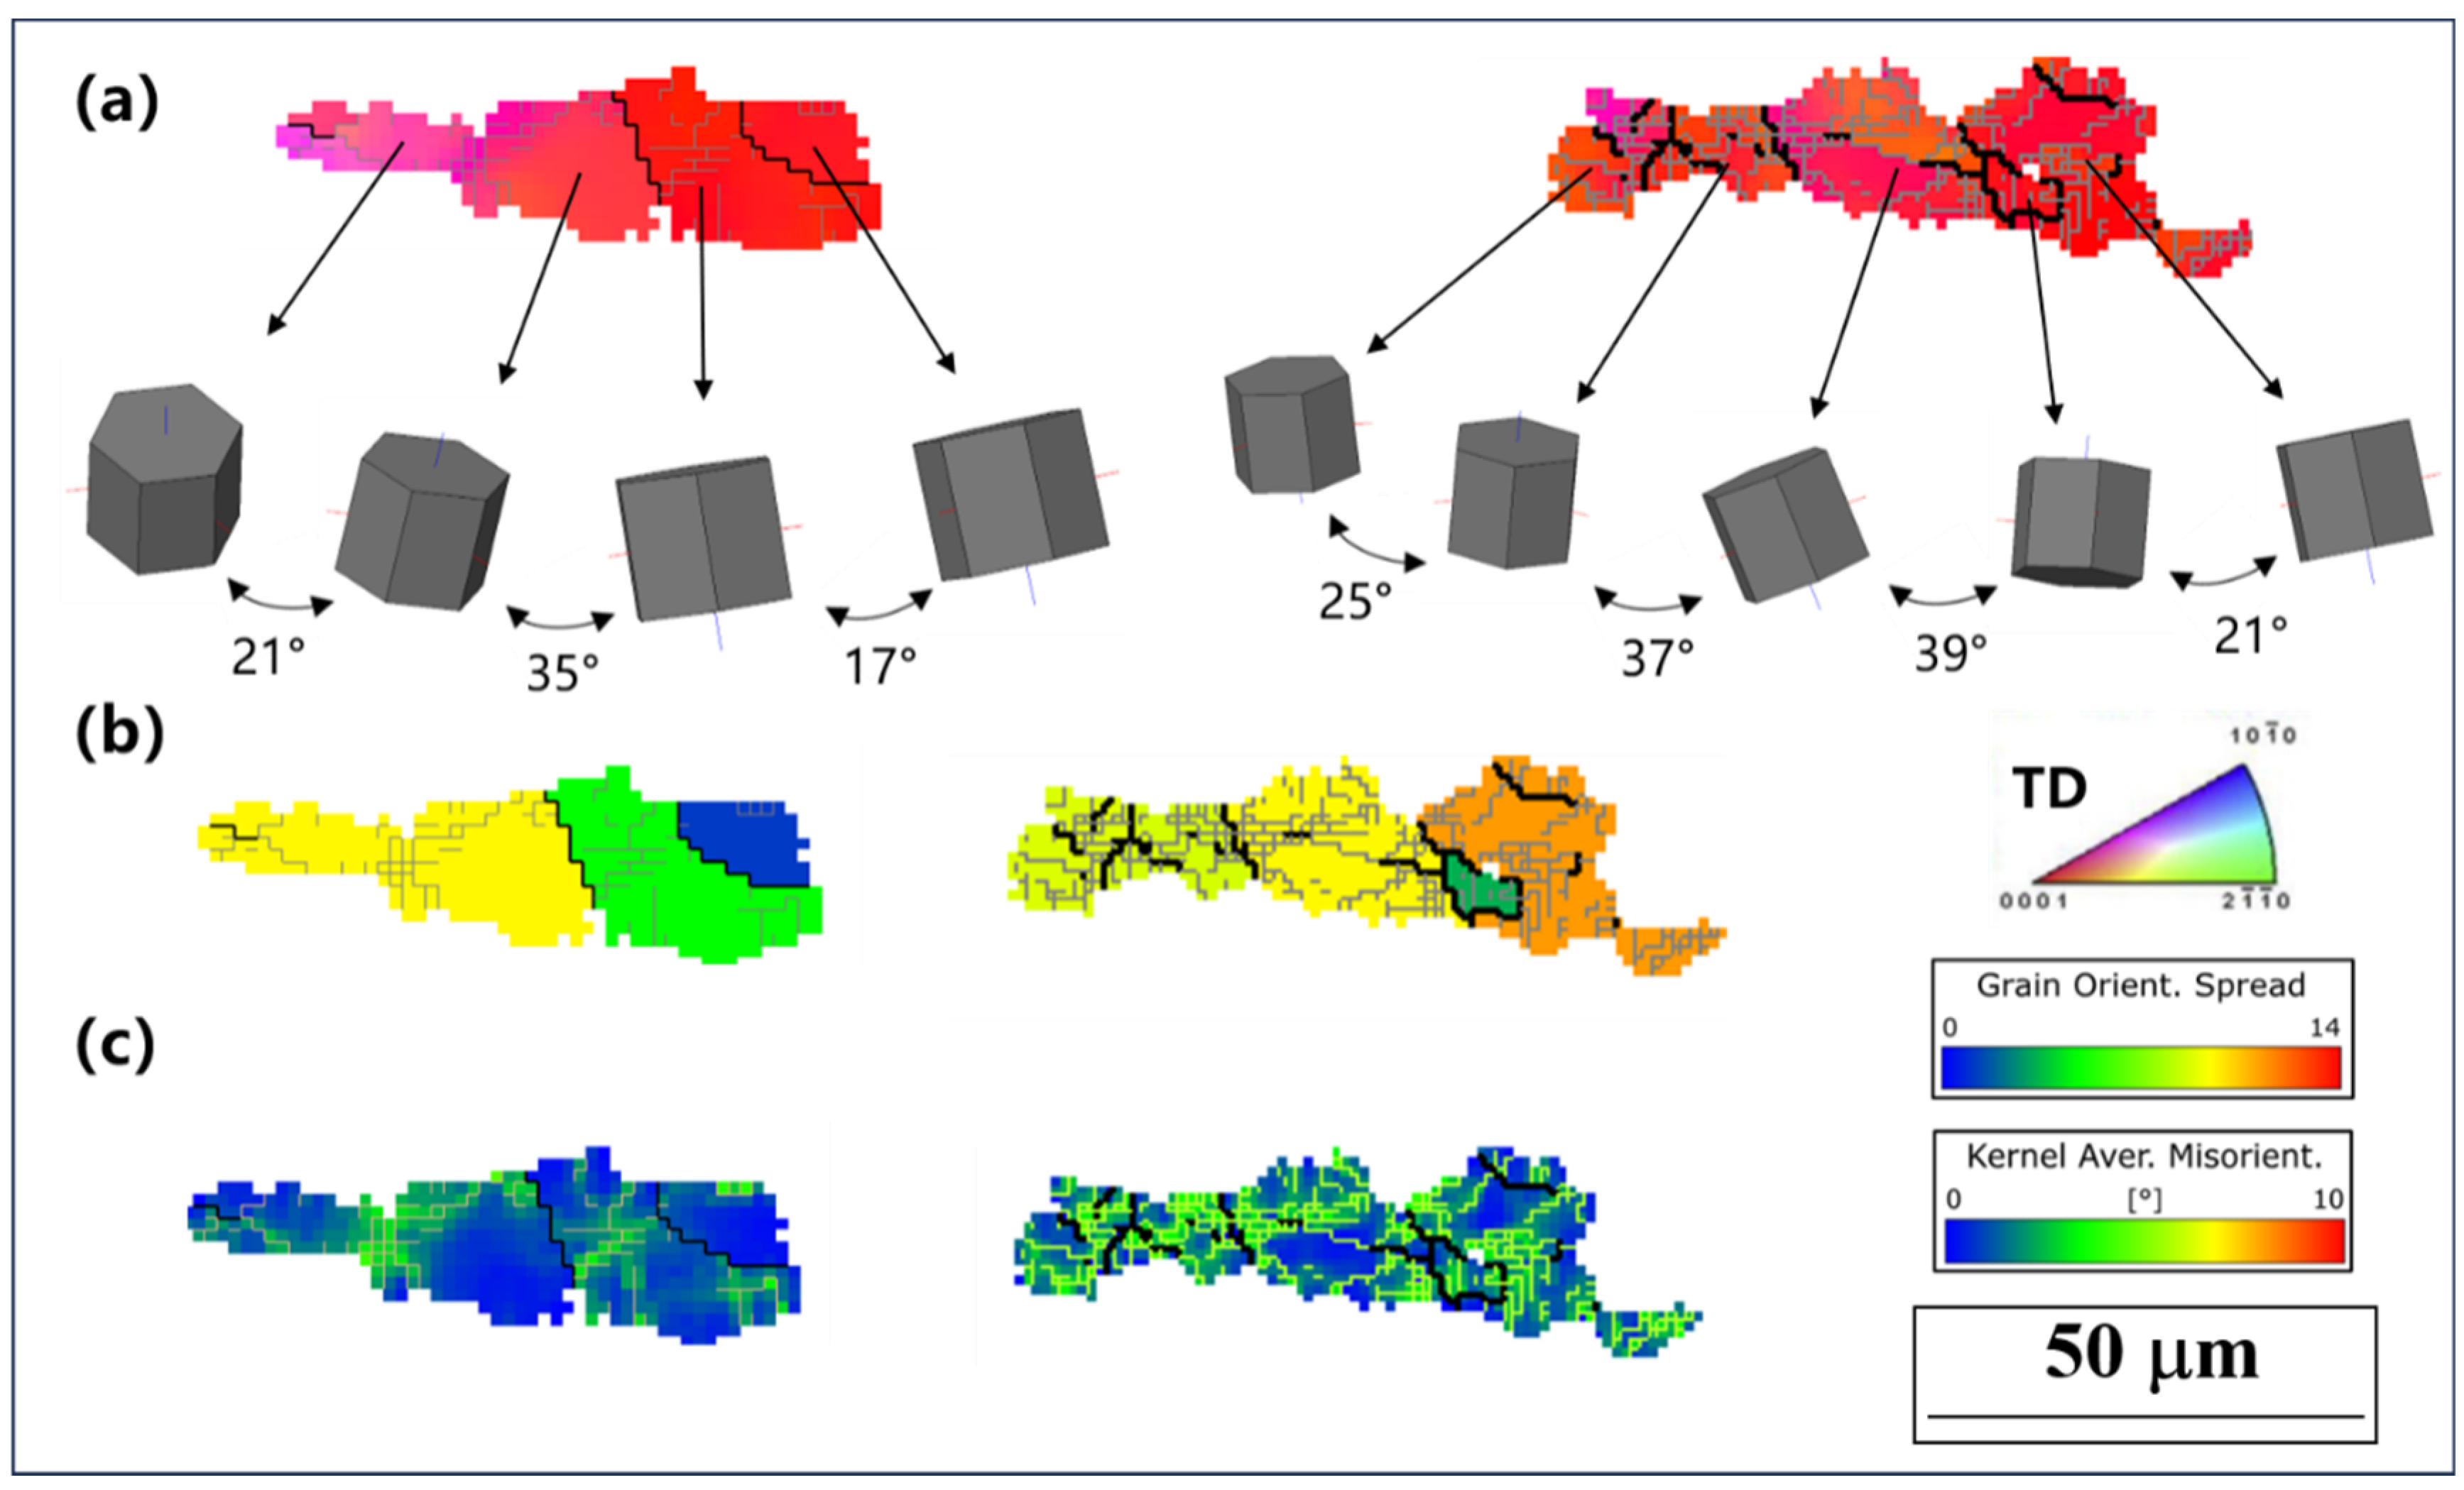
Figure 12.
The second typical grain diagram of dynamic spheroidization: (a) grain orientation; (b) the GOS map; and (c) the KAM map.
Figure 12.
The second typical grain diagram of dynamic spheroidization: (a) grain orientation; (b) the GOS map; and (c) the KAM map.
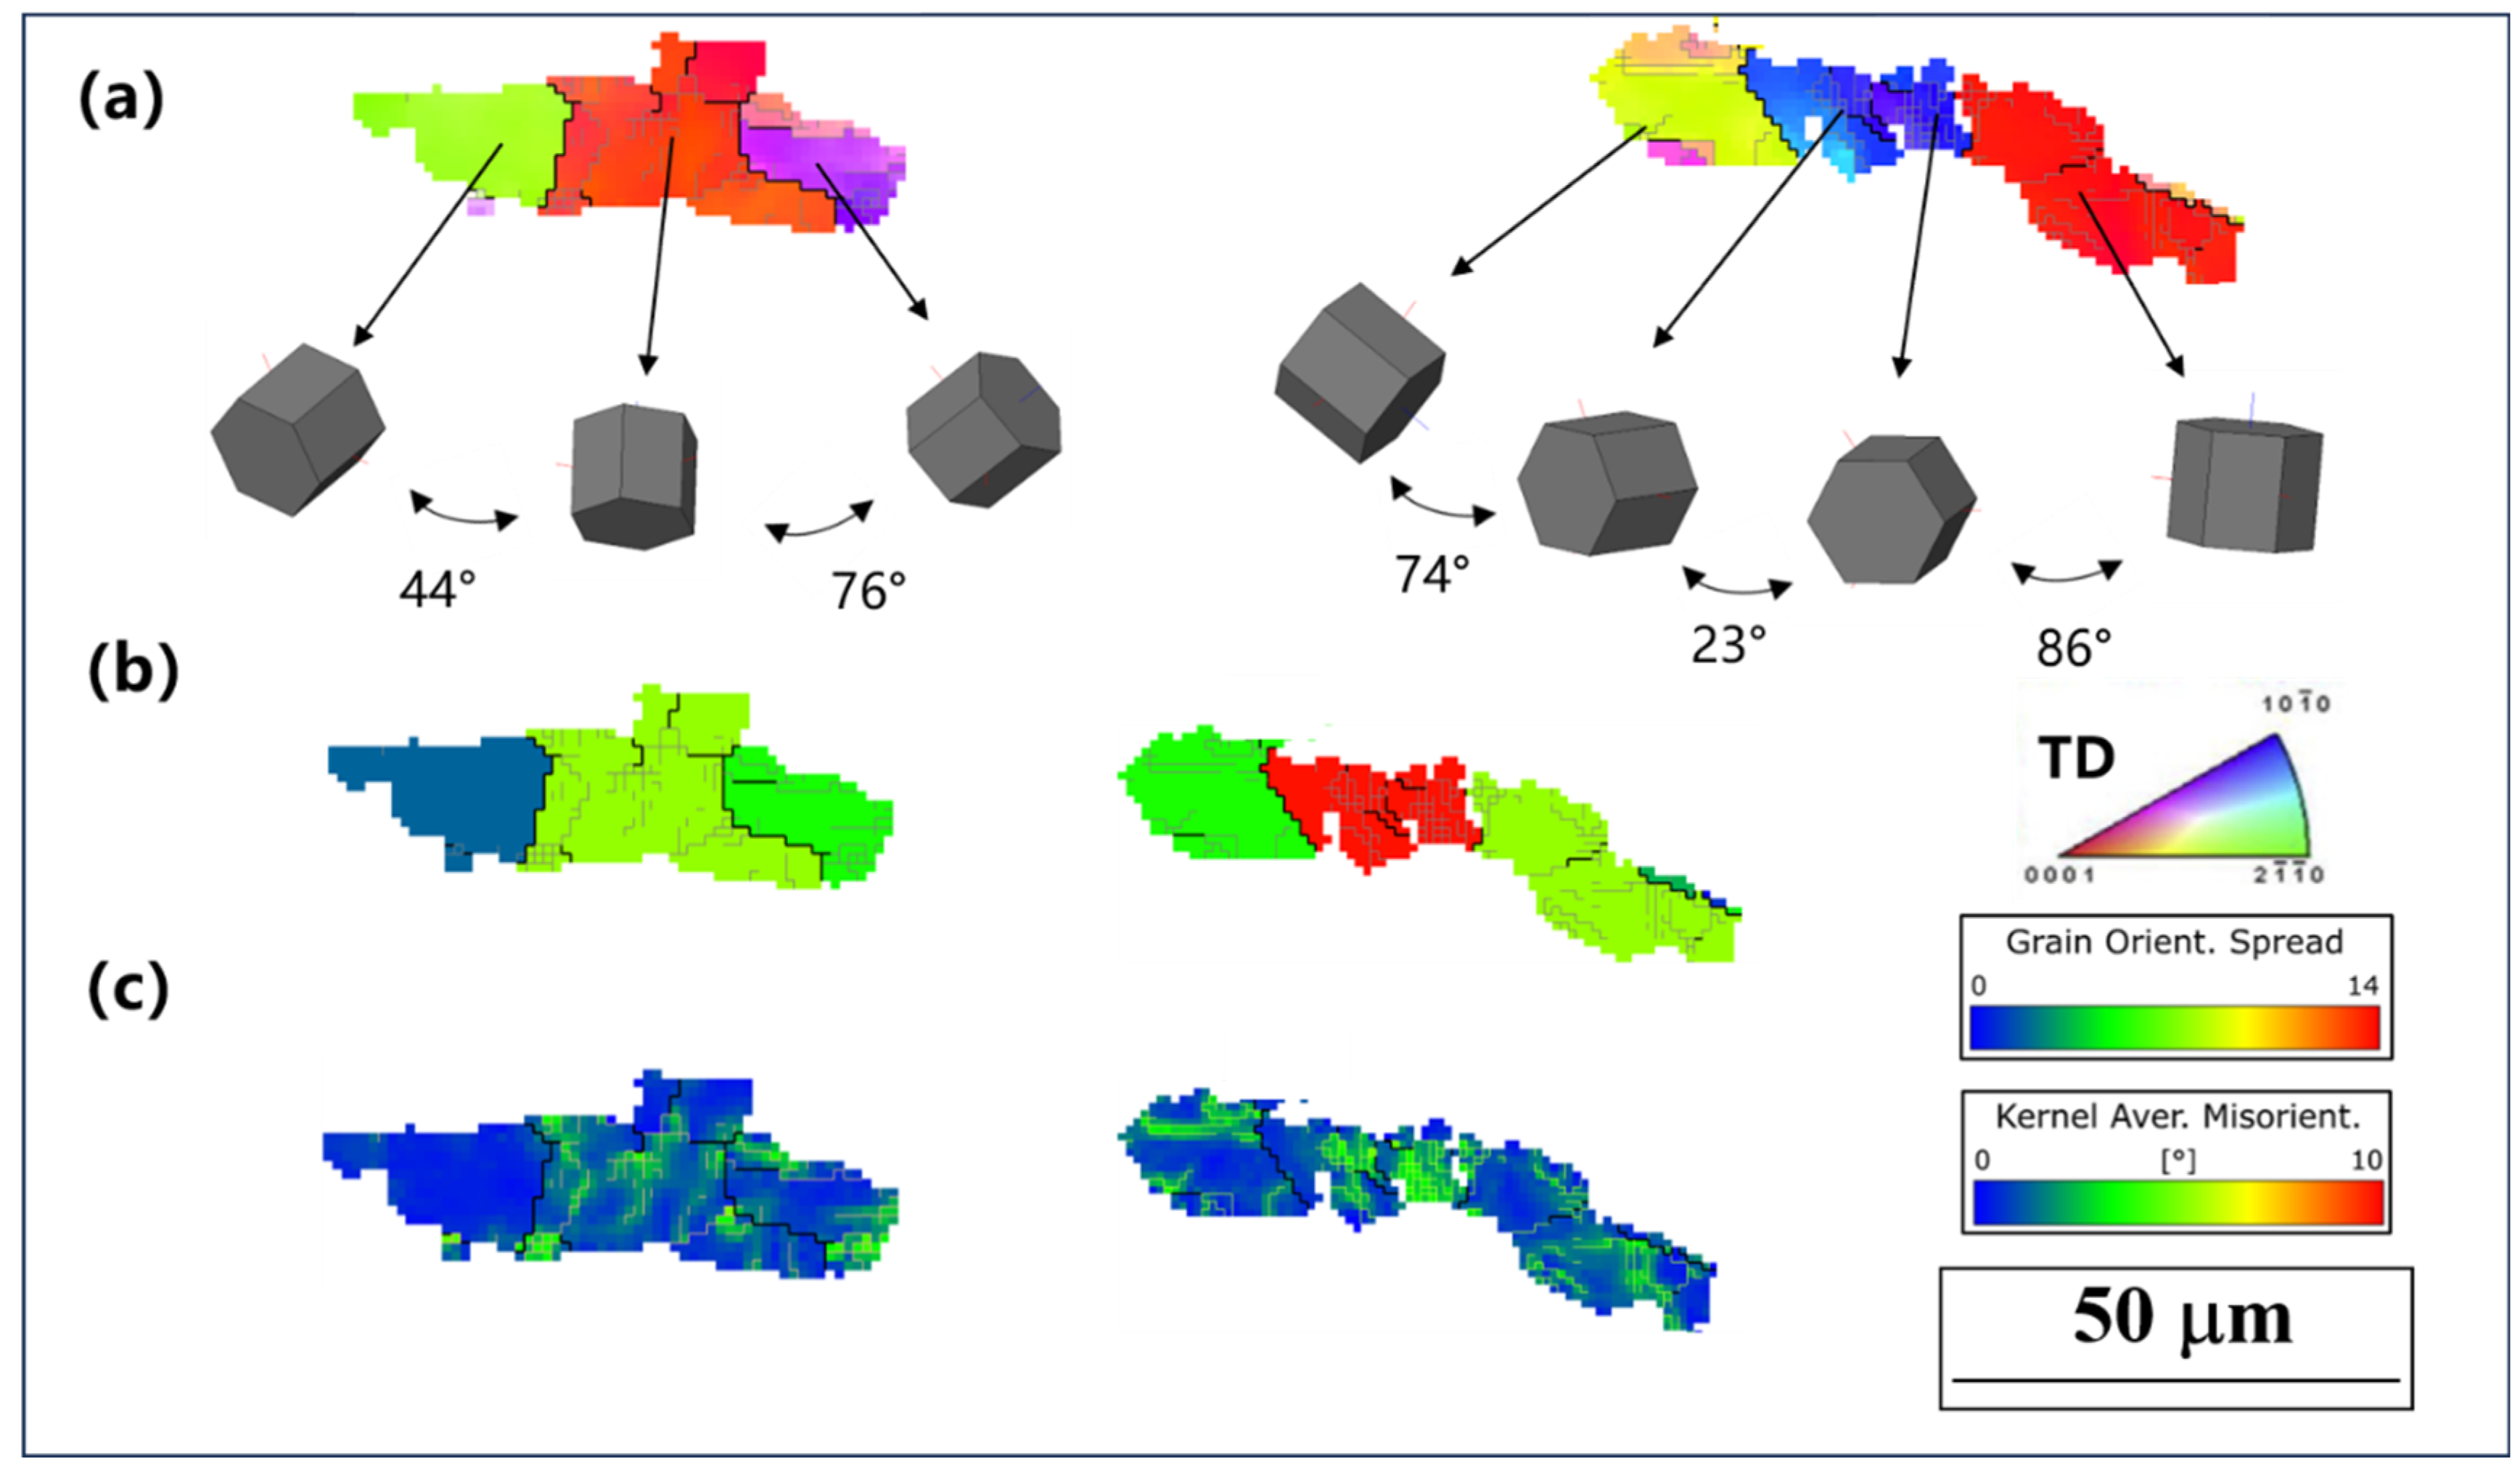
Figure 13.
The third typical grain diagram of dynamic spheroidization: (a) grain orientation; (b) the GOS map; and (c) the KAM map.
Figure 13.
The third typical grain diagram of dynamic spheroidization: (a) grain orientation; (b) the GOS map; and (c) the KAM map.

Table 1.
Phase constitution and the average size of the phase under different conditions.
| Samples | αp (vol%) | βt (vol%) | αp (μm) | Aspect Ratio of αp |
|---|---|---|---|---|
| Original | 71.4 | 28.6 | 29.5 | 1.6 |
| 930 °C | 68.1 | 31.9 | 27.8 | 2.3 |
| 960 °C | 59.0 | 41.0 | 26.1 | 2.6 |
| 990 °C | 52.3 | 47.7 | 24.9 | 2.8 |
Table 2.
Texture index of the entire compositon, αp, and αs under different compression temperatures: the initial temperature, 930 °C, 960 °C, and 990 °C.
Table 2.
Texture index of the entire compositon, αp, and αs under different compression temperatures: the initial temperature, 930 °C, 960 °C, and 990 °C.
| Temperature/°C | Entire Composition | αp Phase | αs Phase |
|---|---|---|---|
| Original | 0.53 | 1.17 | 0.61 |
| 930 °C | 1.01 | 1.51 | 0.96 |
| 960 °C | 0.59 | 1.14 | 0.83 |
| 990 °C | 0.62 | 0.98 | 0.81 |
Disclaimer/Publisher’s Note: The statements, opinions and data contained in all publications are solely those of the individual author(s) and contributor(s) and not of MDPI and/or the editor(s). MDPI and/or the editor(s) disclaim responsibility for any injury to people or property resulting from any ideas, methods, instructions or products referred to in the content. |
© 2024 by the authors. Licensee MDPI, Basel, Switzerland. This article is an open access article distributed under the terms and conditions of the Creative Commons Attribution (CC BY) license (https://creativecommons.org/licenses/by/4.0/).
Share and Cite
MDPI and ACS Style
Dai, Y.; Xiao, Y.; Zeng, W.; Jia, R.; Jia, W. Mechanism of Crystallographic Orientation and Texture Evolution of Ti60 Alloy during Plane Strain Compression. Metals 2024, 14, 359. https://doi.org/10.3390/met14030359
AMA Style
Dai Y, Xiao Y, Zeng W, Jia R, Jia W. Mechanism of Crystallographic Orientation and Texture Evolution of Ti60 Alloy during Plane Strain Compression. Metals. 2024; 14(3):359. https://doi.org/10.3390/met14030359
Chicago/Turabian StyleDai, Yi, Yunteng Xiao, Weidong Zeng, Runchen Jia, and Weiju Jia. 2024. "Mechanism of Crystallographic Orientation and Texture Evolution of Ti60 Alloy during Plane Strain Compression" Metals 14, no. 3: 359. https://doi.org/10.3390/met14030359
Note that from the first issue of 2016, this journal uses article numbers instead of page numbers. See further details here.