
A 3D Non-Linear FE Model and Optimization of Cavity Die Sheet Hydroforming Process

Department of Mechanical Engineering, Amrita School of Engineering, Amrita Vishwa Vidyapeetham, Coimbatore 641112, India
*
Authors to whom correspondence should be addressed.
Metals 2024, 14(4), 478; https://doi.org/10.3390/met14040478
Submission received: 28 February 2024
/
Revised: 12 April 2024
/
Accepted: 16 April 2024
/
Published: 19 April 2024
(This article belongs to the Section Metal Casting, Forming and Heat Treatment)
Abstract
:Cryo-rolled aluminum alloys have a much higher strength-to-weight ratio than cold-rolled alloys, which makes them invaluable in the aerospace and automotive industries. However, this strength gain is frequently accompanied by a formability loss. When uniformly applied to the blank surface, hydroforming provides a solution by generating geometries with constant thickness, making it possible to produce complex structures with “near-net dimensions”, which are difficult to achieve with conventional approaches. This study delves into the cavity die sheet hydroforming (CDSHF) process for high-strength cryo-rolled AA5083 aluminum alloy, focusing on two primary research questions. Firstly, we explored the utilization of a nonlinear 3D finite-element (FE) model to understand its impact on the dimensional accuracy of hydroformed components within the CDSHF process. Specifically, we investigated how decreasing fluid pressure and increasing the holding time of peak fluid pressure can be quantitatively assessed. Secondly, we delved into the optimization of process parameters—fluid pressure (FP), blank holding force (BHF), coefficient of friction (CoF), and flange radius (FR)—to achieve dimensional accuracy in hydroformed square cups through the CDSHF process. Our findings reveal that our efforts, such as reducing peak fluid pressure to 22 MPa, implementing a 30 s holding period, and utilizing an unloading path, enhanced component quality. We demonstrated this with a 35 mm deep square cup exhibiting a 16.1 mm corner radius and reduced material thinning to 5.5%. Leveraging a sophisticated nonlinear 3D FE model coupled with response surface methodology (RSM) and multi-objective optimization techniques, we systematically identified the optimal process configurations, accounting for parameter interactions. Our results underscore the quantitative efficacy of these optimization strategies, as the optimized RSM model closely aligns with finite-element (FE) simulation results, predicting a thinning percentage of 5.27 and a corner radius of 18.64 mm. Overall, our study provides valuable insights into enhancing dimensional accuracy and process optimization in CDSHF, with far-reaching implications for advancing metal-forming technologies.
1. Introduction
Typically, metal forming employs appropriate loads to cause plastic deformation of materials, resulting in the required shape of parts with enhanced material strength. Deep drawing is a forming process with a die and a punch. However, it involves the major challenge of achieving better surface quality and attaining the required thinning of the formed parts. A solution for this challenge is the hydroforming process. To achieve the desired shape, the hydroforming process employs fluid pressure uniformly across the entire surface of the material [1]. Implementing various measures, such as hydroform press and tool technology advancements, simulation methods, and innovations in semi-finished products, sheet material hydroforming, and utilization of heat energy, currently facilitates continuous enhancements in hydroforming applications [2].
Hydroforming can be classified into (i) the shell hydroforming process, (ii) tube hydroforming, and (iii) sheet hydroforming [1,3]. Sheet forming and shell forming are fundamentally different depending on whether a die is used or not. Hwang Y and Manabe K [4] discussed the wide application of hydroforming processes in manufacturing lightweight parts for various industries and presented the latest achievements in tube and sheet hydroforming processes, aiming to provide valuable insights for professionals in product development and forming technology innovation. Considering the vast applications and scope of the sheet hydroforming process, this research focuses on cavity die sheet hydroforming (CDSHF) for the deep drawing process. Sheet hydroforming is typically carried out with either a cavity die (punchless) or a punch (hydromechanical deep drawing).
The CDSHF process is capable of manufacturing complex and intricate geometries. Palumbo et al. used a CDSHF operation with a moveable die to create a hemi-toroidal shape to form stainless steel samples [5]. Successfully producing complex and intricate geometry depends on the design aspects of tools and the control of essential process parameters. Fluid pressure (FP), blank holding force (BHF), and coefficient of friction (CoF) between the blank and die and material thickness are a few commonly studied process parameters for the hydroforming of deep-drawn components [6,7,8,9]. After FP, BHF has the most significant influence on forming. A small change in the BHF is predicted to significantly impact the forming, which will affect the product’s quality [10]. Pradeep Raja C et al. [11] developed an experimental setup for the sheet hydroforming process to study the impact of FP on forming. Other important process parameters are the flange radius (FR), blank temperature, limiting drawing ratio (LDR) of sheet metal [11], and residual stresses and strains carried over from previous processes like rolling [12]. Xiao Jing Liu et al. [13] studied the effect of elevated temperature during the hydroforming process (warm forming). High temperatures have a softening impact, but the intensity of the flowing blank is low. Also, warm forming depicts a more ductile fracture compared to forming at room temperature [14].
Important output parameters found in the literature are material thinning, major and minor strains, and the corner radius of the deep-drawn component. FP controls the formation of inside corners, and a lack of pressure results in an improperly filled corner with a bigger radius than the preferred or worst case, wrinkling [15]. One significant flaw in the sheet hydroforming process is wrinkling. The double-sided hydroforming (DSHF) process is a solution to reduce wrinkling [16]. As back pressure is used during the DSHF process, wrinkles disappear, resulting in better forming. Numerous studies have been performed on flexible dies and how they can increase formability during hydroforming [17,18]. The impact of stresses on spring-back during hydroforming was researched by Zhiying Sun and Lihui Lang. It was discovered that the spring-back decreases with increasing hydraulic pressure [19]. Churiaque C et al. [20] discussed the development of a FE model for predicting spring-back in the hydroforming process of aluminum alloy parts, emphasizing the influence of material parameters on simulations and the importance of accurate material characterization for reliable estimations. Researchers have found that some unusual forming techniques, like using shock waves to form metals, are also gaining popularity [21].
Nowadays, aluminum is considered an ideal solution for lightweight, high-strength applications in the automobile and aerospace industries. The main disadvantages of using aluminum instead of carbon steel are its relatively lower strength and formability. Cryo-rolled Al-alloy sheets can overcome these disadvantages since they possess significantly greater strength due to their ultra-fine grain structure. Cryo-rolling, followed by annealing, improves malleability significantly [22]. Plastic deformation occurs at −196 °C during the cryo-rolling process. Liquid nitrogen is used to achieve this temperature. Cryo-rolling, preceded by CDSHF, can create intricate forms that are light in weight and stronger [23,24,25].
This study uses Abaqus/Explicit 2022 finite-element (FE) software to present a novel method for the CDSHF process for the high-strength cryo-rolled AA5083 aluminum alloy. The blank is assumed to be deformable, and the die and blank holder are assumed to be analytically rigid. The CoF between the blank and blank holder is supposed to be 0.08. The study examines the effects of various process variables on the dimensional accuracy of the hydroformed square cup, such as blank holding force (BHF), fluid pressure (FP), flange radius (FR), and coefficient of friction (CoF). The material flow model uses the arbitrary Lagrangian–Eulerian (ALE) technique. In the conventional Lagrangian approach, the mesh is attached to the material. As a result, the mesh deforms as the material deforms. In the Eulerian method, the material is allowed to flow through the mesh, which remains as a control volume. On the other hand, in the ALE method, those regions corresponding to extensive distortion use the Eulerian method, and other locations use the Lagrangian method [26,27]. The corner radius, the depth of the cup drawn without failure and the corner thinning percentage are among the output parameters examined during the CDSHF.
The introduction section clarifies the difficulties associated with metal forming and offers hydroforming as a solution, emphasizing the applicability of sheet hydroforming—particularly cavity die sheet hydroforming (CDSHF)—for complex geometries. It emphasizes important process variables such as blank holding force (BHF) and fluid pressure (FP) as well as methods to deal with complex forming. The study focuses on developing CDSHF employing high-strength cryo-rolled AA5083 aluminum alloy, emphasizing the importance of cryo-rolled aluminum alloys for lightweight, high-strength applications. These are the research issues that, in light of the completed literature evaluation, our study has attempted to address.
Research Question 1: How might the use of a 3D nonlinear FE model affect the dimensional accuracy of hydroformed components? Specifically, how might the effects of decreasing fluid pressure and increasing holding time of peak fluid pressure be examined when applied to the cavity die sheet hydroforming process for the high-strength cryo-rolled AA5083 aluminum alloy?
Research Question 2: In hydroformed square cups made from cryo-rolled AA5083 aluminum alloy, what are the best configurations for process parameters—such as FP, BHF, CoF, and FR—to achieve dimensional accuracy, and how do these parameters interact with one another to affect the result?
Our work is based on the development and validation of a sophisticated nonlinear 3D finite-element (FE) model specifically intended for CDSHF operations. This model helps us better understand how to optimize process settings for better component quality and formability by accurately mimicking material behavior. Comprehensive evaluations of structural integrity, such as stress distribution, strain behavior, and strain rates under various operating scenarios, are made possible by FE modeling, which is challenging to achieve through experimentation. Using Abaqus/Explicit FE software, we implemented a unique material flow modeling strategy based on the arbitrary Lagrangian–Eulerian (ALE) method. A more accurate depiction of the dynamics of material deformation during the hydroforming process was made possible by this departure from conventional approaches. Additionally, our study presents a novel approach to reduce applied peak fluid pressure, improve component quality, and increase the geometric accuracy of produced components by optimizing the relationship between peak FP and holding time. In particular, our results show that holding FP is essential for process optimization since it greatly lowers the peak fluid pressure needed to produce the product. Additionally, by combining response surface methodology (RSM) with multi-objective optimization techniques, we establish optimal configurations for the CDSHF process while considering process factors like FP, BHF, CoF, and FR. We also systematically determine the relevance of process parameters. The use of this comprehensive quantitative approach bears important implications for industry operations and the future advancement of metal-forming technologies. It enhances our comprehension of CDSHF procedures and opens the door to better process optimization and component quality improvement. Our research essentially represents a paradigm shift in the field of hydroforming, offering fresh perspectives and methods that could revolutionize industrial operations and propel the industry’s ongoing advancement.
2. Methodology
The finite-element (FE) package Abaqus/Explicit was used to develop a nonlinear 3D FE model for the CDSHF process of high-strength cryo-rolled AA5083 (aluminum alloy). The blank is assumed to be deformable, and the die and the blank holder are assumed to be analytically rigid. The CoF between the blank and blank holder is supposed to be 0.08. The developed model was first validated by the experimental results published in the literature by Fitsum Taye and Digavalli Ravi Kumar (2019), namely “Enhancement of draw ability of cryo-rolled AA5083 alloy sheets by hydroforming” [6], which considers BHF, FP, and CoF as the input parameters.
Figure 1 depicts the various stages of the CDSHF process for a square cup using FE modeling. Due to extensive thinning, the bottom corner is the most difficult to form. As mentioned earlier, the ALE scheme is used for meshing the domain. Surface interaction takes place between the die and the bottom part of the blank surface as well as between the blank holder and the blank’s upper surface. The friction coefficient between the blank and the blank holder is set to 0.08, the CoF between the die and the blank is set to 0.04, the FR to 7 mm, the peak FP to 24 MPa, and the BHF to 310 kN [6]. The blank thickness is 1 mm. Figure 2 represents the blank geometry and dimensions. Table 1 shows the chemical composition and Table 2 shows the mechanical properties of cryo-rolled AA5083.
The die and the blank holder are fixed concerning all degrees of freedom, and the blank is permitted to flow plastically in all directions. The level of mesh refinement greatly influences the quality of outcomes in problems involving nonlinear geometry. Hence, we conducted a mesh convergence study (Figure 3) to reach an optimal element size. We obtained the best results for a mesh element size of 0.6, where the solution time is 9.1 h, and the die corner is 7.24 mm (which we discuss later in the paper). Using the C3D8R element typically found in the ABAQUS element library, we applied four elements evenly spaced throughout the thickness of the blank to simulate the response. To ensure consistency in our strategy, we meshed the entire blank surface using the same element type. C3D8R has fewer integration points than an ordinary eight-nodded brick element, which therefore reduces the computational time. The most accurate results in terms of force-displacement, cup height, thinning, and spring-back were obtained using C3D8R elements [28].
Our work investigates the possibility of lowering the applied peak FP by increasing the peak pressure-holding time. Such a reduction in the applied pressure would, in turn, reduce the spring-back effect, thereby increasing the accuracy of the final part geometry. Figure 4 shows the FP path and the BHF applied. In the given figure, the peak FP is kept constant at 22 MPa. Similar studies were carried out for a range of 18 to 22 MPa. Also, we conducted simulations where the FP was uniformly reduced to zero (unloading path) concerning time, as shown in Figure 5.
The presented work also investigates the development of a mathematical model and multi-objective optimization. The objective functions are minimizing thinning percentage and corner radius using response surface methodology (RSM). A flow chart for the optimization process is given in Figure 6. Input parameters and their range are shown in Table 3. The input parameters considered are CoF, FP, BHF, and FR.
3. Results and Discussions
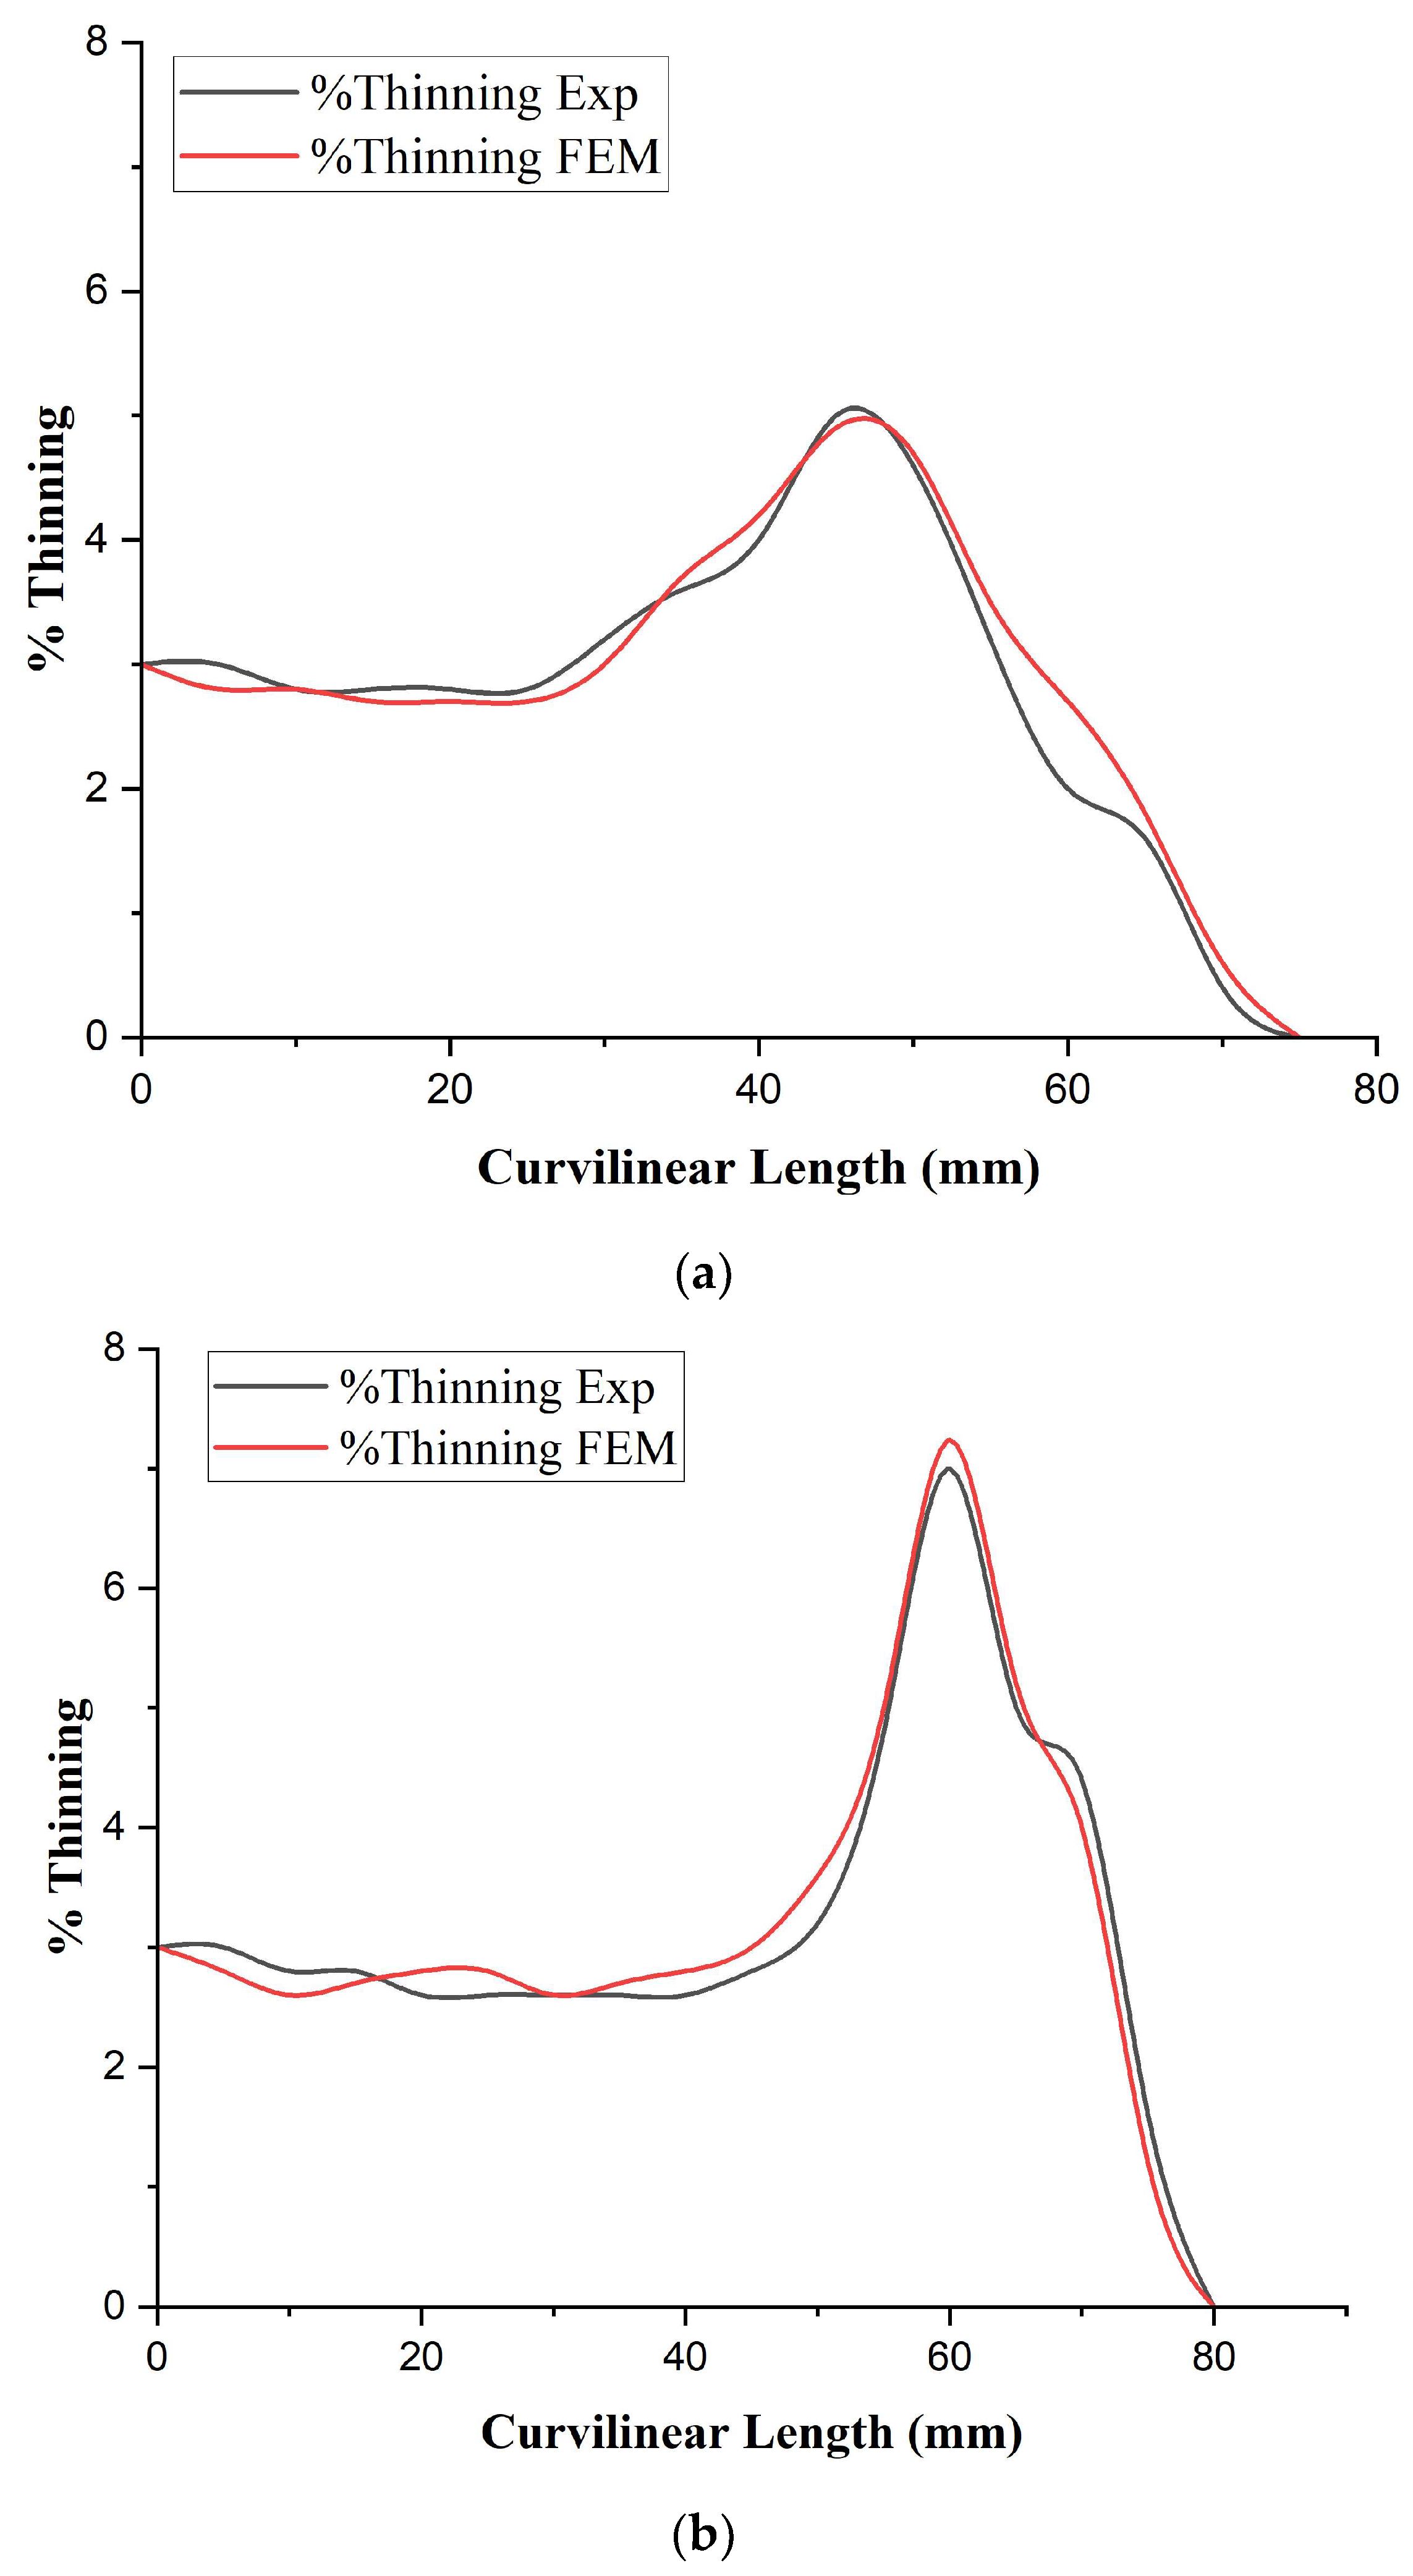
The model validation results are shown in Table 4. Based on the data from the literature [6], the die-blank CoF is taken as 0.04, and between blank holder is taken as 0.08, the FP range is 0–24 MPa, the BHF is 0–310 kN, and the FR is 7 mm. The obtained FE model results differed by less than 5% from the experimental results. Hence, we can be confident in the accuracy of our model. Furthermore, we measured the percentage thinning along the X-X and X-Y directions (as shown in Figure 7) and compared the results with the experimental results obtained in the literature [6] (as shown in Figure 8a,b). The percentage of thinning in the FE model was found to follow the same trend as the experimental results in both the X-X and X-Y directions.
Furthermore, we investigated the possibility of lowering the applied peak FP by increasing the peak pressure-holding time. When the peak pressure was held at 22 MPa for 30 s, we achieved relatively better results with the same material (shown in Figure 4). The resulting die corner radius was 16.21 mm, with a thinning percentage of 5.5. We could only partially form the cups at a peak FP of 18 MPa.
Following an unloading path, as shown in Figure 5, revealed no change in percentage thinning, but a slight improvement was observed in the corner radius formed. The corner radius was measured as 16.1 mm. It was noticed that the material’s spring-back effect was reduced. The FP path shown in Figure 5 was used for further investigation.
The von Mises stress and plastic strain (PEEQ) distribution of fully formed cups at 22 MPa is displayed in Figure 9a,b, respectively. The von Mises stress distribution of partially formed cups at 18 MPa is displayed in Figure 9c. Figure 9a,b depict completely formed corners, while Figure 9c depicts corners that have not yet started to form. The legend represents the von Mises stress and equivalent plastic strain (Figure 9a,b), where the highest concentration of stress and plastic strain are seen at the corners. With 22 MPa peak FP, the average strain rate was 2.21/s at the corners and 1.45/s at the cup’s extremal bottom.
Development of Mathematical Model
Multi-objective optimization was performed to predict the most influencing parameters and to understand the optimal combination of input parameters for an efficient CDSHF process. This optimization process aims to minimize material thinning and corner radius.
Response surface methodology (RSM), a well-established design of experiments (DOE) technique [29,30], was employed to select process parameters. The central composite design (CCD) within response surface methodology (RSM) allowed us to efficiently select 31 unique combinations of process parameters. By strategically placing experimental points at the center, vertices, and midpoints of the factorial design space, CCD ensured comprehensive coverage of the parameter space with only a minimal number of experimental runs. FE simulations were conducted for 25 unique combinations of process parameters, derived from a total of 31 predicted combinations, with 6 combinations repeating. The FE model output parameters include thinning percentage and corner radius, as shown in Table 5.
The effects of different input parameters on the thinning percentage and corner radius of the formed square cup are shown in Figure 10a,b. Figure 10a shows that as the peak FP, BHF, and CoF increase, so does the thinning percentage. On the other hand, FR was found to have an imperceptible effect between 5 mm and 7 mm.
Corners were found to form more efficiently when the FP and BHF were higher, as shown in Figure 10b. Corners formed well when the CoF was lower. The FR greater than 7 mm was found to be of little importance. The material flow was much smoother with a 7 mm FR than a 5 mm FR; however, an FR greater than 7 mm has a larger contact area between the blank and the die. Such a larger FR was found to restrict the flow of material.
The effects of two input parameters on thinning percentage and corner radius are shown in Figure 11a–f and Figure 12a–f, respectively. Figure 11a shows that the thinning percentage is low when low CoF and low BHF are combined, and Figure 12a shows that corner form is better when low CoF and higher BHF are combined. BHF should increase as CoF increases to achieve better corner formation. Thinning decreases for a low CoF/FP combination (Figure 11b), but for better corners, a low CoF/high FP combination is required (Figure 12b). Figure 11c depicts the effect of FR and CoF on percentage thinning; this combination has a negligible impact on reducing material thinning. On the other hand, high FR with low CoF forms corners better (Figure 12c). Figure 11d and Figure 12d show that as FP and BHF increase, the thinning percentage increases, and corner form improves. Figure 11e depicts an interaction between FR and BHF for thinning percentage; thinning decreases with lower CoF for an FR of 7 mm. Figure 12e shows that the FR should increase as the CoF increases for better corner formation. Figure 11f shows very little interaction between FR and FP for the thinning percentage. Figure 12f shows that a larger FR necessitates a larger FP to form corners more effectively.
The RSM-based mathematical model is depicted in Equations (1) and (2). The first equation is a regression equation for the thinning percentage, and the second is a regression equation for the corner radius. The coefficients in the regression equation represent the magnitude and direction of the effect of each independent variable on the response variable, thinning % and corner radius. Positive coefficients indicate a positive relationship, while negative coefficients indicate a negative relationship. The magnitude of the coefficients reflects the strength of the influence. For example, in Equation (1), a 1-unit increase in the coefficient of friction (CoF) results in a 2.78-unit increase in the thinning percentage, all other factors being constant.
Thin.% = −6.45 + 2.78 CoF + 0.01222 BHF + 0.3778 FP + 0.213 FR − 0.0128 FR2
Cor. Rad. = 440.9 + 60.2 CoF − 0.02861 BHF − 37.86 FP − 0.0972 FR − 306 CoF2 + 0.860 FP2
The RSM performance was evaluated using ANOVA. The “model p-value” for both the thinning percentage and corner radius was found to be less than 0.001. As a result, the model can be branded as significant (“model p-value” < 0.05 is significant).
The developed mathematical model yielded the following optimal values: CoF 0.04, BHF 260 kN, peak FP 21.4141, and FR 5 mm. This model has a thinning percentage of 5.27 and a corner radius of 18.64 mm. FE simulations were run for these optimal values of input parameters. The FE model has a thinning percentage of 5.48 and a corner radius of 19.03 mm.
4. Conclusions
- A nonlinear 3D FE model for the CDSHF process of high-strength cryo-rolled AA5083 (aluminum alloy) was developed and validated using experimental work published in the literature;
- Square cups were created through deep drawing using the CDSHF process. The initial process parameters considered were FP 0–24 MPa, BHF 0–310 kN, FR 7 mm, and a CoF of 0.04 between die and blank. The depth of the formed square cup obtained is 35 mm, the corner radius is 16.7 mm, and the thinning percentage is 7.24;
- We formed square cups with better formability by lowering the peak FP to 22 MPa, holding this peak FP for 30 s, and following an unloading path. A 35 mm deep square cup was produced with a die corner radius of 16.1 mm and a thinning percentage of 5.5;
- A mathematical model was developed, and multi-objective optimization was performed to minimize material thinning and corner radius. RSM was used to establish the model. The input parameters considered were FP 20–22 MPa, BHF 260–300 kN, CoF between die and blank 0.04–0.12, and FR 5–7 mm;
- FP was found to be the most influencing parameter. The interaction effects of input parameters on output were also studied. ANOVA was used to validate this RSM-based mathematical model, and the model was found significant (“model p-value” < 0.001);
- The optimal values obtained from the RSM-based mathematical model are CoF of 0.04, BHF of 260 kN, peak FP of 21.41 MPa, and FR 5 mm. This model predicted a thinning percentage of 5.27 and a corner radius of 18.64 mm. The optimum input values were used in the FE simulations, and similar results were obtained. The FE model has a thinning percentage of 5.48 and a corner radius of 19.03 mm.
Author Contributions
Conceptualization, A.A. and A.R.; methodology, A.A.; software, A.A. and A.R.; validation, A.A. and A.R.; formal analysis, A.A.; investigation, A.A.; resources, A.A.; data curation, A.A.; writing—original draft preparation, A.A.; writing—review and editing, A.R. and R.K.V.; visualization, R.K.V.; supervision, A.R. and R.K.V. All authors have read and agreed to the published version of the manuscript.
Funding
This research received no external funding.
Data Availability Statement
The data presented in this study are available on request from the corresponding author. The data are not publicly available due to privacy.
Conflicts of Interest
The authors declare no conflicts of interest.
Abbreviations
| Nomenclature/ Abbreviation | Description |
| FE | Finite element |
| CDSHF | Cavity die sheet hydroforming |
| FP | Fluid pressure |
| ALE | Arbitrary Lagrangian–Eulerian |
| CoF | Coefficient of friction |
| BHF | Blank holding force |
| FR | Flange radius |
| RSM | Response surface methodology |
| YS | Yield strength |
| UTS | Ultimate tensile strength |
| Elng. (%) | Percentage elongation |
| n | Strain hardening index |
| K | Strength coefficient |
| CCD | Central composite design |
| ANOVA | Analysis of variance |
| Cor. Rad. | Corner radius |
| % Thin. | Percentage thinning |
References
- Bell, C.; Corney, J.; Zuelli, N.; Savings, D. A state of the art review of hydroforming technology: Its applications, research areas, history, and future in manufacturing. Int. J. Mater. Form. 2020, 13, 789–828. [Google Scholar] [CrossRef]
- Hartl, C. Research and advances in fundamentals and industrial applications of hydroforming. J. Mater. Process. Technol. 2005, 167, 383–392. [Google Scholar] [CrossRef]
- Lang, L.H.; Wang, Z.R.; Kang, D.C.; Yuan, S.J.; Zhang, S.H.; Danckert, J.; Nielsen, K.B. Hydroforming highlights: Sheet hydroforming and tube hydroforming. J. Mater. Process. Technol. 2004, 151, 165–177. [Google Scholar] [CrossRef]
- Palumbo, G.; Zhang, S.H.; Tricarico, L.; Xu, C.; Zhou, L.X. Numerical/experimental investigations for enhancing the sheet hydroforming process. Int. J. Mach. Tools Manuf. 2006, 46, 1212–1221. [Google Scholar] [CrossRef]
- Hwang, Y.M.; Manabe, K.I. Latest hydroforming technology of metallic tubes and sheets. Metals 2021, 11, 1360. [Google Scholar] [CrossRef]
- Feyissa, F.T.; Kumar, D.R. Enhancement of drawability of cryorolled AA5083 alloy sheets by hydroforming. J. Mater. Res. Technol. 2019, 8, 411–423. [Google Scholar] [CrossRef]
- Modi, B.; Kumar, D.R. Development of a hydroforming setup for deep drawing of square cups with variable blank holding force technique. Int. J. Adv. Manuf. Technol. 2013, 66, 1159–1169. [Google Scholar] [CrossRef]
- Raj, A.B.; Arun, A.; Ramesh, A. Finite Element Modelling and Optimisation of Sheet Hydroforming for Cryo-rolled AA5083 Sheets. In Lecture Notes in Mechanical Engineering; Springer: Singapore, 2021; pp. 931–942. [Google Scholar] [CrossRef]
- Ahamed, J.F.A.; Chinnaiyan, P. Parametric Optimization in Hydroforming of Nimonic 90 Sheet using Cuckoo Search and Particle Swarm Optimization. Int. J. Eng. Trends Technol. 2023, 71, 148–158. [Google Scholar] [CrossRef]
- Nguyen, T.T.; Nguyen, T.D. A Study on the Impact of Blank Holder Pressure on Forming Pressure and Product Quality in Hydrostatic Forming. Int. J. Precis. Eng. Manuf. 2023, 24, 187–198. [Google Scholar] [CrossRef]
- Ballikaya, H.; Savas, V.; Ozay, C. The limit drawing ratio in die angled hydromechanical deep drawing method. Int. J. Adv. Manuf. Technol. 2020, 106, 791–801. [Google Scholar] [CrossRef]
- Chinnaraj, K.; Padmanaban, R. Analytical Prediction of Residual Stresses in Cold Formed Steel Sections with Elastic—Perfectly Plastic Material Model. In SAE Technical Papers; SAE International: Warrendale, PA, USA, 2017. [Google Scholar] [CrossRef]
- Liu, X.J.; Ma, X.F.; Li, C.; Qin, J.; Chen, P. Construction of aluminum alloy constitutive model based on BP neural network and the study of non-isothermal hydroforming. Int. J. Adv. Manuf. Technol. 2022, 120, 8259–8274. [Google Scholar] [CrossRef]
- Wang, H.; Cheng, S.; Ye, Z.; Wu, T.; Jin, K.; Guo, X. Evaluation of the formability of AA2198-T3 Al-Li alloy in warm sheet hydroforming. Int. J. Adv. Manuf. Technol. 2022, 118, 405–416. [Google Scholar] [CrossRef]
- Koç, M. Hydroforming for Advanced Manufacturing; Woodhead Publishing Ltd.: Cambridge, UK, 2008; pp. i–iii. ISBN 9781845693282. [Google Scholar]
- Akay, S.B.; Halkacı, H.S.; Öztürk, E.; Öztürk, O.; Ataş, G.; Aydın, M.; Türköz, M.; Dilmeç, M. Numerical and experimental investigation of the effect of double-sided hydroforming process on wrinkling damage by optimizing loading curves with adaptive control. Int. J. Adv. Manuf. Technol. 2022, 121, 2149–2168. [Google Scholar] [CrossRef]
- Xiang, N.; Huang, T.; Wang, P.Y.; Zheng, L.H.; Guo, J.Q.; Guo, X.H.; Chen, F.X. Increased sheet-forming capability via controlling in-plane stress state of the sheet metal using hetero-structured flexible dies. Int. J. Adv. Manuf. Technol. 2022, 120, 3491–3506. [Google Scholar] [CrossRef]
- Han, Z.; Wei, C.; Du, S.; Jia, Z.; Du, X. Numerical simulation and experimental research on rubber flexible-die forming limitation with new position-limited backpressure mechanism. Int. J. Adv. Manuf. Technol. 2021, 116, 2183–2196. [Google Scholar] [CrossRef]
- Sun, Z.; Lang, L. Effect of stress distribution on springback in hydroforming process. Int. J. Adv. Manuf. Technol. 2017, 93, 2773–2782. [Google Scholar] [CrossRef]
- Churiaque, C.; Sánchez-Amaya, J.M.; Caamaño, F.; Vazquez-Martinez, J.M.; Botana, J. Springback Estimation in the Hydroforming Process of UNS A92024-T3 Aluminum Alloy by FEM Simulations. Metals 2018, 8, 404. [Google Scholar] [CrossRef]
- Nagaraja, S.R.; Prasad, J.K.; Jagadeesh, G. Theoretical-experimental study of shock wave-assisted metal forming process using a diaphragmless shock tube. Proc. Inst. Mech. Eng. Part G J. Aerosp. Eng. 2012, 226, 1534–1543. [Google Scholar] [CrossRef]
- Zhang, S.; Luo, X.; Zheng, G.Y.; Hu, R.; Wang, H.; Li, M.H. Evolutions of Microstructure and Mechanical Properties of Cryorolled 7085 Al Alloy After Annealing Treatments. JOM 2023, 75, 2462–2472. [Google Scholar] [CrossRef]
- Feyissa, F.; Urnendu Das, P.; Ravi Kumar, D.; Ravi Sankar, B. Characterization of Mechanical Properties and Formability of Cryorolled Aluminium Alloy Sheets. In Proceedings of the 5th International & 26th All India Manufacturing Technology, Design and Research Conference (AIMTDR 2014), IIT Guwahati, Assam, India, 12–14 December 2014; pp. 5111–5116. [Google Scholar]
- Feyissa, F.; Ravi Kumar, D.; Rao, P.N. Characterization of Microstructure, Mechanical Properties and Formability of Cryorolled AA5083 Alloy Sheets. J. Mater. Eng. Perform. 2018, 27, 1614–1627. [Google Scholar] [CrossRef]
- Satish, D.R.; Feyissa, F.T.; Kumar, D.R. Formability of Cryorolled Aluminum Alloy Sheets in Warm Forming. Int. J. Mater. Mech. Manuf. 2018, 6, 123–126. [Google Scholar] [CrossRef]
- Raut, S.V.; Ramesh, A.; Arun, A.; Sumesh, C.S. Finite element analysis and optimization of tube hydroforming process. Mater. Today Proc. 2021, 46, 5008–5016. [Google Scholar] [CrossRef]
- Haridas, M.; Gopal, G.; Ramesh, A.; Katta, R.K. Modelling and simulation of single and multi-pass flow forming to investigate the influence of process parameters on part accuracy. Int. J. Manuf. Res. 2016, 11, 274–289. [Google Scholar] [CrossRef]
- Barrett, T.J.; Knezevic, M. Deep drawing simulations using the finite element method embedding a multi-level crystal plasticity constitutive law: Experimental verification and sensitivity analysis. Comput. Methods Appl. Mech. Eng. 2019, 354, 245–270. [Google Scholar] [CrossRef]
- Sumesh, C.S.; Akbar, D.S.; Purandharadass, H.S.; Chandrasekaran, R.J. Optimization of dimensional tolerances and material removal rate in the orthogonal turning of AISI 4340 steel. Period. Polytech. Mech. Eng. 2021, 65, 205–216. [Google Scholar] [CrossRef]
- Kuppusamy, A.; Rameshkumar, K.; Sumesh, A.; Premkumar, S. Gas Metal Arc Welding Process Parameter Optimization to Reduce Porosity Defect in a Longitudinal Seam Welding of Pressure Vessels. SAE Int. J. Mater. Manuf. 2019, 13, 61–79. [Google Scholar] [CrossRef]
Figure 1.
Various stages of the CDSHF process of a square cup using FE modeling.
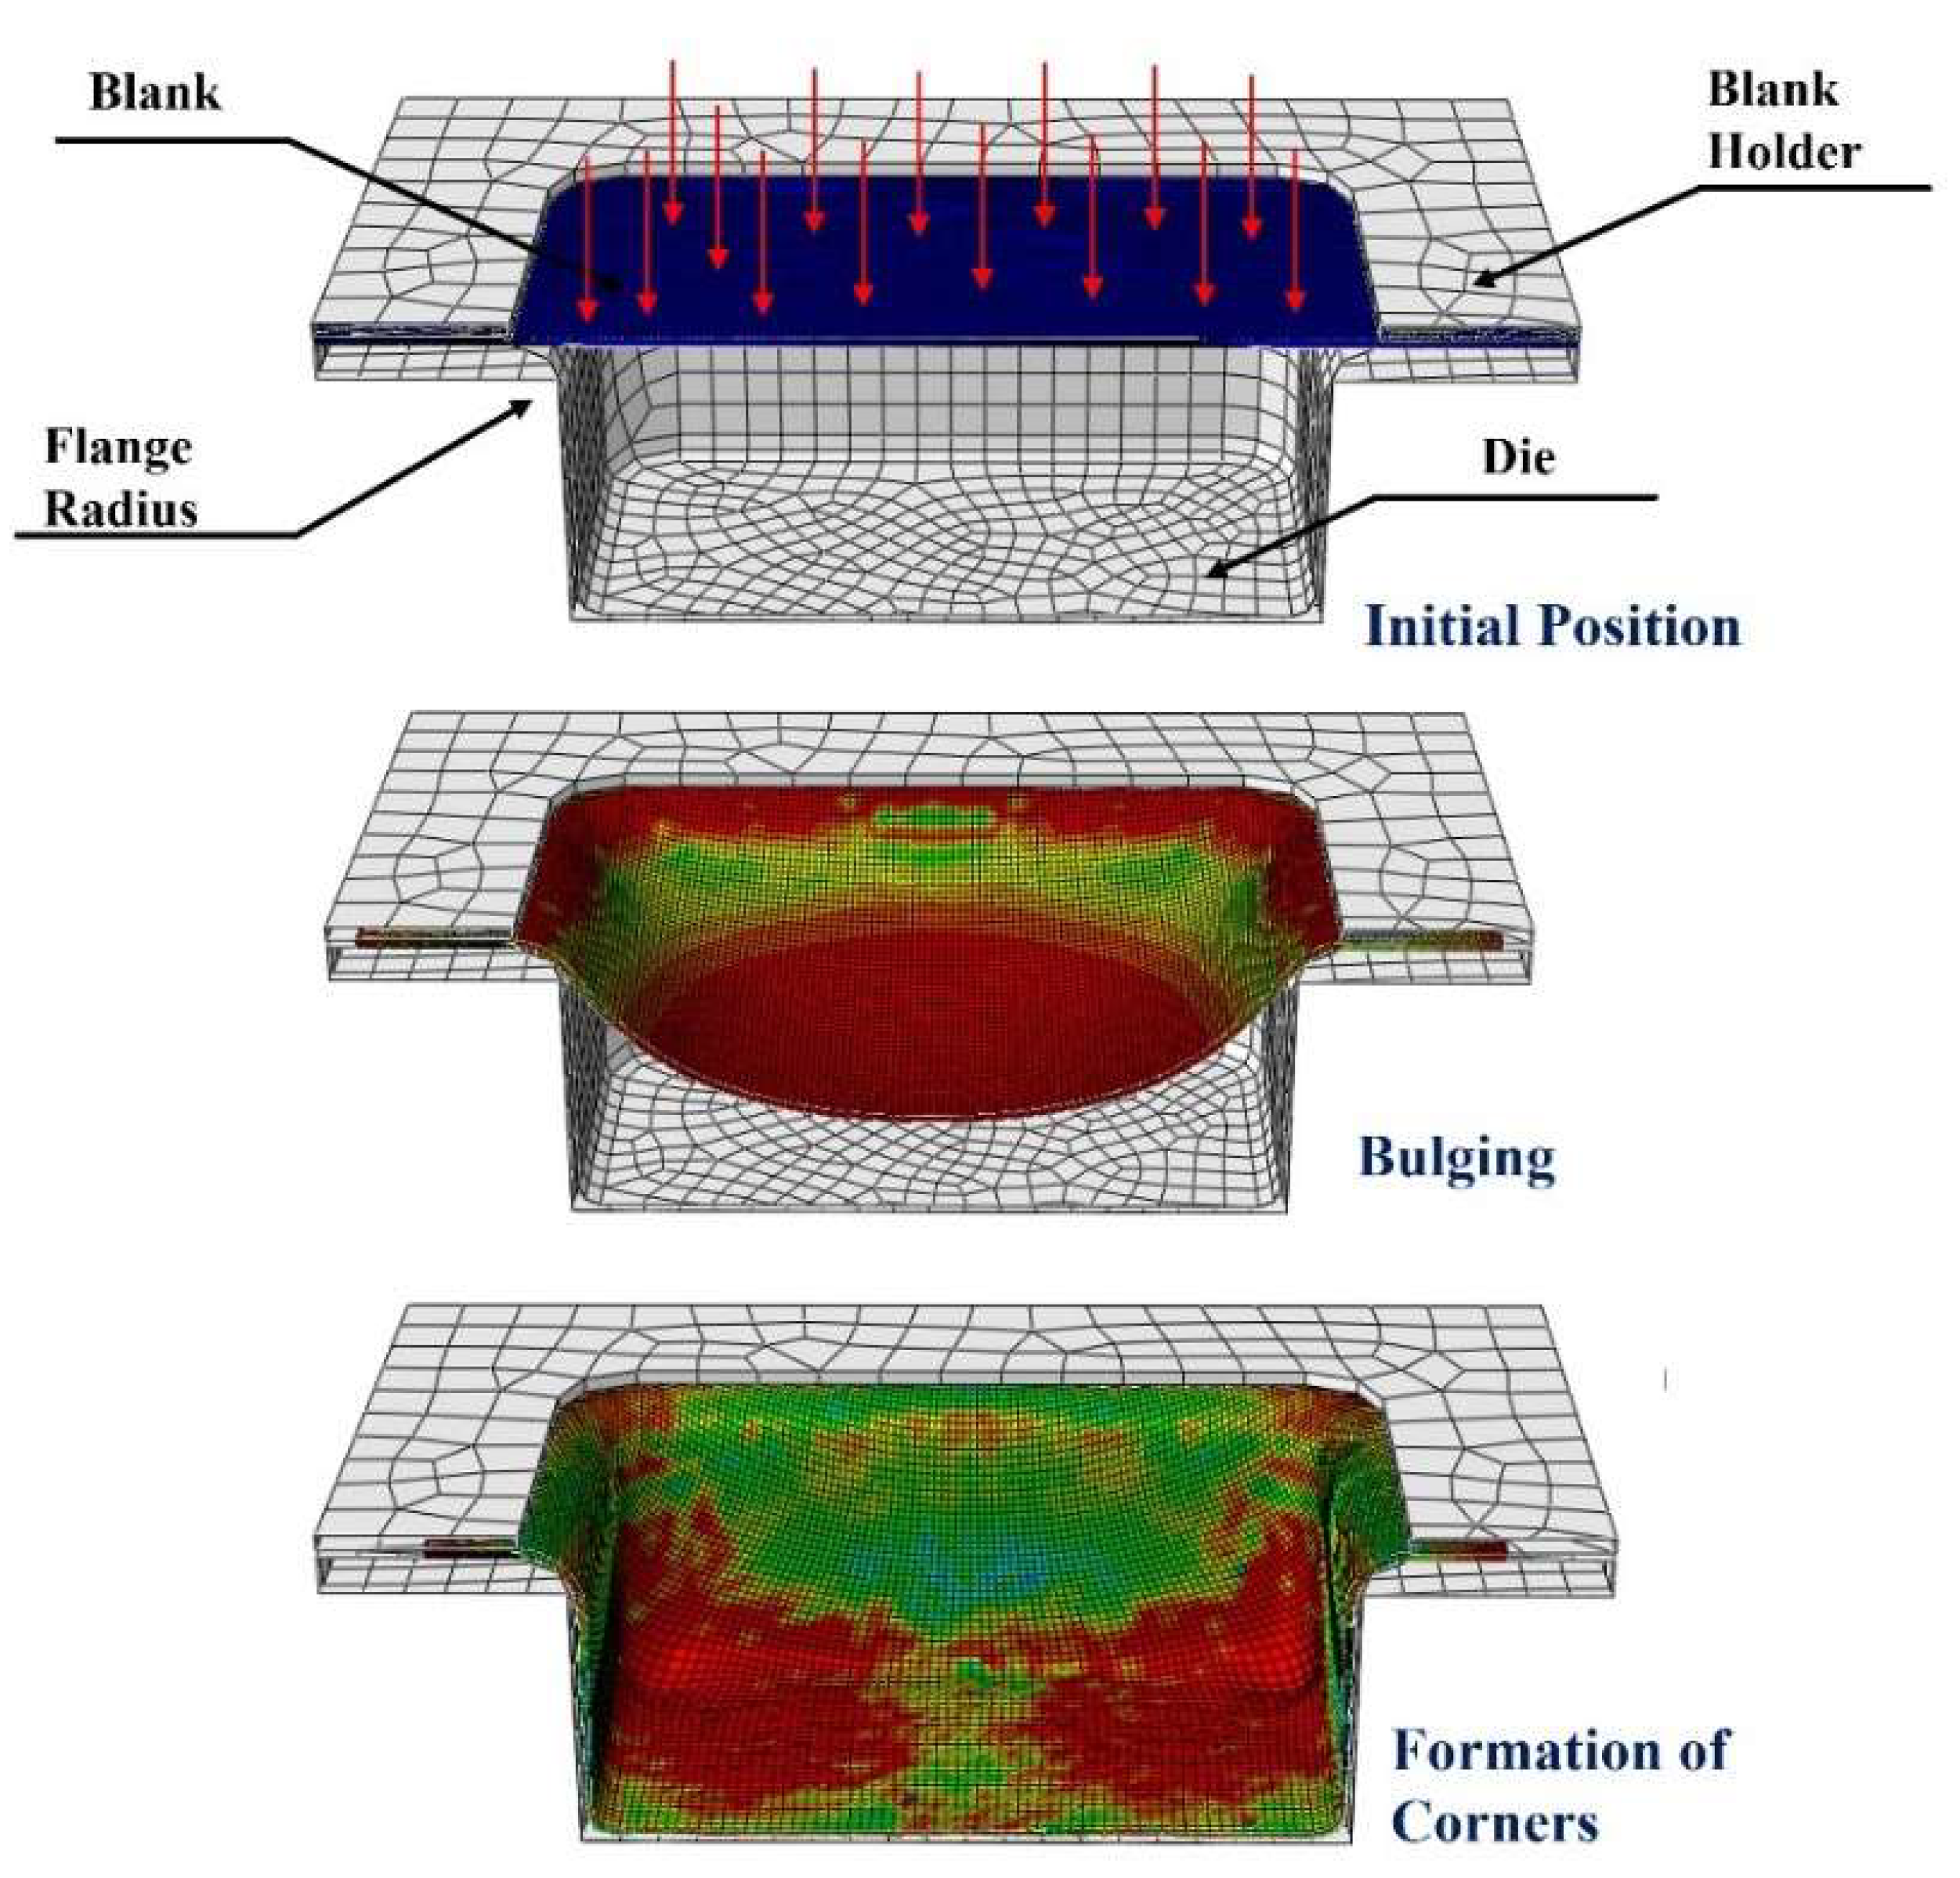
Figure 2.
Blank Geometry and Dimensions.
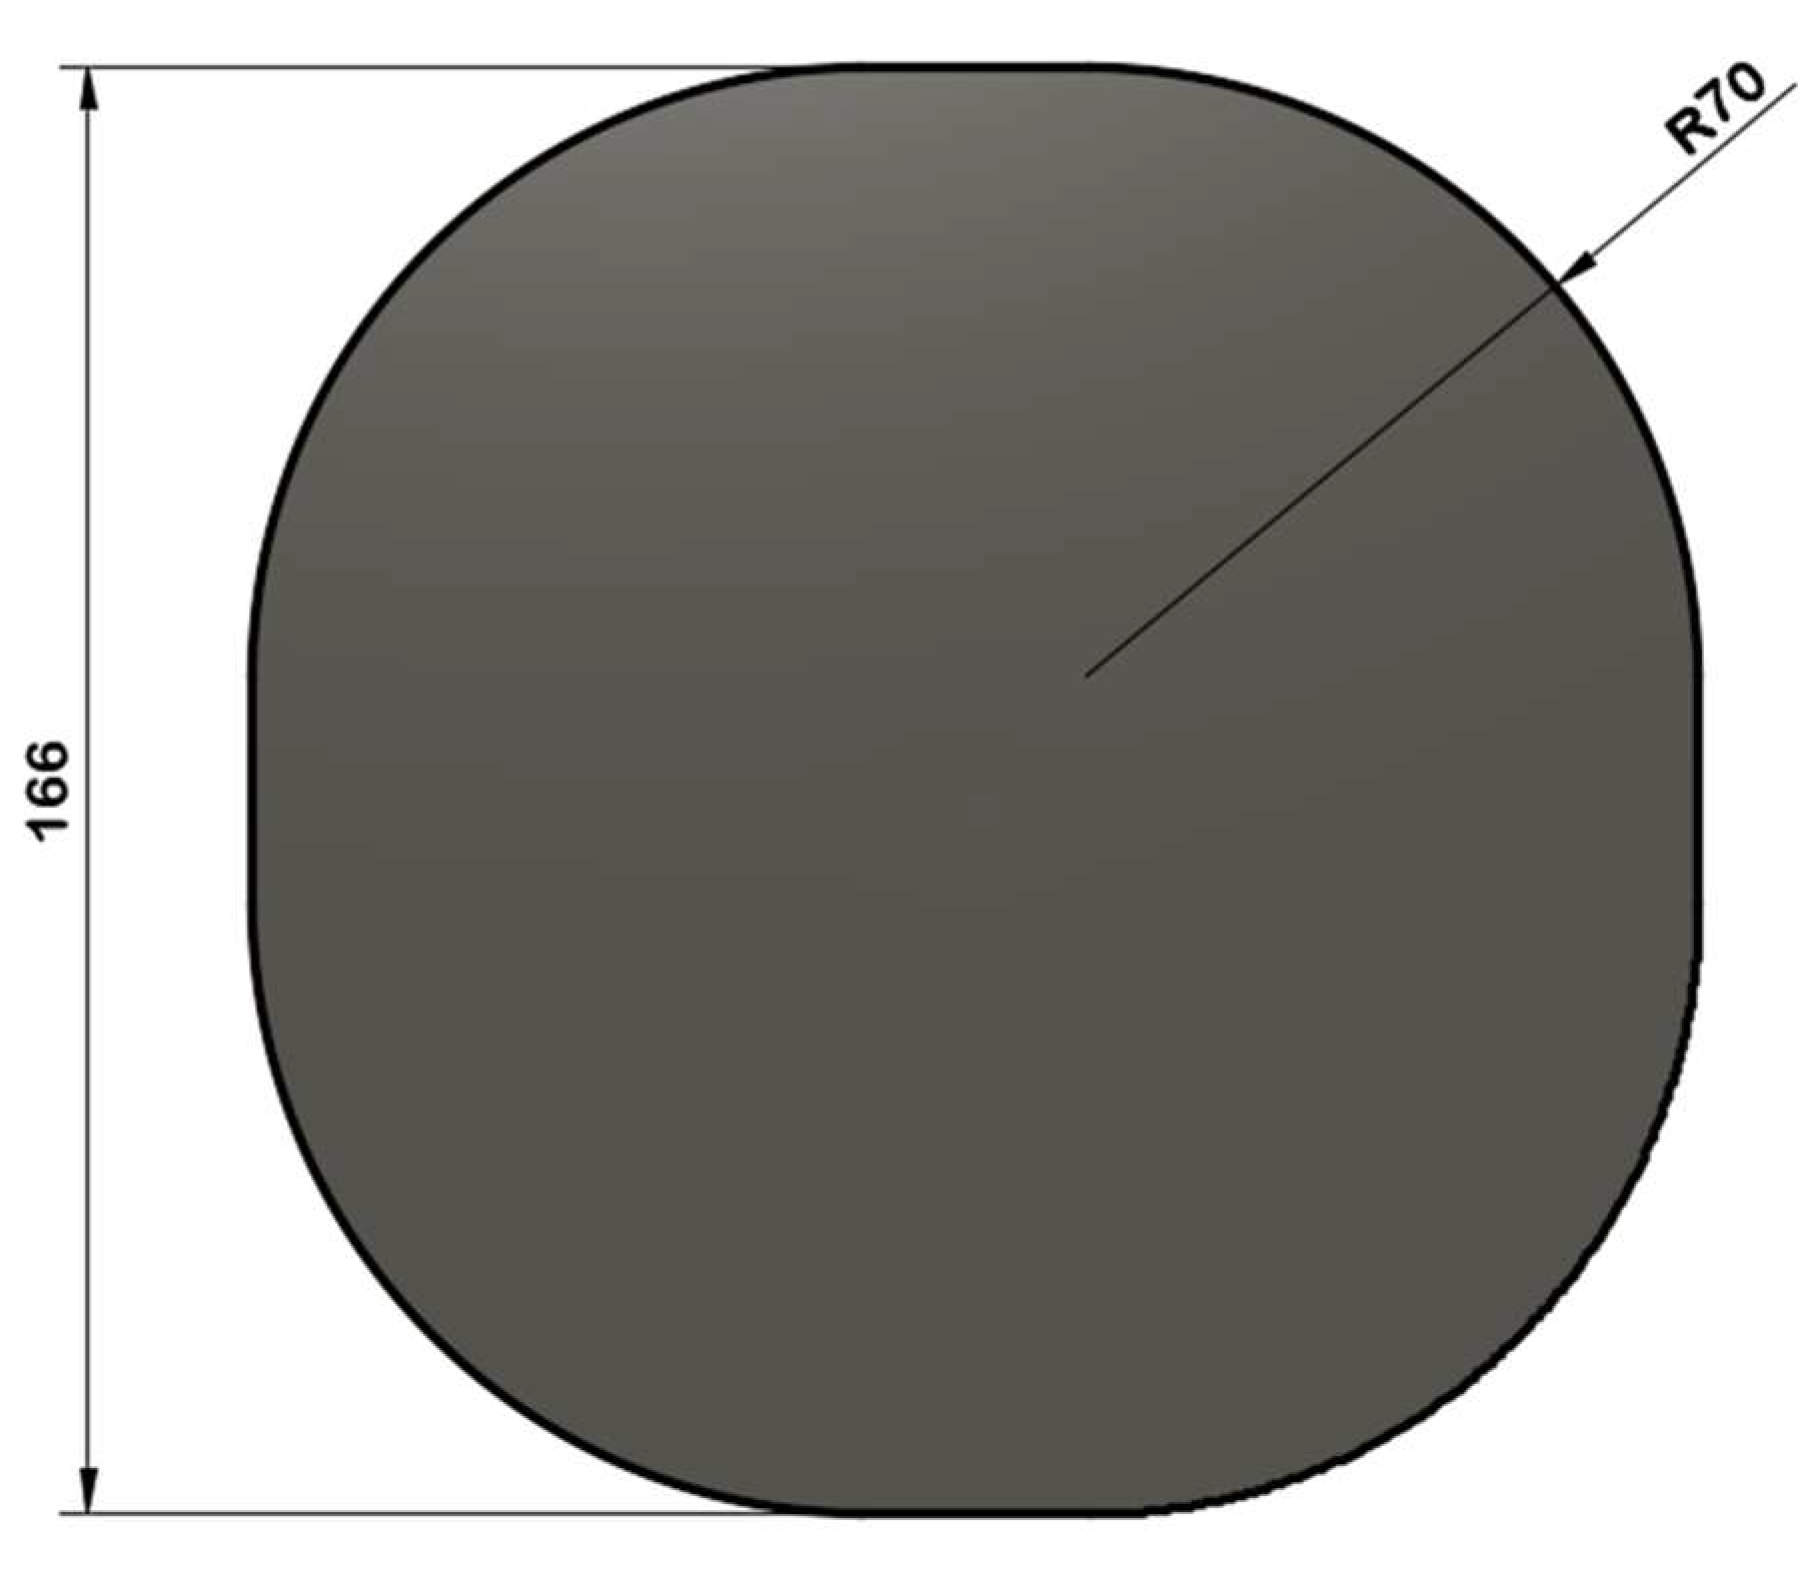
Figure 3.
Mesh convergence study.
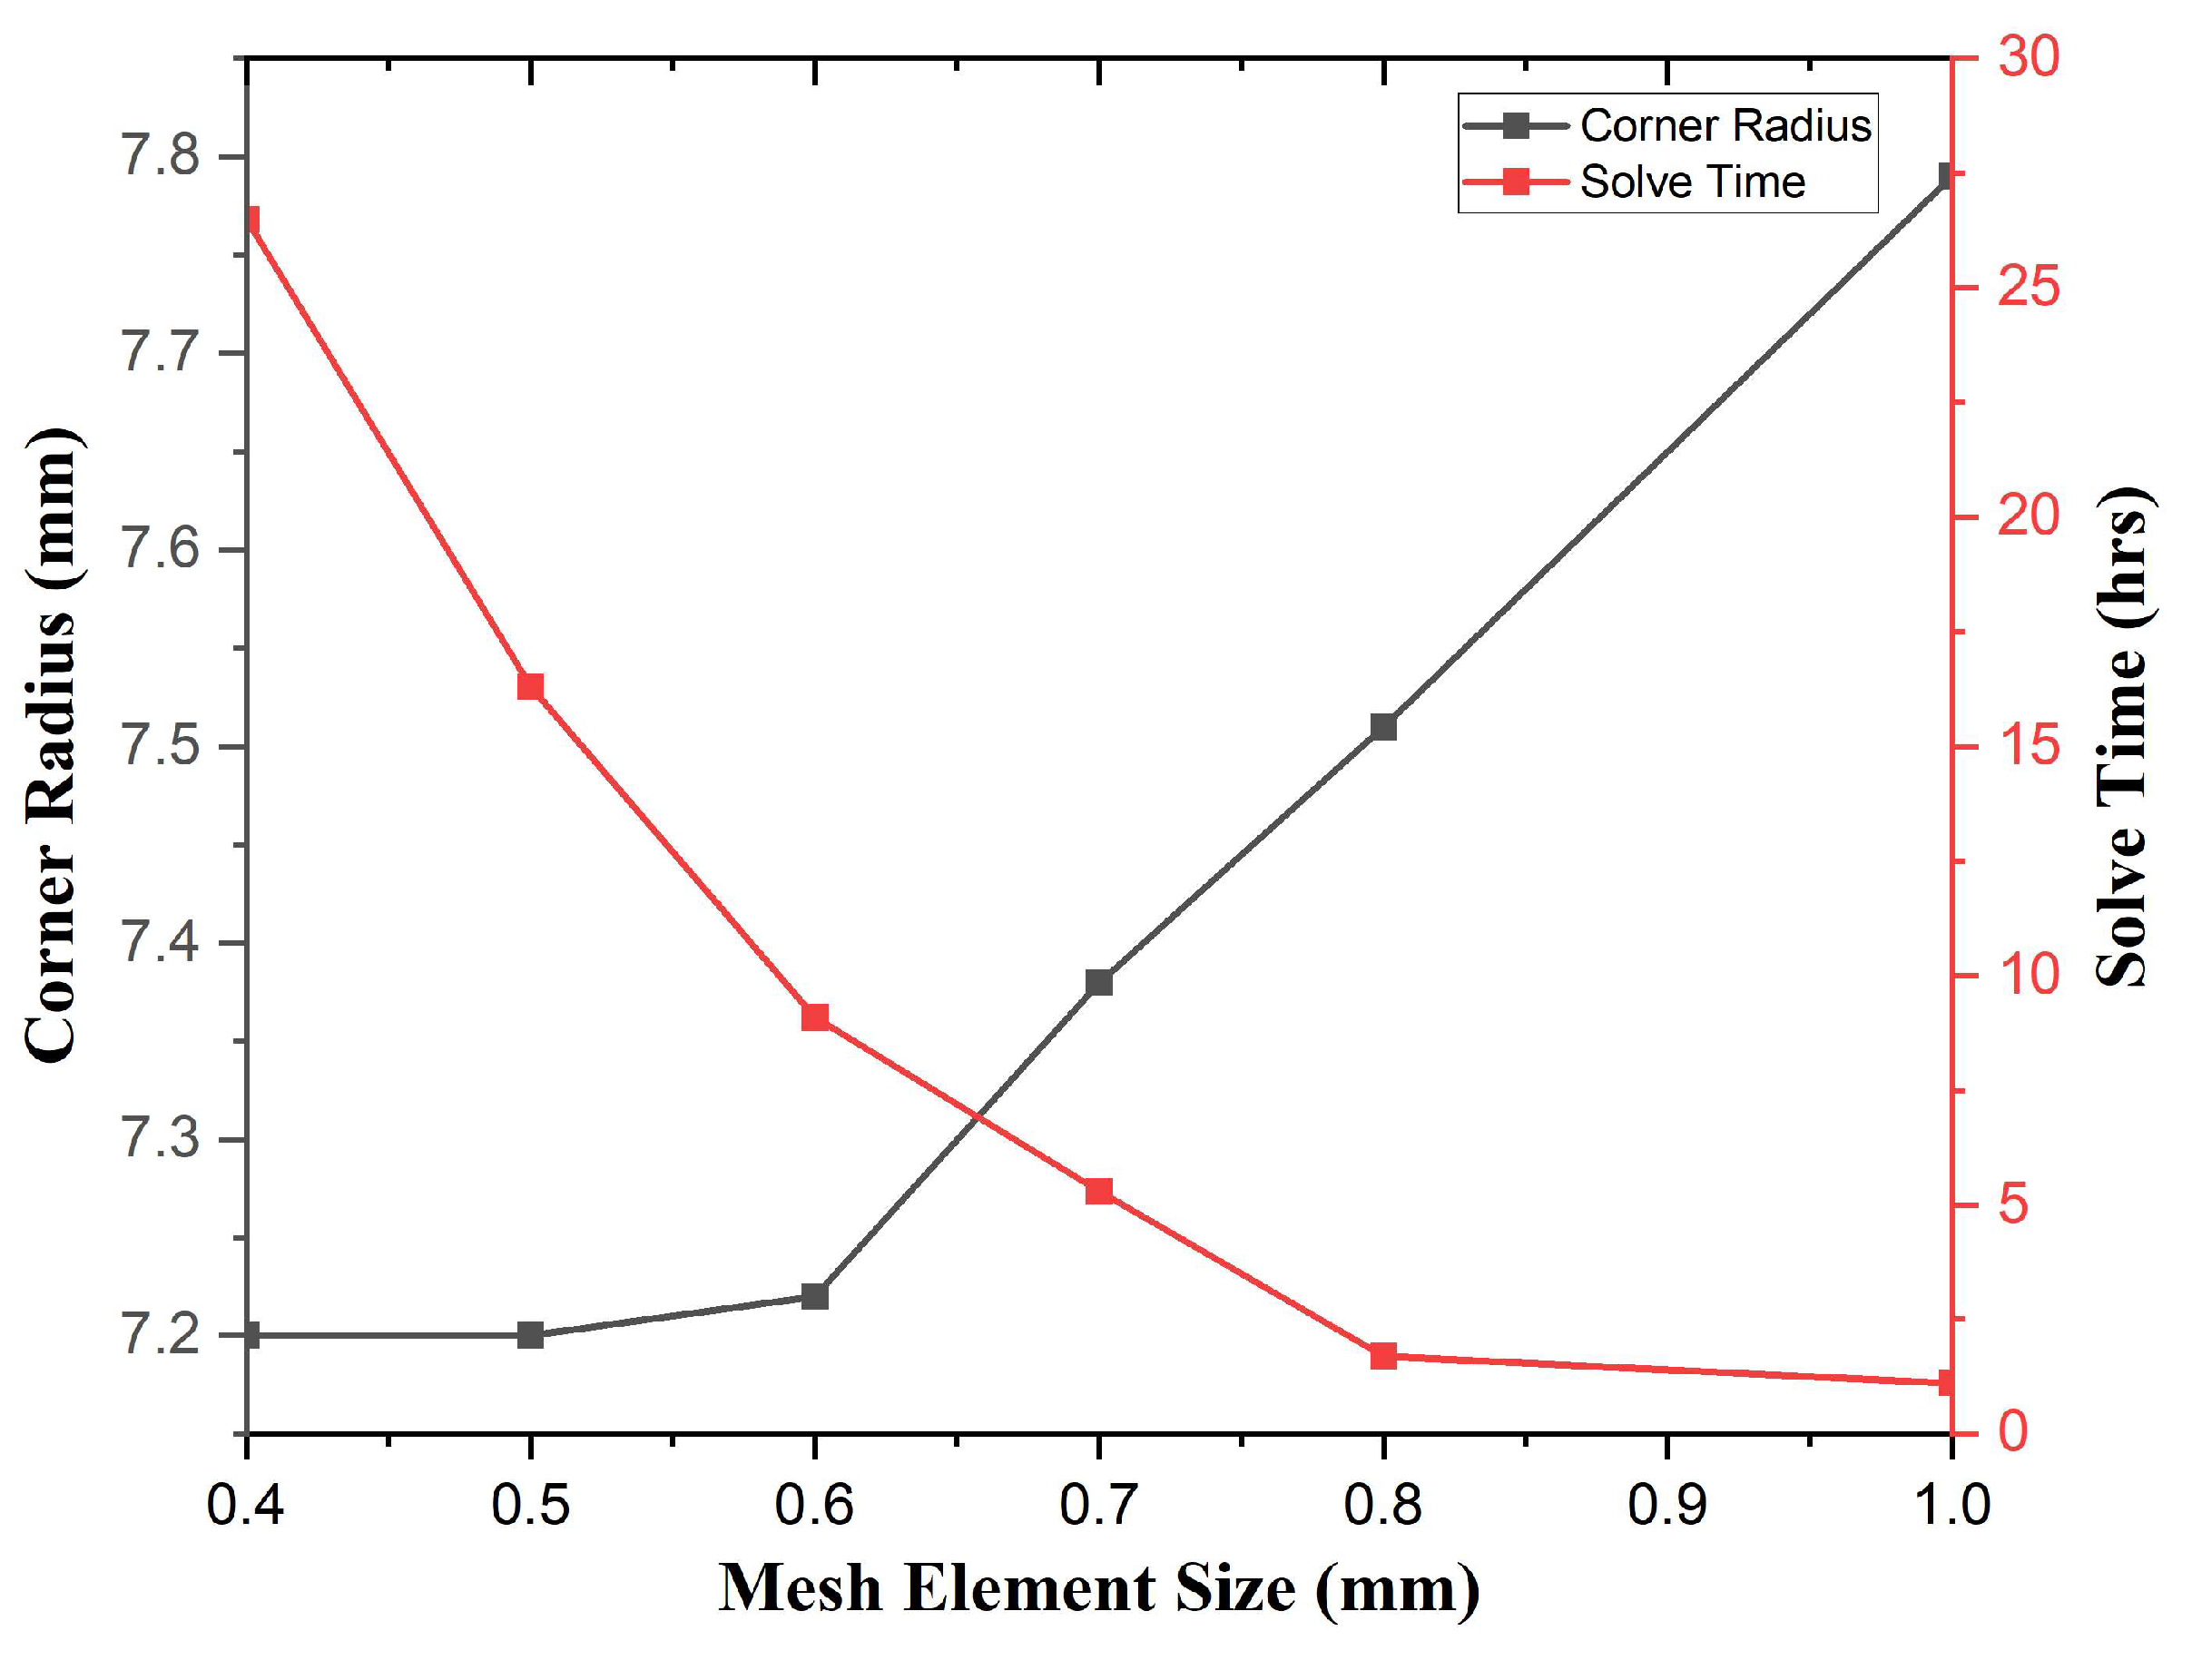
Figure 4.
FP path and BHF vs. time.

Figure 5.
Loading and unloading FP path and BHF vs. time.
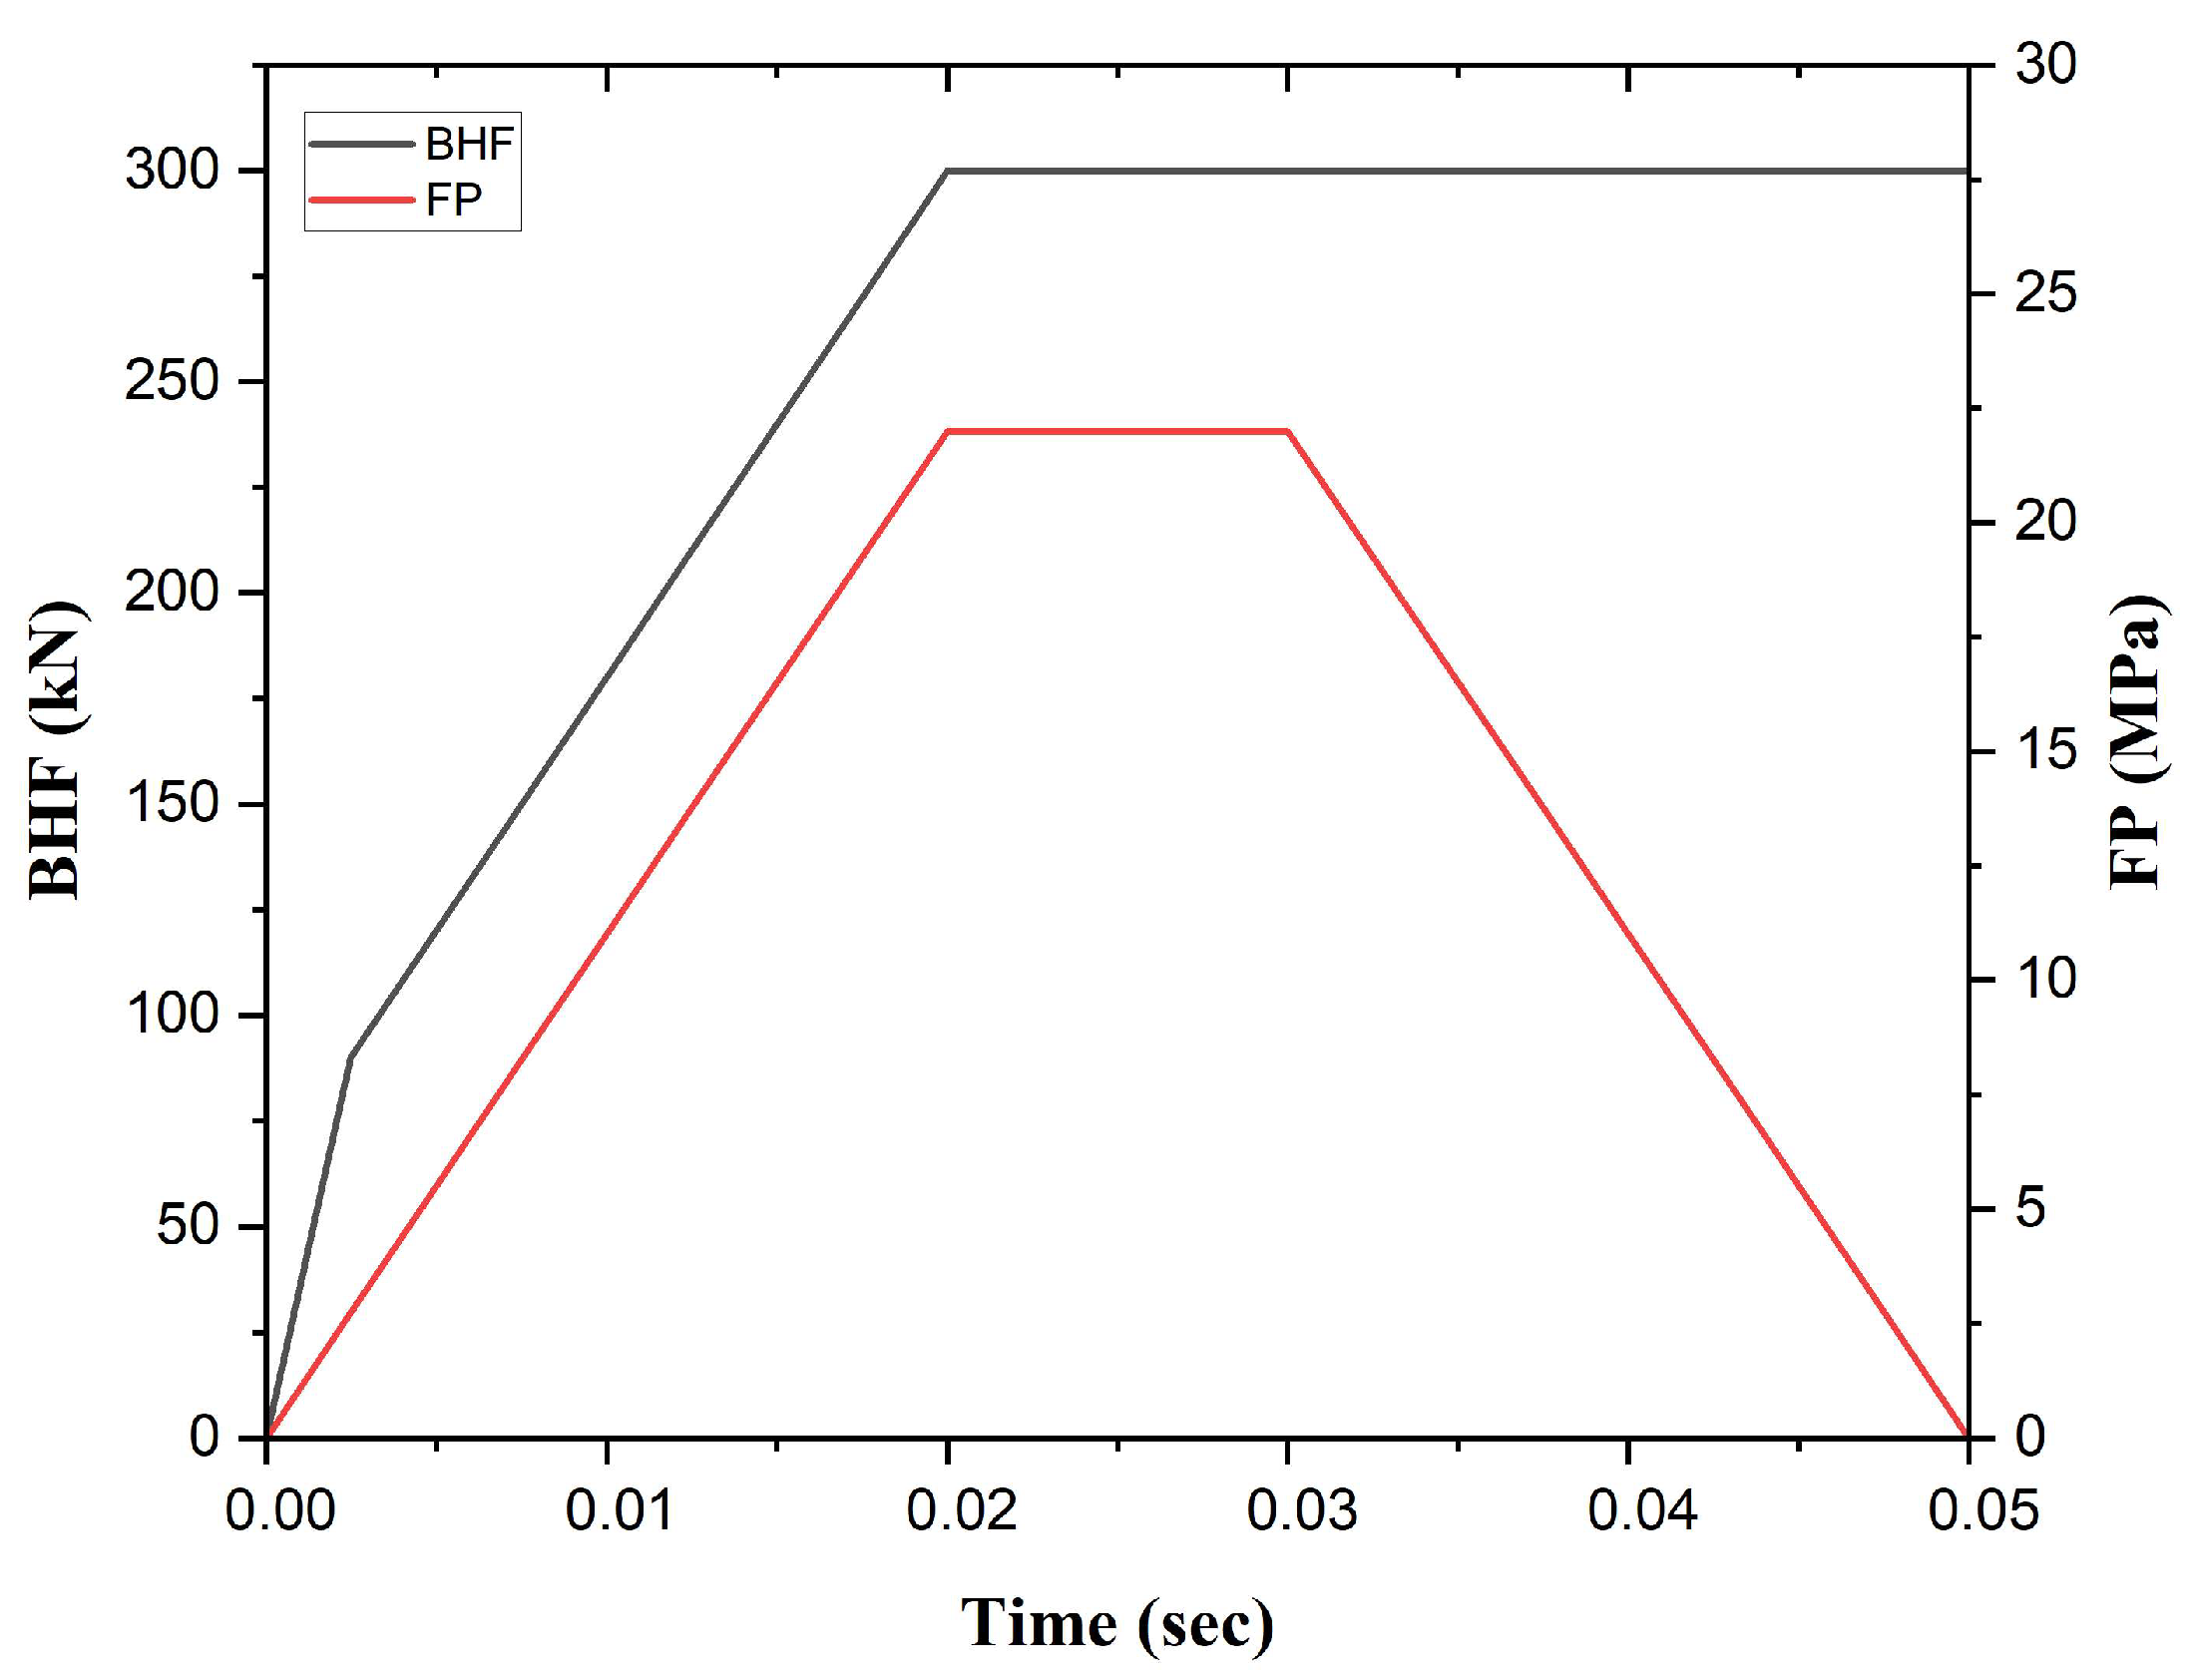
Figure 6.
Optimization Process Flow Chart.
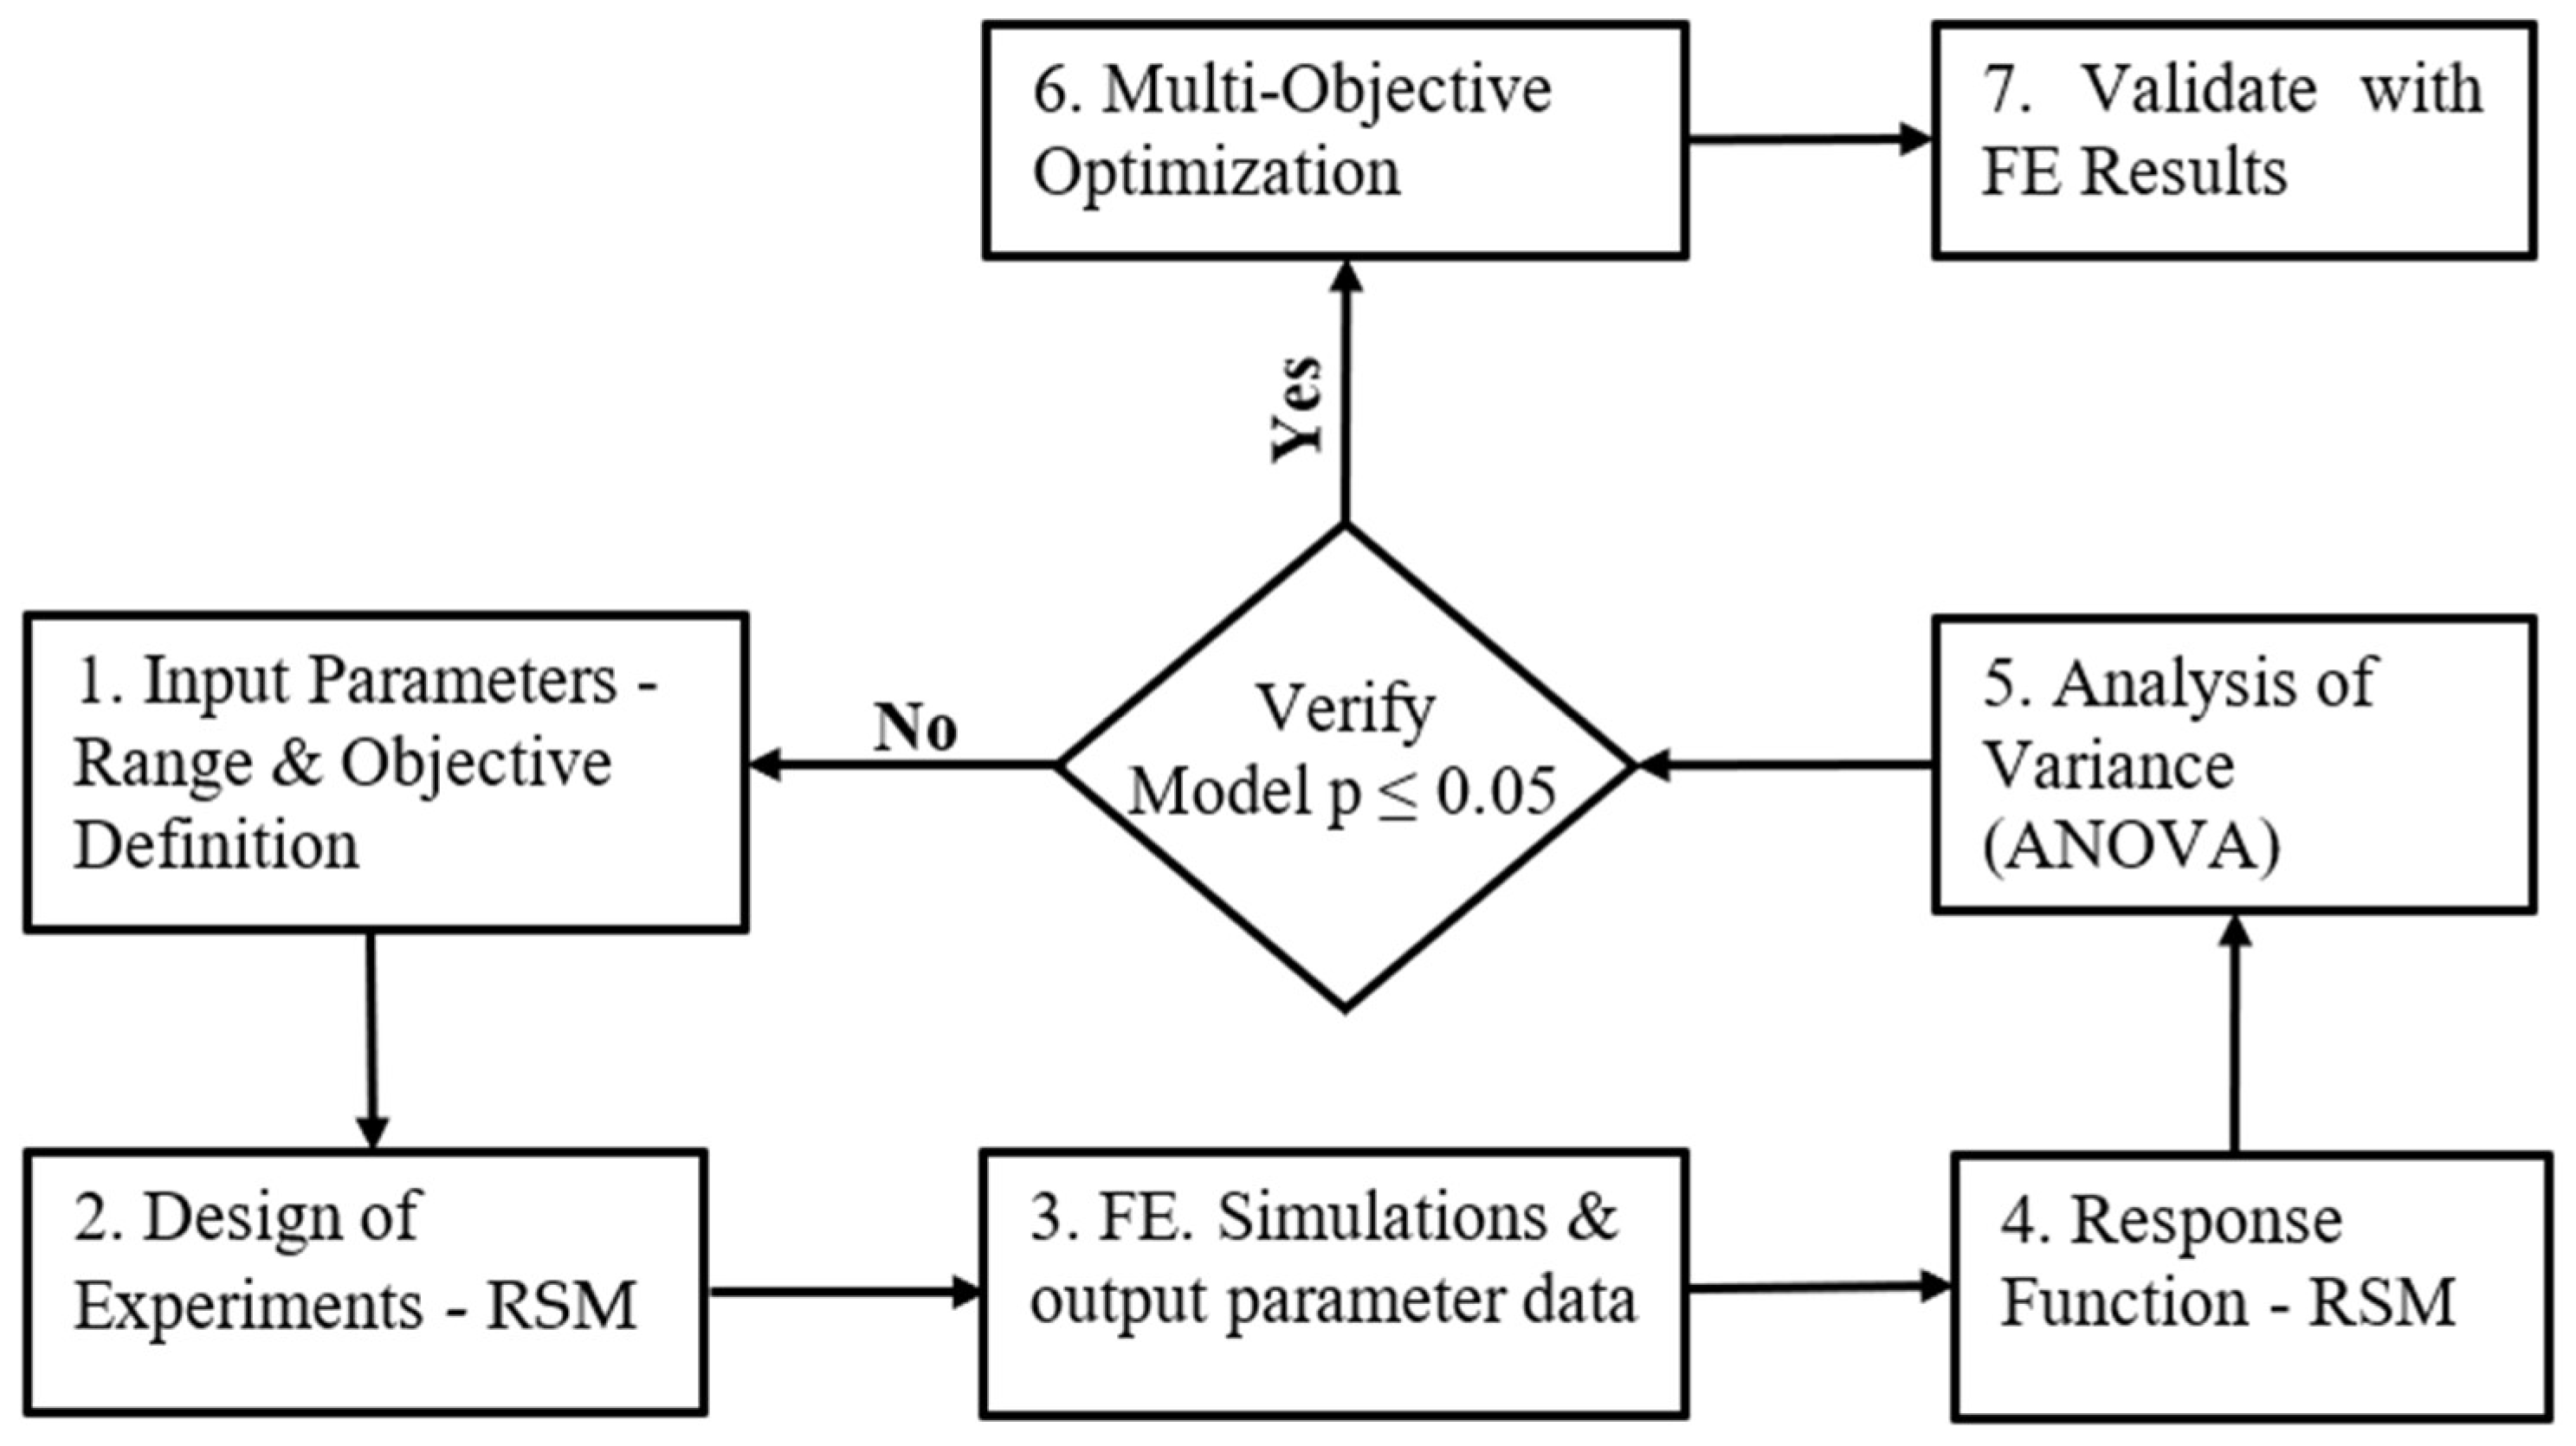
Figure 7.
Fully formed cup depicting X-X and X-Y direction.
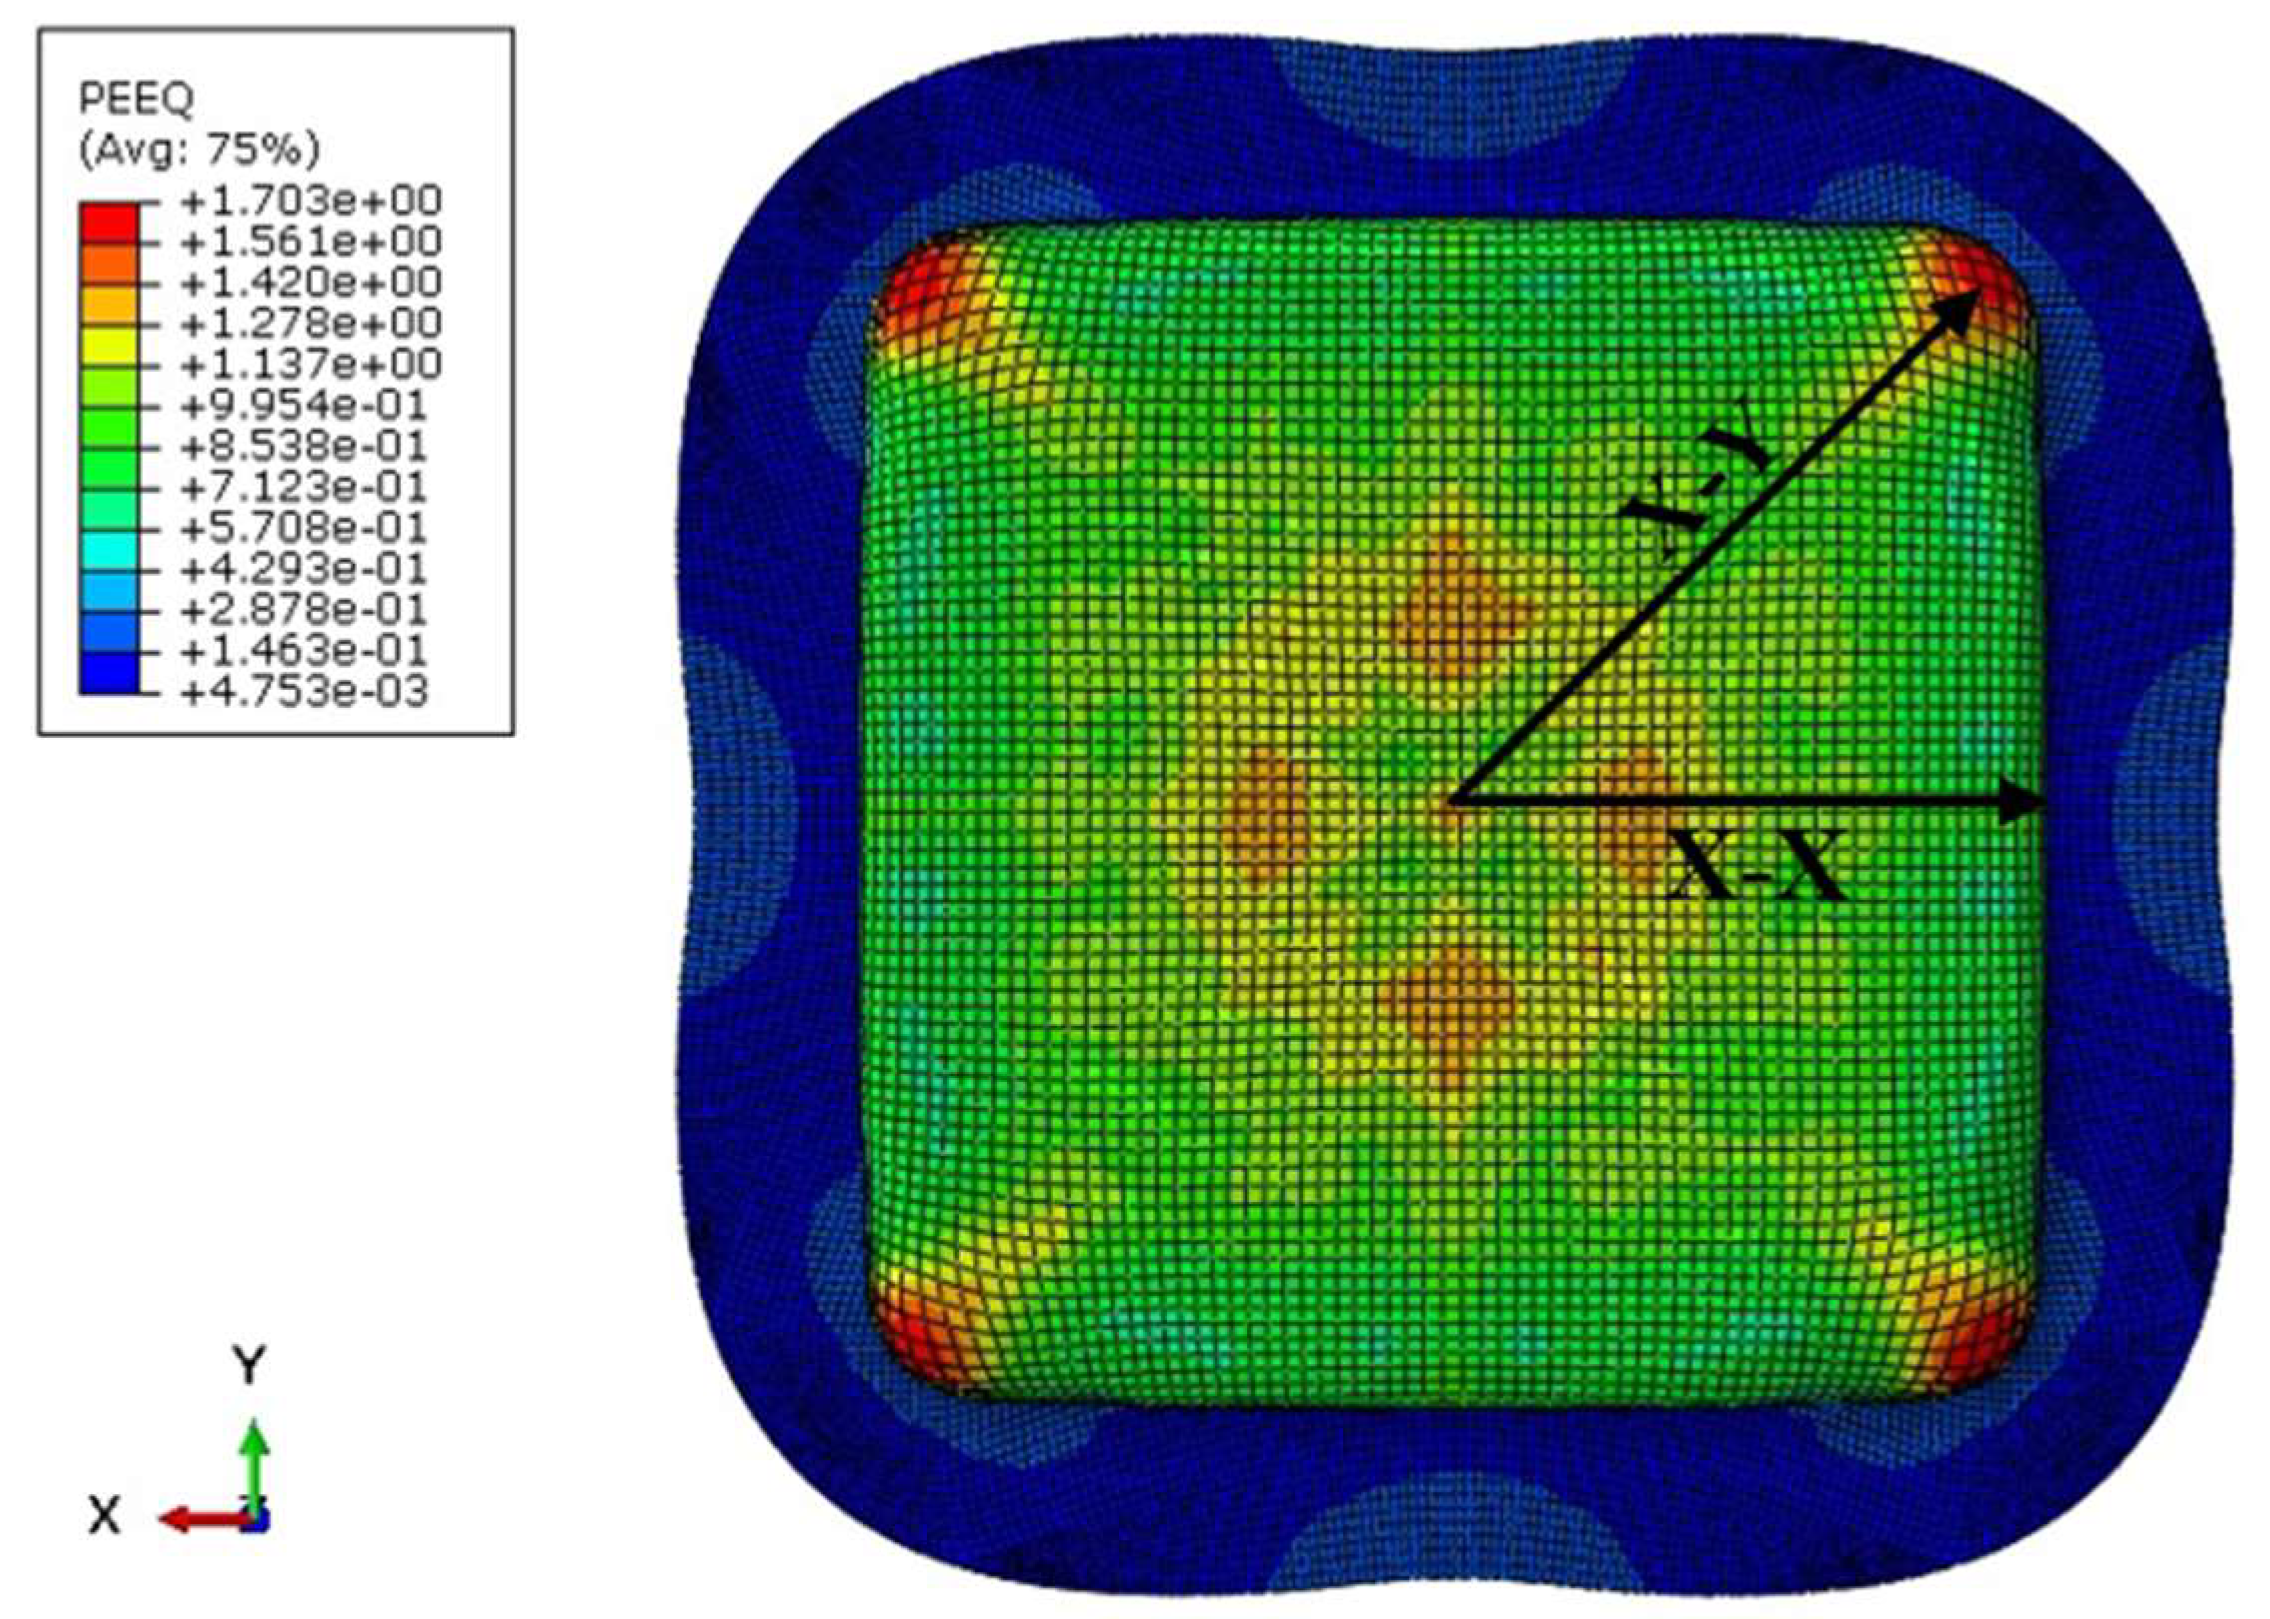
Figure 8.
(a) Comparison of % thinning in X-X direction. (b) Comparison of % thinning in X-Y direction.
Figure 8.
(a) Comparison of % thinning in X-X direction. (b) Comparison of % thinning in X-Y direction.

Figure 9.
(a) Von Mises stress distribution in fully formed cup at 22 MPa peak FP. (b) Equivalent plastic strain in fully formed cup at 22 MPa peak FP. (c) Von Mises stress distribution in partially formed cup at 18 MPa peak FP.
Figure 9.
(a) Von Mises stress distribution in fully formed cup at 22 MPa peak FP. (b) Equivalent plastic strain in fully formed cup at 22 MPa peak FP. (c) Von Mises stress distribution in partially formed cup at 18 MPa peak FP.

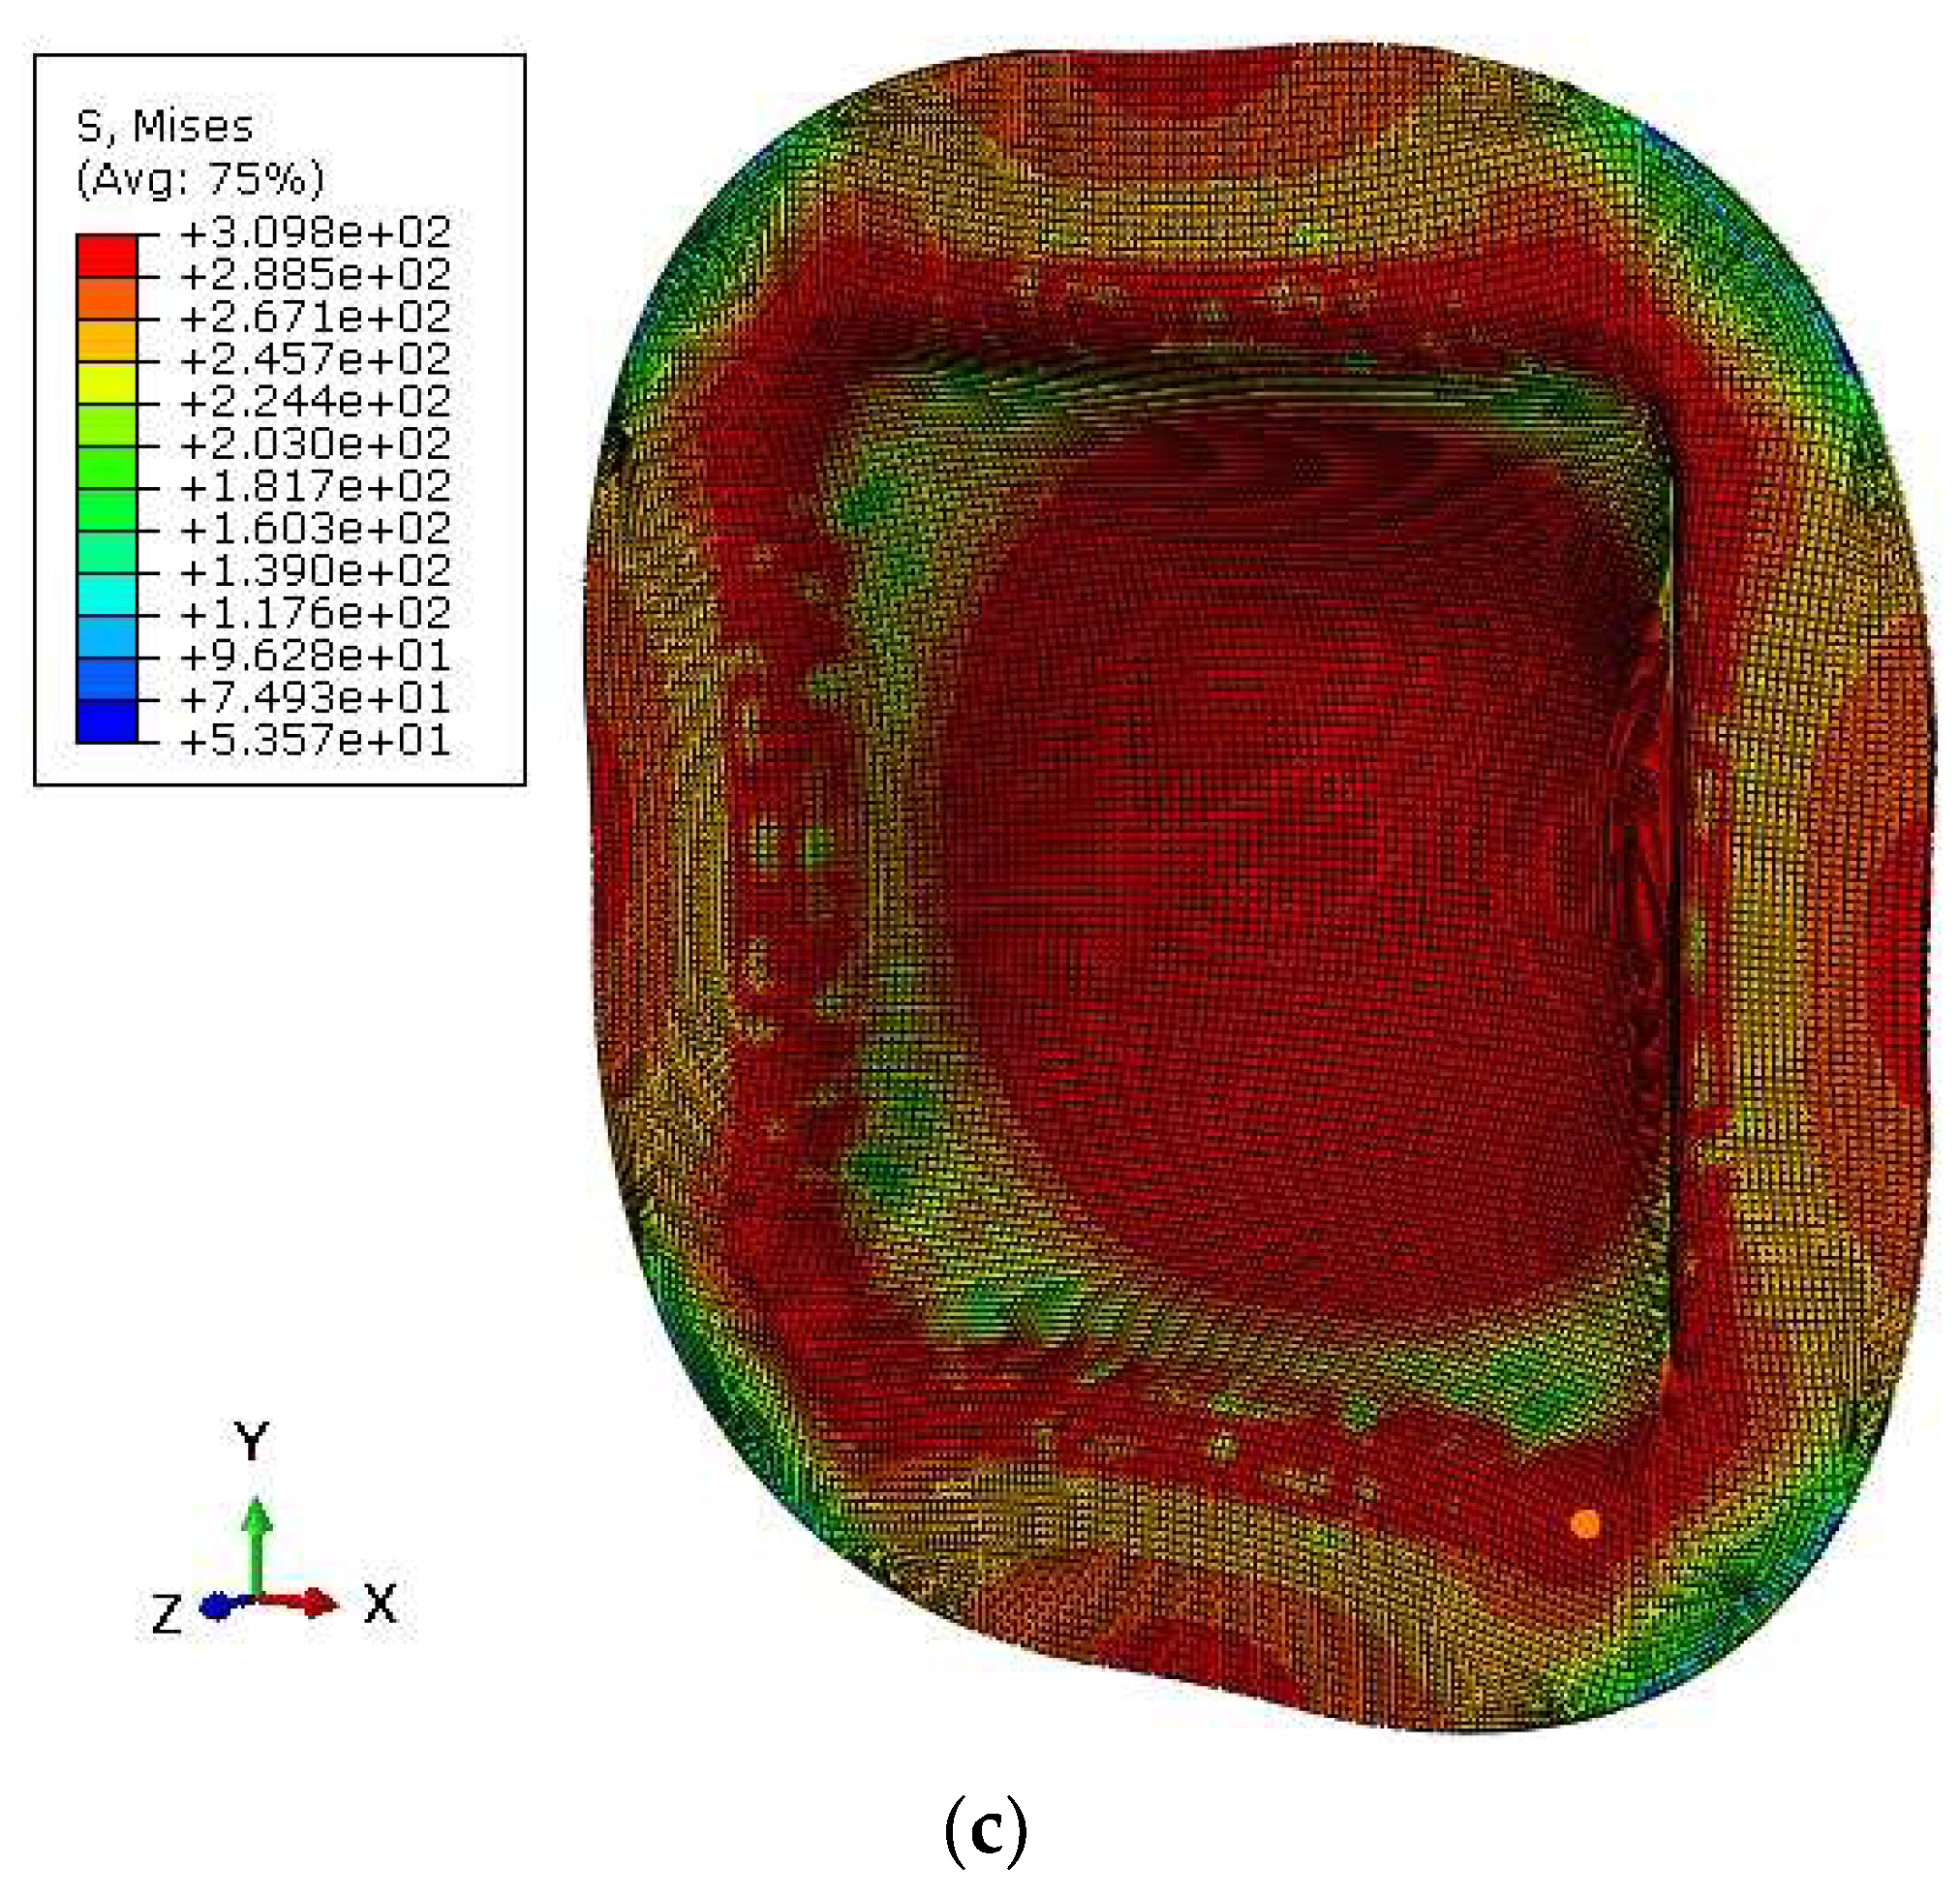
Figure 10.
(a) Main effect plot for a thinning percentage. (b) Main effect plot for corner radius.

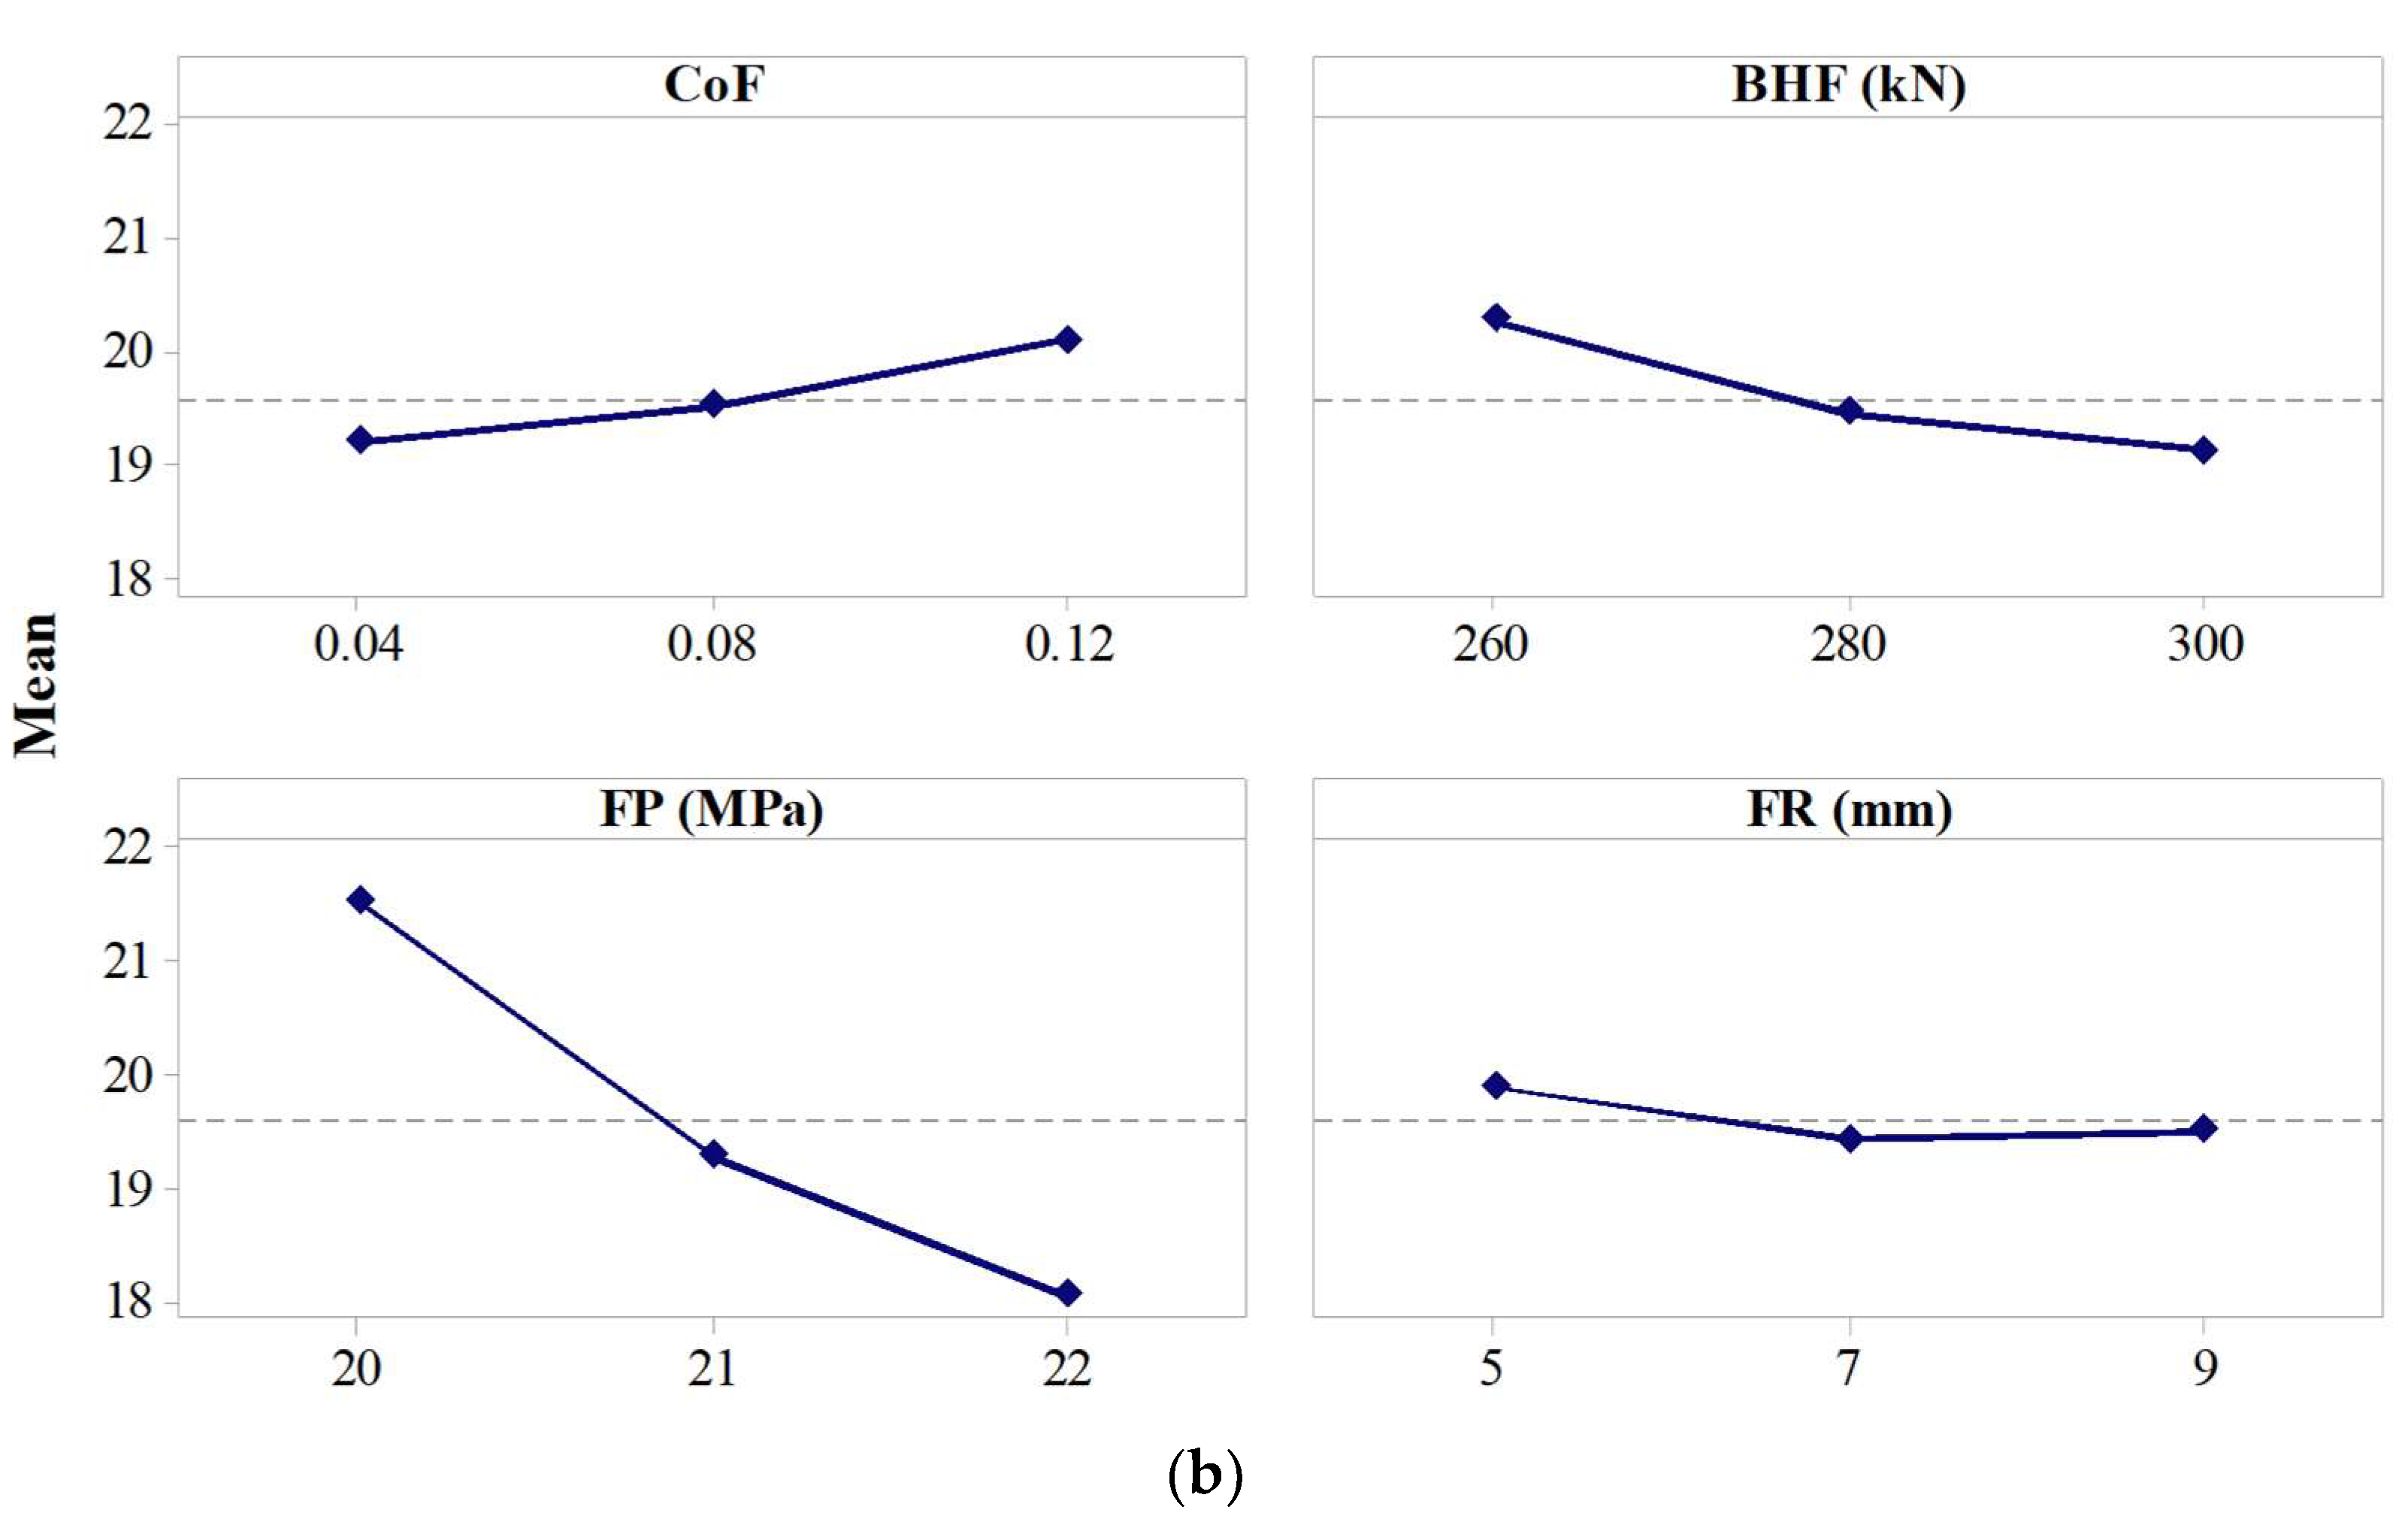
Figure 11.
Contour Plots—effect of two parameters on Thinning Percentage. (a) BHF × CoF, (b) FP × CoF, (c) FR × CoF, (d) FP × BHF, (e) FR × BHF, (f) FR × FP.
Figure 11.
Contour Plots—effect of two parameters on Thinning Percentage. (a) BHF × CoF, (b) FP × CoF, (c) FR × CoF, (d) FP × BHF, (e) FR × BHF, (f) FR × FP.
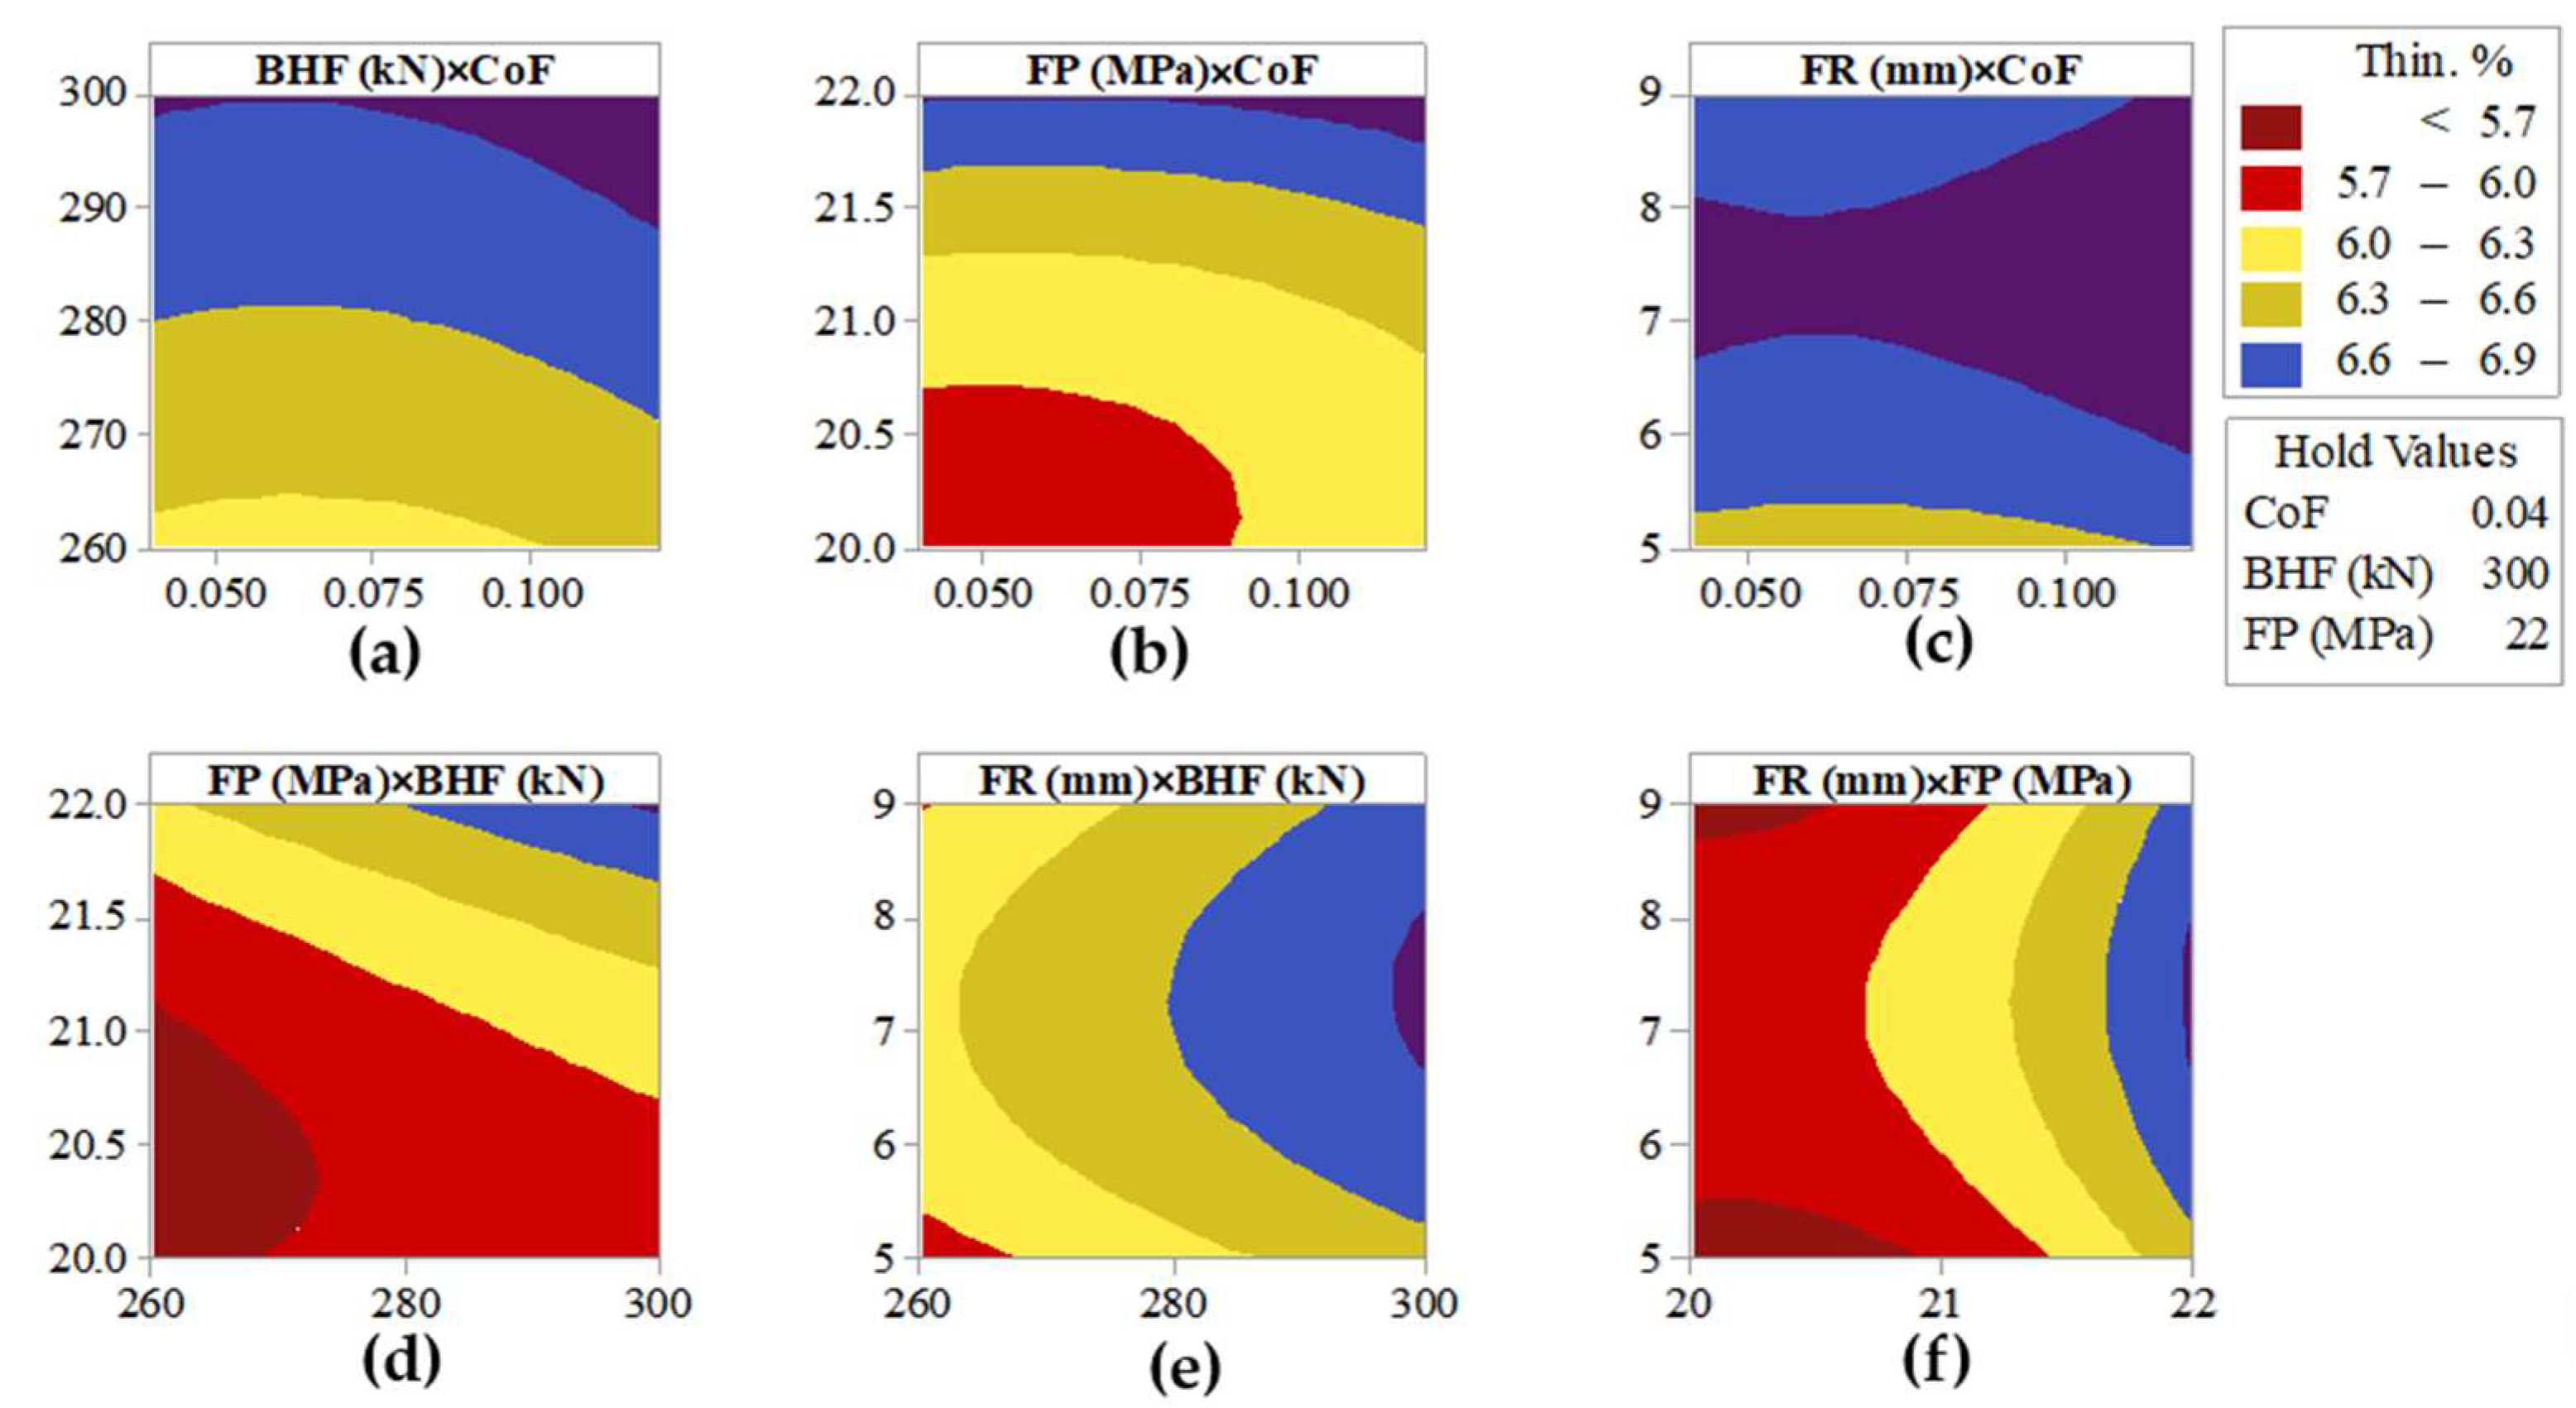
Figure 12.
Contour Plots—effect of two parameters on Corner Radius. (a) BHF × CoF, (b) FP × CoF, (c) FR × CoF, (d) FP × BHF, (e) FR × BHF, (f) FR × FP.
Figure 12.
Contour Plots—effect of two parameters on Corner Radius. (a) BHF × CoF, (b) FP × CoF, (c) FR × CoF, (d) FP × BHF, (e) FR × BHF, (f) FR × FP.


Table 1.
Chemical composition of AA5083 [25].
Table 1.
Chemical composition of AA5083 [25].
| Mg | Mn | Fe | Si | Cu | Cr | Zn | Al |
|---|---|---|---|---|---|---|---|
| 4.256 | 0.542 | 0.221 | 0.258 | 0.047 | 0.086 | 0.030 | Balance |
Table 2.
Mechanical properties of the material cryo-rolled AA5083 [6].
Table 2.
Mechanical properties of the material cryo-rolled AA5083 [6].
| YS (MPa) | UTS (MPa) | Elng. (%) | n | K (MPa) |
|---|---|---|---|---|
| 186.1 | 309.8 | 18.1 | 0.243 | 533 |
Table 3.
Range of Input Parameters.
| Input Parameters | CoF | FP (MPa) | BHF (kN) | FR (mm) |
|---|---|---|---|---|
| Low Level | 0.04 | 20 | 260 | 5 |
| High Level | 0.12 | 22 | 300 | 9 |
Table 4.
FE model validation—FE model results vs. experimental results.
| FE Model Results | Experimental Results [6] | % Difference | |
|---|---|---|---|
| Depth (mm) | 35 | 35 | 0 |
| Min. Corner radius (mm) | 16.7 | 16 | 4.37% |
| Thinning % | 7.24 | 7 | 3.32% |
Table 5.
Input parameter combinations for which simulations were carried out and the corresponding output.
Table 5.
Input parameter combinations for which simulations were carried out and the corresponding output.
| Input Parameters | Output Parameters | |||||
|---|---|---|---|---|---|---|
| Sl. No. | CoF | BHF (kN) | FP (MPa) | FR (mm) | Thin. % | Cor. Rad. (mm) |
| 01 | 0.04 | 260 | 20 | 5 | 5.5 | 22.3 |
| 02 | 0.08 | 280 | 21 | 5 | 5.5 | 19.8 |
| 03 | 0.12 | 300 | 22 | 5 | 6.4 | 17.9 |
| 04 | 0.12 | 260 | 20 | 5 | 5.5 | 22.3 |
| 05 | 0.12 | 300 | 20 | 5 | 5.9 | 21.3 |
| 06 | 0.12 | 260 | 22 | 5 | 6.1 | 19.3 |
| 07 | 0.04 | 260 | 22 | 5 | 5.7 | 18.2 |
| 08 | 0.04 | 300 | 20 | 5 | 5.6 | 20.8 |
| 09 | 0.04 | 300 | 22 | 5 | 6.6 | 17.2 |
| 10 | 0.08 | 300 | 21 | 7 | 6.2 | 19.2 |
| 11 | 0.08 | 280 | 21 | 7 | 5.9 | 19.3 |
| 12 | 0.08 | 280 | 22 | 7 | 7.0 | 19.0 |
| 13 | 0.08 | 260 | 21 | 7 | 5.7 | 19.6 |
| 14 | 0.08 | 280 | 20 | 7 | 5.5 | 21.7 |
| 15 | 0.12 | 280 | 21 | 7 | 6.4 | 20.0 |
| 16 | 0.04 | 280 | 21 | 7 | 5.7 | 18.0 |
| 17 | 0.12 | 260 | 20 | 9 | 5.4 | 22.2 |
| 18 | 0.12 | 300 | 20 | 9 | 6.2 | 21.2 |
| 19 | 0.04 | 300 | 20 | 9 | 5.4 | 20.1 |
| 20 | 0.04 | 260 | 20 | 9 | 5.6 | 21.9 |
| 21 | 0.04 | 260 | 22 | 9 | 5.8 | 17.5 |
| 22 | 0.12 | 300 | 22 | 9 | 6.7 | 17.6 |
| 23 | 0.12 | 260 | 22 | 9 | 6.2 | 19.1 |
| 24 | 0.08 | 280 | 21 | 9 | 5.8 | 19.2 |
| 25 | 0.04 | 300 | 22 | 9 | 6.9 | 16.8 |
Disclaimer/Publisher’s Note: The statements, opinions and data contained in all publications are solely those of the individual author(s) and contributor(s) and not of MDPI and/or the editor(s). MDPI and/or the editor(s) disclaim responsibility for any injury to people or property resulting from any ideas, methods, instructions or products referred to in the content. |
© 2024 by the authors. Licensee MDPI, Basel, Switzerland. This article is an open access article distributed under the terms and conditions of the Creative Commons Attribution (CC BY) license (https://creativecommons.org/licenses/by/4.0/).
Share and Cite
MDPI and ACS Style
Achuthankutty, A.; Ramesh, A.; Velamati, R.K. A 3D Non-Linear FE Model and Optimization of Cavity Die Sheet Hydroforming Process. Metals 2024, 14, 478. https://doi.org/10.3390/met14040478
AMA Style
Achuthankutty A, Ramesh A, Velamati RK. A 3D Non-Linear FE Model and Optimization of Cavity Die Sheet Hydroforming Process. Metals. 2024; 14(4):478. https://doi.org/10.3390/met14040478
Chicago/Turabian StyleAchuthankutty, Arun, Ajith Ramesh, and Ratna Kishore Velamati. 2024. "A 3D Non-Linear FE Model and Optimization of Cavity Die Sheet Hydroforming Process" Metals 14, no. 4: 478. https://doi.org/10.3390/met14040478
Note that from the first issue of 2016, this journal uses article numbers instead of page numbers. See further details here.