
A Novel Design of a Molten Salt Bath Structure and Its Quenching Effect on Wire Transformation from Austenite to Sorbite

1
State Key Laboratory of Advanced Special Steel, Shanghai University, Shanghai 200072, China
2
School of Materials Science and Engineering, Shanghai University, Shanghai 200072, China
*
Author to whom correspondence should be addressed.
Metals 2024, 14(4), 483; https://doi.org/10.3390/met14040483
Submission received: 10 March 2024
/
Revised: 18 April 2024
/
Accepted: 18 April 2024
/
Published: 20 April 2024
(This article belongs to the Special Issue Advanced Rolling, Heat Treatment and Electromagnetic Processing Technology of High Performance Metals (Second Edition))
Abstract
:The technology for obtaining sorbite by isothermal quenching of high-temperature molten salt has been used by more and more factories to produce wires with high tensile strength. In this paper, the controlling cap and bottom pipeline of the original salt bath are redesigned. The mathematical model previously proposed is used to simulate the redesigned salt bath model, and the flow field is analyzed in detail. The redesigned and original controlling cap are compared in detail by applying third-generation vortex identification technology. Then, by using the inverse heat transfer method, the heat transfer coefficient (HTC) during the boiling heat transfer stage of the wire rod in molten salt is calculated by taking advantage of quenching experimental data, on the basis of which the original model is corrected. Finally, a new salt bath design is proposed, which divides the salt bath into two parts. The first salt bath at 515 °C is used to cool the austenitized wire and complete the initial phase transformation. The second salt bath at 560 °C is used to prevent the transformation from retained austenite to bainite, and to induce its transformation from retained austenite to sorbite.
1. Introduction
With the continuous improvement in wire rod users’ requirements for product performance, molten salt heat treatment has started to be used as a new type of quenching technology [1]. Lead bath cooling was a commonly used sorbitization treatment method in the early days. However, lead baths are toxic and affect the health of workers. They also have the disadvantages of high cost and serious pollution. Therefore, at present, most sorbitization treatments in steel plants use molten salts. Molten salt has excellent thermal stability and chemical stability. As a non-flammable substance, salt baths eliminate fire hazards during heat treatment [2]. Molten salt has good thermal conductivity, which can cool wire to the phase transformation temperature in a short time after entering the salt bath [3]. It can also quickly conduct away phase transformation latent heat, and is environmentally friendly [4]. Compared with molten lead, the molten salt heat-treating process meets the production requirements of various steel wires, and has the advantages of saving time, conserving energy, and reducing lead dust and lead smoke pollution, which affect human health and the environment [5]. As long as the appropriate quenching medium and quenching process are selected, steel wire products that meet the requirements of the production process can be produced on the basis of reducing waste gas pollutants [6].
Austenite can form multiple products after cooling, as detailed in Table 1. Pearlite is a mixture of ferrite and cementite, formed by the transformation of supercooled austenite at temperatures from A1 to 550 °C. Depending on the different interlamellar spacings, pearlite can be classified into pearlite, sorbite, and troosite.
- Pearlite is formed by supercooled austenite at A1–650 °C, and it has relatively coarse lamellae. Parallel wide-strip ferrite and fine-strip cementite can be distinguished by magnifying more than 400 times under a metallurgical microscope, and the interlamellar spacing is larger than 200 nm;
- Sorbite is formed by supercooled austenite at 650–600 °C. Using a metallurgical microscope to magnify 500 times, you can only see a black line on the cementite. Only a 1000 times magnification can distinguish the lamellae, and the interlamellar spacing is about 80~200 nm;
- Troosite is formed by supercooled austenite at 600–550 °C. Using a metallurgical microscope to magnify 500 times, only a black pellet structure can be seen. The lamellae can only be distinguished by magnifying 10,000 times with an electron microscope, and the interlamellar spacing is less than 80 nm.
Sorbite is transformed by supercooled austenite between 600 and 650 °C [7,8]. It is a kind of structure with the best comprehensive mechanical performance (excellent tensile strength and impact toughness) in iron and steel structures. Sorbite has fine interlamellar spacing, closely related to the eutectoid transformation temperature. The refinement of interlamellar spacing enhances tensile strength and plastic deformation ability, making it well suited for steel cables for bridge construction [9]. During the cooling process of transformation, it is crucial to rapidly cool the supercooled austenite to prevent the formation of coarse pearlite. In the meantime, it is important to minimize the reheating temperature during the phase transformation process to achieve sorbite with consistent interlamellar spacing. Furthermore, salt bath heat treatment can also reduce steel deformation, residual stress, and cracking.
Bainite is formed by supercooled austenite at Ms–550 °C, which can be divided into two types: upper bainite and lower bainite, according to the range of formation temperatures. In the range of 550 to 350 °C, the upper bainite structure is obtained, which is feather-shaped. The hardness of bainite is 40–50 HRC, its strength is low, and its plasticity and toughness are poor. In the range of 350 °C to Ms, the lower bainite structure is obtained, which is acicular, and its mechanical properties are better than that of upper bainite. The wire studied in this article is used for bridge cables, so it is necessary to obtain sorbite as much as possible. Salt bath heat treatment is suggested to increase the strength and toughness of the wires.
At present, the research on salt heat treatment mainly uses experimental methods to statically measure various mechanical properties and the microstructure of wire rod, or uses inverse heat transfer technology to simulate the heat-treating process [10]. There are few studies on simulating the whole dynamical process of wires in a salt bath. In order to predict the latent heat of phase transformation, the Johnson–Mehl–Avrami–Kolmorgorov (JMAK) equation has been used to track the process of phase transformation since the 1930s [11,12], which is shown in Equation (1), where b and n can be fitted from the TTT (Time–Temperature-Transformation) curve. Some scholars have developed numerical models of phase transformation based on the additivity rule of the TTT curve [13]. Mark Lusk and Herng-JengJou [14] studied the scope of application of the additivity rule in detail from the mathematical aspect, and proved that not all reactions follow this rule. Only the rate-independent reaction, that is, when n in the JMAK equation is constant, is the additivity rule applicable. Prakash K.Agarwal et al. [15] developed a numerical model to predict the transformation from austenite to pearlite and compared it with actual industrial data. The model is used to predict the effects of diameter, initial temperature, HTC, and quenching temperature on the temperature field and austenite transformation rate. Tamura et al. [16,17] developed a model to predict the phase transformation of steel, and the JMAK equation is still used to characterize transformation from austenite to pearlite or bainite. They believe that the incubation period should also be included in the equation. However, a study by E.B.Hawbolt et al. [18] shows that only the phase transformation process follows the JMAK equation, and isothermal kinetic parameters should be calculated from the initial time of the phase transformation. In addition, they also compared predicted and experimental phase transformation curves. K.M.Pranesh Rao et al. [19,20,21] calculated the instantaneous heat flux of the quenching interface by using the temperature data obtained from the quenching experiments of samples with different salt temperatures and different molten salts. By comparing this with the oil quenching process, it is found that only nucleate boiling heat transfer and convective heat transfer occur in the salt bath heat-treating process.
At present, the demand for the performance of sorbite wire used in bridge cables is getting higher and higher. The core control point of ultra-high strength steel wire is to control the structure to obtain fine pearlite (sorbite). In the process of heat treatment for steel, the selection of the cooling process, and determination of the cooling medium and cooling process conditions are important. The purpose of this study is to determine the appropriate isothermal quenching process for the wires through experimental and simulation research methods, and put forward some improvement suggestions to improve the sorbite transformation rate to ensure that the quality of the wire meets the standard.
This article proposes a new salt bath design, which divides the salt bath into two parts. The first salt bath at 515 °C is used to cool the austenitized wire and complete the initial phase transformation. The second salt bath at 560 °C is used to prevent the transformation from retained austenite to bainite, and to induce its transformation from retained austenite to sorbite.
In the field of sorbite heat treatment, the molten salt bath is a very advanced technology. Because the molten salt in the bath has a very low thermal diffusivity and a low viscosity, it remains stable within a specific temperature range. This lower viscosity facilitates the flow of molten salt during quenching, ultimately enhancing the cooling performance. In addition, salt baths help minimize surface oxidation and decarburization by isolating the contact between the wire and atmosphere. The salt bath also provides buoyancy to the wires, minimizing deformation. For wire rods of different steel grades and diameters, it is convenient to adjust the cooling process by changing the temperature of the salt bath. As molten salt is corrosive, this article chose molten nitrate with corrosion resistance as the cooling medium [22]. In addition, in order to prevent corrosion, after the salt bath heat treatment was completed, the production site had special equipment to clean residual molten salt.
In this article, Section 1 introduces the molten salt heat treatment for obtaining sorbite. In Section 2, the physical model of the salt bath is established according to practical production. Section 3 details the simulation method, the mathematical model, and boundary conditions used in the simulation. Section 4 provides a detailed analysis of the simulation results, including the redesign of the controlling cap, the correction of the original model, and the proposal of a new salt bath heat treatment method.
2. Description of the Model
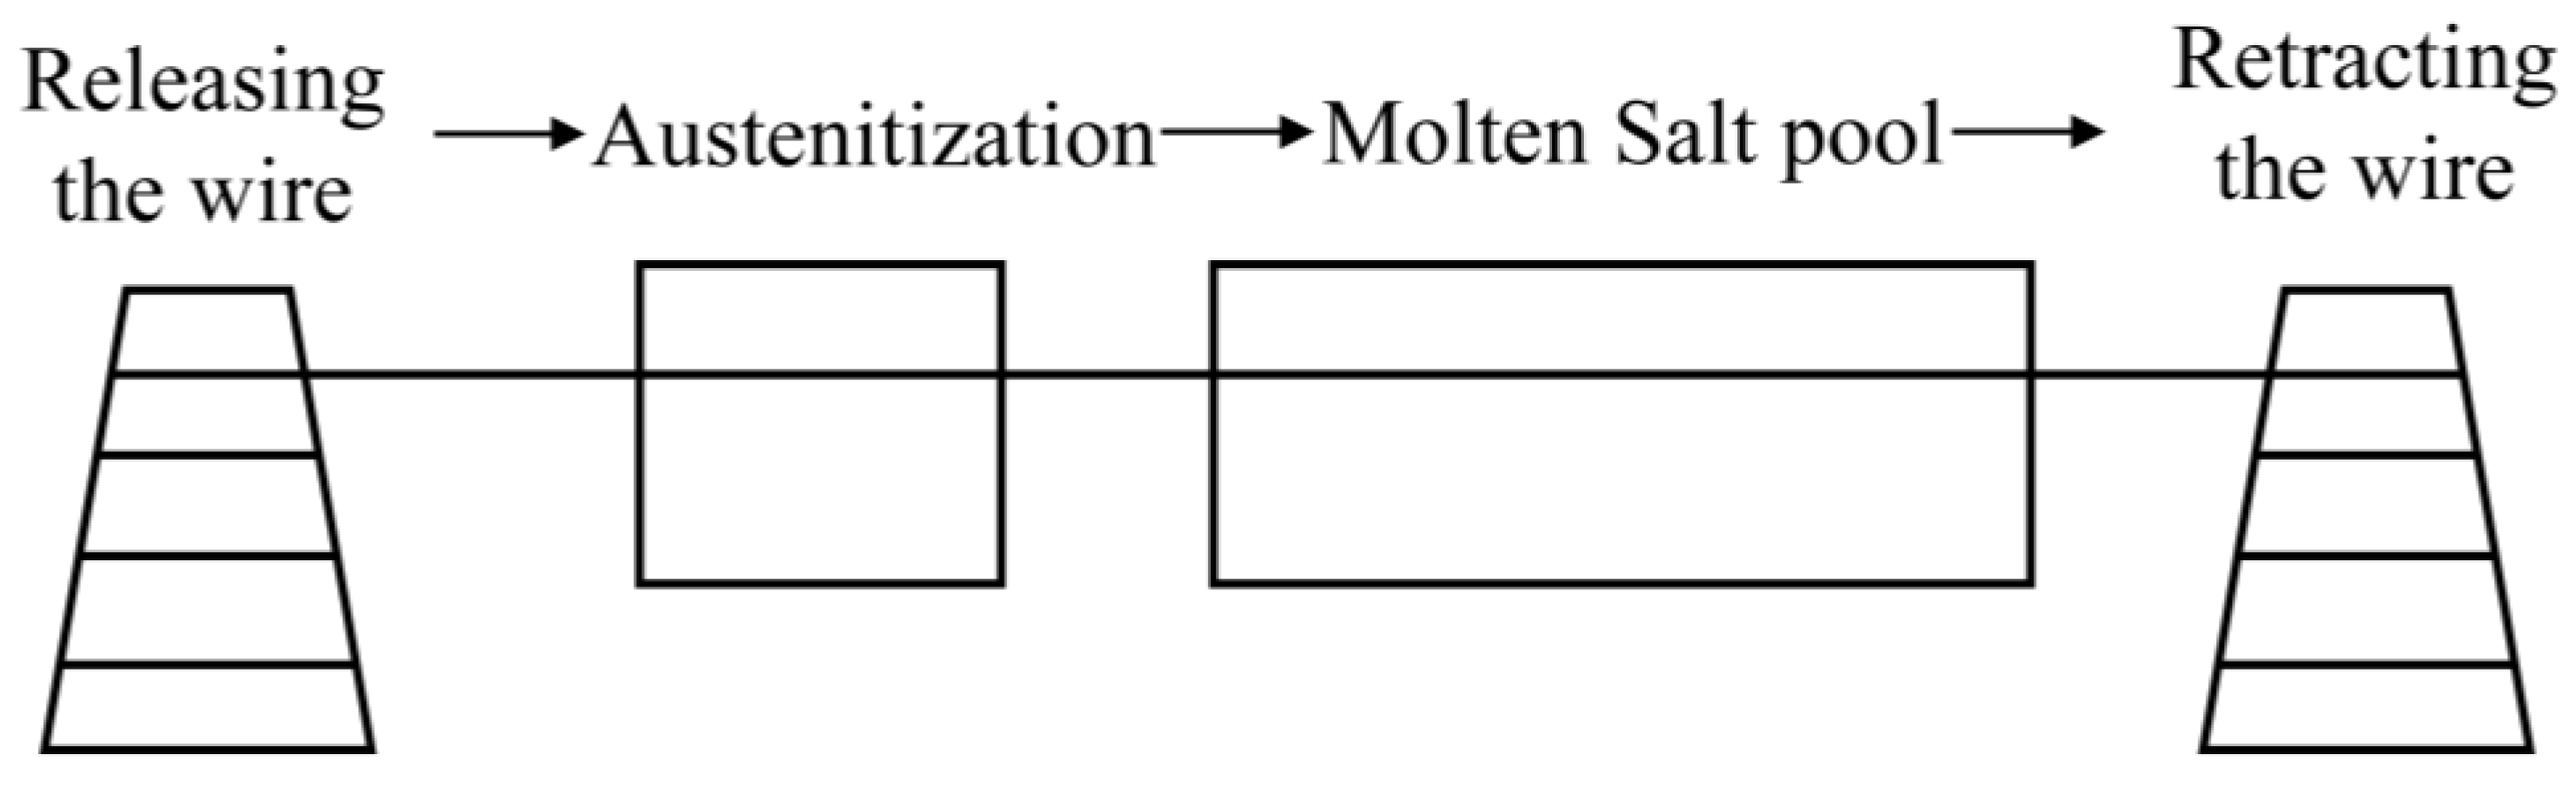
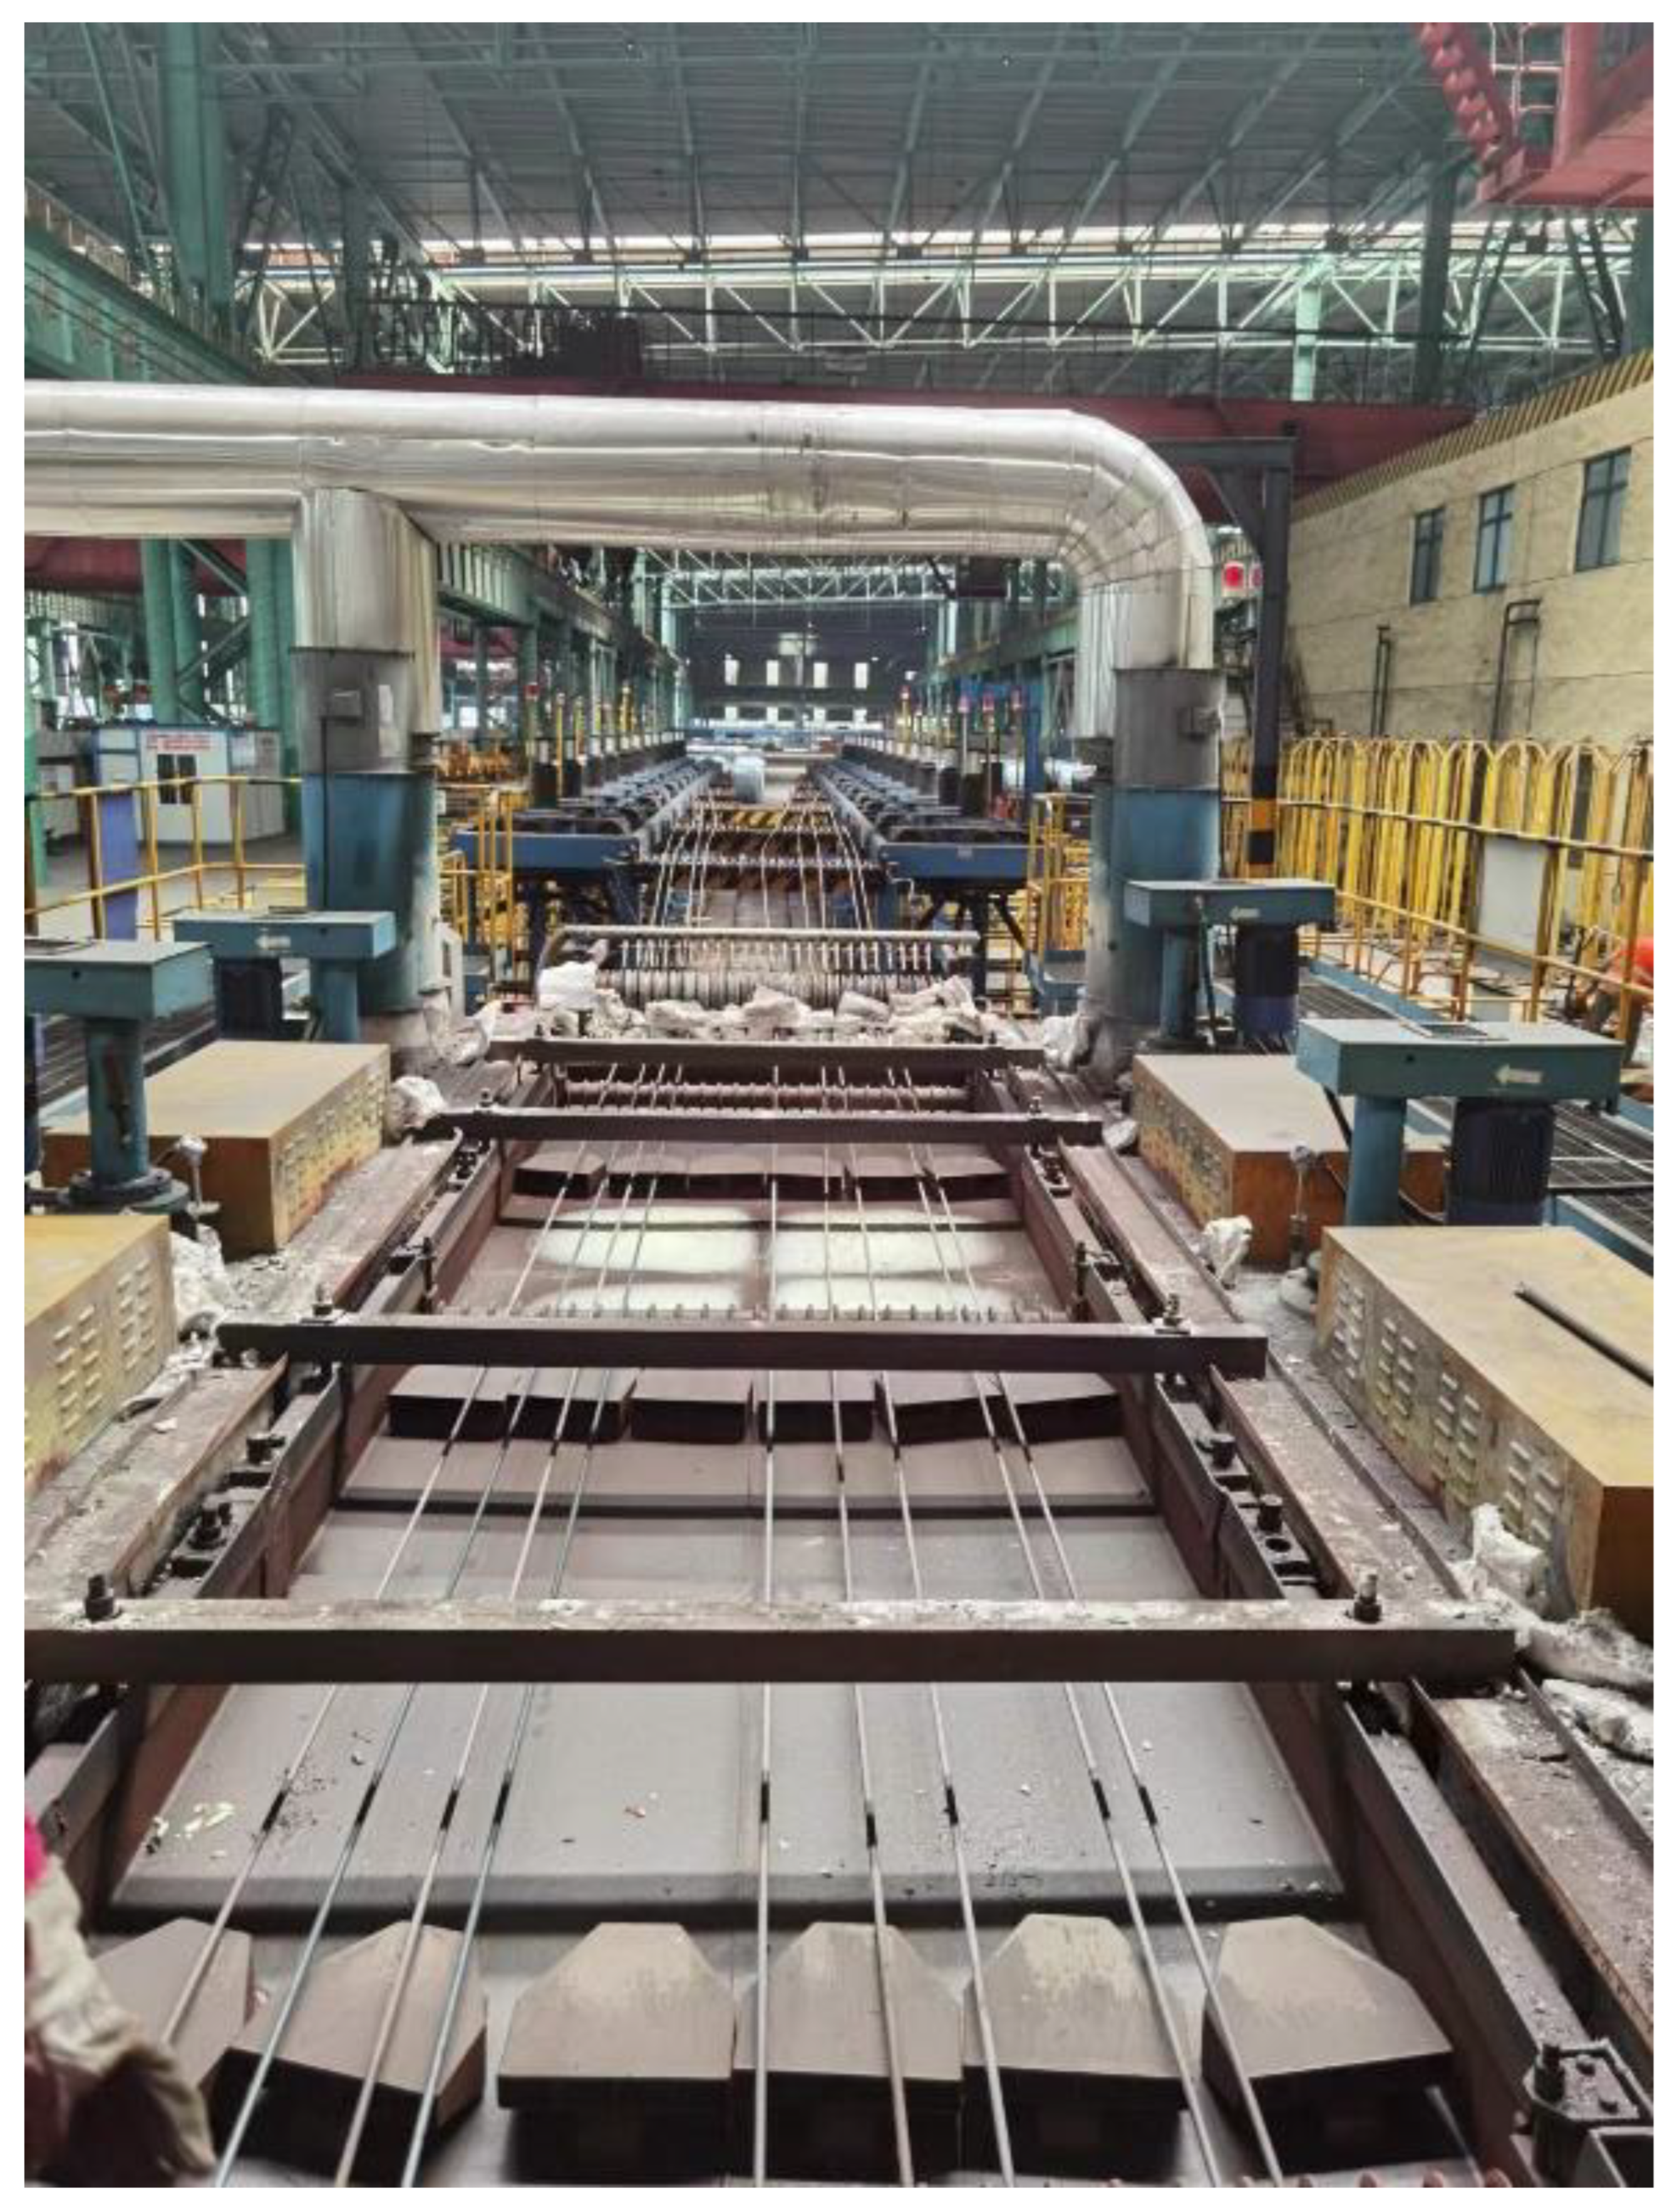
The production flow of salt bath heat treatment is shown in Figure 1. Wires after austenitizing undergo salt bath isothermal quenching treatment to obtain sorbite. The overall appearance of the salt bath tank is depicted in Figure 2, while Figure 3 shows a photo of the salt bath production process in operation. The salt pump transfers molten salt from the lower bottom pipeline to the salt bath through six caps as seen in Figure 4. Molten salt flows in the salt bath and exchanges heat with the wires, and, as seen in Figure 3, then returns to the lower salt tank from both ends, and repeats this process. Simultaneously, multiple wires after austenitizing continuously enter the salt bath tank from one side at a certain speed via the payout device, are rapidly cooled by the salt bath from austenite to sorbite at the transformation temperature, and finally are collected by the take-up device from the other side of the salt bath tank. Figure 4 shows the salt bath physical model. The lower-right corner is the cap model, and the dashed line represents the flow of molten salt in the cap. Figure 5 exhibits the mesh of the salt bath model, in which the blue represents the wires, the purple represents the caps, and the gray represents the salt bath tank. The length of the bath is 10 m, the width is 1.9 m, and the height is 0.25 m. The diameter of the bottom pipeline is 0.209 m, and the diameter of the spout from the bottom pipeline to the cap is 0.065 m.
The residence time of the wire is a function of the moving speed. If fast, the residence time is short, so that the retained austenite, which has not undergone phase transformation at the beginning, may not have enough time to transform into sorbite. If the moving speed of the wire is slow, there will be enough time for the retained austenite that did not undergo phase transformation at the beginning to transform into sorbite, which is beneficial to the quality of the wire, but in industrial production, the moving speed of the wire rod should not be too slow because it affects production efficiency. Therefore, the speed is usually selected based on the performance tested after salt bath heat treatment. As long as the wire performance meets the product requirements, the faster the wire moves, the better.
3. Simulation Method and Mathematical Model
3.1. Simulation Method
The simulation method can be found in articles previously published [23]. The first step is to establish a steady-state salt bath model and calculate the HTC, and the second step is to establish a transient wire slice model and acquire the wires’ temperature field.
3.2. Fundamental Equations for the Salt Bath Model
The fundamental equations employed in the salt bath model are shown in Table 2.
A realizable k-epsilon turbulence model was chosen because it is better for boundary layer flows and separated flows [24]. Compared with a standard k-epsilon model, its prediction accuracy is higher [25]. The realizability effect is realized by the turbulent eddy viscosity , which is a function of turbulent field, mean strain, and rotation rates [26], while in the standard k-epsilon turbulence model, is a constant value.
The equations are listed in Equations (2) and (3).
3.3. Fundamental Equations for the Wire Slice Model
A wire slice model is employed to compute the wires’ temperature field. The equation is listed in Equation (4).
where qL is the latent heat, which is measured with a DSC (Differential Scanning Calorimeter). Its value refers to a previously published article [23].
3.4. Phase Transformation Model
The phase transformation model of austenite to pearlite has been studied in detail by many scholars [13,14]. When the phase transformation takes place, there will be an incubation period, and then the phase transformation will begin. As shown in Equation (1), the classical JMAK equation is also used in this paper, using the additivity rule studied by Scheil to calculate the incubation period. For a detailed description of the phase transformation model, please refer to the article published previously [23].
3.5. Initial and Boundary Conditions
The wire rod studied is 92Si bridge cable steel. The target composition of this steel is shown in Table 3. Cr is enriched in cementite and its diffusion rate is slower than that of Si, so it can maintain the lamellar structure of pearlite. It can also effectively reduce the phase transition temperature of pearlite, refine the lamellar spacing of pearlite, and improve the strength of wire rod. Vanadium carbides in steel can strengthen cementite. The grains can also be refined in the process of austenitization. It can also refine the lamellar spacing of pearlite, reduce the spheroidization of cementite, and improve the torsional property of wire rod in the process of hot-dip galvanizing.
The wire studied was heated to 925 °C to achieve austenitization in a reheating furnace and then held for 15 min before being isothermally quenched in a salt bath. For simulating the salt bath to obtain the convection heat transfer coefficient, it is assumed that there is complete contact between wire and molten salt. The salt bath studied here is used in steel plants, and the molten salt used in the salt bath is a 1:1 mixture of NaNO3 and KNO3. The molten salt in the salt bath does not need to be replaced on a large scale. It only needs to supplement the loss with 30 kg per day, which is also one of the advantages of the salt bath. The salt is pumped continuously into the salt bath through the bottom pipeline and controlling cap, where it undergoes forced heat exchange with the wire entering the salt bath. The salt then flows back to the bottom tank through the outlet, where it is reheated and the above process repeats in a cycle. The thermo-physical parameters of the quenching medium and wire are also referred to in previous work [23]. Since the salt bath is well insulated during actual production, the walls of the salt bath are considered to be adiabatic. The initial and boundary conditions of the salt bath model are in Table 4, and in Table 5 are the boundary and initial conditions of the wire slice model. In the simulation, the convergence rule of energy and other equations are chosen to 10−7 and 10−5, respectively.
4. Results and Discussion
4.1. Optimization of the Salt Bath Physical Model
4.1.1. Optimization from the Perspective of Flow Field
In view of the shortcomings of the salt bath model previously proposed, it is improved and redesigned in this paper. Figure 6 illustrates a comparison between the original and modified salt bath. From Figure 6, it can be observed that the original salt bath features four rows of bottom pipelines, arranged in an interleaved pattern to prevent an uneven flow field in the entire salt bath. Figure 7a,b are based on the same set of data, except that one shows the velocity diagram and the other shows the vector diagram, which are used to observe the movement of the fluid. From the velocity and vector diagrams of the original salt bath in Figure 7, it can be observed that the flow field of the bottom tube and cap is uneven, and it shows a pattern that the farther away from the salt pump, the smaller the flow rate is. This will result in uneven transverse heat transfer of the wire, affecting the uniformity of the wire’s transverse temperature distribution. This non-uniformity can also be seen in the streamline of Figure 8.
To address the aforementioned drawbacks, the bottom pipelines and cap of the salt bath are redesigned, as shown in the lower picture of Figure 6. Since the phase transformation occurs early in the wires’ entry into the salt bath, the original four rows of bottom pipelines were modified to three rows to enhance the flow speed in the phase transformation region. The molten salt bath was designed to pump to the bottom tube from both the left and right sides. From the velocity contour and vector plot of the redesigned salt bath in Figure 9, it can be observed that compared with the original salt bath in Figure 7, thanks to the salt pumping from the left and right symmetrically to the bottom of the tube at the same time, the new salt bath flow field is more uniform after the modification. This phenomenon can also be seen clearly from the streamline of the new salt bath in Figure 10. From this figure, it can be clearly seen that the salt flows symmetrically from both sides of the bottom tube, enters the controlling flow cap through six channels, and then flows into the salt bath. This design makes the velocity of the six channels relatively uniform. Additionally, as shown in the red box in Figure 6, the outflow direction of the original cap is parallel to the forward direction of the wires, which is also disadvantageous for heat exchange between the salt and the wires. Therefore, to address this shortcoming, as shown in the black box in Figure 6, the internal structure of the cap was redesigned. The cross-sectional flow field after structural modification is shown in Figure 11. As seen in the red box, the outflow direction of the redesigned controlling cap is oriented diagonally upward, which improves the heat exchange efficiency near the exit of the cap.
Images of samples treated with the newly designed and original salt bath for sorbite are shown in Figure 12. Here, it can be seen from the figure that the newly designed salt bath produces approximately the same sorbite as the previous salt bath. The main purpose of the newly designed salt bath is to optimize the structure of the salt bath, improve the heat transfer efficiency, and increase the production capacity by increasing the number of heat-treated wires. In addition, it also can be seen from Figure 12 that both photos show fine lamellar layers that are almost entirely sorbite in appearance, and no bainite was found in the SEM figure. This is because the sorbitization rate of the wire studied in this paper after salt bath heat treatment exceeded 95%.
4.1.2. Optimization from the Perspective of Vortex
Vortex is everywhere in nature, such as the microscopic movement of electrons around atomic nuclei, macroscopic tornadoes, and nebulae in galaxies in space. There is also a vortex in the turbulent flow of fluid, and it significantly affects the turbulent flow field.
Vortices provide another perspective on fluid. Vortices hinder the movement of fluid, causing fluid to lose kinetic energy. Therefore, by introducing vortex identification, changes in molten salt flow can be observed [27,28]. Liu Chaoqun [29] introduced the third generation of vortex definition and identification technology. Compared with other vortex identification technology, the method proposed by Liu Chaoqun has the advantages of clear physical meaning, simple realization, normalization (value range 0~1), the ability to capture strong and weak vortices simultaneously, and no need to drastically adjust the threshold. Based on this method, > 0.52 was chosen as a threshold to exhibit the iso-surface. The vortex distributions of the original salt bath and redesigned salt bath are shown in Figure 13. The upper picture in Figure 13a shows the vortex distribution of the original salt bath, and the lower picture shows the vortex distribution of the redesigned salt bath. Figure 13b is an enlargement of Figure 13a. From the upper picture in Figure 13 a,b, the vortex of the original salt bath is mainly concentrated near the cap, which will hinder salt flow and cause the salt to lose some kinetic energy. This also confirms the fact that there is a real problem with the original cap. Thanks to our improved design for the shortcomings of the original salt bath, it can be seen from the lower picture of Figure 13a,b that the vortex of the redesigned salt bath is much smaller than that of the original salt bath.
Figure 14 shows the main distribution positions of the vortex in the newly designed salt bath. The vortex is concentrated in the spouting port from the bottom pipeline to the cap and the position from the spouting port to the cap.
4.2. Inverse Calculation of HTC and Correction of the Model
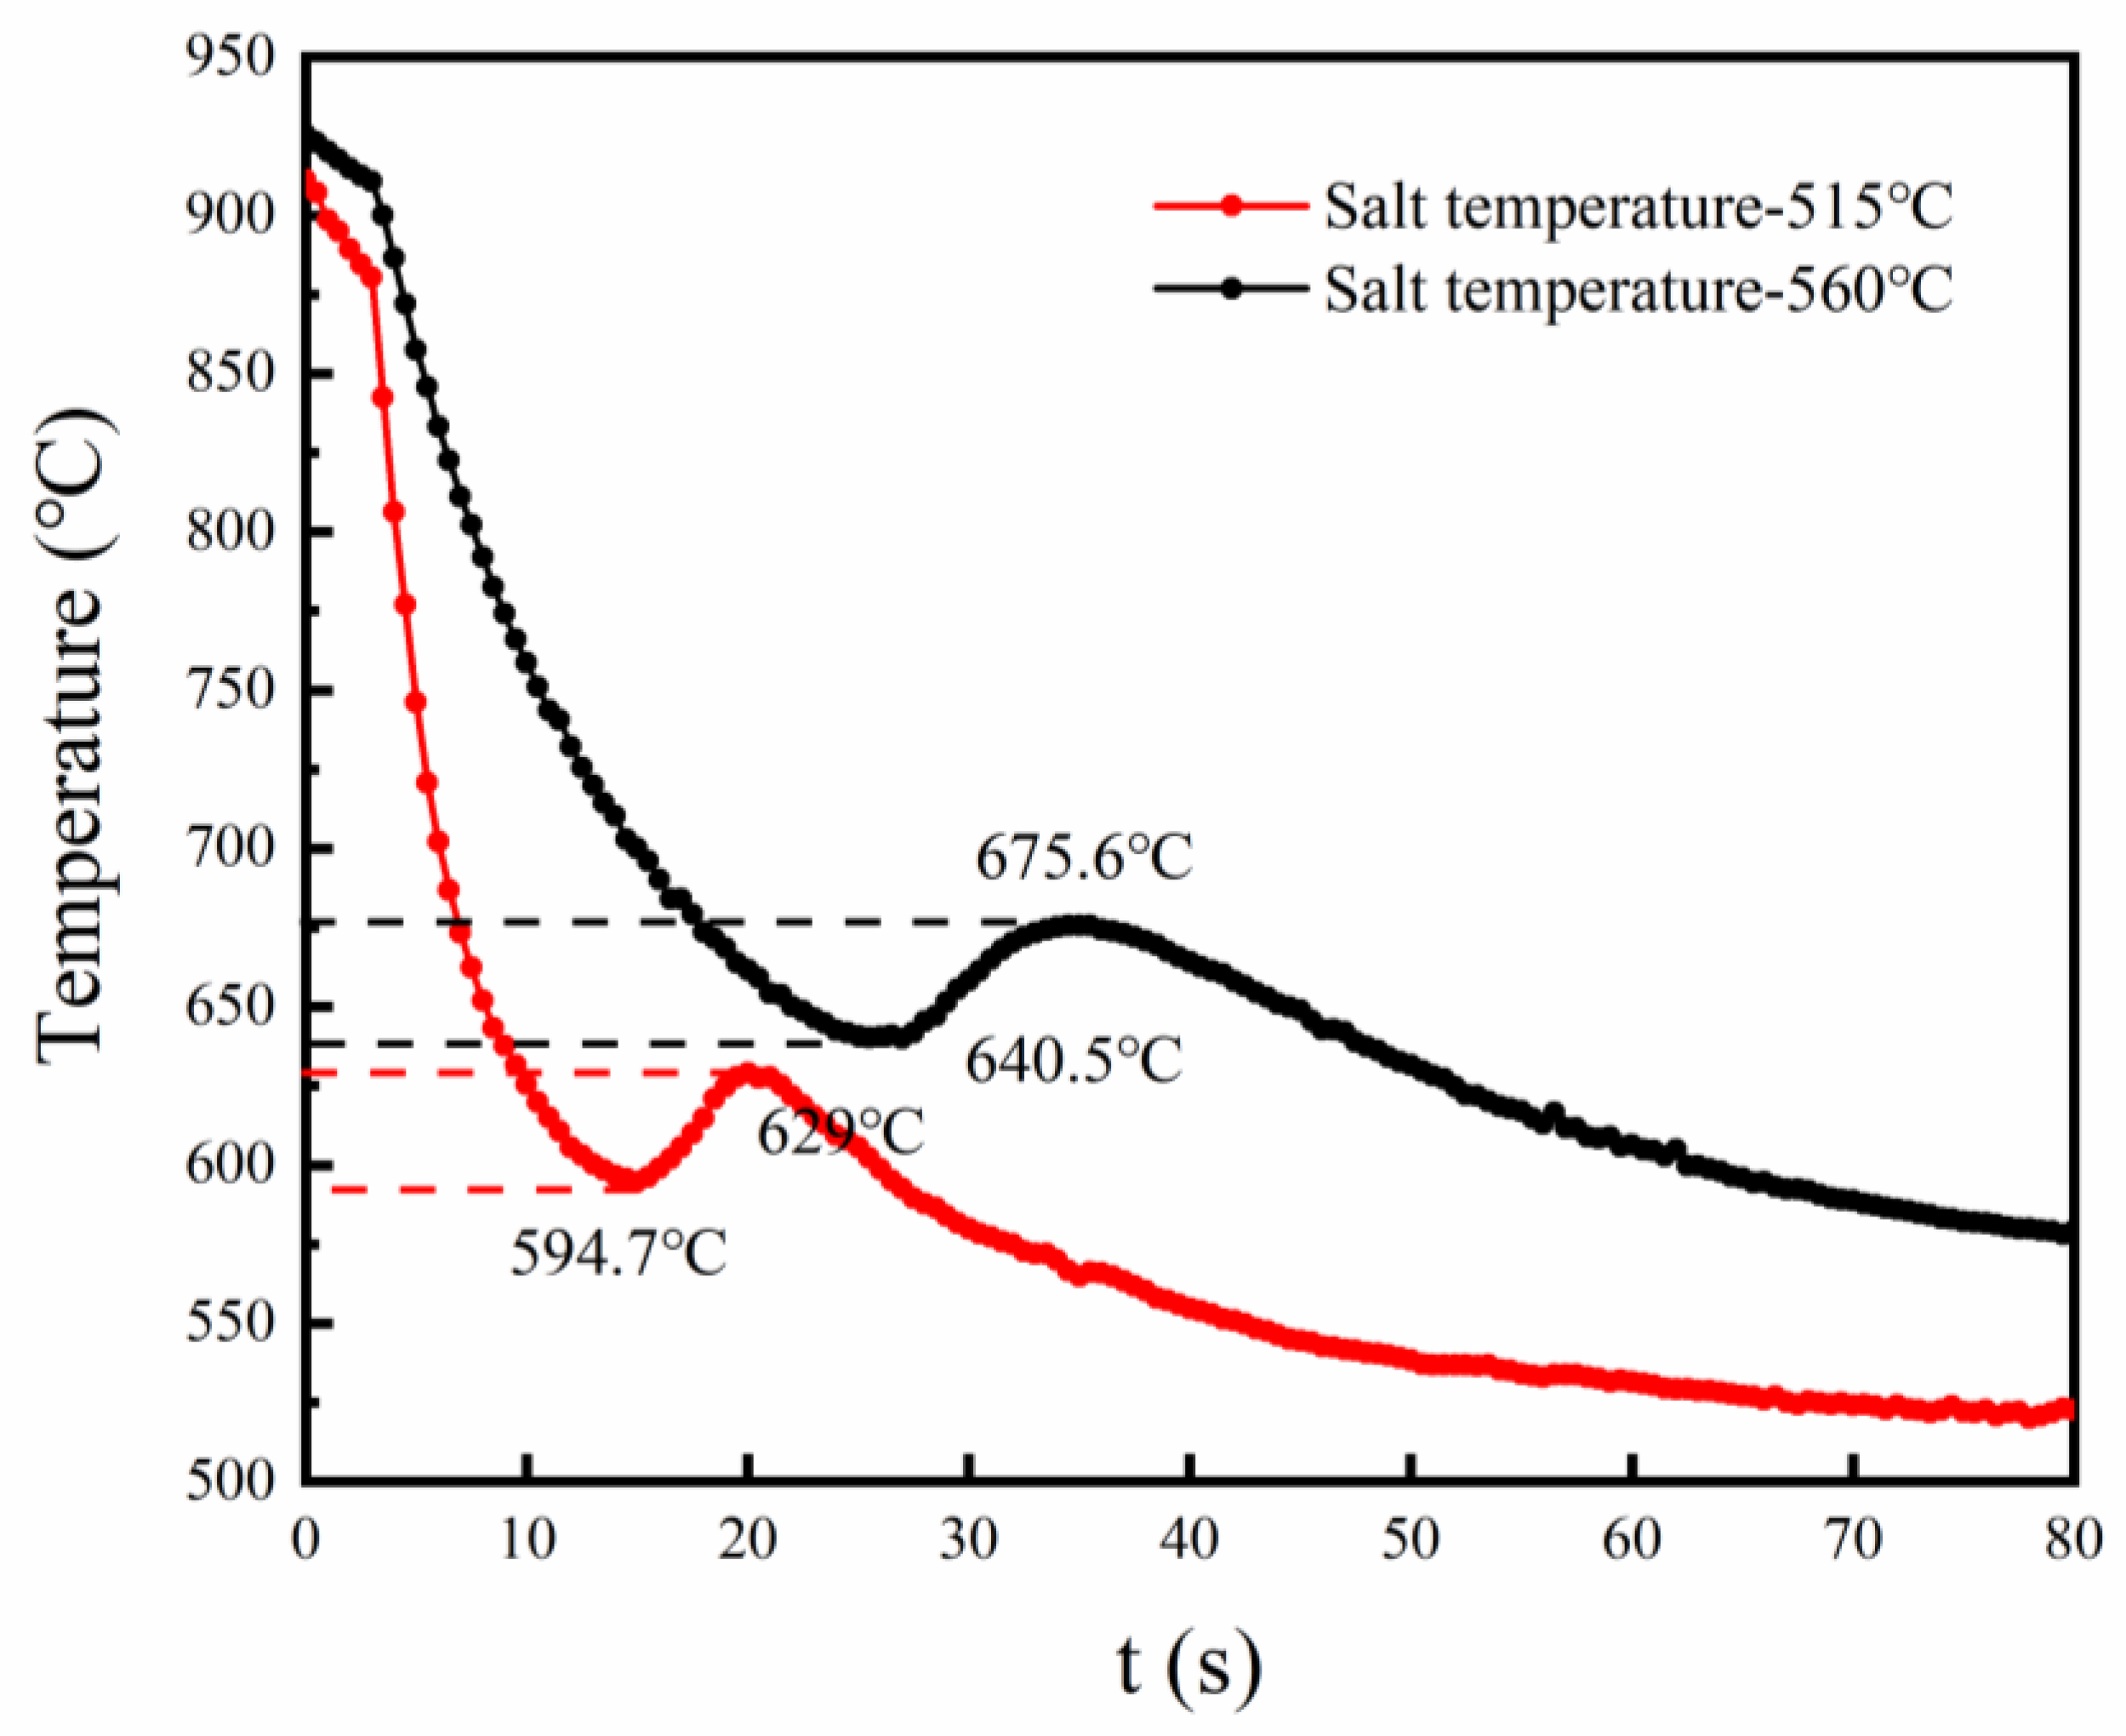
K.M.Pranesh Rao et al. used inverse heat transfer technology to calculate the HTC of the quenching interface by taking advantage of quenching experiment data. By comparison with the oil quenching process, it is found that only nucleate boiling heat transfer and convective heat transfer occur in the salt heat-treating process. In order to make the model more accurate, we performed two sets of experiments using a salt bath furnace with salt temperatures of 515 and 560 °C, according to K.M.Pranesh Rao’s method. As shown in Figure 15, the wire rod sample used in the experiment is 600 mm in length and 14 mm in diameter. In the radius direction, the distance between the thermocouple and the sample surface is 1 mm. Real-time temperature data are recorded using WRNK-192 sheathed thermocouples and a LR8431-30 pyrometer made by HIOKI from Japan.
The temperatures measured are shown in Figure 16. When the molten salt temperature is 560 °C, the lowest temperature in the phase transformation range is 640.5 °C, which is 45.8 °C (640.5–594.7) higher than that when the molten salt temperature is 515 °C. Similarly, the highest temperature in the phase transformation range for a salt temperature of 560 °C is 675.6 °C, which is 46.6 °C (675.6–629) higher than that when the molten salt temperature is 515 °C. It can be concluded that with an increase in the molten salt temperature, the temperature during the phase transformation period also increases, which will inevitably lead to an increase in the interlamellar spacing of the generated sorbite, thus affecting the performance of the wire rod.
The cylindrical surface of the sample has a larger area in comparison to the upper and lower surfaces of the sample, so only radial heat transfer is assumed. The inverse heat transfer model initializes the HTC and then uses the heat conduction equation to calculate the temperature field. It then iterates repeatedly based on the difference between the calculated and experimentally measured values until it converges to a very small value, eventually bringing the calculated value close to the measured value. The equation used in the inverse calculation method is shown in Equation (5).
The inverse calculation HTC results are shown in Figure 17. According to K.M.Pranesh Rao’s article, the HTC of wire rod before phase transformation belongs to boiling heat transfer [30,31]. Therefore, we replaced the HTC in the boiling heat transfer stage in the original model with the inverse calculation HTC of Figure 17, thus correcting the previous model proposed by our research group [32].
The new mathematical model was applied to simulate the redesigned salt bath using the conditions shown in Section 3.5, and the conclusion is shown in Figure 18. The black and blue lines in this figure represent the cooling curves at the center of the wire under the salt temperatures of 515 and 560 °C, while the red and green lines represent the cooling curves at the same position as the thermocouple under the salt temperatures of 515 and 560 °C. The table in Figure 18 shows the temperature of the corresponding point in the cooling curves. Compared to the experimental cooling curves in Figure 16, it is clear that the cooling rates and the reheating temperature after the phase transformation in Figure 18 are faster and lower due to the use of a salt flow rate of 60 m3 in the simulation. The reheating temperature at the position of the thermocouple in Figure 18 (649.5 − 636.5 = 13 °C, 617 − 594 = 3 °C) is significantly reduced compared to that in Figure 16.
4.3. Taking Advantage of Both Low and High Salt Temperatures
In the phase transformation reheating stage, there is a certain temperature gradient from the surface to the core of the wire, which will lead to composition segregation and delay of the completion time of sorbite transformation in the central part of the wire. In order to realize the transformation from the retained austenite to sorbite, it is necessary to keep the temperature of the wire above 560 °C (because bainite transformation occurs when it is less than 560 °C). However, if the salt is at 560 °C, as can be observed in Figure 18, the temperature during the phase transformation is obviously higher than that when the molten salt is at 515 °C, which is bound to result in deterioration of the performance of the wire rod.
Figure 16 shows the salt bath heat treatment experiment. It can be seen from this figure that when the molten salt temperature is 515 °C, the cooling rate is much faster than that at 560 °C. The molten salt temperature currently used in actual production is 515 °C, and feedback from actual production shows that since the molten salt temperature at 515 °C is lower than the lowest transformation temperature at 550 °C for sorbite, residual austenite that has not been transformed at the beginning sometimes was transformed into bainite (its strength is low, and its plasticity and toughness are poor), which will affect the mechanical properties of the wire. Therefore, the actual production site hopes to prevent this phenomenon by increasing the temperature of the molten salt. However, it can be seen from Figure 16 that after the molten salt temperature increases to 560 °C, the cooling rate of the wire slows down and the phase transition temperature increases by approximately 40 °C, which will cause the wire to transform into relatively thick pearlite and also affect the mechanical properties of the wire.
The advantage of molten salt at 515 °C is that the phase transformation temperature is low, and the advantage of molten salt at 560 °C is that it can prevent wire rods that have not undergone phase transformation at the beginning from transforming to bainite. How can we make use of the advantages of these two kinds of molten salt temperature at the same time? It is necessary to divide the salt bath into two parts. The salt temperature in the salt bath where the wire rod begins to enter is set to 515 °C, which is defined as the first salt bath, and its main function is to cool the wire rod and complete the initial phase transformation process. The other half of the salt bath is set to 560 °C, which is defined as the second salt bath, and its main function is to prevent the transformation from retained austenite to bainite.
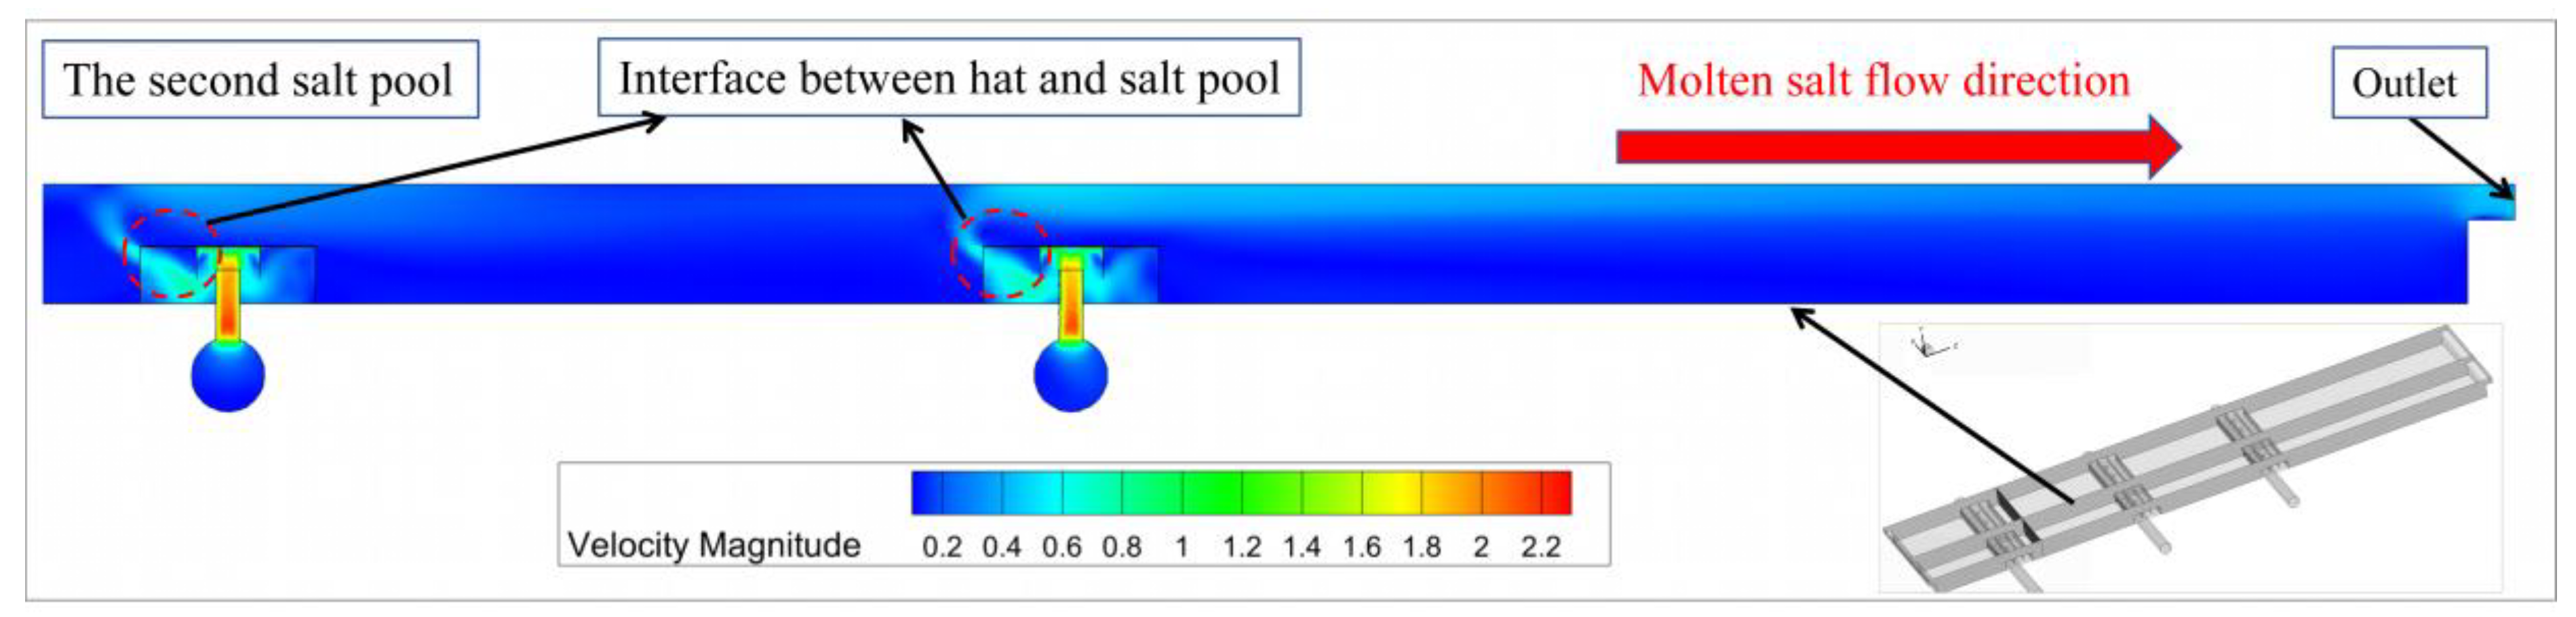
Therefore, based on the analysis above, we designed a novel salt bath model which is divided into two parts, as shown in Figure 19. The molten salt temperatures of the first and second salt baths are 515 and 560 °C, respectively. Figure 20 and Figure 21 illustrate the first and second salt baths in detail. For the first salt bath, in order to increase the flow rate in the phase transformation area, the interface between the cap and the salt bath is set at the position of the red circle in Figure 20. For the second salt bath, in order to form a circulation to facilitate the renewal of molten salt, the interface between the cap and the salt bath is set at the position of the red circle in Figure 21.
The simulation results of the divided salt bath are shown by the solid line in Figure 22, and the simulation results of the previous undivided salt bath are shown by the dashed line in Figure 22. The black and red lines in the figure are the cooling curves of the center and the thermocouple position in the divided salt bath, respectively. The divided salt bath uses the advantages of two salt temperatures. As can be clearly observed in Figure 22, the cooling curves from the divided salt bath can not only keep the wire at a lower temperature during the initial phase transformation (indicated by the cooling curve resembling the green and blue lines before the dividing line) but also keep the temperature of the wire rod above 560 °C after the initial phase transformation is completed (after the dividing line) to prevent the transformation from retained austenite to bainite.
The wires can be transformed from austenite to sorbite by setting the temperature of the first salt bath to 515 °C. As shown in Figure 22, at the molten salt temperature of 515 °C, the average temperature of the phase transformation zone is about 620 °C, which is in the transformation zone of sorbite, and the salt bath at this temperature has been proven to be able to obtain sorbite at the actual production site. In the second stage salt bath, as shown in Figure 1, since the bainite transformation temperature is lower than 550 °C, as long as the molten salt temperature is not lower than 550 °C, the retained austenite that was not transformed in the first stage will not transform into bainite. Therefore, the temperature of the second salt bath is set to 560 °C, which is 10 °C higher than the transformation temperature of bainite.
5. Conclusions
This paper conducted a detailed study on the molten salt isothermal heat treatment process for obtaining sorbite through a combination of numerical simulation and experiments, and reached the following conclusions:
- In view of the shortcomings of the bottom pipeline and controlling cap in the original salt bath, it was redesigned. The redesigned salt bath was simulated using the mathematical model previously proposed by our research group and the advantages of the redesigned salt bath are analyzed in detail from the perspective of the flow field. Third-generation vortex identification methods are used to conduct a detailed comparison between the redesigned salt bath and original salt bath. The advantages of the newly designed flow control cap and the location of the vortex distribution are stated, and it was concluded that the redesigned salt bath is more conducive to the flow of molten salt;
- Quenching experiments in a salt bath furnace at different temperatures were carried out by using wire samples, and the cooling curves were obtained. The HTC of the boiling heat transfer stage was calculated by the inverse heat transfer method. The original mathematical model was corrected using this inverse HTC, and compared the simulation results of the corrected model with the experimental results. It was concluded that the corrected model can predict the isothermal quenching process of a salt bath better;
- According to the advantages of molten salt heat treatment at two temperatures, a new salt bath heat treatment method was proposed, which divides the salt bath into two parts. In the first salt bath, the temperature of the salt bath is 515 °C, and its main function is to cool the wire rod and complete the initial sorbite transformation process. In the second salt bath, the temperature is 560 °C, and its main function is to prevent the transformation from retained austenite to bainite, which affects the performance of the wire rod. The salt bath was effective, including if the steel grade and diameter of the heat-treated wire were modified. The process parameters of both salt baths can be adjusted according to the simulation data for correction.
Author Contributions
Conceptualization, J.L., B.W. and J.Z.; data curation, J.L.; formal analysis, J.L.; funding acquisition, B.W.; investigation, J.L., J.Z. and B.W.; methodology, J.L. and B.W.; project administration, B.W.; resources, J.L., J.Z. and B.W.; supervision, B.W.; validation, J.L.; writing—original draft, J.L.; writing—review and editing, J.L., J.Z. and B.W. All authors have read and agreed to the published version of the manuscript.
Funding
This research received no external funding.
Data Availability Statement
The raw data supporting the conclusions of this article will be made available by the authors on request.
Acknowledgments
Authors thanks the Institute of Research of Iron & Steel, Shagang for the research grant and the experiment.
Conflicts of Interest
The authors declare no conflicts of interest.
Nomenclature
| X | phase transformation rate | effective viscosity | |
| b | parameters of JMAK equation | thermal conductivity | |
| n | parameters of JMAK equation | turbulent dissipation rate | |
| distance of ith orthogonal direction | dynamic molecular-viscosity | ||
| velocity component along the ith orthogonal direction | kinematic eddy viscosity, | ||
| turbulent kinetic energy | turbulent Prandtl number for , 1.0 | ||
| gravitational force in the j-direction | turbulent Prandtl number for , 1.2 | ||
| T | temperature | C1 | constant, |
| turbulent eddy viscosity | C2 | constant, 1.9 | |
| heat capacity | Subscripts | ||
| turbulent kinetic energy generated by mean velocity gradients | i | ith orthogonal direction | |
| t | time | j | j-direction |
| average strain rate tensor | L | latent heat | |
| latent heat measured by DSC | eff | effective | |
| Greek symbols | |||
| molten salt density |
References
- Guo, L.; Xu, K.; Gao, Y.; Sun, Q.; Niu, B. Effect of Salt Bath Isothermal Heat Treatment on Structure and properties of Ultra High Strength Hard Wire 100Si Steel. Spec. Steel 2023, 44, 84–89. [Google Scholar]
- Tong, R.; Yu, X.; Liu, Y.; Xia, Y.; Su, Y.; Jin, Y. Comparative analysis on properties of 8Cr4Mo4V steel for bearing after vacuum gas quenching and isothermal salt bath quenching. Heat Treat. Met. 2022, 47, 9–14. [Google Scholar]
- Chen, F.; Wen, Y.; Guo, Y.; Zheng, F.; Wang, S.; Yang, L.; Zheng, Y.; Li, D.; Ren, Y. Research status of viscosity characteristics of chlorinated molten salt system. Inorg. Chem. Ind. 2021, 1, 1–5. [Google Scholar]
- Zhang, C.; Han, S.; Wu, Y.; Zhang, C.; Guo, H. Investigation on convection heat transfer performance of quaternary mixed molten salt based nanofluids in smooth tube. Int. J. Therm. Sci. 2022, 177, 107534. [Google Scholar] [CrossRef]
- Yizhi, H.; Jianhui, L.; Xue, L.; Weiqun, S. Advances in Molecular Dynamics Studies of Molten Salts Based on Machine Learning. Acta Chim. Sin. 2023, 81, 1663. [Google Scholar]
- Ma, L.; Zhang, C.; Wu, Y.; Lu, Y. Comparative review of different influence factors on molten salt corrosion characteristics for thermal energy storage. Sol. Energy Mater. Sol. Cells 2022, 235, 111485. [Google Scholar] [CrossRef]
- Ridley, N. A Review of the Data on the Interlamellar Spacing of Pearlite. Metall. Trans. A 1984, 15, 1019–1036. [Google Scholar] [CrossRef]
- An, K.S.; Jeong, S.W.; Bea, H.J.; Nam, W.J. Formation of abnormal structures and their effects on the ductility of eutectoid steel. Met. Mater. Int. 2016, 22, 995–1002. [Google Scholar] [CrossRef]
- Fen, L.; Wu, K.; Lu, X.; Qiao, W. Research Status and Development Tendency of Ultra-High Strength Steel Wire for Bridge Cables. Mater. China 2020, 39, 395–403. [Google Scholar]
- Inbaoli, A.; Kumar, C.S.; Jayaraj, S. Experimental investigation on the effect of additives on different orientations of Al6061 cylindrical sample during immersion quenching. Appl. Therm. Eng. 2022, 204, 118030. [Google Scholar] [CrossRef]
- Johnson, W.A. Reaction Kinetics in Processes of Nucleation and Growth. Trans. Am. Inst. Min. Metall. Eng. 1939, 135, 416–442. [Google Scholar]
- Avrami, M. Kinetics of Phase Change. I General Theory. J. Chem. Phys. 1939, 7, 1103–1112. [Google Scholar] [CrossRef]
- Verdi, C.; Visintin, A. A mathematical model of the austenite-pearlite transformation in plain carbon steel based on the Scheil’s additivity rule. Acta Metall. 1987, 35, 2711–2717. [Google Scholar] [CrossRef]
- Lusk, M.; Jou, H.J. On the Rule of Additivity in Phase Transformation Kinetics. Metall. Mater. Trans. A 1996, 28A, 287–291. [Google Scholar] [CrossRef]
- Agarwal, P.K.; Brimacombe, J.K. Mathematical model of heat flow and austenite-pearlite transformation in eutectoid carbon steel rods for wire. Metall. Trans. B 1981, 12B, 121–133. [Google Scholar] [CrossRef]
- Umemoto, M.; Horiuchi, K.; Tamura, I. Transformation Kinetics of Bainite during Isothermal Holding and Continuous Cooling. Tetsu-to-Hagane 1982, 68, 461–470. [Google Scholar] [CrossRef] [PubMed]
- Umemoto, M.; Nishioka, N.; Tamura, I. Prediction of Hardenability from Isothermal Transformation Diagrams. J. Heat Treat. 1981, 2, 130–138. [Google Scholar] [CrossRef]
- Hawbolt, E.B.; Chau, B.; Brimacombe, J.K. Kinetics of austenite-ferrite and austenite-pearlite transformations in a 1025 carbon steel. Metall. Mater. Trans. A 1985, 16, 565–578. [Google Scholar] [CrossRef]
- Pranesh Rao, K.M.; Narayan Prabhu, K. Effect of Bath Temperature on Cooling Performance of Molten Eutectic NaNO3-KNO3 Quench Medium for Martempering of Steels. Metall. Mater. Trans. A 2017, 48, 4895–4904. [Google Scholar] [CrossRef]
- Rao, K.M.P.; Prabhu, K.N. Compositional and Bath Temperature Effects on Heat Transfer During Quenching in Molten NaNO3–KNO3 Salt Mixtures. J. Mater. Eng. Perform. 2020, 29, 1860–1868. [Google Scholar] [CrossRef]
- Rao, K.M.P.; Prabhu, K.N. A Comparative Study on Cooling Performance of Hot Oil and Molten Salt Quench Media for Industrial Heat Treatment. J. Mater. Eng. Perform. 2020, 29, 3494–3501. [Google Scholar] [CrossRef]
- Wei, Z.; Bo, Y.; Guojia, H.; Zhigang, W.; Shiping, L. Preparation and properties of mixed nitrite molten salts. Inorganic Chemicals Industry 2019, 51, 33–38. [Google Scholar]
- Li, J.; Wang, L.; Xing, C.; Zhang, Y.; Wang, B.; Zhang, J. Effect of inflow mode and parameters on temperature and phase transition of wires during isothermal quenching in molten salt bath. Metall. Mater. Trans. B 2023, 55, 301–318. [Google Scholar] [CrossRef]
- Dhruw, L.; Ansari, S.; Kothadia, H.B.; Rajagopal, A.K. Numerical investigation of thermal and aerodynamic behavior in annular jet impingement on a curved surface. Numer. Heat Transf. Part A Appl. 2024, 1–24. [Google Scholar] [CrossRef]
- Fuhrman, D.R.; Li, Y. Instability of the realizable k–ε turbulence model beneath surface waves. Phys. Fluids 2020, 32, 115108. [Google Scholar] [CrossRef]
- Miranda, E.P.; Sempértegui-Tapia, D.F.; Chávez, C.A. Turbulence models performance to predict fluid mechanics and heat transfer characteristics of fluids flow in micro-scale channels. Numer. Heat Transf. Part A Appl. 2024, 1–20. [Google Scholar] [CrossRef]
- Gu, S.; Sun, M.; Wang, B.; Zhang, J. Simulation and Experimental Study of Fluid Flow and Solidification Behavior in Thin Slabs Continuous Casting Process under Secondary Electromagnetic Stirring. Steel Res. Int. 2024, 95, 2300398. [Google Scholar] [CrossRef]
- Tian, W.; Yu, W.; Shi, J.; Wang, Y. The property, preparation and application of topological insulators: A review. Materials 2017, 10, 814. [Google Scholar] [CrossRef] [PubMed]
- Chaoqun, L. Liutex-third generation of vortex definition and identification methods. Acta Aerodyn. Sin. 2020, 38, 413–431. [Google Scholar]
- Rohsenow, W.M. A method of correlating heat-transfer data for surface boiling of liquids. Trans. Am. Soc. Mech. Eng. 1952, 74, 969–975. [Google Scholar] [CrossRef]
- Ding, T.; Yang, G.-L.; Chen, K.-L.; Fan, G.-M.; Meng, Z.-M.; Yan, C.-Q.; Zhang, K.-F.; Chen, H.-L. Heat transfer evaluation of saturated pool boiling outside slender tube bundle in passive residual heat removal system of molten salt reactor. Ann. Nucl. Energy 2022, 169, 108963. [Google Scholar]
- Ni, S.; Pan, C.; Hibiki, T.; Zhao, J. Applications of nucleate boiling in renewable energy and thermal management and recent advances in modeling—A review. Energy 2023, 289, 129962. [Google Scholar] [CrossRef]
Figure 1.
Salt bath heat treatment process.

Figure 2.
Actual photo of the salt bath.

Figure 3.
Actual production photo of the salt bath.

Figure 4.
The salt bath model for simulation.

Figure 5.
The salt bath mesh.

Figure 6.
Comparison between the original and redesigned salt bath.

Figure 7.
The flow field of the original cap: (a) velocity diagram; (b) vector diagram.

Figure 8.
The streamline of the original salt bath.

Figure 9.
The flow field of the redesigned cap.

Figure 10.
The streamline of the redesigned salt bath.

Figure 11.
The cross-sectional flow field of the redesigned salt bath.

Figure 12.
Comparison of the SEM images between the original and redesigned salt bath: (a) the original salt bath; (b) the redesigned salt bath.
Figure 12.
Comparison of the SEM images between the original and redesigned salt bath: (a) the original salt bath; (b) the redesigned salt bath.

Figure 13.
Comparison of the vortex between the original and redesigned salt bath: (a) the whole salt bath; (b) partial enlargement of (a).
Figure 13.
Comparison of the vortex between the original and redesigned salt bath: (a) the whole salt bath; (b) partial enlargement of (a).

Figure 14.
The position of the vortex in the redesigned salt bath.

Figure 15.
The sample treated in the salt bath.

Figure 16.
The experiments’ temperature measurement results.

Figure 17.
The HTC for the salt temperatures of 515 and 560 °C.

Figure 18.
The cooling curves obtained from the redesigned mathematic model.

Figure 19.
The salt bath is divided into the first and second salt baths.

Figure 20.
Detailed explanation of the first salt bath.

Figure 21.
Detailed explanation of the second salt bath.

Figure 22.
Comparison of cooling curves between the redesigned salt bath, 515 °C salt bath, and 560 °C salt bath.
Figure 22.
Comparison of cooling curves between the redesigned salt bath, 515 °C salt bath, and 560 °C salt bath.


Table 1.
Transformation products of supercooled austenite.
| Transformation Type | Transformation Product | Formation Temperature (°C) | Microstructure Characteristics | Hardness (HRC) |
|---|---|---|---|---|
| Pearlite | Pearlite | A1–650 | Coarse lamellar | 5–20 |
| Sorbite | 650–600 | Fine lamellar | 20–30 | |
| Troosite | 600–550 | Extremelly Fine lamellar | 30–40 | |
| Bainite | Upper bainite | 550–350 | Feathery | 40–50 |
| Lower bainite | 350–Ms | Bamboo leaf | 50–60 | |
| Martensite | Acicular martensite | Ms–Mf | Acicular | 60–65 |
| Lath martensite | Ms–Mf | Lath | 50 |
Table 2.
Fundamental equations.
| Equation Type | Equation Expression |
|---|---|
| Continuity equation | |
| Momentum conservation equation | |
| Energy conservation equation |
Table 3.
The ingredients of 92Si.
| Element | C | Al | Si | Mn | V | Cr |
|---|---|---|---|---|---|---|
| % | 0.92 | 0.02 | 1.15 | 0.8 | 0.02 | 0.3 |
Table 4.
Operating conditions of the salt bath model.
| Parameter | Value |
|---|---|
| Wire diameter (mm) | 14 |
| Bottom pipeline diameter (mm) | 209 |
| Salt pump capacity (m3/h) | 60 |
| Salt temperature (°C) | 515, 560 |
| Flow rate weighting of outflow | 1 |
| Heat conditions of walls | Adiabatic |
| Wire velocity (m/min) | 2.7 |
Table 5.
Operating conditions of the wire slice model.
| Parameter | Value |
|---|---|
| Transformation temperature from austenite to sorbite (°C) | 600–650 |
| Initial temperature (°C) | 925 |
| Free stream temperature (°C) | 515, 560 |
| HTC | Import from the salt bath model |
Disclaimer/Publisher’s Note: The statements, opinions and data contained in all publications are solely those of the individual author(s) and contributor(s) and not of MDPI and/or the editor(s). MDPI and/or the editor(s) disclaim responsibility for any injury to people or property resulting from any ideas, methods, instructions or products referred to in the content. |
© 2024 by the authors. Licensee MDPI, Basel, Switzerland. This article is an open access article distributed under the terms and conditions of the Creative Commons Attribution (CC BY) license (https://creativecommons.org/licenses/by/4.0/).
Share and Cite
MDPI and ACS Style
Li, J.; Wang, B.; Zhang, J. A Novel Design of a Molten Salt Bath Structure and Its Quenching Effect on Wire Transformation from Austenite to Sorbite. Metals 2024, 14, 483. https://doi.org/10.3390/met14040483
AMA Style
Li J, Wang B, Zhang J. A Novel Design of a Molten Salt Bath Structure and Its Quenching Effect on Wire Transformation from Austenite to Sorbite. Metals. 2024; 14(4):483. https://doi.org/10.3390/met14040483
Chicago/Turabian StyleLi, Jun, Bo Wang, and Jieyu Zhang. 2024. "A Novel Design of a Molten Salt Bath Structure and Its Quenching Effect on Wire Transformation from Austenite to Sorbite" Metals 14, no. 4: 483. https://doi.org/10.3390/met14040483
Note that from the first issue of 2016, this journal uses article numbers instead of page numbers. See further details here.