
Study of Tuyere Combustion Flame Temperature in Vanadium and Titanium Blast Furnaces by Machine Vision and Colorimetric Thermometry


1
School of Metallurgical and Ecological Engineering, University of Science and Technology Beijing, No. 30 Xueyuan Road, Haidian District, Beijing 100083, China
2
Beijing Jianlong Heavy Industry Group Co., Ltd., Building 49, Zone 12, No. 188 South Fourth Ring West Road, Fengtai District, Beijing 100070, China
3
Collaborative Innovation Center of Steel Technology, University of Science and Technology Beijing, No. 30 Xueyuan Road, Haidian District, Beijing 100083, China
4
Jianlong Group & USTB Joint Laboratory, No. 30 Xueyuan Road, Haidian District, Beijing 100083, China
*
Author to whom correspondence should be addressed.
Metals 2024, 14(5), 499; https://doi.org/10.3390/met14050499
Submission received: 20 March 2024
/
Revised: 21 April 2024
/
Accepted: 23 April 2024
/
Published: 25 April 2024
(This article belongs to the Special Issue Advanced Metal Smelting Technology and Prospects)
Abstract
:The steel industry is an important foundation of the national economy and the livelihood of the people, producing a large amount of carbon dioxide gas, accounting for about 70% of the carbon dioxide gas generated in the steel industry, which occurs during the ironmaking process. Therefore, the key technology to reduce the pollution and improve competitiveness is to increase the stability of blast furnace production and the quality of hot metal. Since the operation requirements for temperature control in the vanadium-titanium blast furnace are dramatically different compared to the traditional ones due to the low fluidity of vanadium-titanium slag, maintaining the required hot metal temperature within a narrow range with smaller fluctuations is essential. In addition, the adjustment parameters of the lower part have a significant influence on the tuyere combustion flame temperature during the daily operation of blast furnaces. At present, there is no relevant research on the online detection and analysis of vanadium-titanium blast furnace tuyere combustion flame temperature. In this study, the temperature of four tuyeres in a 500 m3 vanadium and titanium blast furnace at Jianlong Steel was detected by an online detection system. The tuyere combustion flame temperature was then calculated using colorimetric temperature measuring methodology at various times and at four distinct locations. After that, the calibration analyses, imaging parameter and the temperature tendencies in different directions of the blast furnace were investigated. This study not only offers new methods for understanding the regularity of operation and increasing the degree of visualization in vanadium and titanium smelting blast furnaces but also provides technical support for intelligent and low-carbon operation in blast furnaces.
1. Introduction
The steel industry is an important foundation of the national economy and the livelihood of the people. Whether it is important infrastructures, such as buildings, bridges, ships, transportation, pipelines, or automobiles, railways, power facilities, tools, oil exploitation, and other facilities closely related to personal life, all of these are inseparable from the support of steel materials. For many years, China has accounted for about half of the world’s steel production, making it the second-largest carbon emitter compared to the energy industry. For instance, nearly 70% of the carbon dioxide gas generated in the steel industry occurs during the ironmaking process [1]. The two new technologies that have received widespread attention in the steel industry over the past decade are intelligent and environmentally friendly low-carbon smelting technology [2,3]. However, the long-term procedure of steelmaking, mainly including blast furnace ironmaking and converter steelmaking, still takes up over 80% of the steel industry’s capacity in China [4]. With the impact of overcapacity, transformation and upgrading, carbon neutrality and other policies in the steel industry, the traditional blast furnace ironmaking process will face fierce competition from the emerging low-carbon ironmaking units such as hydrogen shaft furnaces and oxygen blast furnace smelting due to their lower carbon emissions and cheaper prices.
On this basis, the key technology for improving the competitiveness of traditional blast furnaces is to enhance the stability of blast furnace production and the quality of hot metal [5]. The tuyere combustion zone, which is composed of a plurality of tuyeres arranged circumferentially around the blast furnace, is the key for the thermal system and the lower-part adjustment operations. The internal combustion reaction occurs violently due to the high-temperature hot blast and the pulverized coal and coke in the raceway zone of the blast furnace. This not only provides heat, reducing gas, and space for the decline of burden and coke but also affects the chemical reaction between the slag and molten iron in the hearth zone.
As everyone knows, vanadium and titanium are utilized extensively in metallurgy, the chemical industry, aerospace, defense, and military applications, and they are considered significant strategic resources on a global scale. Vanadium and titanium mainly exist in vanadium titanomagnetite in the form of associated ores. China has abundant resources of vanadium and titanium, with the reserves of titanium ranking first in the world, and vanadium ranking third. These resources are mainly distributed in Panxi, Sichuan and Chengde, Hebe. Among them, Panxi’s vanadium titanomagnetite resources are the most abundant, totalling 618 million tons, which accounts for about 95% of the country’s reserves and 35% of the world’s total. In the case of China’s increasingly tight iron ore resources and rising ore prices, how to effectively use vanadium and titanium resources for blast furnace smelting has become a hot issue that major iron and steel enterprises need to face. Vanadium-titanium magnetite is usually smelted using the conventional “blast furnace-converter vanadium extraction-semi-steel steelmaking” method, in which the hot temperature slag exhibits viscosity, poor fluidity and poor stability. These characteristics could also lead to iron loss, iron strip in the slag, difficulty in separating slag from iron, and unstable desulfurization performance of blast furnace slag. By placing more emphasis on the stability and smooth flow of the thermal regime, the vanadium-titanium blast furnace smelting method, in contrast to the conventional one, enhances the fluidity of the vanadium-titanium slag, and achieves acceptable removal of sulfur and phosphorus. Therefore, it can be concluded that the stability of the lower part of the blast furnace is particularly important for vanadium and titanium smelting. Thus, detecting the tuyere combustion flame temperature in vanadium and titanium smelting blast furnaces holds significant guiding importance in grasping the influence of the lower part of the blast furnace on the temperature of the tuyere, the activity of the furnace hearth, and the temperature change trend of the blast furnace.
Despite the above problems, the lack of an effective detection system has rendered the blast furnace a ‘black box’ for a long time, which could be attributed to its high-temperature, high-pressure smelting environment [6]. Actually, as the only window in the lower part that can observe the inside of the blast furnace, the tuyere zone is highly valued by operators and researchers for its ability to intuitively reflect the combustion state of the raceway, high-temperature gases, and the degree of damage to the tuyere cooling equipment [7]. The number of blast furnace tuyeres varies depending on its volume. Normally, blast furnace operators usually judge the change trend in furnace temperature inside the blast furnace by observing the brightness of the blast furnace tuyere at different times [8], and they assess the differences in the furnace hearth state at different locations around the circumference by observing the blast furnace tuyere at different positions at the same time.
In recent years, a large number of scholars have studied the tuyere combustion flame temperature of blast furnaces [9], which could be summarized into three stages. In the early stage, Taylor used a fiber-optic ratio pyrometer to collect radiation light from a tuyere peephole in the blast furnace at the Redcar Blast Furnace of British Steel [10], which was motivated by the online detection of burner temperature in coal-fired power boilers [11]. Meanwhile, Zhang [12] and Matsui [13] investigated the peephole temperature of the flame image using digital image processing techniques. The temperature detection result of the tuyere is substantially lower than that of normal ones due to the huge area of coal injection at the blast furnace tuyere, which shelters the combustion radiation of the raceway zone. These studies have set up a solid framework for the creation of image-based blast furnace temperature-sensing technology. In the middle stage, Salinero [14], Zhou [15,16], Puttinger [17,18,19], and Wang [20] have developed a tuyere combustion flame temperature detection model based on machine vision and a colorimetric temperature measuring technique in an actual blast furnace during the method establishment phase, which was entirely built from the development of the temperature detection hardware system, image processing, the temperature detection model, and the analysis of the temperature detection results. In the latest stage, Wang [20], Huang [21], Zhou [22], Cheng [23], and Zhou [24] studied pulverized coal injection (PCI) blockage, preheated pulverized coal injection combustion, the temperature distribution of PCI process, and the tuyere coke size in the raceway zone of blast furnaces during the application growth research.
Above all, there is no relevant literature to report the temperature variation of vanadium-titanium blast furnaces and analyze the influence of operating parameters. In this paper, an online detection system for tuyere combustion flame temperature bas been built for the online detection of the temperature of the four tuyeres of a 500 m3 vanadium and titanium smelting blast furnace. Then, the colorimetric temperature measuring technique was applied to calculate the tuyere combustion flame temperature at various times at four distinct locations. After that, the investigation of the calibration analysis, imaging parameter, and temperature tendency of the various blast furnace directions were studied. This study could enhance the visualization of vanadium and titanium blast furnaces and introduce new approaches to understanding the operational regularity of smelting. In addition, it has the potential to provide technical support for intelligent and low-carbon smelting in the lower section of blast furnaces.
2. Materials and Methods
2.1. Colorimetric Temperature Measuring Methodology
Colorimetric thermometry is a technique for calculating temperature by comparing the spectrum radiant brightness of thermal radiation objects at two wavelengths and the function connection between temperatures. The gray value produced by the same position is simultaneously measured at two nearby wavelengths, as shown in Equation (1). When assuming that the combustion flame in tuyere is a graybody, with the emissivity of the two wavelengths assumed to be equal, then the temperature T could be computed using Equation (2). After that, a simplified version of the temperature calculation formula could be obtained, as shown in Equation (3).
- ε(λ, T) is the effective spectral emissivity of radiation (-);
- T represents temperature (K);
- C1 is the first radiation constant of Planck (W·m2);
- C2 is the second radiation constants of Planck (m·K);
- , are the gray levels of 1, 2 wavelengths (-);
- λ1, λ2 are the wavelengths of 1, 2 wavelengths (m);
- , are the calibration coefficients of the calculation model (-);
- ε1, ε2 is the emissivity of 1, 2 wavelengths (-).
As a result, only the blackbody furnace calibration of the connection between the calibration coefficient and the grayscale system is required for further calculations. It is possible to calculate the temperature at each point in the tuyere image of the blast furnace.
2.2. Blackbody Furnace Calibration
In order to explore the rules of thermal radiation that do not depend on the precise features of object, an ideal entity known as a blackbody was developed. The Stephen–Boltzmann law states that a blackbody’s radiant energy and thermodynamic temperature are connected. The foundation of temperature sensing is the temperature calibration of the prototype system, and the key to the calibration process is finding a radiation source which emits radiation that is similar to that of a blackbody. In this study, the temperature calibration system, comprising a furnace body, a photoelectric pyrometer, a control box, a water-cooling system, a vacuum system, and an argon transmission system, is calibrated using a modified high-temperature horizontal cylindrical standard blackbody furnace.
The graphite heating element’s target heating element is positioned in the middle and is separated into two symmetrical blackbody cavities. The primary body of the device is a horizontal graphite tube furnace. The outside of the tube is coated with carbon felt, high-temperature insulation, and insulation material. There is a graphite heat insulation screen outside the tube. Moreover, a water-cooling system, an evacuation system, and an argon gas transfer system are all located on the lowest portion of the furnace body.
The blackbody furnace is heated for a while prior to calibration, then the temperature is beginning to increase to the measurement temperature. Following stabilization for ten minutes at each temperature point, calibration images at the specified temperatures are then gathered, and the temperature of the measured point is then measured. At each temperature point, fifty images were taken with a 0.2 s interval between each one. At last, the temperature measuring system starts at 1500 °C and eventually increases to 2100 °C, collecting a temperature point every 100 °C. The dynamic response range of a CCD for a single exposure time and single aperture has been surpassed since the radiant energy at 2100 °C is 3.84 times more than that at 1500 °C.
2.3. Research Scheme
In this paper, firstly, real-time images of tuyere combustion flame temperature were captured in a working 500 m3 vanadium-titanium blast furnace. The sampling interval for tuyere images in four various directions was set, with one photo being taken per second persistently for 7 days by an online detection system. The main parameters of the 500 m3 blast furnace are shown in Table 1. During the experiment, the imaging parameter selection for the tuyere of the online detection system was also researched. Then, the tuyere combustion flame temperatures in four directions were examined by colorimetric temperature measuring methodology. The average temperatures were analyzed at different time intervals, specifically at one minute and 24 h. Moreover, the variation in average tuyere combustion flame temperature variation with blast furnace lower-part operation parameters over a 24 h period was also studied.
This study detected the tuyere combustion flame temperature in real time in a 500 m3 vanadium-titanium blast furnace. Table 1 displays the primary characteristics of a 500 m3 blast furnace under test conditions. Table 2 shows the coke characteristics of a 500 m3 blast furnace under test conditions, while Table 3 shows the slag and hot metal parameters in a 500 m3 blast furnace under test conditions. It can be observed that the silicon content in the vanadium-titanium blast furnace usually remains at about 0.25% to 0.35%. Consequently, the hot metal temperature is also lower by about 70 °C compared to the normal temperature. The operation requirements for temperature control in the vanadium-titanium blast furnace are more demanding compared to the typical furnaces due to the low fluidity of vanadium-titanium slag. This requires that the hot metal temperature be maintained in a narrow range or under smaller fluctuations.
The online blast furnace temperature detection system is described in Figure 1. A 500 m3 blast furnace has four charge-coupled devices (CCD) positioned in front of peepholes at four various tuyeres named as 1st, 2nd, 3rd, 4th. The 1st tuyere is located in the east direction, the 2nd tuyere is located in south direction, the 3rd tuyere is located in the west direction, and the 4th tuyere is located in north direction. Through the tuyere peephole, the radiation light emitted by the combustion zone enters the acquisition system and is then captured by the CCD industrial camera. The camera divides the light into three channels, named R, G, and B. The R, G, and B channels are imaged separately, each generating a grayscale map, and we refer to the images generated by the three channels as R-channel images, G-channel images, and B-channel images in the following part. The signal of the CCD system is then transmitted to the image storage and data processing system in the computer by an image data transmission line. The distribution of tuyere combustion flame temperature field is finally displayed through software calculation.
3. Results and Discussion
3.1. Results of Calibration Process
The calibration images under different temperatures are presented in Figure 2. The average grayscale of the five images is used as the reference for each particular calibration parameter, since the colorimetric model is used to determine the relationship between wavelength and temperature under the corresponding conditions, which could help reduce calibration errors. Table 2 shows the maximum and average grayscale values in the calibration images under different temperatures. The stability of a single image and the average grayscale of five images are examined to determine if the image could satisfy tuyere combustion flame detection. The highest gray value’s departure from the average gray scale of a single picture increases as the calibration temperature rises. The average relative variance of the gray values throughout the five pictures of the R-channel and G-channel is often less than 1%, with the exception of a temperature of 1500 °C. The B-channel’s relative deviation values are often larger than those of the other two wavelengths.
It is clear that the average gray values across in the R-channel and G-channel are stable across the five images. However, the stability of the B-channel is unsatisfactory. The R-channel and G-channel are thus employed in this study as colorimetric temperature measuring wavelengths. Finally, the calibration factors and results for the calculation model’s gray levels under various temperatures are displayed in Figure 3. These can be applied to calculate the temperature of each point in the tuyere image of the blast furnace according to Equation (3).
3.2. Results of Imaging Parameter Selection of Tuyere
In order to increase the precision of the blast furnace tuyere combustion flame temperature detection system, the color CCD industrial camera’s images should be maintained unsaturated. When the blast furnace operation parameters changes, the imaging parameter should be adapted simultaneously. Therefore, the aperture size, gain, and exposure time should be studied in these situations. For instance, the minimum aperture size of the detecting system is set to F16 because the blast furnace combustion zone is characterized by high radiation intensity, a narrow field of vision, and fast brightness changes with furnace conditions.
In general, the R-channel has the highest gray value, followed by the G-channel, while the B-channel has the lowest gray value. The maximum and average R-channel gray values of the tuyere images obtained at various exposure durations are displayed in Table 3. Consequently, only the R-channel gray values are analyzed in this research. The exposure times are 10 μs, 30 μs, 50 μs, 70 μs, 90 μs, and 110 μs, respectively. As shown in Table 3, the maximum gray value of the R-channel and the average gray value of the tuyere image increase as the exposure time increases. The highest value of the R-channel is 255 when the exposure time is larger than 70 μs, which indicates that the images of each tuyere are saturated when the exposure time exceeds 70 μs.
Every generated image’s maximum R-channel gray value ranges from 183 to 243 at a 70 μs exposure time. This indicates that there is no oversaturation under this combination of imaging parameters. Thus, the maximum exposure time of the blast furnace tuyere combustion flame temperature detecting system is set to 70 μs in this study.
3.3. Results of Four-Direction Tuyere Combustion Flame Temperature
Figure 4 depicts the flowchart of the tuyere combustion flame temperature calculating process. Four tuyere flame temperatures were obtained by using the corresponding CCD. The brightness of the flame is represented by R-channel, G-channel, and B-channel gray levels after image preprocessing, which allows determining the radiation intensity using an optical model. Therefore, the image preprocessing includes image denoising and edge extraction process. Due to the interference of high-temperature dust from the blast furnace and the influence of the dark current inside the camera, noise is inevitable in the tuyere image. At the same time, the pulverized coal injection at the blast furnace tuyere obscures the light radiated from a portion of the gyration area, so it is necessary to extract the edge of the image to eliminate the influence of the pulverized coal blockage area on the temper-ature detection results. The wavelet filtering and denoising method in [22] is used to deal with the noise of the blast furnace tuyere image. In addition, the morphological edge detec-tion method is used to detect the edge of the tuyere image and the pulverized coal blockage area. After that, blackbody furnace calibration is applied to determine the temperature of the blackbody. Finally, the temperature of the tuyere at different times and locations can be calculated by gray body assumption.
Figure 5 represents the images of the tuyere flame and the temperature distribution of the actual blast furnace in four different directions, as calculated by Equation (3). In order to better understand the tuyere image and its calculated temperature distribution, the images of the tuyere at the same time in different directions in four directions during the experiment were taken as the images of the tuyere at that time, and the time interval between the eight typical images was 1 min. The pulverized coal injection (PCI) blockage areas of the individual tuyere images are quite different, as shown in 1ST to 4ST, and these occurrences are random, due to the frequent adjustment of the PCI injection and operation parameters. It can also be observed that the position of the high temperature region is not fixed and fluctuates with the combustion conditions in the tuyere radiation images, demonstrating the unevenness of the temperature distribution across the whole tuyere combustion flame.
It is intuitively possible to determine the tuyere combustion flame temperature state at a specific moment by using the highest temperature and temperature distribution. Therefore, a statistical examination of the average tuyere combustion flame temperature at certain times could benefit quantitative characterization of combustion in the raceway zone. Figure 6 displays the average temperature over time at one-minute intervals. The average combustion flame temperature of the 1st and the 4th tuyeres is about 100 °C and 120 °C lower compared to that of the 2nd and 3rd tuyeres. This indicates that the PCI rate, blast volume, and blast pressure of each tuyere should be independently controlled to reduce the relatively considerable disparities in temperature between different directions. Therefore, despite the fact that the blast furnace’s average tuyere combustion flame temperature varies depending on the time of the day. The temperature trend of the blast furnace as a whole remains consistent, with the average temperature of the four tuyere indicating a declining trend over time. From the above analysis, it can be seen that the temperature difference among the tuyeres at different locations in the vanadium-titanium blast furnace is quite different. The possible reasons for this analysis are as follows: First, the asymmetry of the furnace distribution process, which is mainly due to the alternating use of the furnace top coke tank and the mine tank, along with the frequent change of the angle and steering of the rotating chute, leads to the asymmetry of the distribution process. Second, the uniformity of the blast distribution is mainly caused by slag accumulation in front of some tuyeres and the blockage of the tuyere in the blast furnace. Thirdly, the amount of pulverized coal injected between the blast tuyere of the blast furnace is not the same. Fourthly, due to the interference of the central gas-flow and the edge gas-flow of the blast furnace for prolonging its service life, the center line of the blast furnace deviates from the vertical direction.
Finally, the 24 h temperature variations of two typical blast furnace tuyeres in various orientations are shown in Figure 7, providing a better understanding of the average temperature variations of each tuyere. Table 4 shows the average blast volume and PCI rate of blast furnace in different time periods within 24 h. The temperature value of the vanadium-titanium blast furnace at different times at the same tuyere is about 200 °C, which is mainly due to the fluctuation of the blast volume of the blast furnace tuyere and the coal injection volume of the tuyere with time. In addition, the blast furnace cutting speed also determines the amount of coke burned in the gyration area of the blast furnace tuyere. Gases (CO, CO2, N2), liquids (dripping molten iron and slag), and solids (coke particles, unburned pulverized coal) exist in the tuyere combustion zone at the same time, and the transmission phenomena, physical, and chemical changes continue to occur between the multiple phases, resulting in extremely complex internal combustion zones at the tuyere, which, to a certain extent, also affect the temperature of the tuyere at different times.
The tuyere combustion flame temperature is shown to have a process of periodic increase and decline, the temperature at the adjacent time fluctuates significantly, and the highest temperature ranges from 2000 °C to 2050 °C, with a nearly a 300 °C difference between the highest and lowest temperatures. Although it appears that each tuyere’s combustion flame temperature trend in various directions remains constant, there is still a temperature differential of about 100 °C. As can be seen from the analysis above, the composition and temperature of the molten iron and slag in the blast furnace are affected by the chemical reaction that takes place in the cylinder area. On the other hand, each tuyere in the circumferential direction of the blast furnace has a different temperature. Additionally, the uneven temperature distribution will also have an impact on the service life of the tuyere small sleeve and the hearth in each location of the blast furnace.
3.4. Analysis of Blast Operation Parameters and Tuyere Combustion Flame Temperatures
The main adjustment methods to change the thermal regime involve changing the primary distribution of coal gas flow in the lower part of the blast furnace by adjusting the blast temperature, blast volume, and coal injection volume, regulating the heat transfer and mass transfer rate of the chemical reactions in the blast furnace hearth. These adjustments affect the speed at which the blast furnace charge drops, the shape of the soft melt belt, the temperature of the molten iron, as well as the silicon content and the alkalinity of the slag, all of which can also been changed synchronously. Therefore, the vanadium-titanium smelting blast furnace should pay more attention to the continuity and stability of the lower part of the blast furnace, as well as how the main parameters of the lower part of the blast furnace affect the change of tuyere combustion flame temperature, which has not yet been studied.
Figure 8 represents the average tuyere combustion flame temperature variation with blast furnace lower-part operational parameters over a 24 h period. Until now, it has not yet been possible to quantitatively measure the blast volume and coal injection volume of as single tuyere. Therefore, the temperature of the tuyere in Figure 8 is the average temperature of the four tuyeres at the same time, that is, the average temperature of the tuyere of the blast furnace per hour corresponds to the average temperature of the four tuyeres per minute shown in Figure 7 for that hour. Blast temperature, PCI rate, and blast volume are the three main operational concerns in the lower part adjustment of the blast furnace. As the blast volume and PCI rate increase during the blast furnace temperature rise stage, the tuyere combustion flame temperature also rises. However, a dependence on the blast temperature appears due to the blast temperature variation being maintained within a specific range, indicating that the influence on the combustion flame temperature of the blast furnace tuyere is limited.
The reaction mechanism of the blast furnace raceway zone is very complex, and many international theoretical studies have shown that there is a hysteresis effect in the raceway zone. Specifically, when the lower part of the blast furnace is operating in the direction of the temperature rise in the raceway zone of the tuyere, the temperature of the gyroscope increases more gradually than expected, exhibiting a certain degree of hysteresis. Similarly, when operating in the direction of the temperature decrease in the raceway zone, the temperature of the gyroscope will remain near the original temperature for a period of time before decreasing. It can be observed that the tuyere combustion flame temperature only begins to decline after the hot blast volume, blast temperature, and PCI rate all have all been sustained for a while, from 16 h to 21 h, as depicted in Figure 8. It is possible to deduced that there is a significant hysteresis in the blast furnace’s tuyere combustion flame temperature variation process. This observation is consistent with both the actual behavior of blast furnaces and current theoretical research [24].
4. Conclusions
The operation requirements for temperature control in the vanadium-titanium blast furnace is dramatically different compared with the traditional ones due to the low fluidity of vanadium-titanium slag, which requires the hot metal temperature be maintained within a narrow range, with smaller fluctuations. In this study, an online detection system was applied to detect the four different directions of the tuyere combustion flame temperature in the vanadium and titanium smelting blast furnace. Then, the tuyere combustion flame temperature was calculated using the colorimetric temperature measuring technique and calibration procedure at various times at four different locations. After the calibration analyses, the imaging parameters, including the minimum aperture size and the maximum exposure duration were chosen to be F16 and 70 μs, while the R-channel and the G-channel were then employed as colorimetric temperature measuring wavelengths. The temperature development trend of the furnace is the same, even though the average temperature of the blast furnace tuyere at various times of the blast furnace is not the same. The temperature differential between two tuyere is around 100 °C, despite the fact that the temperature tendency of each tuyere’s various directions remains constant. Moreover, the presence of significant hysteresis in the variation process of the blast furnace’s tuyere combustion flame temperature has been verified by experimental results in this paper. This demonstrates that investigating the temperature tendencies from different directions within the blast furnace is extremely important for ensuring the longevity and maintaining the quality of molten iron in vanadium and titanium smelting blast furnaces.
Author Contributions
Conceptualization, D.Z.; methodology, H.C. and Z.Z.; investigation, D.Z. writing—original draft preparation, D.Z., H.C. and Z.Z.; writing—review and editing, D.Z. and H.C.; funding acquisition, D.Z. All authors have read and agreed to the published version of the manuscript.
Funding
This research was funded by Jianlong Group and USTB Youth Science and Technology Innovation Fund (2023), Fundamental Research Funds for the Central Universities (FRF-TP-22-009A1).
Data Availability Statement
The raw data supporting the conclusions of this article will be made available by the authors on request.
Conflicts of Interest
Author Haoyu Cai was employed by the company Beijing Jianlong Heavy Industry Group Co., Ltd. The remaining authors declare that the research was conducted in the absence of any commercial or financial relationships that could be construed as a potential conflict of interest. The authors declare that this study received funding from the company Beijing Jianlong Heavy Industry Group Co. The funder was not involved in the study design, collection, analysis, interpretation of data, the writing of this article or the decision to submit it for publication.
References
- Mele, M.; Magazzino, C. A Machine Learning analysis of the relationship among iron and steel industries, blast pollution, and economic growth in China. J. Clean. Prod. 2020, 277, 123293. [Google Scholar] [CrossRef]
- Shan, S.; Wen, X.; Wei, Y.; Wang, Z.; Chen, Y. Intelligent manufacturing in industry 4.0: A case study of Sany heavy industry. Syst. Res. Behav. Sci. 2020, 37, 679–690. [Google Scholar] [CrossRef]
- Zhang, L.; Feng, L.; Wang, J.; Lin, K. Integration of Design, Manufacturing, and Service Based on Digital Twin to Realize Intelligent Manufacturing. Machines 2022, 10, 275. [Google Scholar] [CrossRef]
- Zhou, D.; Xu, K.; Lv, Z.; Yang, J.; Li, M.; He, F.; Xu, G. Intelligent Manufacturing Technology in the Steel Industry of China: A Review. Sensors 2022, 22, 8194. [Google Scholar] [CrossRef] [PubMed]
- Zhou, D.D.; Xu, K.; Zhou, P.; Jiang, X. The production of large blast furnaces of China in 2018 and thoughts of intelligent manu-facturing in the ironmaking process. Ironmak. Steelmak. 2020, 47, 650–654. [Google Scholar] [CrossRef]
- Song, C.; Zhang, H.; Wang, Y.; Wang, Y.; Hu, K. Abnormality Detection of Blast Furnace Tuyere Based on Knowledge Distillation and a Vision Transformer. Appl. Sci. 2023, 13, 10398. [Google Scholar] [CrossRef]
- Chen, C.; Cai, J. A Hybrid Cluster Variational Autoencoder Model for Monitoring the Multimode Blast Furnace System. Processes 2023, 11, 2580. [Google Scholar] [CrossRef]
- Song, J.; Jiang, Z.; Zhang, Y.; Han, Z.; Lu, Y.; Dong, H.; Zhang, Y. Economic Analysis of an Integrated Steel Plant Equipped with a Blast Furnace or Oxygen Blast Furnace. Sustainability 2023, 15, 11824. [Google Scholar] [CrossRef]
- Zhu, W.; Zhang, J.; Zong, Y.; Zhang, L.; Liu, Y.; Yan, L.; Jiao, K. Optimization Study of Annular Wear-Resistant Layer Structure for Blast Furnace Tuyere. Metals 2023, 13, 1109. [Google Scholar] [CrossRef]
- Taylor, A. Development of techniques for monitoring the raceway zone. Eur. Comm. Tech. Steel Res. 1997, 13. [Google Scholar]
- Yan, Y.; Lu, G.; Colechin, M. Monitoring and characterization of Pulverized coal flames using digital imaging techniques. Fuel 2002, 81, 647–656. [Google Scholar] [CrossRef]
- Zhang, S.F.; Wen, L.Y.; Bai, C.G.; Chen, D.; Ouyang, Q. The temperature field digitization of radiation images in blast furnace raceway. ISIJ Int. 2006, 46, 1410–1415. [Google Scholar] [CrossRef]
- Matsui, Y.; Yamaguchi, Y.; Sawayama, M.; Kitano, S.; Nagai, N.; Imai, T. Analyses on blast furnace raceway formation by micro wave reflection gunned through tuyere. ISIJ Int. 2005, 45, 1432–1438. [Google Scholar] [CrossRef]
- Salinero, J.; Gómez-Barea, A.; Tripiana, M.; Leckner, B. Measurement of char surface temperature in a fluidized bed combustor using pyrometry with digital camera. Chem. Eng. J. 2016, 288, 441–450. [Google Scholar] [CrossRef]
- Zhou, D.; Cheng, S.; Zhang, R.; Li, Y.; Chen, T. Study of the combustion behaviour and temperature of pulverised coal in a raceway zone of BF. Ironmak. Steelmak. 2017, 45, 665–671. [Google Scholar] [CrossRef]
- Zhou, D.; Cheng, S.; Zhang, R.; Li, Y.; Chen, T. Uniformity and Activity of BF Hearth by Monitoring Flame Temperature of Raceway Zone. ISIJ Int. 2017, 57, 1509–1516. [Google Scholar] [CrossRef]
- Puttinger, S.; Stocker, H. Improving Blast Furnace Raceway Blockage Detection. Part 1: Classification of Blockage Events and Processing Framework. ISIJ Int. 2019, 59, 466–473. [Google Scholar] [CrossRef]
- Puttinger, S.; Stocker, H. Improving Blast Furnace Raceway Blockage Detection. Part 2: Signal Processing of Hot Blast Pressure Data. ISIJ Int. 2019, 59, 474–480. [Google Scholar] [CrossRef]
- Puttinger, S.; Stocker, H. Improving Blast Furnace Raceway Blockage Detection. Part 3: Visual Detection Based on Tuyere Camera Images. ISIJ Int. 2018, 59, 481–488. [Google Scholar] [CrossRef]
- Wang, Y.; Huang, P.; Yang, G. A Visual PCI Blockage Detection in Blast Furnace Raceway. ISIJ Int. 2020, 60, 519–527. [Google Scholar] [CrossRef]
- Huang, P.; Zhao, J.; Wang, Y. A visual detection method for PCI blockage and coke size distribution in tuyere raceway. Ironmak. Steelmak. 2020, 48, 919–926. [Google Scholar] [CrossRef]
- Zhou, D.; Cheng, S. Measurement study of the PCI process on the temperature distribution in raceway zone of blast furnace by using digital imaging techniques. Energy 2019, 174, 814–822. [Google Scholar] [CrossRef]
- Cheng, X.; Cheng, S.; Liu, K.; Zhou, D. Measurement study of preheated pulverized coal injection on combustion in a blast furnace raceway by visual detection. Fuel 2020, 271, 117626. [Google Scholar] [CrossRef]
- Zhou, D.; Xu, K.; Bai, J.; He, D. On-line detecting the tuyere coke size and temperature distribution of raceway zone in a working blast furnace. Fuel 2022, 316, 123349. [Google Scholar] [CrossRef]
Figure 1.
Online detection system of tuyere combustion flame temperature of blast furnace. The circle represent the soft melt zone of blast furnace.
Figure 1.
Online detection system of tuyere combustion flame temperature of blast furnace. The circle represent the soft melt zone of blast furnace.
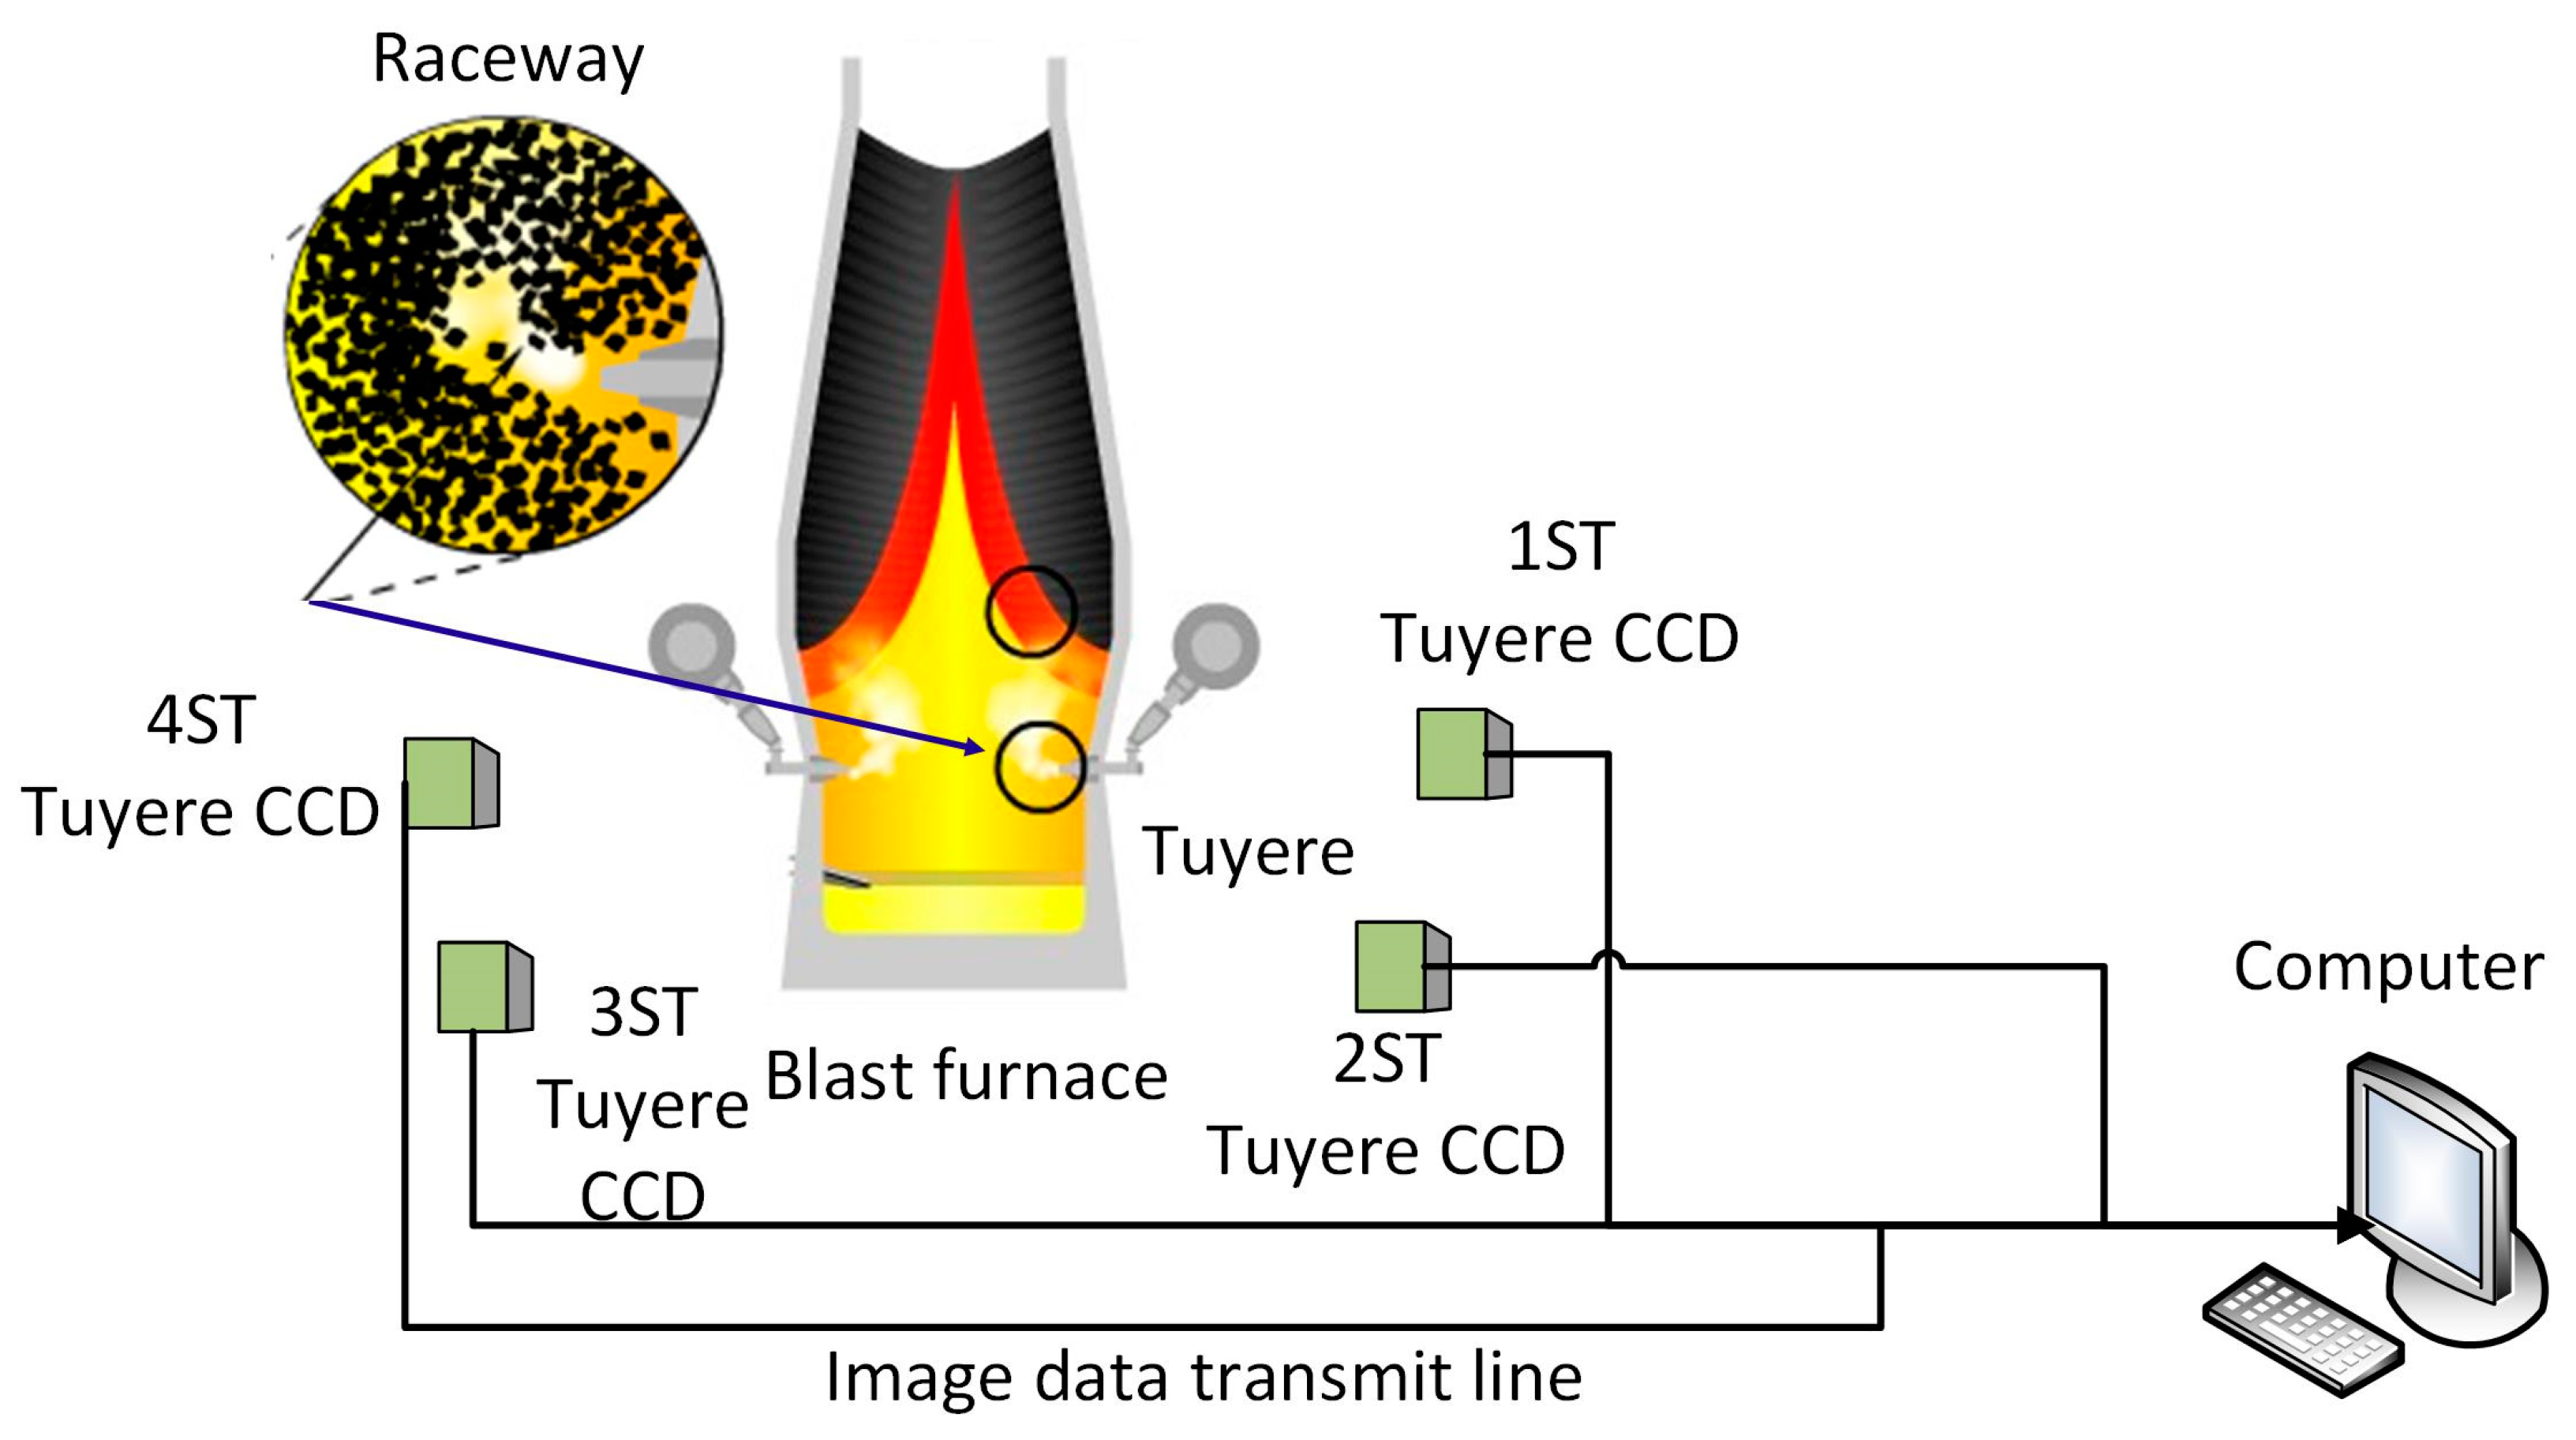
Figure 2.
Calibration images under different temperatures.
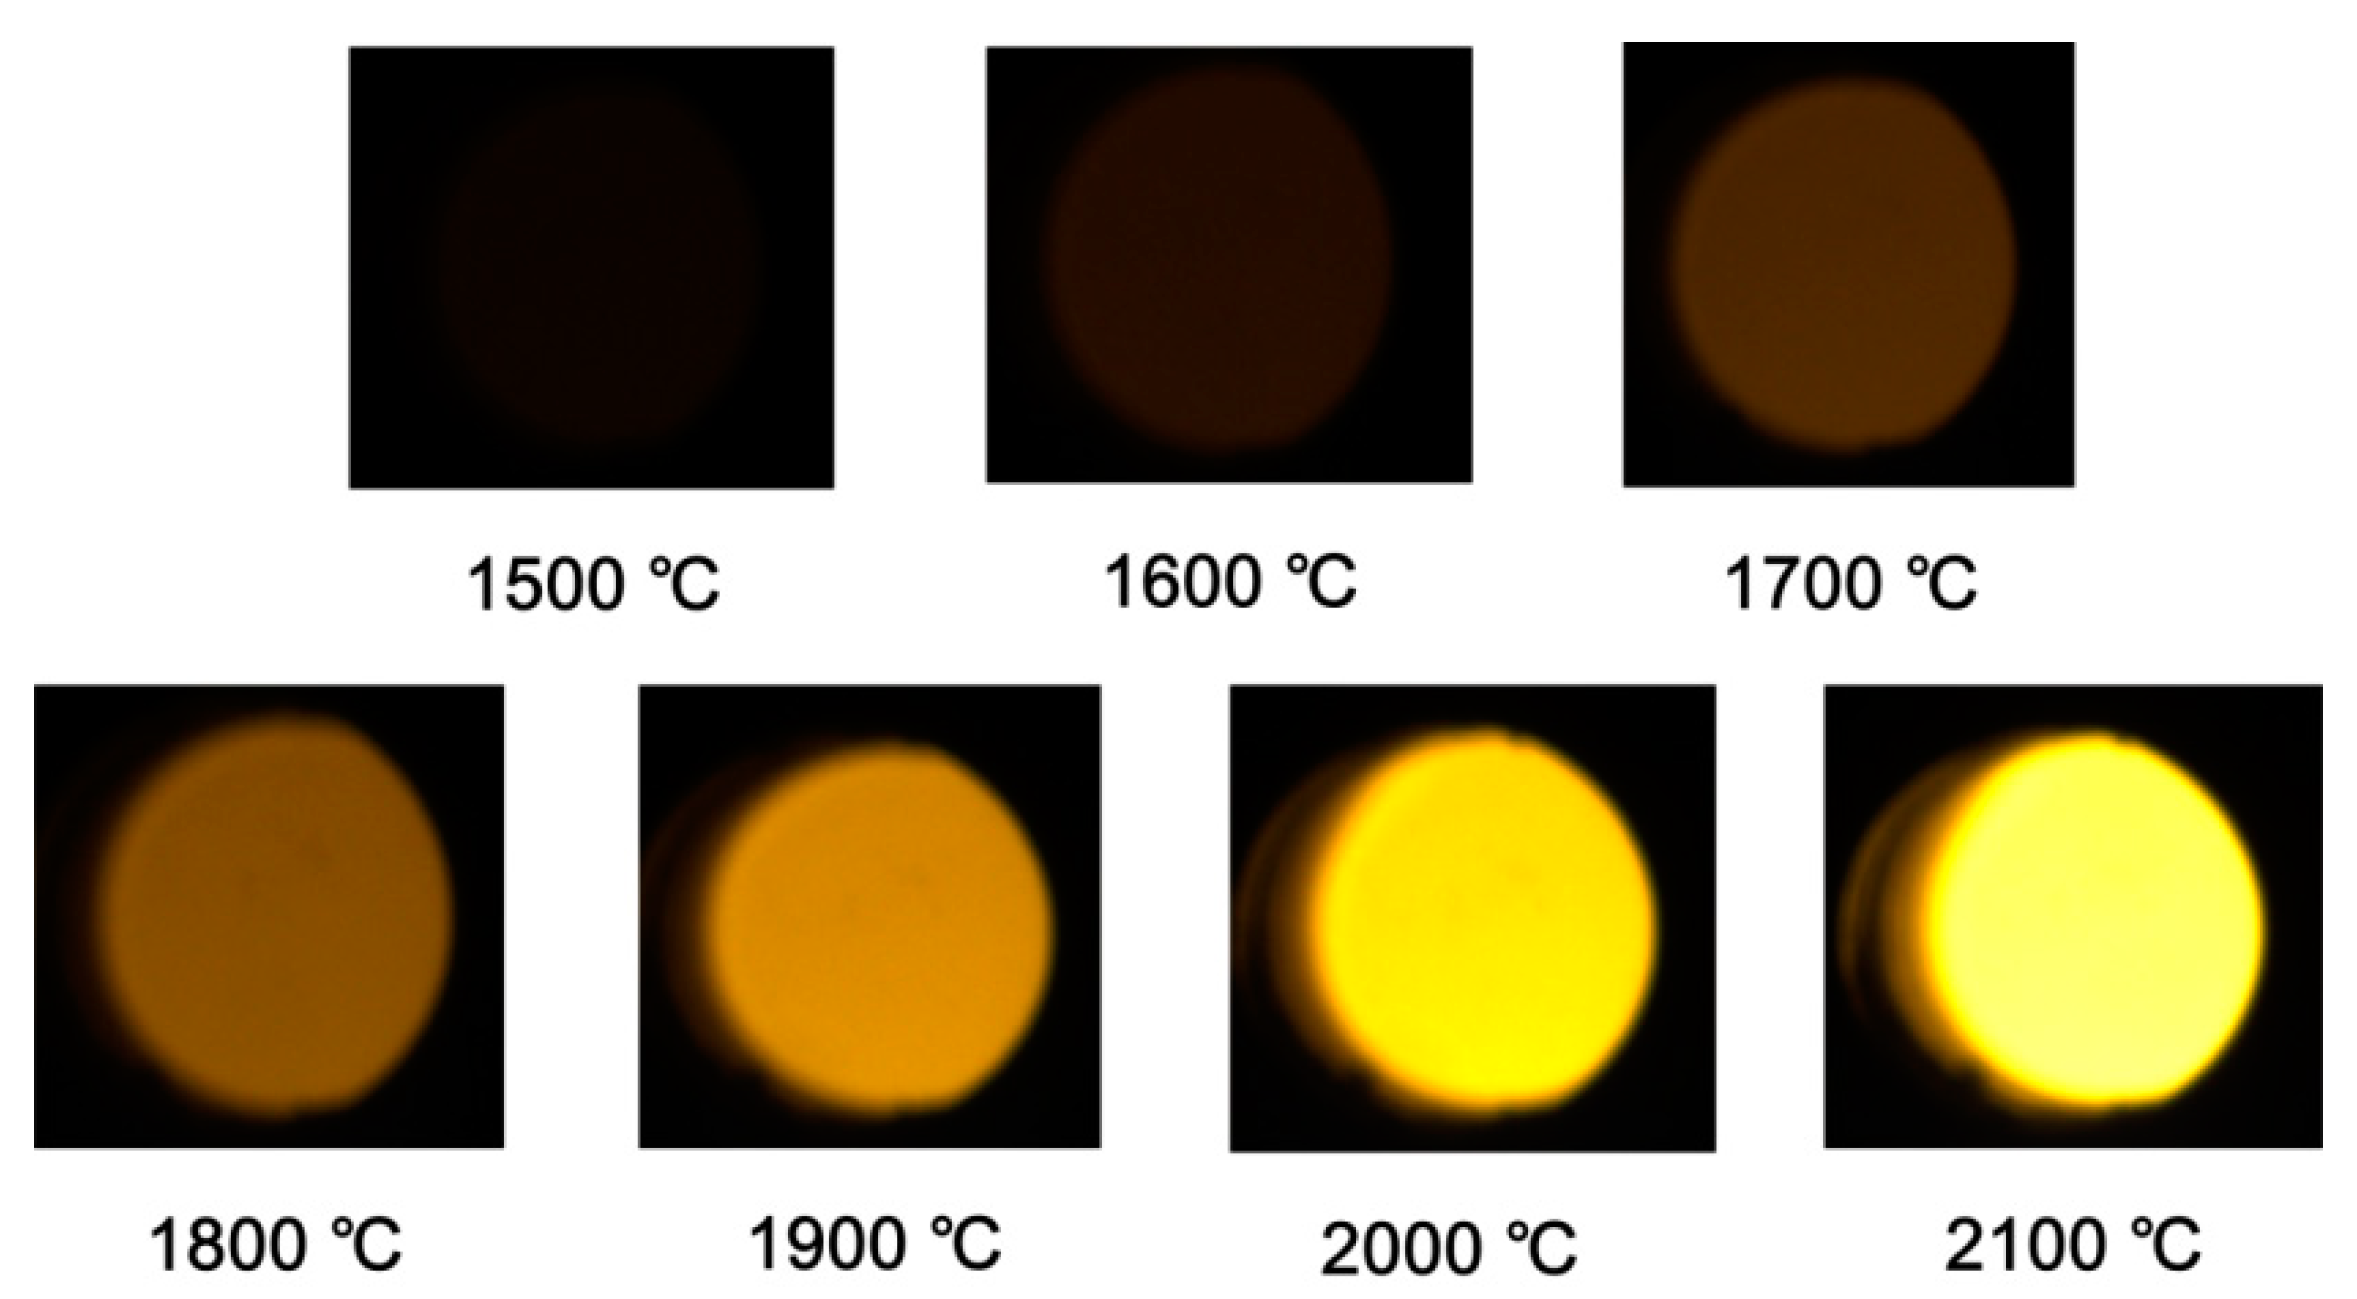
Figure 3.
Calibration results of gray levels and calibration coefficients of the calculation model under different temperatures.
Figure 3.
Calibration results of gray levels and calibration coefficients of the calculation model under different temperatures.

Figure 4.
Flowchart of tuyere combustion flame temperature calculations.
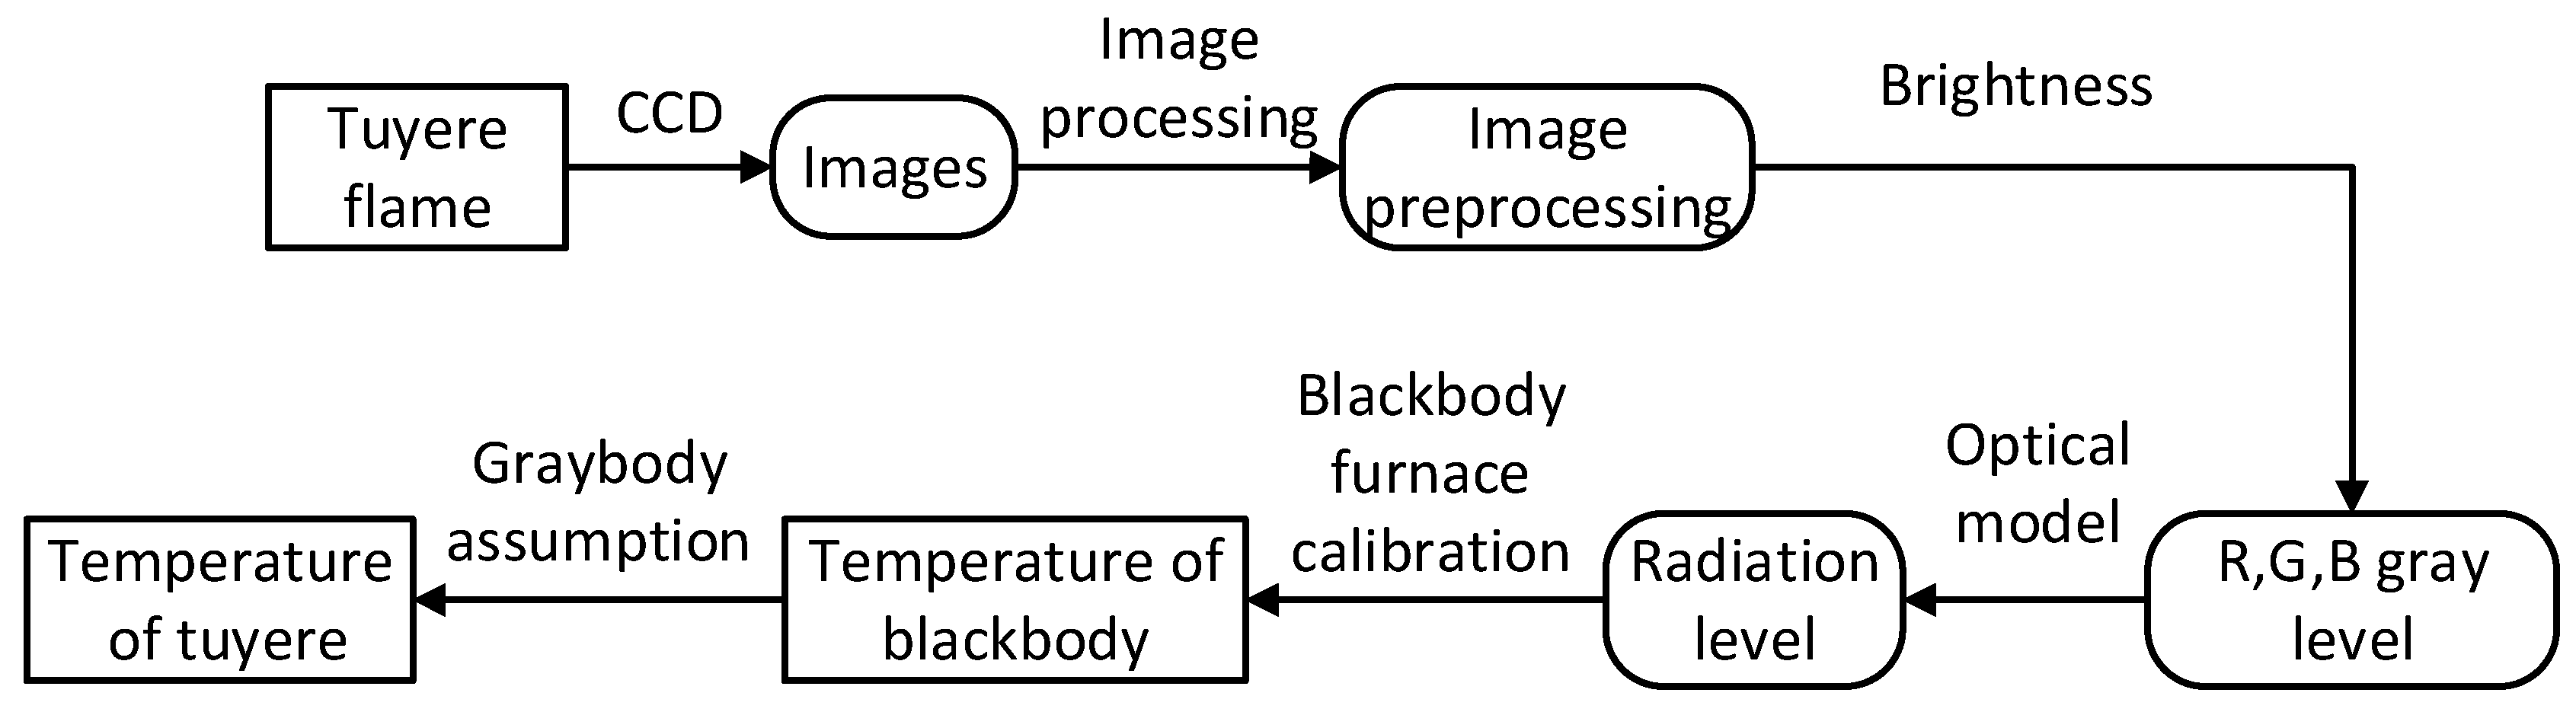
Figure 5.
The images of tuyere flame and temperature distribution.
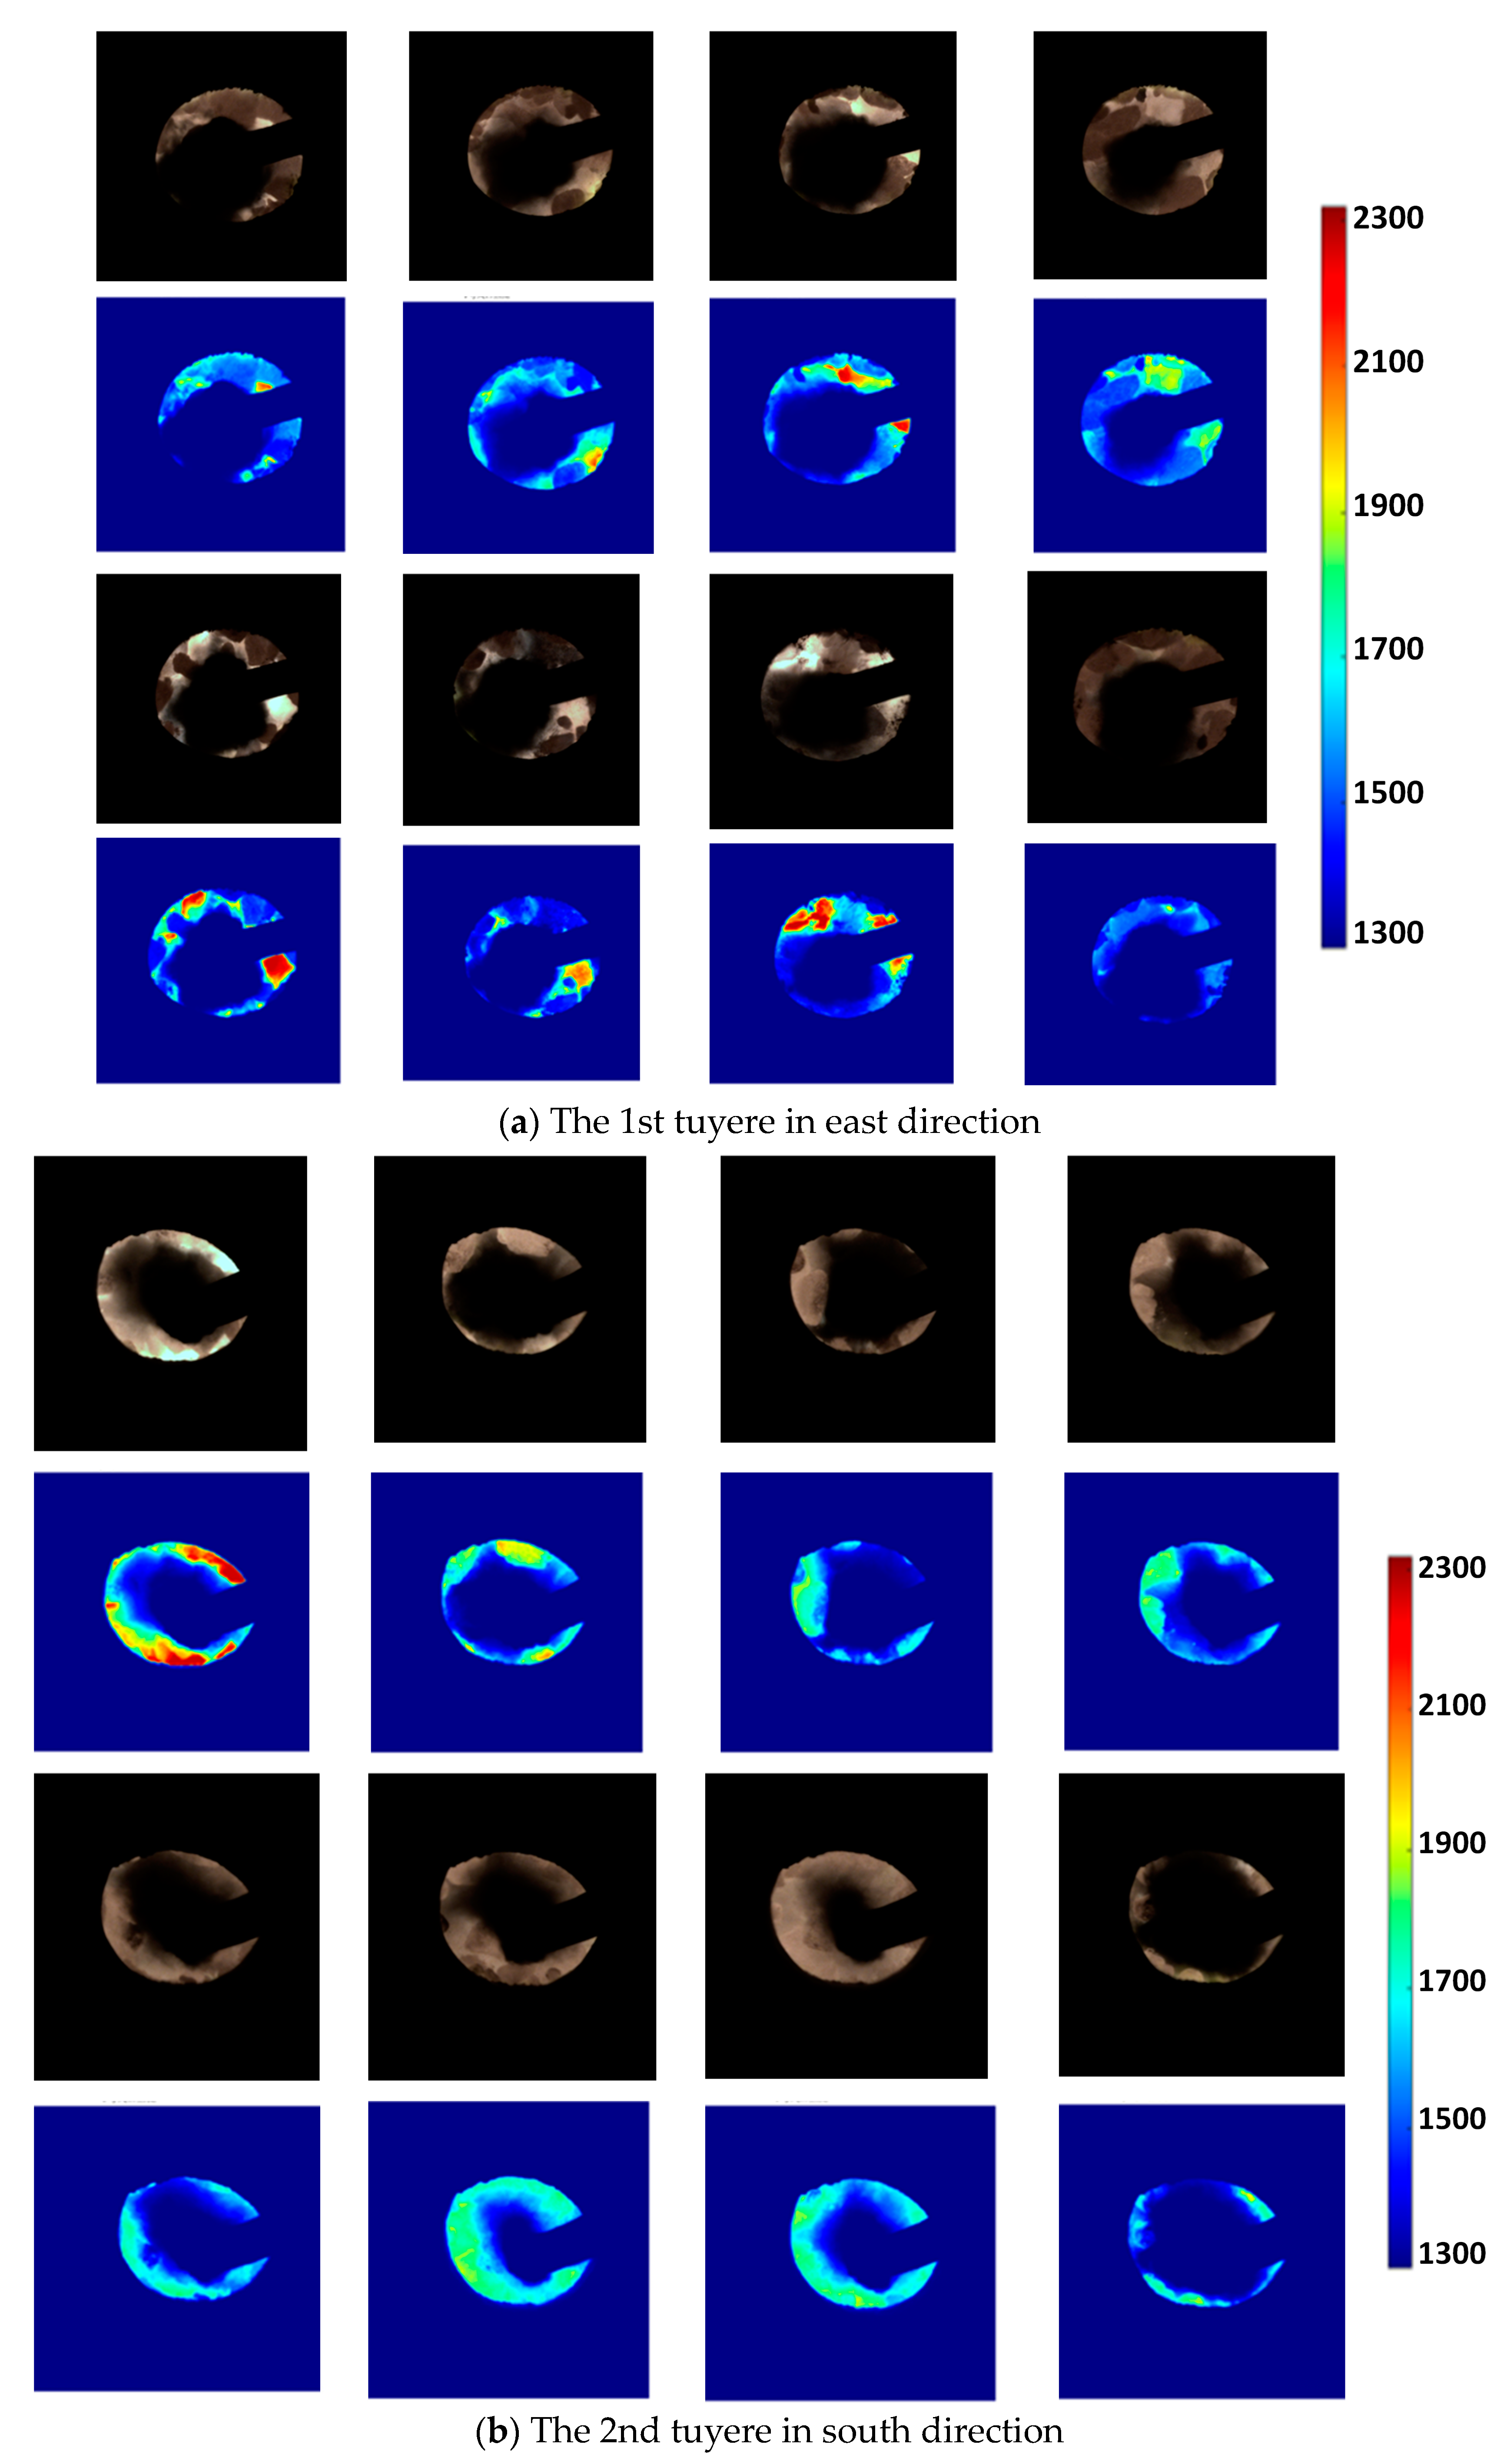
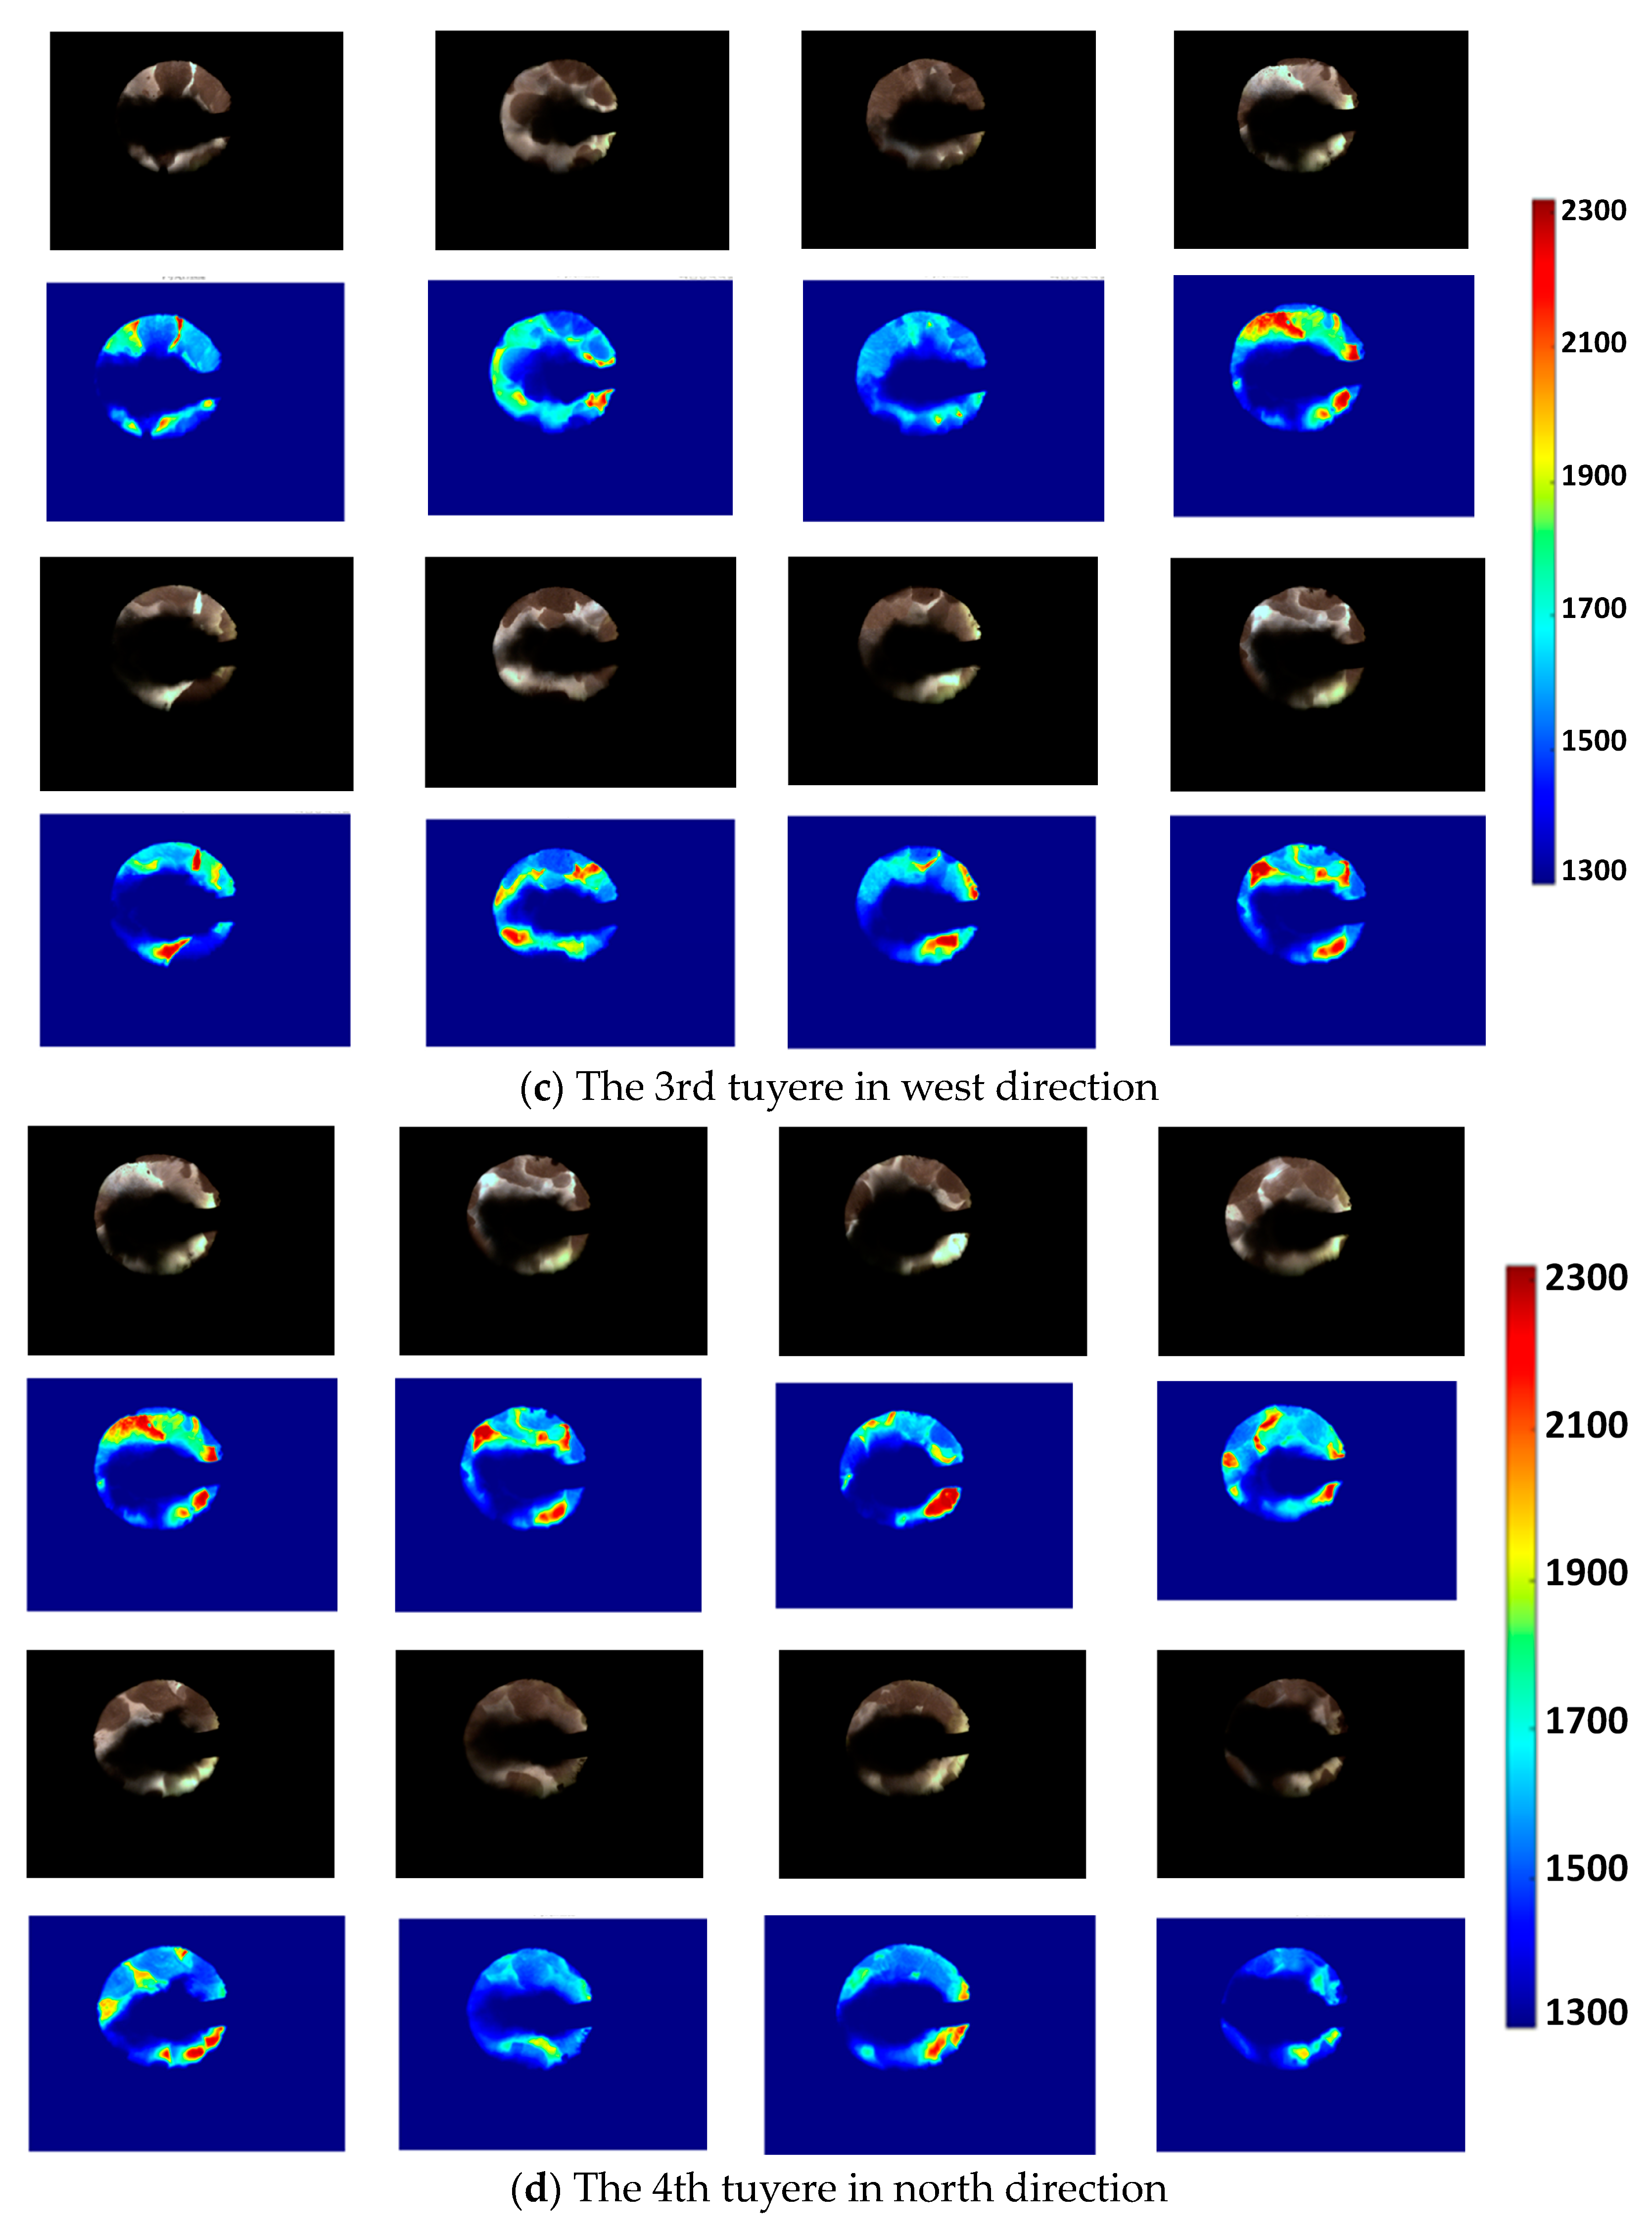
Figure 6.
The average estimated flame temperature during one minute in the tuyeres.
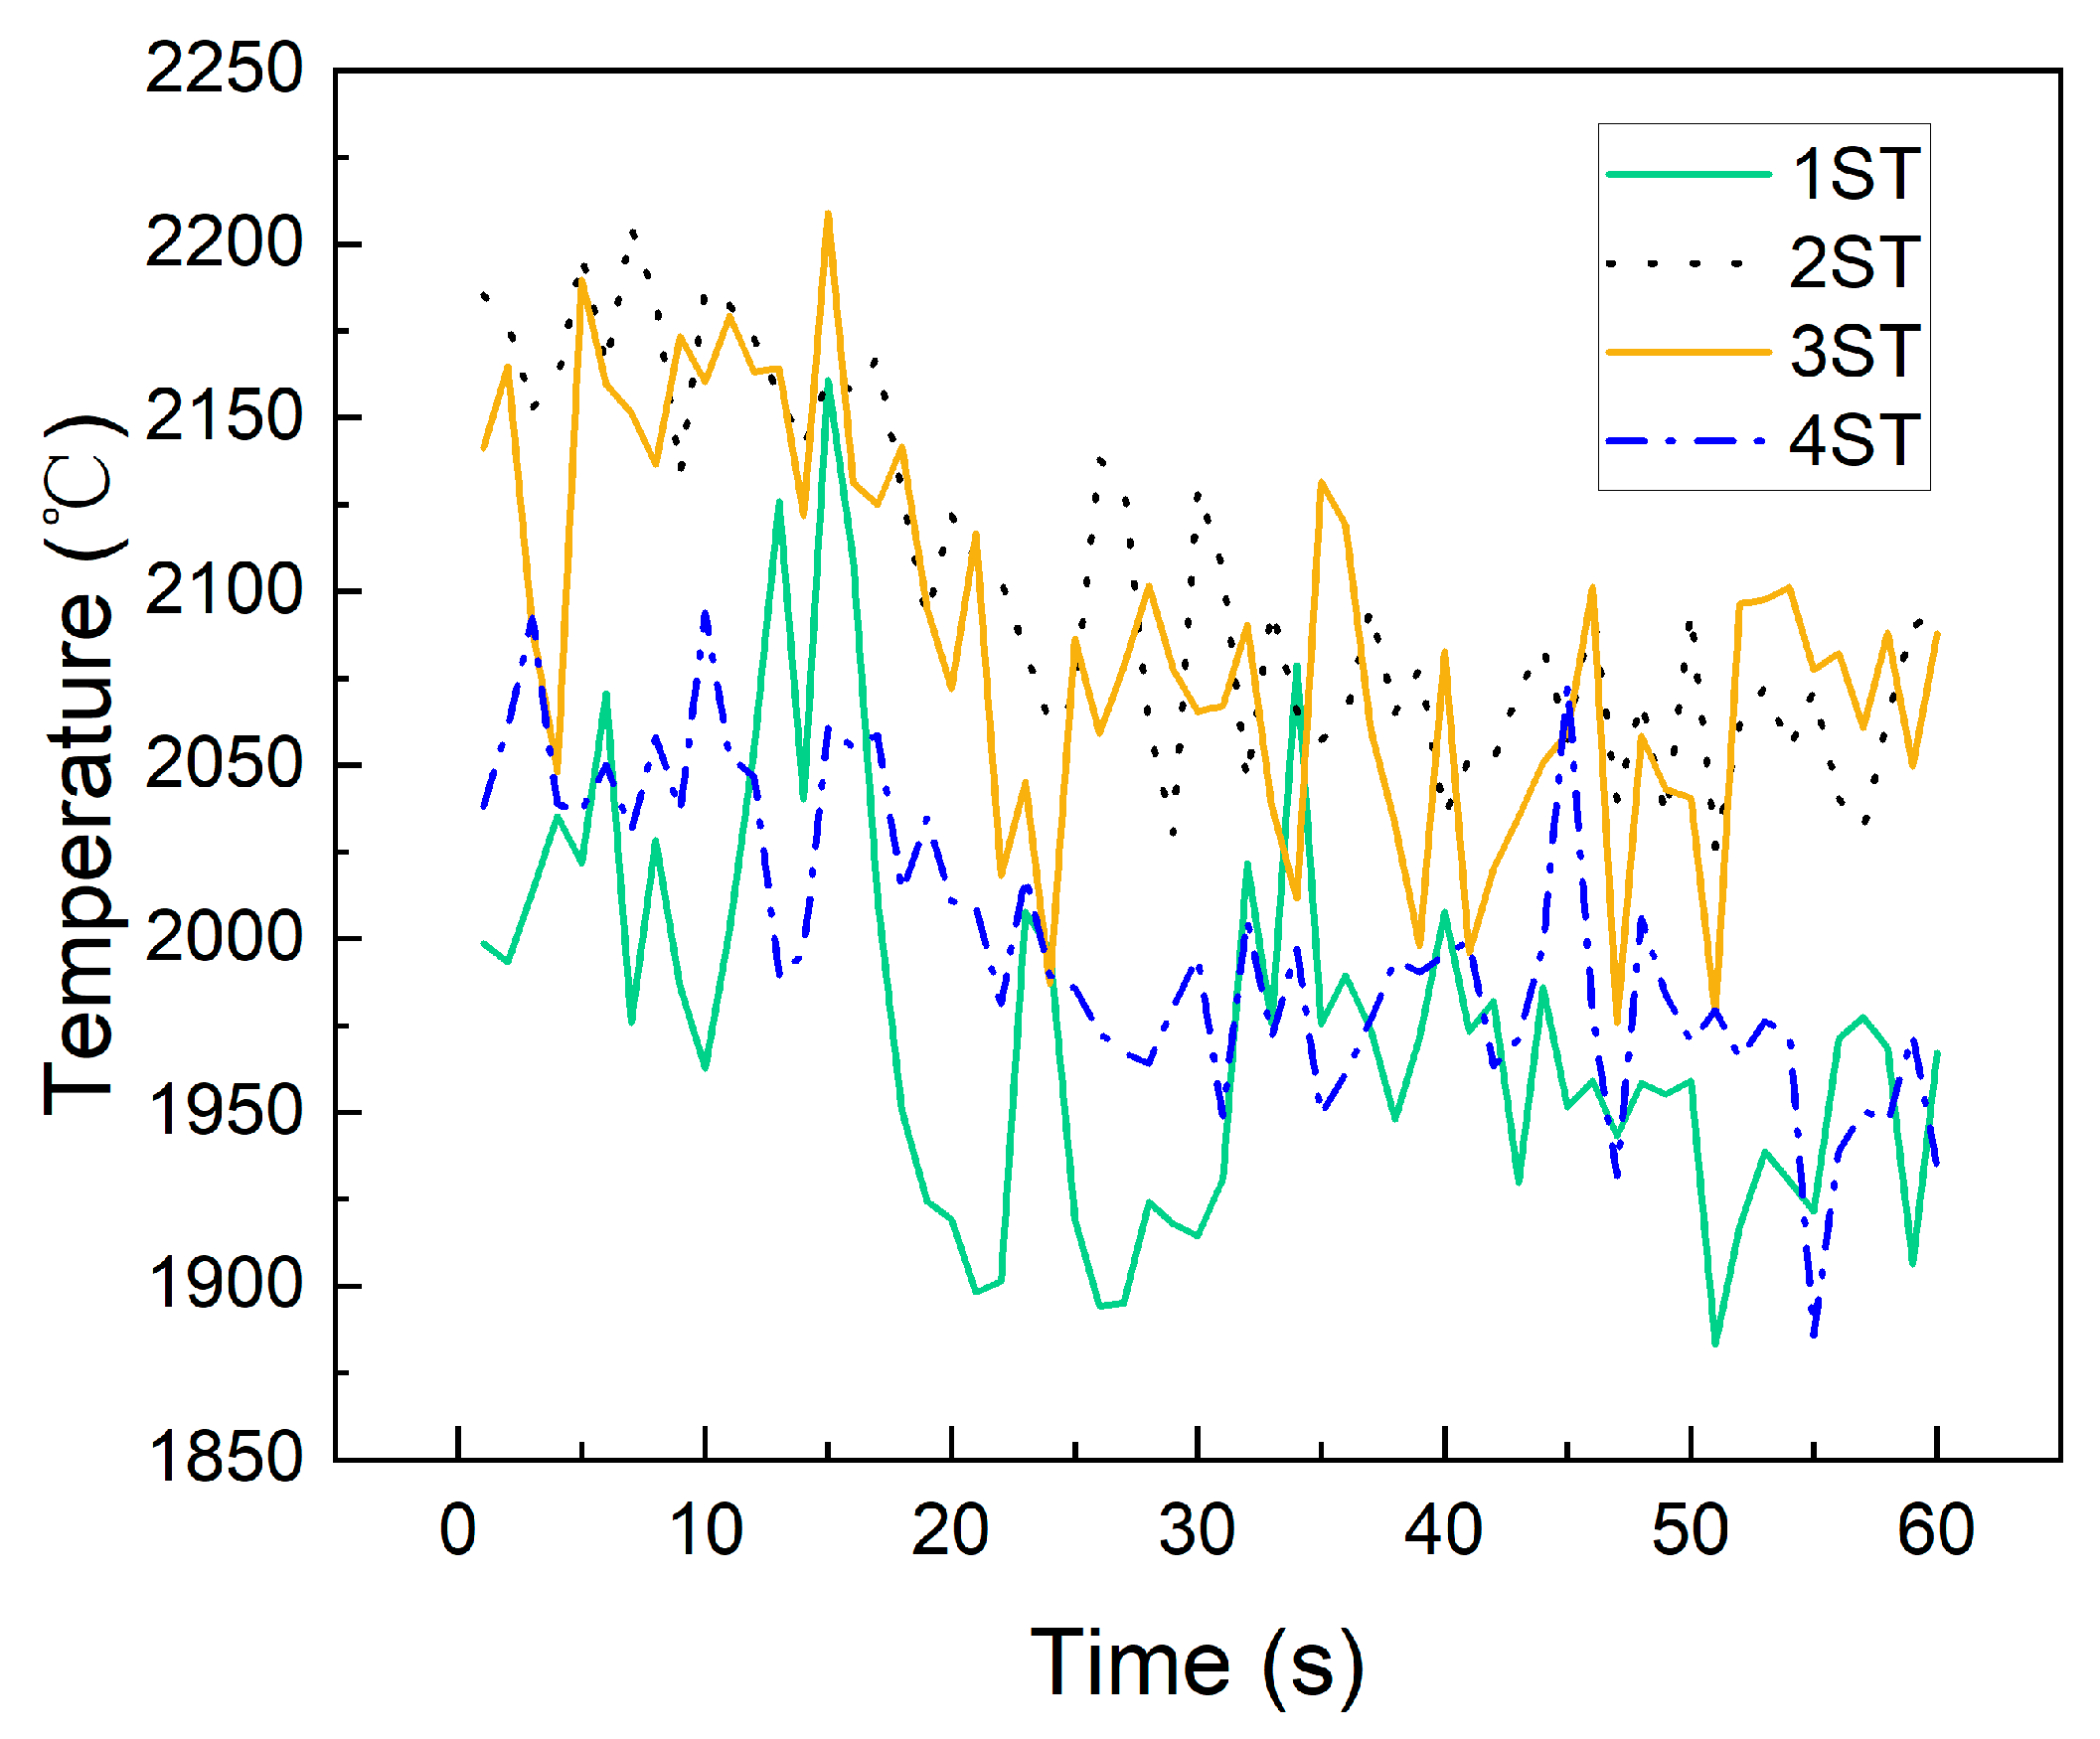
Figure 7.
The average temperature at different times within a 24 h period.

Figure 8.
The average tuyere combustion flame temperature variation with blast furnace lower-part operational parameters within a 24 h period.
Figure 8.
The average tuyere combustion flame temperature variation with blast furnace lower-part operational parameters within a 24 h period.


Table 1.
The main operation parameters of 500 m3 blast furnace under test condition.
| Volume (m3) | Daily Production (t) | Coke Rate (kg/t) | PCI Rate (kg/t) | Tuyere Number | Tuyere Diameter (m) | Blast Volume (m3/min) | Raw Iron Content (%) | Blast Temperature (°C) | Oxygen Enrichment (%) |
|---|---|---|---|---|---|---|---|---|---|
| 500 | 2150 | 420 | 138 | 14 | 0.12 | 1600 | 57 | 981 | 5.83 |
| Coke | Fixed Carbon (%) | Ash (%) | Volatile (%) | M40 (%) | M10 (%) | Diameter (mm) | |||
| Coke Constituents | 2.32 | 18.37 | 47.77 | 25.94 | 5.60 | 47.94 | |||
| Hot metal | Si (%) | S (%) | Mn (%) | P (%) | Ti (%) | V (%) | Temperature (°C) | ||
| Hot metal Constituents | 0.32 | 0.038 | 0.23 | 0.098 | 0.26 | 0.303 | 1425.9 | ||
| Slag | SiO2 (%) | CaO (%) | MgO (%) | S (%) | Al2O3 (%) | MnO (%) | TiO2 (%) | V2O5 (%) | R2 (-) |
| Slag Constituents | 28.22 | 34.32 | 9.3 | 0.816 | 13 | 0.63 | 9.55 | 0.227 | 1.22 |
PCI rate: pulverized coal injection rate; M40: metallurgical coke crushing strength, that is, the ability of coke to resist crushing; M10: metallurgical coke wear strength, that is, the ability of coke to resist wear; R2: alkalinity means the ratio of basic oxides to acidic oxides in the slag, R2 = CaO/SiO2.
Table 2.
The maximum and average grayscale value in the calibration images under different temperatures.
Table 2.
The maximum and average grayscale value in the calibration images under different temperatures.
| R-Channel Image | G-Channel Image | B-Channel Image | ||||
|---|---|---|---|---|---|---|
| MGV | AGV | MGV | AGV | MGV | AGV | |
| 1500 °C | 14 | 11.8 | 7 | 5.39 | 1 | 0.089 |
| 1600 °C | 27 | 23.04 | 15 | 12.58 | 2 | 0.65 |
| 1700 °C | 51 | 46.17 | 30 | 26.72 | 4 | 2.14 |
| 1800 °C | 86 | 78.07 | 55 | 49.63 | 7 | 4.84 |
| 1900 °C | 142 | 131.85 | 97 | 90.27 | 14 | 10.95 |
| 2000 °C | 214 | 203.1 | 158 | 148.03 | 27 | 21.94 |
| 2100 °C | - | - | 255 | 243.6 | 56 | 48.85 |
MGV: maximum grayscale value, AGV: average grayscale value.
Table 3.
The maximum and average grayscale values in the tuyere images at different exposure times.
| Exposure Time/μs | 1st Tuyere | 2nd Tuyere | 3rd Tuyere | 4th Tuyere | ||||
|---|---|---|---|---|---|---|---|---|
| MGV | AGV | MGV | AGV | MGV | AGV | MGV | AGV | |
| 10 | 116 | 18.89 | 111 | 21.80 | 154 | 36.06 | 103 | 15.11 |
| 30 | 142 | 19.11 | 166 | 30.25 | 183 | 49.07 | 139 | 17.43 |
| 50 | 201 | 28.73 | 205 | 38.07 | 209 | 55.72 | 194 | 26.45 |
| 70 | 226 | 33.29 | 243 | 54.08 | 242 | 59.08 | 183 | 33.39 |
| 90 | 255 | 42.74 | 255 | 55.55 | 255 | 62.08 | 255 | 40.46 |
| 110 | 255 | 46.66 | 255 | 68.87 | 255 | 82.71 | 255 | 48.25 |
Table 4.
The average blast volume and PCI rate of blast furnace at different times within a 24 h period.
Table 4.
The average blast volume and PCI rate of blast furnace at different times within a 24 h period.
| Hours/h | 1 | 2 | 3 | 4 | 5 | 6 | 7 | 8 | 9 | 10 | 11 | 12 |
|---|---|---|---|---|---|---|---|---|---|---|---|---|
| Average Blast Volume/(m3/min) | 1363 | 1456 | 1467 | 1479 | 1541 | 1489 | 1521 | 1532 | 1536 | 1525 | 1313 | 1501 |
| Average PCI Rate/(kg/t) | 116 | 121 | 135 | 135 | 141 | 161 | 136 | 142 | 151 | 144 | 155 | 138 |
| Hours/h | 13 | 14 | 15 | 16 | 17 | 18 | 19 | 20 | 21 | 22 | 23 | 24 |
| Average Blast Volume/(m3/min) | 1521 | 1531 | 1525 | 1530 | 1541 | 1492 | 1518 | 1518 | 1573 | 1576 | 1468 | 1397 |
| Average PCI Rate/(kg/t) | 142 | 158 | 152 | 153 | 149 | 149 | 140 | 137 | 146 | 144 | 137 | 137 |
Disclaimer/Publisher’s Note: The statements, opinions and data contained in all publications are solely those of the individual author(s) and contributor(s) and not of MDPI and/or the editor(s). MDPI and/or the editor(s) disclaim responsibility for any injury to people or property resulting from any ideas, methods, instructions or products referred to in the content. |
© 2024 by the authors. Licensee MDPI, Basel, Switzerland. This article is an open access article distributed under the terms and conditions of the Creative Commons Attribution (CC BY) license (https://creativecommons.org/licenses/by/4.0/).
Share and Cite
MDPI and ACS Style
Cai, H.; Zhu, Z.; Zhou, D. Study of Tuyere Combustion Flame Temperature in Vanadium and Titanium Blast Furnaces by Machine Vision and Colorimetric Thermometry. Metals 2024, 14, 499. https://doi.org/10.3390/met14050499
AMA Style
Cai H, Zhu Z, Zhou D. Study of Tuyere Combustion Flame Temperature in Vanadium and Titanium Blast Furnaces by Machine Vision and Colorimetric Thermometry. Metals. 2024; 14(5):499. https://doi.org/10.3390/met14050499
Chicago/Turabian StyleCai, Haoyu, Ziming Zhu, and Dongdong Zhou. 2024. "Study of Tuyere Combustion Flame Temperature in Vanadium and Titanium Blast Furnaces by Machine Vision and Colorimetric Thermometry" Metals 14, no. 5: 499. https://doi.org/10.3390/met14050499
Note that from the first issue of 2016, this journal uses article numbers instead of page numbers. See further details here.