Article

Nano-ZnO Particles’ Effect in Improving the Mechanical Response of Mg-3Al-0.4Ce Alloy

1
Department of Mechanical Engineering, National University of Singapore, 9 Engineering Drive 1, Singapore 117576, Singapore
2
Department of Mechanical Engineering, University of Akron, Akron, OH 44325, USA
*
Author to whom correspondence should be addressed.
Metals 2016, 6(11), 276; https://doi.org/10.3390/met6110276
Submission received: 13 October 2016 / Revised: 30 October 2016 / Accepted: 9 November 2016 / Published: 11 November 2016
(This article belongs to the Special Issue Metal Matrix Composites)

Abstract

:
Magnesium based nanocomposites, due to their excellent dimensional stability and mechanical integrity, have a lot of potential to replace the existing commercial Al alloys and steels used in aerospace and automotive applications. Mg-Al alloys are commercially used in the form of AZ (magnesium-aluminum-zinc) and AM (magnesium-aluminum-manganese) series in automobile components. However, the Mg17Al12 phase in Mg-Al alloys is a low melting phase which results in a poor creep and high temperature performance of the alloys. Rare earth additions modify the phase and hence improve the properties of the materials. In this paper, Ce and nano ZnO particles were added to Mg-Al alloys to attain a favorable effect on their properties. The developed materials exhibited promising properties in terms of thermal expansion coefficient (CTE), hardness, and tensile strength. Further, the ZnO addition refined the microstructure and helped in obtaining a uniform distribution, however without grain size refinement. The increased addition of ZnO and the improvement in the distribution led to an enhancement in the properties, rendering the materials suitable for a wide spectrum of engineering applications.

Graphical Abstract

1. Introduction

The extraction and utilization of magnesium (Mg) in significant amounts started only in the 20th century, despite the fact that the discovery of Mg by Sir H. Davy dates back to 1808 [1]. Mg, with a density of 1.738 g/cm3, is one of the lightest engineering and structural metals available on the earth, with its density being about two-thirds that of aluminium and one-fourth that of steel [2]. Therefore, there is an increasing interest in the usage of Mg in certain engineering industries, specifically in the automobile, electronic, and aviation industries. In the above mentioned sectors, for material selection, weight of the components is one of the most crucial criteria, thus giving light metals such as Mg a lot of potential for applications. Besides low density, Mg based materials also display other beneficial properties such as specific mechanical strength, excellent damping capacity, good castability, machinability, thermal stability, weldability, and resistance to electromagnetic radiation [2]. However, despite these advantages, Mg has limited ductility under tensile deformation loads, poor elastic modulus, and low resistance to creep at high temperatures. As Mg has a Hexagonal Close Packed (HCP) crystal structure, at ambient temperatures, deformation is, thus, confined to a few modes such as basal slip and twinning. Due to fracture (transgranular and intergranular) at basal planes or twin zones, pure Mg shows a tendency for low ductility [1]. There is also a tension-compression yield asymmetry, and a significant difference in tensile and compressive yield strengths exhibited by Mg, which narrows the opportunities of Mg in structural applications. To circumvent these limitations, Mg is alloyed with other elements, such as aluminium, zinc, zirconium, rare earths, etc., to improve strength, ductility, corrosion resistance, and other properties [1].
Among different alloying constituents, Al addition seems to have favourable effects on magnesium as it leads to increases in strength and ductility. Despite several extensive research studies and characterizations on magnesium-aluminium alloys, the main focus was laid on specific materials, such as AZ31, AZ61, and AZ91 [1]. Other potential alloying elements with Mg would be rare earth (RE) metals, which have been known for many years [1]. Furthermore, RE metals also are promising for increasing strength and ductility [3] when alloyed to Mg. However, one limitation of RE metals is the high cost, limiting their usage. Furthermore, the solubility of RE metals in Mg is not very high, hence, increase in the content of solute RE concentration reduces strength [4]. The results of literature studies showed that the addition of 0.4% Ce [5] yields the best properties of tensile strength and ductility and no research has been done to study the effect of reinforcement on Mg-Al-Ce alloys. Furthermore, reinforcement with nano-particulates is also another possibility to improve the properties of Mg. Previously reported literature shows that the improvement in strength and ductility was highest with the addition of nano-scale ZnO [6]. Furthermore, it may also be noted that the ZnO nanoparticle addition helped in reducing the tension-compression yield asymmetry (tensile yield strength/compressive yield strength) [6].
Accordingly, the aim of the current work was to develop Mg-Al-RE nanocomposites through the integration of aluminium, nano zinc oxide, and a rare earth element (Ce) using the Disintegrated Melt Deposition (DMD) technique followed by hot extrusion. Microstructure and mechanical properties are studied and critically analysed. The developed materials are expected to be promising in many engineering applications that include high performance automobile components such wheels (by replacing currently used AM60 alloys), transmission case, bumper beam, etc.

2. Materials and Methods

2.1. Materials

Mg was obtained in the form of turnings from Acros Organics, NJ, USA, with 99% purity. Al was obtained in powder form with a size of 7–15 µm from Alfa Aesar, with 99.5% purity. Ce was incorporated by using Mg-30 wt. % Ce master alloy procured from Sunrelier Metal Co., Limited, Pudong, Shanghai, China. ZnO was obtained in the form of powder from Nanostructured and Amorphous Materials (Houston, TX, USA). The powder exhibited a particle size of less than 200 nm and an average particle size of 90 nm.

2.2. Primary Processing

Synthesis of the Mg-3Al-0.4Ce alloy using magnesium turnings, Al powder, and Mg-Ce master alloy was carried out using the disintegrated melt deposition (DMD) technique [7]. Synthesis of the alloy involved heating the Mg turnings with the addition of respective weights of Al powder and Mg-Ce master alloy in a graphite crucible to 750 °C using an electrical resistance furnace and an atmosphere of inert argon gas. The superheated melt was then stirred (at 465 rpm for 5 min) and bottom-poured into a steel mold (following disintegration by two jets of argon gas oriented normal to the melt stream). This technique displays the advantages of spray processing and conventional casting i.e., utilizing higher superheat temperatures and lower impinging gas jet velocities to produce the bulk composite material. The advantage of using this technique is to obtain a uniform distribution of reinforcements, fine equiaxed grains, and low porosity in the materials due to the rapid solidification of the atomized melt leading to an improvement in properties. An ingot of 40 mm diameter was obtained following the deposition stage. This technique was repeated for the other compositions, which contained ZnO nanoparticles.

2.3. Secondary Processing

2.3.1. Pre-Extrusion

The 40 mm diameter ingots, obtained from casting, were machined down to a diameter of 36 mm. Further, billets with lengths of approximately 45 mm were cut and machined.

2.3.2. Extrusion

The billets were, first, soaked at 400 °C for 1 h in a furnace, before extrusion. Extrusion was done at 350 °C on a 150 tonne hydraulic press. An extrusion ratio of 20.25:1 was used to produce rods of 8 mm diameter.

2.3.3. Post-Extrusion

After extrusion, the rods were machined to the required sample dimensions: dog bone shaped tensile test specimens with a gauge diameter of 5 mm. Samples were also prepared for other characterisation tests.

2.4. Characterisation

2.4.1. Density and Porosity

Density measurements were performed in accordance with the Archimedes’ principle on eight randomly selected samples taken from the extruded rods. The experimental density measurements involved weighing samples in air and in distilled water. Theoretical densities of materials were calculated assuming the samples are fully dense to measure the volume percentage of porosity in the end materials. The porosity was calculated by using the theoretical and experimental densities. An electronic balance (A&D HM-202, Bradford, MA, USA) with an accuracy of ±0.0001 g was used for all the measurements.

2.4.2. Microstructure

Microstructural characterization studies were conducted on metallographically polished extruded samples to investigate morphological characteristics of grains, reinforcement distribution, and interfacial integrity between the matrix and reinforcement. Picric acid was used as the etching solution. The sample was then analysed using the Leica DM2500 M metallographic optical microscope equipped with a Leica E3 digital colour camera (procured from Baldock, UK). Scion image analysis software was used to determine the grain size and morphology of the samples. The presence and distribution of the secondary phases as well as reinforcement was studied using the JEOL JSM-5600LV Scanning Electron Microscope (SEM) (procured from Tokyo, Japan).

2.4.3. X-ray Diffraction

X-ray diffraction (XRD) analysis of the samples was performed using the automated Shimadzu LAB-X XRD-6000 X-ray diffractometer (procured from Tokyo, Japan). The specimens, approximately 5 mm in height, were exposed to CuKα radiation (λ = 1.54056 Å) at a scanning speed of 2°/min. The scanning range was 20°–80° for all samples. The graph intensity against 2θ (θ represents the Bragg angle) was obtained, illustrating peaks at different Bragg angles. The Bragg angles corresponding to different peaks were noted, and the values of interplanar spacing (d-spacing) obtained from the computerized output were compared with the standard values from the Powder Diffraction File (PDF).

2.4.4. Coefficient of Thermal Expansion

Coefficient of Thermal Expansion (CTE) values were measured using a thermo mechanical analysis instrument “INSEIS TMA PT 1000LT” (procured from Tokyo, Japan). A heating rate of 5 °C/min was maintained with an argon flow rate of 0.1 lpm. Using an alumina probe, the displacement of the test samples was measured as a function of temperature.

2.4.5. Microhardness

Microhardness measurements were obtained using the Shimadzu HMV automatic digital microhardness tester (procured from Tokyo, Japan) with a Vickers indenter (square-based pyramidal-shaped diamond indenter with a face angle of 136°). Cylindrical samples were prepared and polished. Tests were conducted in compliance with ASTM test method E384-11e1. A 25 g force load was applied with a dwell time of 15 s. Three samples were prepared per composition and 10 readings were taken per sample for an accurate and consistent result. Indentations and the microhardness readings were recorded in Vickers Hardness number (HV).

2.4.6. Tensile Test

Tensile tests were performed using the MTS 810 machine (procured from Eden Prairie, MN, USA). Specimens of 5 mm diameter and 25 mm gauge length were prepared. Tests were conducted in compliance with ASTM test method E8M-13a. The crosshead speed was 2.54 × 10⁻⁴ m/min−1 (strain rate: 0.01 min−1). Five samples were tested per composition to obtain more accurate and consistent results. Fractured specimens were studied under SEM to analyse the fracture features.

3. Results and Discussion

3.1. Density and Porosity

The results of addition of ZnO nano-particulates show an increase in the density, but only marginally. While porosity values do not manifest any particular trend, the values remained relatively insignificant. The results for density and porosity can be found in Table 1. Within the synthesised materials, a positive trend was noticed with the addition of ZnO nano-particulates in terms of density. This is expected to be due to the high density of ZnO (5.61 g/cc) as compared to that of Mg. Furthermore, the addition of increasing amounts of ZnO nano-particulates increased the porosity of the alloy. The same trend was noticed in other studies on nano-composites [7]. The highest porosity was recorded for the Mg-3Al-0.4Ce-2.5ZnO nanocomposite. This is due to the possible clustering effects caused by the increased addition of nano-reinforcements (a limitation of the casting technique). Nevertheless, the absolute porosity values are relatively low, with the highest recorded porosity value being about 1%. Thus, obtaining nanocomposites with <1% porosity was achieved and is accredited to the secondary processing (extrusion and the extrusion ratio).

3.2. Microstructure/Phase Analysis

3.2.1. Grain Size Analysis

Nearly similar grain morphology was noticed when the samples were studied under the optical microscope. The results and images of the grain size and morphology are shown in Table 1 and Figure 1a–d. The addition of ZnO did not affect the grain size of the monolithic alloy, considering the standard deviation.

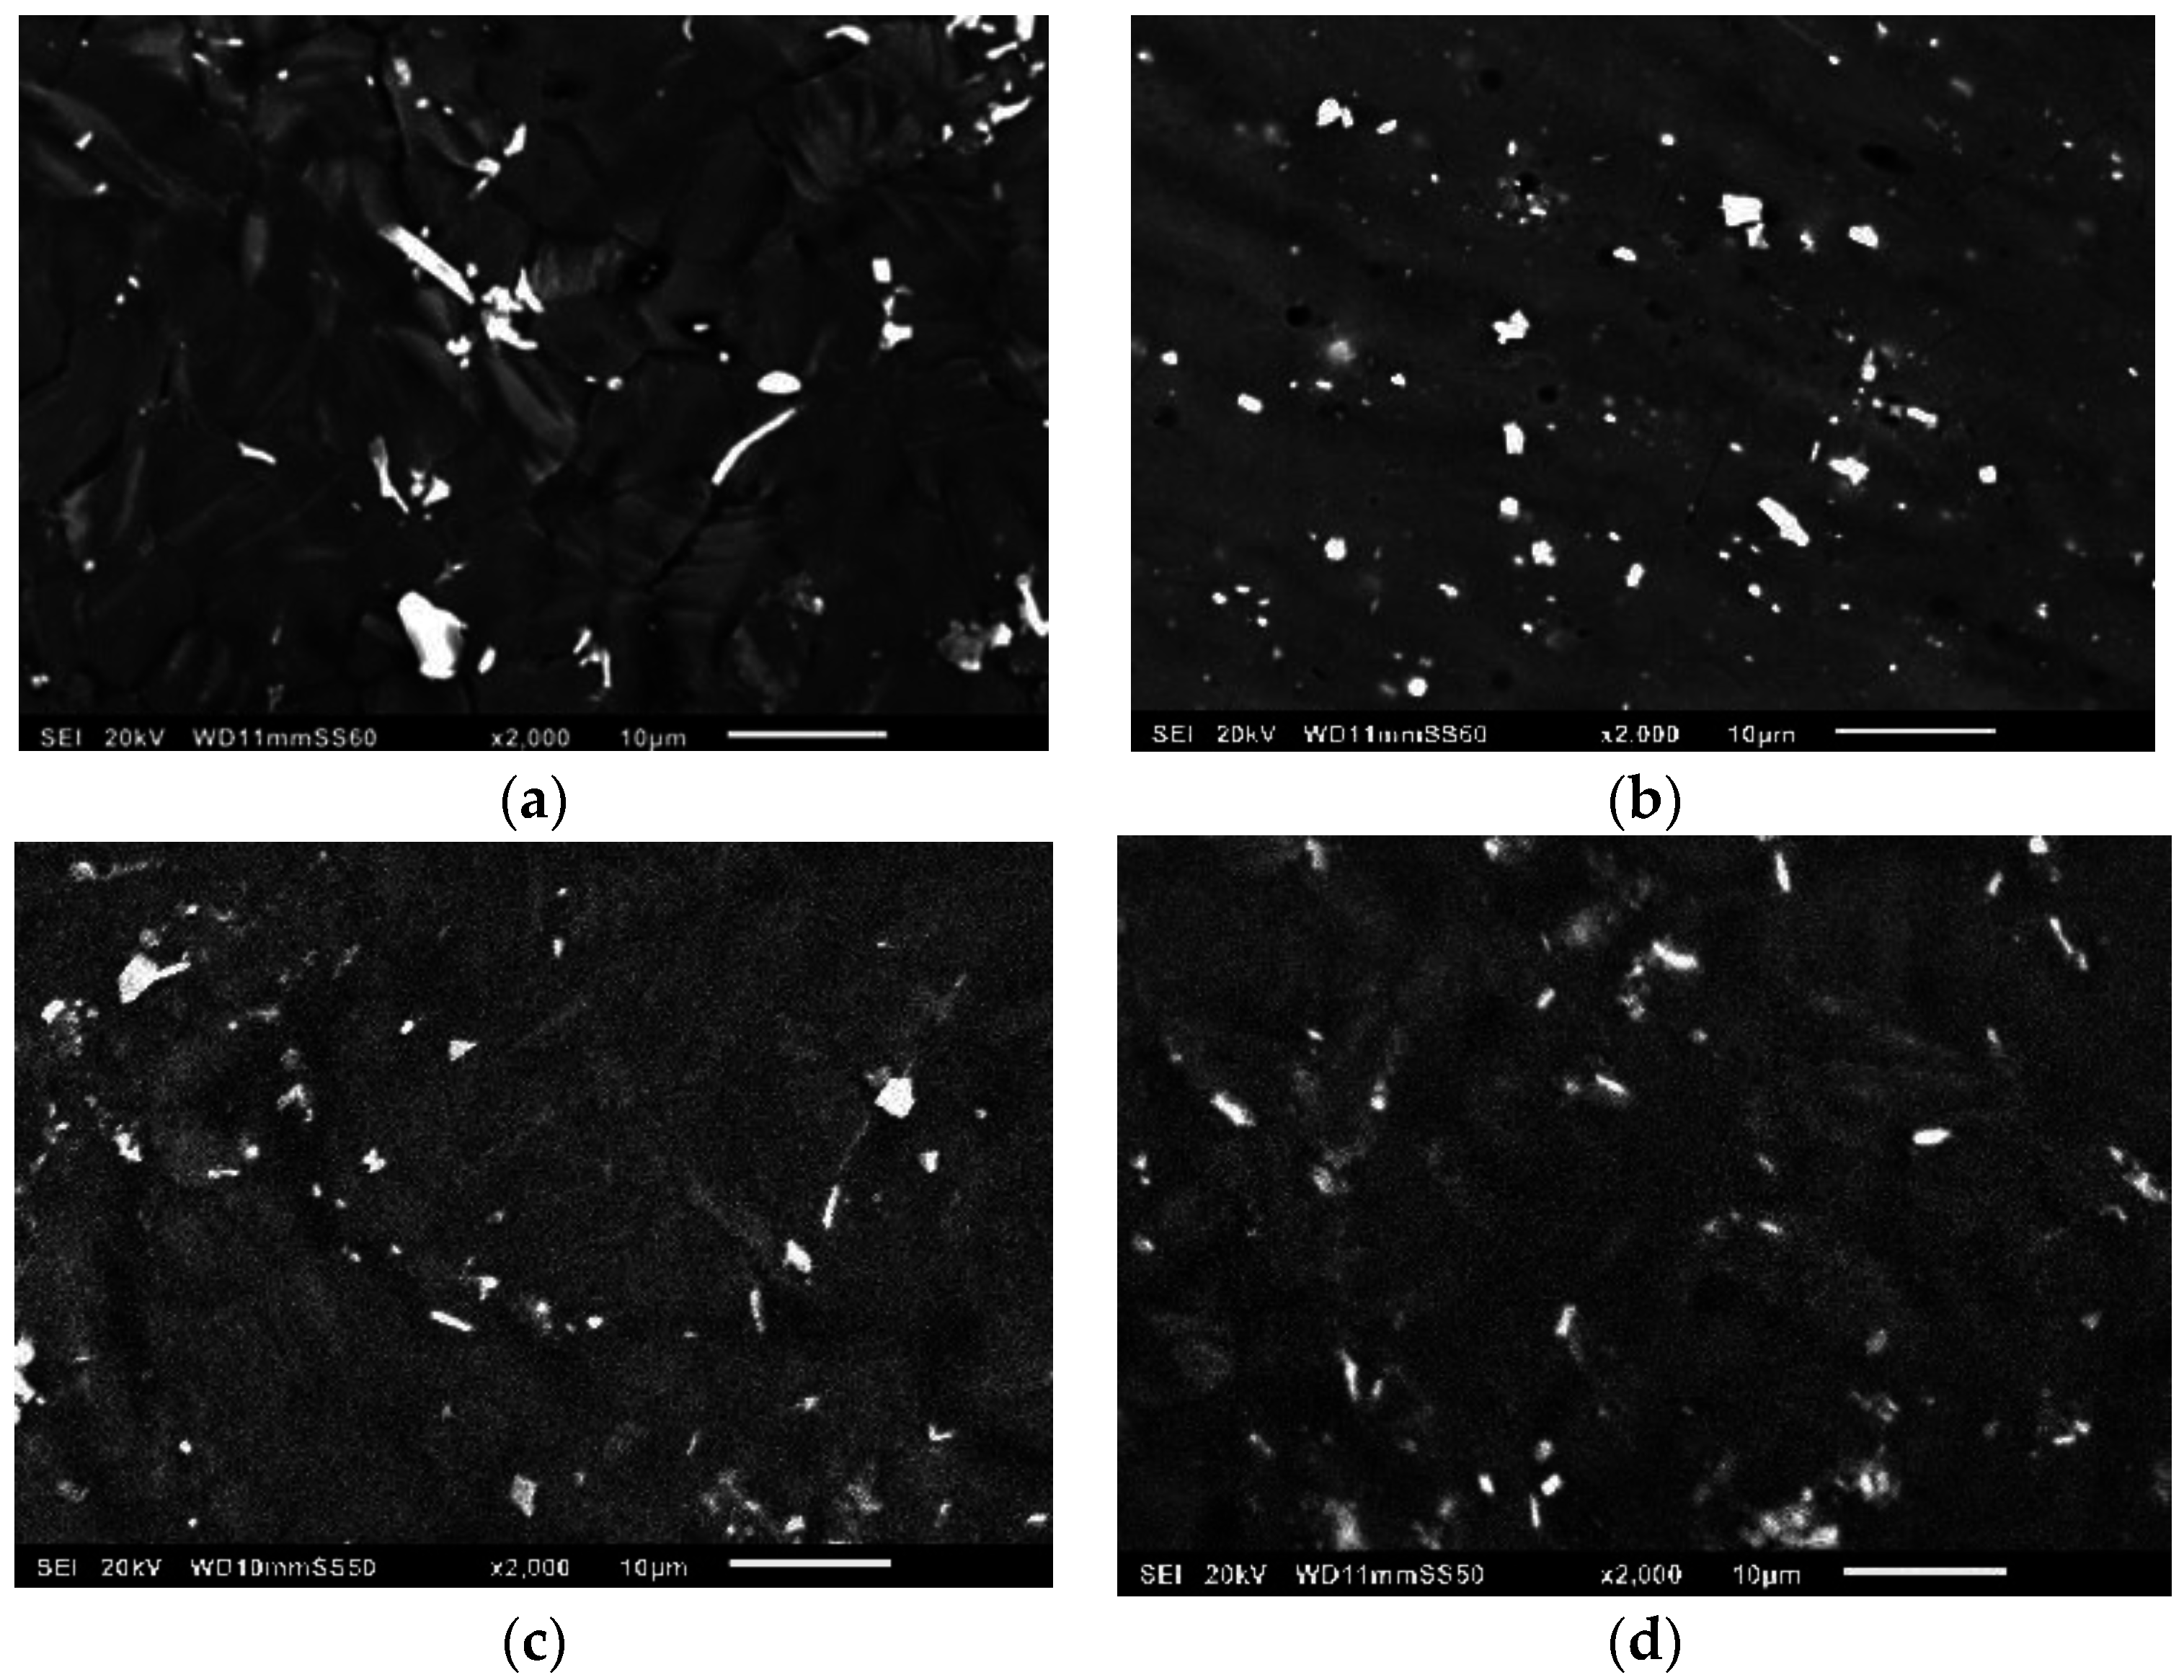
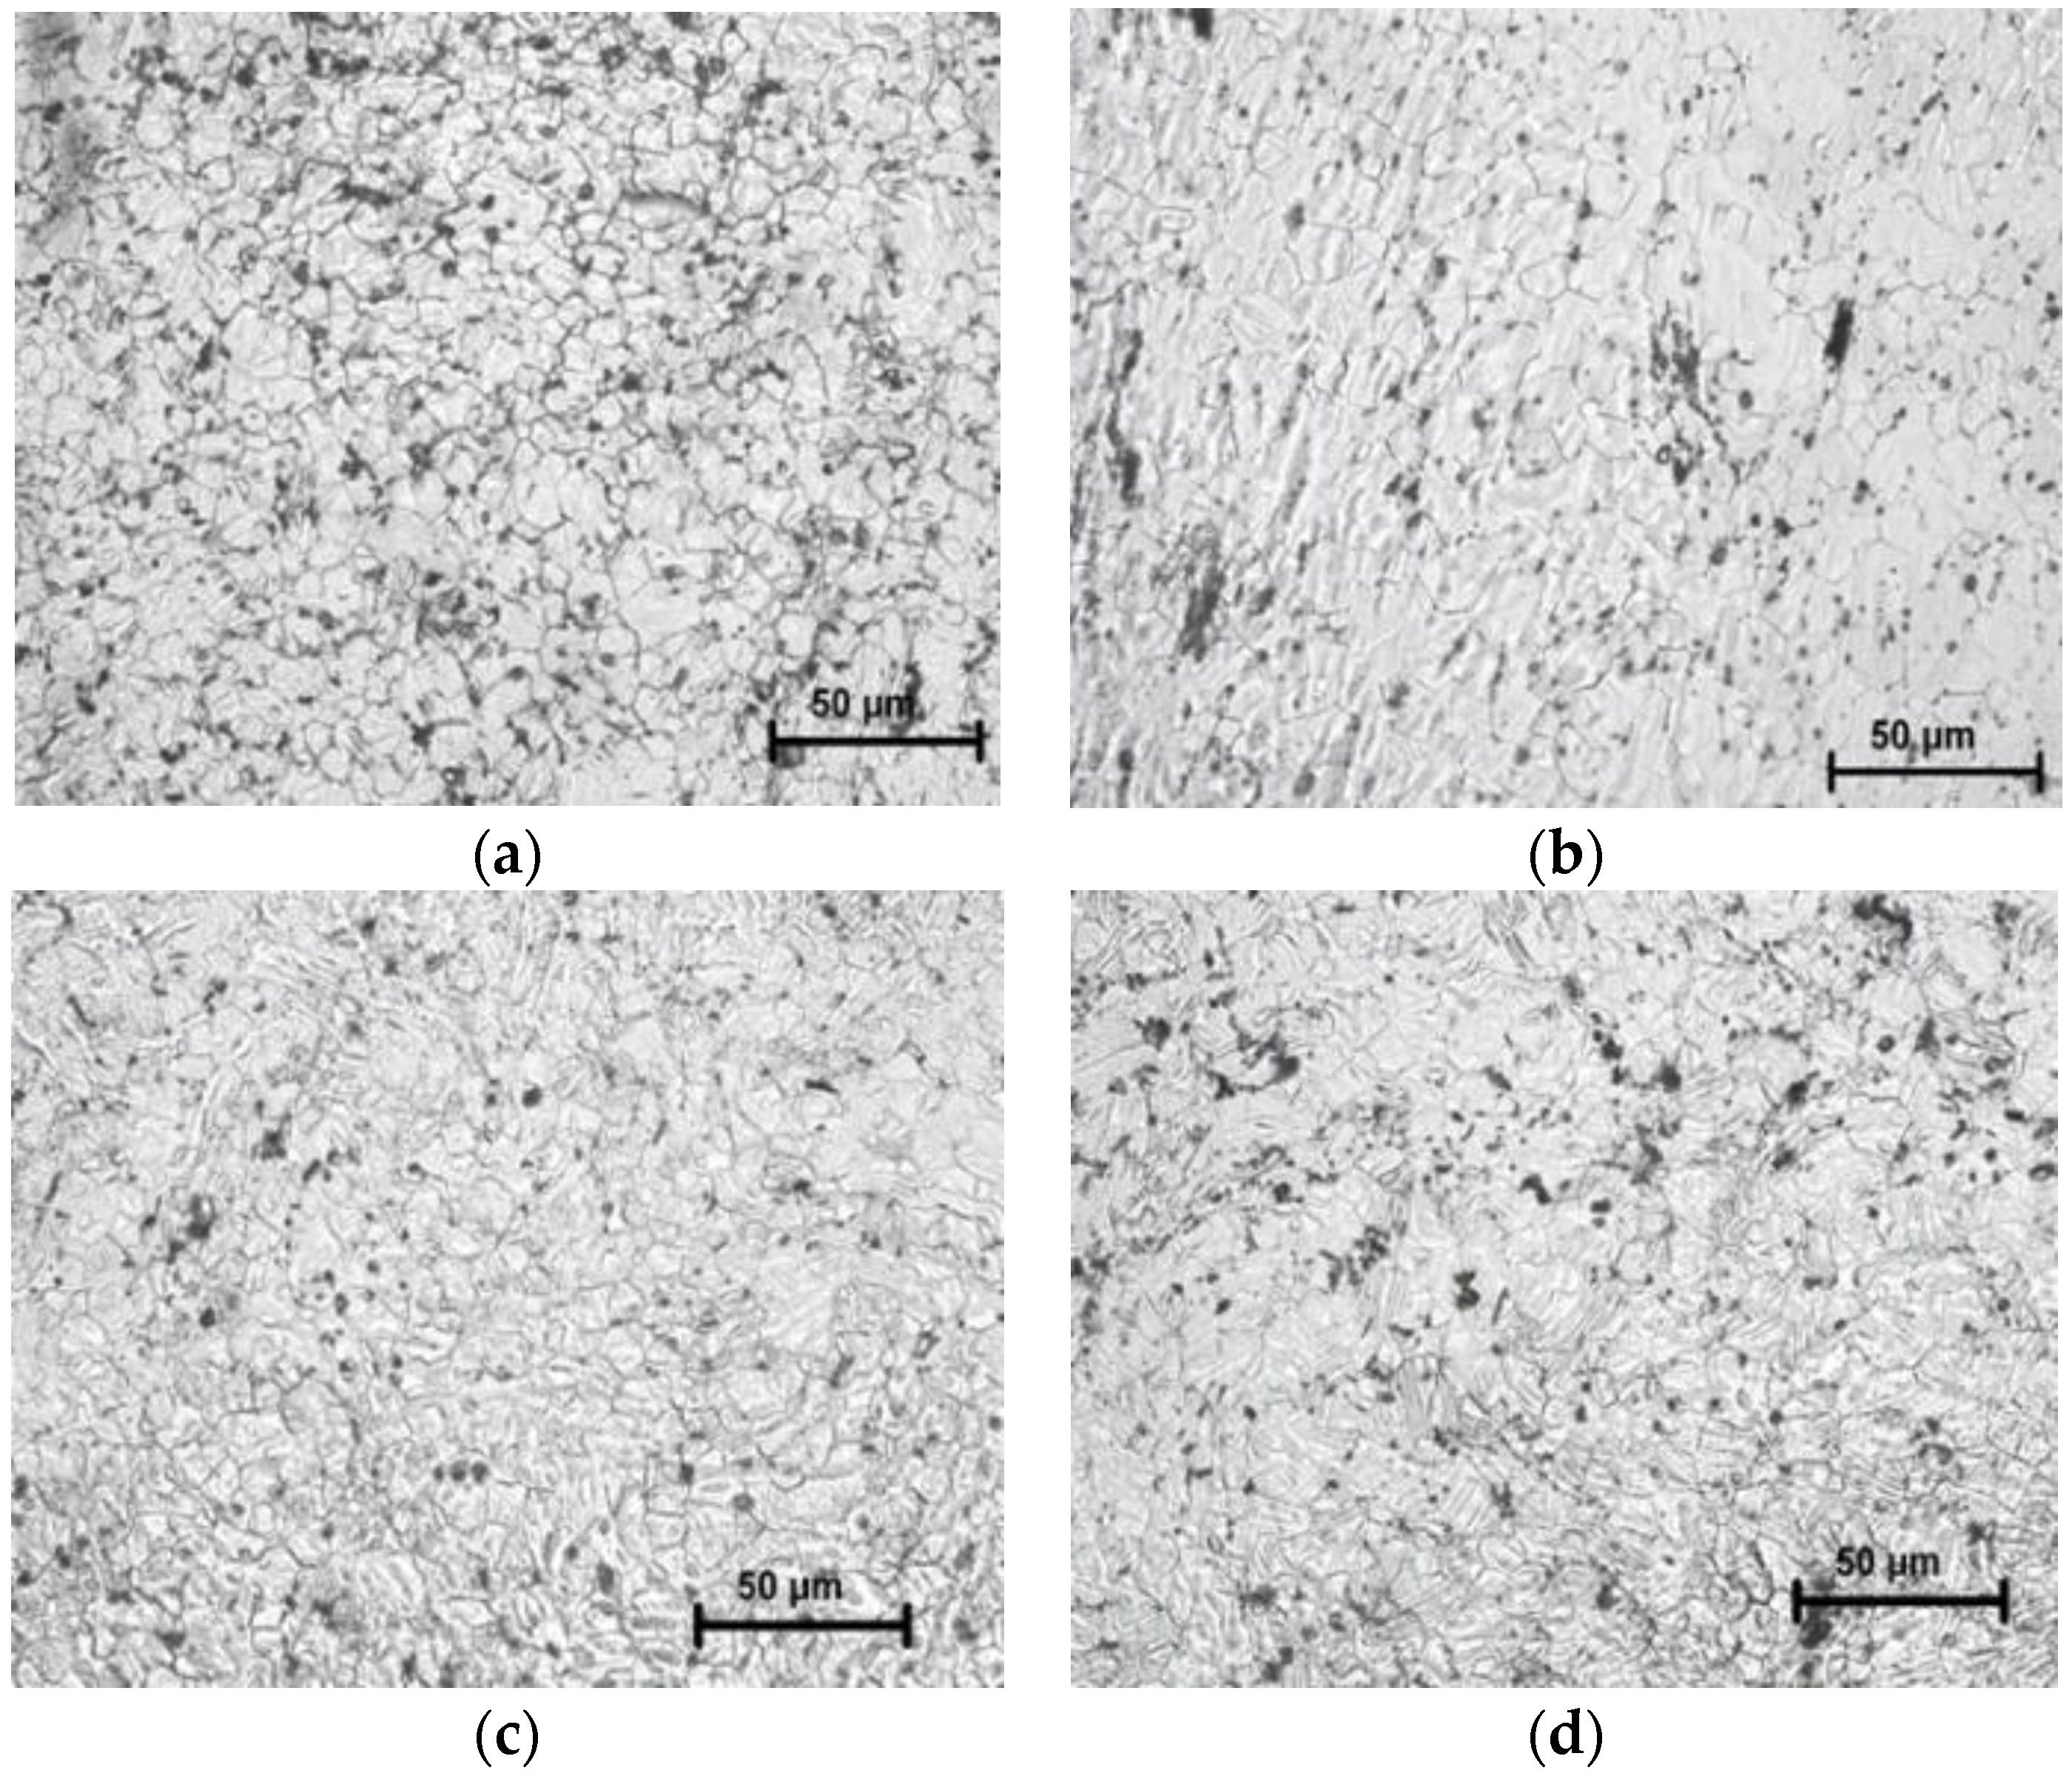
3.2.2. Microstructure Analysis

Figure 2a–d shows the secondary phase distribution in the alloy and the nanocomposites. The images indicate the reduced size of the secondary phases and the improved phase and reinforcement distribution with an increase in the amount of ZnO particles.

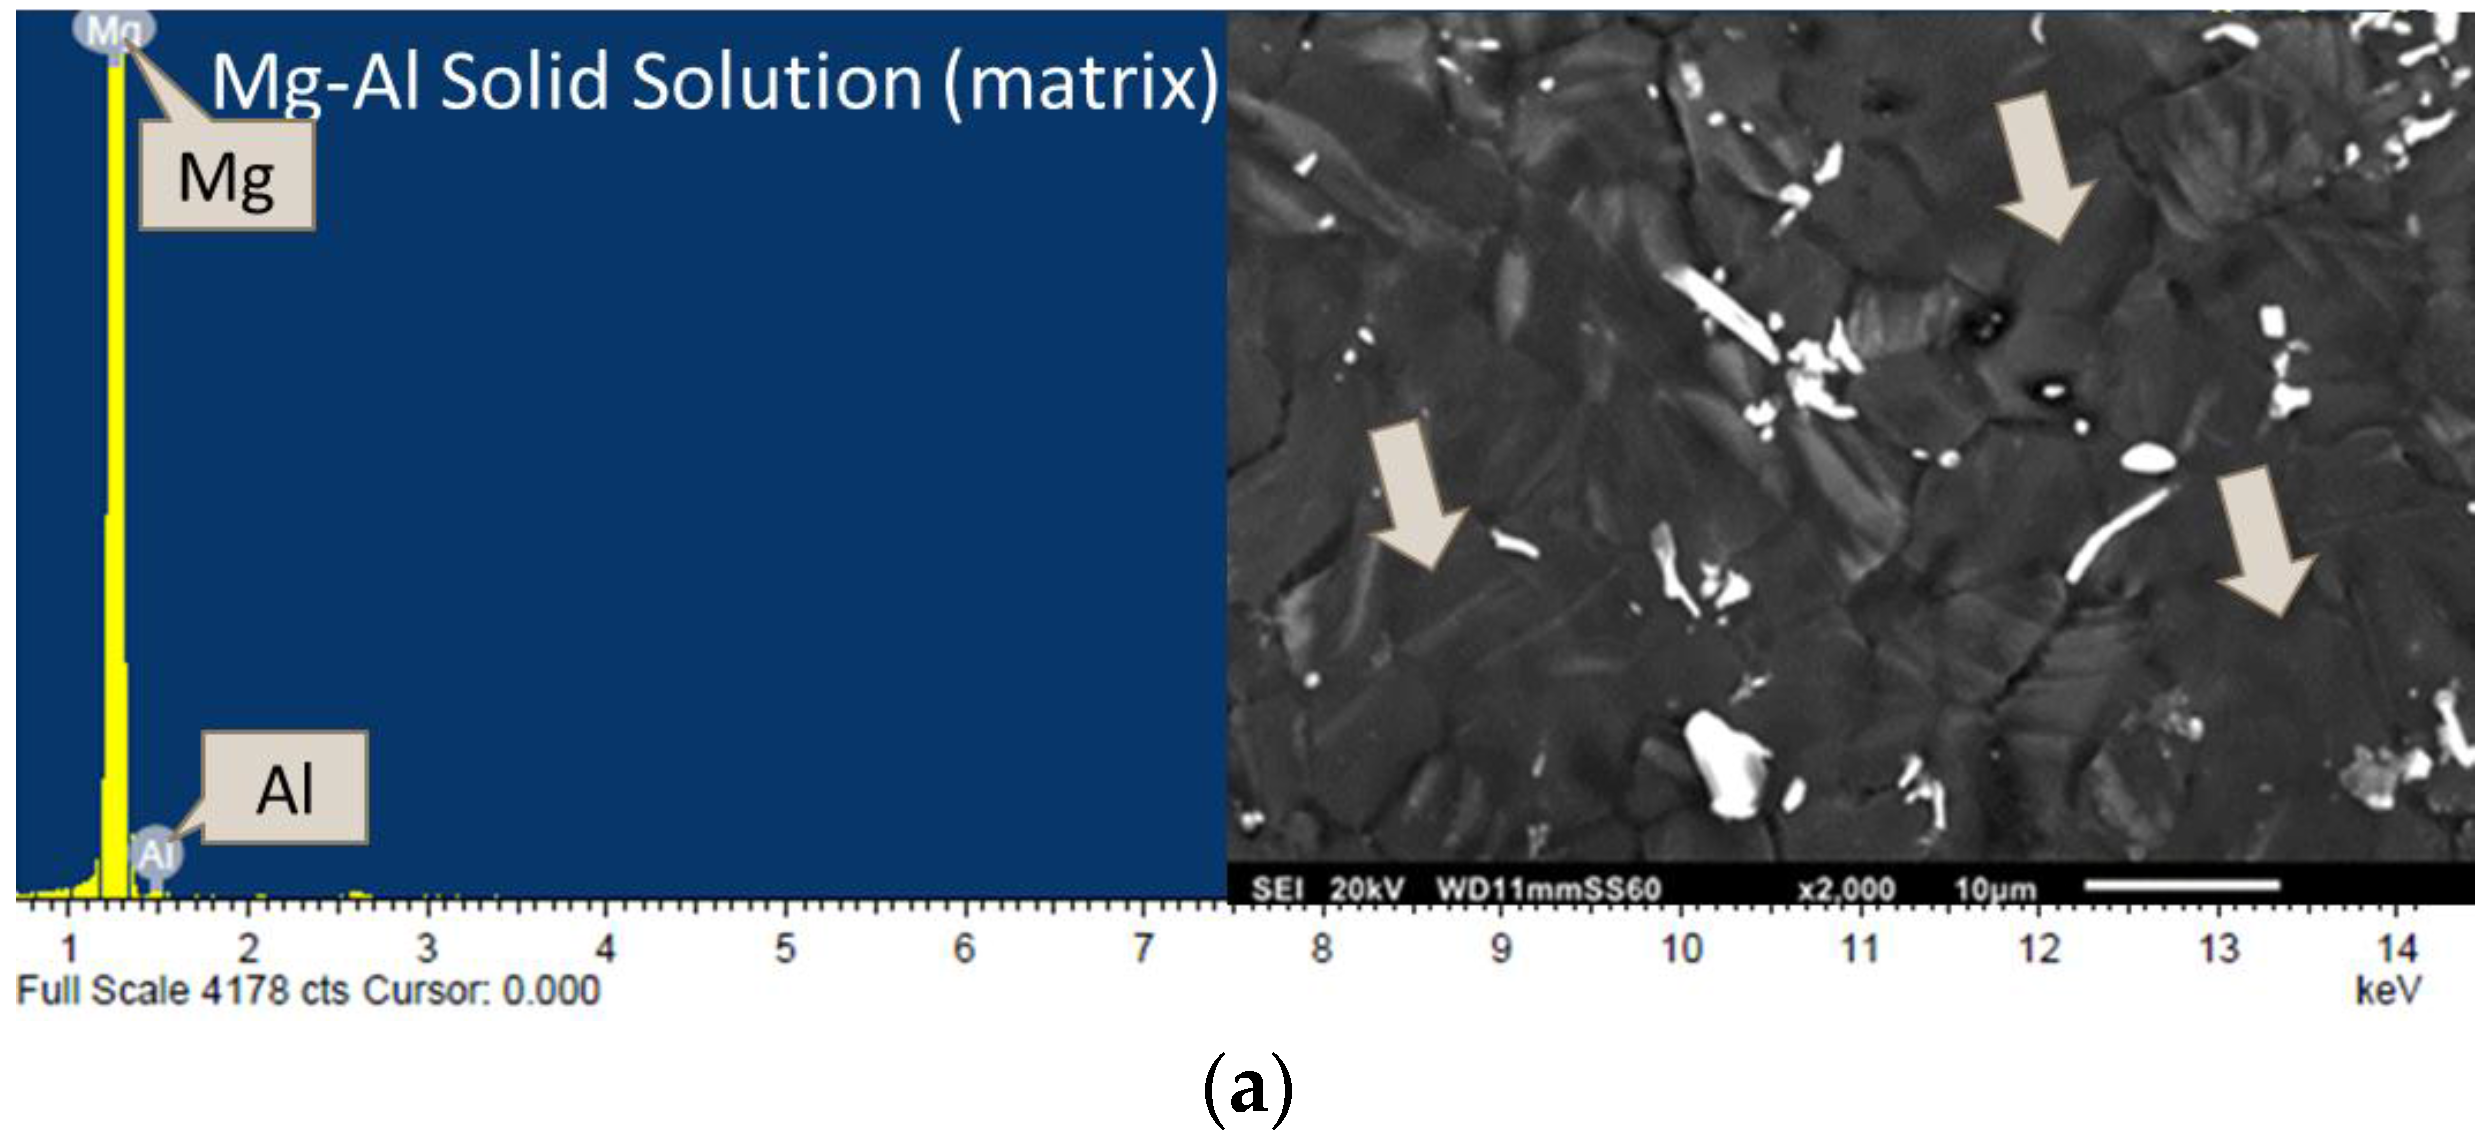
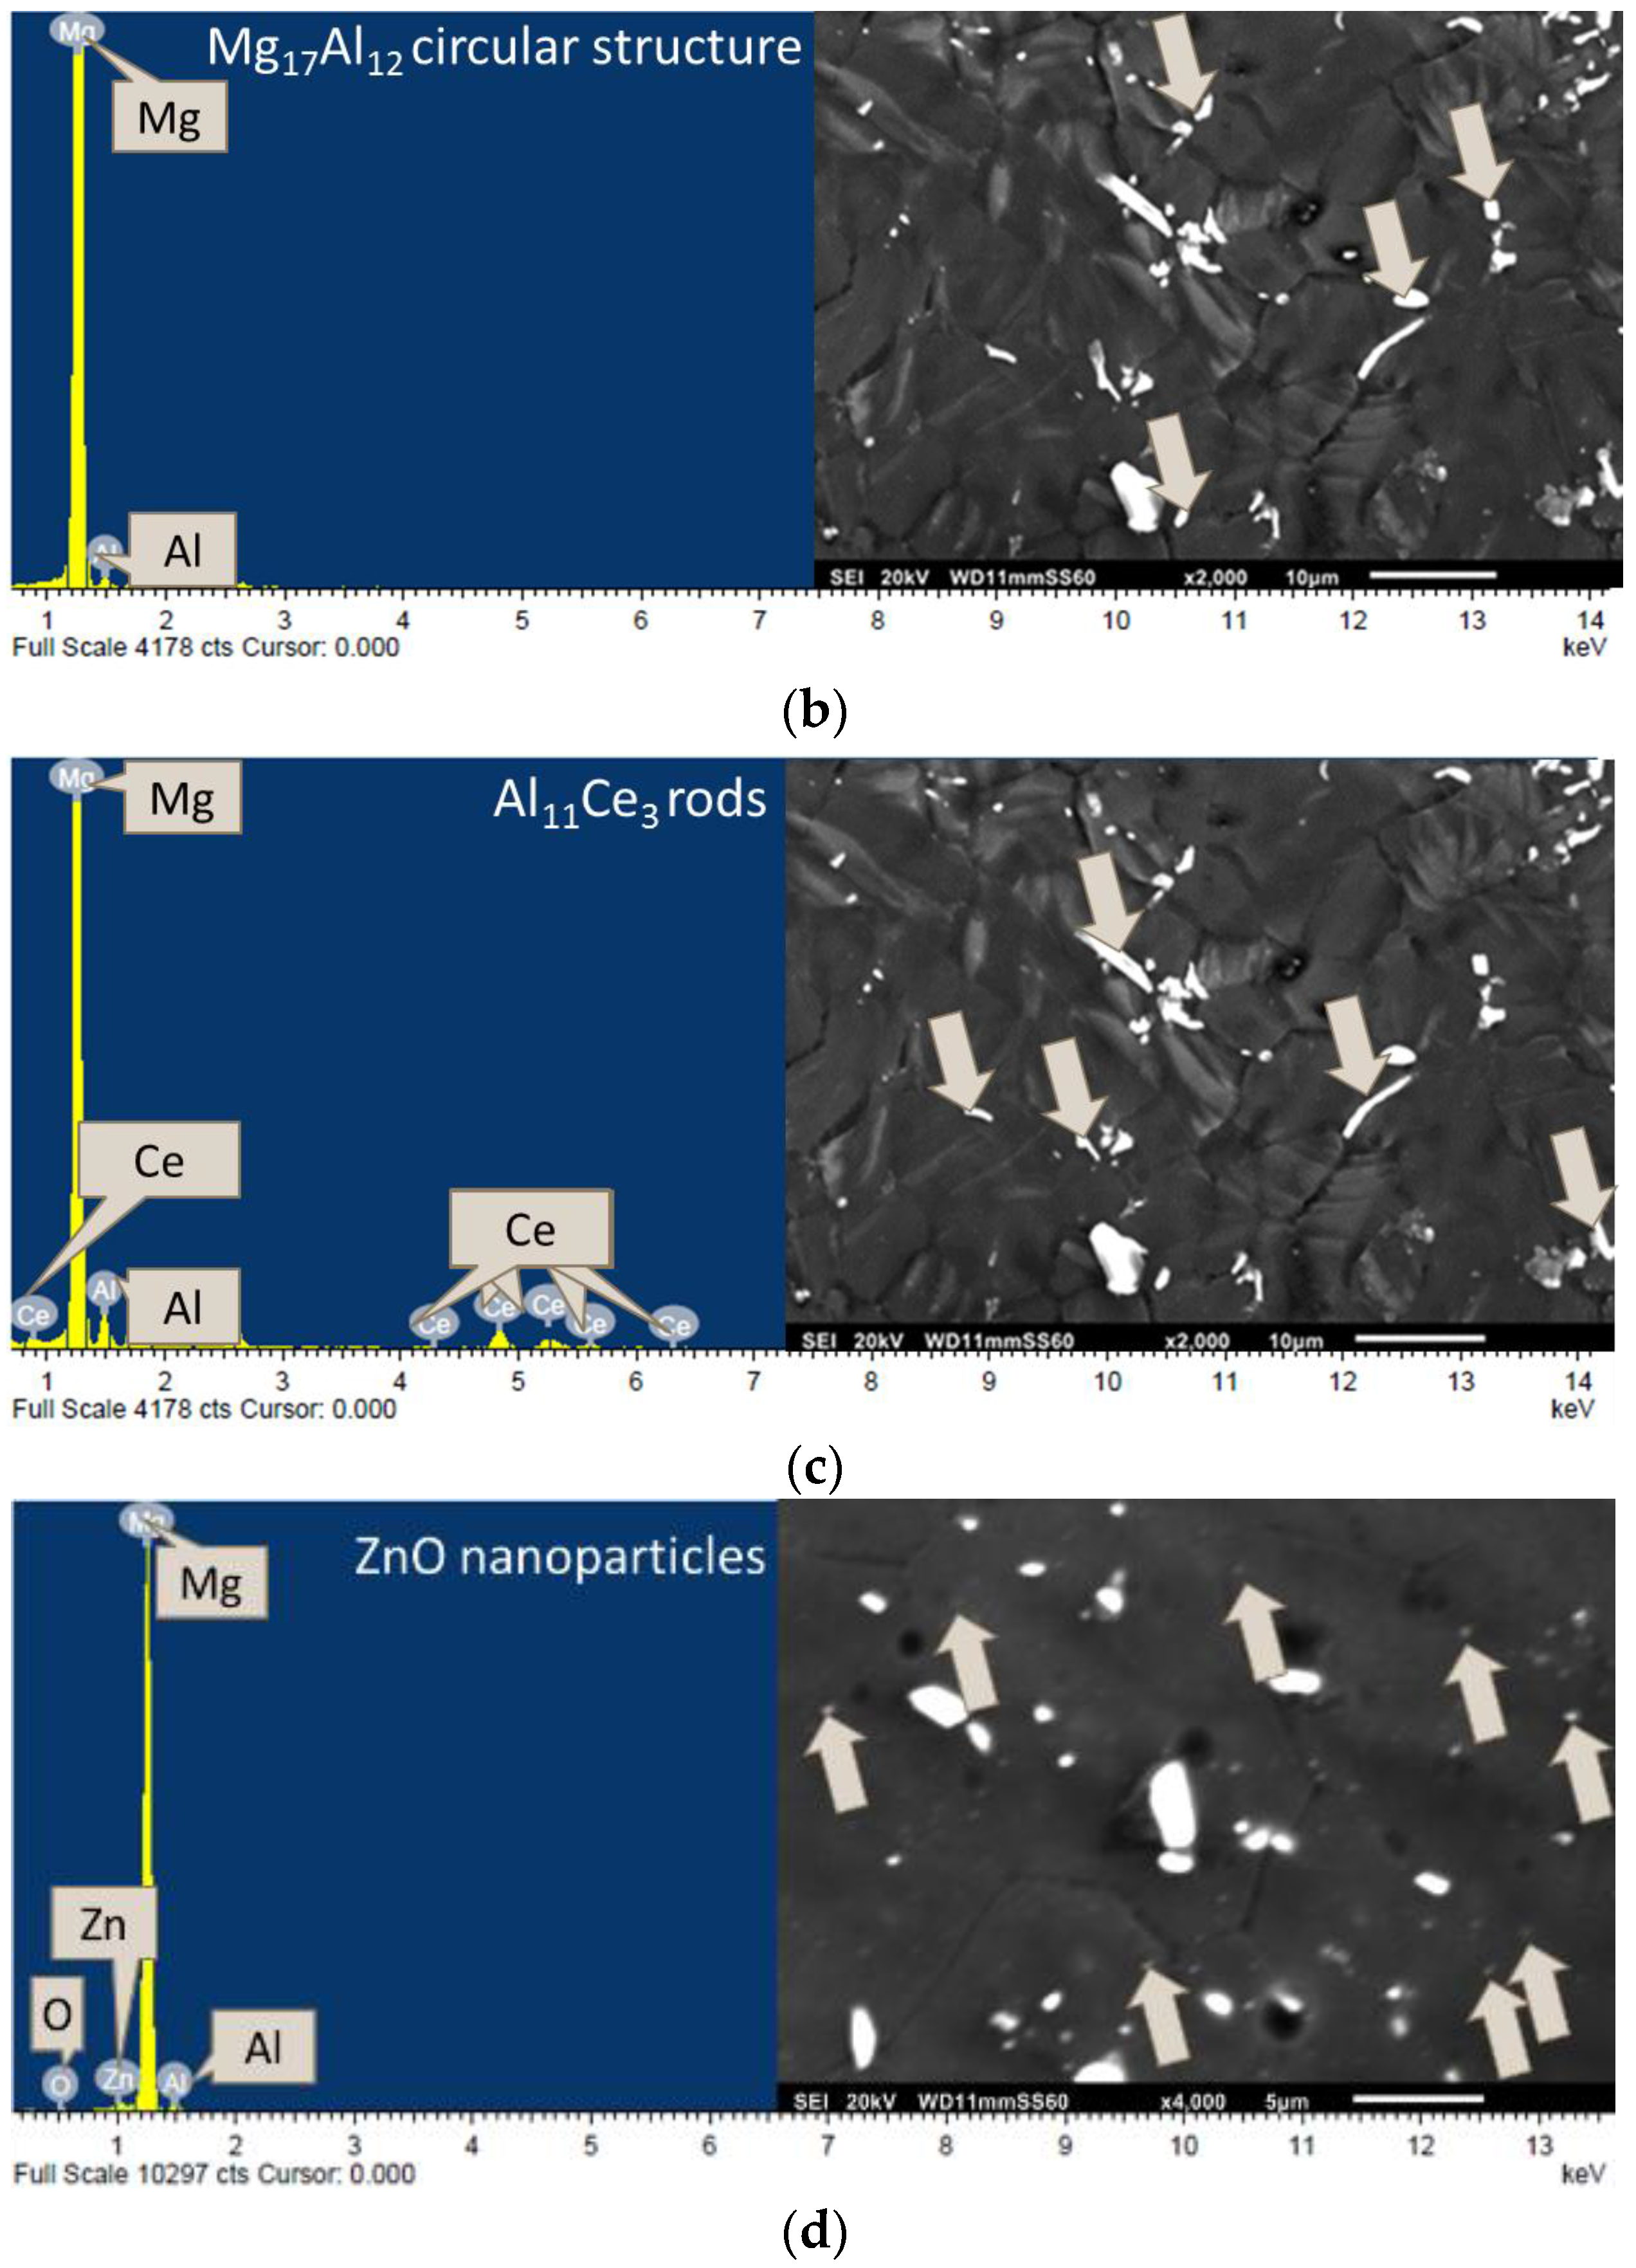
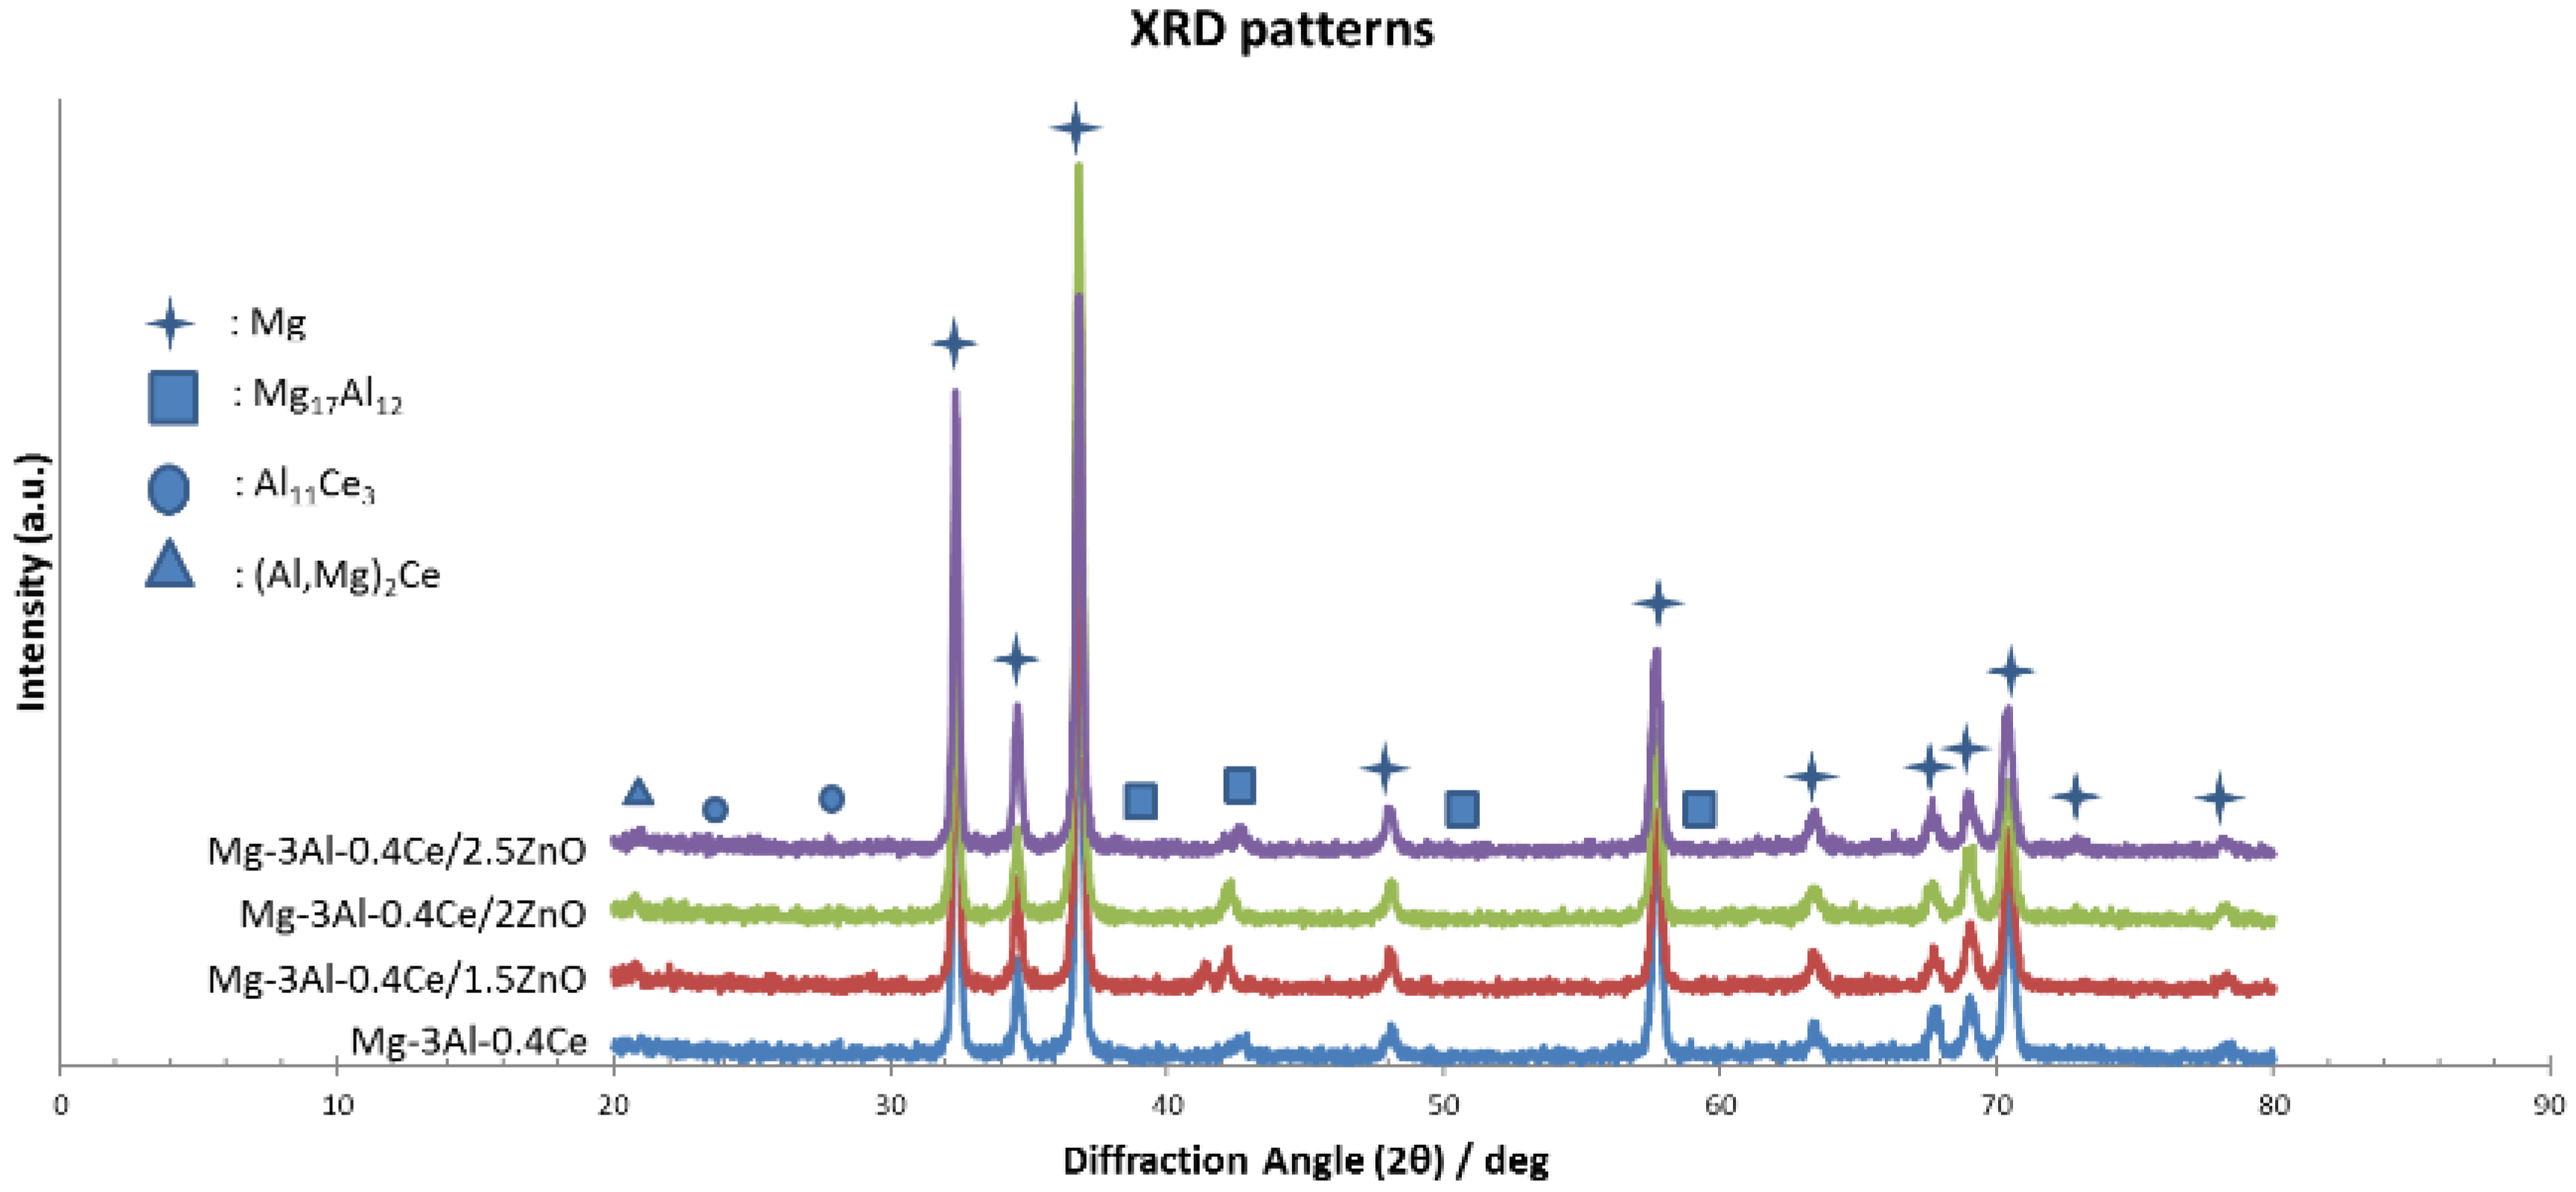
3.2.3. Phase Analysis

The XRD patterns confirmed the existence of secondary phases as shown in Figure 3. The peaks seen in the obtained patterns are correlated with the standard diffraction patterns obtained from the Powder Diffraction File data (PDF). The following phases were confirmed to be present in all the synthesized compositions, in varying intensities: α-Mg, Mg17Al12, Al11Ce3, (Al,Mg)2Ce.
No peaks corresponding to the Mg-Ce intermetallic phases were observed from the XRD patterns. This is ascribed to be due to the greater affinity of Ce towards Al [8], therefore, forming a Al11Ce3 phase instead of a Mg-Ce phase. From the SEM images in Figure 2, for alloy and nanocomposites, blocky shaped structures and rod-like structures were observed in the matrix. Spherical structures were also observed only in the case of nanocomposites.
From the energy dispersive spectroscopy (EDS) results in Figure 4, the following inferences are made: (i) The matrix correspond to Mg-Al solid solution; (ii) blocky shaped structures correspond to the Mg17Al12 phase (iii) rod-like structures are a combination of a phase containing Mg, Al, and Ce. While this could be either the Al11Ce3 phase or (Al,Mg)2Ce phase, previous research has shown that Al11Ce3 phase has a needle-like structure [9] and is the more dominant phase compared to (Al,Mg)2Ce [10]. Furthermore, XRD results also suggests that more peaks were observed for Al11Ce3 phase. Thus, this rod-like structure could be the Al11Ce3 phase. Further; (iv) the spherical structures are noted to be ZnO nano-particles. Also, these structures were detected only on the materials containing the ZnO particles. Furthermore, no evident peaks of ZnO were observed in the XRD patterns. This is due to the inability of XRD to detect nano-length scale particles in low volume fractions.
Thus, from the microstructural characterization of the Mg-3Al-0.4Ce alloy and its ZnO reinforced nanocomposites, the following points are to be factored in: (a) no drastic change in the grain morphology or grain size among the alloy and nanocomposites and (b) a more uniform distribution of the hard secondary phases and ZnO nano-particulates in the nanocomposites.

3.3. Coefficient of Thermal Expansion (CTE)

Thermal expansion refers to the tendency to change shape in response to a change in temperature, occurring through heat transfer. The lesser the CTE value, the lesser the tendency for the material to change shape when the temperature is increased. Thus, a material with lower CTE values indicates a thermally stable material. The addition of Al and Ce corresponded to a drop in the CTE value of Mg. Comparing Mg-Al-0.4Ce with Mg-3Al-0.4Ce-1.5ZnO, a further decrease in CTE value was noticed. However, when the wt % of ZnO nano-particles increased, the CTE values increased. Nevertheless, the addition of ZnO particles resulted in overall lower CTE values and thereby, more thermally stable materials in contrast with the monolithic alloy. Results of the CTE are shown Table 2. The obtained results are due to the lower CTE value of ZnO as compared to that of Mg.

3.4. Mechanical Properties

3.4.1. Microhardness

The microhardness of Mg-3Al-0.4Ce alloy is seen to be much higher as compared to that of pure Mg [5] and commercially available AZ31B [11]. This is due to the addition of a rare earth element. Nayyeri et al. [12] reported an increase in hardness when RE metals were added to Mg-Al alloys, due to the Al-RE intermetallic phase formation. Further, the increasing addition of ZnO nanopartices progressively increased the microhardness of the nanocomposites (Table 3). This is due to the existence of harder ZnO particles that can resist deformation under indentation loads [13].

3.4.2. Tensile Properties
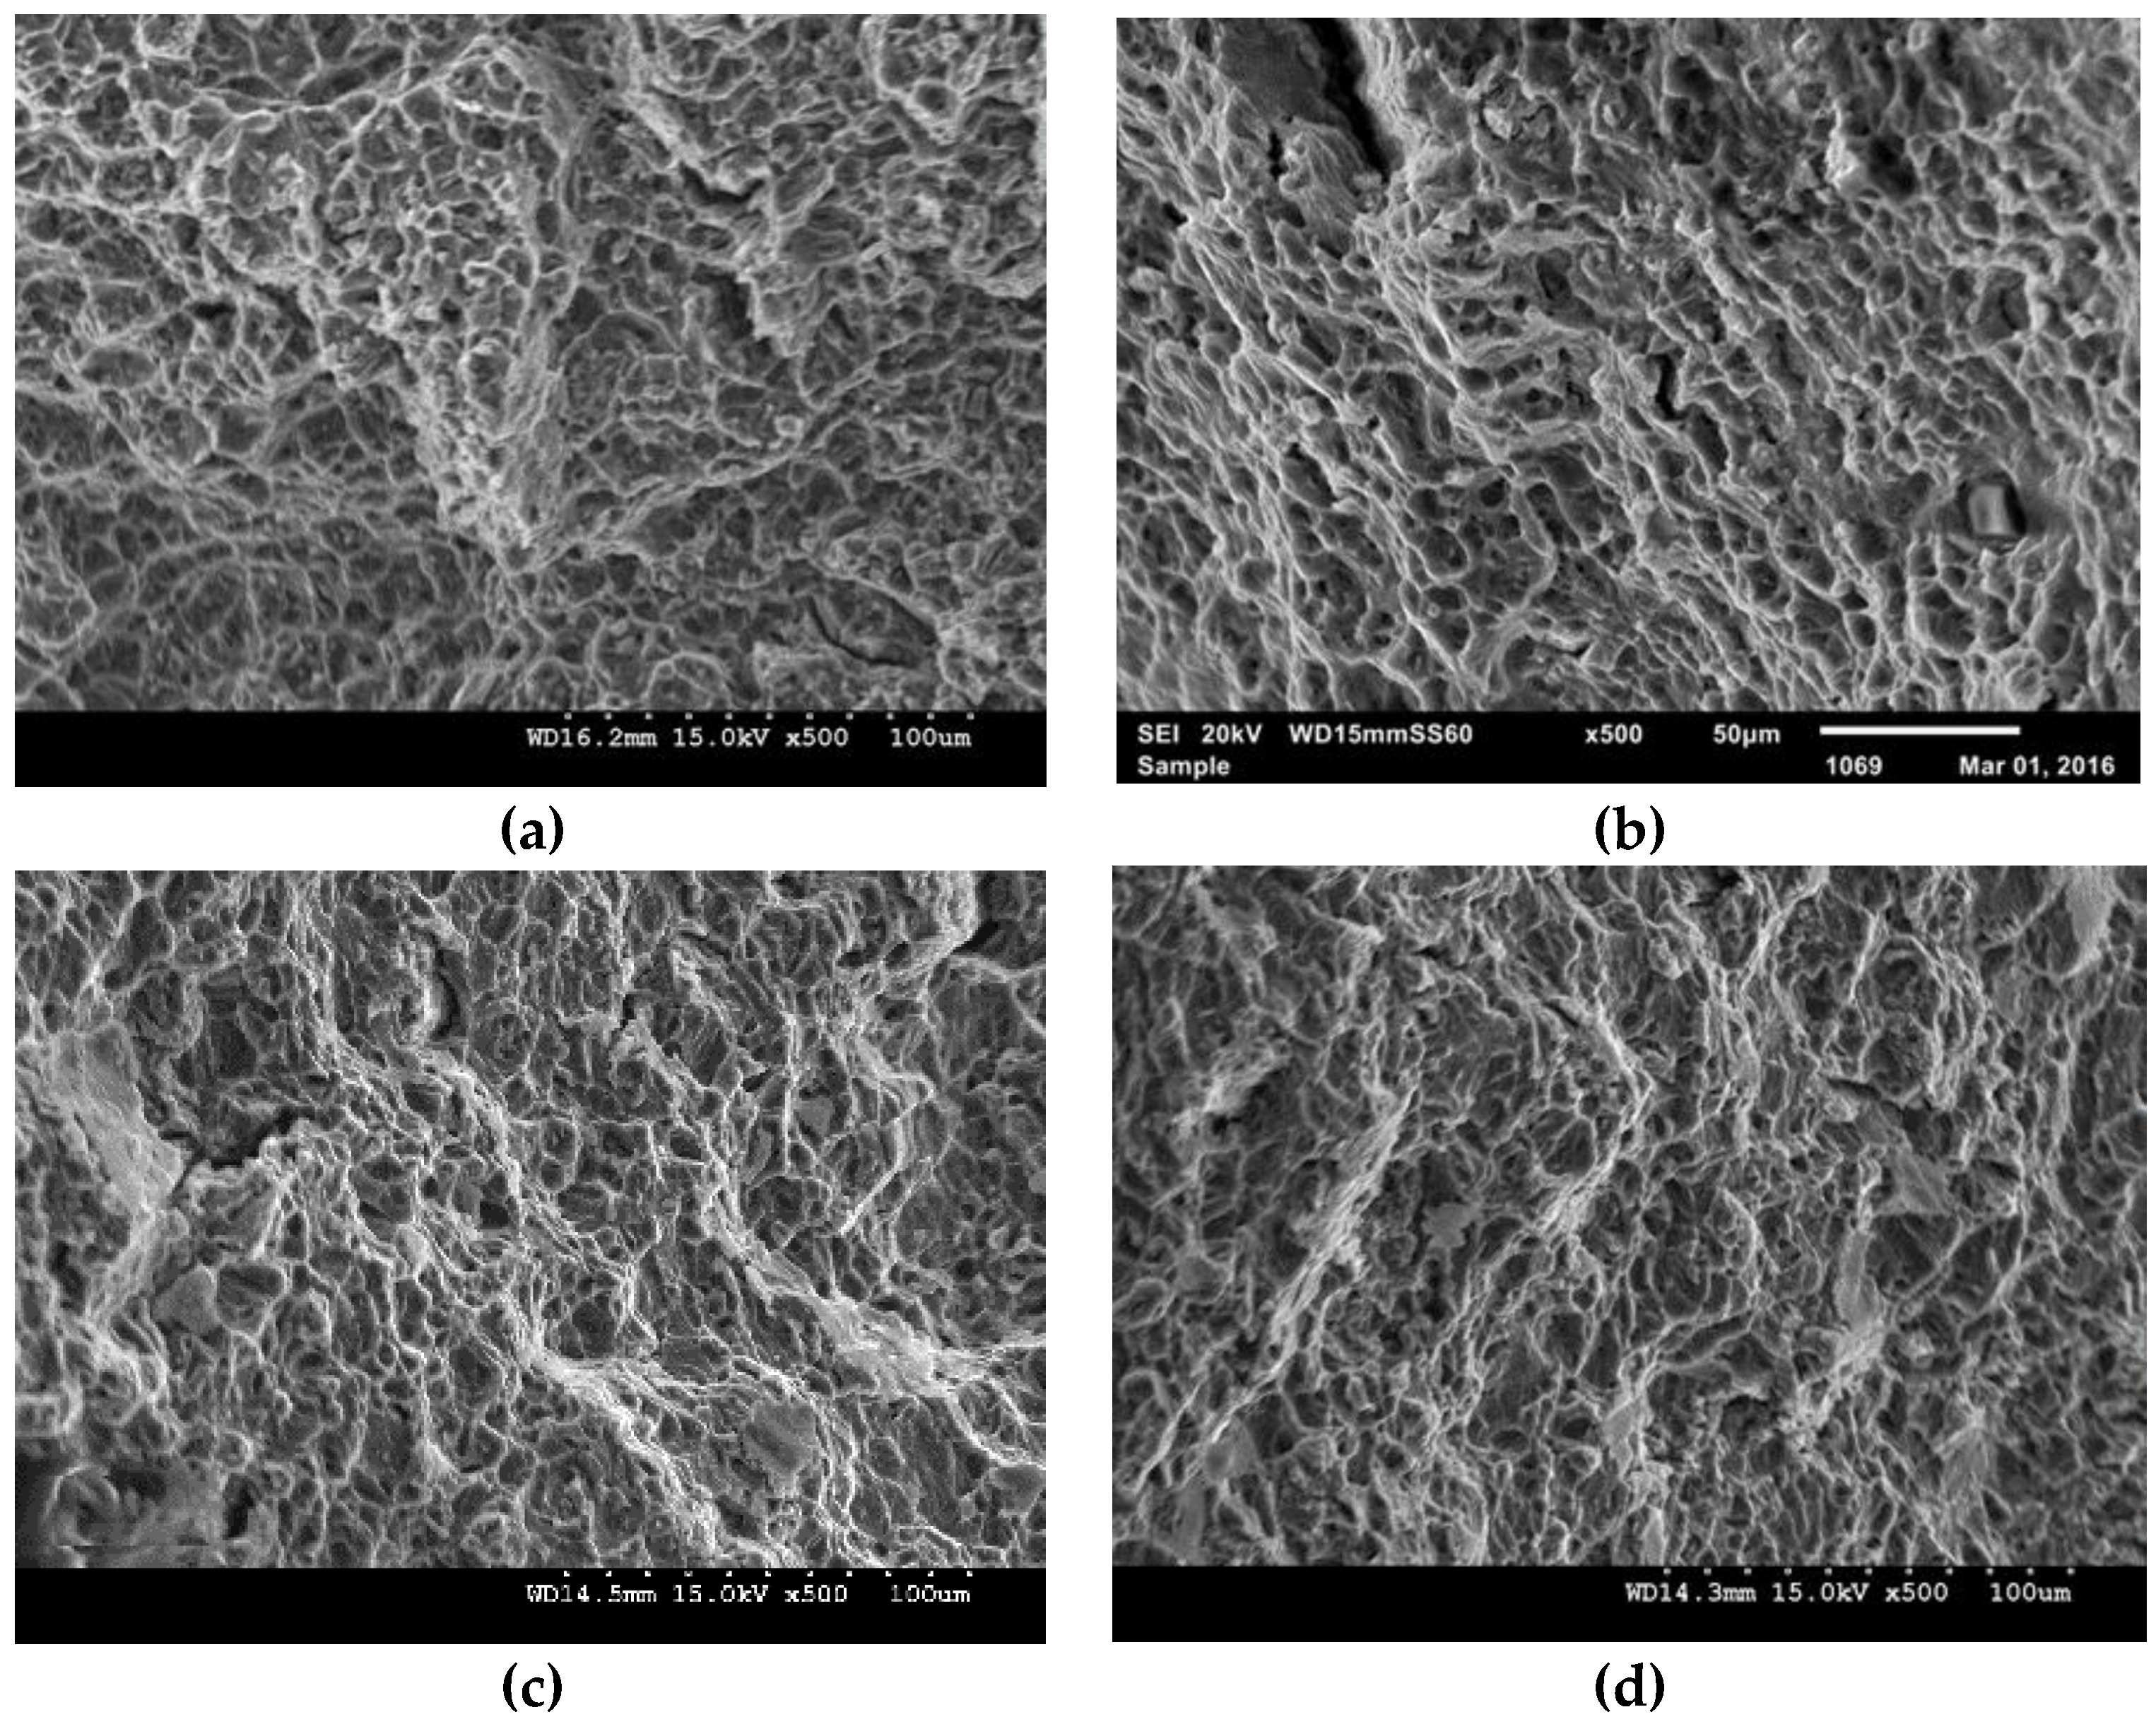
A trend similar to that of the microhardness results was observed for the results of the tensile tests. An increase in the 0.2% offset yield strength and ultimate tensile strength was observed with the progressive addition of ZnO to the Mg-3Al-0.4Ce alloy. The addition of ZnO displayed no significant effect on the ductility. The overall tensile response assessed in terms of the energy absorption capability prior to failure remained superior in the case of the nanocomposites. The results are found in Table 3 and Figure 5. When compared to the previously reported results on Mg-3Al-0.2Ce and Mg-3Al-0.5Ce alloys [8] (similar processing conditions), it is observed that the materials synthesized in this study possess superior strengths. Within the nanocomposites, the fracture strain and energy absorption values increased from Mg-3Al-0.4Ce to Mg-3Al-0.4Ce-2ZnO and decreased for Mg-3Al-0.4Ce-2.5ZnO. This could be due to a clustering effect of ZnO nanoparticles [14], as well as the increased porosity as seen in Table 1 for the Mg-3Al-0.4Ce-2.5ZnO nanocomposite. Furthermore, an interesting observation from the curves is that all the materials fractured at (or before realizing) their ultimate tensile strengths, i.e., they had not undergone any deformation after reaching the peak values. This shows that the ultimate failure has occurred at (or before) the peak stress. This occurs when the plastic strain at any point in the material reaches the maximum value. The common stress concentration sites in all the materials, in this study, are the rod shaped Al11Ce3 structures. These rods seemed to act as the stress concentration sites, i.e., sites for continued local stresses. When the local stress at these sites reach the threshold stress, the materials begin to fail at these sites. Thus, the rod shaped Al11Ce3 is responsible for the materials exhibiting this phenomenon.

3.4.3. Fractography

The microscopic fracture features of the samples fractured in the tensile test are shown in Figure 6. These images revealed pronounced ductile features due to plastic deformation. Typically, magnesium materials exhibit cleavage features which are suggestive of their inability to deform plastically (due to the HCP crystal structure). However, in the current study, the developed Mg-3Al-0.4Ce alloy and its ZnO reinforced nanocomposites showed noticeable ductile features representing the occurrence of pronounced plastic deformation, thus validating the tensile test results.

4. Conclusions

Synthesis of the Mg-3Al-0.4Ce alloy and its ZnO nano-particulate reinforced nanocomposites was carried out using the DMD technique followed by hot extrusion. The microstructural and mechanical properties were studied. With the current findings, the following can be concluded:
  • The processing methodology used in this study is capable of synthesizing the Mg-3Al-0.4Ce alloy and its nanocomposites with porosities restricted to ~1%.
  • The addition of ZnO nanoparticles reduced the CTE of the Mg-3Al-0.4Ce alloy, resulting in more dimensionally stable nanocomposites.
  • The addition of ZnO nano-particulates corresponded with the increase in the microhardness of the Mg-3Al-0.4Ce alloy. A maximum microhardness was realized in the case of the Mg-3Al-0.4Ce/2.5ZnO nanocomposite, with a value of 161 Hv.
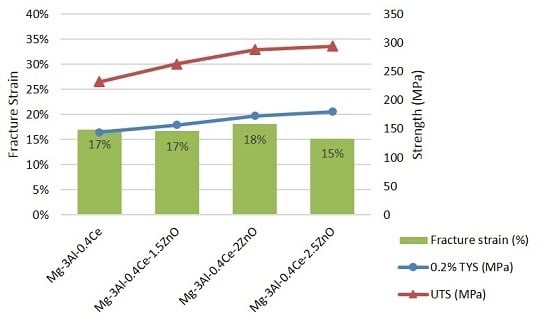
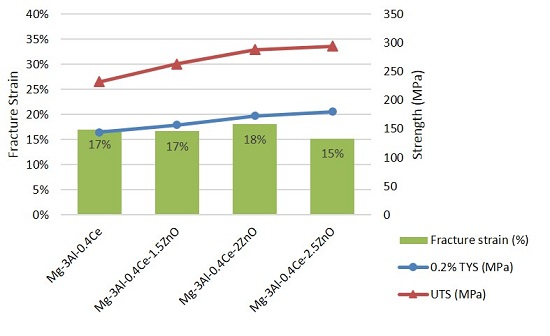
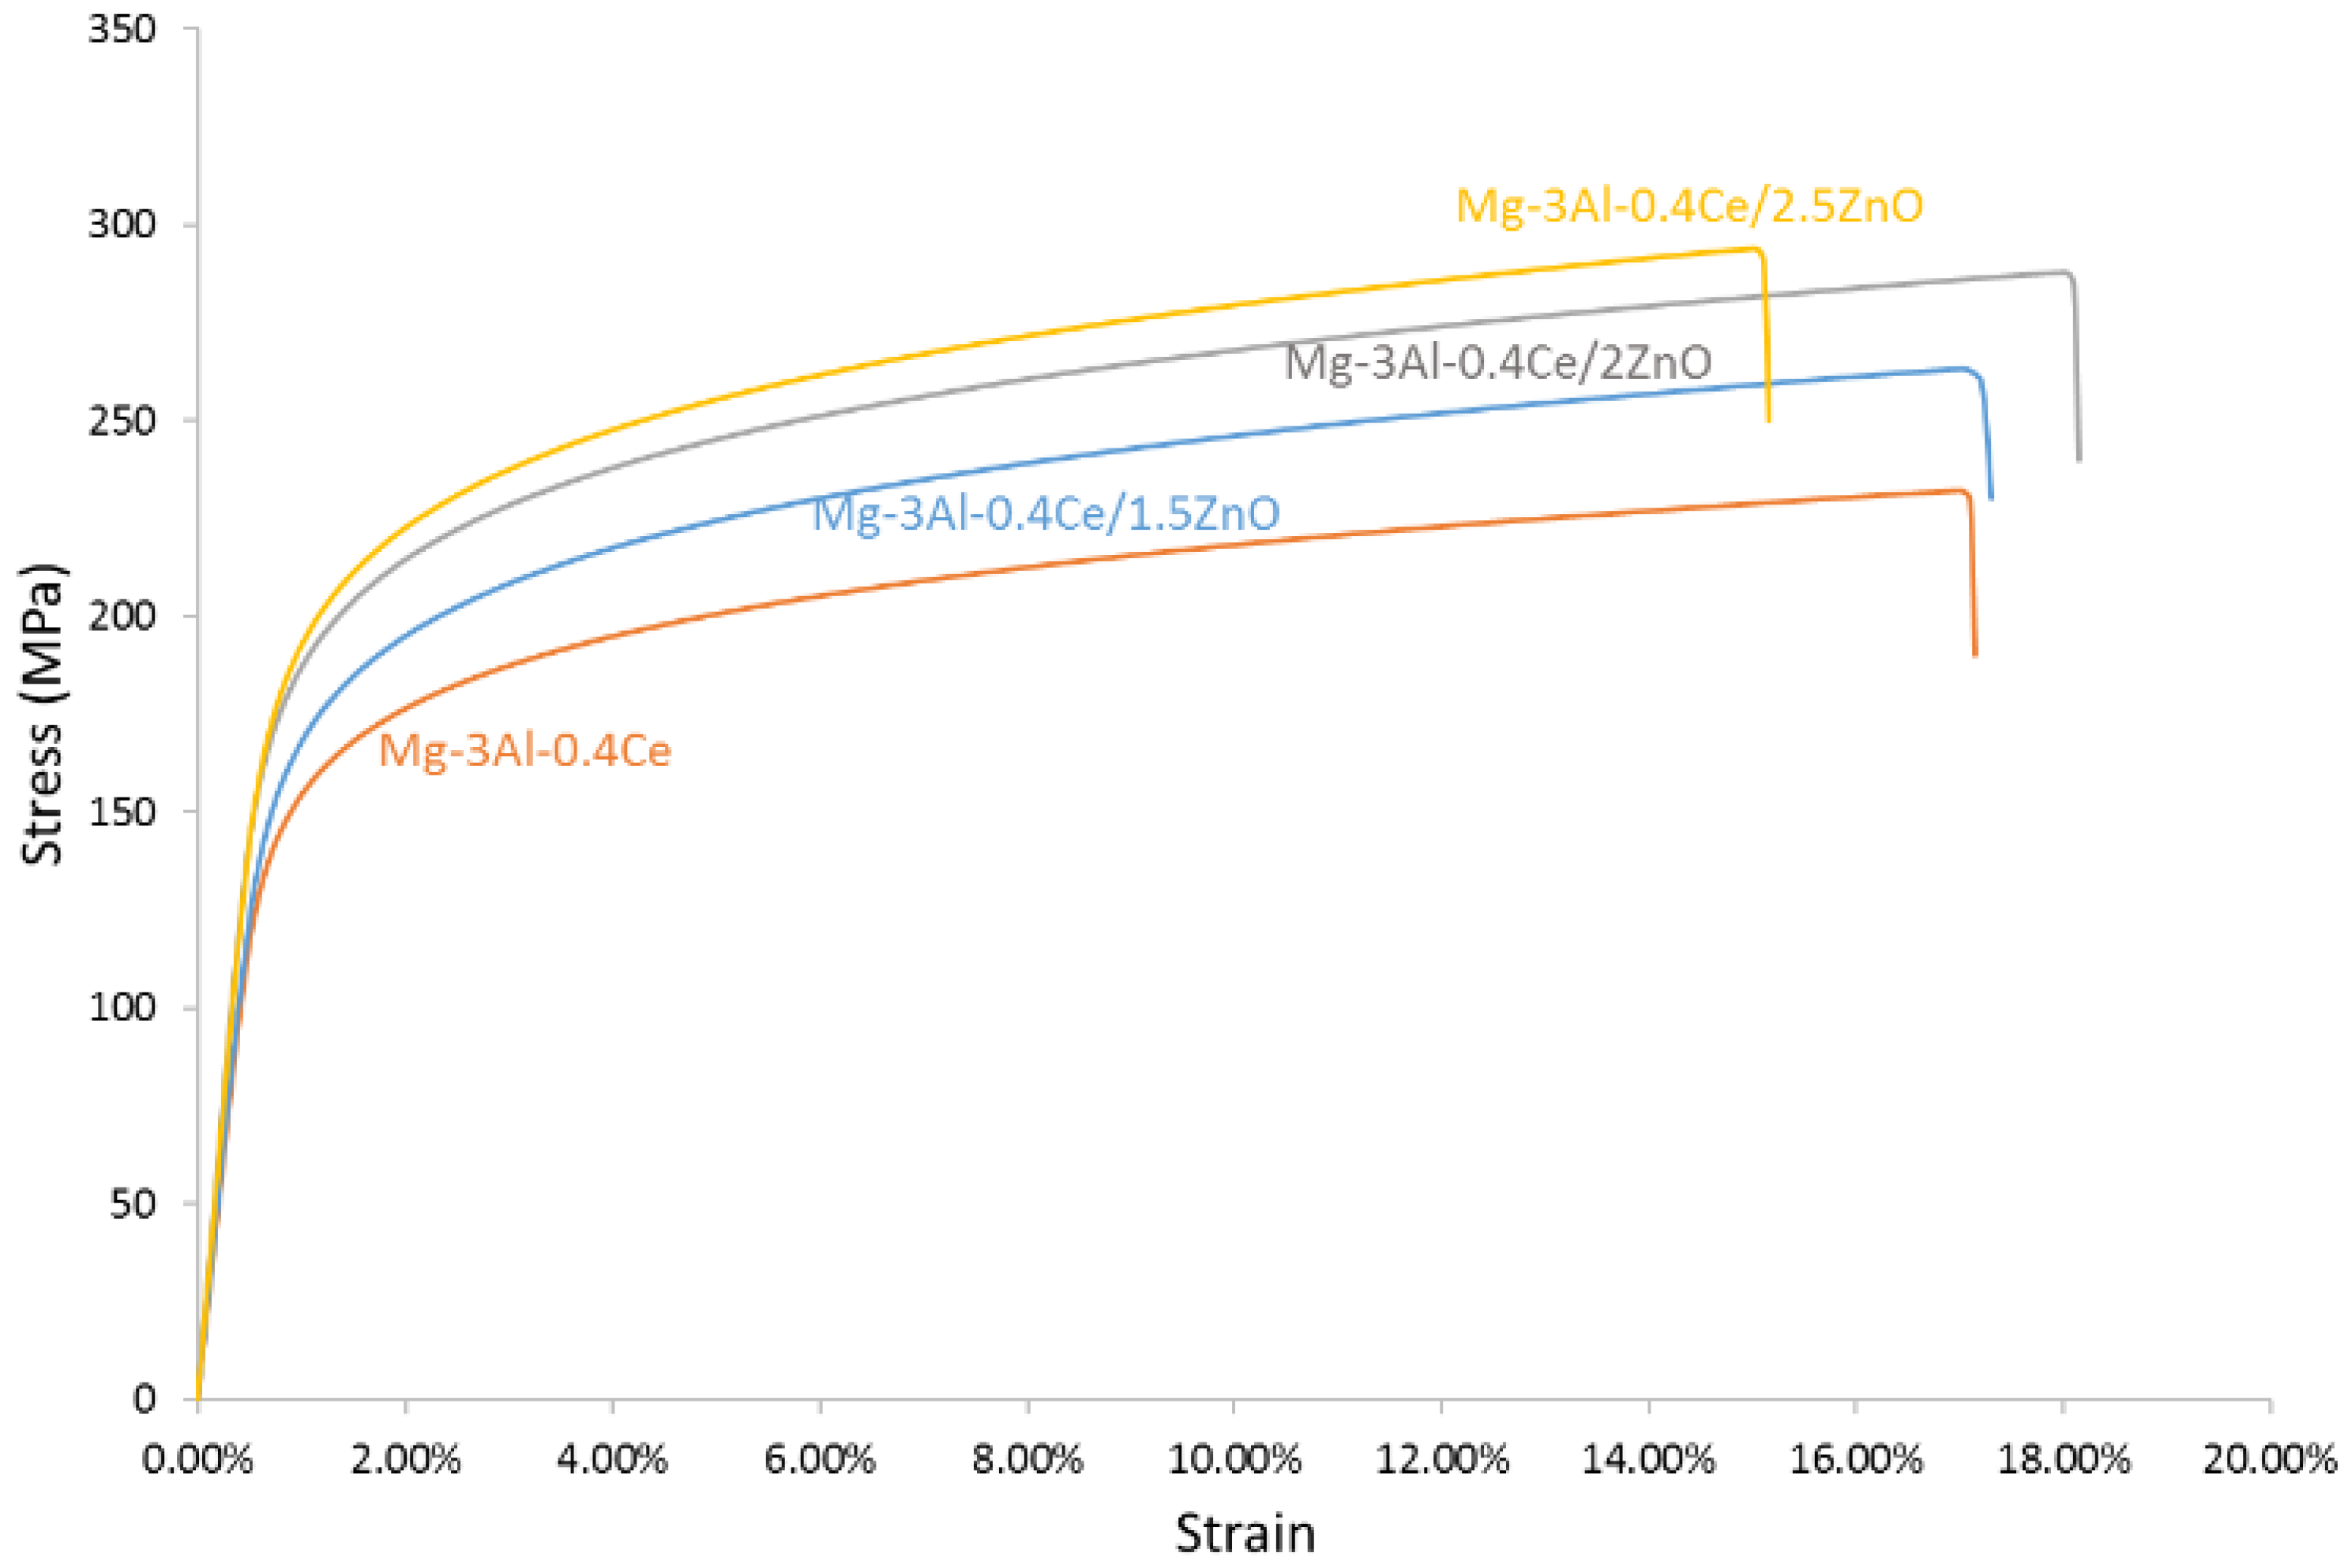
  • The addition of an increasing amount of ZnO nanoparticles led to an increase in the 0.2% offset yield strength and ultimate tensile strength, while strain to fracture remained unaffected. A maximum yield strength of 180 MPa and ultimate tensile strength of 294 MPa was achieved for the Mg-3Al-0.4Ce/2.5ZnO nanocomposite.
  • These superior mechanical properties, achieved with the addition of the ZnO nanoparticles, are attributed to the uniform distribution of the secondary phases and the presence of ZnO reinforcement.

Acknowledgments

This work was supported by the Singapore Ministry of Education Academic Research Funding (grant number WBS# R-265-000-498-112).

Author Contributions

Sravya Tekumalla and Manoj Gupta conceived and designed the experiments; Sravya Tekumalla and Najib Farhan performed the experiments, Sravya Tekumalla, Manoj Gupta, and Tirumalai S. Srivatsan analyzed the data, and all the authors wrote the paper.

Conflicts of Interest

The authors declare no conflict of interest.

References

  1. King, J.F. Magnesium: Commodity or exotic? Mater. Sci. Technol. 2007, 23, 1–14. [Google Scholar] [CrossRef]
  2. Alam, M.E.; Han, S.; Nguyen, Q.B.; Hamouda, A.M.S.; Gupta, M. Development of new magnesium based alloys and their nanocomposites. J. Alloy. Compd. 2011, 509, 8522–8529. [Google Scholar] [CrossRef]
  3. Tekumalla, S.; Seetharaman, S.; Almajid, A.; Gupta, M. Mechanical Properties of Magnesium-Rare Earth Alloy Systems: A Review. Metals 2015, 5, 1. [Google Scholar] [CrossRef]
  4. Rokhlin, L.L. Structure and properties of alloys of the Mg-REM system. Met. Sci. Heat Treat. 2006, 48, 487–490. [Google Scholar] [CrossRef]
  5. Tekumalla, S.; Seetharaman, S.; Bau, N.Q.; Wong, W.L.E.; Goh, C.S.; Shabadi, R.; Gupta, M. Influence of Cerium on the Deformation and Corrosion of Magnesium. J. Eng. Mater. Technol. 2016, 138, 031011. [Google Scholar] [CrossRef]
  6. Sankaranarayanan, S.; Nayak, U.P.; Sabat, R.; Suwas, S.; Almajid, A.; Gupta, M. Nano-ZnO particle addition to monolithic magnesium for enhanced tensile and compressive response. J. Alloy. Compd. 2014, 615, 211–219. [Google Scholar] [CrossRef]
  7. Gupta, M.; Wong, W.L.E. Magnesium-based nanocomposites: Lightweight materials of the future. Mater. Charact. 2015, 105, 30–46. [Google Scholar] [CrossRef]
  8. Luo, A.A.; Wu, W.; Mishra, R.K.; Jin, L.; Sachdev, A.K.; Ding, W. Microstructure and Mechanical Properties of Extruded Magnesium-Aluminum-Cerium Alloy Tubes. Metall. Mater. Trans. A 2010, 41, 2662–2674. [Google Scholar] [CrossRef]
  9. Song, Y.L.; Liu, Y.H.; Wang, S.H.; Yu, S.R.; Zhu, X.Y. Effect of cerium addition on microstructure and corrosion resistance of die cast AZ91 magnesium alloy. Mater. Corros. 2007, 58, 189–192. [Google Scholar] [CrossRef]
  10. Zhang, J.; Leng, Z.; Zhang, M.; Meng, J.; Wu, R. Effect of Ce on microstructure, mechanical properties and corrosion behavior of high-pressure die-cast Mg-4Al-based alloy. J. Alloy. Compd. 2011, 509, 1069–1078. [Google Scholar] [CrossRef]
  11. Nguyen, Q.B.; Gupta, M. Increasing significantly the failure strain and work of fracture of solidification processed AZ31B using nano-Al2O3 particulates. J. Alloy. Compd. 2008, 459, 244–250. [Google Scholar] [CrossRef]
  12. Nayyeri, M.J.; Ganjkhanlou, Y.; Kolahi, A.; Jamili, A.M. Effect of Ca and Rare Earth Additions on the Texture, Microhardness, Microstructure and Structural Properties of As-Cast Mg–4Al–2Sn Alloys. Trans. Indian Inst. Met. 2014, 67, 469–475. [Google Scholar] [CrossRef]
  13. Yahya, N.; Puspitasari, P.; Latiff, N.R.A. Characterization and Development of Biosystems and Biomaterials; Springer: Berlin/Heidelberg, Germany, 2013; pp. 9–32. [Google Scholar]
  14. Zhaoxu, D.; Daining, F.; Kah, S.A. On the effect of nano-particle clustering on toughening of nano-composite ceramics. Acta Mech. Sin. 2002, 18, 146–158. [Google Scholar] [CrossRef]
Figure 1. Images observed under an optical microscope for: (a) Mg-3Al-0.4Ce; (b) Mg-3Al-0.4Ce-1.5ZnO; (c) Mg-3Al-0.4Ce-2ZnO and (d) Mg-3Al-0.4Ce-2.5ZnO.
Metals 06 00276 g001
Figure 2. Images observed under SEM for: (a) Mg-3Al-0.4Ce; (b) Mg-3Al-0.4Ce-1.5ZnO; (c) Mg-3Al-0.4Ce-2ZnO and (d) Mg-3Al-0.4Ce-2.5ZnO.
Metals 06 00276 g002
Figure 3. X-ray diffraction patterns.
Metals 06 00276 g003
Figure 4. EDS analysis of the phases (a) Mg-Al matrix; (b) circular Mg17Al12 phase; (c) rod shaped Al11Ce3 phase and (d) ZnO nanoparticles (in a high magnification image of Mg-3Al-0.4Ce-1.5ZnO showing nano-particle distribution).
Metals 06 00276 g004aMetals 06 00276 g004b
Figure 5. Engineering tensile stress strain curves.
Metals 06 00276 g005
Figure 6. Fracture surfaces of the (a) Mg-3Al-0.4Ce alloy; (b) Mg-3Al-0.4Ce-1.5ZnO; (c) Mg-3Al-0.4Ce-2ZnO and (d) Mg-3Al-0.4Ce-2.5ZnO nanocomposites.
Metals 06 00276 g006
Table 1. Density, Porosity, and Grain size results.
CompositionExperimental Density (g/cm3)Theoretical Density (g/cm3)Porosity (%)Grain Size (µm)
Mg-3Al-0.4Ce1.759 ± 0.0131.7620.2016.5 ± 1.5
Mg-3Al-0.4Ce-1.5ZnO1.779 ± 0.012 (↑ 1.13%) 11.7810.1206.4 ± 1.5
Mg-3Al-0.4Ce-2ZnO1.783 ± 0.013 (↑ 1.36%) 11.7870.2356.1 ± 1.5
Mg-3Al-0.4Ce-2.5ZnO1.774 ± 0.028 (↑ 0.85%) 11.7941.0806.0 ± 1.6
1 (↑ x%) corresponds to an increase in the density by x% as compared to the monolithic alloy.
Table 2. CTE results.
CompositionCTE (µK−1)
Mg-3Al-0.4Ce25.52 ± 0.8
Mg-3Al-0.4Ce-1.5ZnO22.03 ± 1.0
Mg-3Al-0.4Ce-2ZnO24.16 ± 2.0
Mg-3Al-0.4Ce-2.5ZnO24.36 ± 0.6
Table 3. Tensile test results.
CompositionMicrohardness (Hv)0.2% Offset Tensile Yield Strength (MPa)Ultimate Tensile Strength (MPa)Fracture Strain (%)
Mg-3Al-0.4Ce105 ± 4144 ± 8232 ± 1117 ± 1
Mg-3Al-0.4Ce-1.5ZnO113 ± 3 (↑ 7.6%) 1157 ± 8 (↑ 9%) 1263 ± 8 (↑ 13%) 117 ± 5
Mg-3Al-0.4Ce-2ZnO144 ± 4 (↑ 37.1%) 1173 ± 11 (↑ 20%) 1288 ± 11 (↑ 24%) 118 ± 2
Mg-3Al-0.4Ce-2.5ZnO161 ± 5 (↑ 53.3%) 1180 ± 7 (↑ 25%) 1294 ± 9 (↑ 27%) 115 ± 2
Mg-3Al-0.2Ce [8]-120235-
Mg-3Al-0.5Ce [8]-125230-
1 (↑ x%) corresponds to an increase in the respective property by x% as compared to the monolithic alloy.

