3. Results
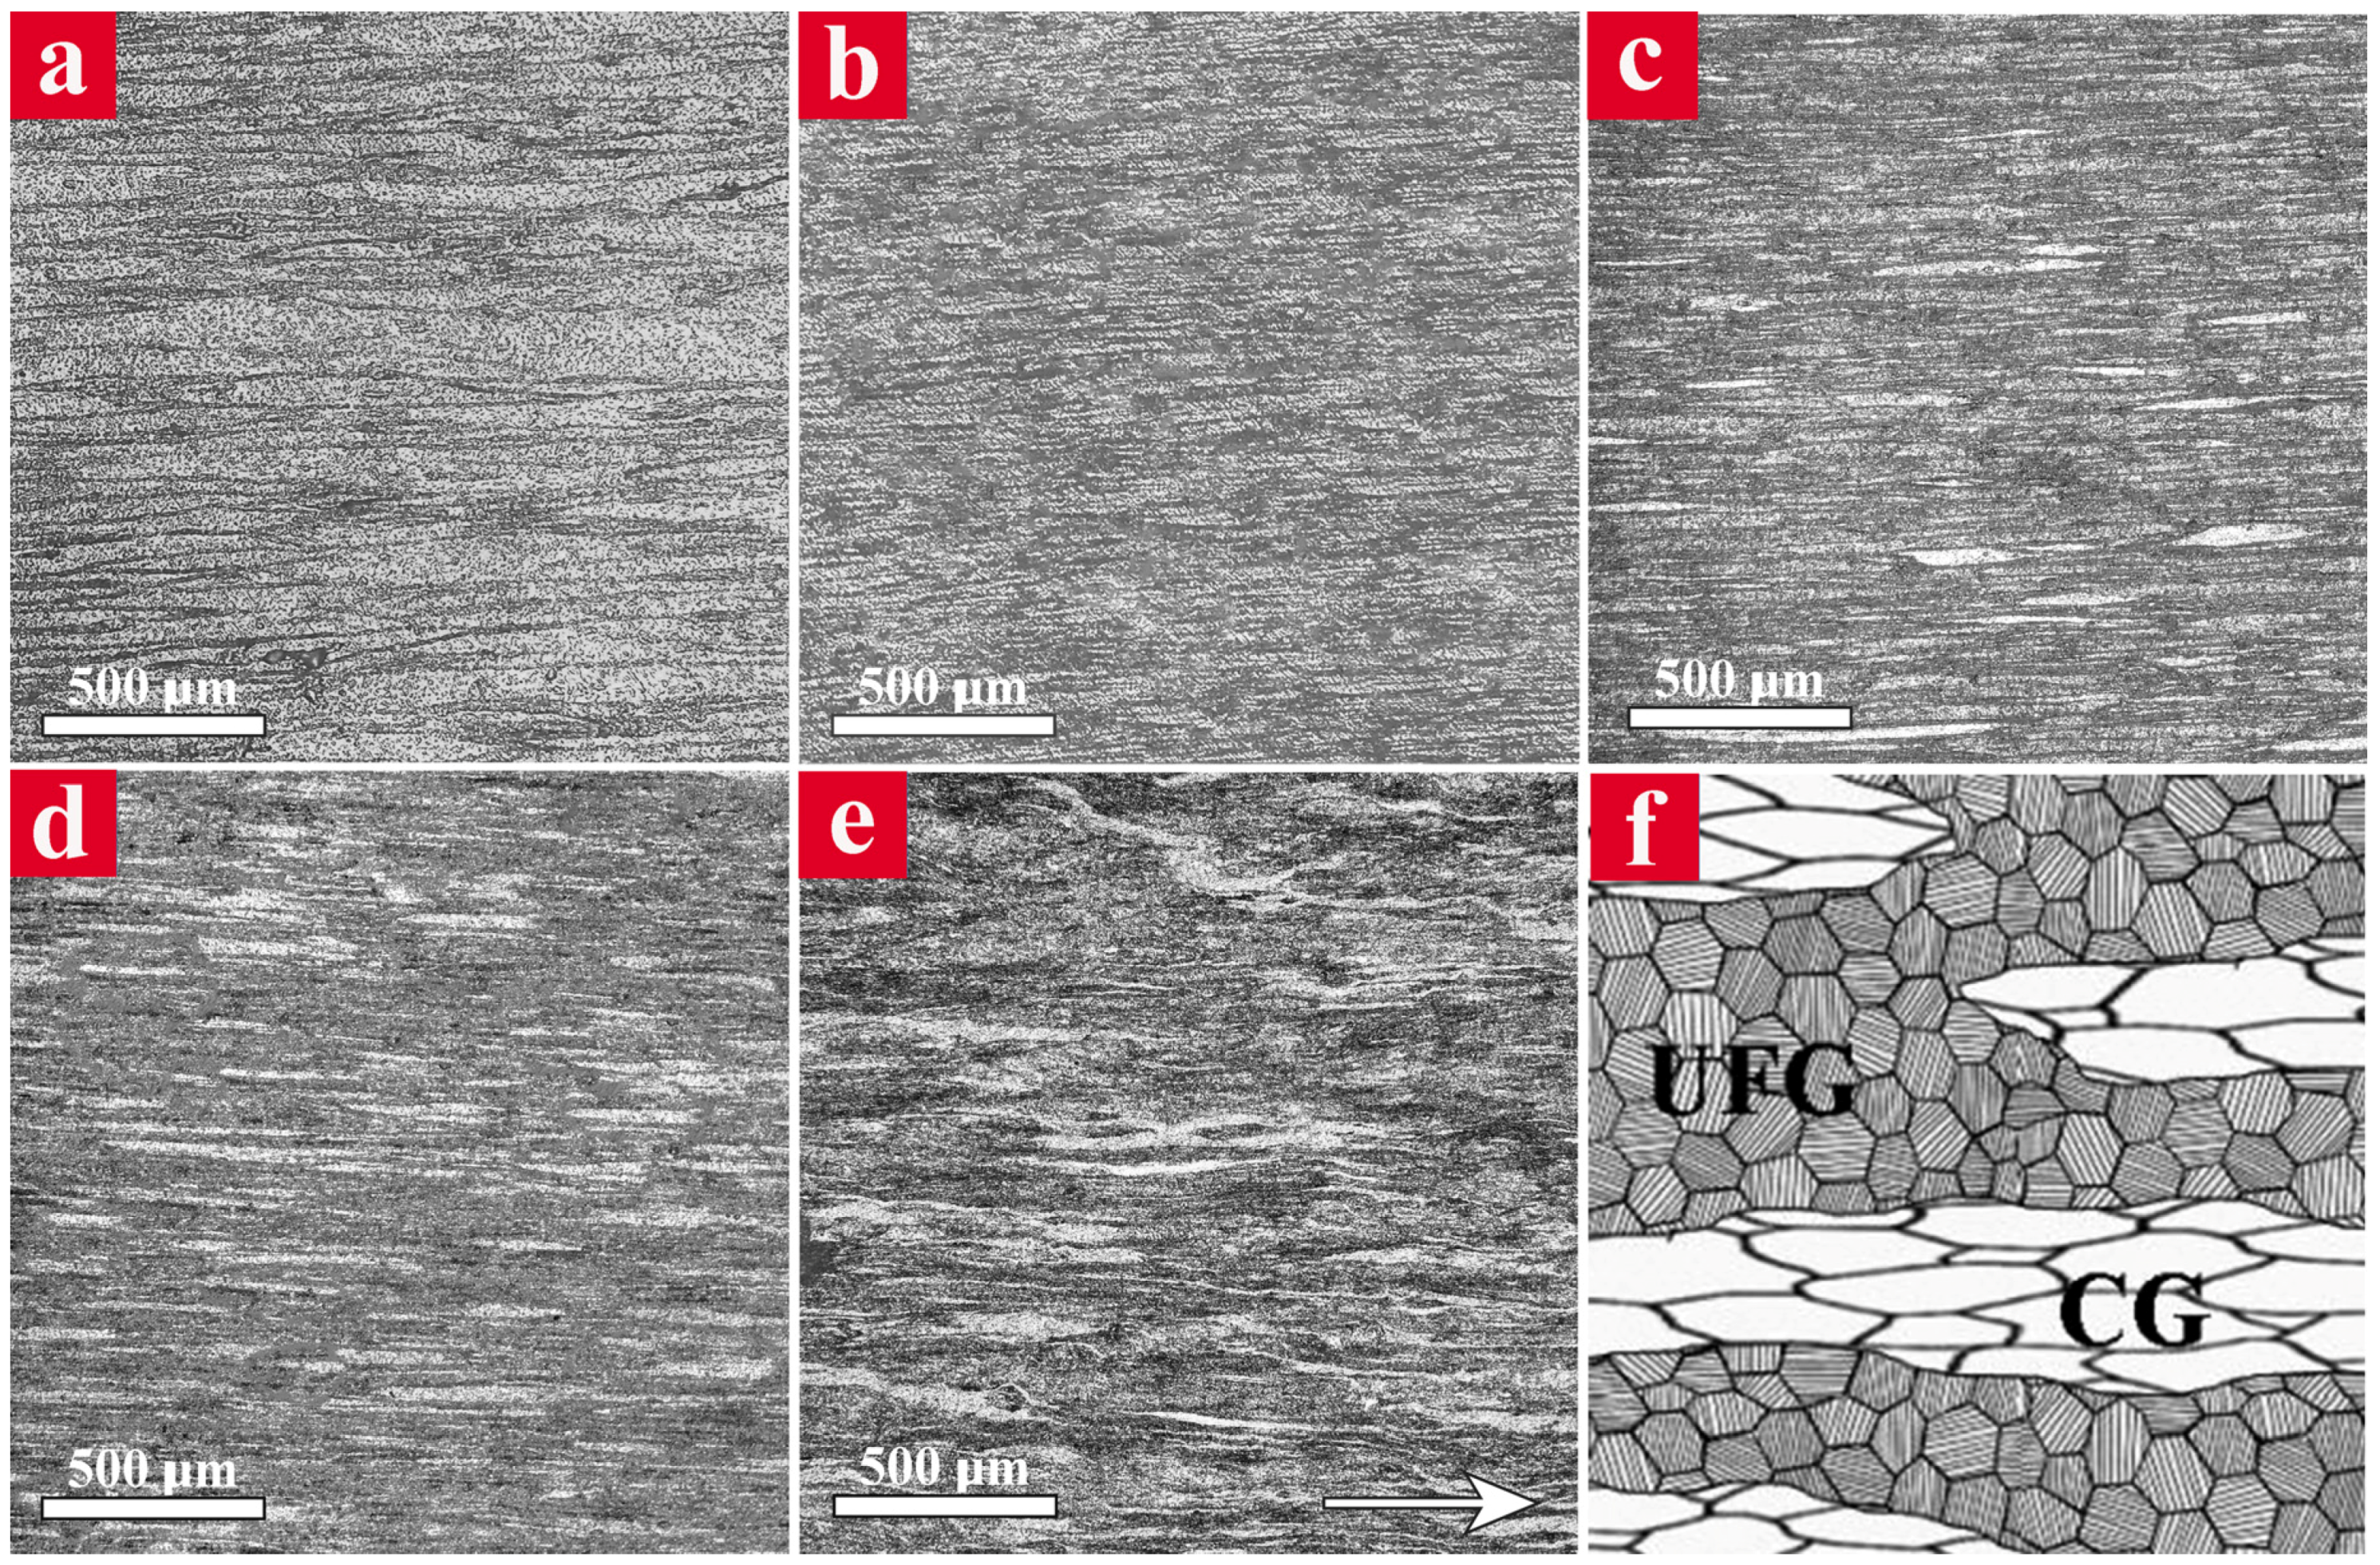
The OM micrographs of the extrudates parallel to the extrusion direction are shown in
Figure 1. The CG and UFG specimens demonstrated a relatively uniform microstructure including coarse and ultrafine Al grains elongated along the extrusion direction, respectively (
Figure 1a,b). The microstructure of bimodal specimens (
Figure 1c–e) consisted of light and dark regions in which the former corresponds to the CGs and the latter is attributed to the UFGs. It is clear that the elongated CG regions are embedded in the continuous UFG matrix and their fraction increases as the amount of unmilled particles in the initial powder mixture increases. The schematic illustration of a bimodal microstructure is also shown in
Figure 1f, which shows the white CG regions elongated through extrusion direction within the dark UFG matrix.
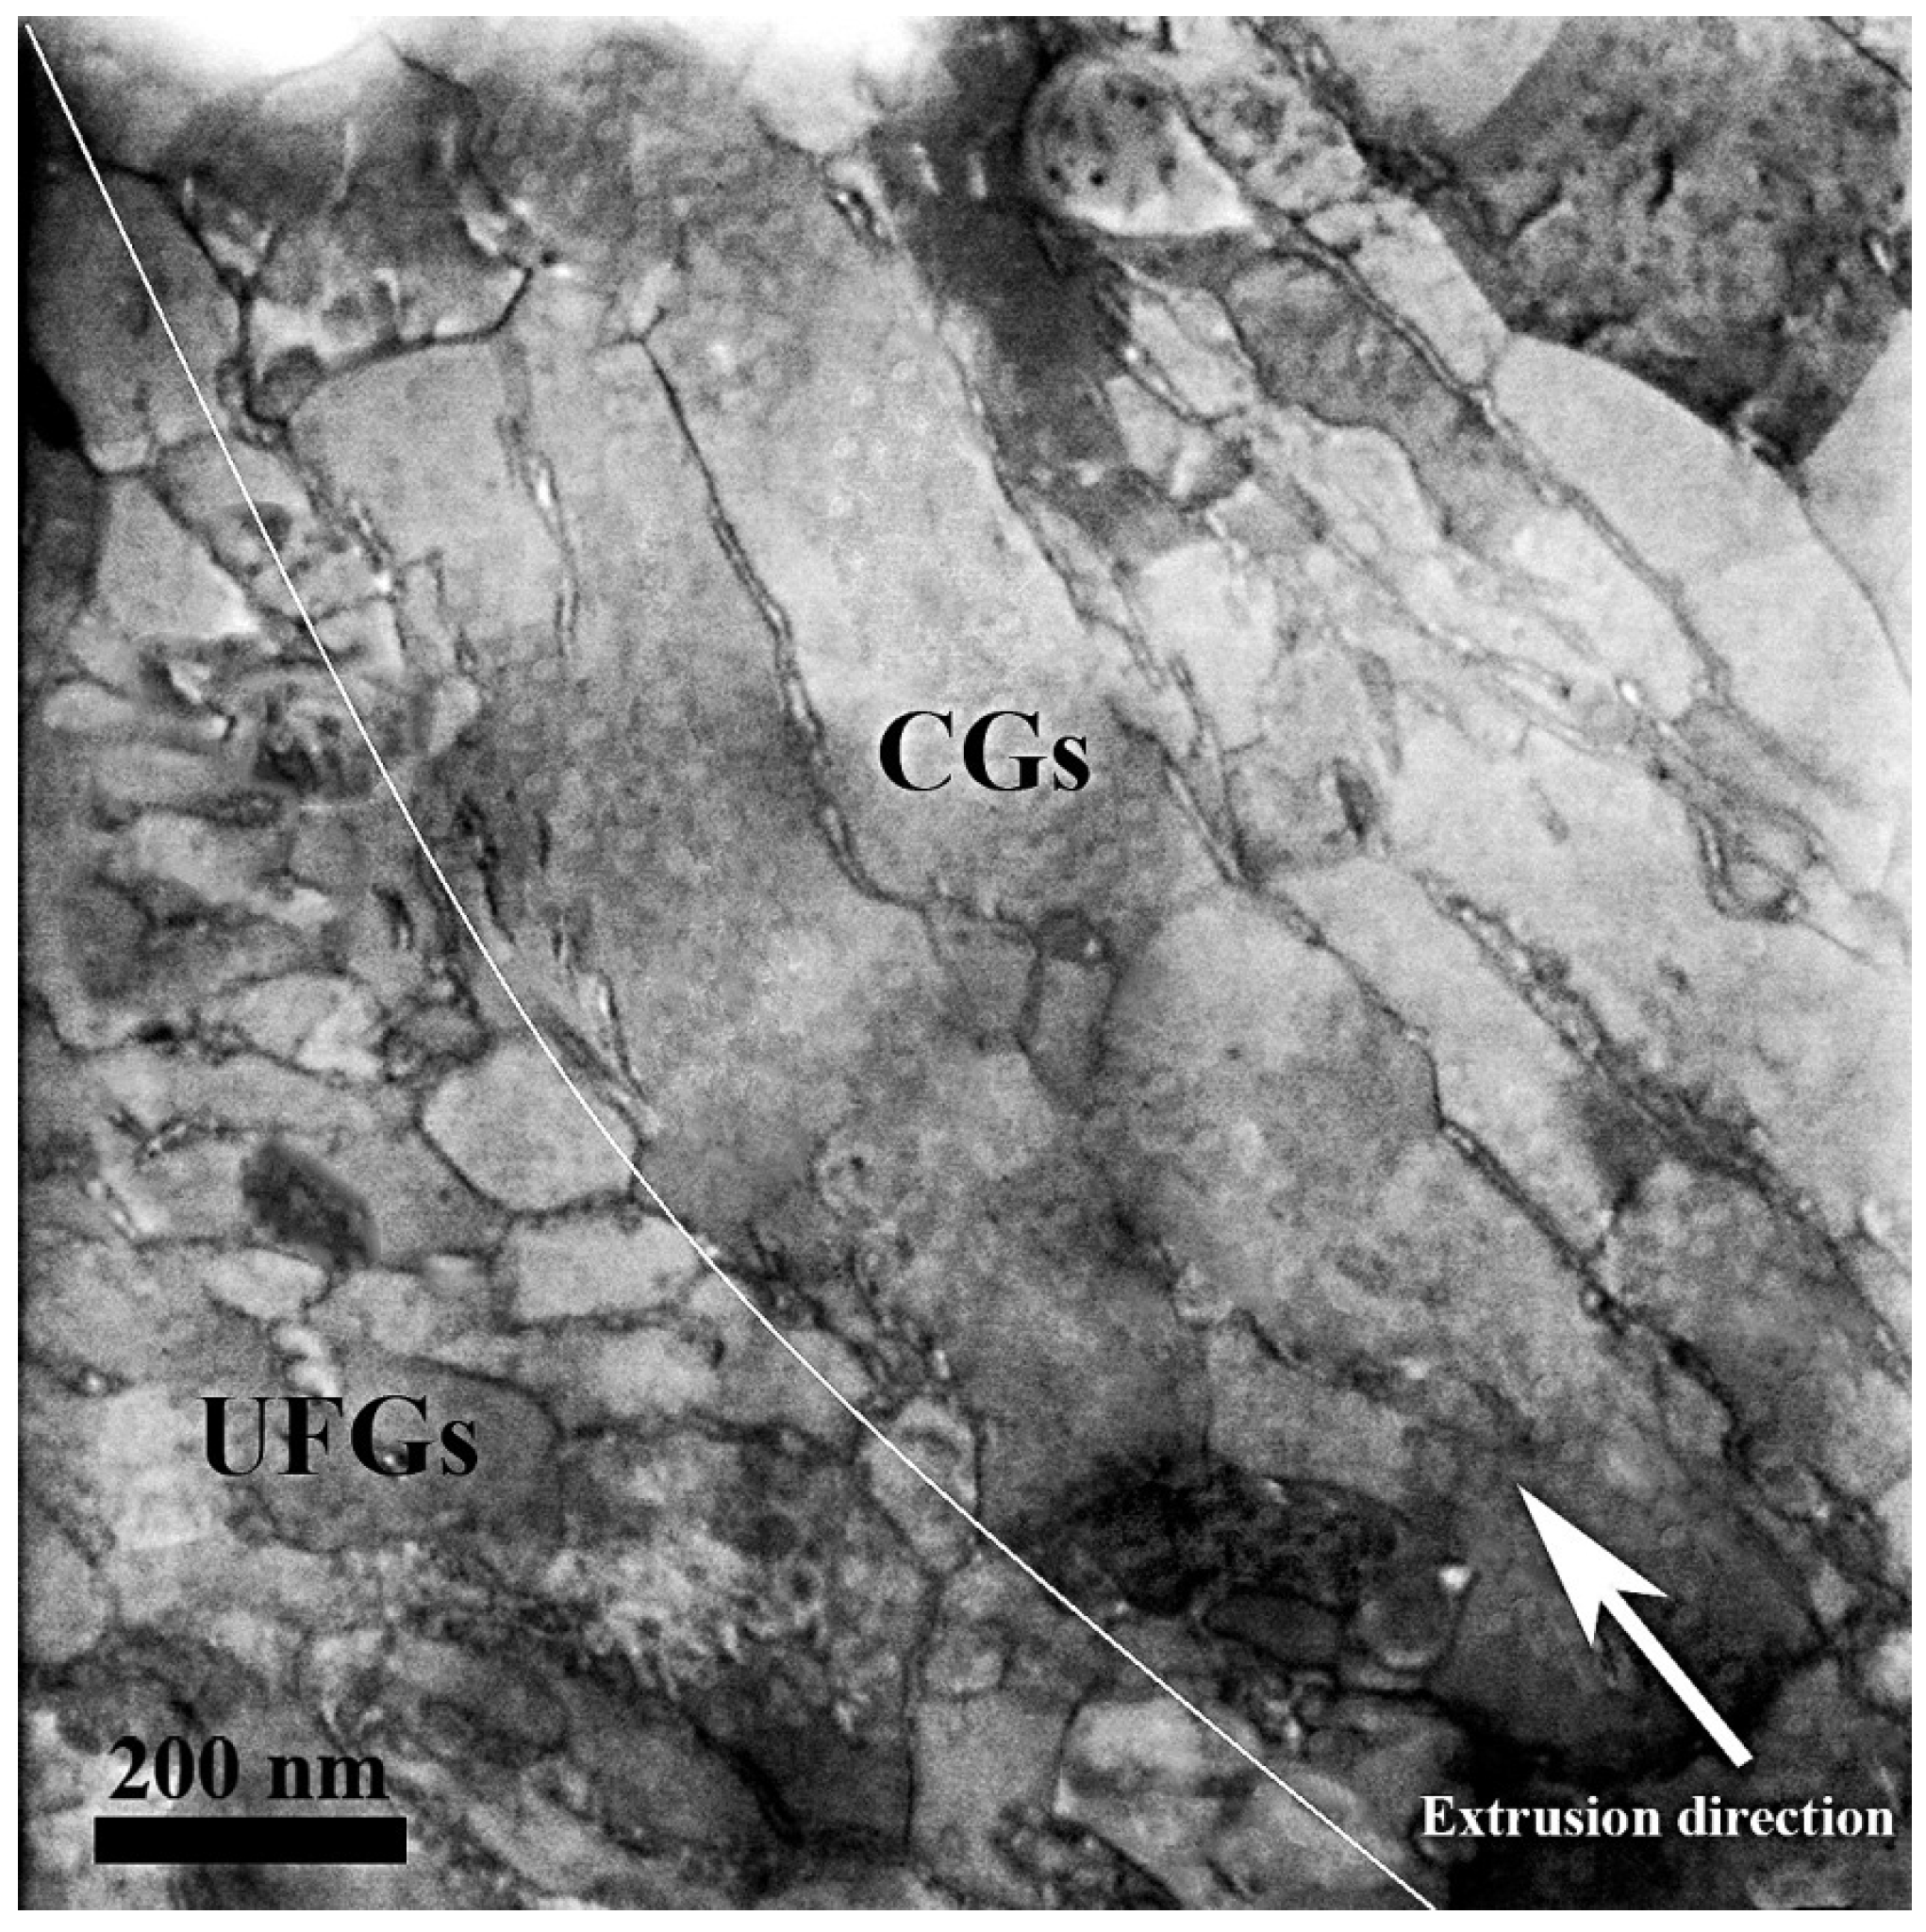
In
Figure 2, a typical STEM image from the microstructure of bimodal specimens is illustrated in order to distinguish the grain-size distribution at a higher magnification. The interface between CG and UFG regions has been elucidated by a white curve on the STEM image. In the CG region, the large and elongated grains are observed while several fine and equiaxed grains in the order of 200 nm is observed in the UFG region.
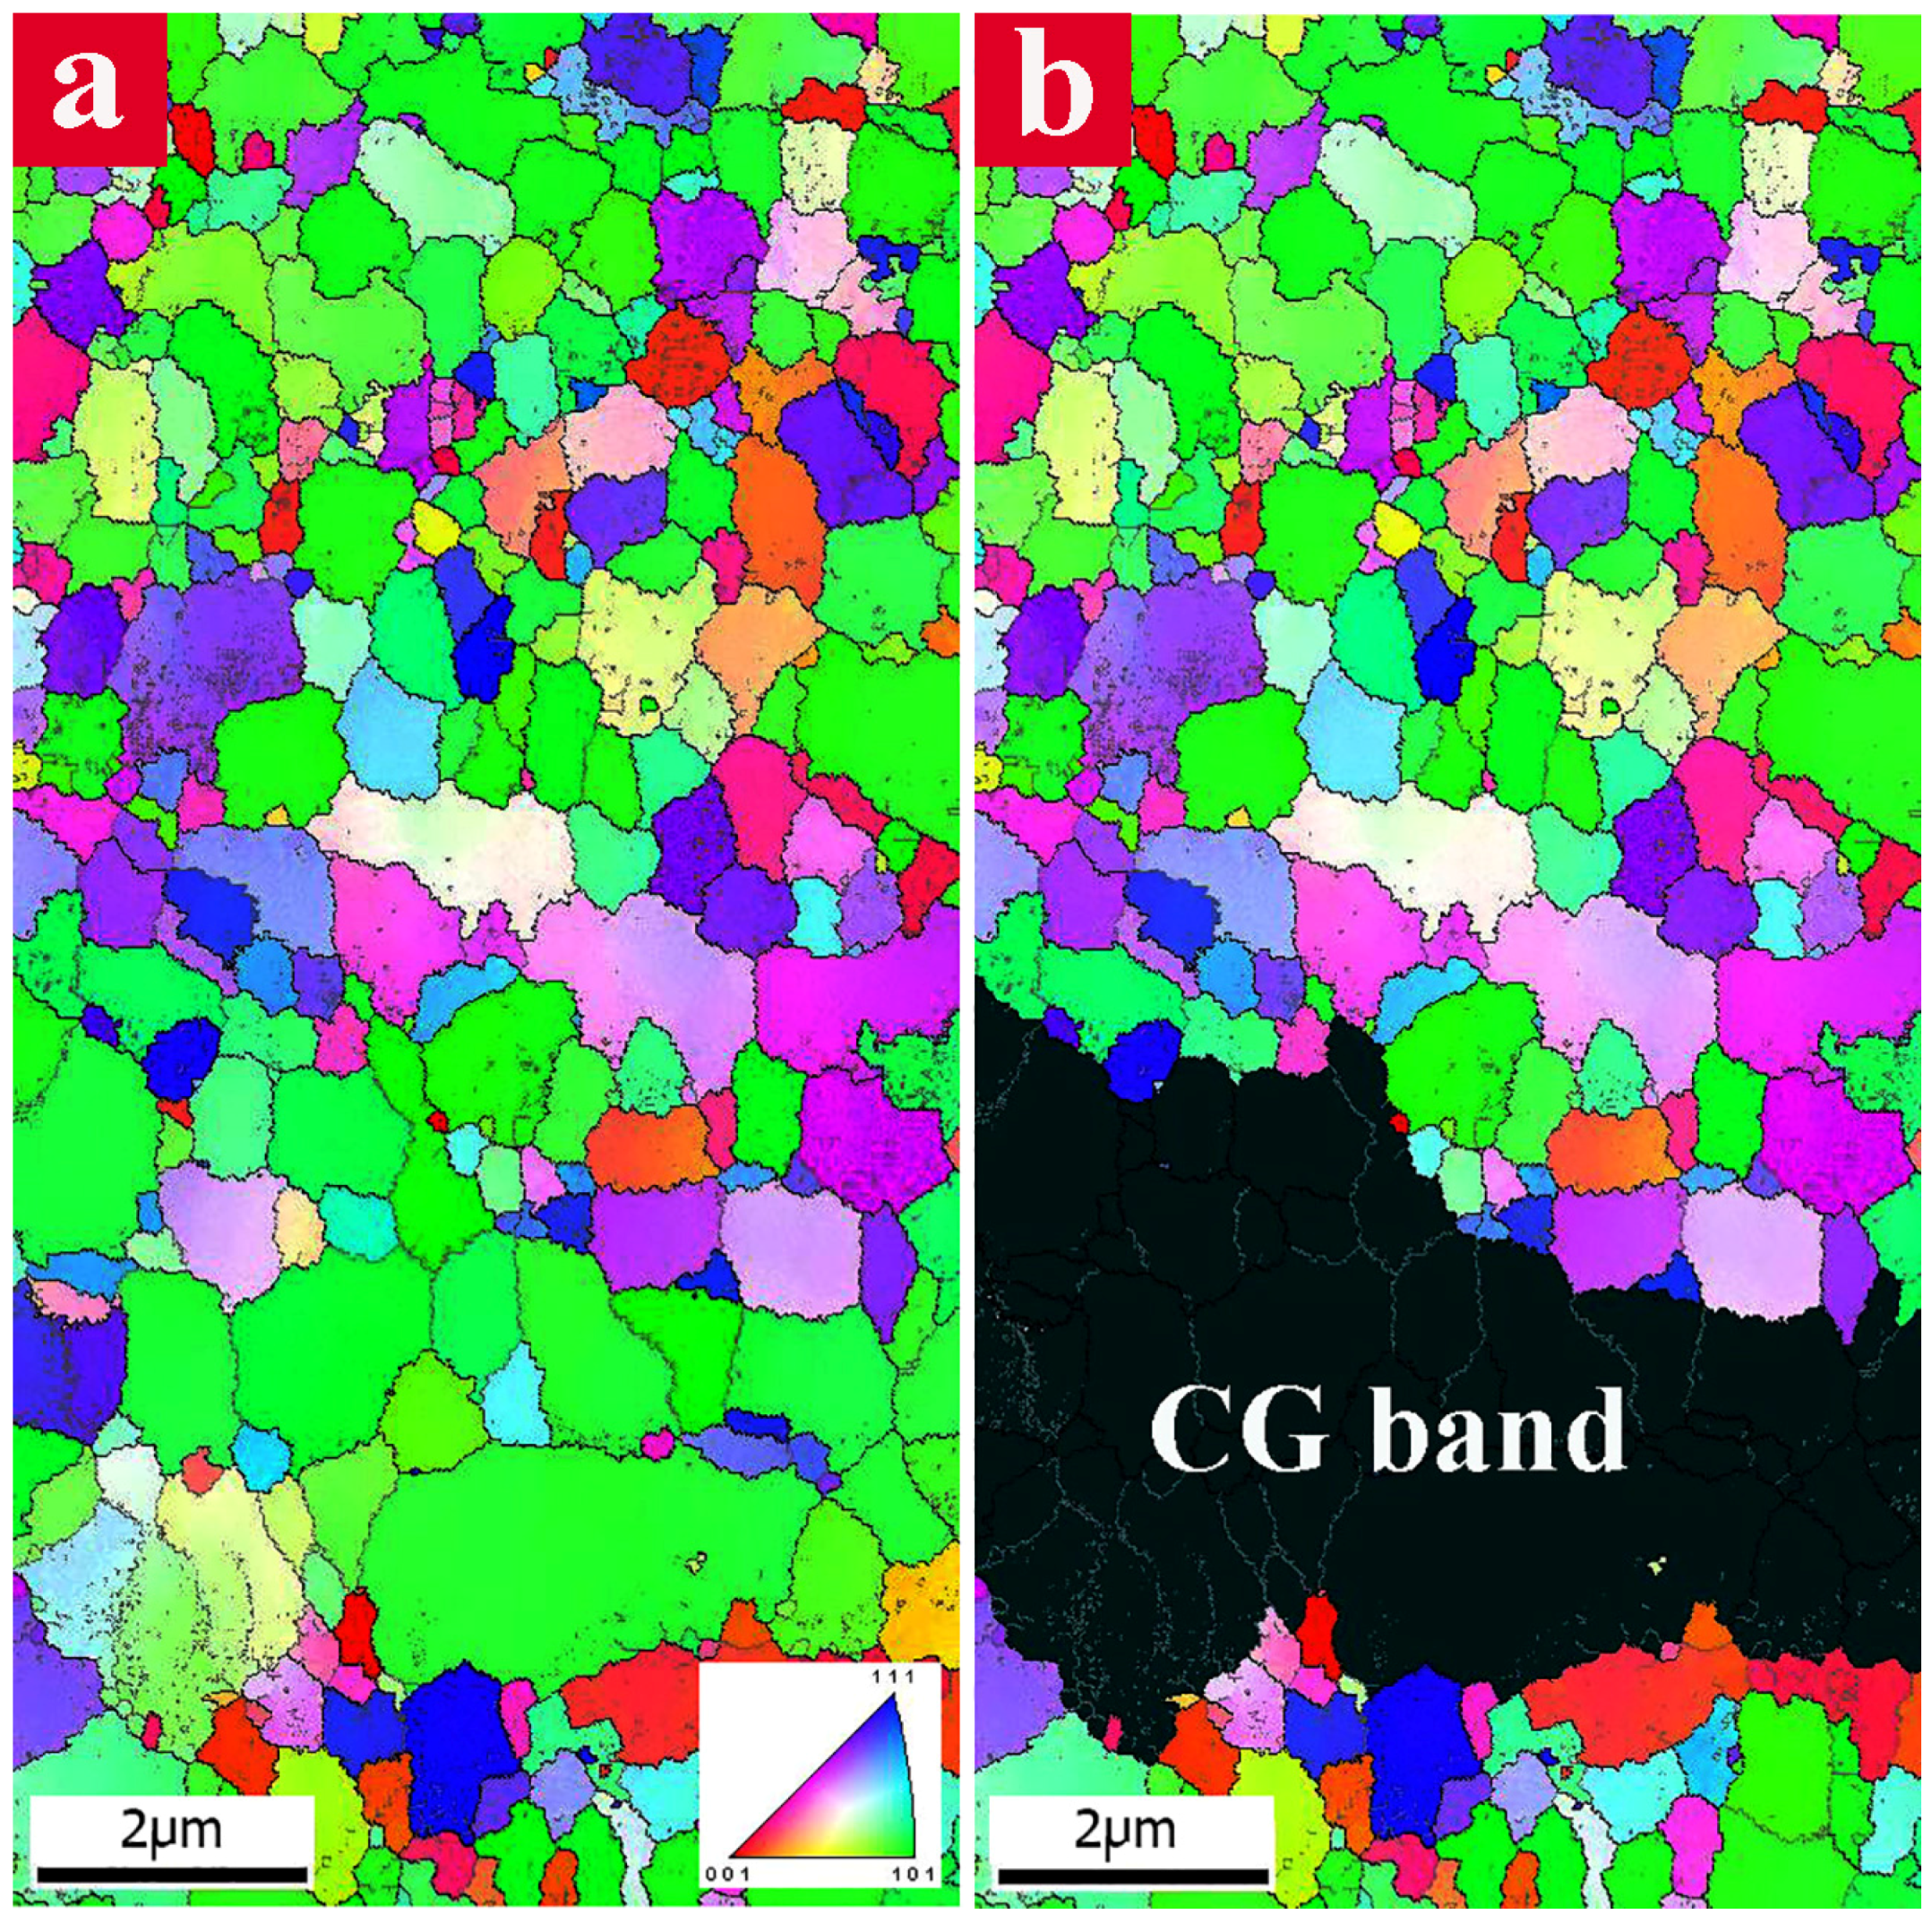
Figure 3 exhibits the EBSD color-coded inverse pole figure map of the bimodal specimen containing 30 vol. % CG. The bimodal distribution of the grains in the microstructure can be clearly observed in
Figure 3a. For better distinguishing the microstructural features, a CG band within the UFG matrix was highlighted as a black region and is shown in
Figure 3b. An elongated CG network structure is observed in the direction parallel to extrusion. The CG band represents a preferential crystallographic direction of (101) which is the favored crystallographic slip direction in the face-centered cubic (FCC) lattice.
Nevertheless, there are many dissimilar colors in the EBSD map of the UFG areas revealing the noteworthy differences in the orientation of neighbor grains. The evaluation of the grain-size distribution using EBSD analysis shows that the grain size of the UFG matrix is in the range of 0.08 to 1.2 µm while the CG regions consisted of large grains in the order of several micrometers. In the EBSD map, low-angle grain boundaries (LABs) with misorientation angle between 2° and 15° and high-angle grain boundaries (HABs) with misorientation angle larger than 15° were defined by white and black lines, respectively.
Distribution of misorientation angles exhibited the presence of a large fraction of HABs (~68%) primarily situated around UFGs. Meanwhile, LABs are mainly aggregated within the CG regions.
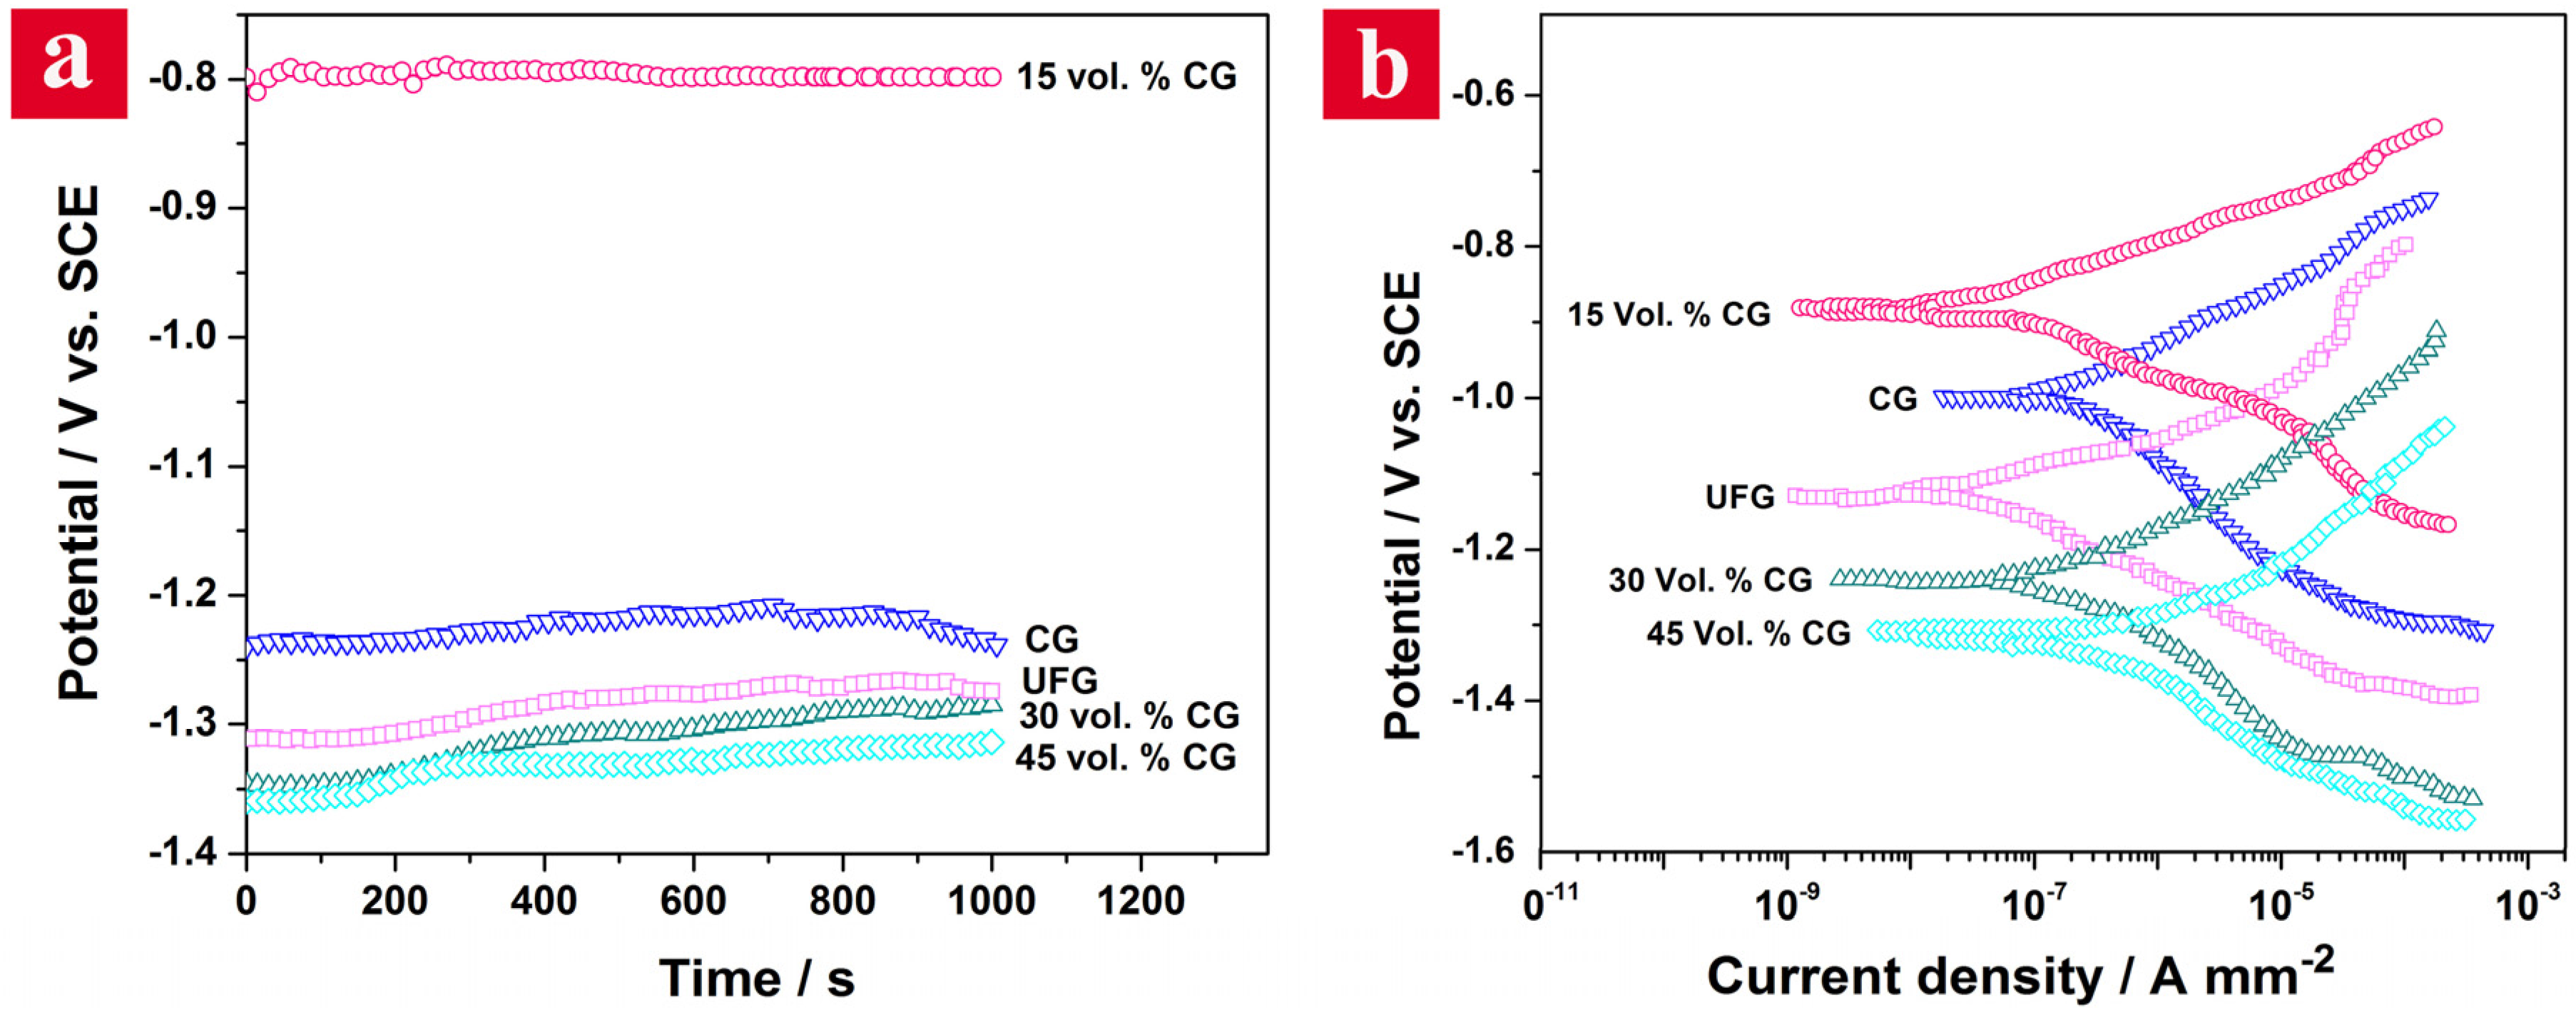
Figure 4 shows the OCP and Tafel curves of CG, UFG and bimodal samples in 3.5% NaCl solution. According to
Figure 4a, OCPs of the samples increase as a function of exposure time indicating the growth of a passive oxide film on their surfaces. Furthermore, OCPs exhibit some fluctuations that can be attributed to the frequent formation and breakdown of the oxide layer in some regions. All the OCPs tend to stabilize with immersion time. The 15 vol. % CG bimodal alloy displays the highest OCP value (~−0.8 V vs. SCE) indicating its highest thermodynamic stability among the samples. On the other hand, the bimodal alloy containing 45 vol. % CG shows the lowest OCP value in 3.5% NaCl solution.
The Tafel plots of the examined plain and bimodal Al6063 alloys are presented in
Figure 4b. It is clear that the polarization behavior of all samples is similar. Regarding the electrochemical data given in
Table 1, it is apparent that the order of the corrosion potential (
Ecorr) of the samples is in a good accordance with their OCPs.
The UFG sample demonstrates a less noble corrosion potential compared with the CG alloy. The corrosion potential of the bimodal samples shifts negatively by increasing the amount of CG phase; e.g.,
Ecorr decreases from ~−0.883 V for the 15 vol. % CG bimodal sample to ~−1.302 V for the 45 vol. % CG bimodal alloy. The bimodal sample containing 15 vol. % CG phase, owing to its highest corrosion potential, is the most noble and has the least tendency to corrosion in the corrosive media among various Al6063 microstructures. As is well known, the
Ecorr value represents the intersection between the anodic and cathodic kinetics (which in this case can change differently as a result of different grain-size distributions), it is frequently used for general reporting. However, the
icorr data represents the kinetic information about reactions. Variations in the value of current density suggests changes of dissolution rate. The polarization results depict that
icorr of the UFG sample (~0.389 µA·cm
−2) is extremely lower than that of the CG counterpart (~4.911 µA·cm
−2) which implies the higher corrosion resistance of the UFG specimen. On the other hand,
icorr of the 15 vol. % CG bimodal sample is lower than
icorr of the UFG alloy while
icorr of the 45 vol. % CG bimodal sample is higher than
icorr of the CG material. Nevertheless, the corrosion current density of the bimodal sample containing 30 vol. % CGs is between CG and UFG samples. Thus, the bimodal samples containing 15 and 45 vol. % CG phase have the highest and the lowest corrosion resistance, respectively. The Stern-Geary equation [
25] was used to determine the corrosion rate of the samples from polarization data. According to
Table 1, the corrosion rate of the samples can be arranged as 45 vol. % CG > CG > 30 vol. % CG > UFG > 15 vol. % CG. Consequently, the 15 vol. % CG bimodal sample has the lowest corrosion rate (~0.130 μA·cm
−2) revealing its excellent corrosion resistance in 3.5% NaCl solution. The reduction in the corrosion rate with changing of the content of CGs distributed in the UFG matrix in different bimodal samples appears to be non-monotonic which must be investigated precisely in terms of the metallurgical microstructure impact on the kinetics of corresponding chemical reactions. The steady-state cyclic polarization (CP) behavior was studied in order to interpret the kinetic basis of corrosion improvement and also the passivation and pitting characteristics in bimodal microstructure. Remarkable differences in the polarization behavior of different samples were observed, even though the material has the identical bulk chemistry. In the samples with an enhanced corrosion resistance, the considerable decrease in
icorr can either be a result of decreasing the rate of anodic reactions, cathodic reactions, or both.
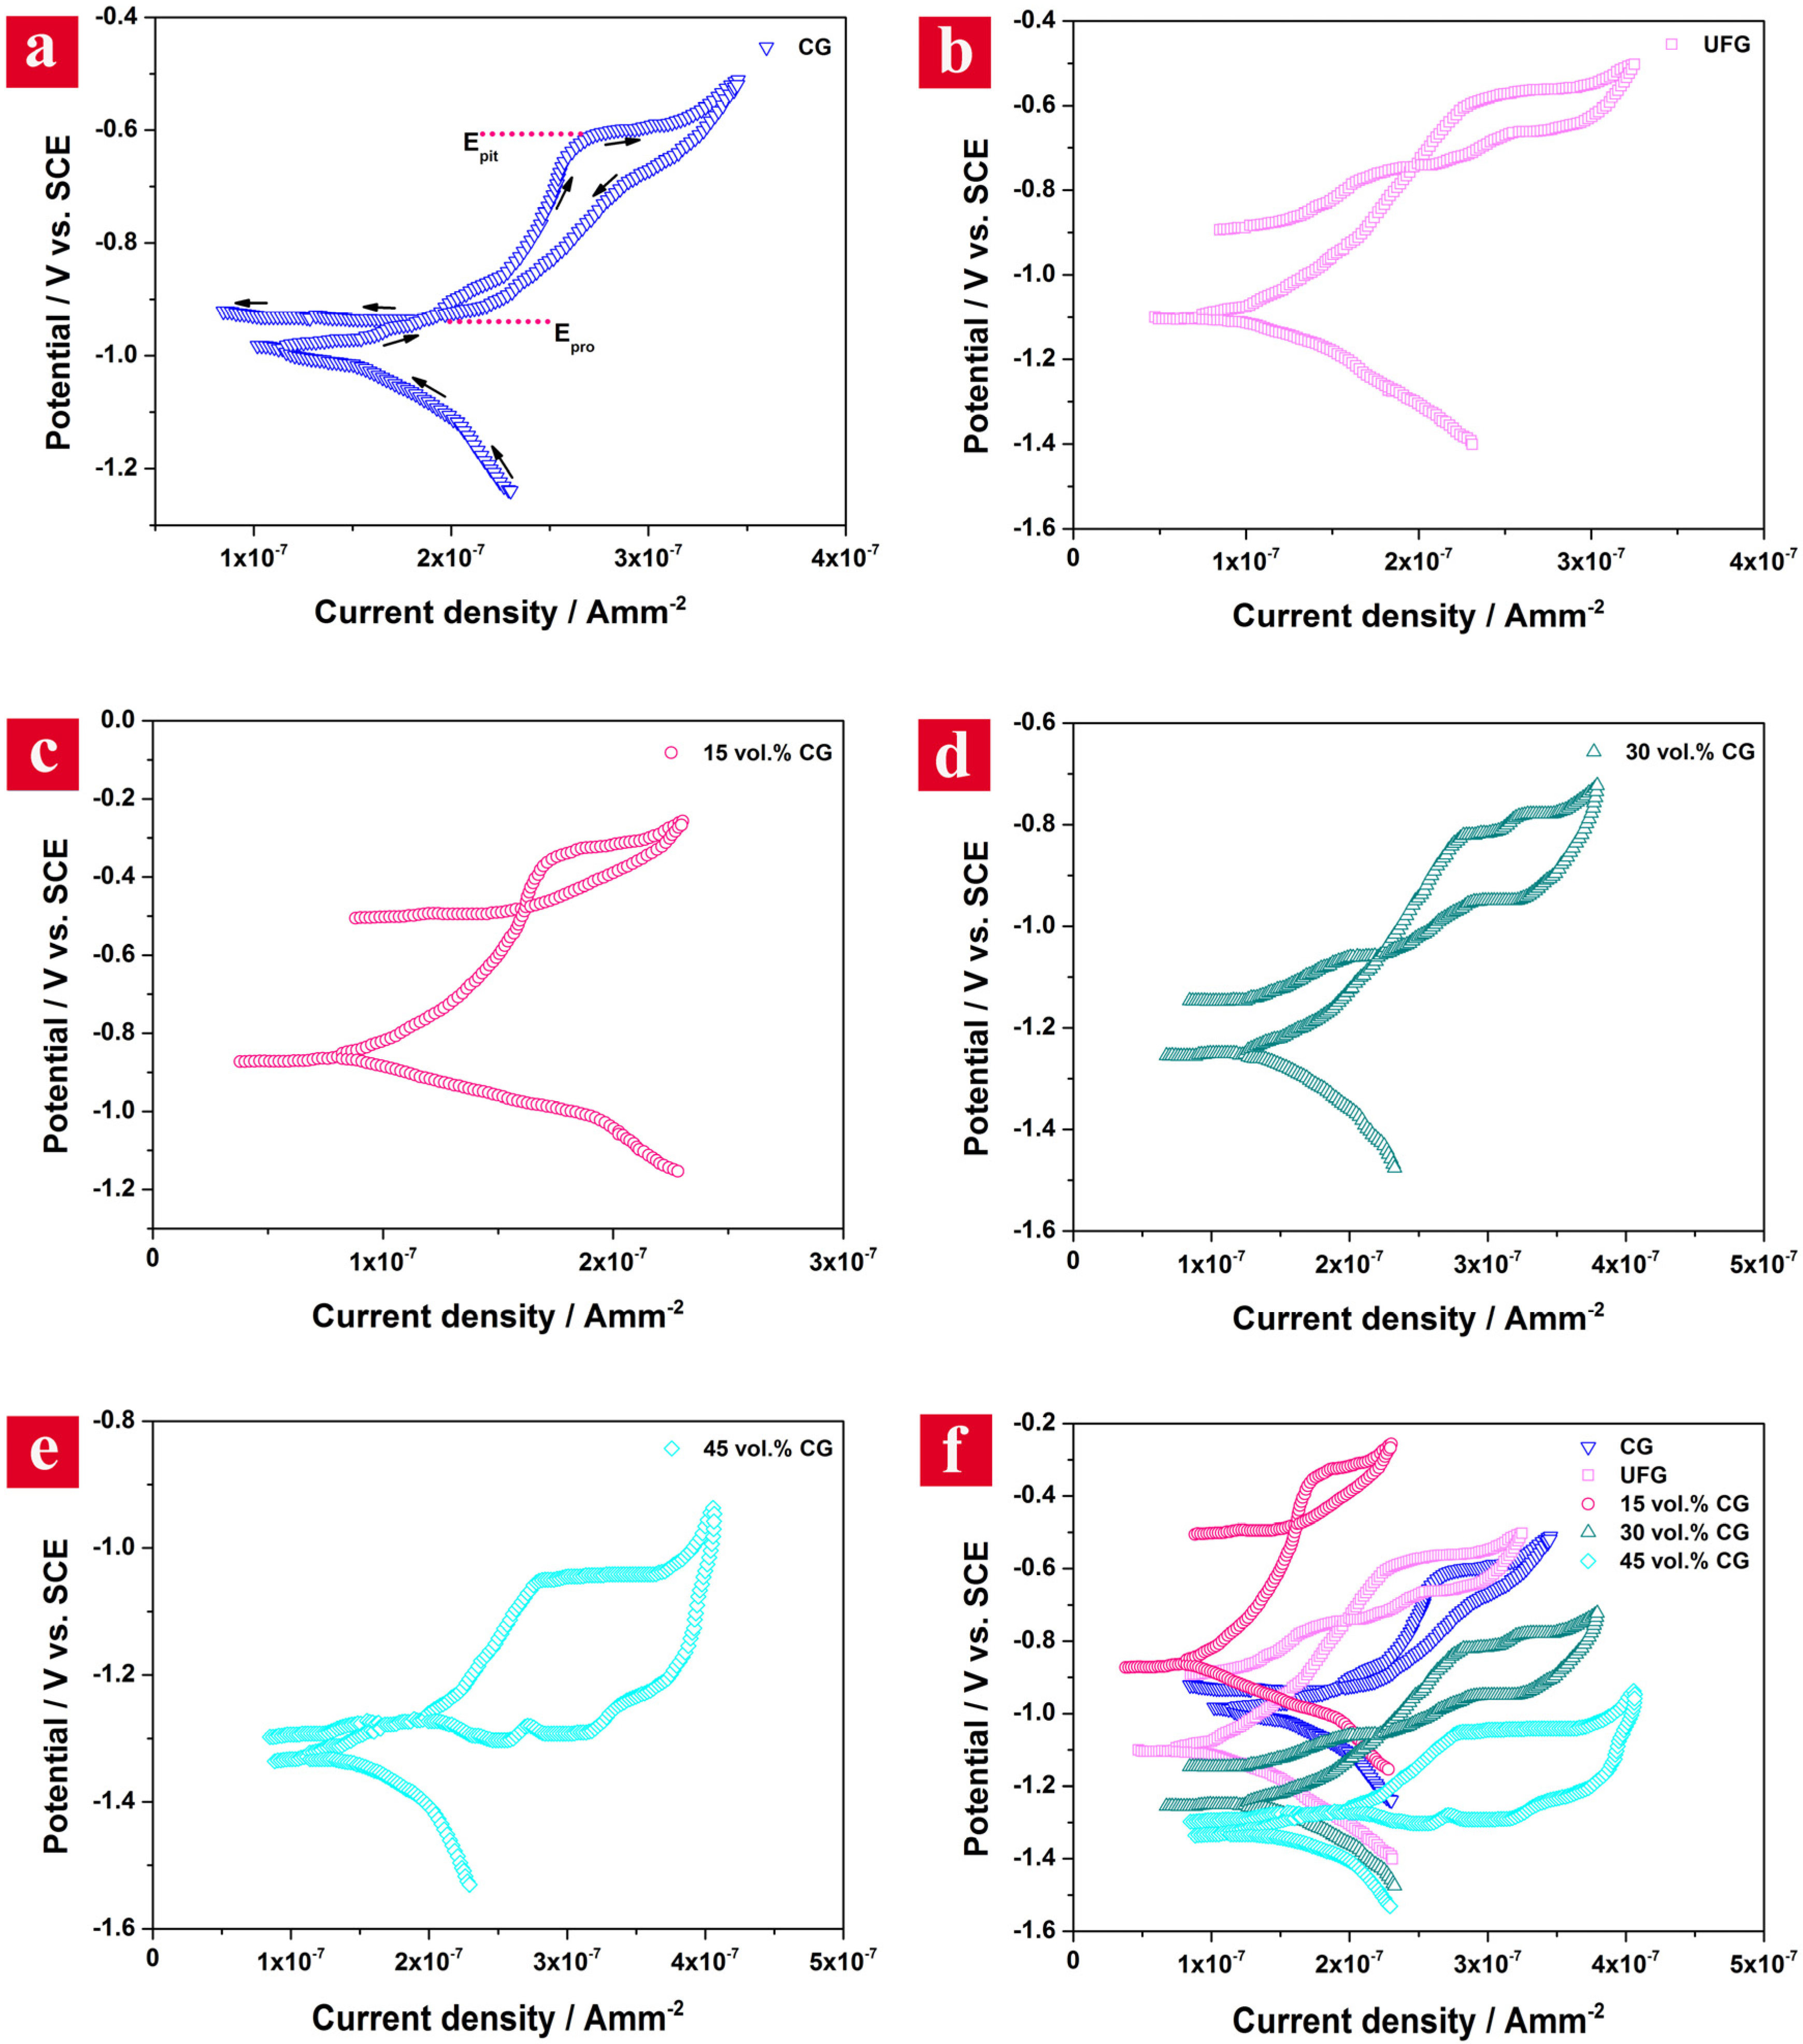
Figure 5 depicts the CP curves obtained for CG, UFG and bimodal samples in 3.5 wt. % NaCl solution. The pathway of the typical CP scan is shown in
Figure 5a for the CG sample, which is the same for the other samples. It is established that the cathodic reaction for metals in near-neutral solutions is usually oxygen reduction, which releases the hydroxide ions into the solution [
26,
27]. On the other hand, an oxide film can form on the aluminum by the anodic reaction. It is obvious from
Figure 5c that the 15 vol. % CG sample shows a wide passive region extending from −0.87 to −0.26 V due to the formation of a thick and strong oxide film on its surface compared to the other samples. The breakdown of the passive film occurs due to the pitting corrosion because of the higher applied potential and the presence of aggressive species (chloride ions) in the solution [
28,
29]. The pitting corrosion of Al in chloride-containing solutions occurs through one of the two well-known mechanisms [
30,
31,
32,
33]. In one mechanism, a salt barrier of AlCl
3 forms within the pits and changes to AlCl
−4, which disperses to the solution allowing the pitting corrosion to occur. In the other mechanism, the adsorption and reaction of chloride ions with Al (III) in the oxide lattice leads to the formation of oxychloride complexes, like Al(OH)
2Cl
2. Such a soluble complex decreases the chemical inertness of the natural oxide film and therefore enhances the anodic dissolution of the Al metal. This phenomenon can be observed as an abrupt increase in the current values in the CP curves (
Figure 5). In CP curves, the potential at which the current sharply increases is defined as the pitting potential (
Epit), and the potential at which the loop closes on the reverse scan is the protection (or repassivation) potential (
Epro) [
34].
The quantitative values for pitting loops for different Al6063 samples are also given in
Table 1. Since in all the samples there is a difference between
Epro and
Epit (they are not identical) and also
Epit >
Epro, the pitting phenomenon could occur [
35,
37]. It is well known that the size of the pitting loop is a rough indication of the pitting tendency, i.e., the larger the loop, the greater the tendency to pit [
35,
36,
37]. On the other hand, the difference in the values of
Epit and
Epro could be an indication of the strength of the passive protective layer over the samples; an alloy with a smaller value of
Epit −
Epro in CP curves exhibits a higher corrosion resistance [
38,
39,
40,
41]. The UFG sample demonstrates a narrower pitting loop and a smaller
Epit −
Epro compared with the CG sample (
Figure 5b and
Table 1). The narrowest hysteresis loop together with the highest
Epro and the smallest
Epit −
Epro (0.08 V) is observed for the 15 vol. % CG sample (
Figure 5c), signifying the lowest degradation of its passive film in the corrosive media. Alternatively, the 45 vol. % CG sample represents the widest pitting loop and the highest
Epit −
Epro, which is an indication of its catastrophic pitting corrosion and the formation of a thin and unstable passive layer over its surface. Assessment of the polarization curves in terms of kinetics of anodic and cathodic reactions reveals that the anodic reaction rate (represented by β
a in
Table 1) has been decreased in the UFG sample compared to the CG sample. Additionally, the rate of cathodic reaction kinetic (represented by β
c in
Table 1) decreases in the case of UFG sample. This phenomenon can be understood from the
Ecorr value of the UFG sample, in which the simultaneous decrease in the anodic and cathodic reaction rates has led to an
Ecorr less than the CG sample. Actually, the ennoblement of the UFG sample has been suppressed by the decrease in cathodic reaction rate. Although
Ecorr decreases in the UFG sample compared to the CG one, there is a significant reduction in
icorr value. The high breakdown potential in the anodic branch of the polarization curve for the UFG sample reveals that the material may possibly be protected by a surface film that requires the influence of increased potential to be broken down. In the bimodal microstructures, the CG regions have been stocked to the UFG matrix and formed a coupled structure consisting of two segments with different electrochemical characteristics. As previously mentioned, the CG structure represents a considerably inert behavior compared to the UFG structure. As a result, the CG regions perform as cathode and the UFG matrix as anode in a bimodal microstructure. According to the electrochemical polarization results, the 15 vol. % CG sample represents the highest corrosion resistance among bimodal samples. This behavior can be described in terms of formation of an effective protective passive layer on this sample as it was proved by electrochemical impedance results.
The CGs (cathode) accelerate the passivation rate of the UFG matrix and form a relatively thick protective layer over aluminum surface in 15 vol. % CG sample. This phenomenon is identical to a local anodizing process, which protects the aluminum surface with a thick passive barrier layer. In other words, the optimum ratio of cathode to anode surface area results in a well-defined self-anodic protection in the 15 vol. % CG sample. From the kinetic point of view, in the case of 15 vol. % CG sample, it was observed that the anodic branch of its polarization curve has been shifted to the lower values compared to the UFG sample. There is also a slight difference in their cathodic reaction rates; in fact, the 15 vol. % CG sample supports relatively higher rates of reduction reactions over a range of potentials (
Table 1). This phenomenon is originated from the cathodic processes mostly on the CG regions. Nevertheless, the decrease in anodic reaction rate overwhelms the increase in the cathodic reduction reaction rate, as evidenced by ennoblement in
Ecorr by 11.54%. The
Ecorr parameter sheds light on which reaction dominates the overall response, which has resulted in a remarkable net decrease in
icorr. This finding is electrochemically consistent with the development of a more coherent, uniform and protective film on the Al surface. As the surface area ratio of cathode to anode increases in the coupled metals, a violent localized galvanic corrosion occurs on the anodic areas. Through the galvanic corrosion process in bimodal microstructures, the CG cathodes accelerate the passivation rate of UFG matrix in an uncontrollable manner. Owing to a relatively high current flow through the UFG matrix, the passive layer locally breaks down earlier and aggressive pitting occurs. Depending on the content of CG regions, the degree of corrosion in terms of size and amount of pitting and localized corrosion increases in 30 and 45 vol. % CG bimodal samples. In other words, as the ratio of cathode to anode area on the surface of the bimodal microstructure increases, compared to the plain UFG sample, the anodic corrosion rate increases and cathodic corrosion rate decreases. Increased anodic and decreased cathodic corrosion rates result in an overall decreased
Ecorr and
icorr in 30 and 45 vol. % CG bimodal samples.
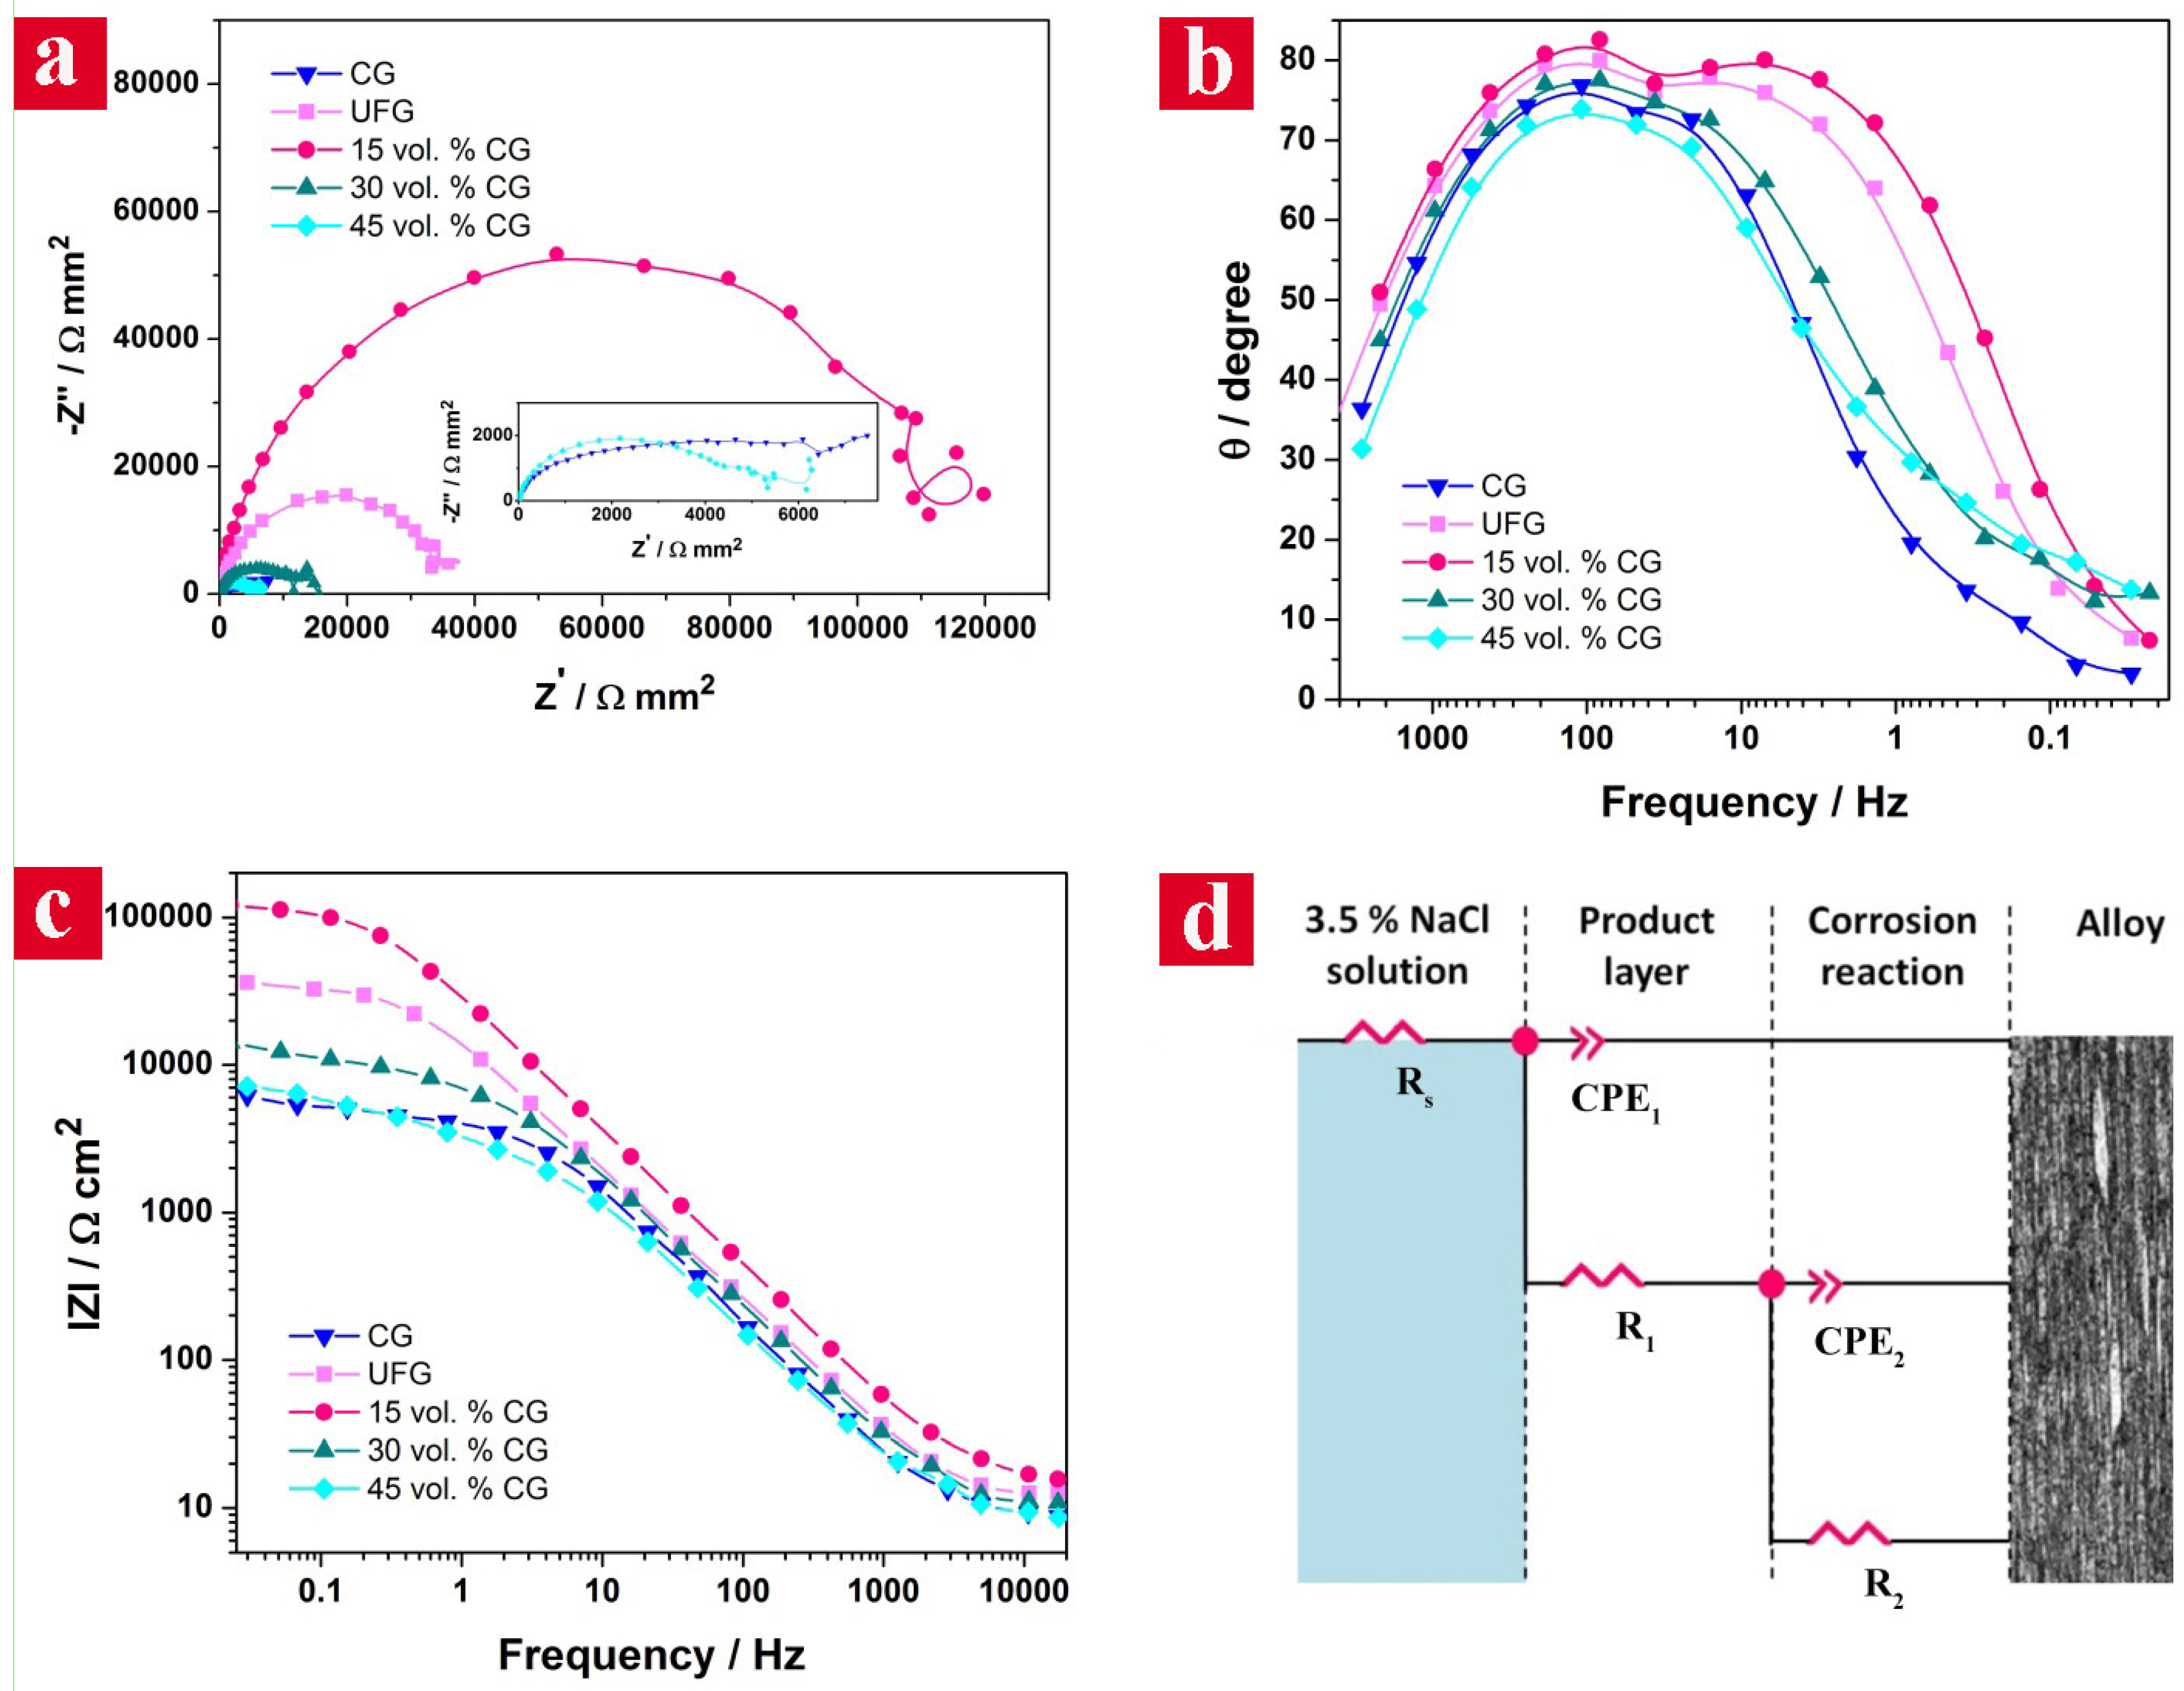
In order to investigate the impedance characteristics at the Al alloy/electrolyte interface and confirming the polarization data, the EIS measurements were carried out.
Figure 6 shows the EIS results of the samples including the Nyquist (−
Zimaginary vs.
Zreal,
Figure 6a), Bode phase angle (θ vs. frequency,
Figure 6b), and Bode module (|
Z| vs. Frequency,
Figure 6c) plots together with the simulated equivalent circuit (
Figure 6d). It is apparent from
Figure 5a that there is no marked difference in the shape of Nyquist plots indicating a relatively similar corrosion mechanism in the various Al6063 samples.
All of the Nyquist plots show one semicircle curve at higher frequencies followed by an ill-defined Warburg tail with an angle of about 45° at lower frequencies due to the superimposing of the passive layer breakdown and reformation processes occuring on the surface of the samples. The representation of all the corrosion reactions only by one loop at high frequencies can be related to the overlapping of several processes’ loops [
42]. Indeed, the Nyquist plots show a depressed shape which can be deconvoluted into two capacitive and inductive loops. The capacitive loop appearing at higher frequency values arises from the time constant of the electric double layer and charge transfer resistance. It is known that the capacitive loop depends either on the direct electron transfer at the metal surface or on the electron conduction through the surface film. According to Brett [
43,
44], the capacitive loop is corresponding to the interfacial reactions, particularly, the oxidation of Al at the metal/oxide/electrolyte interface. The process includes the formation of Al
+ ions at the metal/oxide interface and their migration through the oxide/solution interface where they are oxidized to Al
3+ [
45]. On the other hand, the inductive loop, located at lower frequencies, originates from the adsorption relaxation of intermediates that cover the reaction surface [
46]. In fact, the inductive loop is associated with the weakening of the protectability of the passive layer as a result of the anodic dissolution of the alloy [
47].
The diameter of the Nyquist semicircles, which denotes the corrosion resistance of a material, altered with the amount of the CG phase in the alloys. Thus, it is obvious from
Figure 6a that the corrosion resistance of the UFG alloy is significantly higher than that of its CG counterpart. In addition, the 15 vol. % CG bimodal sample demonstrated the highest corrosion resistance among the various Al6063 microstructures. Indeed, the trend of corrosion resistances obtained from EIS measurements is in a good accordance with the polarization test results. On the other hand, the tail at high frequencies corresponds to the diffusive processes which can be ascribed to the diffusion of chloride ions through the passive film on the Al alloy [
48]. Thus, the corrosion process is controlled by the diffusion of ions in addition to the charge transfer. The Warburg arc shrinkage is clearly observable in the Nyquist plot of the 15 vol. % CG bimodal sample (
Figure 6a) and can be attributed to the blockage of the pores in the outer coarse layer by the accumulation of corrosion products [
49].
The Bode phase angle and module plots (
Figure 6b,c) confirm the Nyquist results. The capacitive and inductive loops can be more clearly observed in the Bode phase angle plot (
Figure 6b). The maximum and the minimum of the phase angle was approximately 82° and 73° for the bimodal samples with 15 and 45 vol. % CG phase, respectively. Furthermore, the 45 vol. % CG bimodal sample showed a dramatic decrease of the impedance in the capacitive region, indicating the low resistivity in 3.5% NaCl media and several local corrosions on the surface of Al alloy [
50]. Considering the Bode-module diagram (
Figure 6c), it can be observed that all plots show a descending trend with two slope changes, implying the activation of two distinct corrosion phenomena: the first phenomenon (faradaic effect) appears at high and intermediate frequencies and the second one (adsorption effect) emerges at intermediate and low frequencies. The highest impedance value (~117 kΩ·cm
2) was attributed to the 15 vol. % CG bimodal sample revealing its enhanced corrosion resistance against the penetration of attractive active species (chloride ions) among the various Al6063 microstructures.
With an electronic model to verify the mechanistic behavior of the samples, a two-time constant equivalent circuit comprised of a capacitive loop at high frequencies and an inductive loop at low frequencies was used. The simulated equivalent circuit obtained by fitting to the EIS results is illustrated in
Figure 6d, in which
Rs represents the solution resistance,
R1 shows the passive layer resistance and
R2 is the charge transfer resistance at substrate/passive layer interface. The
Cdl and
Cs are the ideal capacitors for passive layer and substrate/passive layer interface, respectively. Indeed, the capacitance shows the amount of electric charge stored on the surface immersed in the electrolyte and is usually used instead of the capacitance or the double layer between the charged metal surface and the solution in electrochemical processes [
51]. The capacitive components (
Cdl and
R1) are mainly attributed to the double-layer capacitance and the inductive components (
Cs and
R2) usually originate from the dissolution and formation of the corrosion product layer at vulnerable regions. The equivalent circuit parameters are listed in
Table 2. It is clear that the values of double-layer capacitance are mostly larger than inductive values in all of the samples indicating the dominance of capacitive behavior in Al6063. On the other hand, the
Cdl and
Cs values of the UFG alloy are lower than that of the CG material and the lowest capacitance values are obtained for the 15 vol. % CG bimodal sample. This finding can be explained by the effect of the protective layer formed on the surface of Al alloys. The relationship between the effective surface capacitance (
Ceff or
C) and the protective layer thickness (
d) can be generally expressed as [
52]:
where
A is the effective surface area of the electrode, ε is the dielectric constant of the medium and ε
0 is the vacuum permittivity. According to Equation (1), the formation of a thick and smooth protective passive layer on the Al surface gives rise to the reduction of capacitance. Thus, the lower capacitance values in the 15 vol. % CG bimodal sample suggests a higher thickness of the oxide layer on it. In contrast, in other bimodal samples, as the amount of CG phase embedded in the UFG matrix increases, the thickness of the passive film decreases. Additionally, the
R1 and
R2 values of the bimodal alloy containing 15 vol. % CG are also higher than those of plain CG and UFG samples. The charge transfer resistance at the interface of the 15 vol. % CG bimodal sample is approximately 17.8 and 3.2 times higher than the CG and UFG samples, respectively. The corrosion resistance of the 30 vol. % CG bimodal alloy is ~7% of the 15 vol. % CG bimodal material. Furthermore, the bimodal sample containing 45 vol. % CG has a very low corrosion resistance, even less than the plain CG sample. According to the electrochemical results from the 15 vol. % CG sample, it can be concluded that by tailoring the non-chemical factors of the Al it would be possible to adjust the relative anodic and cathodic kinetics of the material and consequently its corrosion properties.
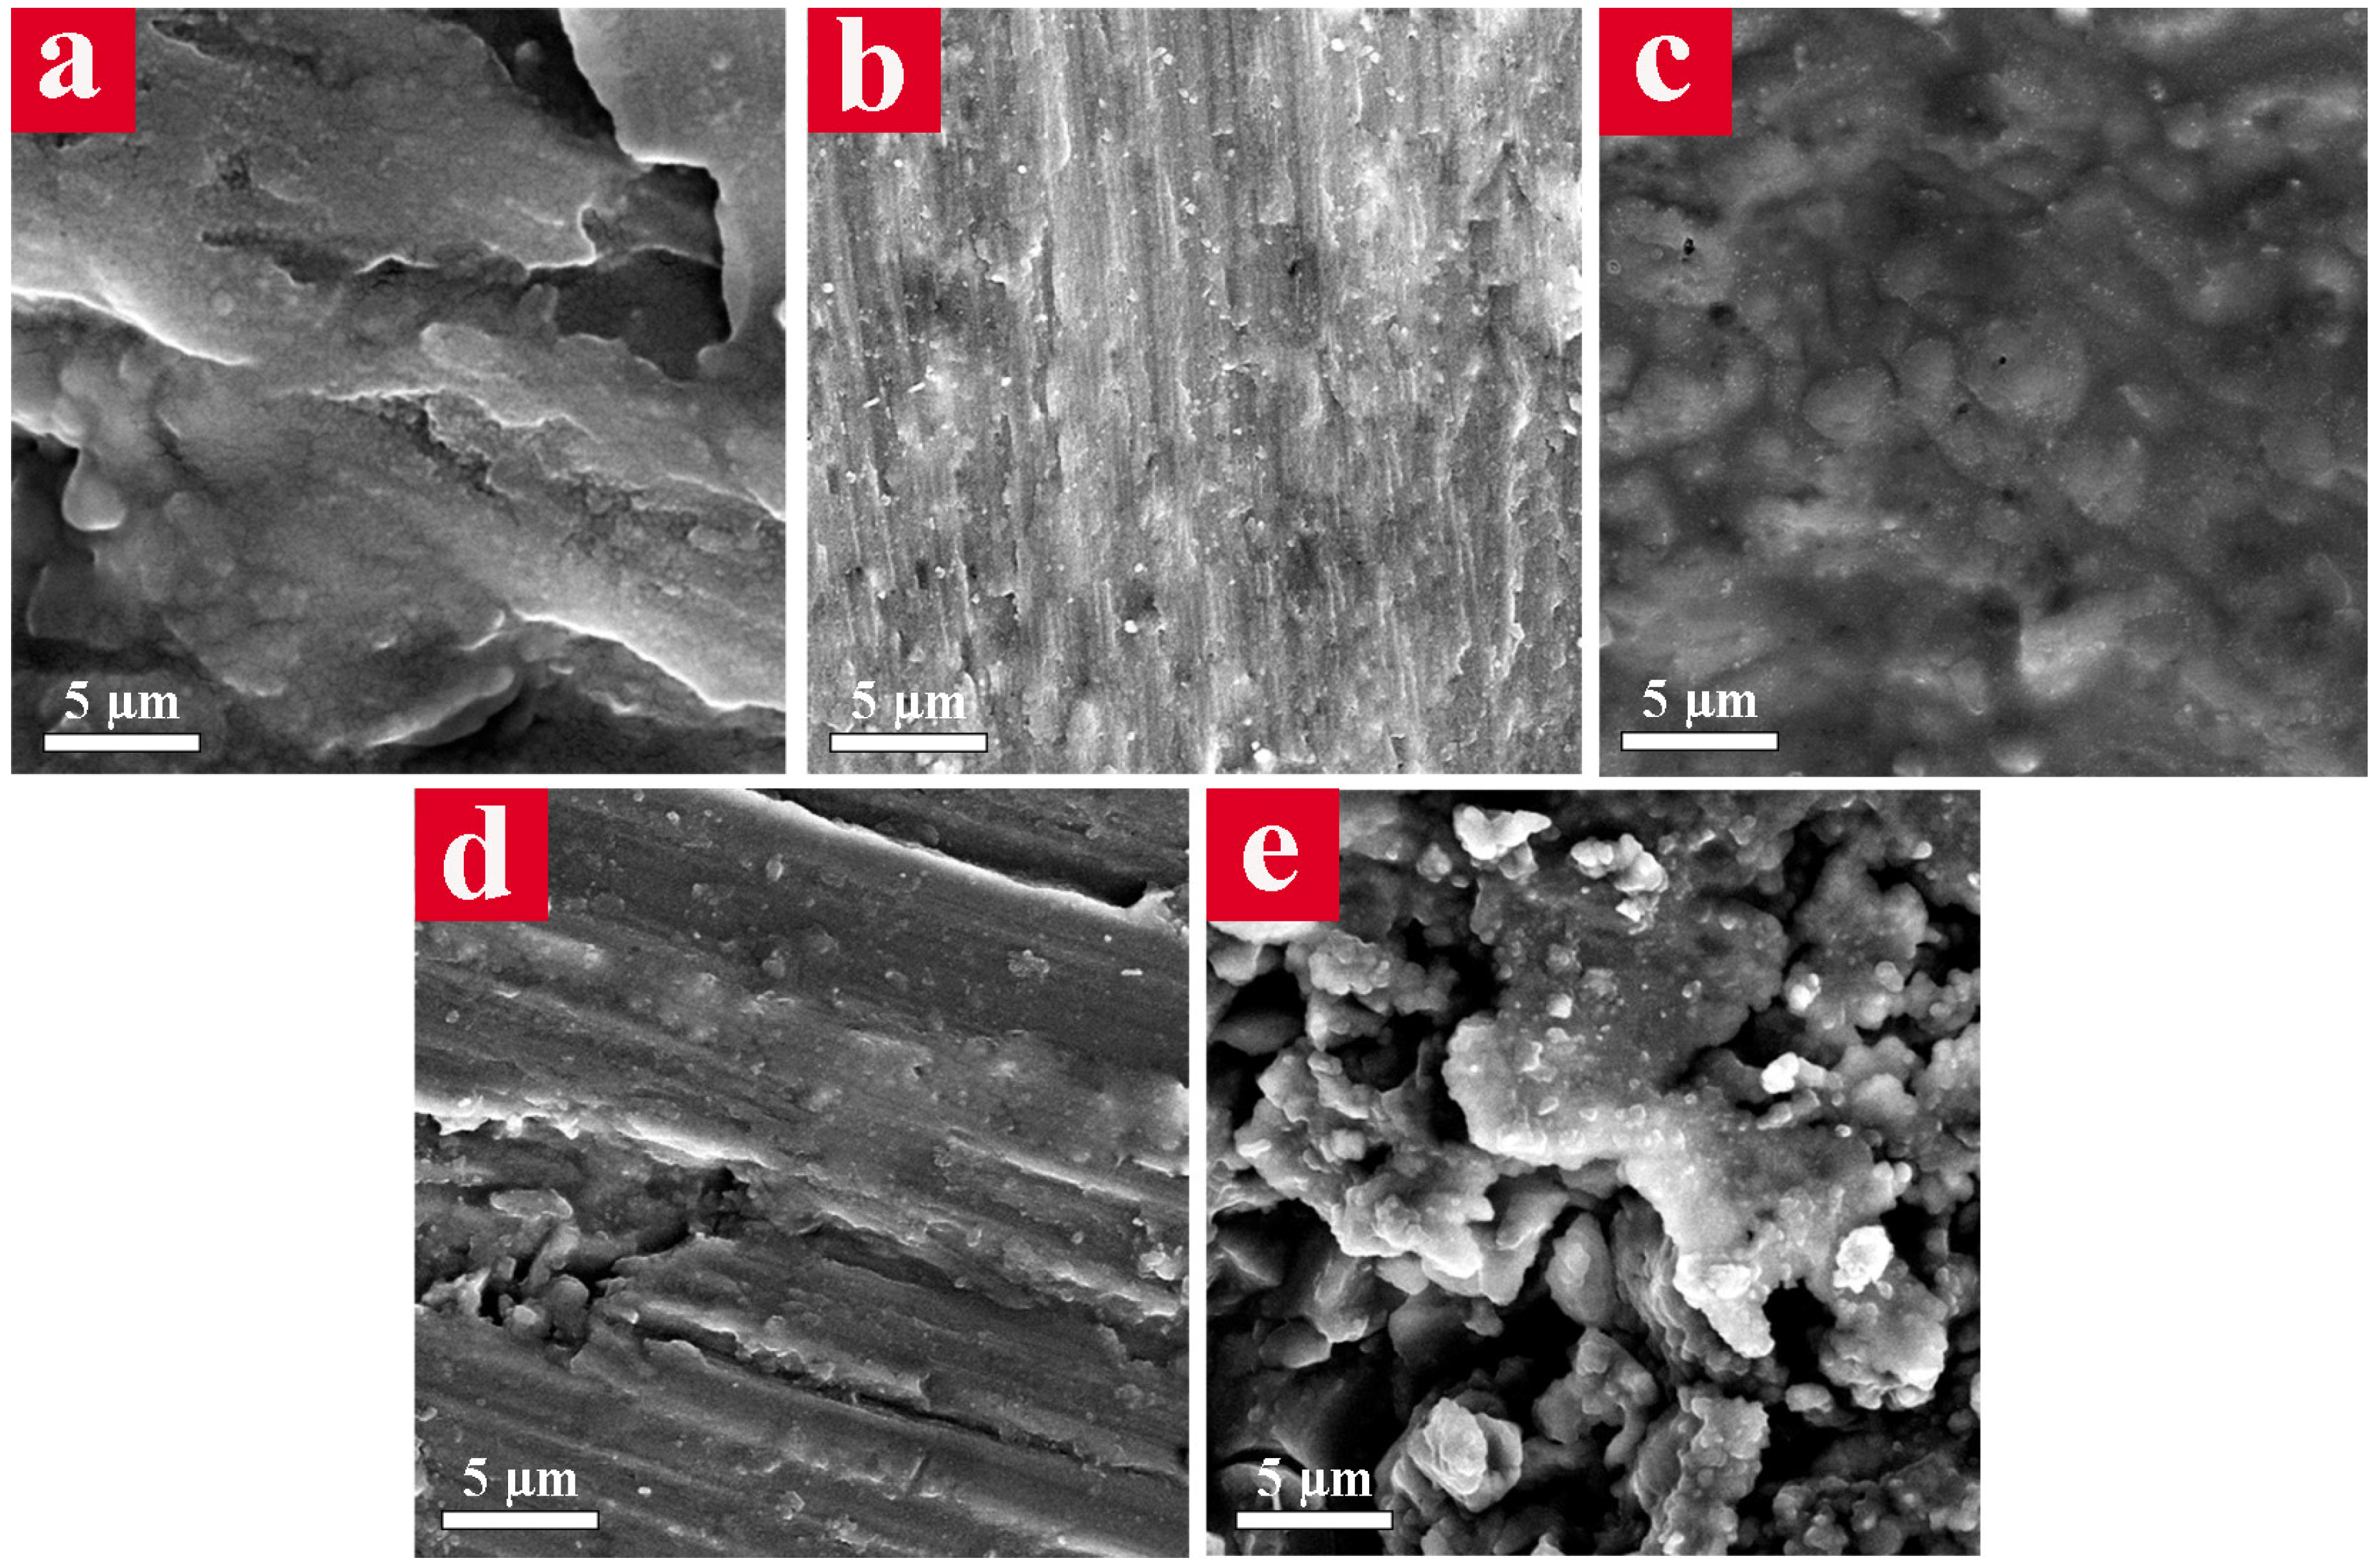
The surface morphology of the samples after electrochemical tests were characterized using FE-SEM (
Figure 7) with the aim of realizing the corrosion mechanism. Several long and deep cavities appeared on the surface of the CG sample (
Figure 7a), which are mainly related to the breakdown of the thin passive layer and drastic attack of the corrosive ions to the Al alloy substrate. Nevertheless, a relatively uniform oxide layer over the surface of the UFG sample was observed (
Figure 7b). The surface examination of the 15 vol. % CG bimodal alloy (
Figure 7c) indicated a thick and homogeneous protective oxide layer, which is considered the main reason behind its highest corrosion resistance in 3.5% NaCl corrosive media. The surface of the bimodal sample containing 30 vol. % CG showed a less protective passive layer with some deep grooves (
Figure 7d). The most catastrophic corrosion occurred in the 45 vol. % CG bimodal sample in which numerous deep cavities and several parts of the detached corrosion products were detected on its surface, as shown in
Figure 7e.
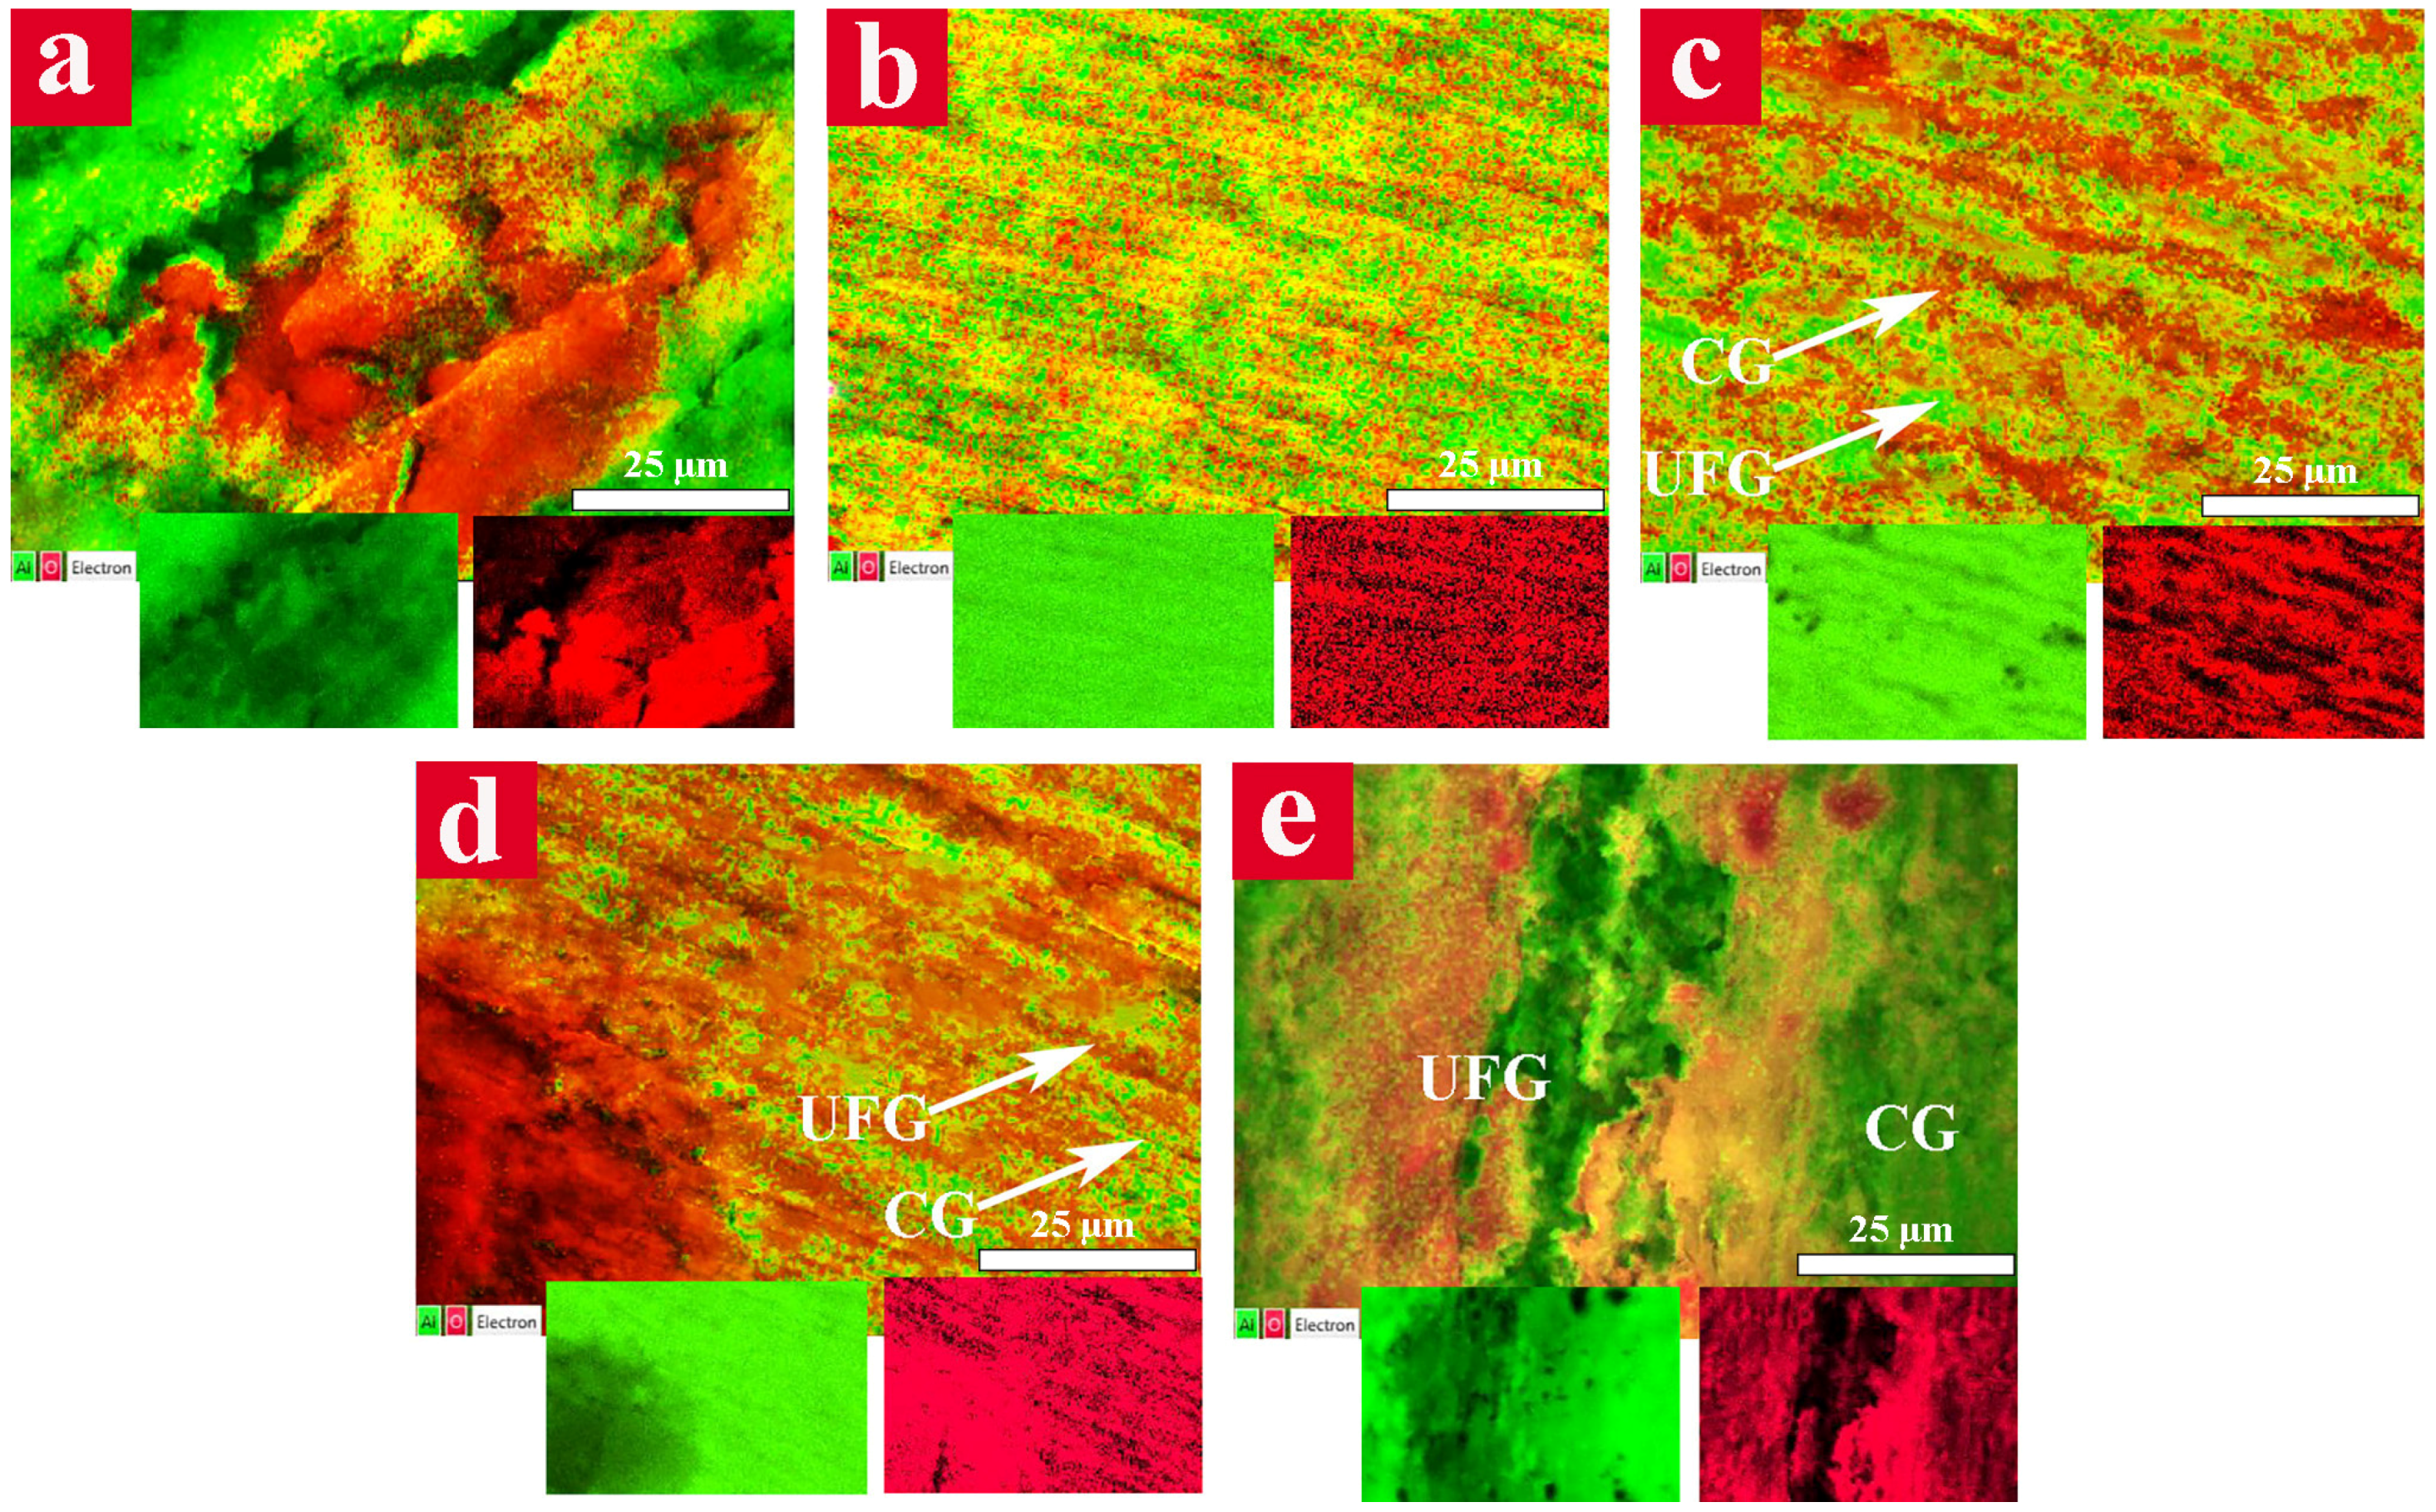
Formation of oxide film over the surface of Al6063 alloys were examined through the distribution of Al and O elements by means of EDS mapping (
Figure 8). The EDS map of the CG sample (
Figure 8a) showed an extremely attacked surface consisting of deeply corroded cavities (red regions) and the bare metal (green areas).
The presence of large uncovered regions implies the formation of an unstable and non-uniform passive film, which had been broken and detached from the Al alloy surface. On the other hand, the UFG sample demonstrated a uniform surface that was covered by the protective oxide layer (
Figure 8b). The surface of the 15 vol. % CG bimodal sample (
Figure 8c) illustrated an attractive pattern consisting of red areas attributed to the CG bands and green regions related to the UFG matrix. To ensure the position of these constituents, the surface area of red and green regions was determined. The surface area of red bands was about 15% of the whole surface area which is in a good accordance with the CG content in the sample. A relatively uniform distribution of red points on the surface of UFG regions entails the existence of a proper passive layer over these areas. The surface of the 30 vol. % CG bimodal sample (
Figure 8d) showed a non-uniform oxide layer with some corroded cavities indicating the lower protection capability of the passive layer. The 45 vol. % CG bimodal sample demonstrated a large fraction of green areas (bare metal) which is a caused by dissolution or detachment of passive layer, in addition to several deeply corroded regions.
The complementary information on the type of passive films over the samples was obtained by XRD analysis (
Figure 9). The XRD pattern of the UFG Al6063 alloy before the electrochemical test is also shown in
Figure 9, in which only Al reflections are detectable. All of the Al6063 samples after electrochemical test exhibited analogous peaks indicating the formation of similar corrosion products. The corrosion products covering the surface of the samples are mainly composed of γ-Al
2O
3 (JCPDS file card No. 00-004-0880), AlOOH (Boehmite, JCPDS file card No. 01-076-1871), α-Al(OH)
3 (Gibbsite, JCPDS file card No. 01-076-1782) and β-Al(OH)
3 (Bayerite, JCPDS file card No. 01-077-0250).
4. Discussion
It is well established that the presence of a passive layer over the surface can prevent the reaction between corroding media and aluminum [
53]. Regarding the XRD patterns (
Figure 9), AlOOH, Al(OH)
3, and γ-Al
2O
3 were formed over the surface of Al6063 alloys irrespective of the grain structure. Indeed, the surface of the samples is primarily covered by the air-formed oxide film (amorphous γ-alumina) that grows in the exposure to a neutral aqueous solution through the formation of a crystalline hydrated alumina layer [
54]. The aluminum oxidation reactions in neutral aqueous solutions (e.g., 3.5% NaCl) can be expressed as followings:
All of these reactions are thermodynamically favorable and their products differ in the level of hydration. The boehmite is nucleated at dislocation centers or pores at the surface of the amorphous oxide film [
55]. Then, the boehmite film growth occurs by ionic diffusion through the oxide lattice. After thickening the boehmite film to some extent, Al ions escape into the liquid adjoining the surface and hydrate in the solution resulting in the growth and deposition of aluminum hydroxide phases (bayerite and gibbsite) on the outer boehmite surface. It has been suggested that aluminum hydroxide phases continue to thicken until the reaction is inhibited by the film itself [
56]. It has been established that the following reactions consecutively occur during the corrosion of Al in chloride solutions which leads to the formation of γ-Al
2O
3 [
57]:
Regarding the electrochemical tests’ results and taking into account the surface morphology and chemical composition of the passive layers, it is obvious that the corrosion behavior of the Al6063 alloy is greatly affected by its grain structure. Considering the plain Al6063 alloys, the polarization and EIS results indicated the higher corrosion resistance of the UFG alloy compared with the CG material (
Table 1 and
Table 2). Furthermore, a much more uniform protective passive layer was formed on the surface of the UFG sample, as shown in
Figure 7b and
Figure 8b. The effective role of the grain-size refinement on the enhancement of the corrosion behavior has been previously reported [
58,
59,
60,
61]. It has been shown that the ultrafine grains improve the activity of electrons at grain boundaries leading to the decrease in the electron work function [
62]. Thus, the surface of the UFG alloy becomes more electrochemically reactive giving rise to the rapid formation of a mechanically strong and stable passive layer. Indeed, the presence of a high density of grain boundaries in the microstructure of the UFG alloy, as it was confirmed by EBSD map (
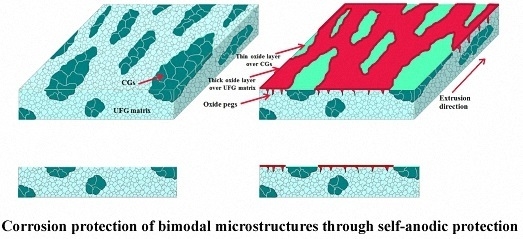
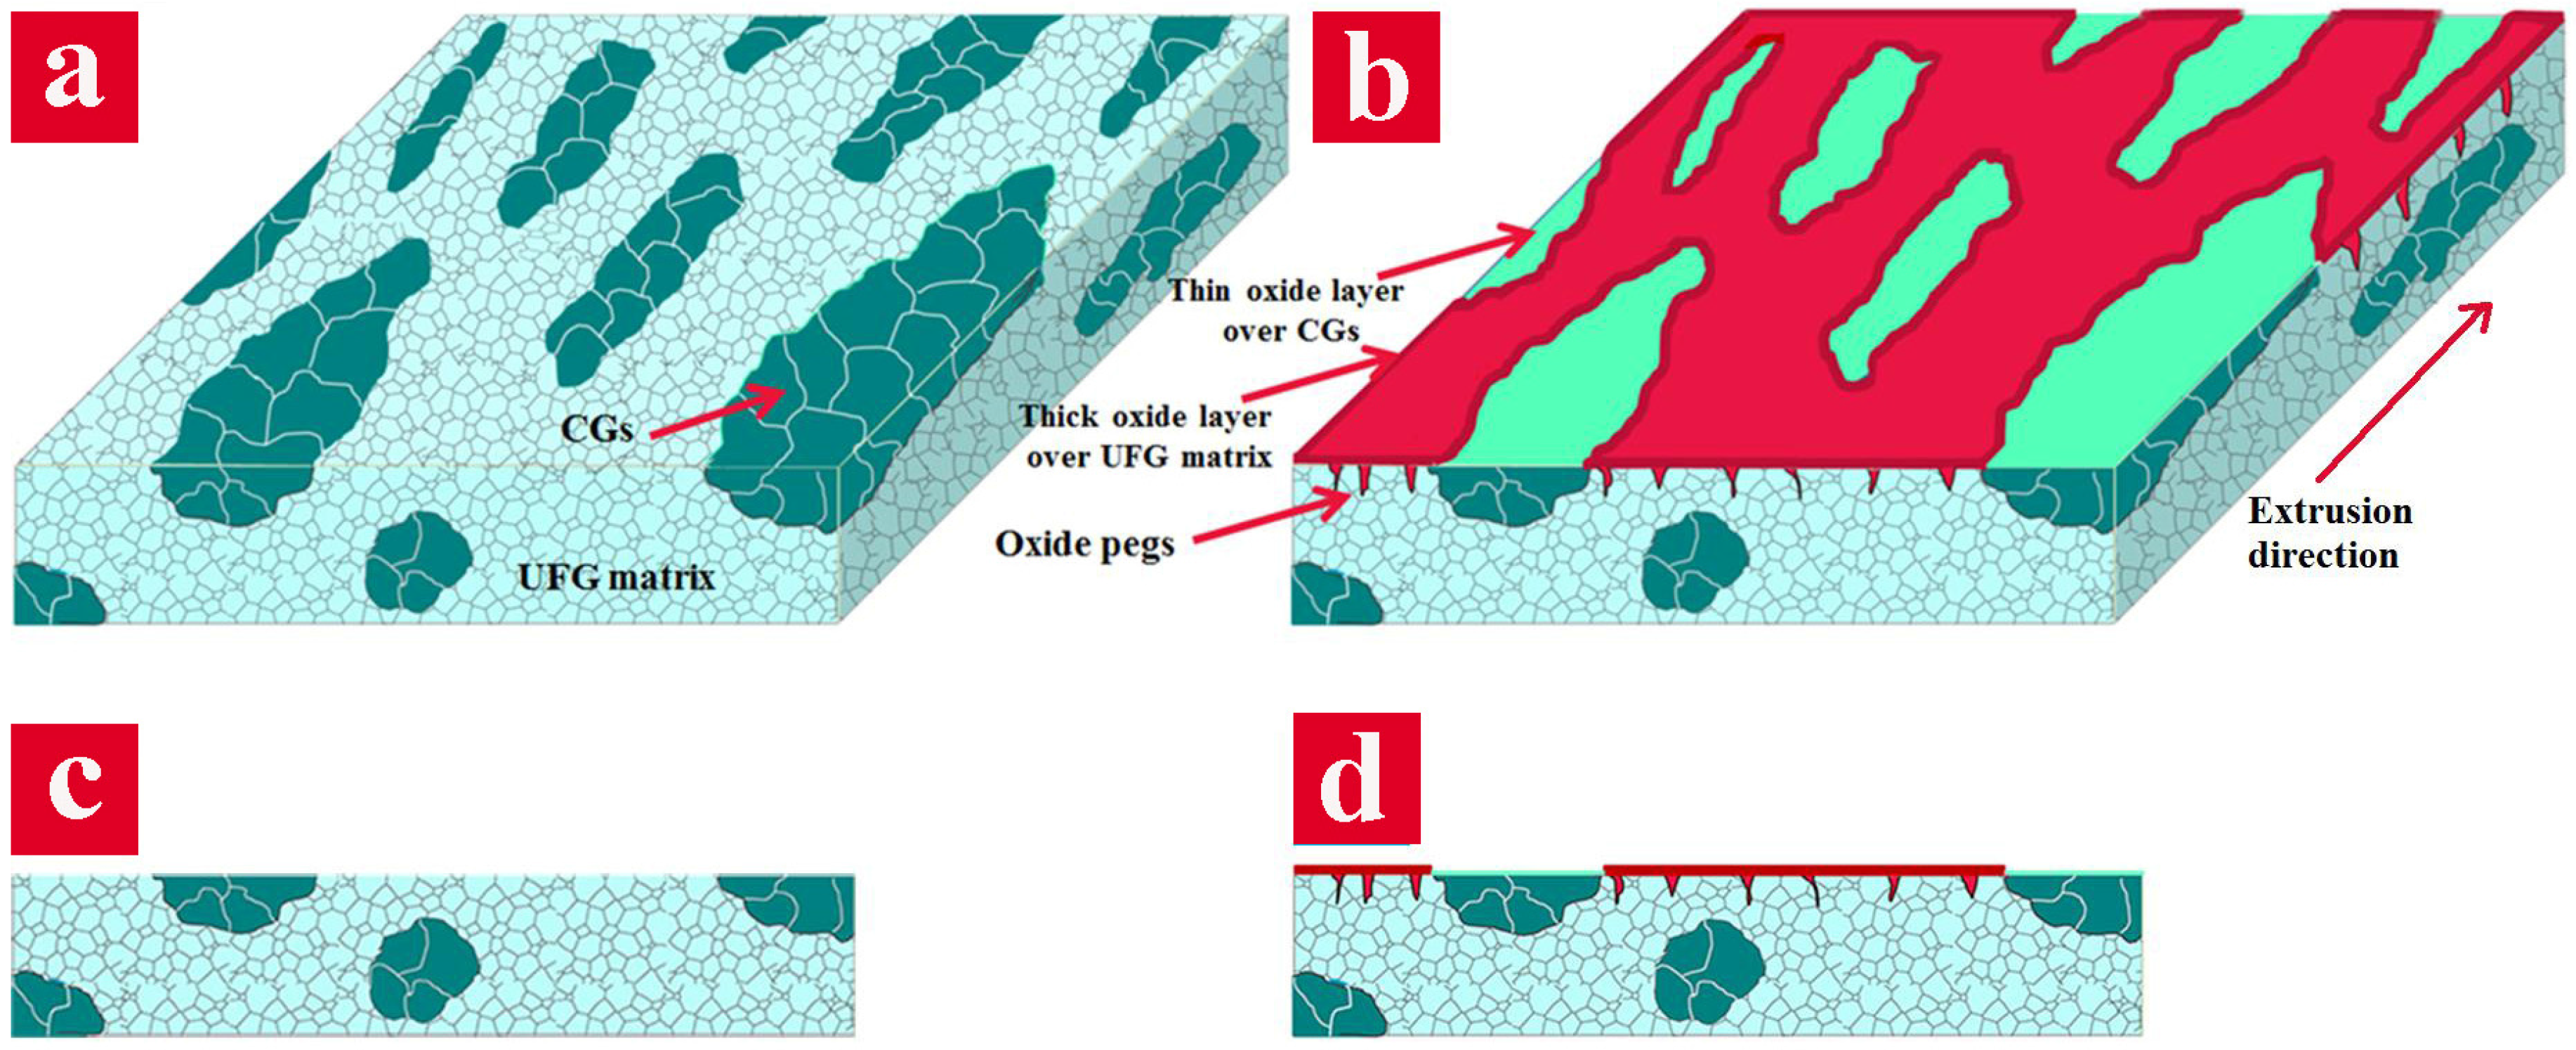
Figure 3a), results in an increased interfacial adherence of the passive film. This phenomenon is mainly attributed to the formation of oxide protrusions penetrating into the grain boundaries, namely “oxide pegs” (the schematic illustration in
Figure 10), which can significantly increase the corrosion resistance [
63]. Nevertheless, the corrosion of the CG alloy is virtually due to the dissolution and breakdown of the feeble passive layer by chloride ions resulting in the intense localized corrosion, as shown in
Figure 7a. As previously mentioned, the 15 vol. % CG bimodal alloy exhibited the highest corrosion resistance compared to the various bimodal microstructures and also plain UFG and CG material. On the other hand, the other bimodal samples containing 30 and 45 vol. % CG represented an inappropriate corrosion resistance (
Figure 4,
Figure 5 and
Figure 6). This phenomenon can only be explained regarding the mechanism of the passive layer formation over the bimodal samples with various CG phase contents. According to the OCP and corrosion potential values (
Figure 4), it is clear that the CG microstructure is nobler than the UFG one. As a result, when a bimodal microstructure consisted of CG regions within a UFG matrix is immersed in a corrosive media, a dual (galvanic) potential energy system is formed. In this system, the CG regions (with higher potential energy) act as cathodes and the UFG area operates as anode; accordingly, a micro-galvanic couple is created between CG cathodes and the UFG anode. The different affinities of anodes and cathodes to the corrosion create an electrical potential between them and consequently the anodes (UFG matrix) undergo the corrosion with a higher rate than that of the plain UFG sample. It is known that this accelerated corrosion is beneficial for the metals capable of being passivated [
64]. The migration of Al ions through the passive layer and its consequent thickening as well as the reduction of oxygen over the cathodic regions are the main processes which occur in the bimodal samples. The transfer of Al ions occurs through Al vacancies from near the substrate/passive layer into the regions close to the passive layer/solution interface [
65]. The cathodic reactions on CG regions are very intense immediately after exposure to the corrosive media. As the immersion time increases, the weakening of the electrical connection between UFG anodic regions and the solution by the corrosion products occurs and their connection is interrupted. Afterwards, the electrochemical potential of UFG passive regions increases to a value near the potential energy of CG bands and, in some places, even further. Owing to the potential energy variations, the role of anode and cathode changes and a metastable passive layer is formed over CG regions in a very short fraction of time. Subsequently, a uniform and continuous passive layer forms on the surface of bimodal sample. However, since the passive layer formed on the CG regions is not very thick and stable, due to the potential energy fluctuations on the surface, it can easily be dissolved. Thus, again the CG bands become exposed to the corrosive media and retrieve their function as cathodes in the microstructure. This phenomenon occurs frequently and the passive film forms and dissolves on CG regions until a well-defined protective film can be formed over them owing to the proper energy differences between passive layer formed on the UFG matrix and CG regions which can be considered as a steady-state condition. Eventually, a protective oxide layer is formed on the surfaces of CG. Additionally, although a protective layer is also formed on the CG regions and the whole surface of the 15 vol. % CG sample becomes appropriately protected, the thickness of the oxide over UFG and CG regions will be different. Clearly, because of higher passivation capability, the oxide layer will be far thicker than that of the CG regions. This phenomenon interpreted from the results is schematically represented in
Figure 10.
Owing to the proposed corrosion mechanism, the enhanced corrosion resistance of the 15 vol. % CG bimodal alloy is attributed to the effective galvanic couple developed between CG bands and the UFG matrix. In this sample, the CG bands serve as galvanic cathodes and accelerate the corrosion process of the UFG matrix which gives rise to the formation of a stable, uniform and thick oxide layer over its surface. According to the EDS map (
Figure 8c), the intense oxide layers covered the CG bands (denoted by red color) whereas a uniform passive layer is formed over the UFG matrix, verifying the suggested mechanism. Meanwhile, the higher corrosion resistance of this alloy compared with the plain UFG alloy is connected to the higher passivation rate of the bimodal sample as well. Indeed, the anodic protection phenomenon is dominated in the 15 vol. % CG bimodal sample. In spite of the enhanced corrosion resistance of the bimodal alloy containing 15 vol. % CG, the anodic protection became less effective and a catastrophic corrosion occurred in other bimodal samples with a higher amount of the CG phase, which is mainly caused by the galvanic corrosion. As the CG area fraction in a bimodal sample increases over 15 vol. %, the cathodic reactions increase which significantly enhances the rate of the anodic reactions in small areas. It is pertinent to note that cathodic reactions on CG regions increase the alkalinity of the area surrounding them and thus dissolve the passive layer on CG areas [
66]. The enforcing of a high current flow on the surface of UFG regions breaks down the passive layer locally and creates several cavities on the surface of the bimodal sample. Additionally, the alkaline dissolution of the passive layer over the cathodic regions diminishes the protective layer of CG areas and accelerates the localized corrosion. Regarding the fact that the rate of penetration at the anode depends on the current density, a large cathode to anode surface area ratio is undesirable due to the concentration of the galvanic current onto a small anodic area and thus quick thickness loss of the dissolving anode [
67]. Indeed, the galvanic corrosion is a disadvantageous consequence of a large cathode to anode surface area ratio. With respect to surface areas of CG and UFG regions, a large anode (UFG phase) in contact with a relatively small cathode (CG phase) is usually favorable. Considering that the CG to UFG volume fraction ratio is proportional to the CG to UFG area fraction ratio in the bimodal samples, it can be suggested that the cathode to anode surface area ratio is about 18, 43 and 82% for bimodal samples containing 15, 30 and 45 vol. % CG phase, respectively. Consequently, a large cathode to anode area ratio in the 30 vol. % CG bimodal sample leads to a higher galvanic current flow and significantly accelerates the corrosion of UFG matrix compared with the 15 vol. % CG bimodal alloy. In the meantime, the corrosion over the CG cathodic areas is inhibited, as denoted by green-colored regions in the EDS map (
Figure 8d). The high galvanic current locally breaks down the oxide layer and motivates the formation of cavities as well (
Figure 8d). Hence, the oxide layer formed over the UFG matrix could not effectively protect the 30 vol. % CG bimodal sample against the corrosive solution and an intense corrosion of the bare metal occurred (red aggregates in
Figure 8d). In the case of the 45 vol. % CG bimodal sample, the highest cathode to anode surface area ratio leads to the most severe galvanic corrosion effect and catastrophic corrosion. Indeed, the flow of a high current density in this alloy makes the passive layer over its UFG matrix unstable, thereby leading to the breakdown and detachment of large pieces of the oxide layer in some regions. Thus, the least corrosion resistance amongst the bimodal alloys occurred in the 45 vol. % CG bimodal sample.


