Investigation of the Deformation Mechanism of a near β Titanium Alloy through Isothermal Compression


Abstract
:1. Introduction
2. Materials and Methods
3. Results and Discussion
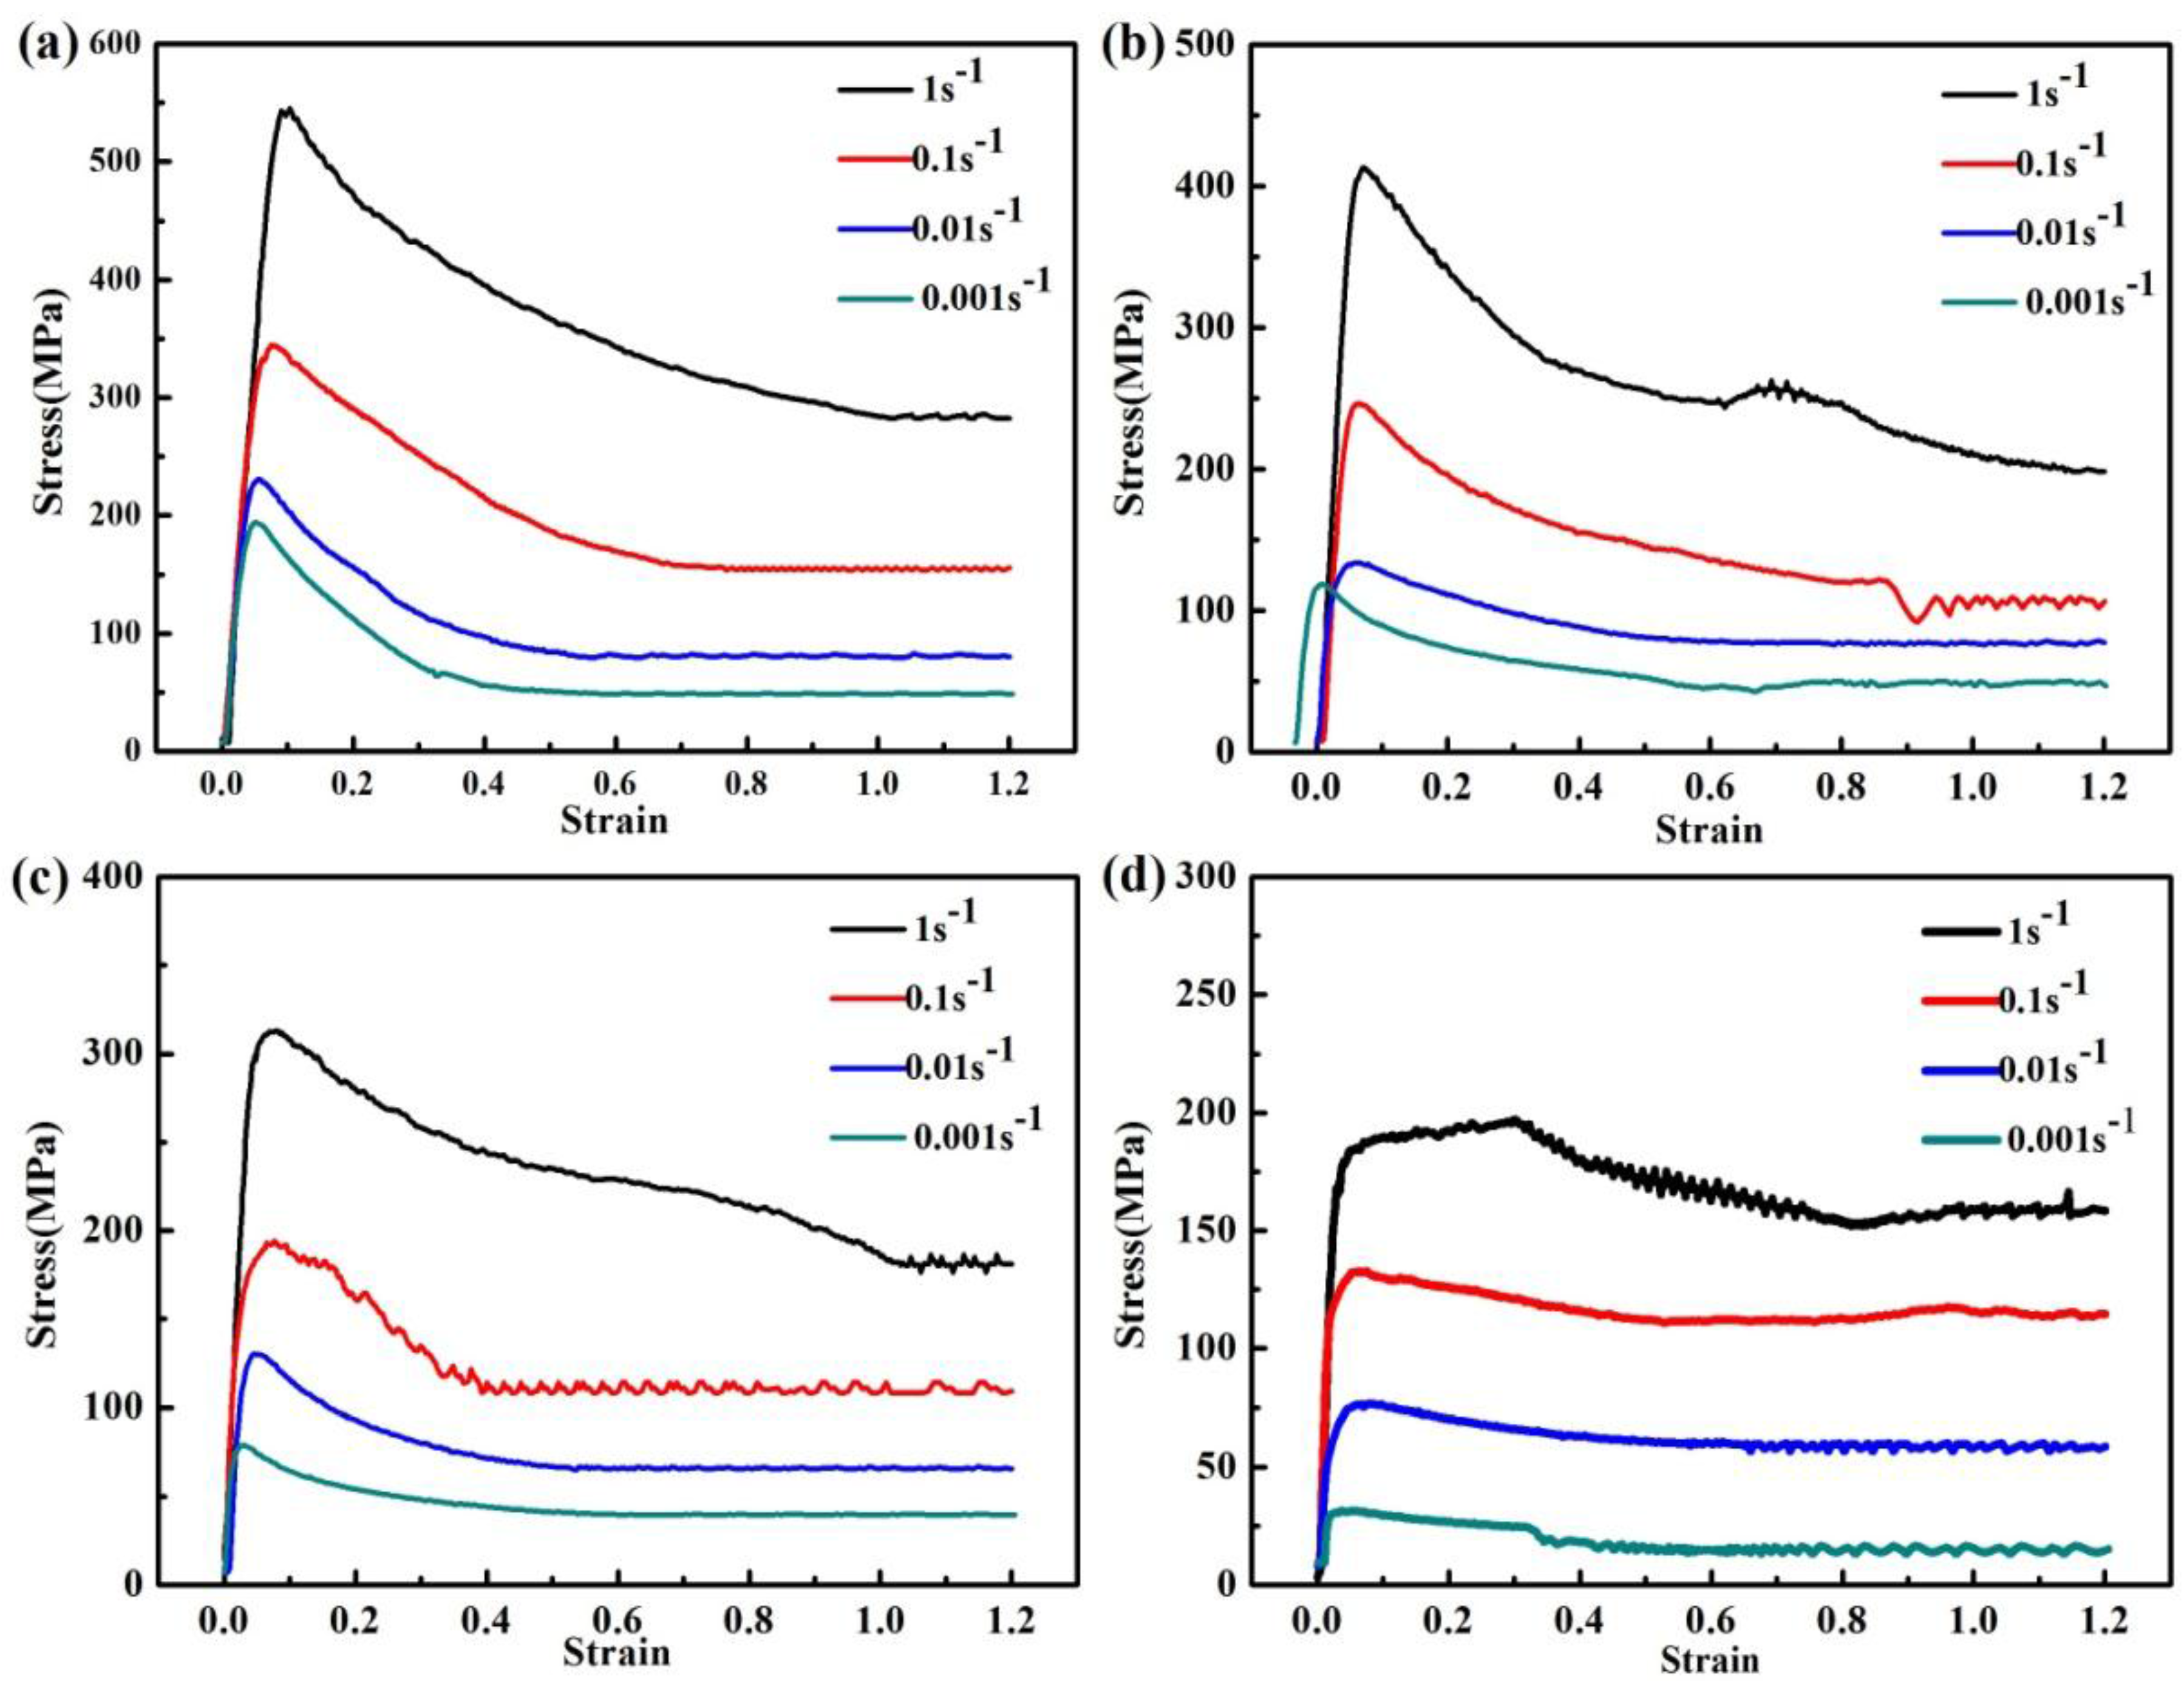
3.1. True Stress-True Strain Curves
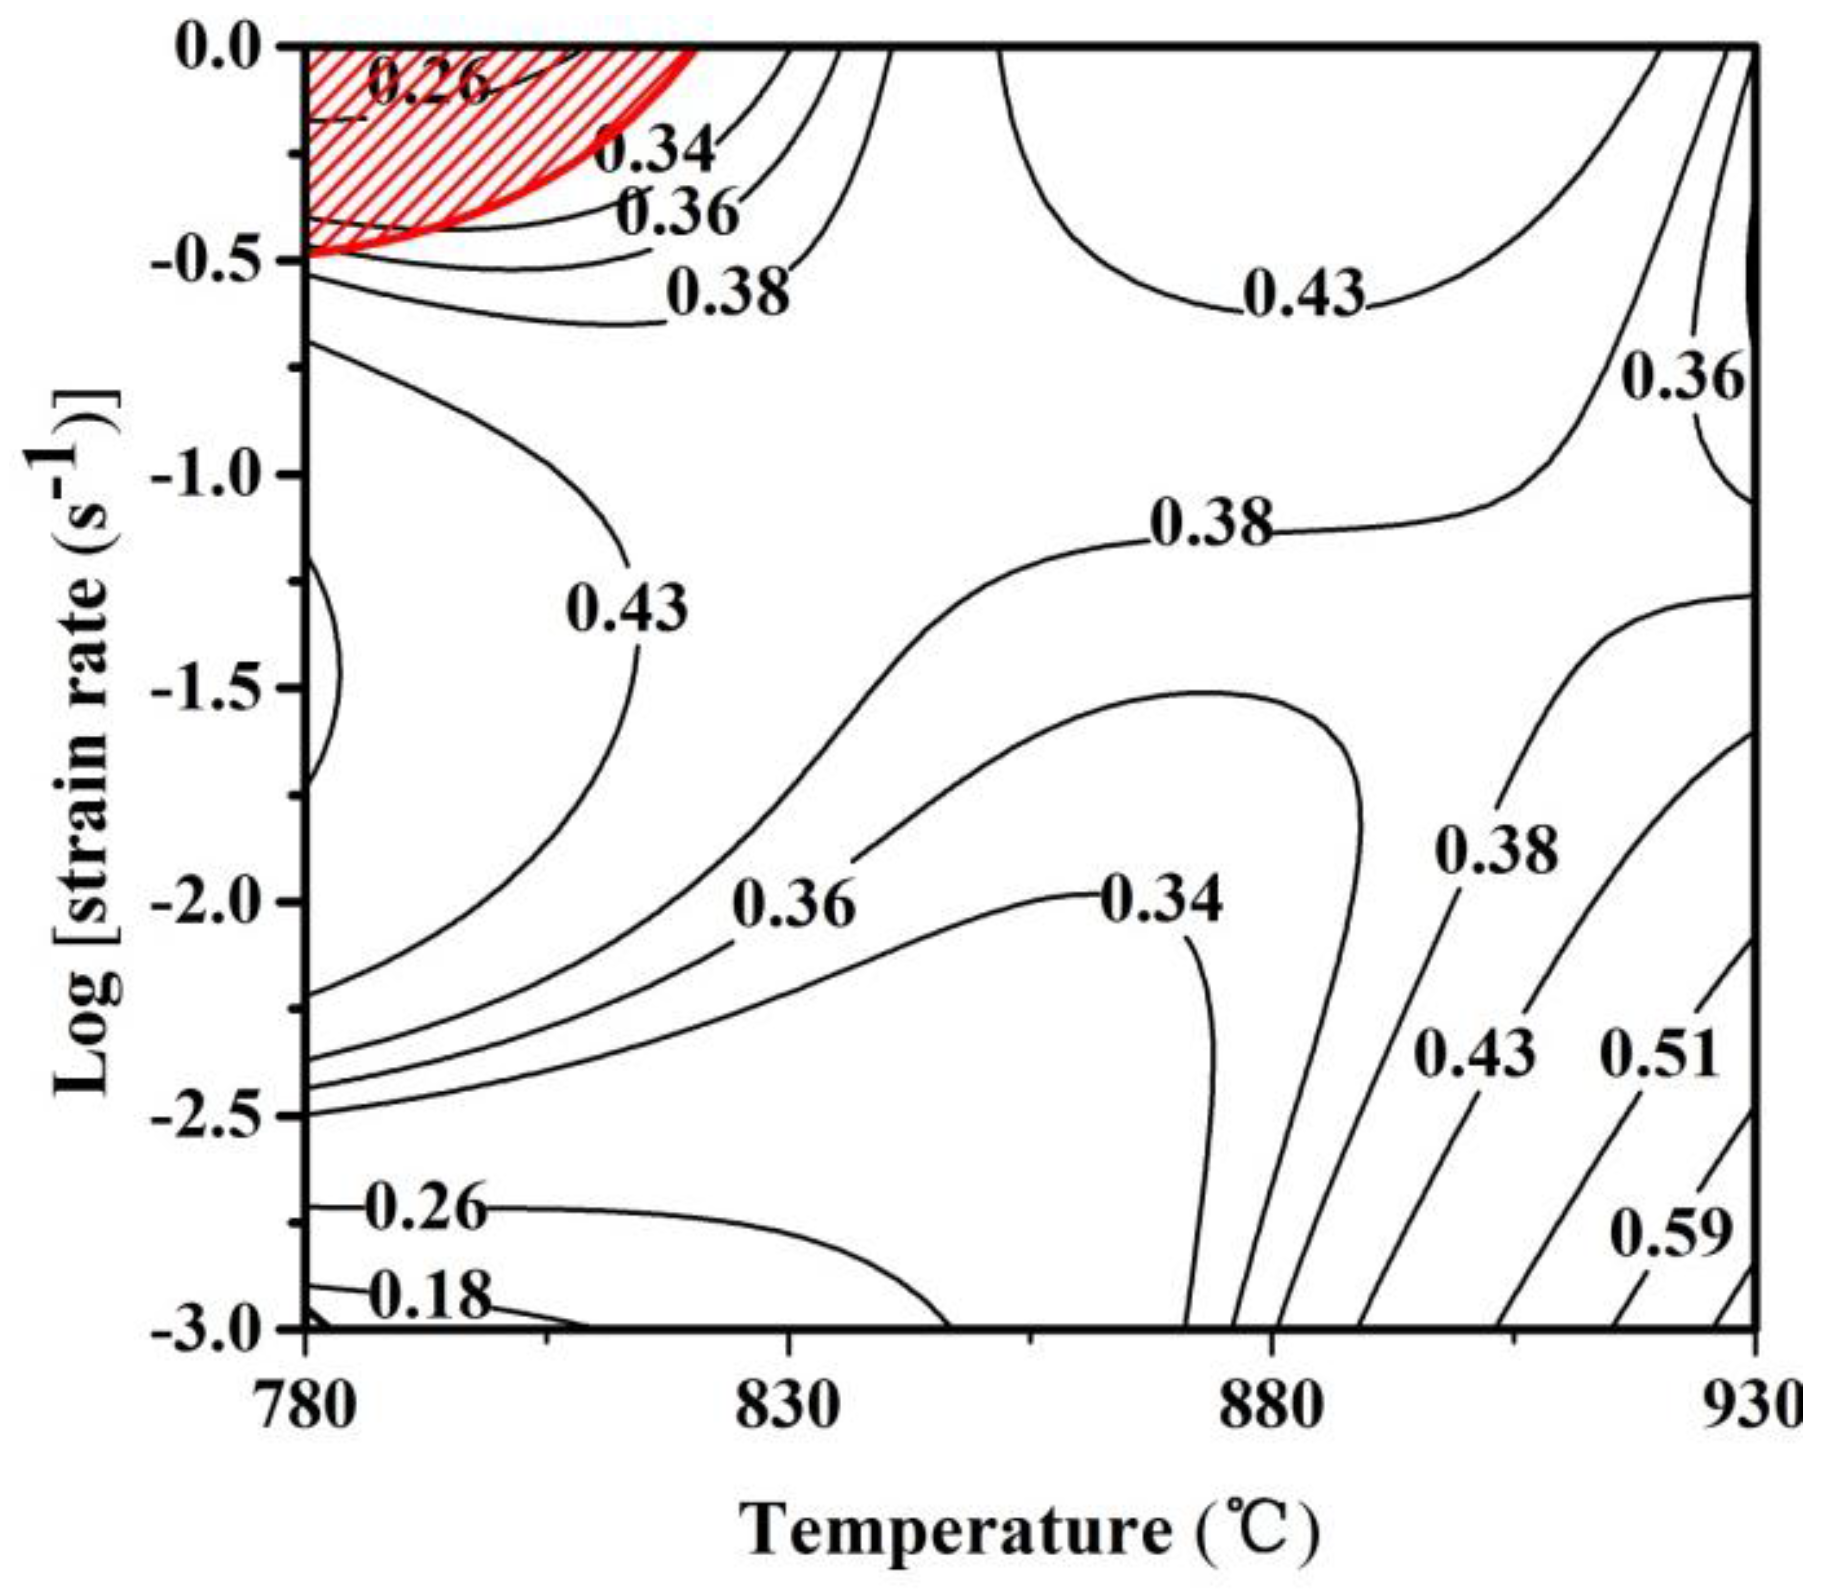
3.2. Processing Map
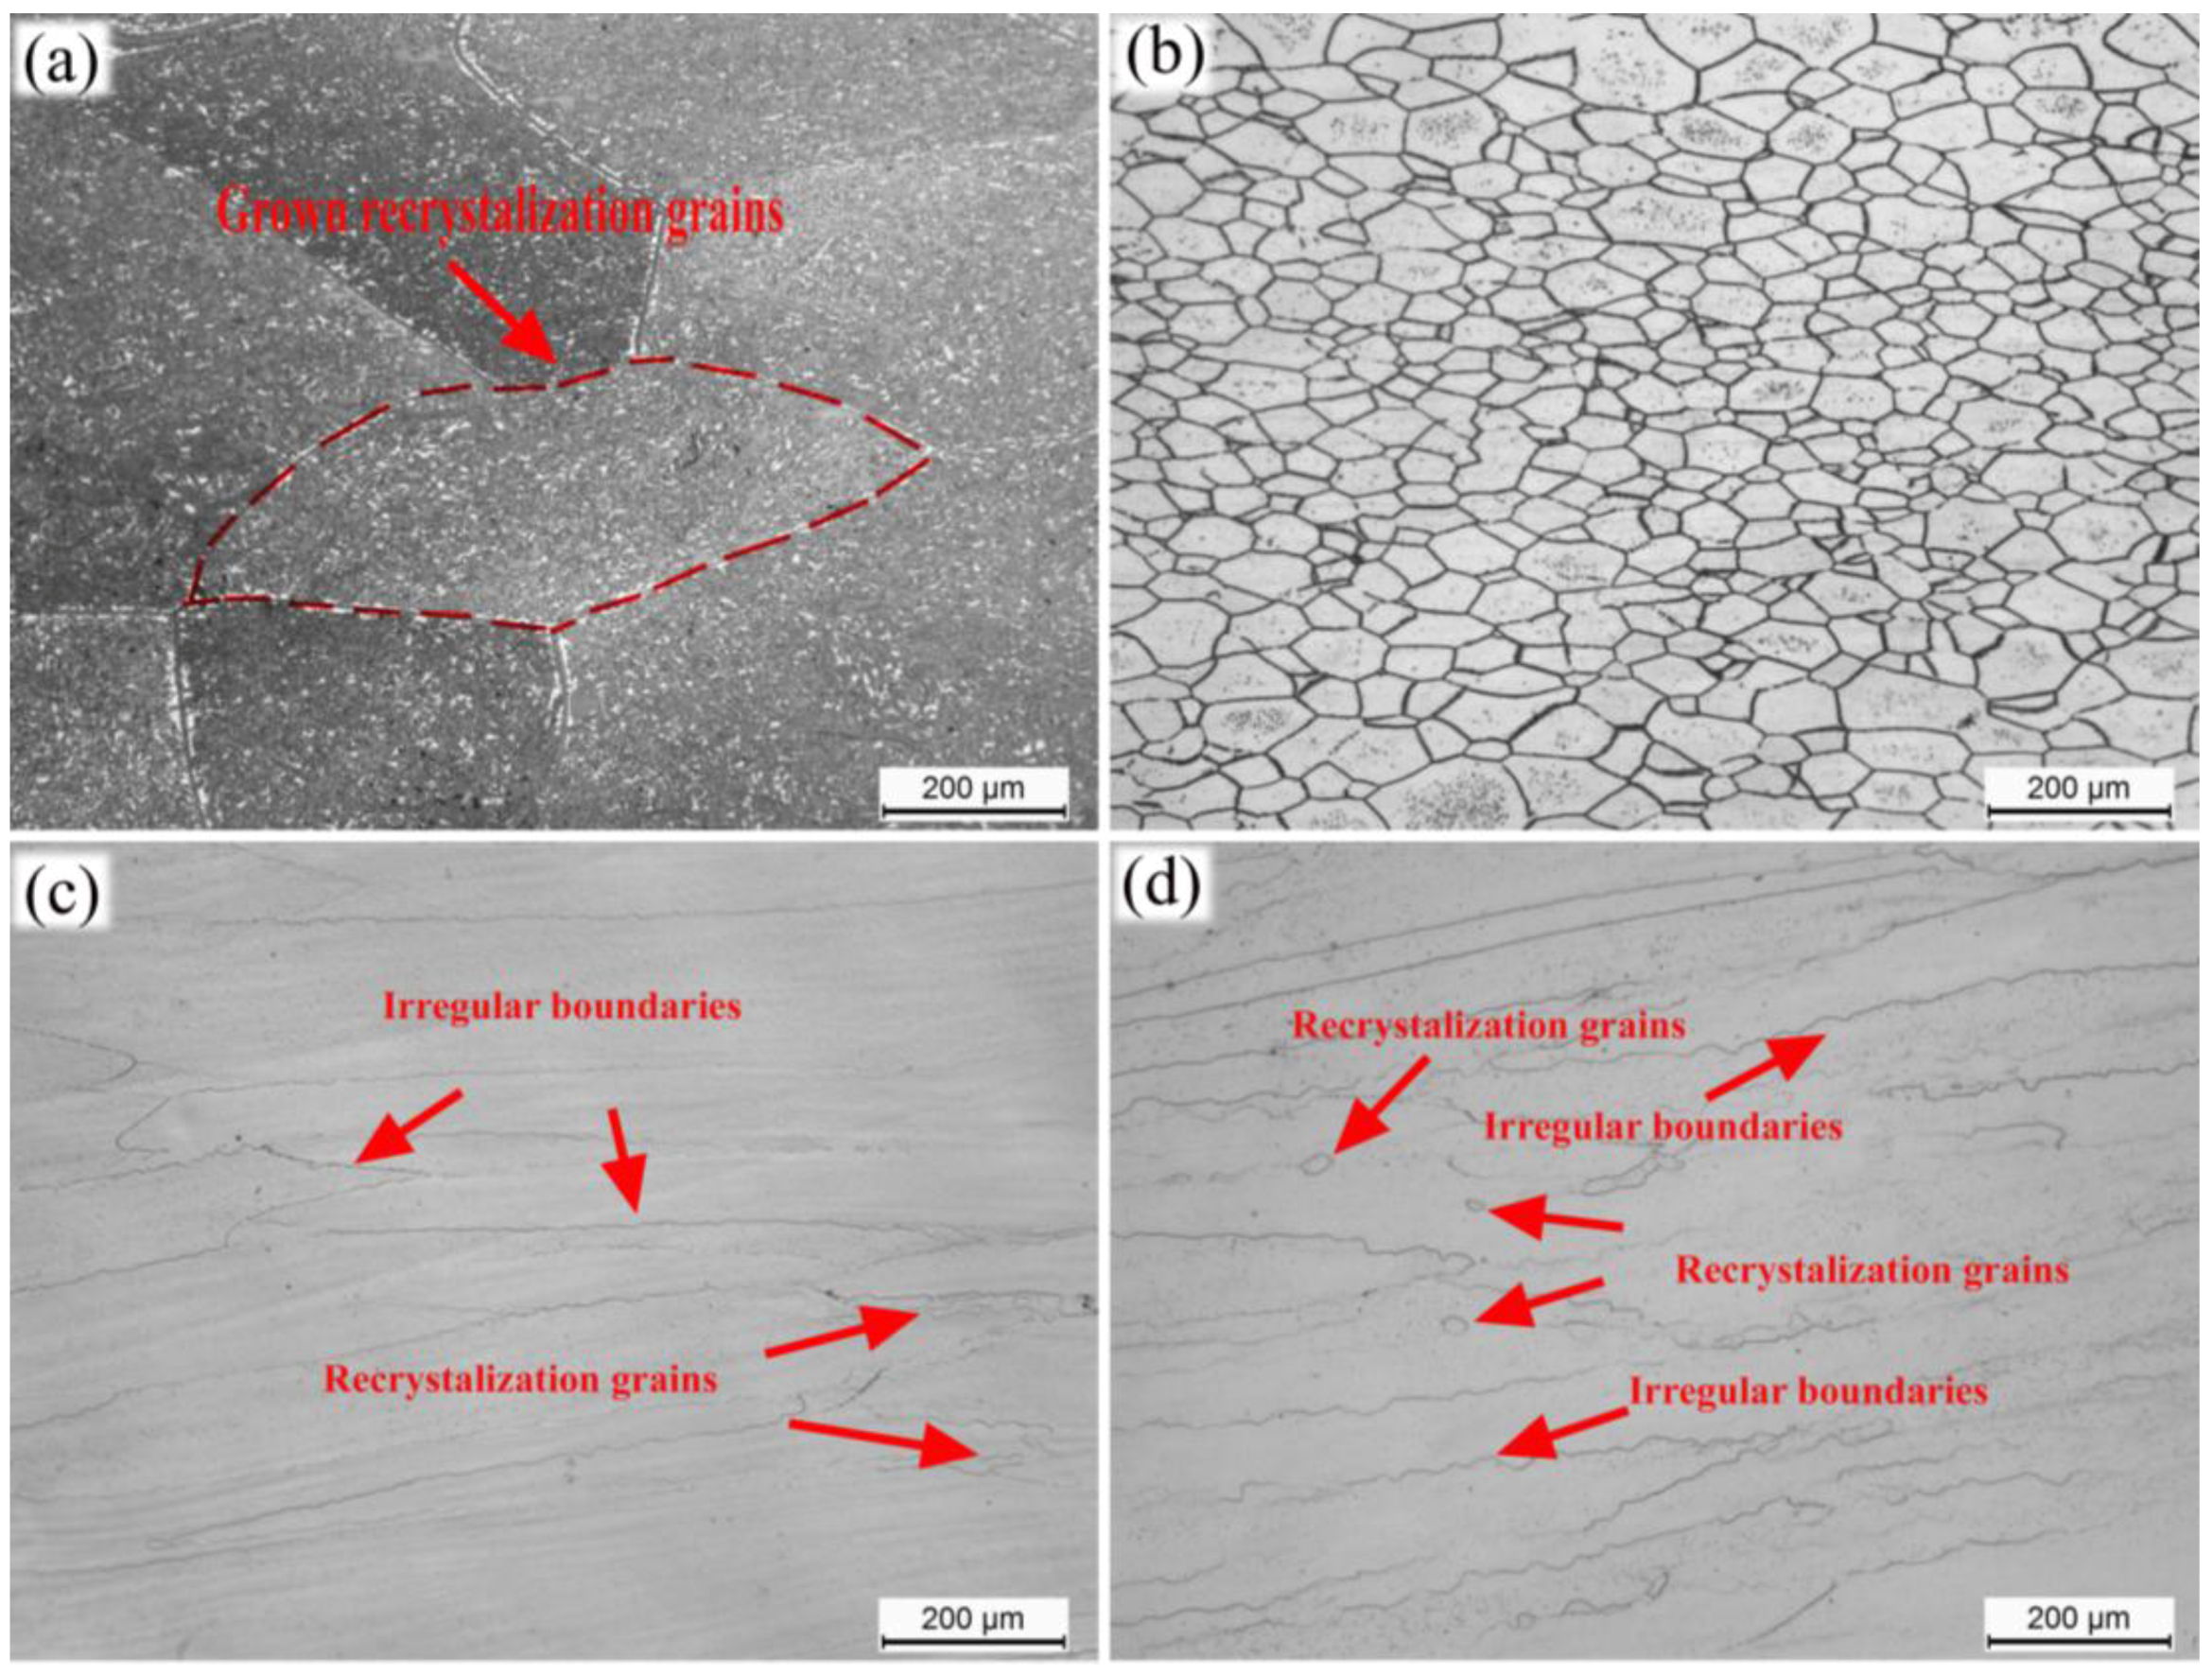
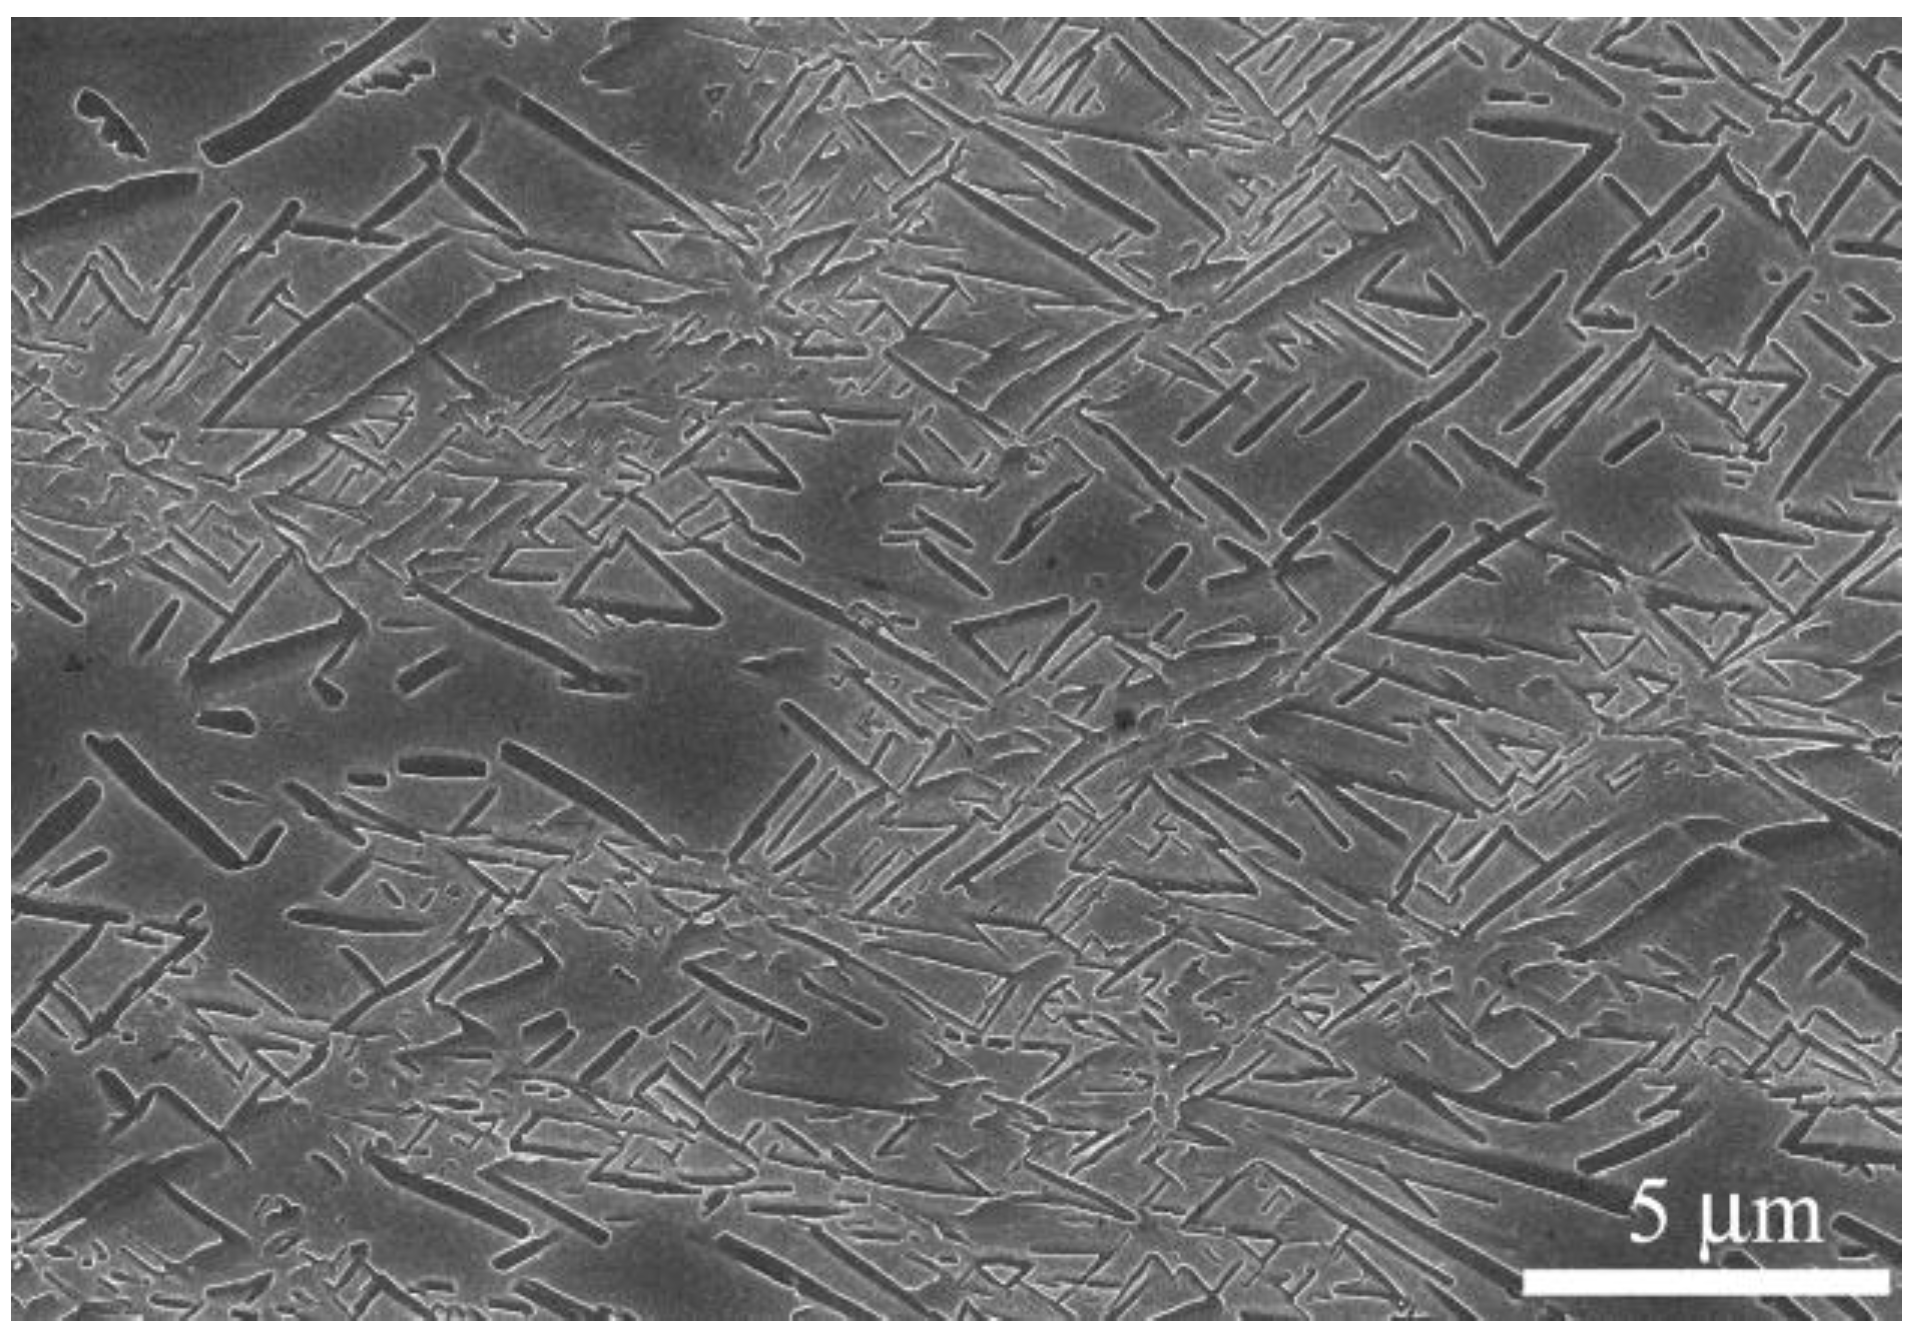
3.3. Microstructure
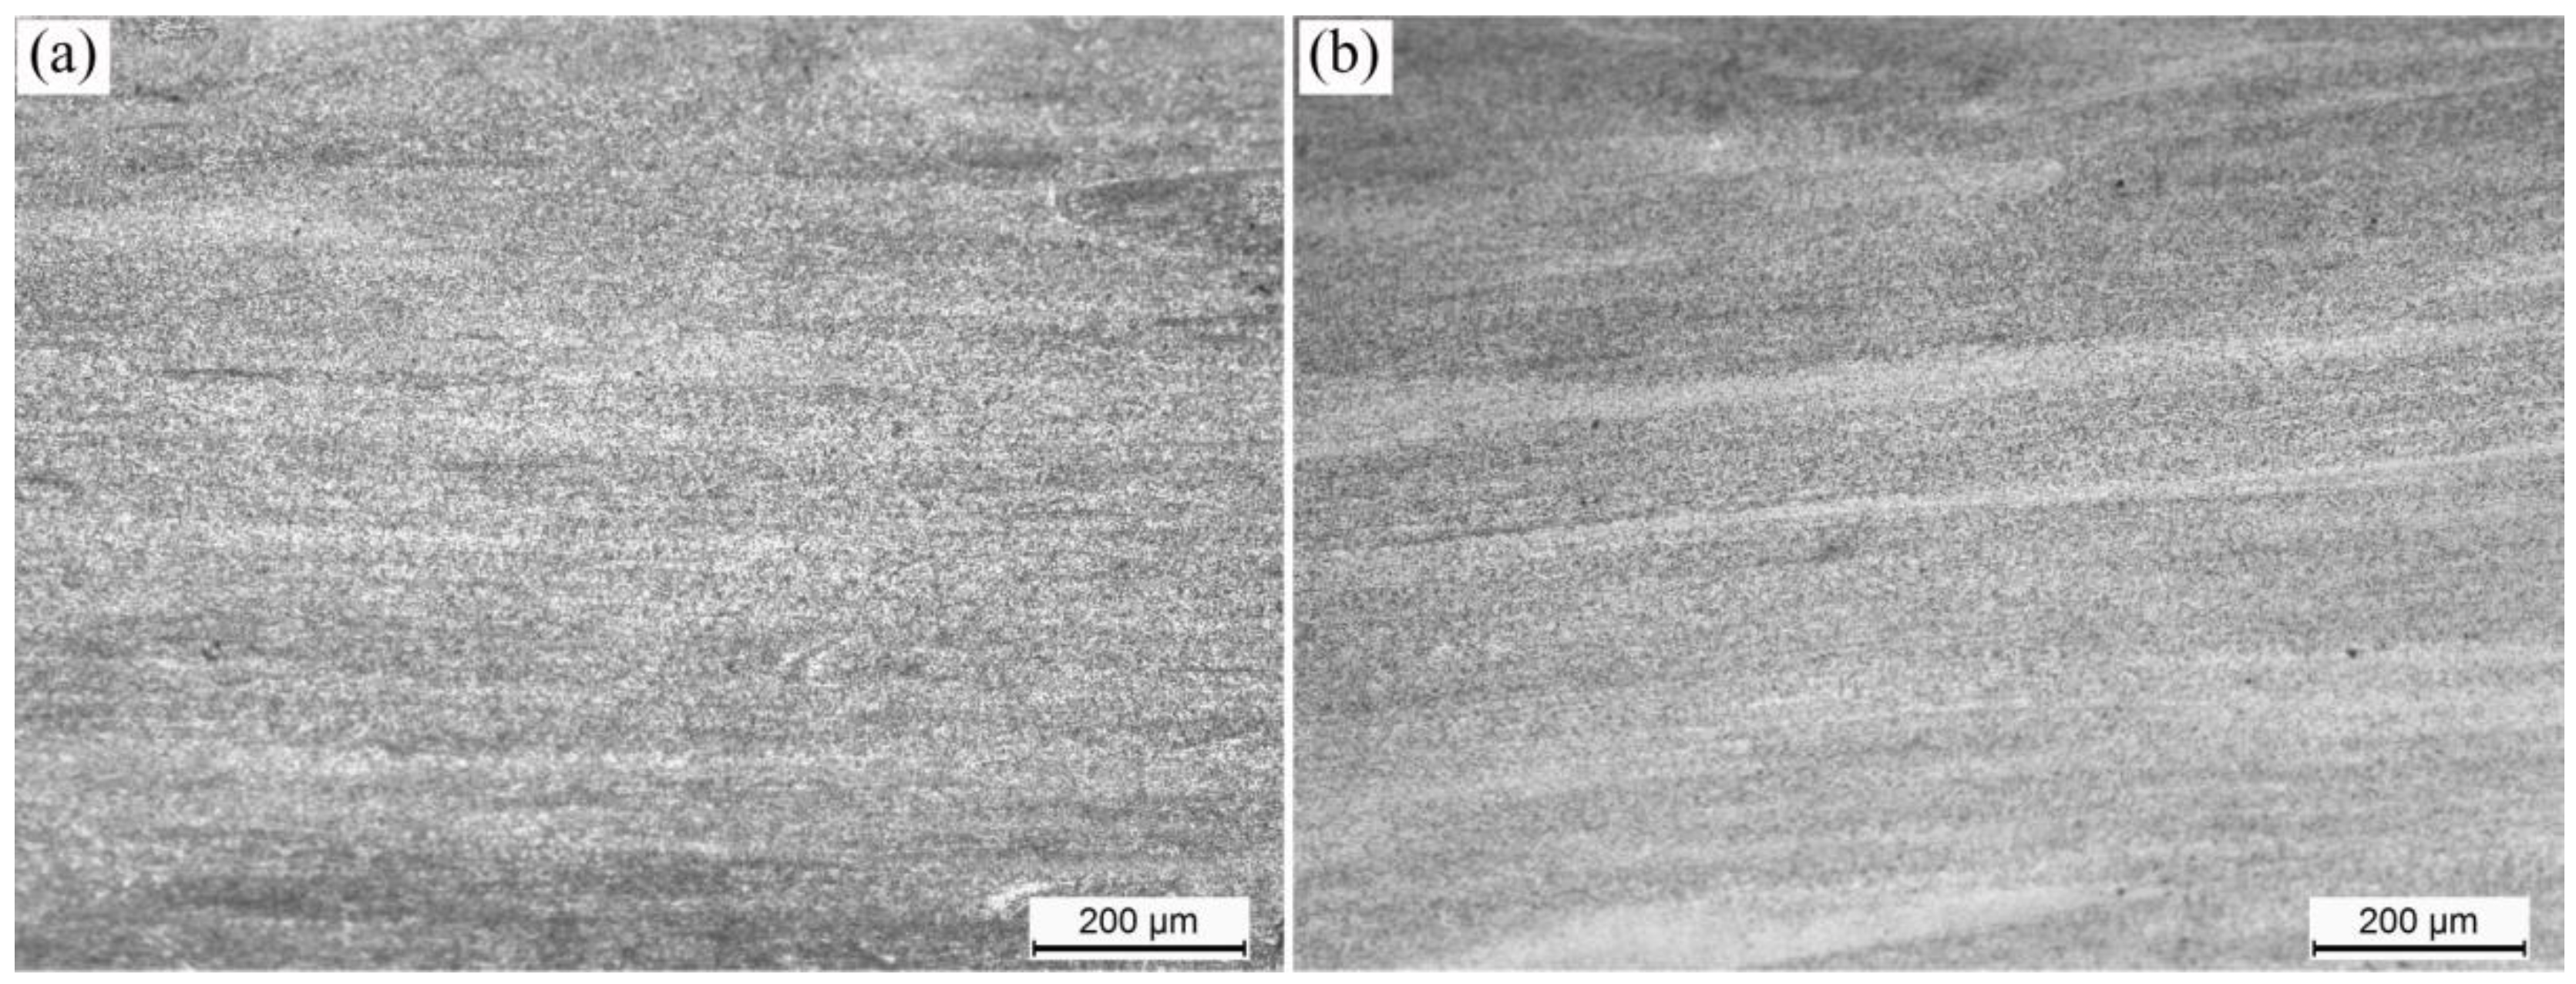
3.3.1. Samples Deformed in Flow Stability Regions
3.3.2. Samples Deformed in Flow Instability Regions
4. Conclusions
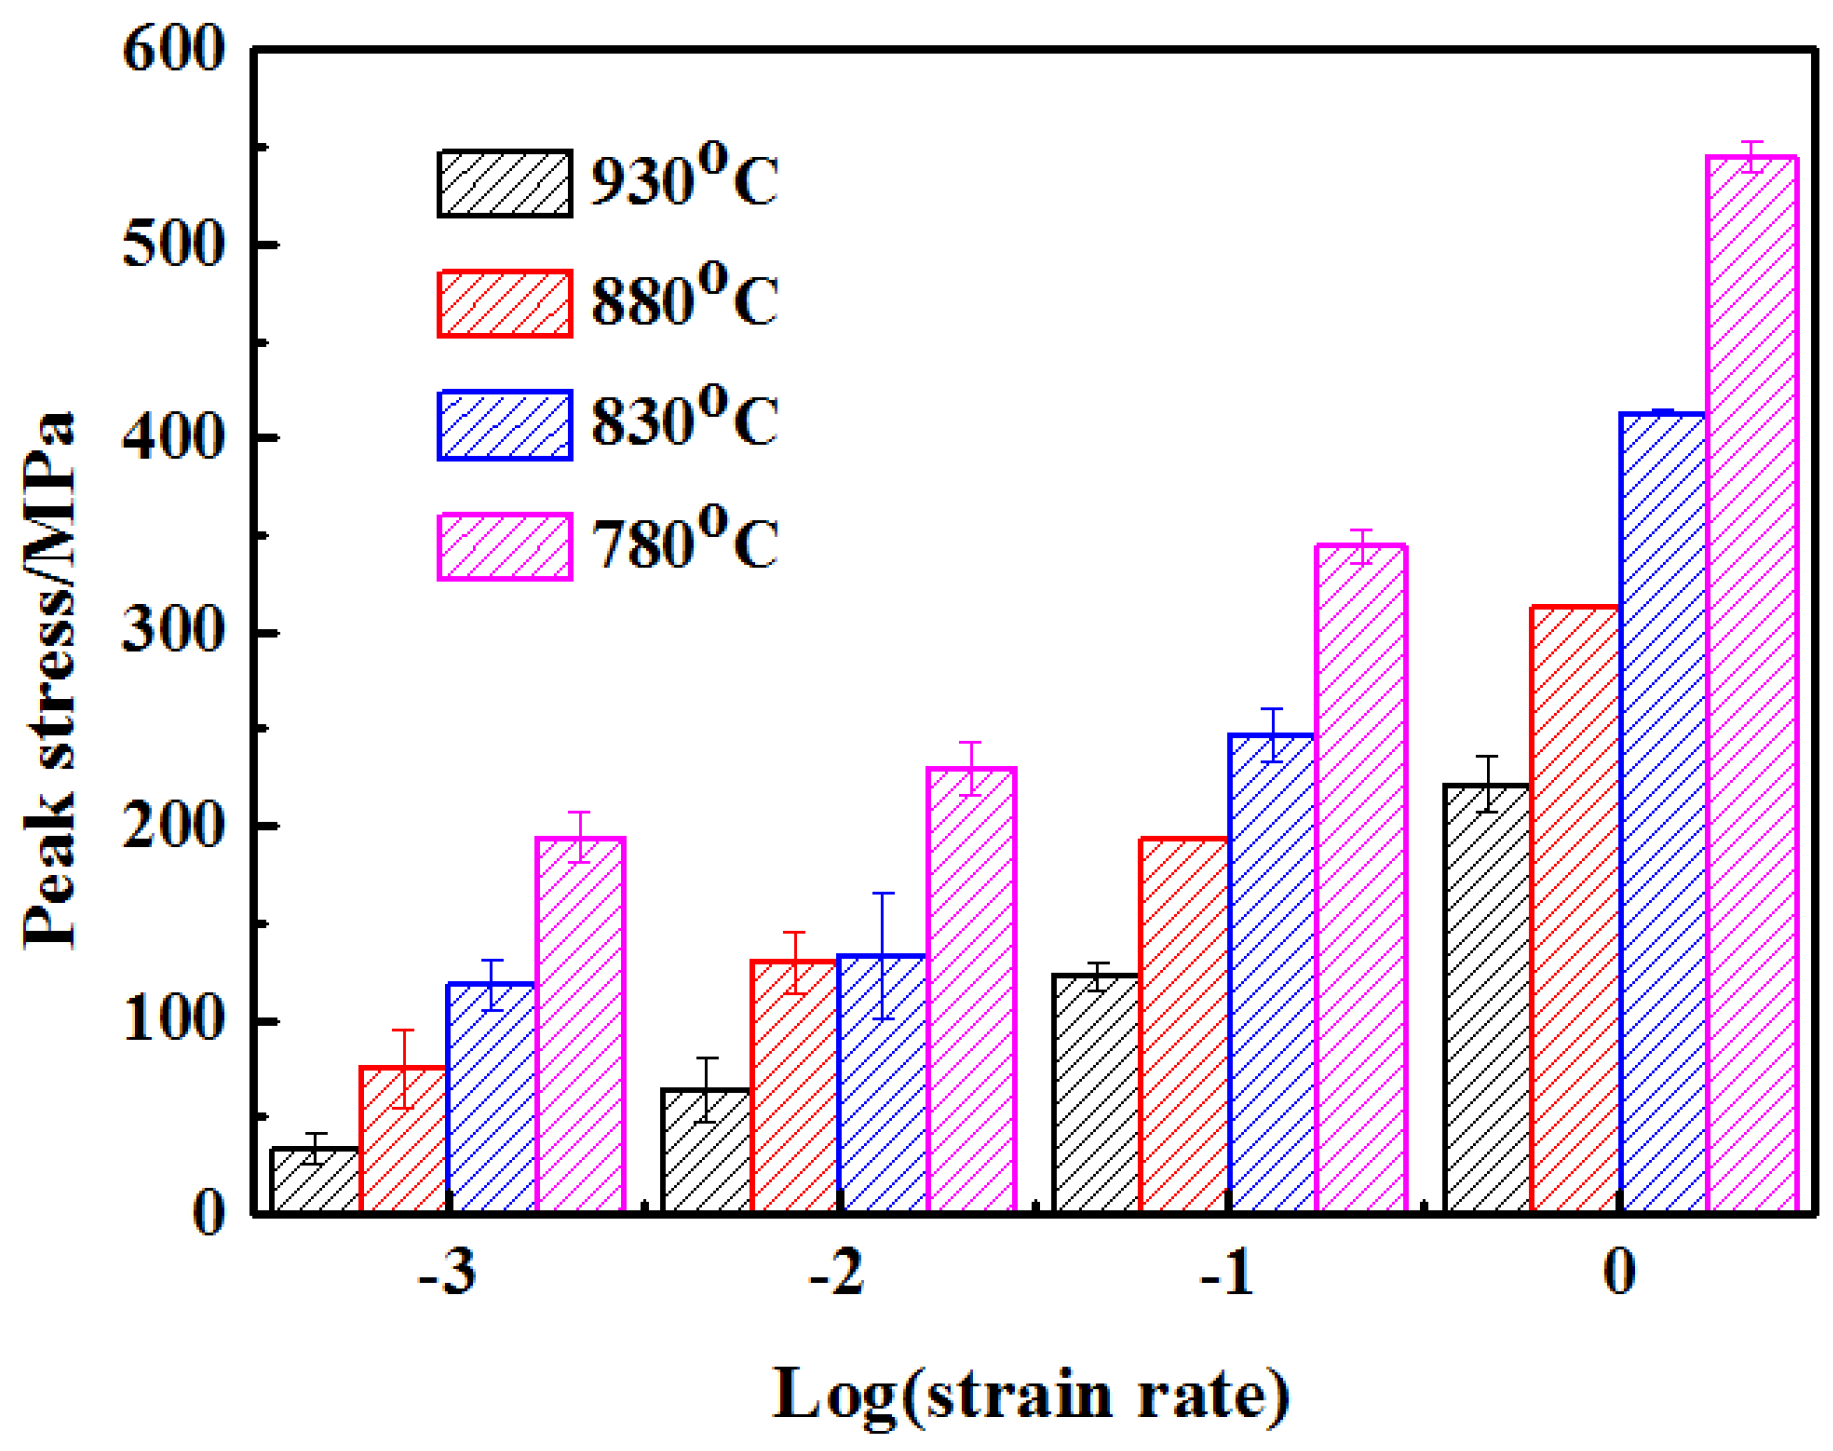
- The flow stress variation of Ti-4Al-1Sn-2Zr-5Mo-8V-2.5Cr alloy is strongly dependent on the strain rate and deformation temperature. The peak flow stress decreases with decreasing strain rate and increasing temperature.
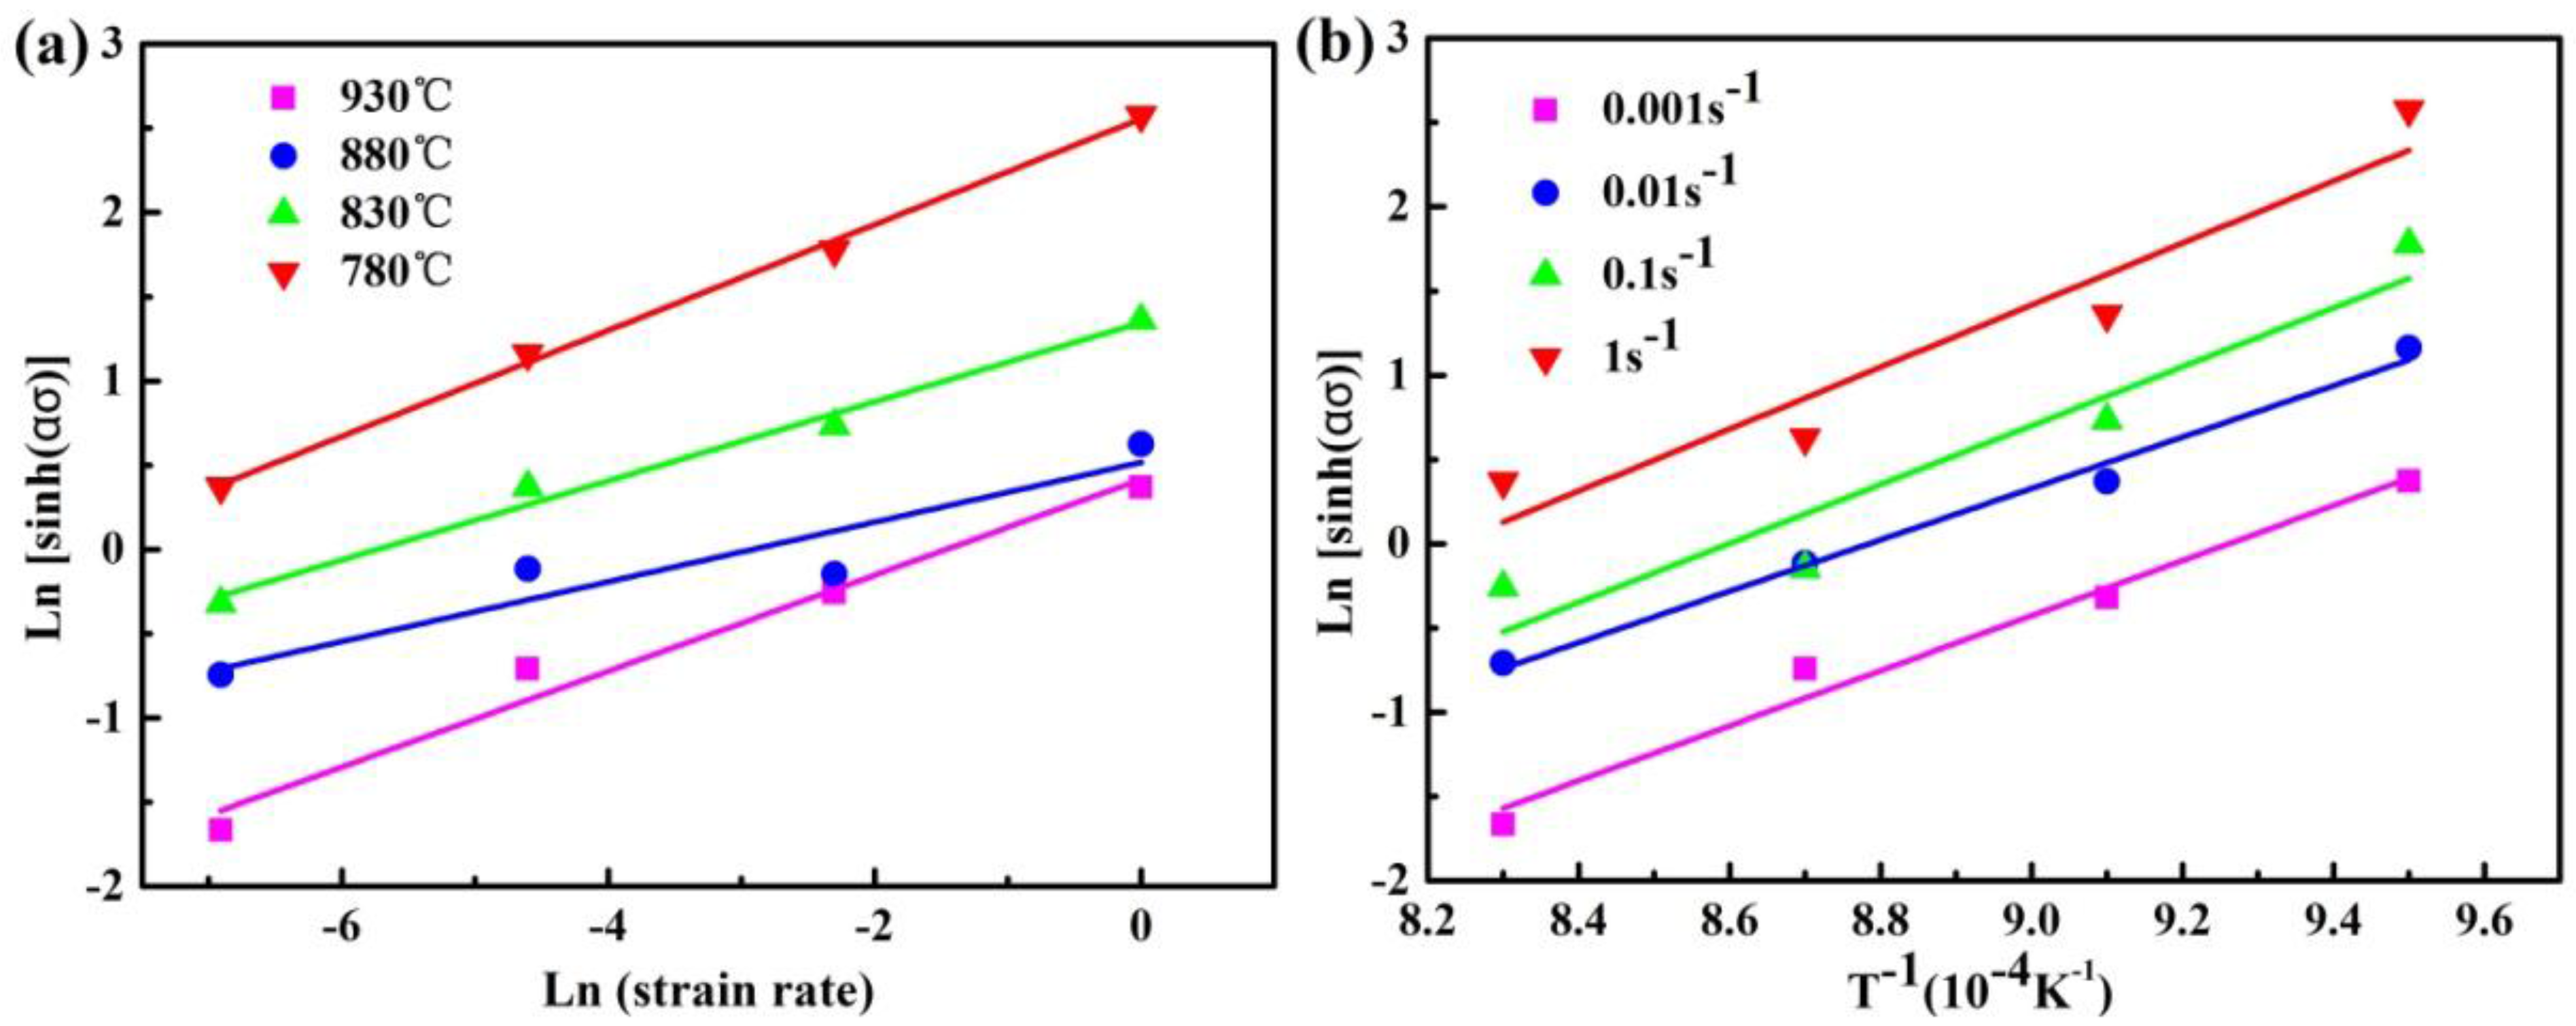
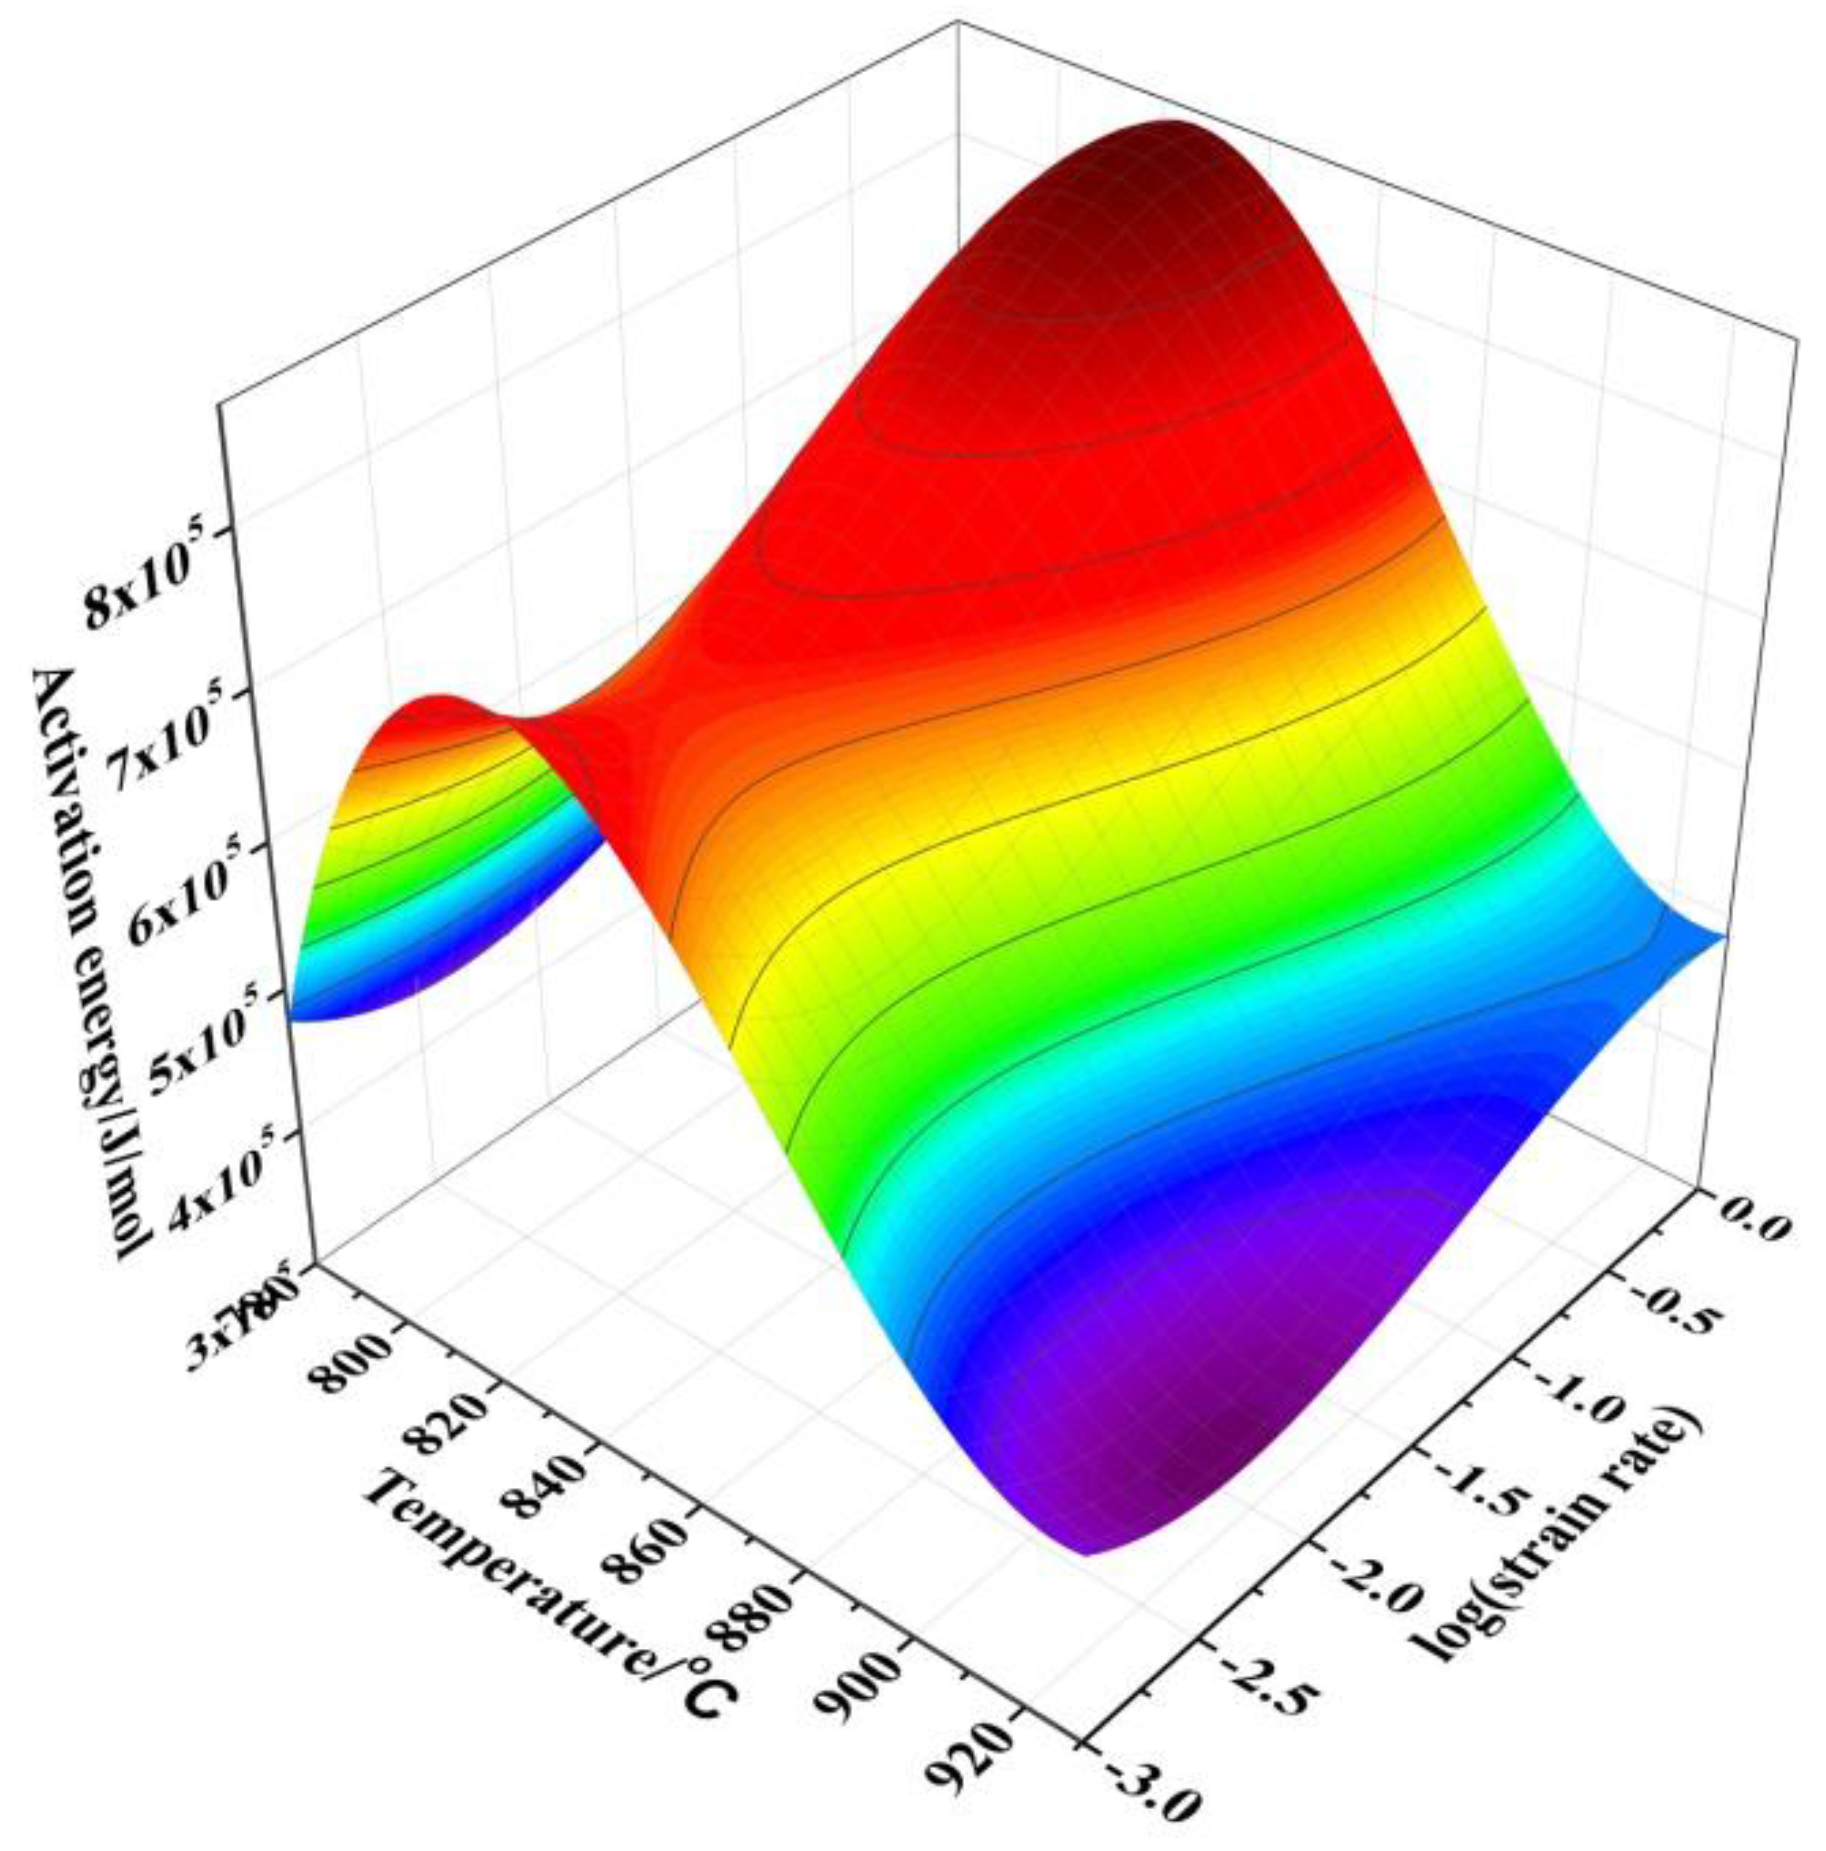
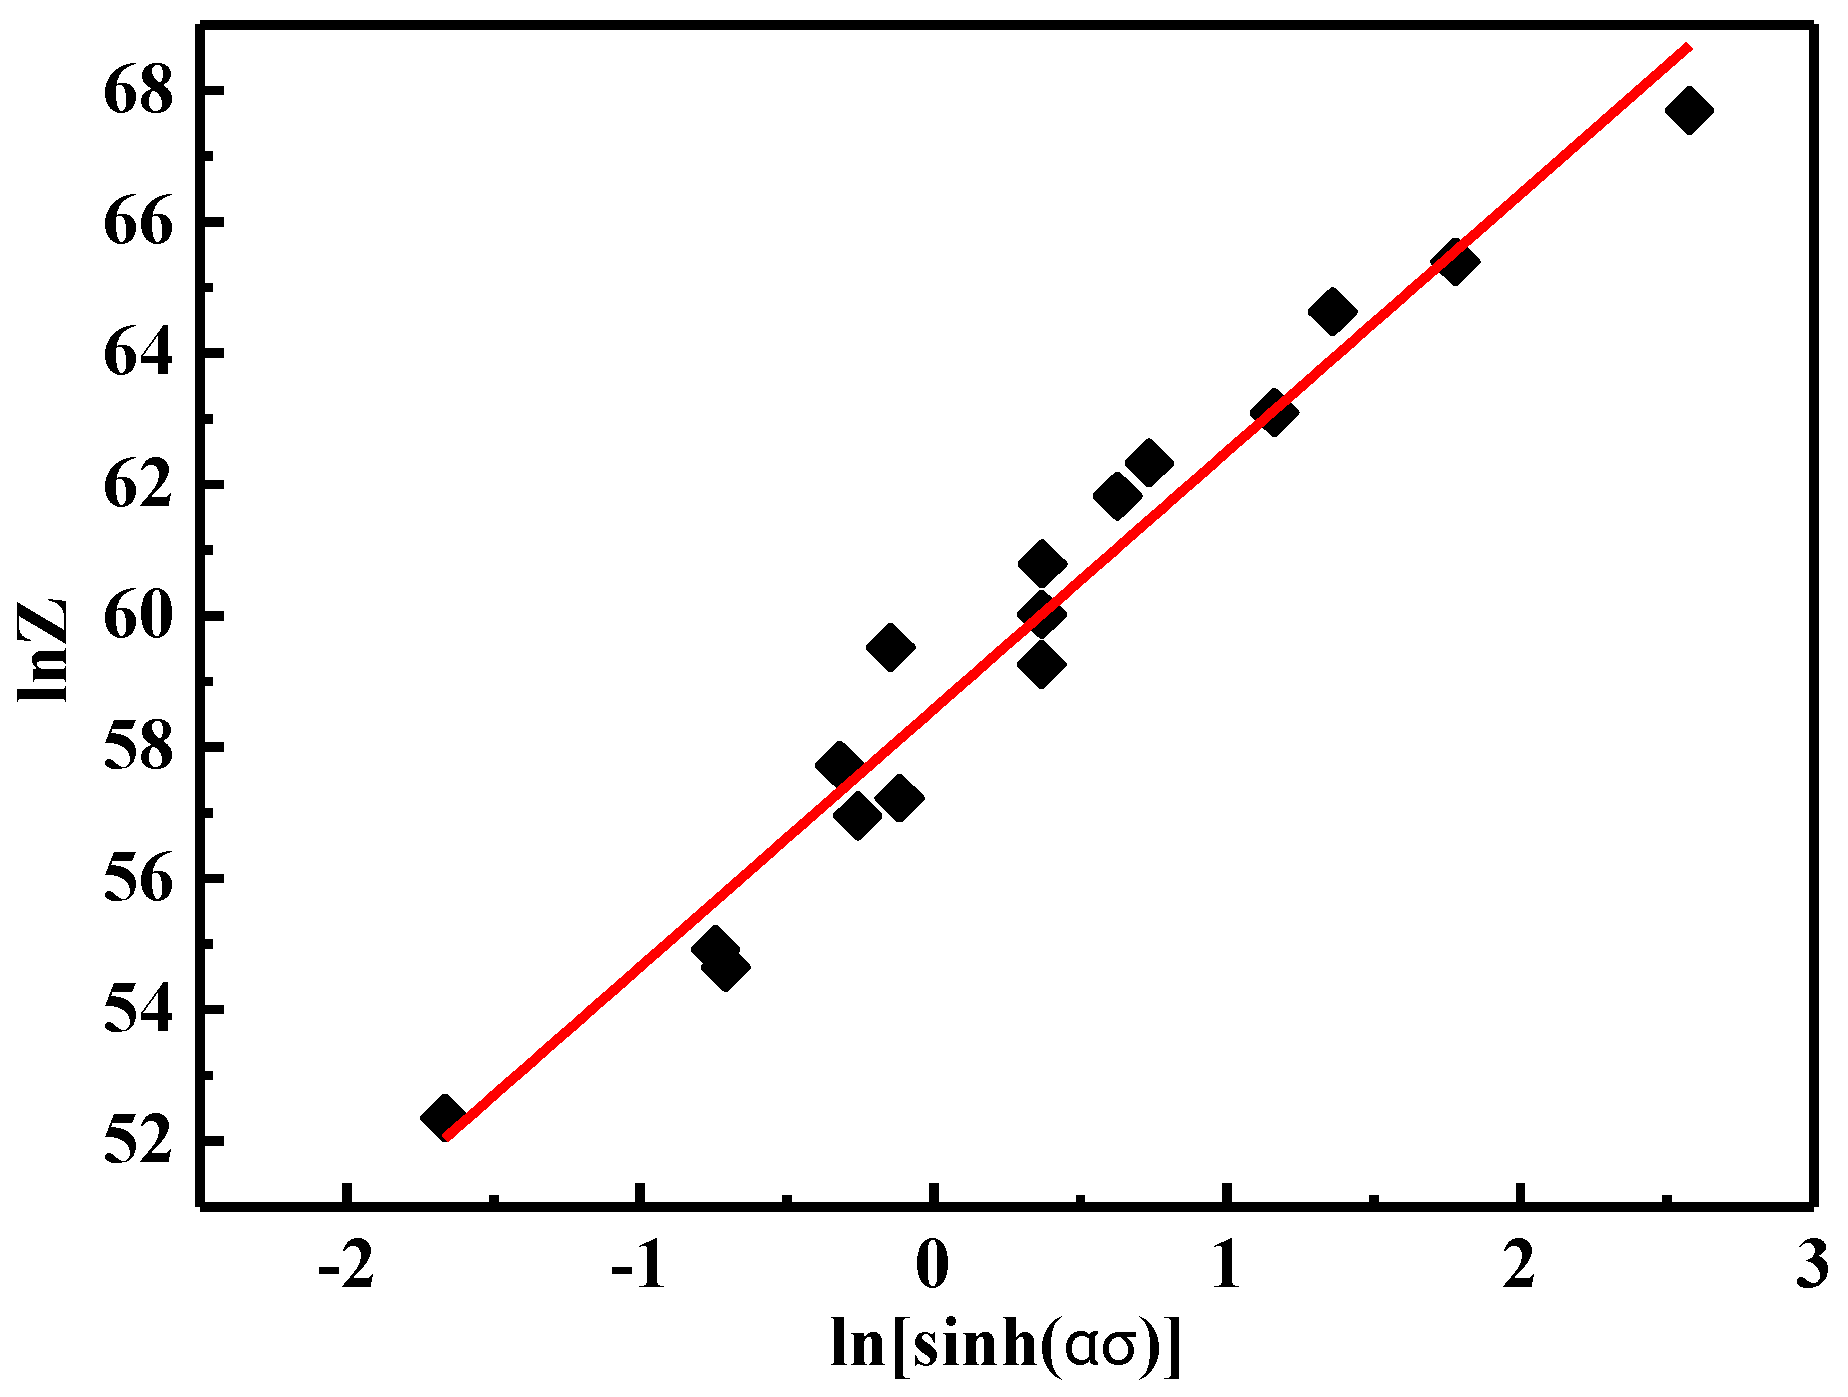
- The constitutive equation is constructed and the average deformation activation energy is calculated to be 592.7 kJ/mol. The constitutive equations for the current alloy are:
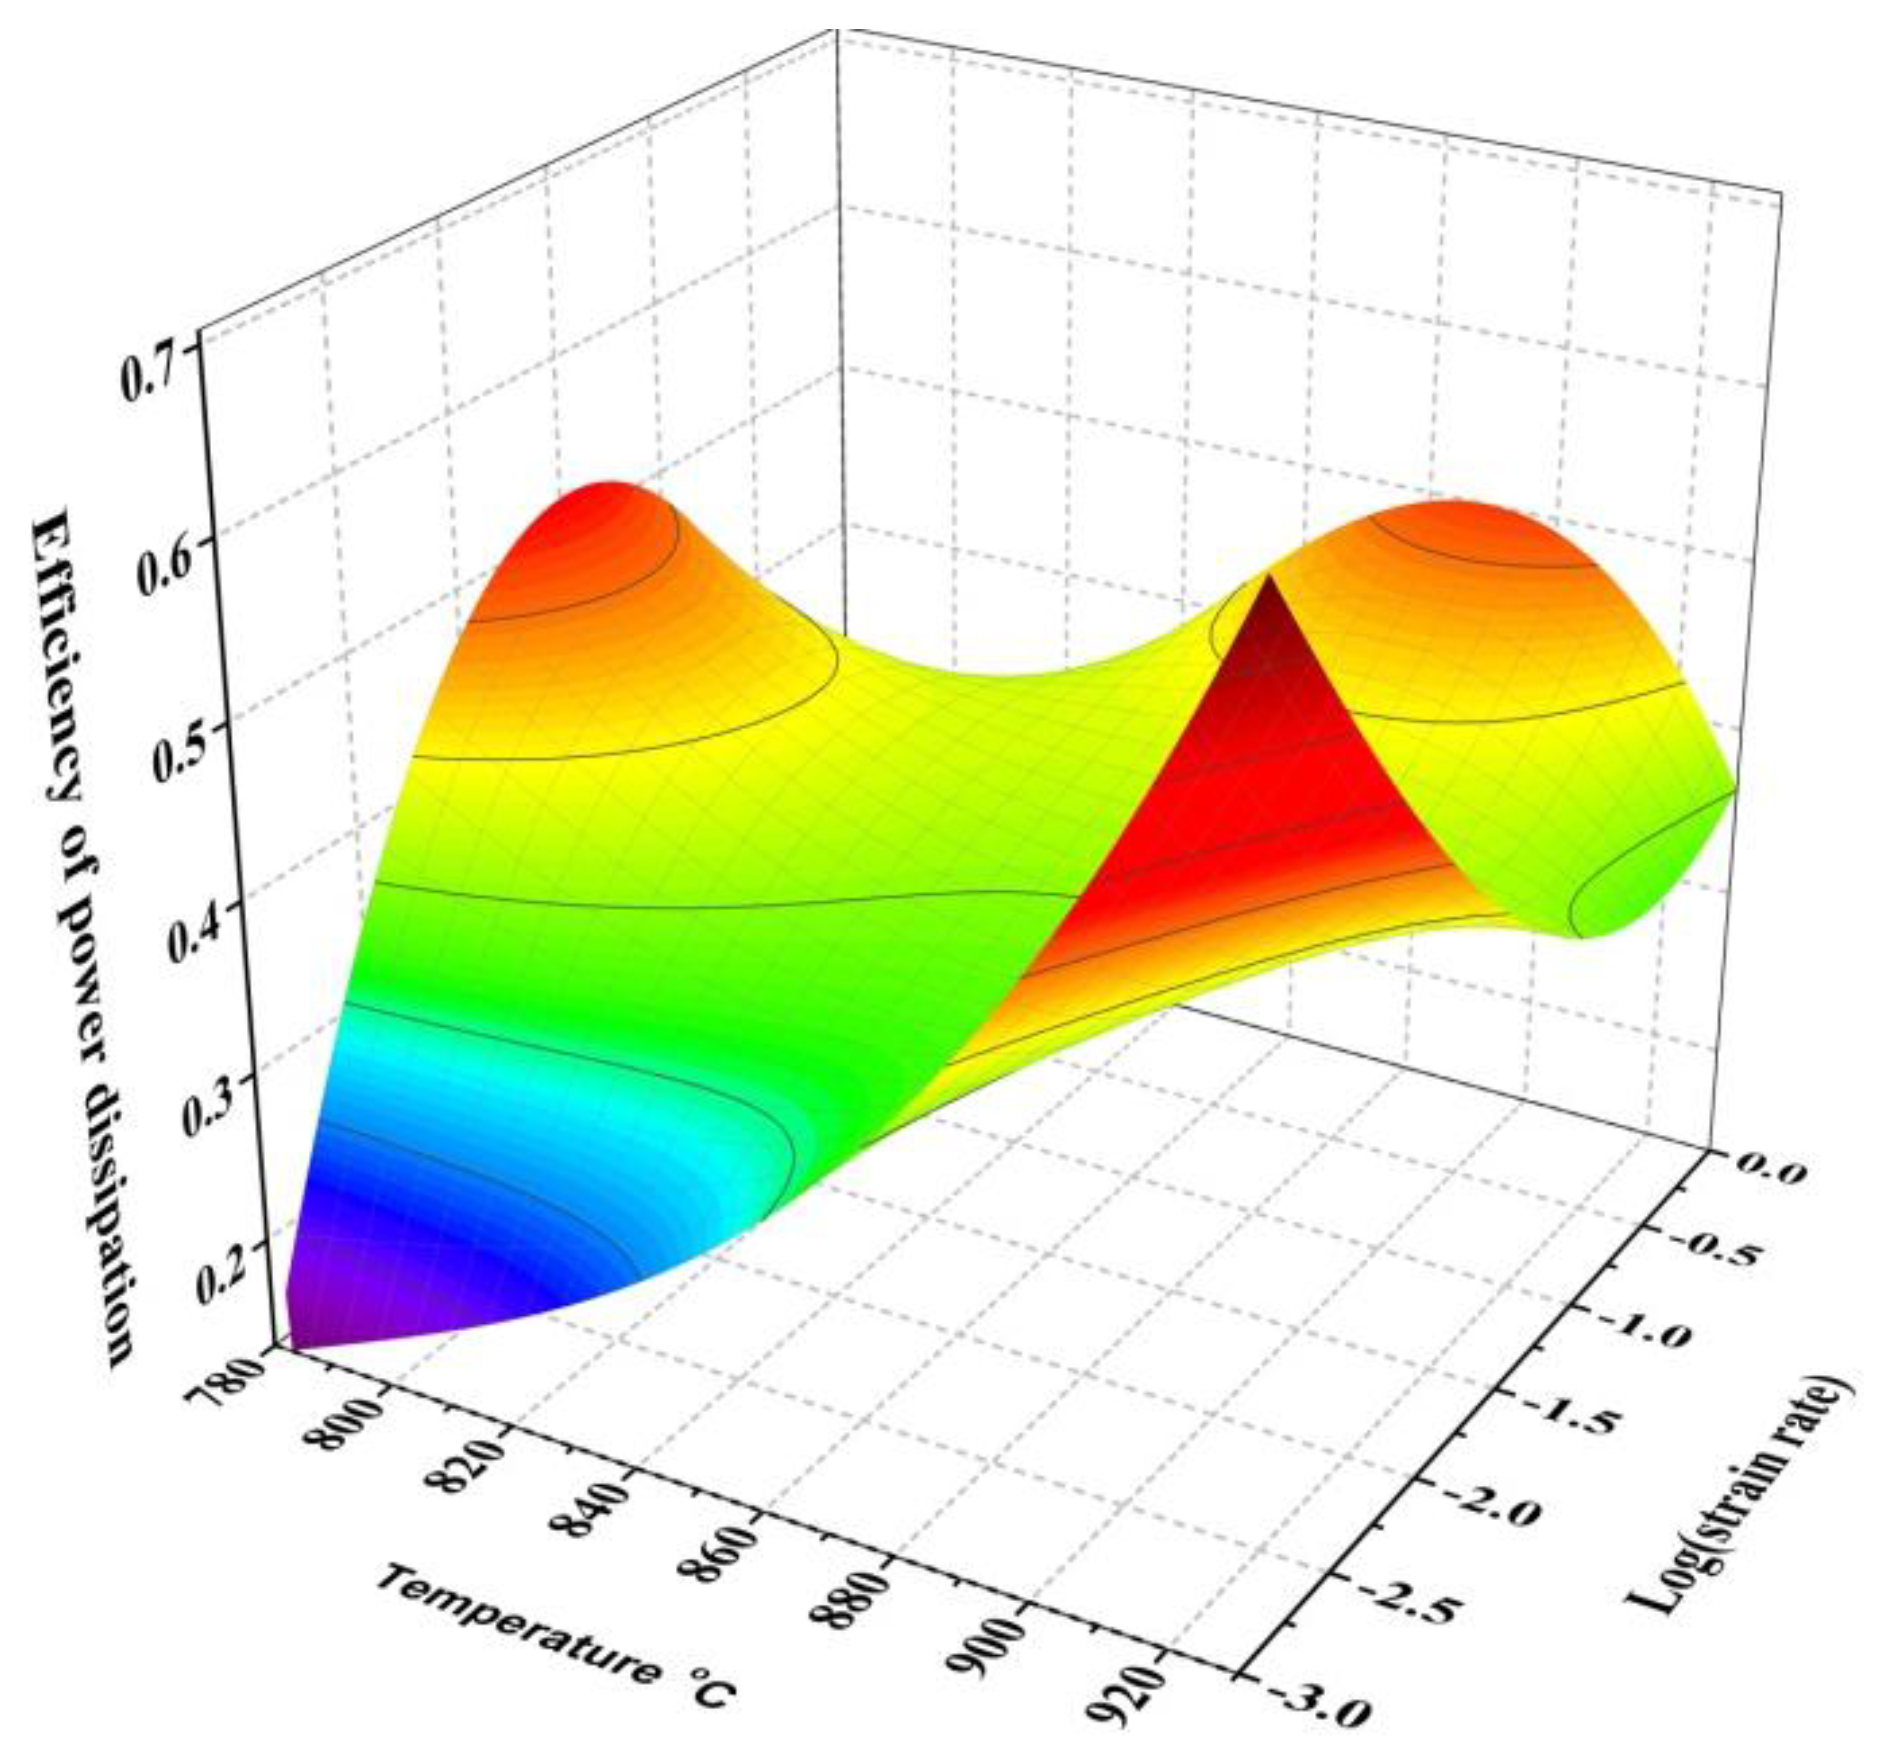
- The dominant mechanism in the instability domain is the flow localizations, while in the stability domains, the mechanisms are DRV and DRX. The optimal processing parameters are obtained in the temperature range of 780 °C to 880 °C and strain rate of 0.001 to 0.01s−1.
Acknowledgments
Author Contributions
Conflicts of Interest
References
- Zhang, X.E.; Zhang, J.S.; Chen, F.; Yang, Z.J.; He, J.L. Characteristics of resistance spot welded Ti6Al4V titanium alloy sheets. Metals 2017, 10, 424. [Google Scholar] [CrossRef]
- Zhang, Q.; Chen, J.; Wang, L.; Tan, H.; Lin, X.; Huang, W. Solidification microstructure of laser additive manufactured Ti-6Al-2Zr-2Sn-3Mo-1.5Cr-2Nb titanium alloy. J. Mater. Sci. Technol. 2016, 32, 381–386. [Google Scholar] [CrossRef]
- Zhao, Z.; Chen, J.; Guo, S.; Tan, H.; Lin, X.; Huang, W. Influence of α/β interface phase on the tensile properties of laser cladding deposited Ti-6Al-4V titanium alloy. J. Mater. Sci. Technol. 2017, 33, 675–681. [Google Scholar] [CrossRef]
- Tang, B.; Kou, H.; Zhang, X.; Gao, P.; Li, J. Study on the formation mechanism of α lamellae in a near β titanium alloy. Prog. Nat. Sci. Mater. Inter. 2016, 26, 385–390. [Google Scholar] [CrossRef]
- Du, Z.X.; Xiao, S.L.; Shen, Y.P.; Liu, J.S.; Liu, J.; Xu, L.J.; Kong, F.T.; Chen, Y.Y. Effect of hot rolling and heat treatment on microstructure and tensile properties of high strength beta titanium alloy sheets. Mater. Sci. Eng. A 2015, 631, 67–74. [Google Scholar] [CrossRef]
- Boyer, R.R. An overview on the use of titanium in the aerospace industry. Mater. Sci. Eng. A 1996, 213, 103–114. [Google Scholar] [CrossRef]
- Bruschi, S.; Buffa, G.; Ducato, A.; Fratini, L.; Ghiotti, A. Phase evolution in hot forging of dual phase titanium alloys: Experiments and numerical analysis. J. Manuf. Process. 2015, 20, 382–388. [Google Scholar] [CrossRef]
- Guo, L.; Fan, X.; Yu, G.; Yang, H. Microstructure control techniques in primary hot working of titanium alloy bars: A review. Chin. J. Aeronaut. 2016, 29, 30–40. [Google Scholar] [CrossRef]
- Weiss, I.; Semiatin, S.L. Thermomechanical processing of beta titanium alloys–An overview. Mater. Sci. Eng. A 1998, 243, 46–65. [Google Scholar] [CrossRef]
- Zhou, Y.G.; Zeng, W.D.; Yu, H.Q. An investigation of a new near-beta forging process for titanium alloys and its application in aviation components. Mater. Sci. Eng. A 2005, 393, 204–212. [Google Scholar] [CrossRef]
- Carrino, L.; Paradiso, V.; Franchitti, S.; Squillace, A.; Russo, S. Superplastic forming/diffusion bonding of a titanium alloy for the realization of an aircraft structural component in multi-sheets configuration. Key Eng. Mater. 2012, 504–506, 712–722. [Google Scholar] [CrossRef]
- Wang, K.; Lu, S.; Fu, M.W.; Li, X.; Dong, X. Optimization of β/near-β forging process parameters of Ti-6.5Al-3.5Mo-1.5Zr-0.3Si by using processing maps. Mater. Charact. 2009, 60, 492–498. [Google Scholar] [CrossRef]
- Wang, Z.; Wang, X.; Zhu, Z. Characterization of high-temperature deformation behavior and processing map of TB17 titanium alloy. J. Alloys Compd. 2017, 692, 149–154. [Google Scholar] [CrossRef]
- Zhao, J.; Zhong, J.; Yan, F.; Chai, F.; Dargusch, M. Deformation behaviour and mechanisms during hot compression at supertransus temperatures in Ti-10V-2Fe-3Al. J. Alloys Compd. 2017, 710, 616–627. [Google Scholar] [CrossRef]
- Zhao, H.Z.; Xiao, L.; Ge, P.; Sun, J.; Xi, Z.P. Hot deformation behavior and processing maps of Ti-1300 alloy. Mater. Sci. Eng. A 2014, 604, 111–116. [Google Scholar] [CrossRef]
- Li, J.; Liu, Y.; Liu, B.; Wang, Y.; Cao, P.; Zhou, C.; Xiang, C.; He, Y. High temperature deformation behavior of near γ-phase high Nb-containing TiAl alloy. Intermetallics 2014, 52, 49–56. [Google Scholar] [CrossRef]
- Zhu, Y.; Zeng, W.; Feng, F.; Sun, Y.; Han, Y.; Zhou, Y. Characterization of hot deformation behavior of as-cast TC21 titanium alloy using processing map. Mater. Sci. Eng. A 2011, 528, 1757–1763. [Google Scholar] [CrossRef]
- Li, L.; Li, M. Constitutive model and optimal processing parameters of TC17 alloy with a transformed microstructure via kinetic analysis and processing maps. Mater. Sci. Eng. A 2017, 698, 302–312. [Google Scholar] [CrossRef]
- Liu, D.; Liu, Y.; Zhao, Y.; Huang, Y.; Chen, M. The hot deformation behavior and microstructure evolution of HA/Mg-3Zn-0.8Zr composites for biomedical application. Mater. Sci. Eng. C 2017, 77, 690–697. [Google Scholar] [CrossRef] [PubMed]
- Haghdadi, N.; Zarei-Hanzaki, A.; Khalesian, A.R.; Abedi, H.R. Artificial neural network modeling to predict the hot deformation behavior of an A356 aluminum alloy. Mater. Des. 2013, 49, 386–391. [Google Scholar] [CrossRef]
- Fan, J.K.; Kou, H.C.; Lai, M.J.; Tang, B.; Chang, H.; Li, J.S. Characterization of hot deformation behavior of a new near beta titanium alloy: Ti-7333. Mater. Des. 2013, 49, 945–952. [Google Scholar] [CrossRef]
- Flower, H.M. Microstructural development in relation to hot working of titanium alloys. Mater. Sci. Technol. 1990, 6, 1082–1092. [Google Scholar] [CrossRef]
- Ravindranadh, B.; Venkata, R.B.; Madhu, V. A physically-based constitutive model for hot deformation of Ti-10-2-3 alloy. J. Alloys Compd. 2017, 696, 295–303. [Google Scholar]
- Warchomicka, F.; Poletti, C.; Stockinger, M. Study of the hot deformation behaviour in Ti–5Al–5Mo–5V–3Cr–1Zr. Mater. Sci. Eng. A 2011, 528, 8277–8285. [Google Scholar] [CrossRef]
- Guo, S.; Li, D.; Wu, X.; Xu, X.; Du, P.; Hu, J. Characterization of hot deformation behavior of a Zn–10.2Al–2.1Cu alloy using processing maps. Mater. Des. 2012, 41, 158–166. [Google Scholar] [CrossRef]
- Zhou, Z.; Fan, Q.; Xia, Z.; Hao, A.; Yang, W.; Ji, W.; Cao, H. Constitutive Relationship and Hot Processing Maps of Mg-Gd-Y-Nb-Zr Alloy. J. Mater. Process. Technol. 2017, 33, 637–644. [Google Scholar] [CrossRef]
- Basanth, K.K.; Saxena, K.K.; Dey, S.R.; Pancholi, V.; Bhattacharjee, A. Processing map-microstructure evolution correlation of hot compressed near alpha titanium alloy (TiHy 600). J. Alloys Compd. 2017, 691, 906–913. [Google Scholar]
- Prasad, Y.V.R.K.; Seshacharyulu, T. Processing maps for hot working of titanium alloys. Mater. Sci. Eng. A 1998, 243, 82–88. [Google Scholar] [CrossRef]
- Luo, J.; Li, M.; Yu, W.; Li, H. Effect of the strain on processing maps of titanium alloys in isothermal compression. Mater. Sci. Eng. A 2009, 504, 90–98. [Google Scholar] [CrossRef]
- Peng, X.; Guo, H.; Shi, Z.; Qin, C.; Zhao, Z.; Yao, Z. Study on the hot deformation behavior of TC4-DT alloy with equiaxed α + β starting structure based on processing map. Mater. Sci. Eng. A 2014, 605, 80–88. [Google Scholar] [CrossRef]
- Sun, Y.; Zeng, W.D.; Zhao, Y.Q.; Zhang, X.M.; Shu, Y.; Zhou, Y.G. Research on the hot deformation behavior of Ti40 alloy using processing map. Mater. Sci. Eng. A 2011, 528, 1205–1211. [Google Scholar] [CrossRef]
- Matsumoto, H.; Kitamura, M.; Li, Y.; Koizumi, Y.; Chiba, A. Hot forging characteristic of Ti–5Al–5V–5Mo–3Cr alloy with single metastable. Mater. Sci. Eng. A 2014, 611, 337–344. [Google Scholar] [CrossRef]
- Zong, Y.Y.; Shan, D.B.; Xu, M.; Lv, Y. Flow softening and microstructural evolution of TC11 titanium alloy during hot deformation. J. Mater. Process. Technol. 2009, 209, 1988–1994. [Google Scholar] [CrossRef]
- Momeni, A.; Abbasi, S.M. Effect of hot working on flow behavior of Ti–6Al–4V alloy in single phase and two phase regions. Mater. Des. 2010, 31, 3599–3604. [Google Scholar] [CrossRef]


| Element | Al | Sn | Zr | Mo | V | Cr | Ti |
|---|---|---|---|---|---|---|---|
| Nominal wt. % | 4.00 | 1.00 | 2.00 | 5.00 | 8.00 | 2.50 | bal. |
| Actual wt. % | 4.30 | 1.03 | 2.07 | 4.99 | 8.00 | 2.50 | bal. |
© 2017 by the authors. Licensee MDPI, Basel, Switzerland. This article is an open access article distributed under the terms and conditions of the Creative Commons Attribution (CC BY) license (http://creativecommons.org/licenses/by/4.0/).
Share and Cite
Wu, J.; Lü, Z.; Zhang, C.; Han, J.; Zhang, H.; Zhang, S.; Hayat, M.; Cao, P. Investigation of the Deformation Mechanism of a near β Titanium Alloy through Isothermal Compression. Metals 2017, 7, 498. https://doi.org/10.3390/met7110498
Wu J, Lü Z, Zhang C, Han J, Zhang H, Zhang S, Hayat M, Cao P. Investigation of the Deformation Mechanism of a near β Titanium Alloy through Isothermal Compression. Metals. 2017; 7(11):498. https://doi.org/10.3390/met7110498
Chicago/Turabian StyleWu, Jie, Zhidan Lü, Changjiang Zhang, Jianchao Han, Hongzhou Zhang, Shuzhi Zhang, Muhammad Hayat, and Peng Cao. 2017. "Investigation of the Deformation Mechanism of a near β Titanium Alloy through Isothermal Compression" Metals 7, no. 11: 498. https://doi.org/10.3390/met7110498
APA StyleWu, J., Lü, Z., Zhang, C., Han, J., Zhang, H., Zhang, S., Hayat, M., & Cao, P. (2017). Investigation of the Deformation Mechanism of a near β Titanium Alloy through Isothermal Compression. Metals, 7(11), 498. https://doi.org/10.3390/met7110498