New Nanocomposite Materials with Improved Mechanical Strength and Tailored Coefficient of Thermal Expansion for Electro-Packaging Applications

 ,
, 
 ,
, 

Abstract
:1. Introduction
2. Materials and Methods
2.1. Starting Materials
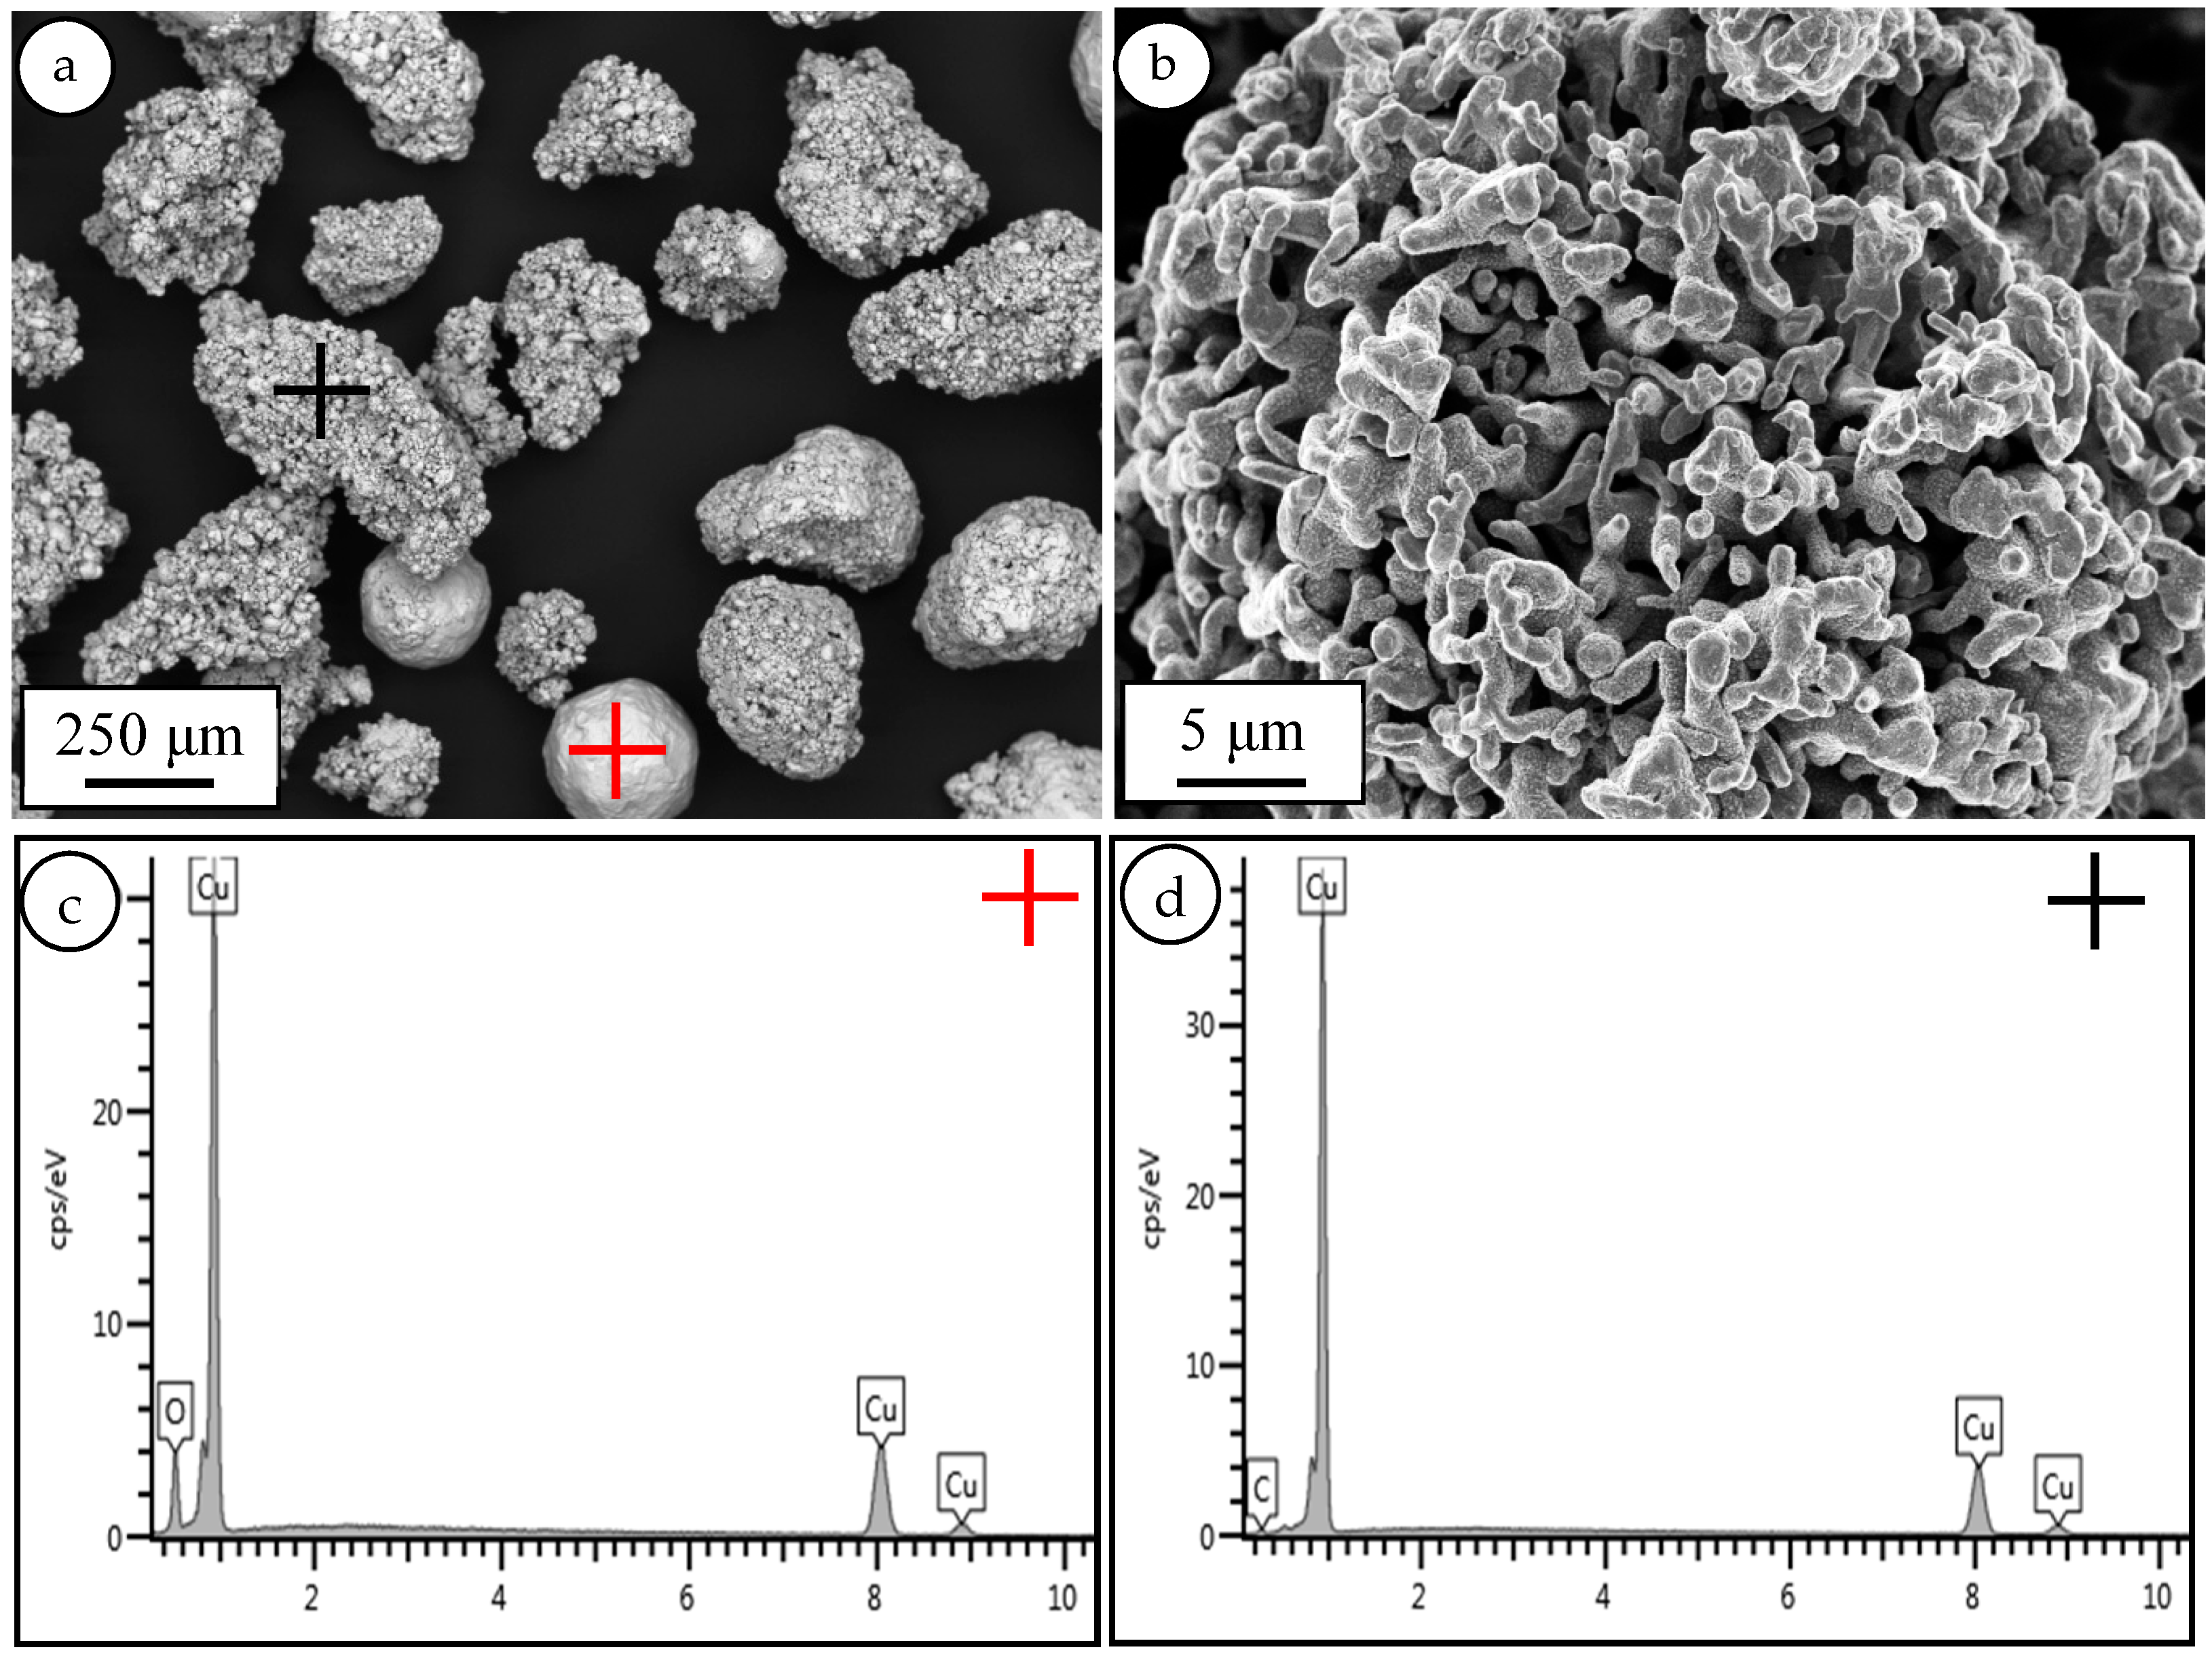
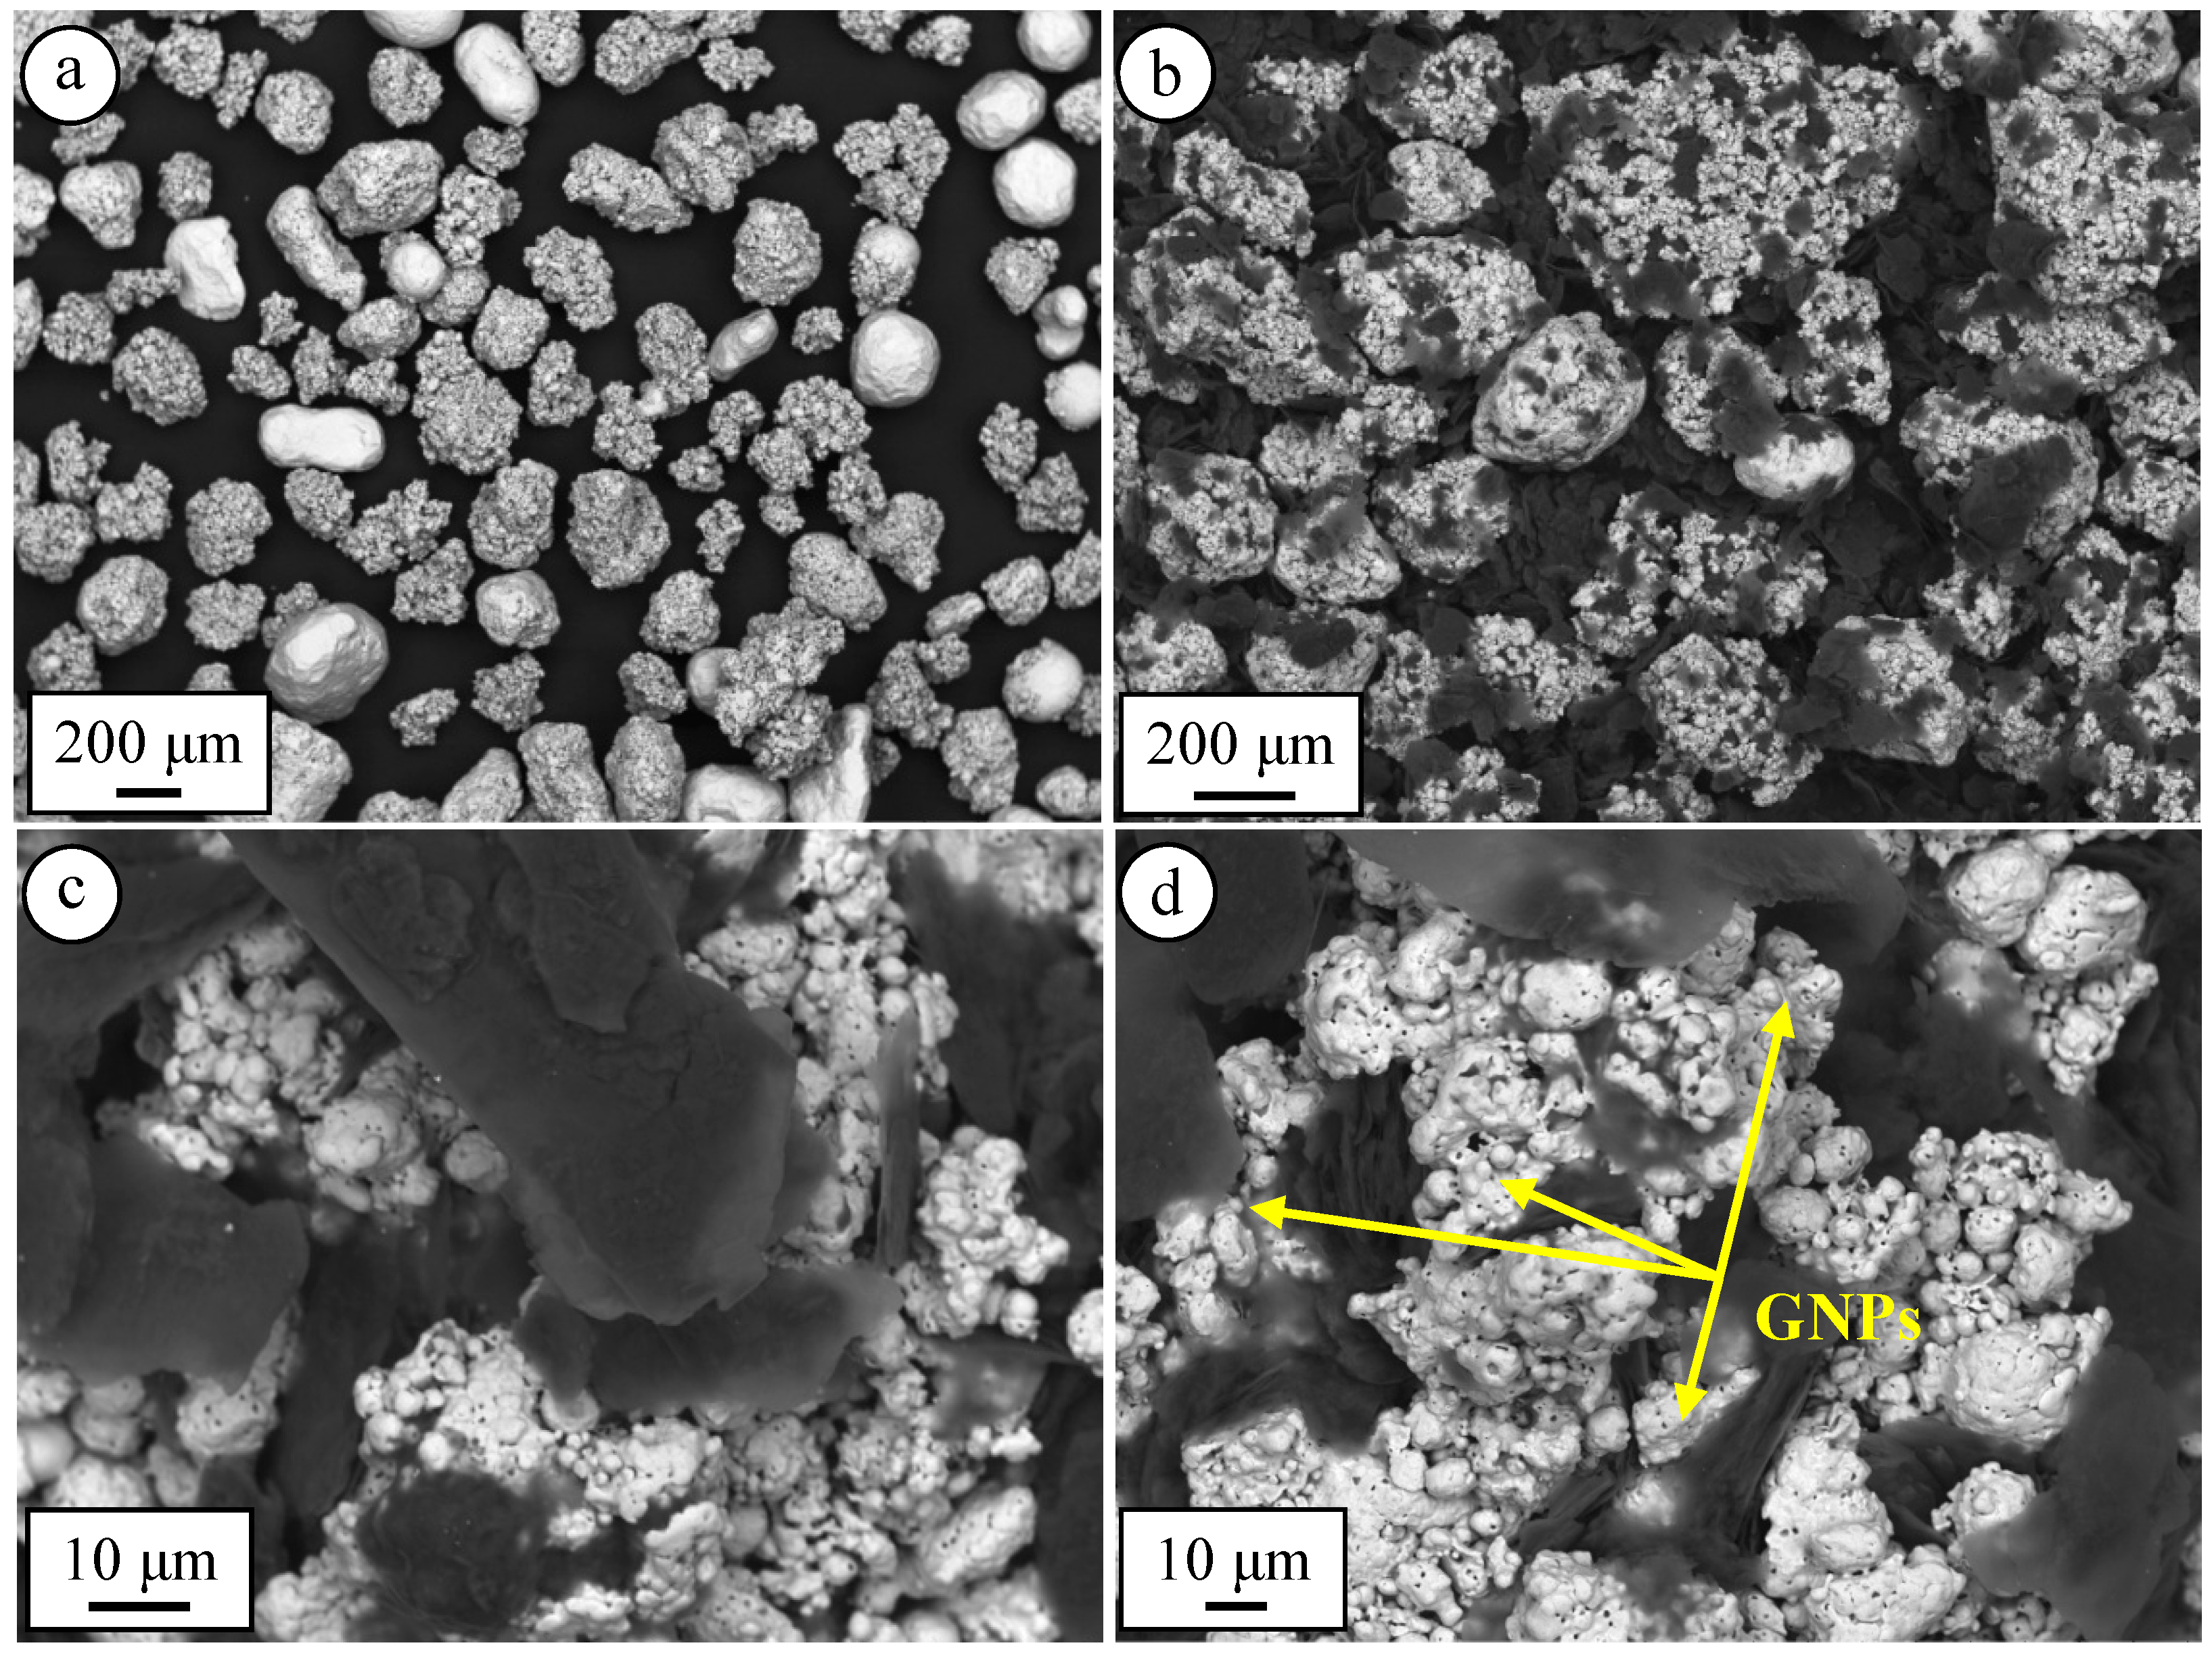
- Copper (Cu) powder, with 150–240 μm size and 99.5% purity (Figure 1a). This powder has an irregular morphology with a porous surface (spongy structure) and was supplied by Alfa Aesar, Ward Hill, MA, USA.
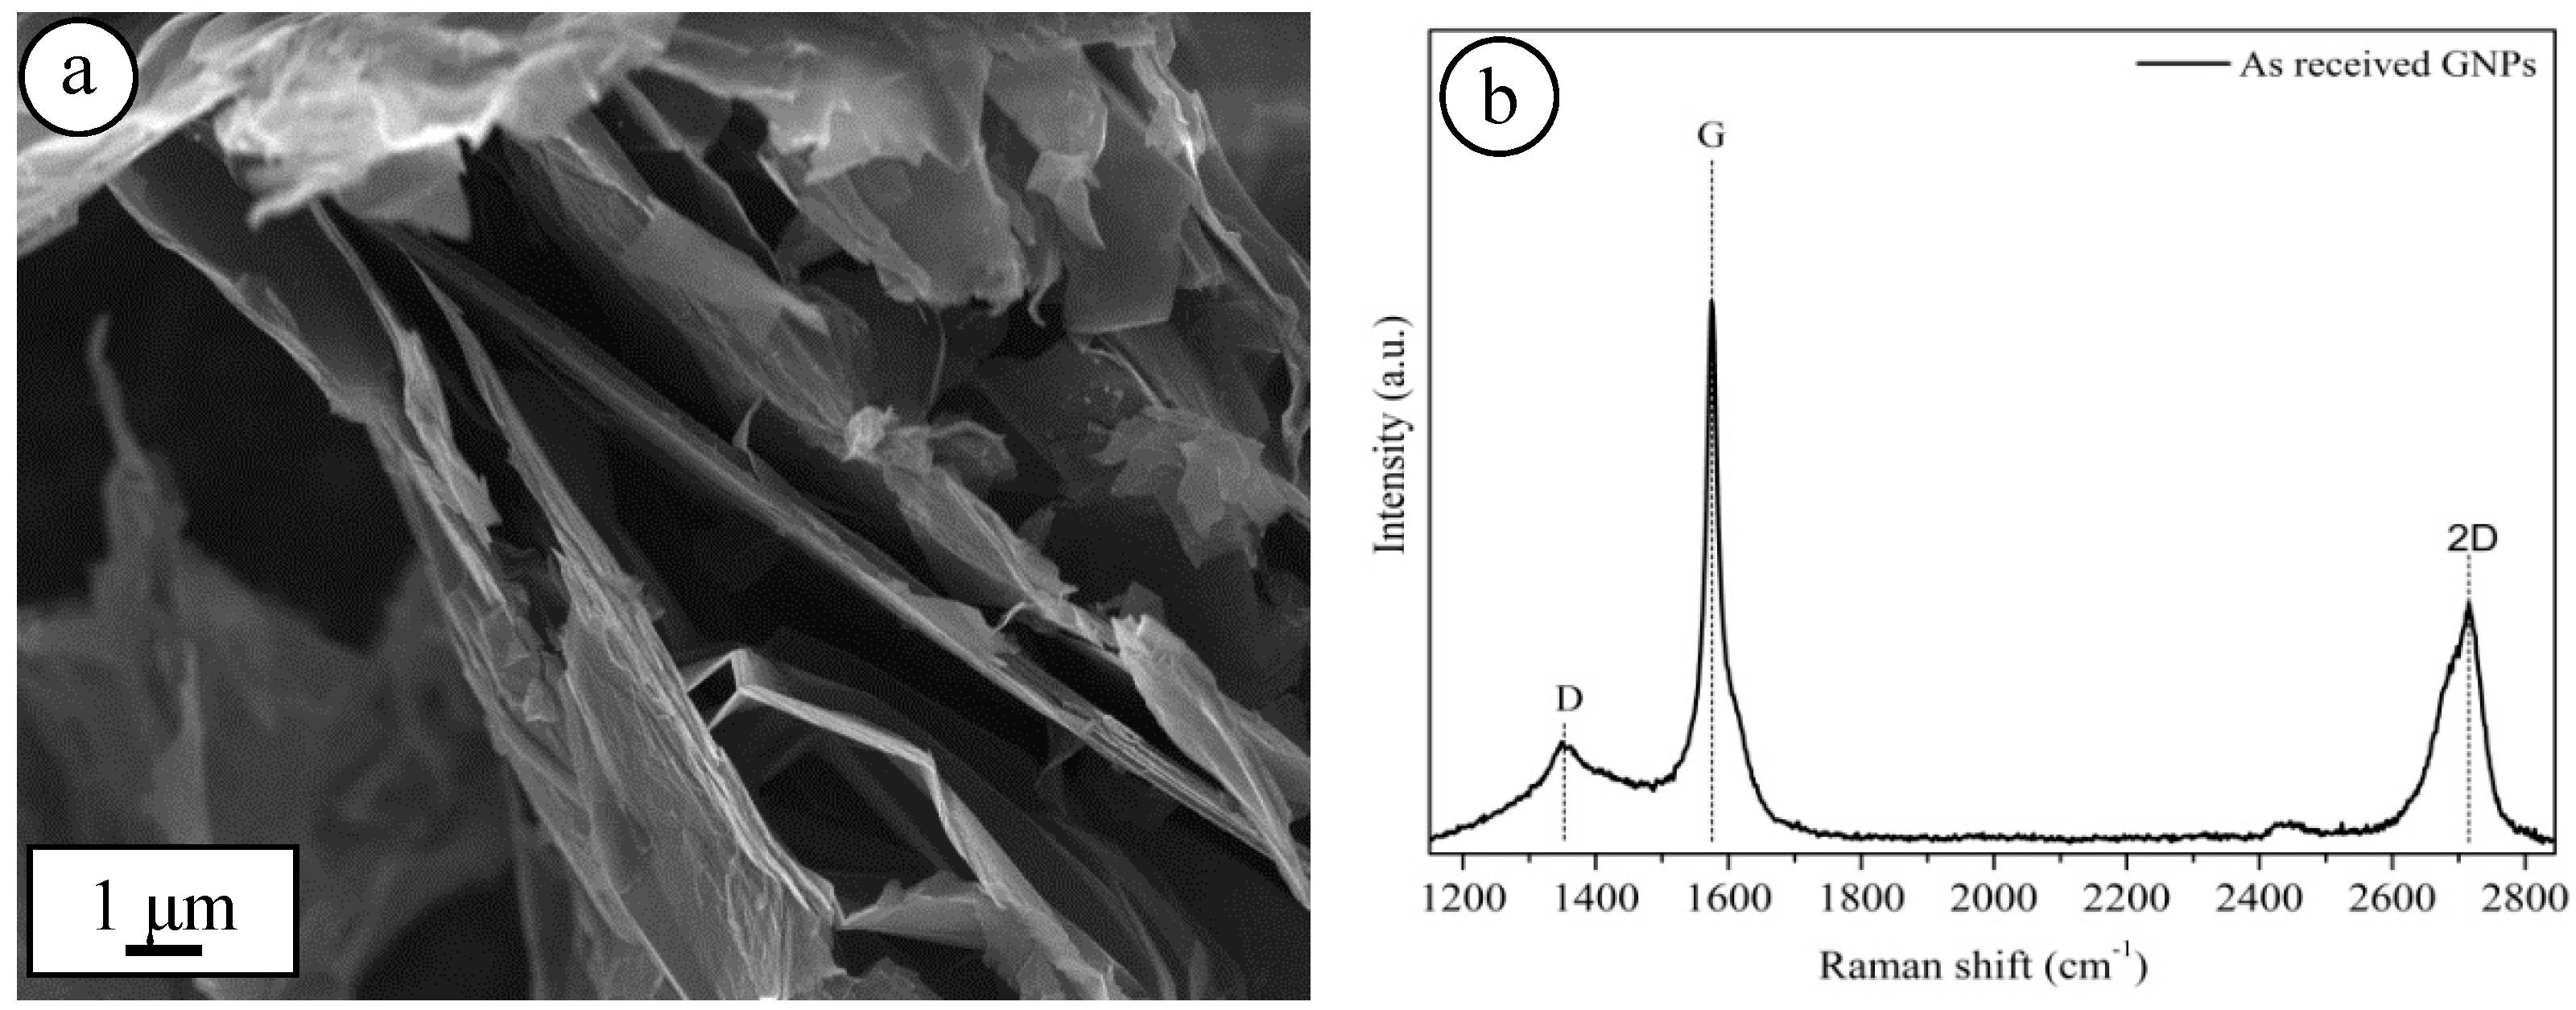
- Graphene nanoplatelets (GNPs) with 99% purity, ~100 nm thickness, 25 μm width, and surface area of 700 m2/g, supplied by abcr GmbH, Karlsruhe, Germany (Figure 1b).
2.2. Mixing
2.2.1. Ball Milling
2.2.2. Wet Mixing
2.3. Consolidation and Sintering
2.4. Characterization
3. Results and Discussion
4. Conclusions
Author Contributions
Conflicts of Interest
References
- Macke, A.; Schultz, B.F. Metal matrix composites offer the automotive industry and opportunity to reduce vehicle weight, improve performance. Adv. Mater. Process. 2012, 170, 19–23. [Google Scholar]
- Deng, C.F.; Ma, Y.X.; Zhang, P.; Zhang, X.X.; Wang, D.Z. Thermal expansion behaviors of aluminum composite reinforced with carbon nanotubes. Mater. Lett. 2008, 62, 2301–2303. [Google Scholar] [CrossRef]
- Chen, Y.; Zhang, X.; Liu, E.; He, C.; Han, Y.; Li, Q.; Nash, P.; Zhao, N. Fabrication of three-dimensional graphene/Cu composite by in-situ CVD and its strengthening mechanism. J. Alloys Compd. 2016, 688, 69–76. [Google Scholar] [CrossRef]
- Saboori, A.; Pavese, M.; Badini, C.; Fino, P. A Novel approach to enhance the mechanical strength and electrical and thermal conductivity of Cu-GNP nanocomposites. Metall. Mater. Trans. A 2017, 1–13. [Google Scholar] [CrossRef]
- Du, H.; Lu, D.; Qi, J.; Shen, Y.; Yin, L.; Wang, Y.; Zheng, Z.; Xiong, T. Heat dissipation performance of porous copper with elongated cylindrical pores. J. Mater. Sci. Technol. 2014, 30, 934–938. [Google Scholar] [CrossRef]
- Memis, I. Electronic Packaging Materials: Properties and Selection. In Reference Module in Materials Science and Materials Engineering; Elsevier B.V.: Amesterdam, The Netherlands, 2016; ISBN 978-0-12-803581-8. [Google Scholar]
- Huang, D.-S.; Tu, W.-B.; Zhang, X.-M.; Tsai, L.-T.; Wu, T.-Y.; Lin, M.-T. Using Taguchi method to obtain the optimal design of heat dissipation mechanism for electronic component packaging. Microelectron. Reliab. 2016, 65, 131–141. [Google Scholar] [CrossRef]
- Kováčik, J.; Emmer, Š. Thermal expansion of Cu/graphite composites: Effect of copper coating. Kov. Mater. 2011, 49, 411–416. [Google Scholar]
- Kutz, M. (Ed.) Materials in Electronic Packaging. In Hand Book of Materials Selection; John Wiley & sons Inc.: New York, NY, USA, 2002. [Google Scholar]
- Chen, B.; Bi, Q.; Yang, J.; Xia, Y.; Hao, J. Tribology international tribological properties of solid lubricants (graphite, h-BN) for Cu-based P/M friction composites. Tribol. Int. 2008, 41, 1145–1152. [Google Scholar] [CrossRef]
- Hanada, K.; Matsuzaki, K.; Sano, T. Thermal properties of diamond particle-dispersed Cu composites. J. Mater. Process. Technol. 2004, 153–154, 514–518. [Google Scholar] [CrossRef]
- Davis, J.R. Powder Metallurgy: Copper and Copper Alloys. ASM Specialty Handbook; ASM International: Geauga County, OH, USA, 2001; ISBN 0-87170-726-8. [Google Scholar]
- Caron, R.N. Copper Alloys: Properties and Applications, 2nd ed.; Elsevier B.V.: Amesterdam, The Netherlands, 2001. [Google Scholar]
- Kundig, K.J.A.; Cowie, J.G. Mechanical Engineers’ Handbook: Materials and Mechanical Design, 3rd ed.; Kutz, M., Ed.; John Wiley & Sons, Inc.: New York, NY, USA, 2006; ISBN 9780471449904. [Google Scholar]
- Rashad, M.; Pan, F.; Asif, M.; Tang, A. Powder metallurgy of Mg–1%Al–1%Sn alloy reinforced with low content of graphene nanoplatelets (GNPs). J. Ind. Eng. Chem. 2014, 20, 4250–4255. [Google Scholar] [CrossRef]
- Liu, L.; Qing, M.; Wang, Y.; Chen, S. Defects in graphene: Generation, healing, and their effects on the properties of graphene: A review. J. Mater. Sci. Technol. 2015, 31, 599–606. [Google Scholar] [CrossRef]
- Van Chuc, N.; Thanh, C.T.; Van Tu, N.; Phuong, V.T.Q.; Thang, P.V.; Thi, N.; Tam, T. A simple approach to the fabrication of graphene-carbon nanotube hybrid films on copper substrate by chemical vapor deposition. J. Mater. Sci. Technol. 2015, 31, 479–483. [Google Scholar] [CrossRef]
- Saboori, A.; Pavese, M.; Badini, C.; Fino, P. Microstructure and thermal conductivity of Al-Graphene composites fabricated by powder metallurgy and hot rolling techniques. Acta Metall. Sin. (Engl. Lett.) 2017, 30, 675–687. [Google Scholar] [CrossRef]
- Rashad, M.; Pan, F.; Tang, A.; Asif, M.; Hussain, S.; Gou, J.; Mao, J. Improved strength and ductility of magnesium with addition of aluminum and graphene nanoplatelets (Al + GNPs) using semi powder metallurgy method. J. Ind. Eng. Chem. 2015, 23, 243–250. [Google Scholar] [CrossRef]
- Saboori, A.; Novara, C.; Pavese, M.; Badini, C.; Giorgis, F.; Fino, P. An investigation on the sinterability and the compaction behavior of aluminum/graphene nanoplatelets (GNPs) prepared by powder metallurgy. J. Mater. Eng. Perform. 2017, 26, 993–999. [Google Scholar] [CrossRef]
- Ferrari, A.C.; Robertson, J. Resonant Raman spectroscopy of disordered, amorphous, and diamondlike carbon. Phys. Rev. B 2001, 64, 075414. [Google Scholar] [CrossRef]
- Mohiuddin, T.M.G.; Lombardo, A.; Nair, R.R.; Bonetti, A.; Savini, G.; Jalil, R.; Bonini, N.; Basko, D.M.; Galiotis, C.; Marzari, N.; et al. Uniaxial strain in graphene by Raman spectroscopy: G peak splitting, Grüneisen parameters, and sample orientation. Phys. Rev. B 2009, 79, 205433. [Google Scholar] [CrossRef]
- Perez-Bustamante, R.; Bolanos-Morales, D.; Bonilla-Maetinez, J.; Estrada-Guel, I. Microstructural and hardness behavior of graphene-nanoplatelets/aluminum composites synthesized by mechanical alloying. J. Alloys Compd. 2014, 615, S578–S582. [Google Scholar] [CrossRef]
- Pérez-Bustamante, R.; Gómez-Esparza, C.D.; Estrada-Guel, I.; Miki-Yoshida, M.; Licea-Jiménez, L.; Pérez-García, S.A.; Martínez-Sánchez, R. Microstructural and mechanical characterization of Al–MWCNT composites produced by mechanical milling. Mater. Sci. Eng. A 2009, 502, 159–163. [Google Scholar] [CrossRef]
- Tabandeh-khorshid, M.; Ferguson, J.B.; Schultz, B.F.; Kim, C.; Cho, K.; Rohatgi, P.K. Strengthening mechanisms of graphene- and Al2O3-reinforced aluminum nanocomposites synthesized by room temperature milling. Mater. Des. 2016, 92, 79–87. [Google Scholar] [CrossRef]
- Chu, K.; Jia, C.C. Enhanced strength in bulk graphene-copper composite. Phys. Status Solidi A 2014, 211, 184–190. [Google Scholar] [CrossRef]
- Levy-Tubiana, R.; Baczmanski, A.; Lodini, A. Relaxation of thermal mismatch stress due to plastic deformation in an Al/SiCp metal matrix composite. Mater. Sci. Eng. A 2003, 341, 74–86. [Google Scholar] [CrossRef]
- Qian, L.H.; Wang, S.C.; Zhao, Y.H.; Lu, K. Microstrain effect on thermal properties of nanocrystalline Cu. Acta Mater. 2002, 50, 3425–3434. [Google Scholar] [CrossRef]
- Kassner, M.E.; Hayes, T.A. Creep cavitation in metals. Int. J. Plast. 2003, 19, 1715–1748. [Google Scholar] [CrossRef]
- Weidenmann, K.; Tavangar, R.; Weber, L. Mechanical behaviour of diamond reinforced metals. Mater. Sci. Eng. A 2009, 523, 226–234. [Google Scholar] [CrossRef]
- Wang, X.; Li, J.; Wang, Y. Improved high temperature strength of copper-graphene composite material. Mater. Lett. 2016, 181, 309–312. [Google Scholar] [CrossRef]
- Hale, D.K. The physical properties of composite materials. J. Mater. Sci. 1976, 11, 2105–2141. [Google Scholar] [CrossRef]
- Turner, P.S. Thermal-expansion stresses in reinforced plastics. J. Res. Natl. Bur. Stand. 1946, 37, 239–250. [Google Scholar] [CrossRef]
- Hashin, Z.; Shtrikman, S. A variational approach to the theory of the elastic behaviour of multiphase materials. J. Mech. Phys. Solids 1963, 11, 127–150. [Google Scholar] [CrossRef]
- Schapery, R.A. Thermal expansion coefficients of composite materials based on energy principles. J. Compos. Mater. 1968, 2, 380–404. [Google Scholar] [CrossRef]
- Saboori, A.; Pavese, M.; Badini, C.; Fino, P. Development of Al- and Cu-based nanocomposites reinforced by graphene nanoplatelets: Fabrication and characterization. Front. Mater. Sci. 2017, 11, 171–181. [Google Scholar] [CrossRef]
- Lee, C.; Wei, X.; Kysar, J.W.; Hone, J. Measurement of the elastic properties and intrinsic strength of monolayer graphene. Science 2008, 321, 385–388. [Google Scholar] [CrossRef] [PubMed]
- Chen, B.; Li, S.; Imai, H.; Jia, L.; Umeda, J.; Takahashi, M.; Kondoh, K. Carbon nanotube induced microstructural characteristics in powder metallurgy Al matrix composites and their effects on mechanical and conductive properties. J. Alloys Compd. 2015, 651, 608–615. [Google Scholar] [CrossRef]
- Chen, B.; Jia, L.; Li, S.; Imai, H.; Takahashi, M.; Kondoh, K. In situ synthesized Al4C3 nanorods with excellent strengthening effect in aluminum matrix composites. Adv. Eng. Mater. 2014, 16, 972–975. [Google Scholar] [CrossRef]
- Tong, X.C. Electronic Packaging Materials and Their Functions in Thermal Managements. In Advanced Materials for Thermal Management of Electronic Packaging; Springer: New York, NY, USA, 2011; pp. 131–167. ISBN 978-1-4419-7759-5. [Google Scholar]
- Wilson, J. Thermal Conductivity of Common Alloys in Electronics Packaging; Electronics Cooling: Montgomery County, PA, USA, 2007. [Google Scholar]


| Composition | Ball Milled | Wet Mixed | ||
|---|---|---|---|---|
| ID/IG | I2D/IG | ID/IG | I2D/IG | |
| As-received GNPs | 0.112 | 0.511 | 0.112 | 0.511 |
| Cu–8 vol % GNPs | 0.893 | 0.584 | 0.127 | 0.525 |
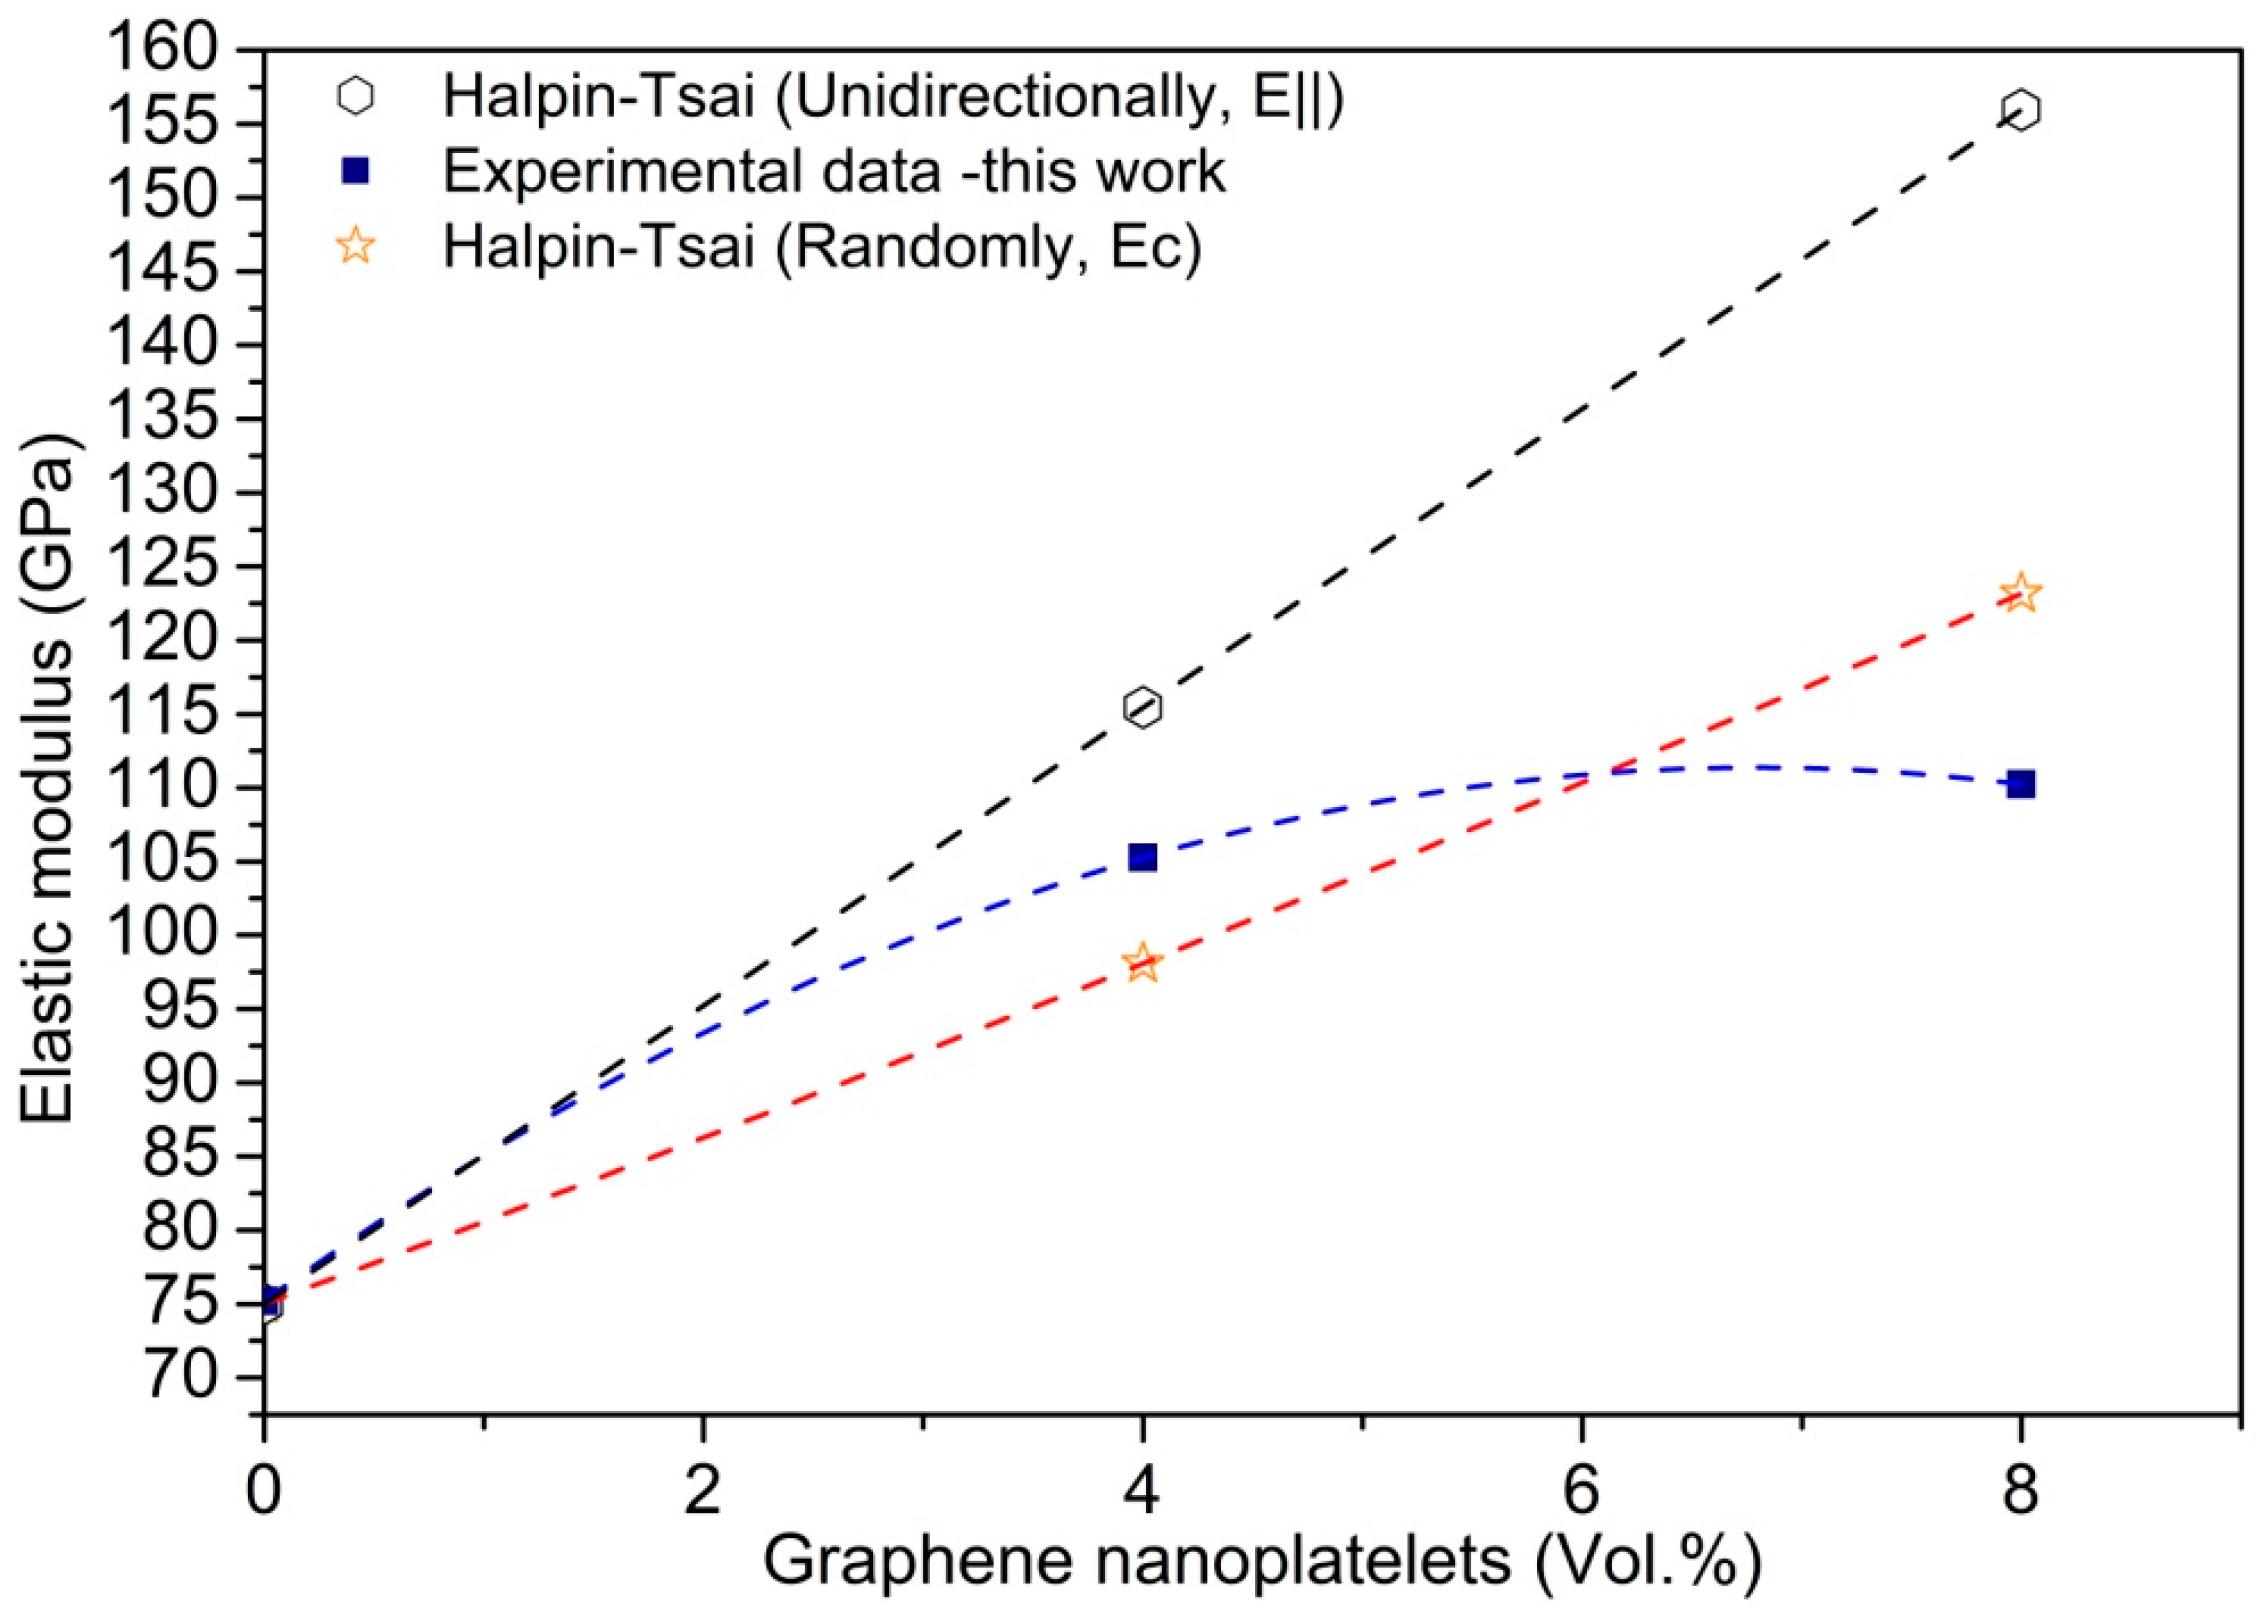
| αi (10−6 K−1) | αo (10−6 K−1) | Ei (GPa) | Eo (GPa) | ECu (GPa) | αCu (10−6 K−1) |
|---|---|---|---|---|---|
| −1 | 26 | 1000 | 20 | 75 | 17.1 |
| Metals and Alloys | Thermal Conductivity at 0–100 °C (W/m·K) | Electrical Resistivity at 20 °C (Ω m × 108) | Thermal Expansion (1/k × 106) | Density at 20 °C (g/cm3) | Reference |
|---|---|---|---|---|---|
| Aluminium (Al) | 238 | 2.8 | 23.5 | 2.7 | [9] |
| Cu–Ni–Sn | 50 | 14 | 17.1 | 8.88 | [9] |
| Copper (Cu) | 393 | 1.7 | 17 | 8.9 | [40] |
| Red Brass (15% Zn) | 151 | 4.66 | 18.7 | 8.8 | [40] |
| CuW | 180–220 | -- | 7–9 | >9 | [40] |
| CuMo | 160–185 | -- | 7–9 | 9 | [41] |
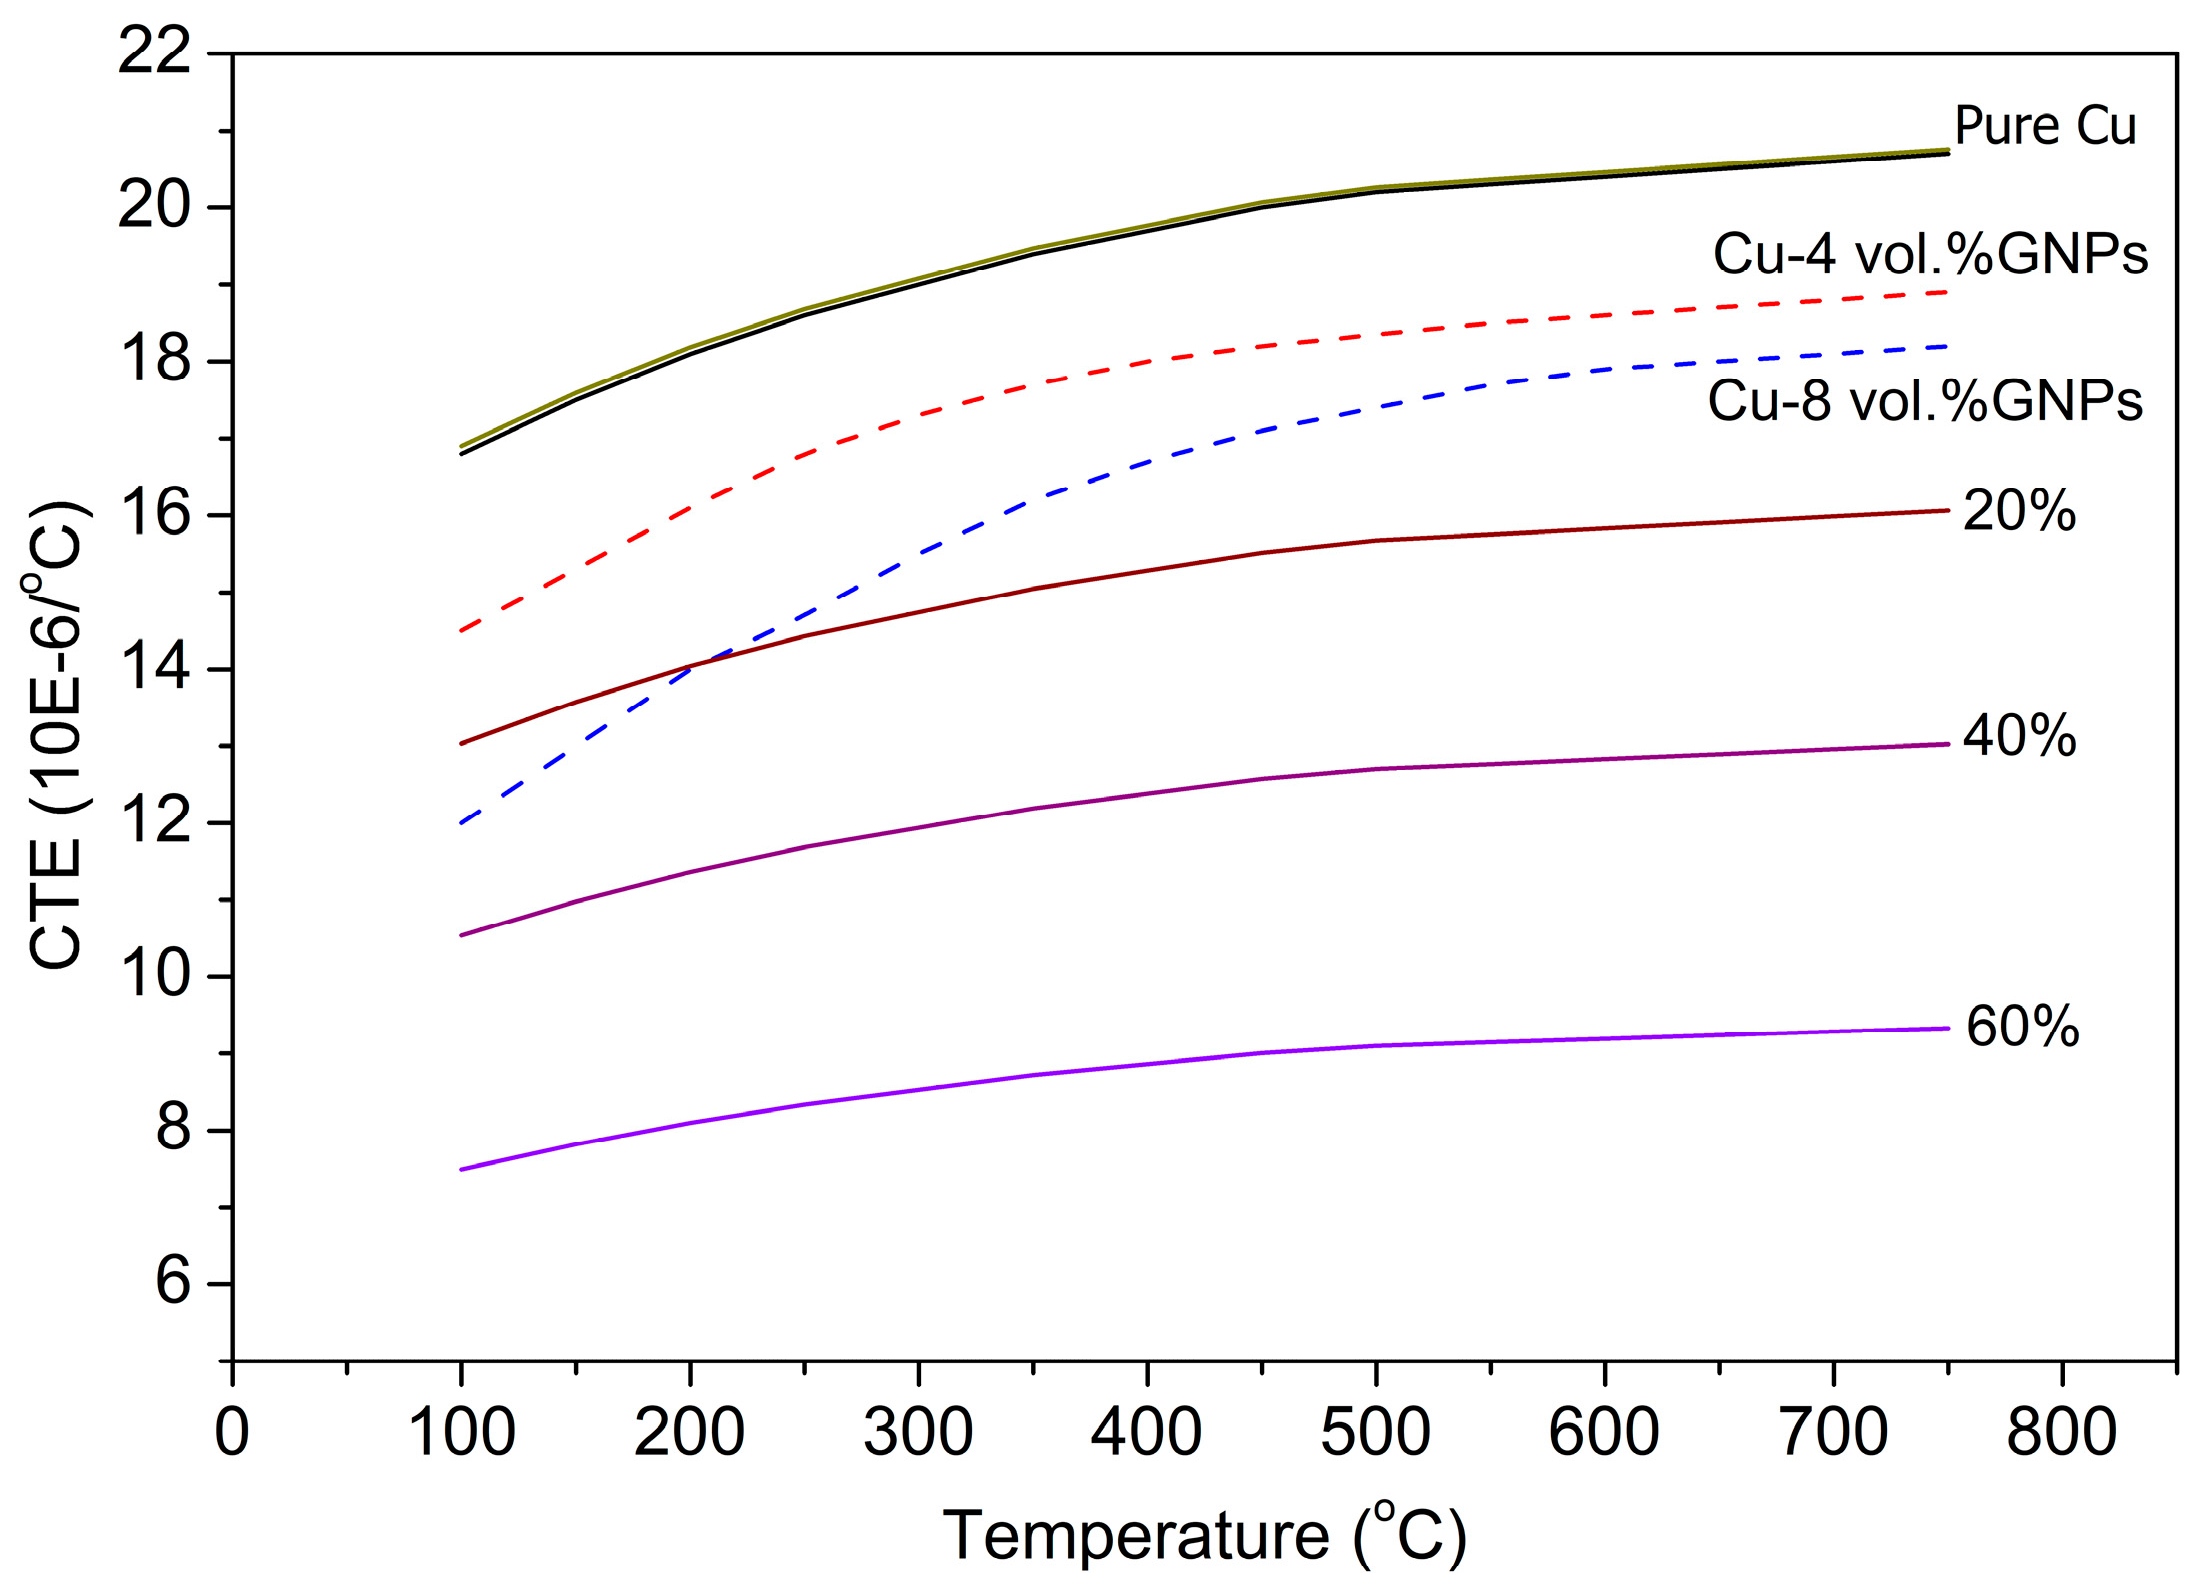
| Copper (Cu) | 350 | 1.45 | 18 | 8.9 | Current work |
| Cu–4 vol % GNPs | 304 | 1.49 | 14 | 8.7 | Current work |
| Cu–8 vol % GNPs | 262 | 1.55 | 12 | 8.3 | Current work |
© 2017 by the authors. Licensee MDPI, Basel, Switzerland. This article is an open access article distributed under the terms and conditions of the Creative Commons Attribution (CC BY) license (http://creativecommons.org/licenses/by/4.0/).
Share and Cite
Saboori, A.; Moheimani, S.K.; Pavese, M.; Badini, C.; Fino, P. New Nanocomposite Materials with Improved Mechanical Strength and Tailored Coefficient of Thermal Expansion for Electro-Packaging Applications. Metals 2017, 7, 536. https://doi.org/10.3390/met7120536
Saboori A, Moheimani SK, Pavese M, Badini C, Fino P. New Nanocomposite Materials with Improved Mechanical Strength and Tailored Coefficient of Thermal Expansion for Electro-Packaging Applications. Metals. 2017; 7(12):536. https://doi.org/10.3390/met7120536
Chicago/Turabian StyleSaboori, Abdollah, Seyed Kiomars Moheimani, Matteo Pavese, Claudio Badini, and Paolo Fino. 2017. "New Nanocomposite Materials with Improved Mechanical Strength and Tailored Coefficient of Thermal Expansion for Electro-Packaging Applications" Metals 7, no. 12: 536. https://doi.org/10.3390/met7120536
APA StyleSaboori, A., Moheimani, S. K., Pavese, M., Badini, C., & Fino, P. (2017). New Nanocomposite Materials with Improved Mechanical Strength and Tailored Coefficient of Thermal Expansion for Electro-Packaging Applications. Metals, 7(12), 536. https://doi.org/10.3390/met7120536