Article

Very High Cycle Fatigue of Butt-Welded High-Strength Steel Plate

Department of Mechanical Engineering, Ajou University, 206 Worldcup-ro, Yeongtong-gu, Suwon, 16499, Korea
*
Author to whom correspondence should be addressed.
Metals 2017, 7(3), 103; https://doi.org/10.3390/met7030103
Submission received: 2 January 2017 / Revised: 2 March 2017 / Accepted: 6 March 2017 / Published: 21 March 2017
(This article belongs to the Special Issue Fatigue Damage)

Abstract

:
Welded parts fabricated from high-strength steel (HSS) require an almost infinite lifetime, i.e., a gigacycle (109). Therefore, it is necessary to test its high-cycle fatigue behavior. In this paper, an accelerated fatigue test method using ultrasonic resonance is proposed. This method reduces the experimental time required in comparison with a conventional fatigue test setup. The operating principle of the accelerated ultrasonic fatigue test involved the use of a 20-kHz resonant frequency. Therefore, it was necessary to design a specimen specifically for the test setup. In the study, ultrasonic fatigue testing equipment was used to test butt-welded 590- and 780-MPa ferrite–bainite steel plates. In order to design the specimen, a dynamic Young’s modulus was measured using piezoelectric element, a laser Doppler vibrometer, and a digital signal analyzer. The S–N curves of fatigue behavior of the original and butt-welded specimens were compared. The fatigue test results showed that the infinite (i.e., gigacycle) fatigue strengths of the welded specimens were approximately 8% less than those of the original specimen.

1. Introduction

Industrial development has led to increasing demand for parts and elements with a longer service life. Given this trend, the standard value accepted for an infinite service life has increased from 107 to 109 cycles [1]. Previous studies investigated gigacycle fatigue regimes to assess fatigue behavior in applications in the aerospace, space, high-speed rail, automotive, and biomedical industries. These applications involve operation under severe environments and in situations where it is difficult or impossible to replace parts. Previous studies determined that differences exist between fatigue and fracture behaviors according to the test regime. Test regimes are divided into three segments: low cycle (~104), high cycle (~107), and very high cycle (~109) [2,3,4,5].
It is also necessary to increase the test speed to check gigacycle regime fatigue behaviors. Typically, a conventional hydraulic fatigue test machine runs in an approximate range of 2–15 Hz, while rotary bending and electro-force fatigue testers operate in an approximate range of 50–300 Hz. A gigacycle regime was reached in approximately 912 h during a test involving a frequency of 300 Hz. Hence, some researchers used an ultrasonic fatigue tester to expedite experiments [6,7,8].
Figure 1 shows the setup of an ultrasonic fatigue test using a frequency of 20 kHz. Through this setup, a gigacycle test can be completed within a period of only 14 h. Therefore, because of the time saved, this setup is suitable for very-high-cycle testing. In a test, the maximum load was applied at the center of the specimen, and the maximum displacement was observed at the free end. For this ultrasonic fatigue test, the design of the test specimen was critical because it was necessary for the specimen to resonate. Most previous studies were performed with hourglass-type solid cylindrical or plate-shaped test specimens that were manufactured from stainless steel or magnesium alloys [9,10].
In the present study, tests were performed on high-strength steels (590- and 780-MPa ferrite–bainite (FB)) that are used in several industries, and especially in the automotive and ship building industries. There has been previous research on fatigue tests of FB steel used in various fields. When comparing ferrite–martensite (FM) steel to FB steel, it was found that crack initiation was delayed rather than FM steel. However, fatigue test data is available only up to a 105 cycle test regime [11]. In the automotive industry, metal inert gas (MIG)/metal active gas (MAG) welding is mainly used for joining components, such as lower arms and subframes [12,13]. Parts such as lower arms, in which FB steel is mainly used, are subject to repetitive loads. Therefore, it is necessary to consider the fatigue life of the welded parts.
Previous studies showed that welded materials had a shorter fatigue life than raw materials. Additionally, a grounded weld toe sample had a longer fatigue life than a welding bead remain sample. The fatigue test results considered up to 107 cycles [14,15,16]. As indicated above, the currently required fatigue life is up to 109 cycles, and there are no previous studies on this requirement for welded FB steel plates.
While FB steels have only been studied up to high cycle fatigue (HCF), research on other welded steels has been performed up to the very high cycle fatigue (VHCF) regime. The VHCF performance of FV520B-I welded material was characterized by a longer fatigue life because the surface roughness value decreased and the inclusion size was smaller [17]. In addition, the results of the fatigue test of a Cr-Ni-Mo-V steel welded material showed that cracks were formed in the internal nonmetallic inclusions in the VHCF region [18]. EW36 steel welding results showed that the slope of the S–N curve decreased even after 107 cycles, which is considered the conventional fatigue limit. This means that it is necessary to study the VHCF behavior for developing safe designs. In addition, the crack propagation rate was rapid because of the larger internal defects in the welded region compared with the base metal [19]. Fatigue failure was observed up to 109 cycles for weld material of Q345, and the fatigue strength of the fusion zone and heat-affected zone decreased by 60% and 55%, respectively [20].
In this study, welded plate specimens were designed for ultrasonic fatigue tests, and finite element analysis on the free resonant mode was conducted to validate the test specimen design. Additionally, fatigue tests up to the gigacycle regime were performed both on the raw steel plates and on the welded plate specimens because the welded specimens were expected to exhibit different fatigue behaviors.

2. Materials and Methods

2.1. Materials

The selected materials included 2.8-mm-thick, 590-MPa and 780-MPa FB high-strength steel plates. Currently, these materials are commercially applied to the suspension, arms, and wheel disks of automobiles in the automotive industry because ferrite and bainite provide the required high elongation and high stretch-flangeability, respectively [21]. Table 1 summarizes the material compositions. The specimens were prepared using an electric discharge machining (EDM) process.

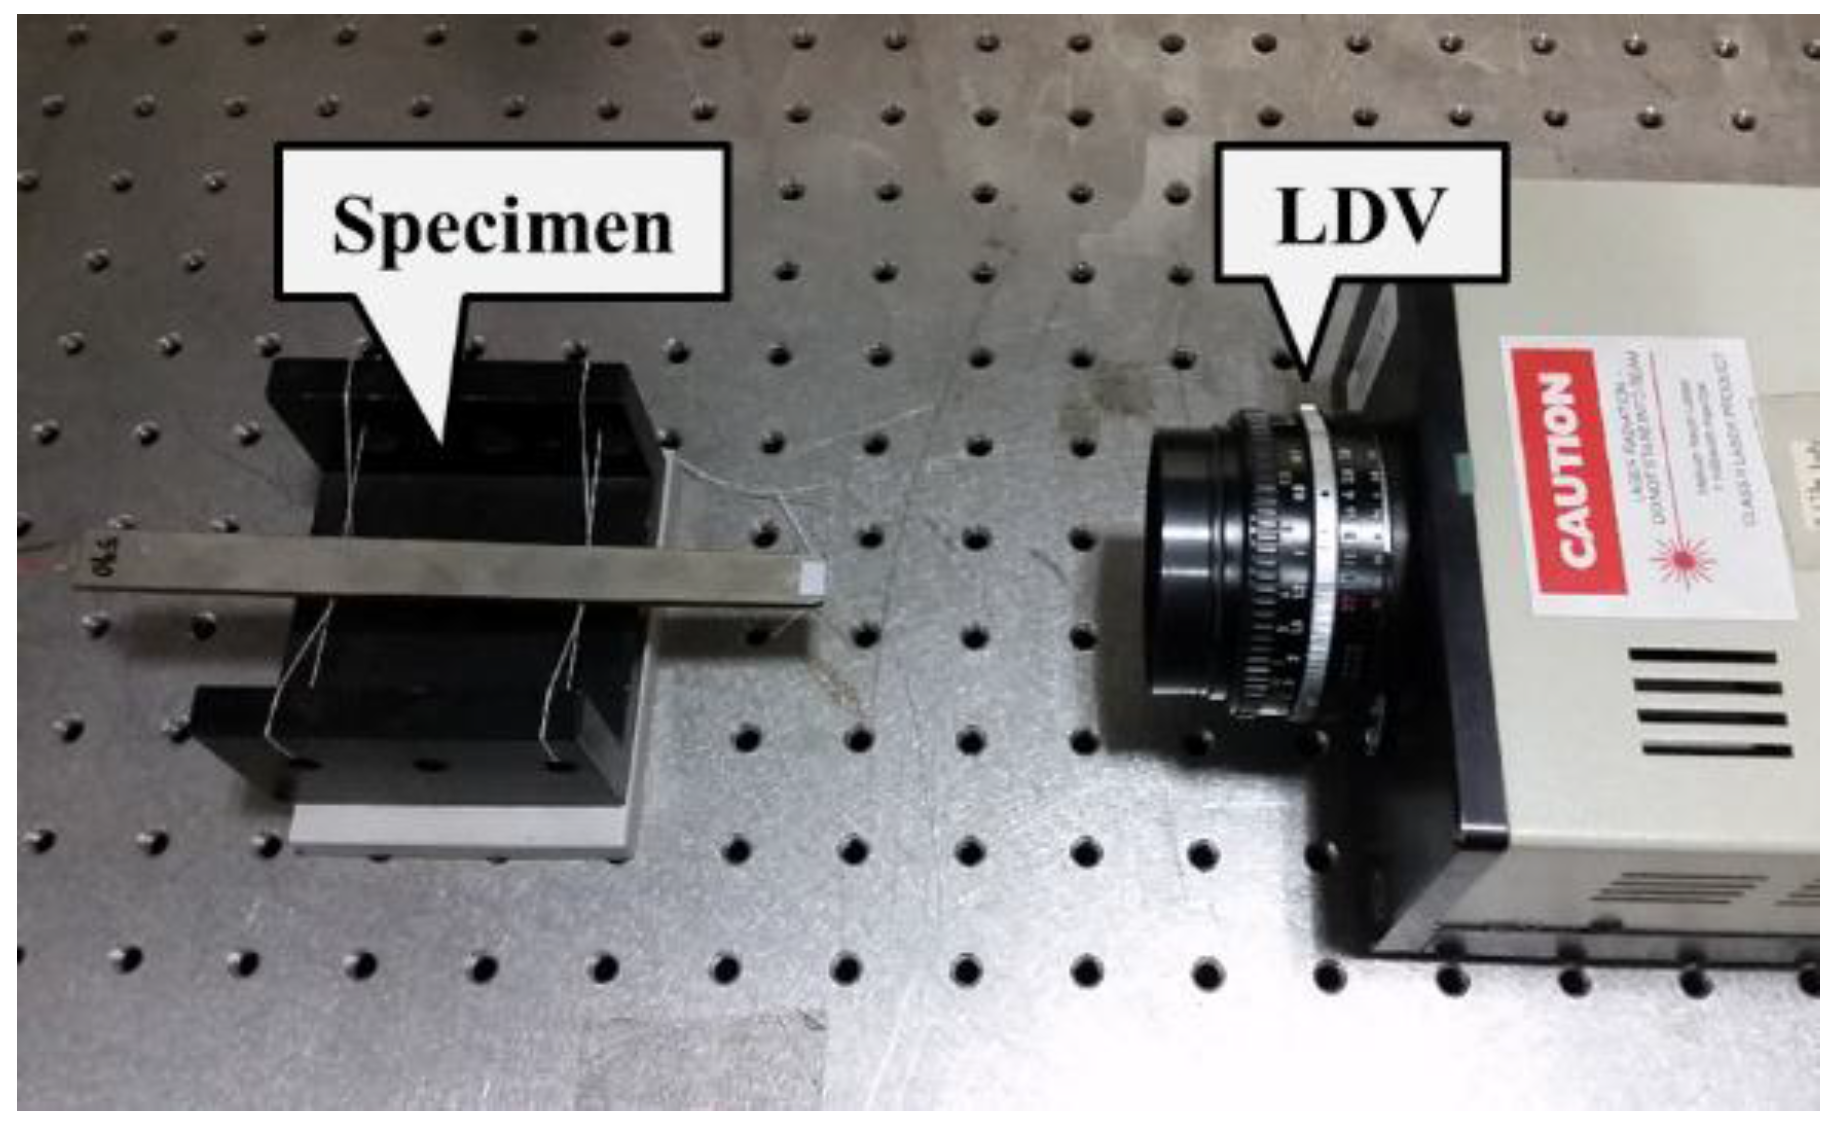
2.2. Dynamic Young’s Modulus

Precise values for the dynamic Young’s modulus of the specimens were required to ensure that the specimens resonated at 20 kHz during the ultrasonic fatigue test. The dynamic Young’s modulus values were also used to calculate the appropriate loads that should be applied during the fatigue tests. Figure 2 shows the experimental set up for measurement. A piezoelectric element (Physik Instrumente(PI) GmbH & Co.KG, Karlsruhe, Germany ), a laser Doppler vibrometer (LDV, OFV-352, Polytec GmbH, Waldbronn , Germany), and a digital signal analyzer (DSA, HP-35670A, Agilent Technologies, Inc., Santa Clara, CA, USA) were used during the experiments, following the steps below:
  • Suspend the bar-shaped original FB steel with a thread for free motion;
  • Place a piezoelectric element at the end of the bar with wax to provide the excitation frequency;
  • Measure the displacement using the LDV on the other side of the piezoelectric element; and
  • Measure the resonant frequency by analyzing the excitation frequency and displacement with the DSA.
The dynamic Young’s modulus (Ed) was calculated using Equation (1). The density (ρ) was determined by mass measurement, and the acoustic velocity (Vc) was calculated using the resonant frequency (fn) and the length of the wave (λ). Table 2 summarizes the calculated results. The calculation is as follows:
E d =   ρ V c 2
Where: V c = f n λ n

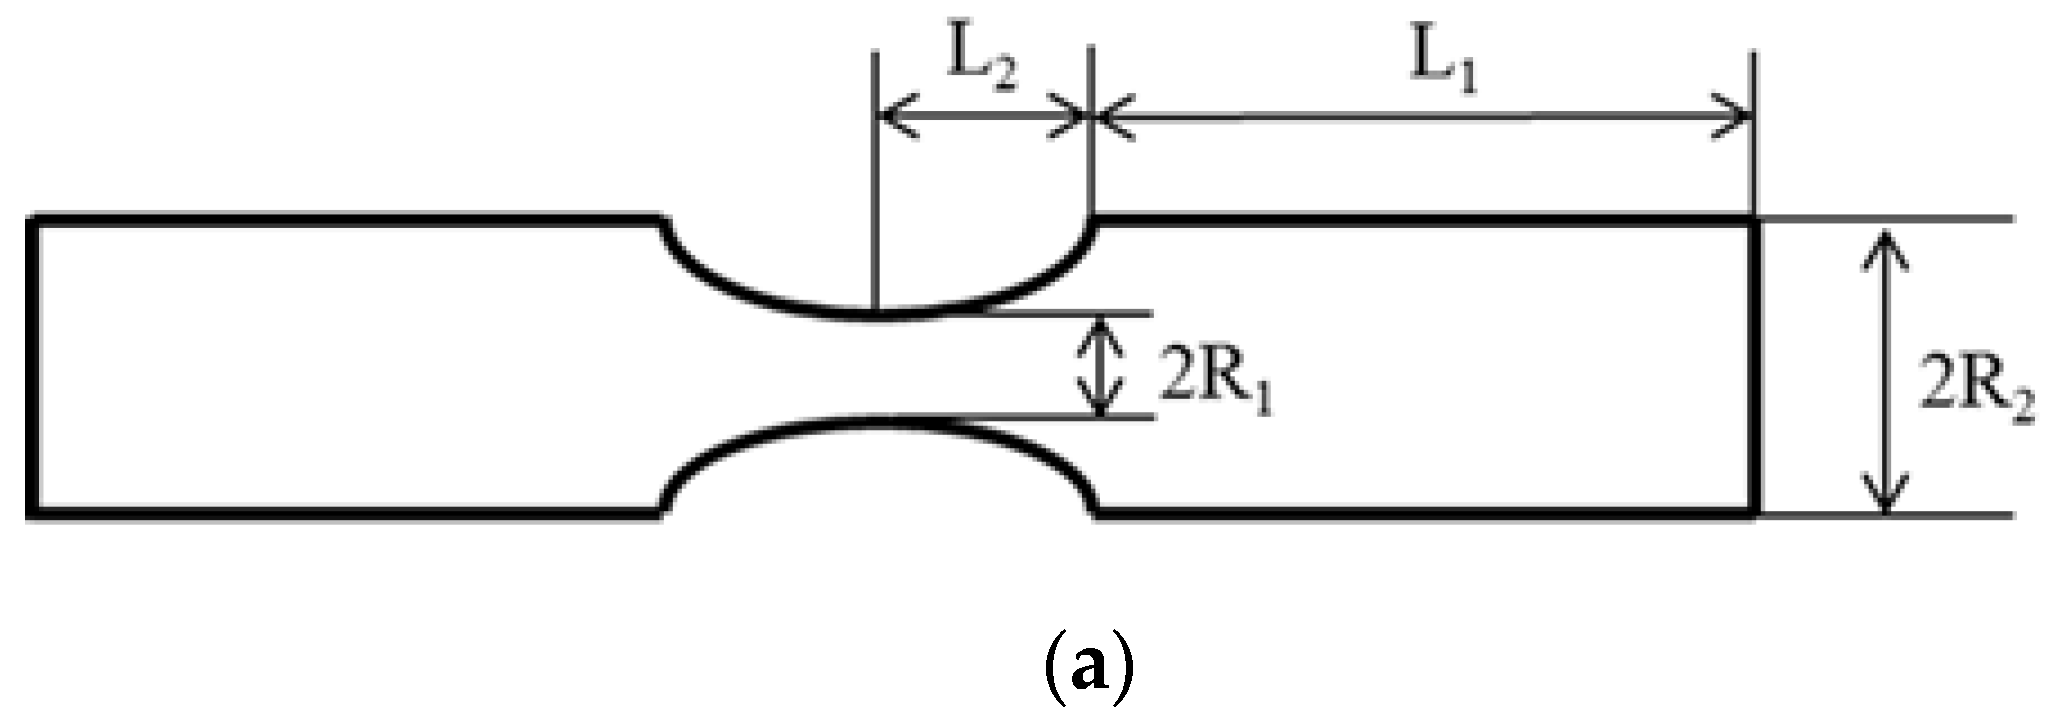
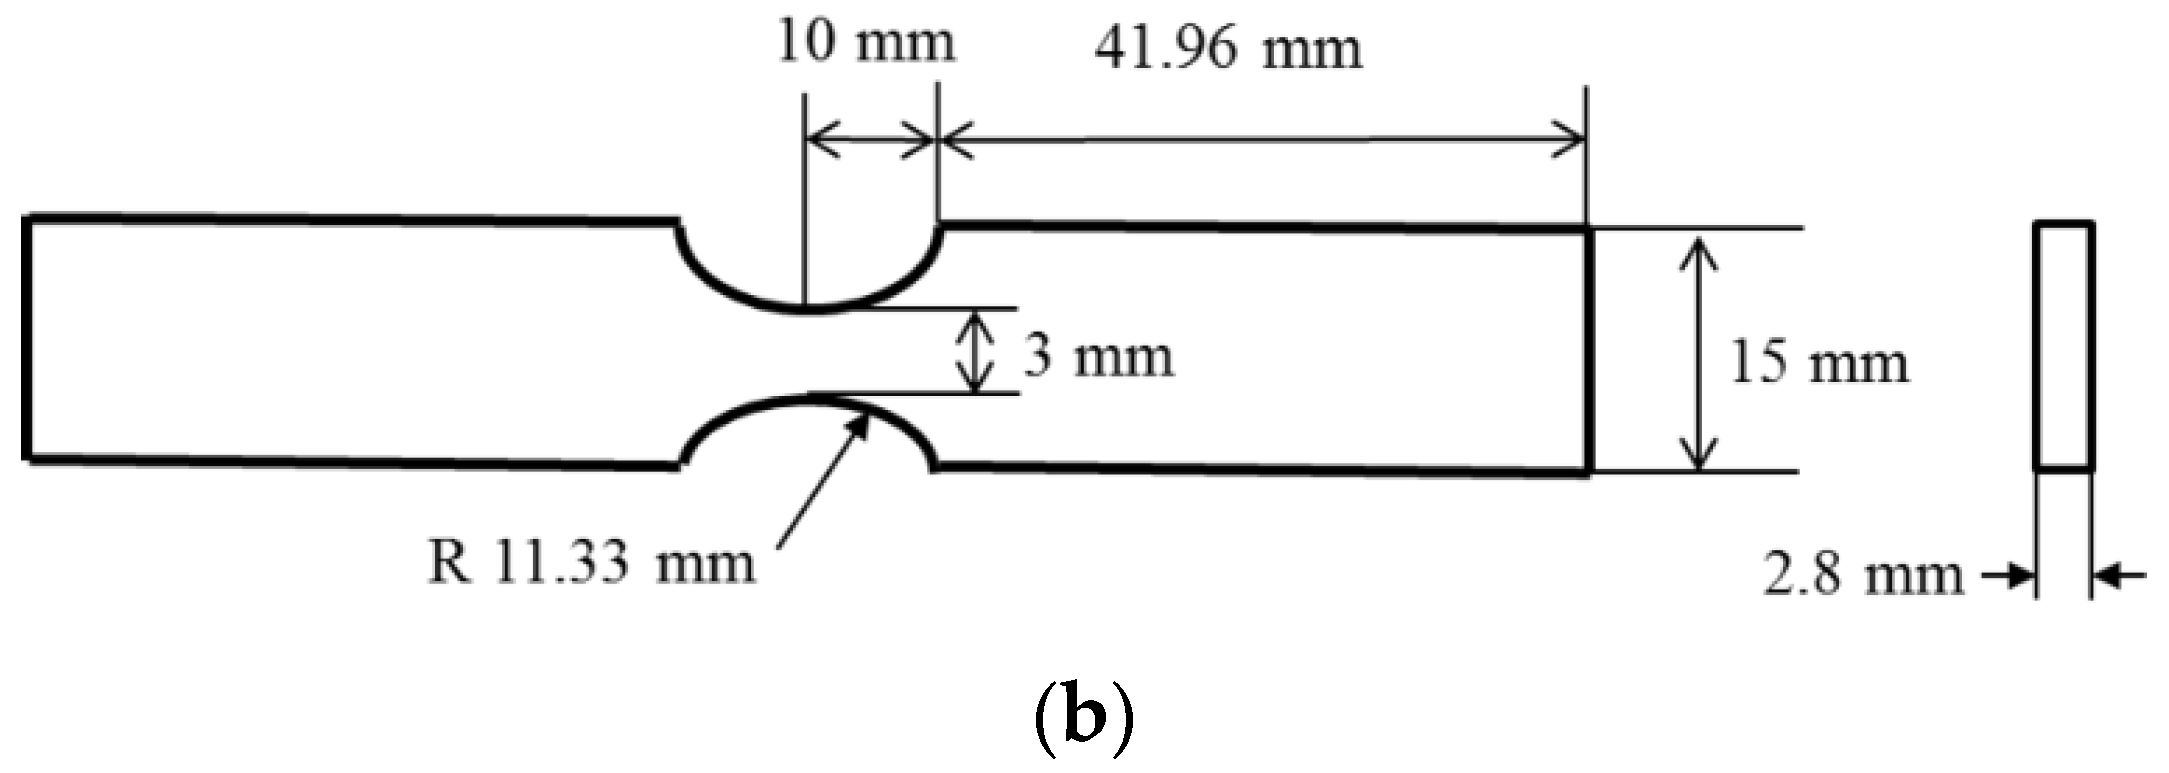
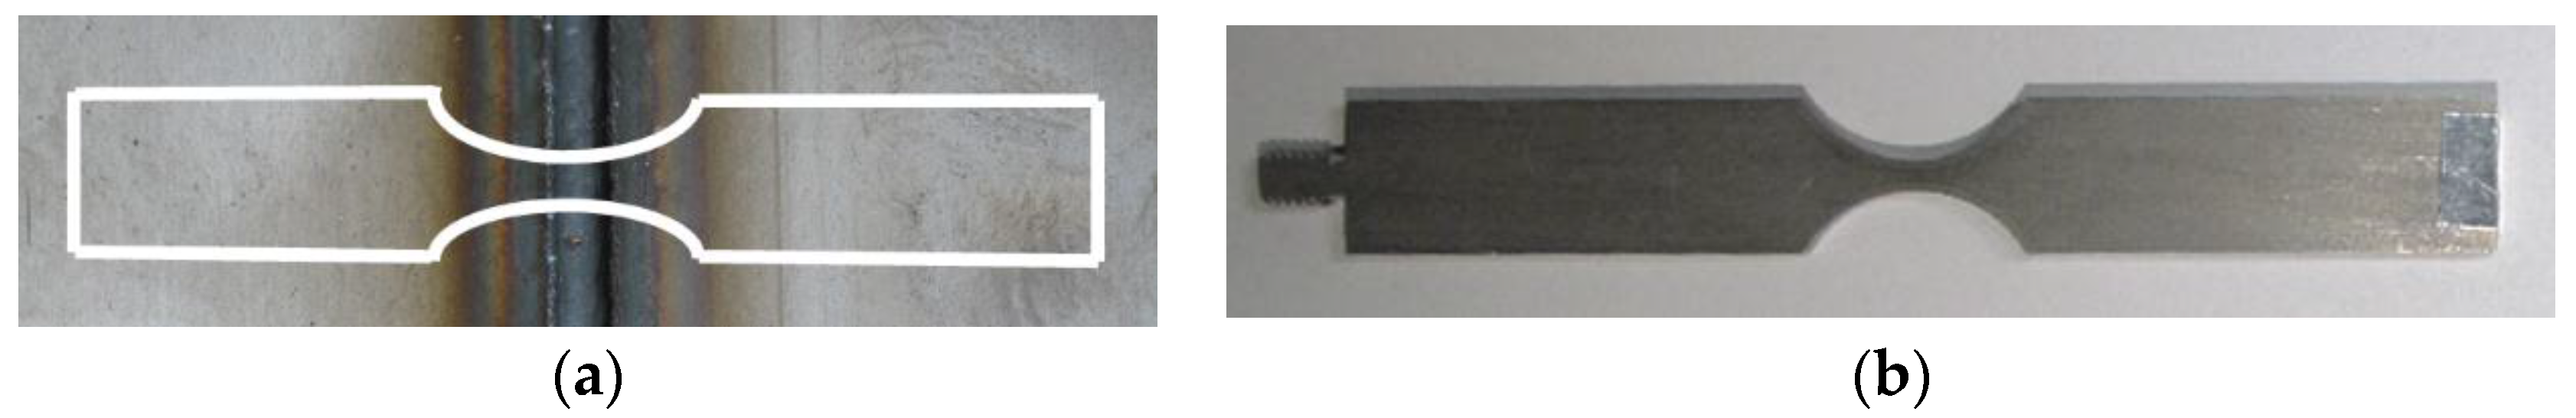
2.3. Design of Plate Specimen

The waves applied to the specimen resulted in the exertion of stress and the occurrence of displacement. The elastic wave theory was used to calculate the displacement and stress [1]. If gravity is neglected, then the wave equation can be simplified to a single equation, as shown in Equation (2). In the equation, u, x, and t represent the rectangular components of displacement, Cartesian coordinates, and time, respectively.
E 2 u x 2 = ρ 2 u t 2
l = 1 2 f E d ρ
ρ S ( x ) 2 u t 2 = f x , f = E d S ( x ) u x
y ( x ) = R 2 , L 2 < | x | L  where , L = L 1 + L 2 , l = 2 L      y ( x ) = R 1 exp ( 2 α x ) ,   | x | L 2      α = 1 2 L 2 ln ( R 2 R 1 ) ,   β = α 2 k 2  where ,   k = π l
The maximum displacements at both ends of the specimen were used as boundary conditions. The length of resonance (l) was calculated based on Equation (2) and is shown in Equation (3). The cross-sectional area S(x) was reduced to ensure that the stress concentration occurred at the center of the specimen. Equation (4) shows the wave equation for the varying cross section. Figure 3a shows a schematic of the specimen. The curve of L2 is set as exponential, and α and β are constants, as shown in Equation (5).
L 1 = 1 k arctan 1 k { β cot h ( β L 2 ) α }
The plate specimen exhibited maximum stress in the middle, and the total length corresponded to the resonance length. Equation (6) shows L1 with differentiable assumptions. Figure 3b shows the designed specimen for the FB steel plate.

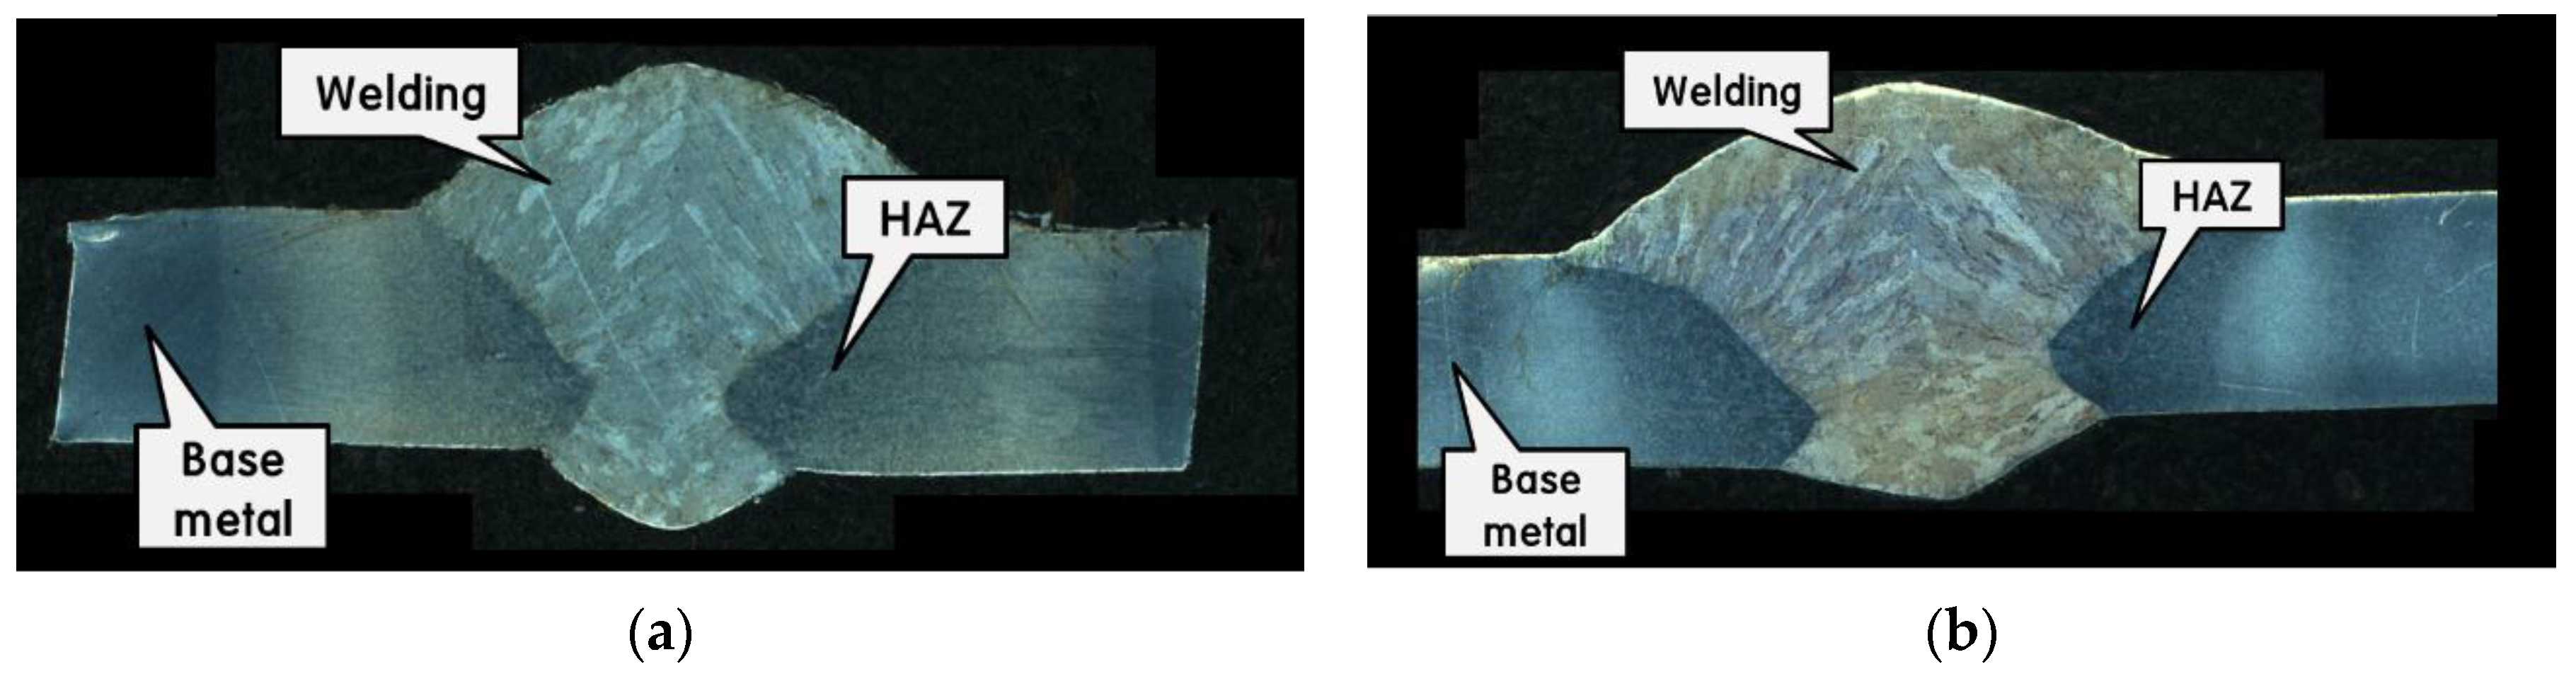
2.4. Welded Fatigue Specimen

As previously discussed, high-strength 590 FB and 780 FB steels were selected because they are widely used in the automotive industry. The pressed parts were welded and can be expected to exhibit lower strengths and fatigue lives.
A digital-waveform-controlled metal active gas (MAG) butt-welding process was used to prepare the welded specimens because it is capable of producing a superior weld quality with reduced spatter and heat input. A highly-accurate clamped welding jig and a semiautomatic welding system were used to ensure consistent weld quality. Figure 4 shows the weld setup. The welder used was the 350A DC CO2/MAG (Acro Co., Sejong, Korea), and the welding torch was fixed on a 5-µm-accuracy linear stage (LP200-SC, LPK, Cincinnati, OH, USA) to attain stable movement. The linear stage was controlled with an AC servo-driver (MR-J3-70A, MISUBISHI, Tokyo, Japan) on a controller (PXI-1008B, National Instrument, Austin, TX, USA).
The welding wire used corresponded to the KC-28 (KISWELL) based on the American Welding Society standard AWS A5.18 ER70S-6. The welding conditions are summarized in Table 3. The welded specimens were prepared by a wire–EDM process, and half the designed plate specimens were precisely clamped on the jig and were butt-welded. The weld bead was milled to prevent any uncontrolled stress concentrations, as shown in Figure 5. Although multiple clamps and additional milling were applied, the samples still had some distortion or misalignment. However, the resonance frequency of the fabricated samples was under a 1.5% range difference. For this reason, it was assumed that the distortion or misalignment did not affect to the experimental results.

3. Results

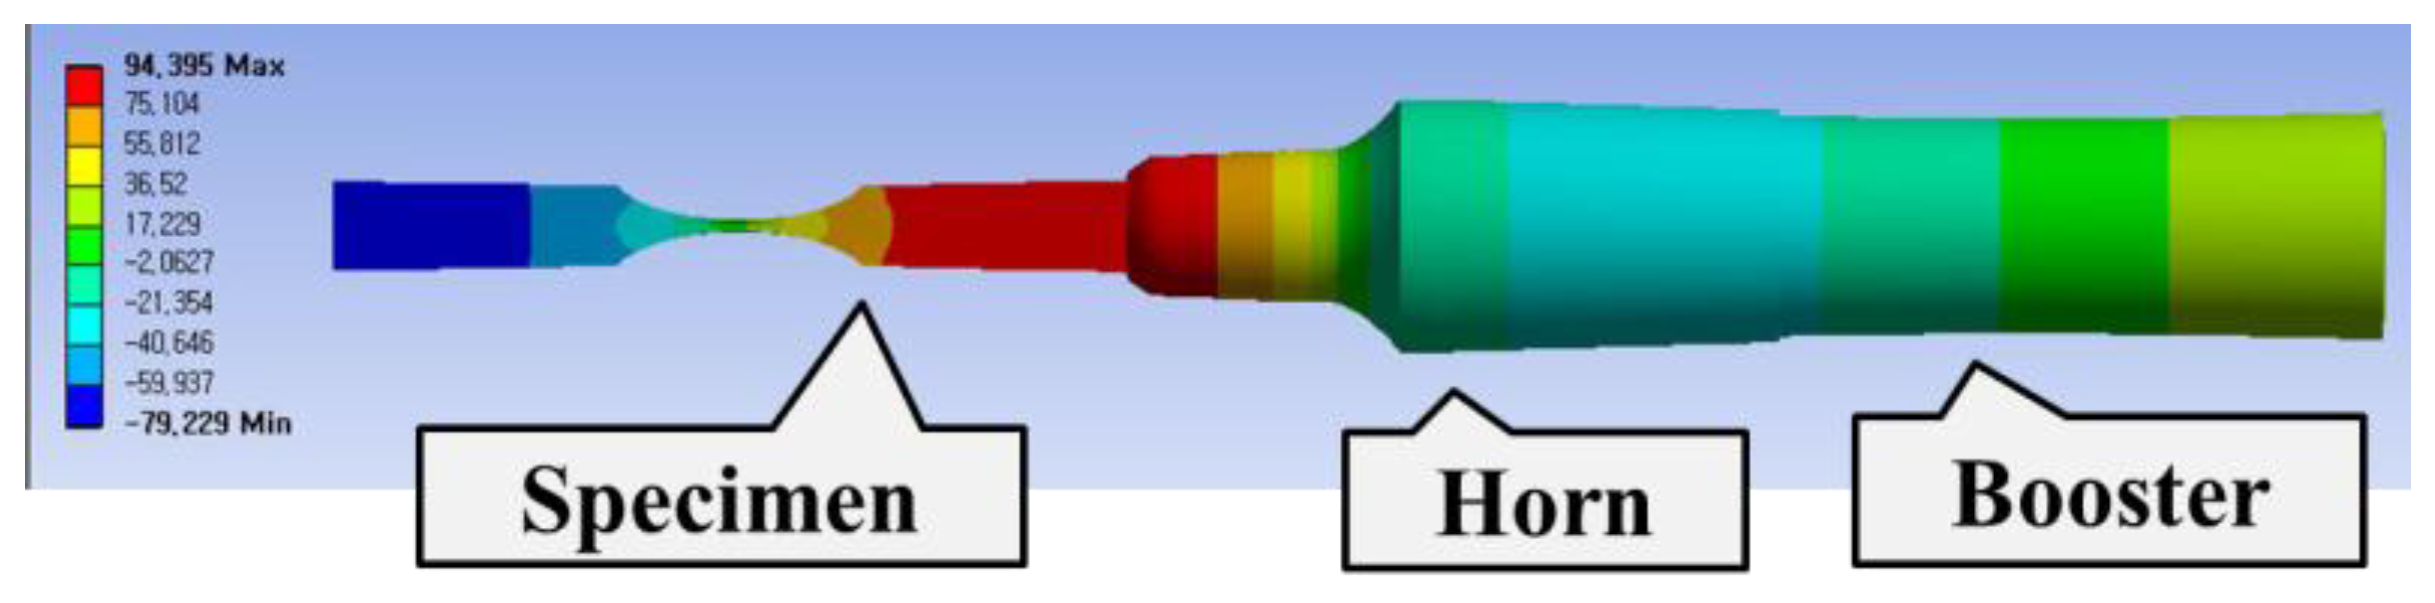
3.1. Finite Element Method (FEM) Simulation for Specimen Resonance
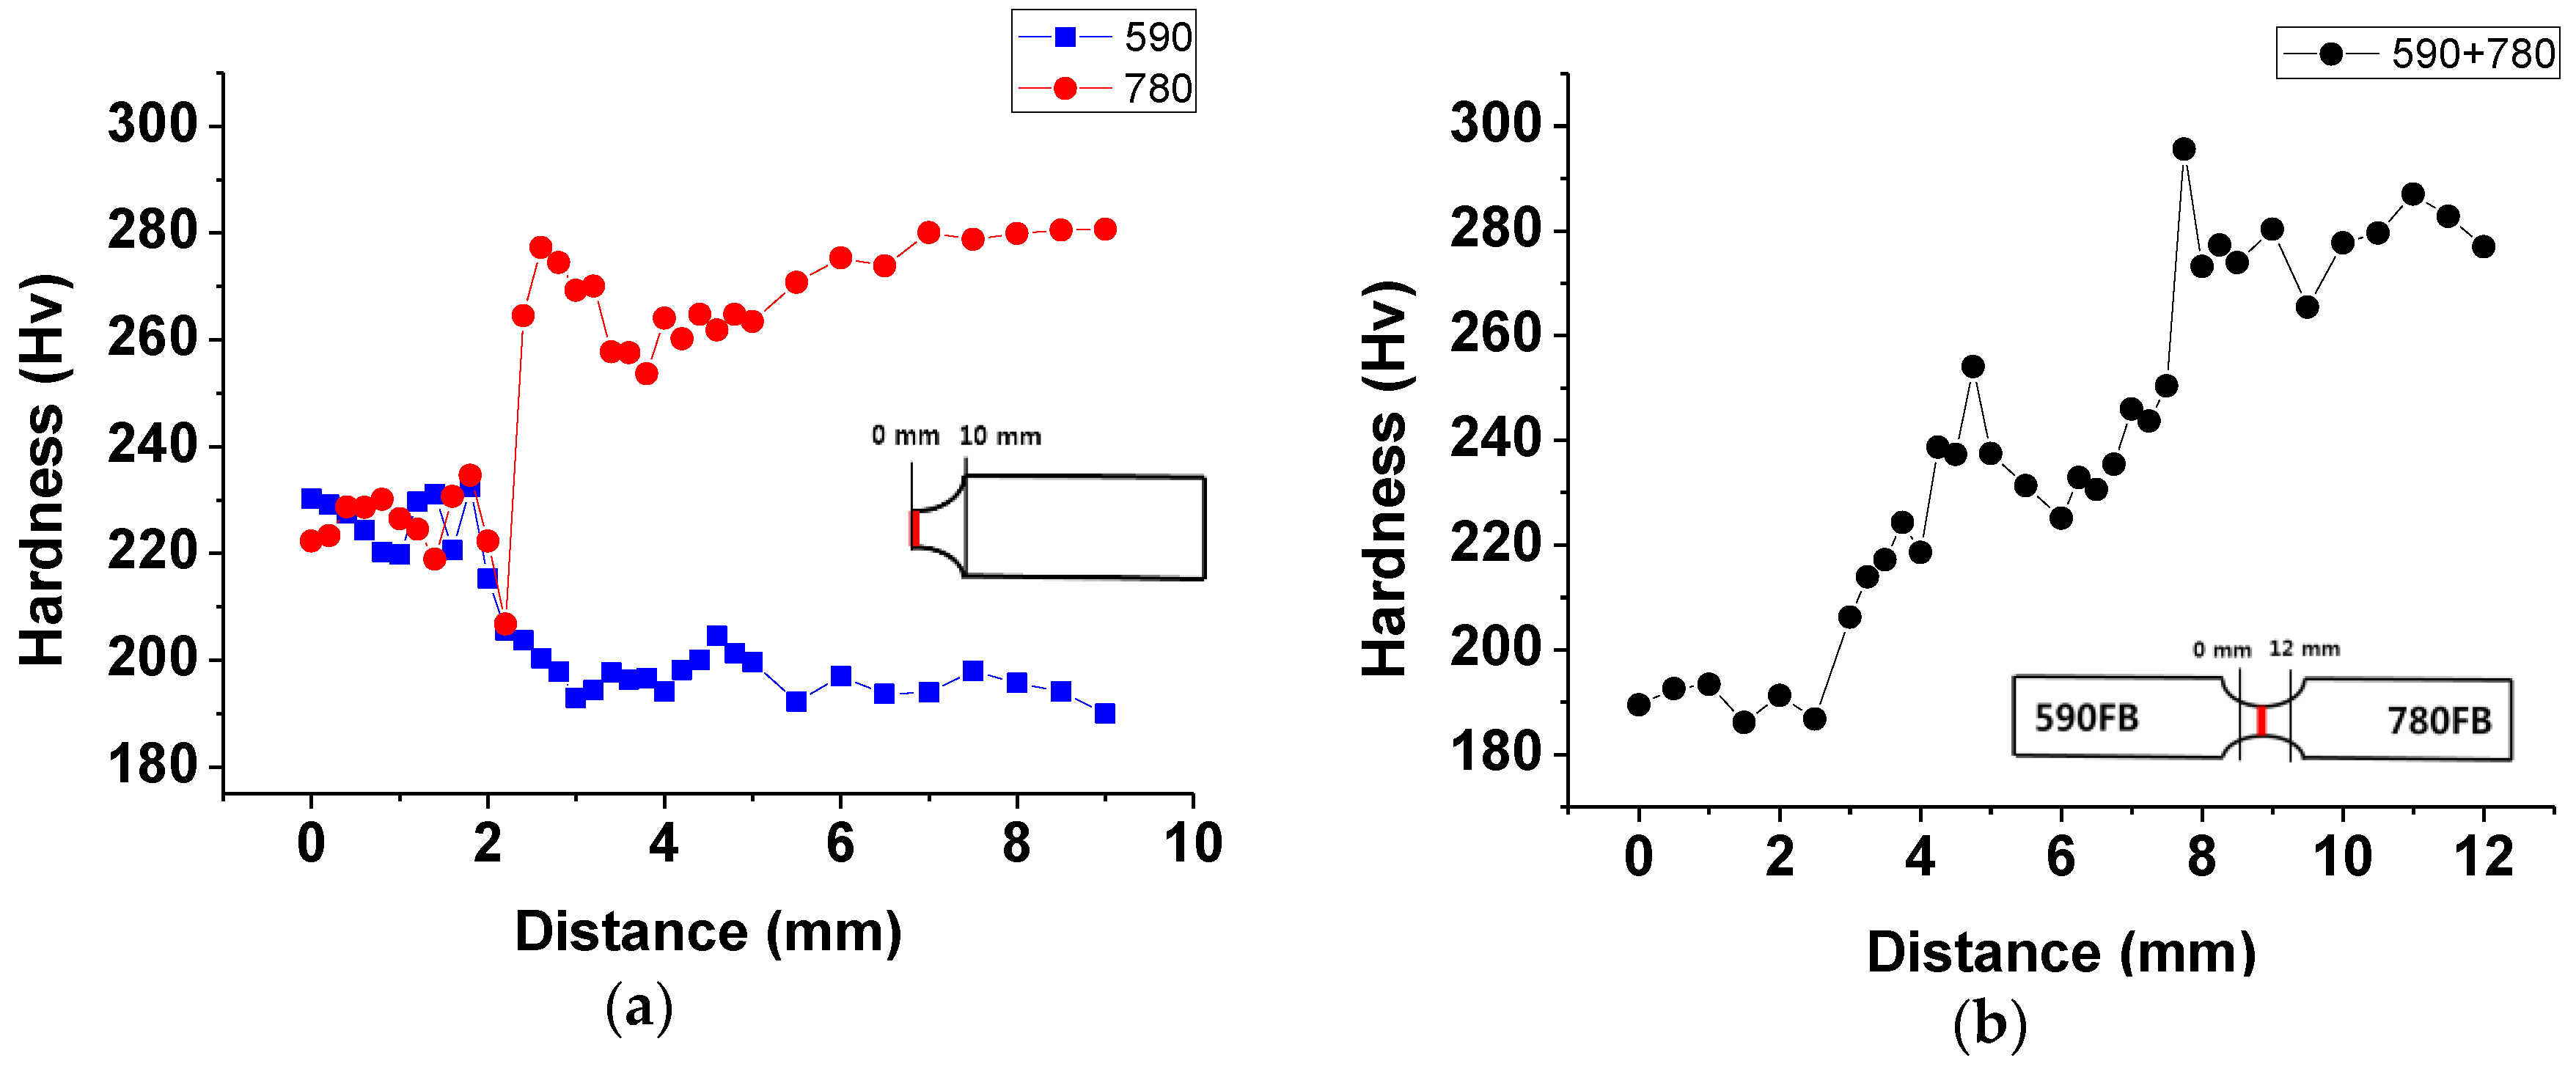
It was necessary to resonate the ultrasonic fatigue plate specimen at a specified frequency (20 kHz). Hence, an FEM simulation was performed to confirm the proper design of the specimen. An ANSYS (V.17, ANSYS, Inc., Canonsburg, PA, USA) modal simulation was performed in a free vibration condition. Figure 6 shows a simulated model in which the number of nodes corresponded to 10,638. The material properties for the booster and horn corresponded to that of titanium Ti–6Al–4V, and the properties of general FB steel were used for the specimen (Table 4). The model was simulated from 15 kHz to 25 kHz, and the result indicated an axial directional mode at 19.927 kHz. The result revealed a difference of only 0.4% when compared with the target frequency (20 kHz), thus confirming that the specimen design was appropriate.

3.2. Hardness Tests

Welding always generates a heat-affected zone that changes the specimen hardness. Therefore, hardness tests were conducted from the middle of the welded zone to the end of the base material. Figure 7 shows the results of the hardness tests. The specimens were cut using machining oil to prevent work hardening. A micro-Vickers tester (HM-122, Mitutoyo, Kawasaki, Japan) was used with a 500-g load and 5-s time condition.
In Figure 7a, the results indicated that the welded zones for both specimens had values of 225 HV because they were welded using the same welding wire. The 590 FB and 780 FB base materials had hardness values of 195 HV and 280 HV, respectively. The results confirmed that there was a linear correlation between the hardness and the yield strength of the base material. Figure 7b shows the results from butt-welding on 590 FB steel (on the left) and on 780 FB steel (on the right) for each side. The hardness of the 780 FB steel side could be attributed to an increased number of bainite structures.

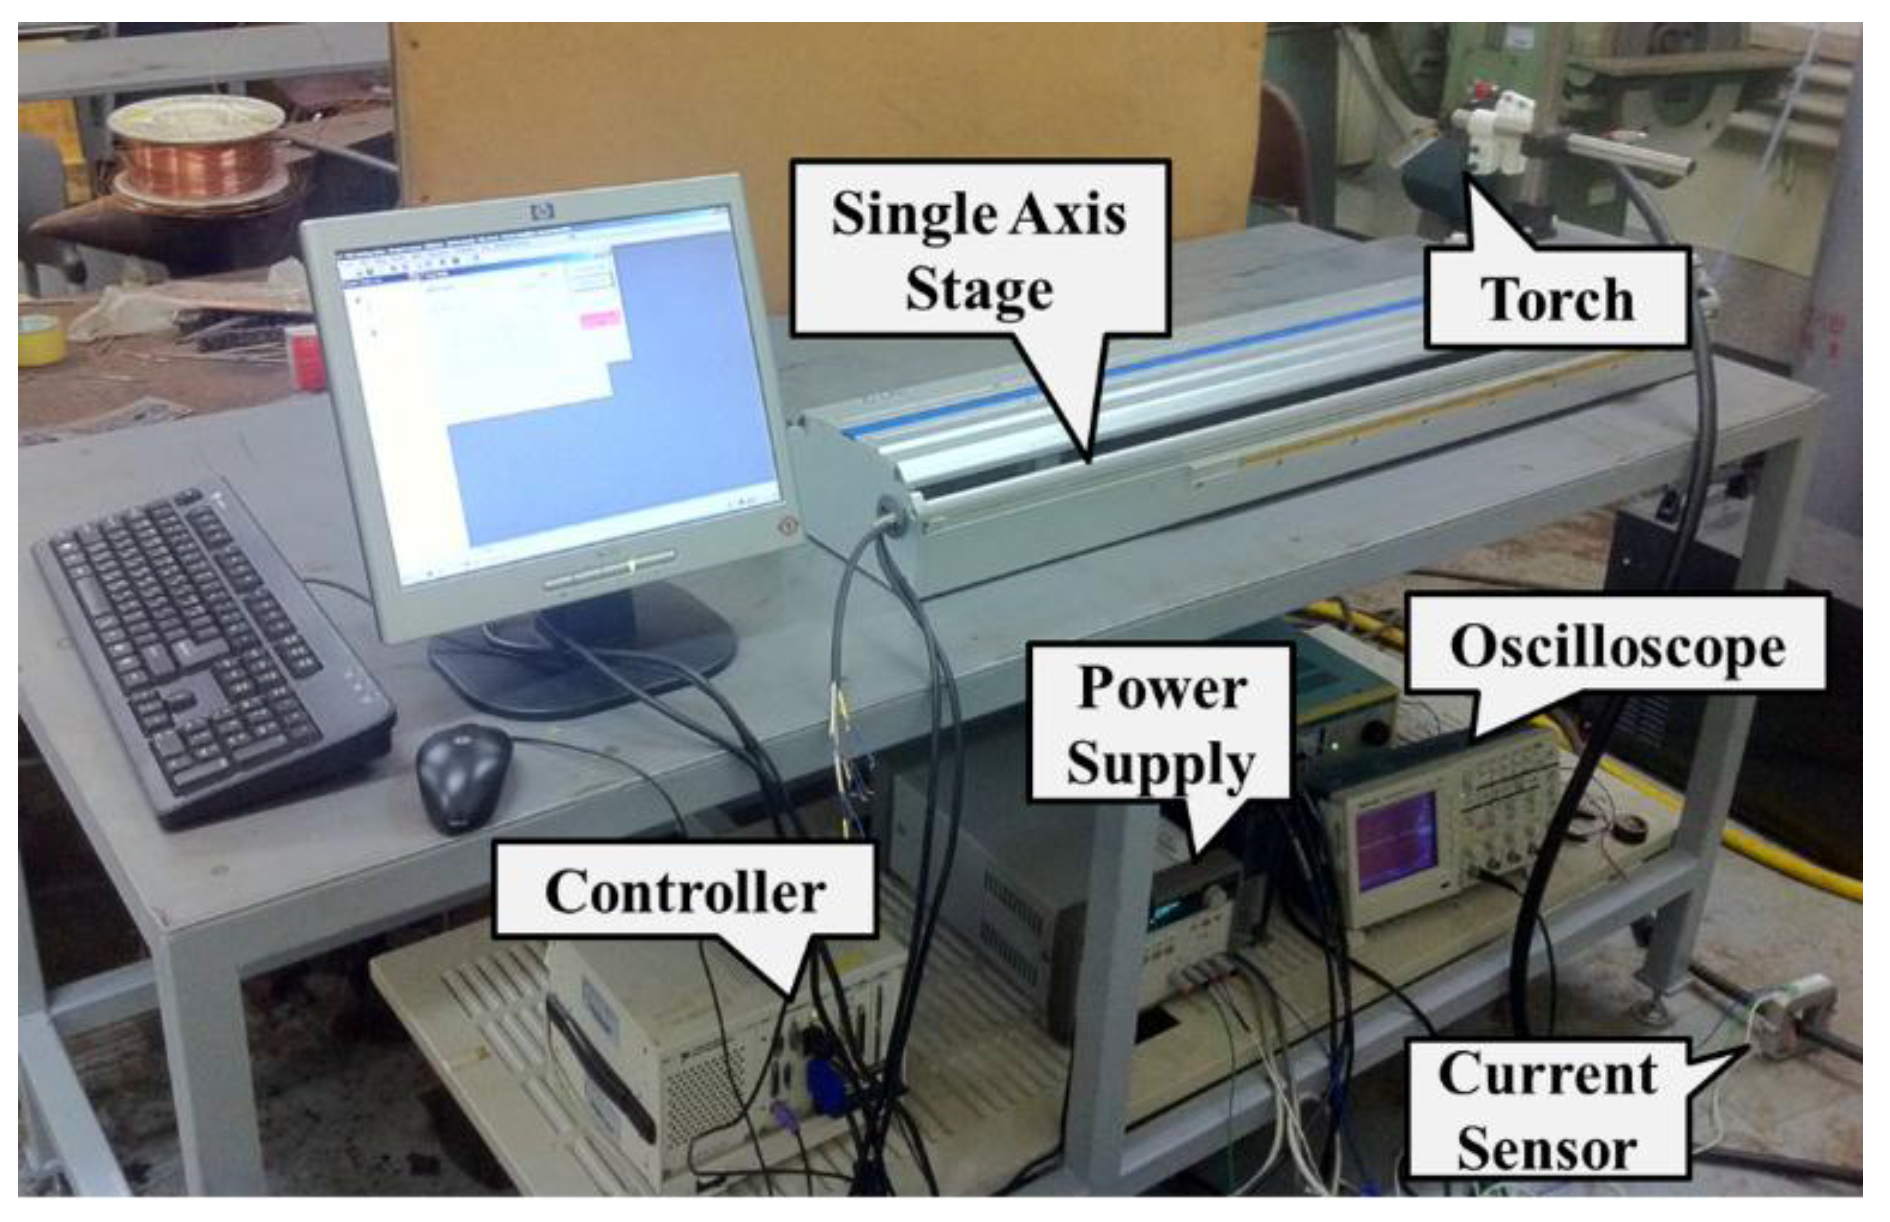
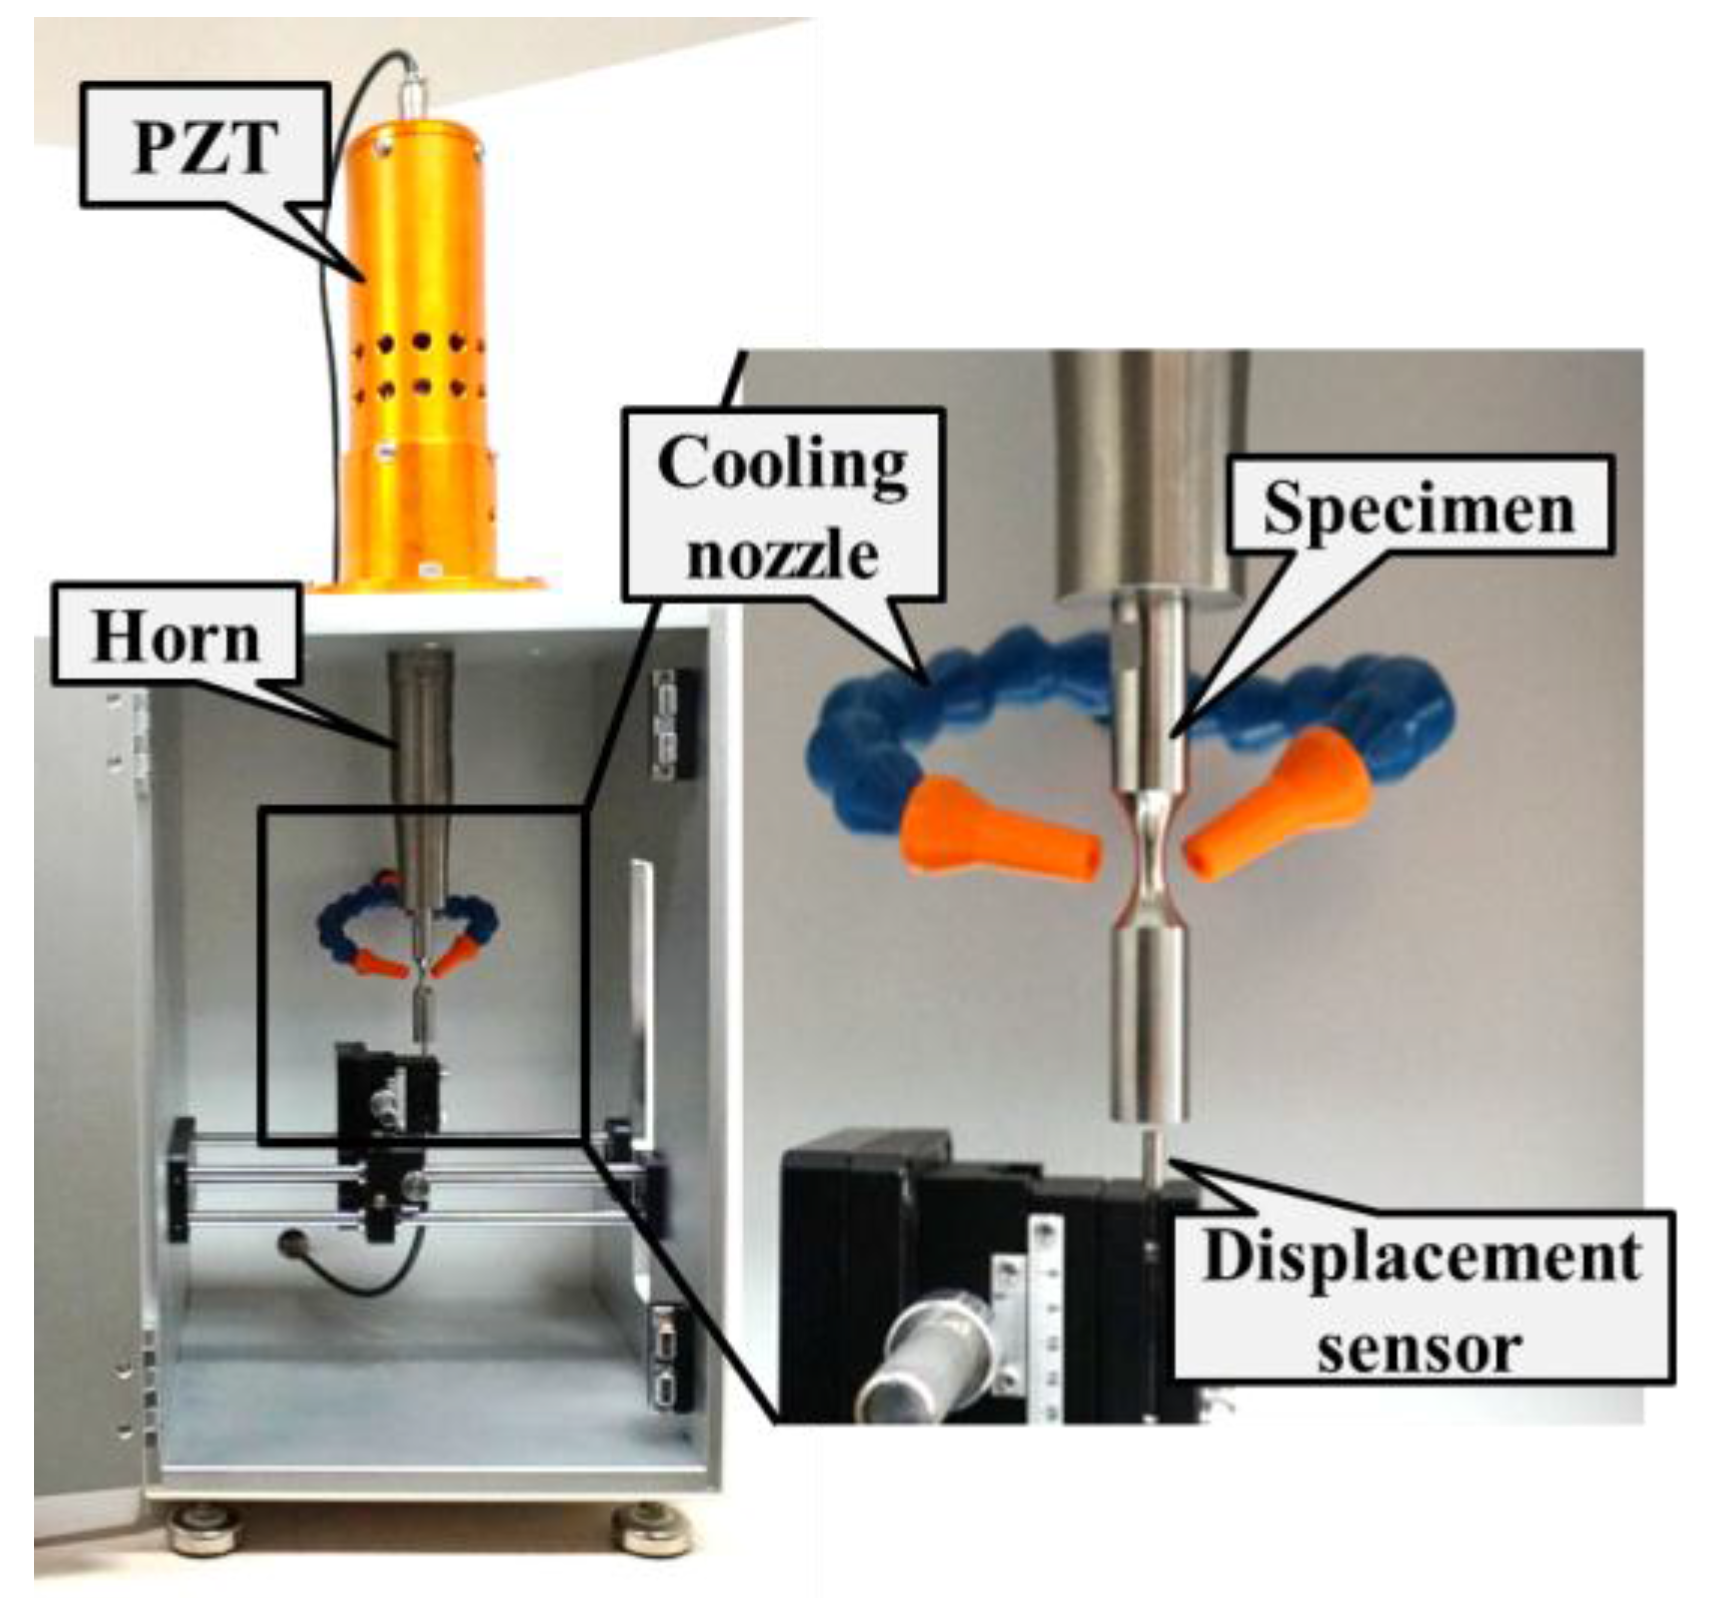
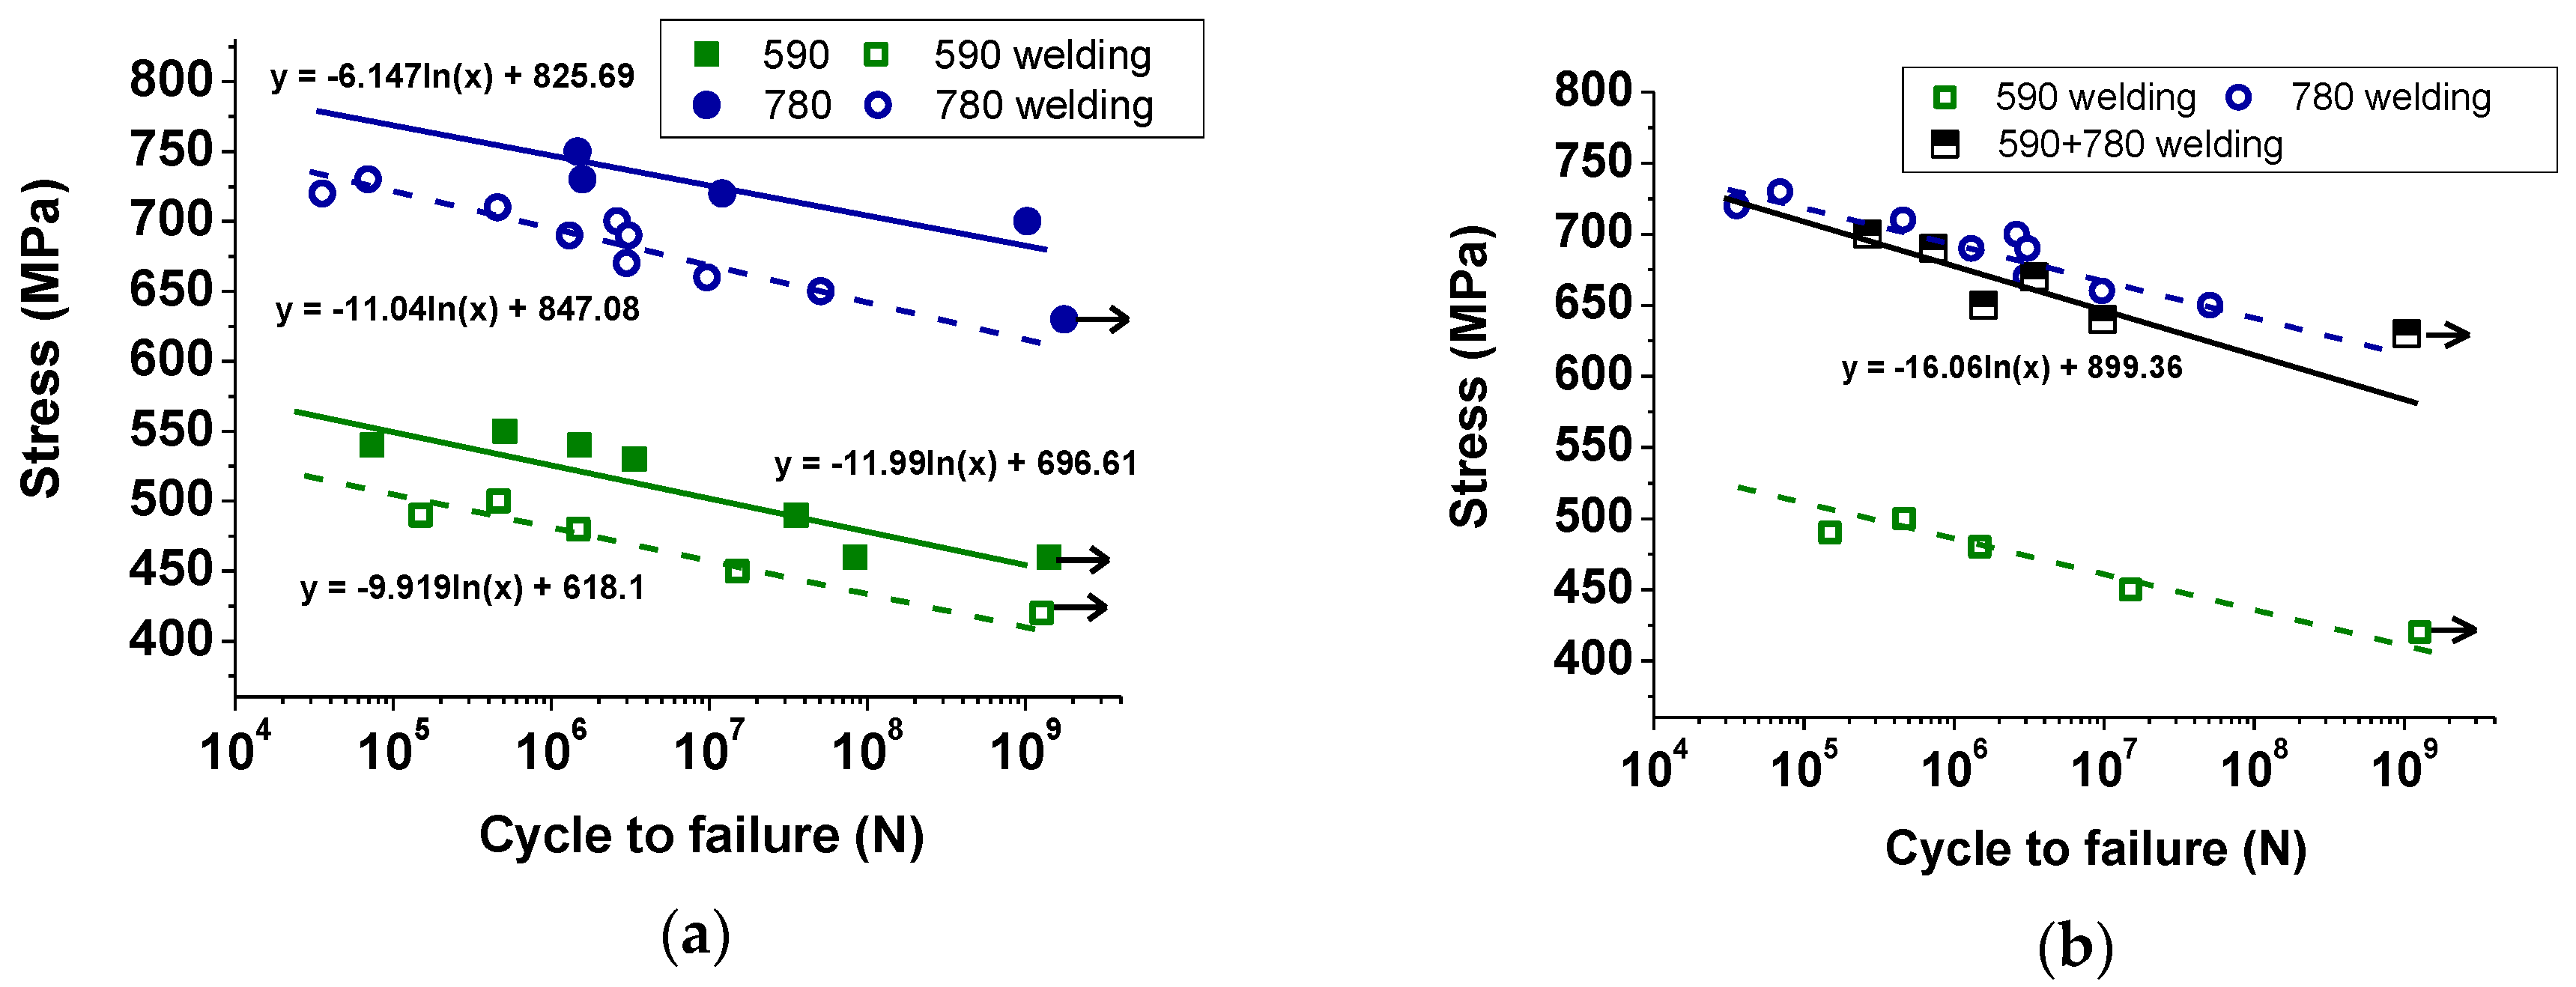
3.3. Ultrasonic Fatigue Test

The ultrasonic fatigue test conditions of the specially designed FB steel plate specimens for resonance at 20 kHz are summarized in Table 5. The stress ratio and experimental resonant frequency corresponded to R = −1 and 19.914 kHz, respectively. The fatigue tests were performed at room temperature. However, heat was generated in the middle of the specimen owing to stress concentration and the internal friction of the steel material [22]. Compressed air was blown on the middle section of the specimen for cooling purposes to avoid experimental errors and any resulting changes in the resonant frequency from the generated heat. Additionally, the experiments were performed at intervals to prevent excessive heat generation.
Five cases were examined in the fatigue tests and included raw 590 FB steel, raw 780 FB steel, butt-welded 590 FB steel, butt-welded 780 FB steel, and 590 FB and 780 FB steels butt-welded to each other. The specimens failed in the middle section, as predicted (Figure 8).
Figure 9 shows the results of the fatigue tests. With respect to the raw 590 FB steel, the shortest and longest fatigue failures corresponded to 7.34 × 10⁴ cycles with a load of 540 MPa and 1.41 × 10⁹ cycles with a load of 460 MPa, respectively. The S–N curve followed a general trend. Thus, it could be used to determine that the fatigue tests were appropriately performed. A specimen with a load of 460 MPa was capable of reaching gigacycles, while another specimen reached 8.37 × 10⁷ cycles under the same load. Based on these results, it was proposed that the raw 590 FB material is capable of an infinite fatigue life when a load less than 460 MPa is applied.
The butt-welded 590 FB steel had the shortest fatigue life, with failure occurring at 1.49 × 10⁵ cycles at a load of 490 MPa. However, failure was not observed for a load of 420 MPa. A fatigue strength loss of approximately 7.97% was observed in the butt-welded 590 FB steel when compared with the raw 590 FB material. The S–N curves for the raw and butt-welded 590 FB materials exhibited similar trends. The raw 780 FB and butt-welded 780 FB materials exhibited fatigue strengths of 667 MPa and approximately 618 MPa, respectively, in the gigacycle test. In the case of the 780 FB steel, a fatigue strength loss of 7.38% was observed owing to welding, similar to the strength loss of the 590 FB steel.
Figure 9b depicts the results of the 590 FB and 780 FB steels butt-welded to each other. The predicted fatigue strength was similar to that of the butt-welded 590 FB steel. However, the test results indicated that the fatigue life of the 590 FB and 780 FB steels butt-welded to each other was similar to that of the butt-welded 780 FB. This could occur because an increased stress was absorbed by the 780 FB steel region. Nevertheless, further studies should be conducted to examine this issue.

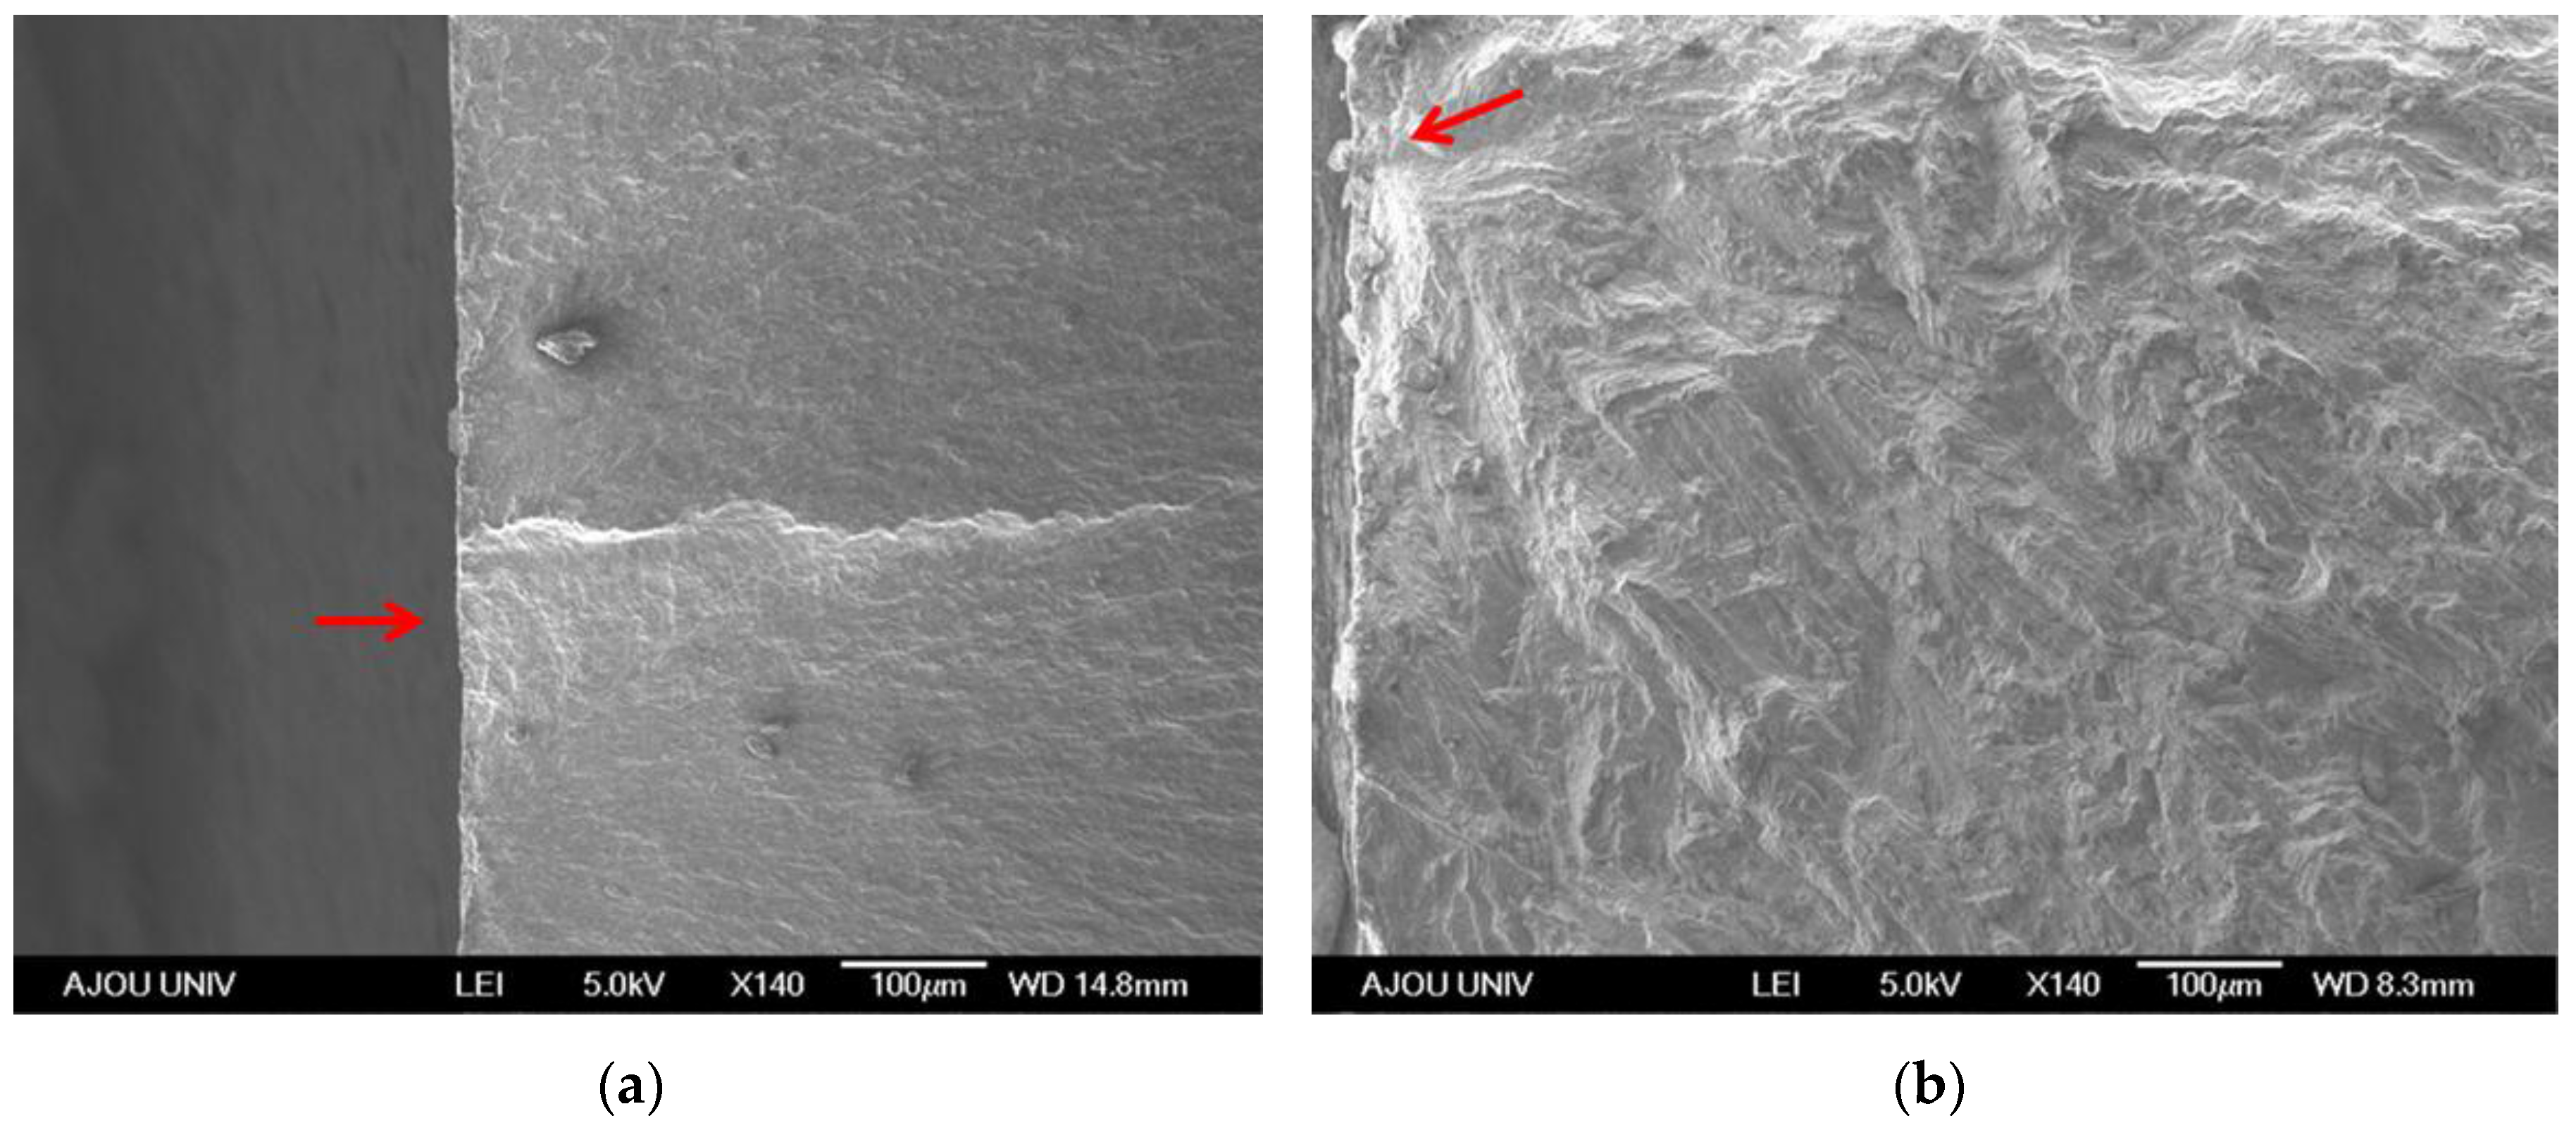
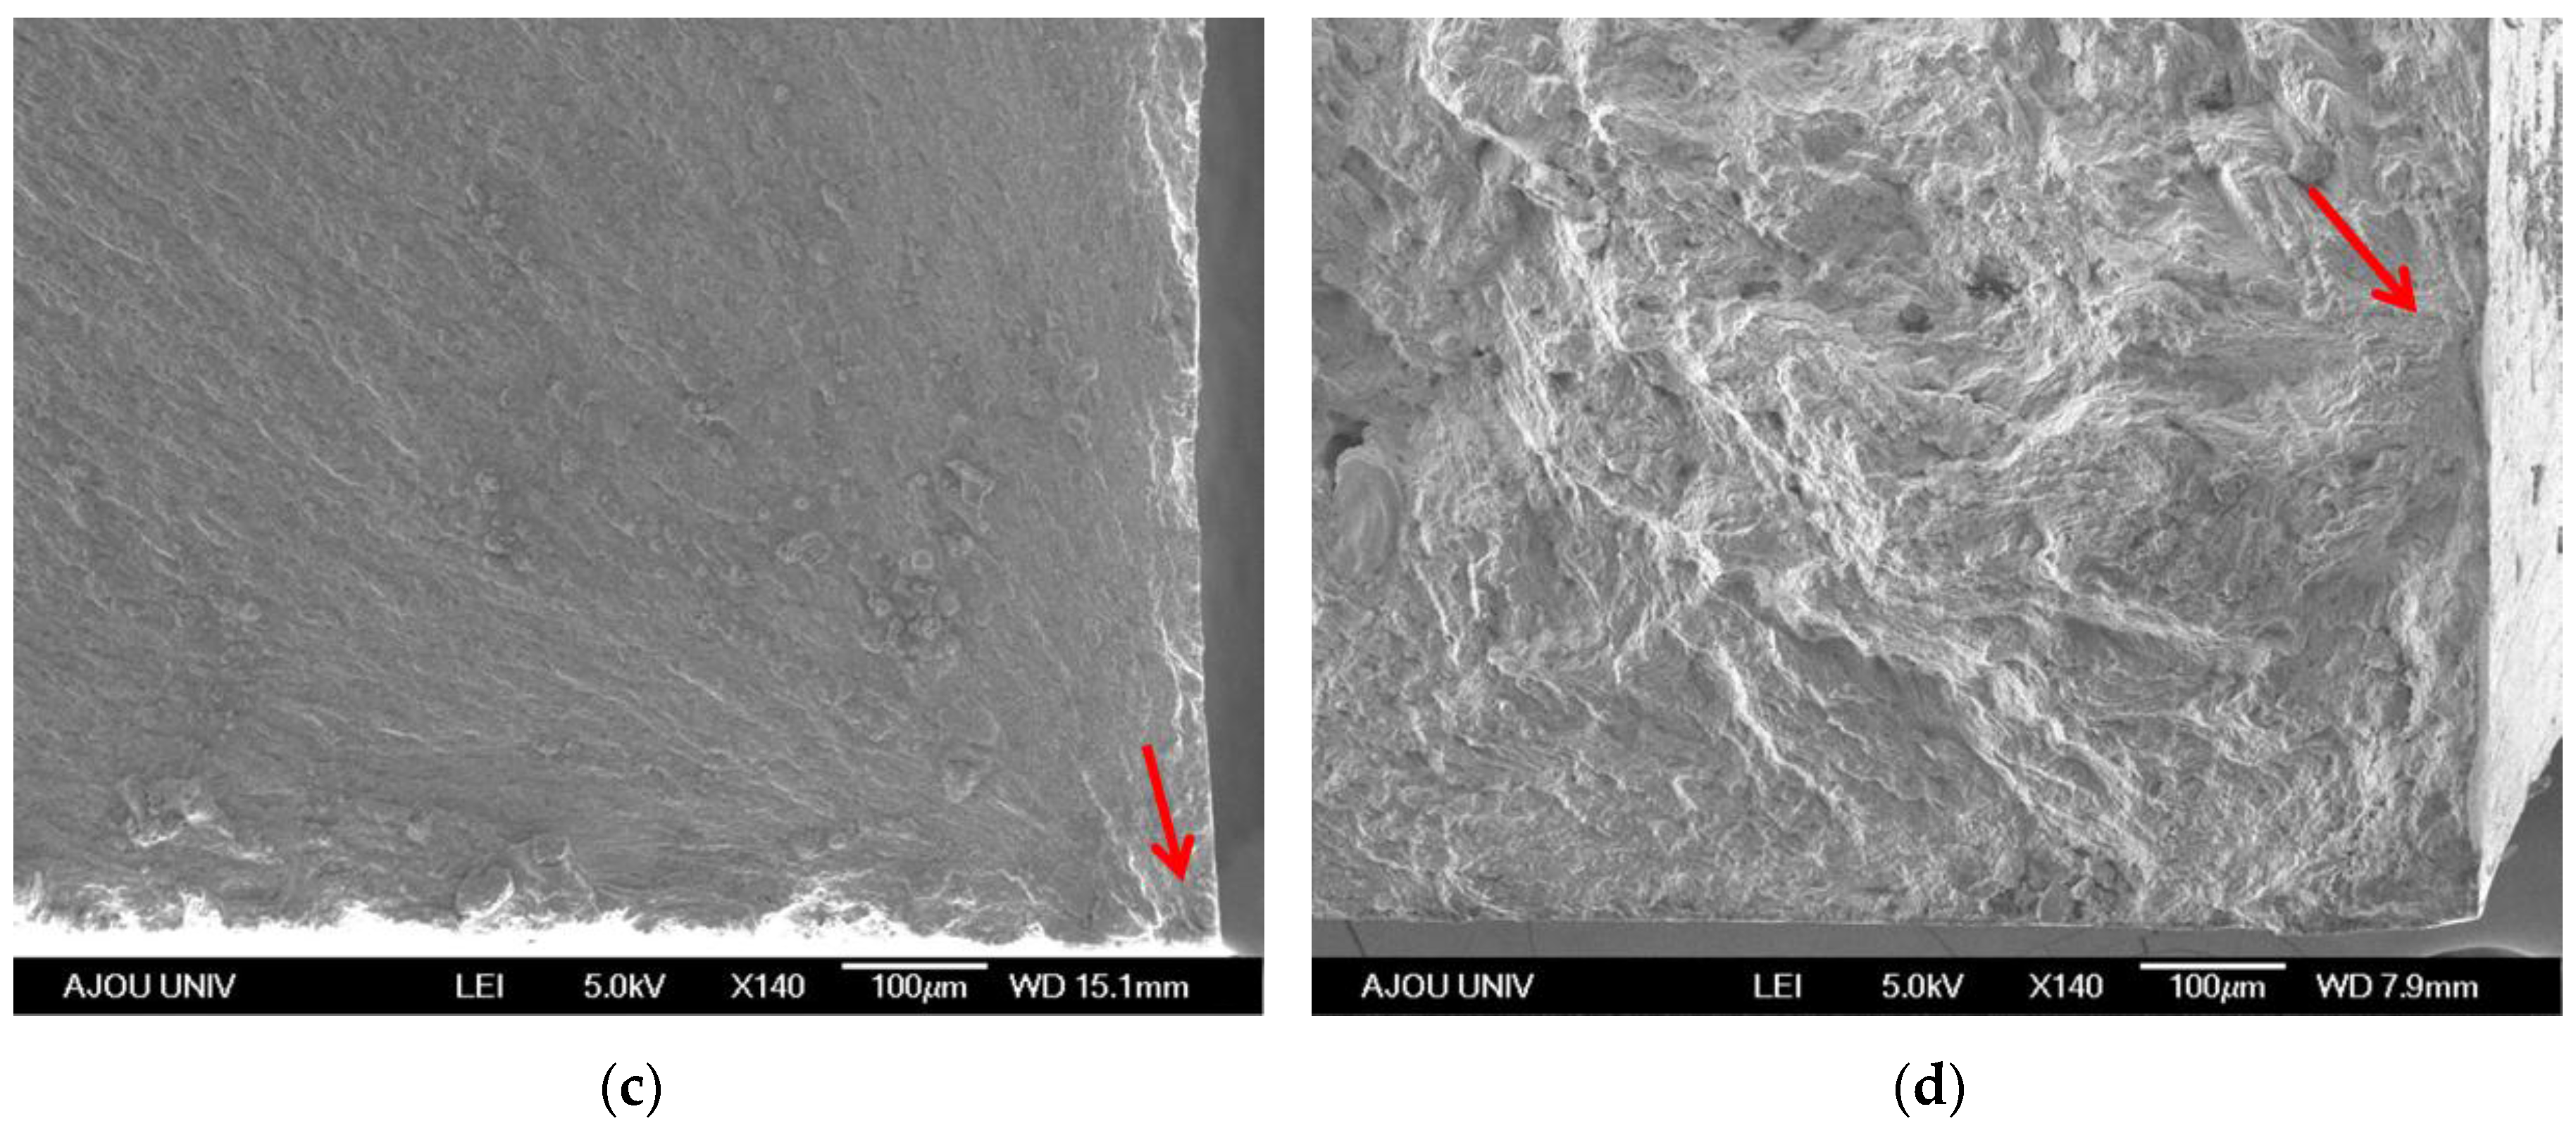
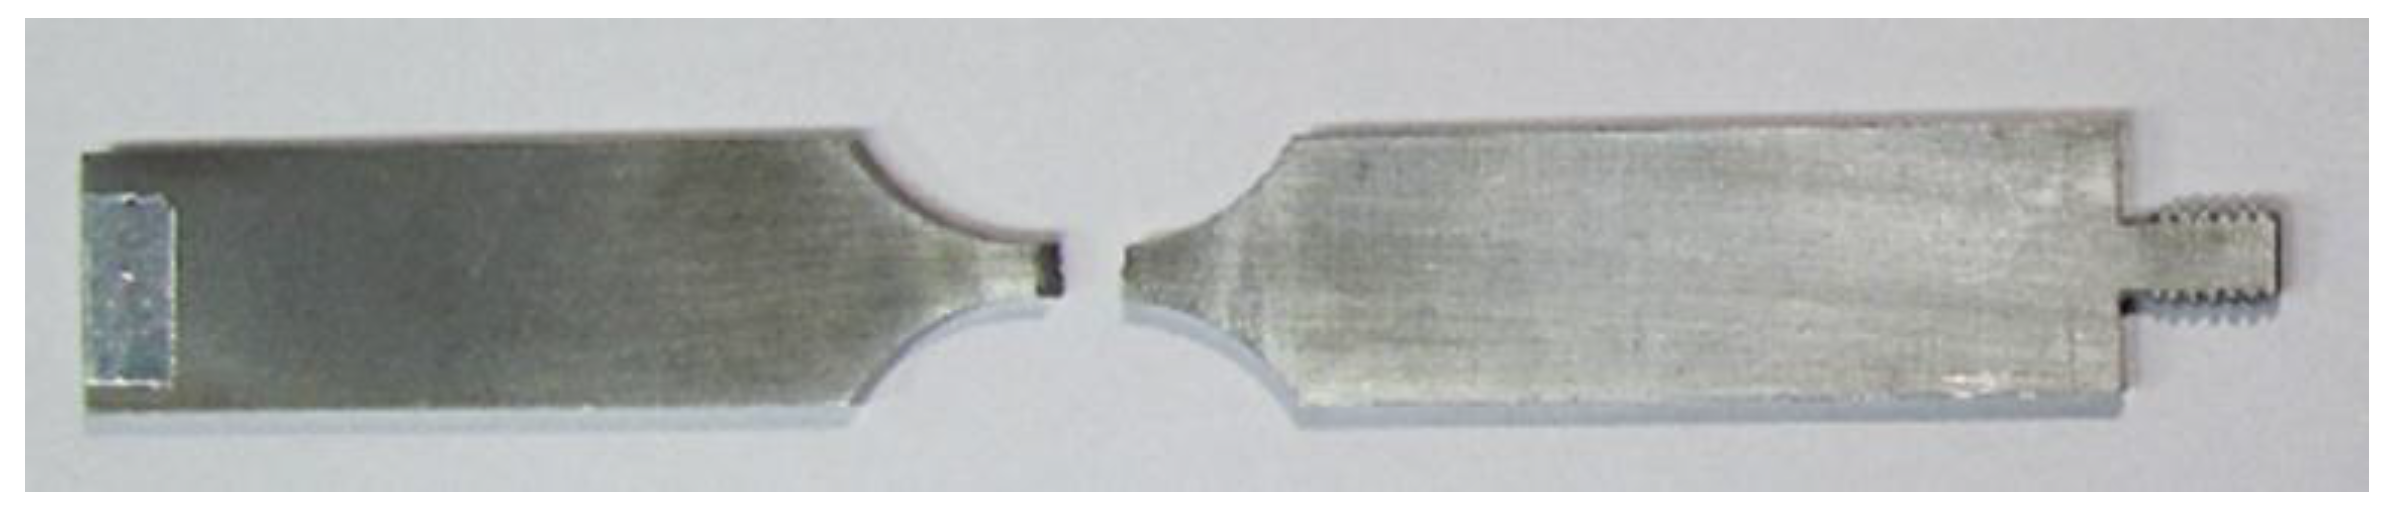
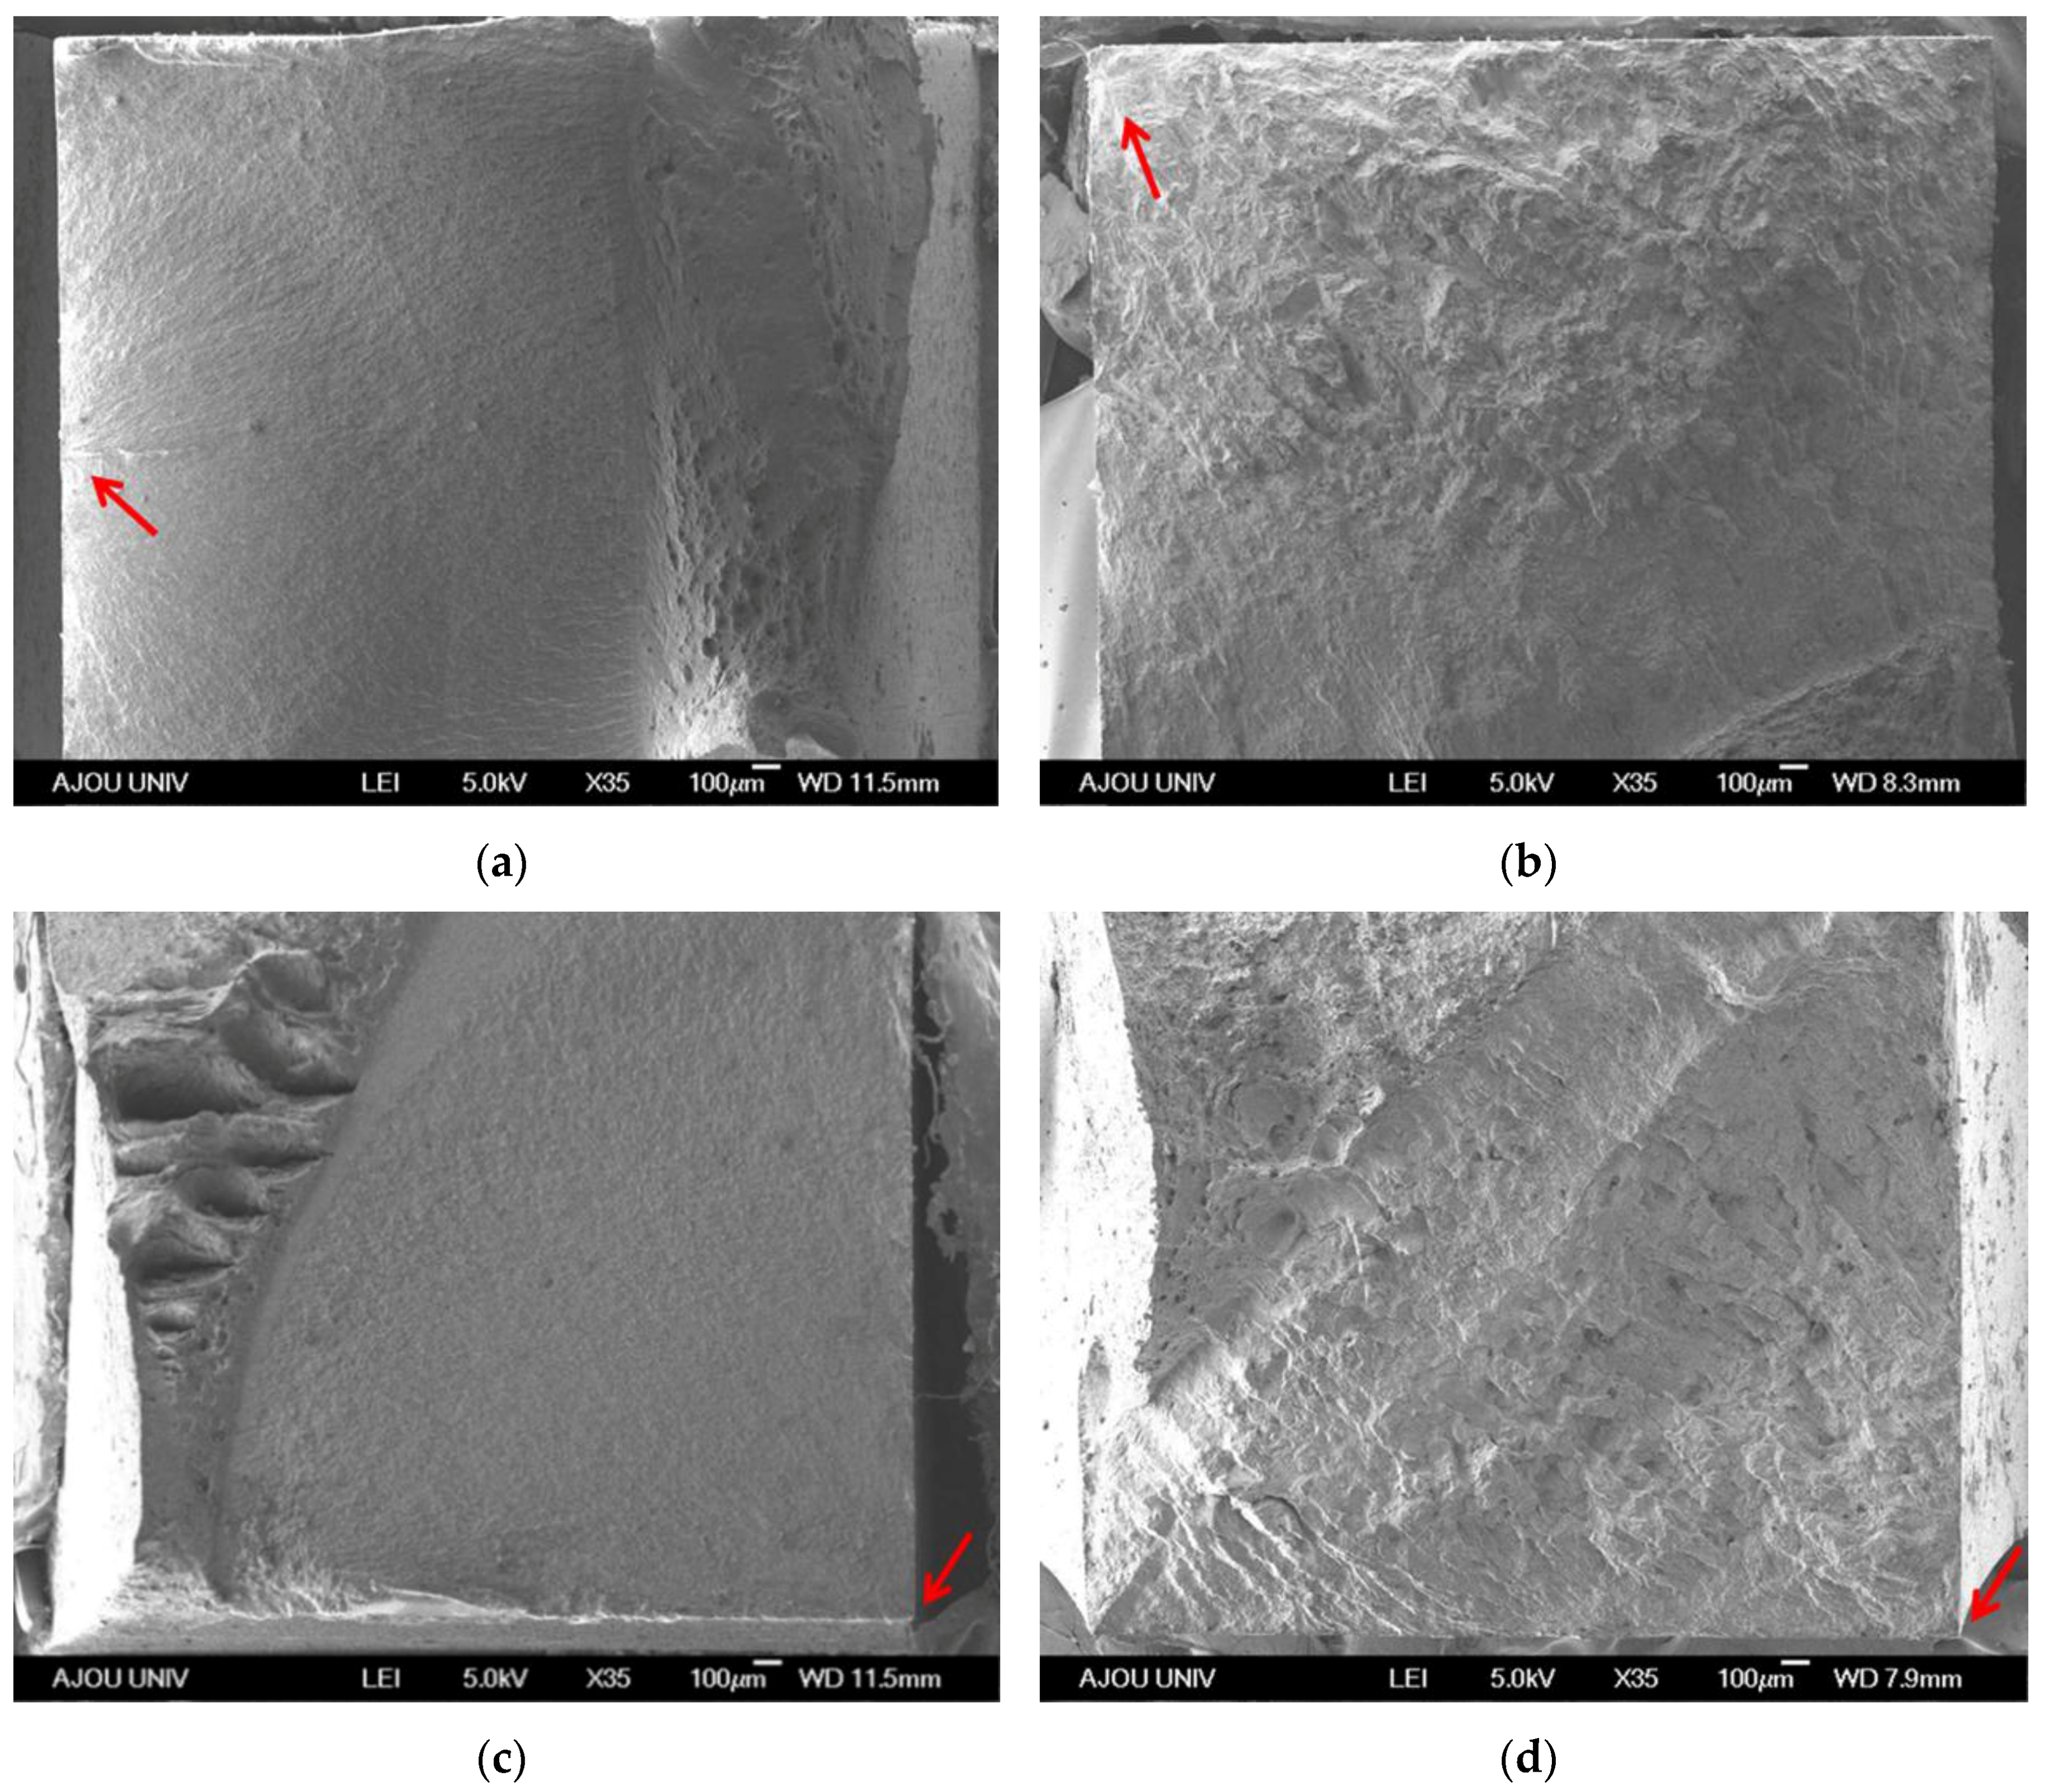
3.4. Fracture Surface

Figure 10 shows cross sections of the welded 590 FB and 780 FB specimens. The specimens were polished and etched using a solution containing 95 mL of methanol and 5 mL of HNO3 [23]. The figure shows the base material, heat-affected zone, and welding zone separately. Larger grains were observed in the welding zone as a result of grain growth.
A field emission scanning electron microscope (FE-SEM, JSM-6700F, JEOL, Tokyo, Japan) was used to examine the fractured surface. Figure 11 shows the results. Each of the 590 FB steel and 780 FB steel sheet material specimens exhibited a clean and sharp fracture surface. By contrast, the welded specimens exhibited bumpy and wavy surfaces. This could have occurred because of the welding wire and brittle fracture caused by the grain growth [24,25]. Figure 12 shows the crack initiations with a magnified view of the arrow point of Figure 11. All fractures occurred at periods exceeding 107 cycles. A previous study proposed that cracks were initiated at a single point exceeding 107 cycles. This was verified by the results of the present study [26]. All cracks were initiated at the surface.

4. Conclusions

In this study, plate specimens for ultrasonic fatigue tests were successfully designed, and their designs were validated. A novel method to measure the dynamic Young’s modulus was also proposed. The designed specimen confirmed that the resonant frequency corresponded to 19.927 kHz by FEM simulation. This value is very close to the target resonant frequency (20 kHz). Additionally, ultrasonic fatigue tests were performed using EDM-machined plate specimens at a test frequency of 19.914 kHz.
The fatigue strengths of the 590 FB steel and 780 FB steel specimens corresponded to 460 MPa and 667 MPa, respectively, during a gigacycle test. This indicated an approximate reduction of 7%–8% of the fatigue strength in the butt-weld specimens. This result verified the results obtained by previous studies, wherein it was observed that the heat of the welding process increased the grain size and decreased the fatigue life. Large grains were observed at the fractured surface and cross-section of the welded specimen. The tests also verified a single-point crack initiation at a very high cycle fatigue.
Hence, as indicated by the aforementioned results, this study confirmed a method to design ultrasonic fatigue test plate specimens. The fatigue behaviors of 590 FB steel, 780 FB steel, and welded plate specimens were examined by using an S–N curve based on gigacycle testing. It is expected that these results will benefit industries requiring parts that are manufactured and welded from high-strength steel materials. The results can also be applied to numerical fatigue simulations.

Acknowledgments

This research was supported by the Basic Science Research Program through the National Research Foundation of Korea (NRF) funded by the Ministry of Science, ICT and Future Planning (No. NRF-2015R1C1A1A02036547).

Author Contributions

Hyunho Yeom, Byungjoo Choi, and Taeho Seol performed the experiments; Hyunho Yeom, Moongu Lee, and Yongho Jeon analyzed the data; Hyunho Yeom and Yongho Jeon wrote the paper.

Conflicts of Interest

The authors declare no conflicts of interest.

References

  1. Bathias, C.; Paris, P.C. Gigacycle Fatigue in Mechanical Practice; Marcel Dekker: New York, NY, USA, 2005; pp. 9–50. [Google Scholar]
  2. Kazymyrovych, V. Very High Cycle Fatigue of Tool Steels. Ph.D. Thesis, Karlstad University, Karlstad, Sweden, 10 September 2010. [Google Scholar]
  3. Crupi, V.; Epasto, G.; Guglielmino, E.; Risitano, G. Analysis of temperature and fracture surface of AISI4140 steel in very high cycle fatigue regime. Theor. Appl. Fract. Mech. 2015, 80, 22–30. [Google Scholar] [CrossRef]
  4. Wang, Q.Y.; Bathias, C.; Kawagoishi, N.; Chen, Q. Effect of inclusion on subsurface crack initiation and gigacycle fatigue strength. Int. J. Fatigue 2002, 24, 1269–1274. [Google Scholar] [CrossRef]
  5. Wang, Q.Y.; Berard, J.Y.; Dubarre, A.; Baudry, G.; Rathery, S.; Bathias, C. Gigacycle fatigue of ferrous alloys. Fatigue Fract. Eng. Mater. Struct. 1999, 22, 667–672. [Google Scholar] [CrossRef]
  6. Gu, Y.; Tao, C.; He, Y.; Liu, C. The effect of frequency and sample shape on fatigue behaviors of DZ125 superalloy. Theor. Appl. Mech. Lett. 2012, 2. [Google Scholar] [CrossRef]
  7. Jiang, Q.; Sun, C.; Liu, X.; Hong, Y. Very-high-cycle fatigue behavior of a structural steel with and without induced surface defects. Int. J. Fatigue 2016, 93, 352–362. [Google Scholar] [CrossRef]
  8. Heinz, S.; Eifler, D. Crack initiation mechanisms of Ti6Al4V in the very high cycle fatigue regime. Int. J. Fatigue 2016, 93, 301–308. [Google Scholar] [CrossRef]
  9. Müller-Bollenhagen, C.; Zimmermann, M.; Christ, H.J. Very high cycle fatigue behaviour of austenitic stainless steel and the effect of strain-induced martensite. Int. J. Fatigue 2010, 32, 936–942. [Google Scholar] [CrossRef]
  10. Mayer, H.; Papakyriacou, M.; Zettl, B.; Stanzl-Tschegg, S.E. Influence of Porosity on the Fatigue Limit of Die Cast Magnesium and Aluminium Alloys. Int. J. Fatigue 2003, 25, 245–256. [Google Scholar] [CrossRef]
  11. Majumdar, S.; Roy, S.; Ray, K.K. Fatigue performance of dual-phase steels for automotive wheel application. Fatigue Fract. Eng. Mater. Struct. 2016, 40, 315–332. [Google Scholar] [CrossRef]
  12. Ellwood, R.D. Fatigue Performance of Downgauged High Strength Steel Automotive Suspension Component. Ph.D. Thesis, University of Wales Swansea, Swansea, UK, 2003. [Google Scholar]
  13. Potukutchi, R.; Agrawal, H.; Perumalswami, P.; Dong, P. Fatigue Analysis of Steel MIG Welds in Automotive Structures; SAE International: Warrendale, PA, USA, 2004. [Google Scholar]
  14. Takaoka, Y.; Shimoda, T.; Hara, J.; Seki, N.; Deguchi, T.; Koshio, K. Application of the latest technologies to fatigue strength improvement. In Proceedings of the TSCF2010 Shipbuilders’ Meeting, Todyo, Japan, 28 October 2010.
  15. Zhao, Z.P.; Qiao, G.Y.; Li, G.P.; Yang, W.W.; Liao, B.; Xiao, F.R. Fatigue properties of ferrite/bainite dual-phase X80 pipeline steel welded joints. Sci. Technol. Weld. Join. 2016, 22, 1–10. [Google Scholar] [CrossRef]
  16. Shrama, Kadhum. Fatigue of Welded High Strength Steels for Automotive Chassis and Suspension Applications. Ph.D. Thesis, Cardiff University, Cardiff, UK, 2016. [Google Scholar]
  17. Zhang, M.; Wang, W.; Wang, P.; Liu, Y.; Li, J. Fatigue behavior and mechanism of FV520B-I welding seams in a very high cycle regime. Int. J. Fatigue 2016, 87, 22–37. [Google Scholar] [CrossRef]
  18. Zhu, M.L.; Liu, L.L.; Xuan, F.Z. Effect of frequency on very high cycle fatigue behavior of a low strength Cr-Ni-Mo-V steel welded joint. Int. J. Fatigue 2015, 77, 166–173. [Google Scholar] [CrossRef]
  19. Zhao, X.; Dongpo, W.; Deng, C.; Liu, Y.; Zongxian, S. The fatigue behaviors of butt welds ground flush in the super-long life regime. Int. J. Fatigue 2012, 36, 1–8. [Google Scholar] [CrossRef]
  20. Liu, Y.; Tian, R.; He, C. Gigacycle fatigue behaviors in fusion zone and heat affected zone of Q345 LA steel welded joints. In Proceedings of the ICF13, Beijing, China, 16–21 June 2013.
  21. Matlock, D.K.; John, G.S. Third generation of AHSS: Microstructure design concepts. In Microstructure and Texture in Steels; Springer: London, UK, 2009; pp. 185–205. [Google Scholar]
  22. Rojas, J.I.; Daniel, C. Onset Frequency of Fatigue Effects in Pure Aluminum and 7075 (AlZnMg) and 2024 (AlCuMg). Metals 2016, 6, 50. [Google Scholar] [CrossRef] [Green Version]
  23. Buehler. The Science behind Materials Preparation a Guide to Materials Preparation & Analysis; Buehler Ltd.: Lake Bluff, IL, USA, 2007. [Google Scholar]
  24. Westgate, S. The resistance spot welding of high and ultra-high strength steels. In Proceedings of the 3rd International Seminar on Advances in Resistance Welding, Berlin, Germany, 16–17 November 2004.
  25. Seon, S.W.; Yi, W.; Park, H.D.; Hwang, Y.T. Characteristics of welds of pure titanium plate using ultrasonic attenuation. J. Korean Soc. Nondestruct. Test. 2013, 33, 205–211. [Google Scholar] [CrossRef]
  26. Stille, S.; Tilmann, B.; Lorenz, S. Very high cycle fatigue (VHCF) behavior of structured Al 2024 thin sheets. In Proceedings of the 13th International Conference on Fracture, Beijing, China, 16–21 June 2013.
Figure 1. Ultrasonic fatigue tester.
Metals 07 00103 g001
Figure 2. Measurement of dynamic Young’s modulus.
Metals 07 00103 g002
Figure 3. (a) Schematic of specimen; and (b) Specimen design of ferrite–bainite (FB) steel plate.
Metals 07 00103 g003aMetals 07 00103 g003b
Figure 4. Semiautomatic welding machine.
Metals 07 00103 g004
Figure 5. (a) Welding plate; and (b) welding ultrasonic fatigue specimen.
Metals 07 00103 g005
Figure 6. Modal simulation (19.927 kHz).
Metals 07 00103 g006
Figure 7. (a) 590 FB and 780 FB hardness; (b) 590 FB + 780 FB hardness.
Metals 07 00103 g007
Figure 8. Specimen after the fatigue test.
Metals 07 00103 g008
Figure 9. (a) S–N curves of 590 and 780 FB; (b) S–N curves of welding specimens (survival probability = 50%).
Metals 07 00103 g009
Figure 10. Cross-sections of (a) 590 FB steel and (b) 780 FB steel.
Metals 07 00103 g010
Figure 11. Fracture images (×35): (a) 590 FB (490 MPa, 3.53 × 10⁷ cycles); (b) welded 590 FB steel (450 MPa, 1.50 × 10⁷ cycles); (c) 780 FB steel (700 MPa, 1.03 × 10⁹ cycles); and (d) welded 780 FB steel (650 MPa, 5.08 × 10⁷ cycles).
Metals 07 00103 g011
Figure 12. Crack initiations (×140): (a) 590 FB (490 MPa, 3.53 × 10⁷ cycles); (b) welded 590 FB (450 MPa, 1.50 × 10⁷ cycles); (c) 780 FB (700 MPa, 1.03 × 10⁹ cycles); and (d) welded 780 FB (650 MPa, 5.08 × 10⁷ cycles).
Metals 07 00103 g012aMetals 07 00103 g012b
Table 1. Composition of ferrite–bainite (FB) steel.
MaterialsC Max. (wt %)Mn Max. (wt %)Si Max. (wt %)P Max. (wt %)S Max. (wt %)Fe
590 FB0.0901.5500.1500.0300.003balance
780 FB0.0501.8001.2500.0150.003balance
Table 2. Physical properties of FB Steel.
MaterialsDensity (g/cm3)Dynamic Young’s Modulus (GPa)
590 FB7.91221.28
780 FB8.01221.98
Table 3. Conditions of welding experiment.
Current (A)Voltage (V)Feed (cm/min)Shield Gas Ratio (%)Shield Gas Injection Quantity (L/min)Contact Tip to Work Distance (mm)Torch Degree (°)
21024.57680(Ar):20(CO2)201590
Table 4. Material properties for simulation.
PartMaterialDensity (kg/m3)Young’s Modulus (GPa)Poisson’s Ratio
SpecimenFB59081702210.3
Horn, BoosterTitanium Alloy4620960.36
Table 5. Conditions for ultrasonic fatigue test.
Stress Ratio (R)Frequency (kHz)Temperature (°C)On/Off Time (s)
−119.914255/2

