
Structural Investigations of TiC–Cu Nanocomposites Prepared by Ball Milling and Spark Plasma Sintering


1
School of Materials Science and Engineering, Hanoi University of Science and Technology, No 1 Dai Co Viet, Hanoi 100000, Vietnam
2
School of Materials Science and Engineering, University of Ulsan, San-29, Mugeo-2 Dong, Nam-Gu, Ulsan 680-749, Korea
3
Lavrentyev Institute of Hydrodynamics, Siberian Branch of the Russian Academy of Sciences, Lavrentyev Ave. 15, Novosibirsk 630090, Russia
4
Institute of Solid State Chemistry and Mechanochemistry, Siberian Branch of the Russian Academy of Sciences, Kutateladze str. 18, Novosibirsk 630128, Russia
*
Author to whom correspondence should be addressed.
Metals 2017, 7(4), 123; https://doi.org/10.3390/met7040123
Submission received: 17 January 2017
/
Revised: 10 March 2017
/
Accepted: 31 March 2017
/
Published: 3 April 2017
Abstract
:In this work, TiC–Cu composites containing 20 and 30 vol % of nano-sized titanium carbide (TiC) particles were prepared by powder metallurgy using copper powders with micrometer-sized and nanometer-sized particles. Mixtures of TiC and Cu powders were ball milled for 10 h and spark plasma sintered at 800–900 °C under an applied pressure of 50 MPa. The relative density of the sintered composites was 95.0%–96.5%. The composites fractured in a ductile mode. The crystallite size of the copper matrix in the composites prepared using the nanometer-sized copper powder was smaller than that in composites prepared using the micrometer-sized copper powder, which was confirmed by transmission electron microscopy (TEM). The hardness of the composites increased as the sintering temperature was increased from 800 to 900 °C. When the TiC content increased from 20 to 30 vol %, the hardness of the composites obtained from the micrometer-sized copper powder and sintered at 900 °C increased from 284 to 315 HV, while in composites obtained from the nanometer-sized copper, the hardness decreased from 347 to 337 HV.
1. Introduction
Copper is widely used as a material for electrical contacts due to its high electrical and thermal conductivities, low cost, and good corrosion resistance. However, the poor mechanical properties of copper—low hardness and strength—narrow the range of its possible applications. Inherent limitations of copper stimulate the development of copper matrix composites reinforced with ceramic particles [1,2,3,4,5,6]. To maintain high electrical conductivity, reinforcements that are thermodynamically stable in copper should be used. This avoids the dissolution of other elements in copper and maintains its high electrical conductivity. Titanium carbide (TiC) can be used as a reinforcing phase in copper matrix composites due to its high modulus, high hardness, and high melting temperature. In addition, TiC has negligible solubility in copper such that the TiC/Cu interface remains free from intermetallic compounds or solid solutions [7,8].
Discontinuously reinforced metal matrix composites can be produced by powder metallurgy, casting, self-propagating high-temperature synthesis, and other techniques [4,5,9,10,11]. All of these techniques are based on the addition of ceramic reinforcements to the matrix materials, which are in the liquid or solid (powder) state. In practice, it is rather difficult to distribute reinforcing nanoparticles in metallic melts [12,13]. Therefore, in order to improve the dispersion of TiC in the Cu matrix, high-energy ball milling is used to produce composite powders. Until now, most studies have focused on the possibilities of reducing the size of the reinforcing particles down to the nanoscale. The main issue in the synthesis of TiC–Cu composites is low wettability of the reinforcing particles by the matrix. It is generally accepted that a finer size of the reinforcing particles is desirable for improving the mechanical properties of the metal matrix composites.
Another possibility to achieve a better mechanical performance of TiC–Cu is to use copper powders with different particle sizes. It should be noted that the effect of reducing the particle size of the copper powders down to the nanoscale on the microstructure and mechanical properties of TiC–Cu composites has been much less investigated.
In this work, TiC–Cu composites were prepared by high-energy ball milling and spark plasma sintering (SPS). This sintering technique has gained a reputation of a versatile method of fast consolidation of powder materials [14,15,16,17,18]. The SPS method proves effective for consolidating composite powders. This works is aimed at investigating the influence of the size of the starting copper powders on the microstructure and hardness of the spark plasma sintered TiC–Cu composites.
2. Experimental Procedures
Two copper powders with average particle sizes of 75 µm and 40 nm (US1090, US Research Nanomaterials, Inc., Houston, TX, USA) were used as the staring materials. Titanium carbide TiC powder (US2052, US Research Nanomaterials, Inc.) with particles in the 40–60 nm range was used as a reinforcement. The TiC–Cu powder mixtures containing 20 and 30 vol % of TiC were mechanically milled in a high-energy planetary ball mill (P100, Taemyong Scientific Co., Ltd., Seoul, South Korea) for 10 h under an argon atmosphere. The ball-to-powder weight ratio was 10:1, and the ball diameter was 5 mm. To disperse the nanometer-sized TiC particles in the copper matrix homogeneously, the milling conditions (vial rotation speed and milling time) were optimized. At a rotation speed of 500 rpm, sticking of the powder to the milling vials and balls prevailed, and the iron contamination of the powder mixture was significant. At 300 rpm, mixing of the Cu and TiC powders was poor, which resulted in low hardness of the sintered materials. Conditions of milling established at 400 rpm were found to be optimal for the selected powder mixtures. A milling time of 10 h was determined to be sufficient for achieving a uniform distribution of TiC nanoparticles in the copper matrix. Composites obtained from the 75-µm copper powder are designated as “nanocomposite A”, while those obtained from the 40-nm copper powder are designated as “nanocomposite B”. The ball-milled powders were placed into a graphite die with an inner diameter of 10 mm. Before sintering, the SPS chamber was pumped to a pressure below 5 Pa.
The sintering experiments were conducted using a spark plasma sintering facility (DR. SINTER LAB Model: SPS-515S, Sumitomo Coal Mining, Tokyo, Japan). The samples were heated from room temperature to 800–900 °C by pulsed DC current passing through the graphite die, punches, and the sample itself. The samples were held at the maximum temperature for 5 min. A pressure of 50 MPa was applied through the sintering cycle. The microstructure of the composites was studied by scanning electron microcopy and energy-dispersive spectroscopy (SEM/EDS) using a field-emission JEOL JSM-7600F microscope (JEOL Ltd., Tokyo, Japan) and transmission electron microscopy (TEM) using a JEOL JEM-2100 microscope (JEOL Ltd., Tokyo, Japan). The phase composition of the sintered samples was studied by means of X-ray diffraction (XRD) using a RIGAKU RINT-2000 diffractometer with Cu Kα radiation (Rigaku Corporation, Tokyo, Japan). The relative density of the composites was determined by Archimedes’ method. The hardness of the sintered TiC–Cu composites was measured using a Vickers hardness instrument (Mitutoyo MVK-H1 Hardness Testing Machine, Mitutoyo, Japan) under a load of 100 g.
3. Results and Discussion
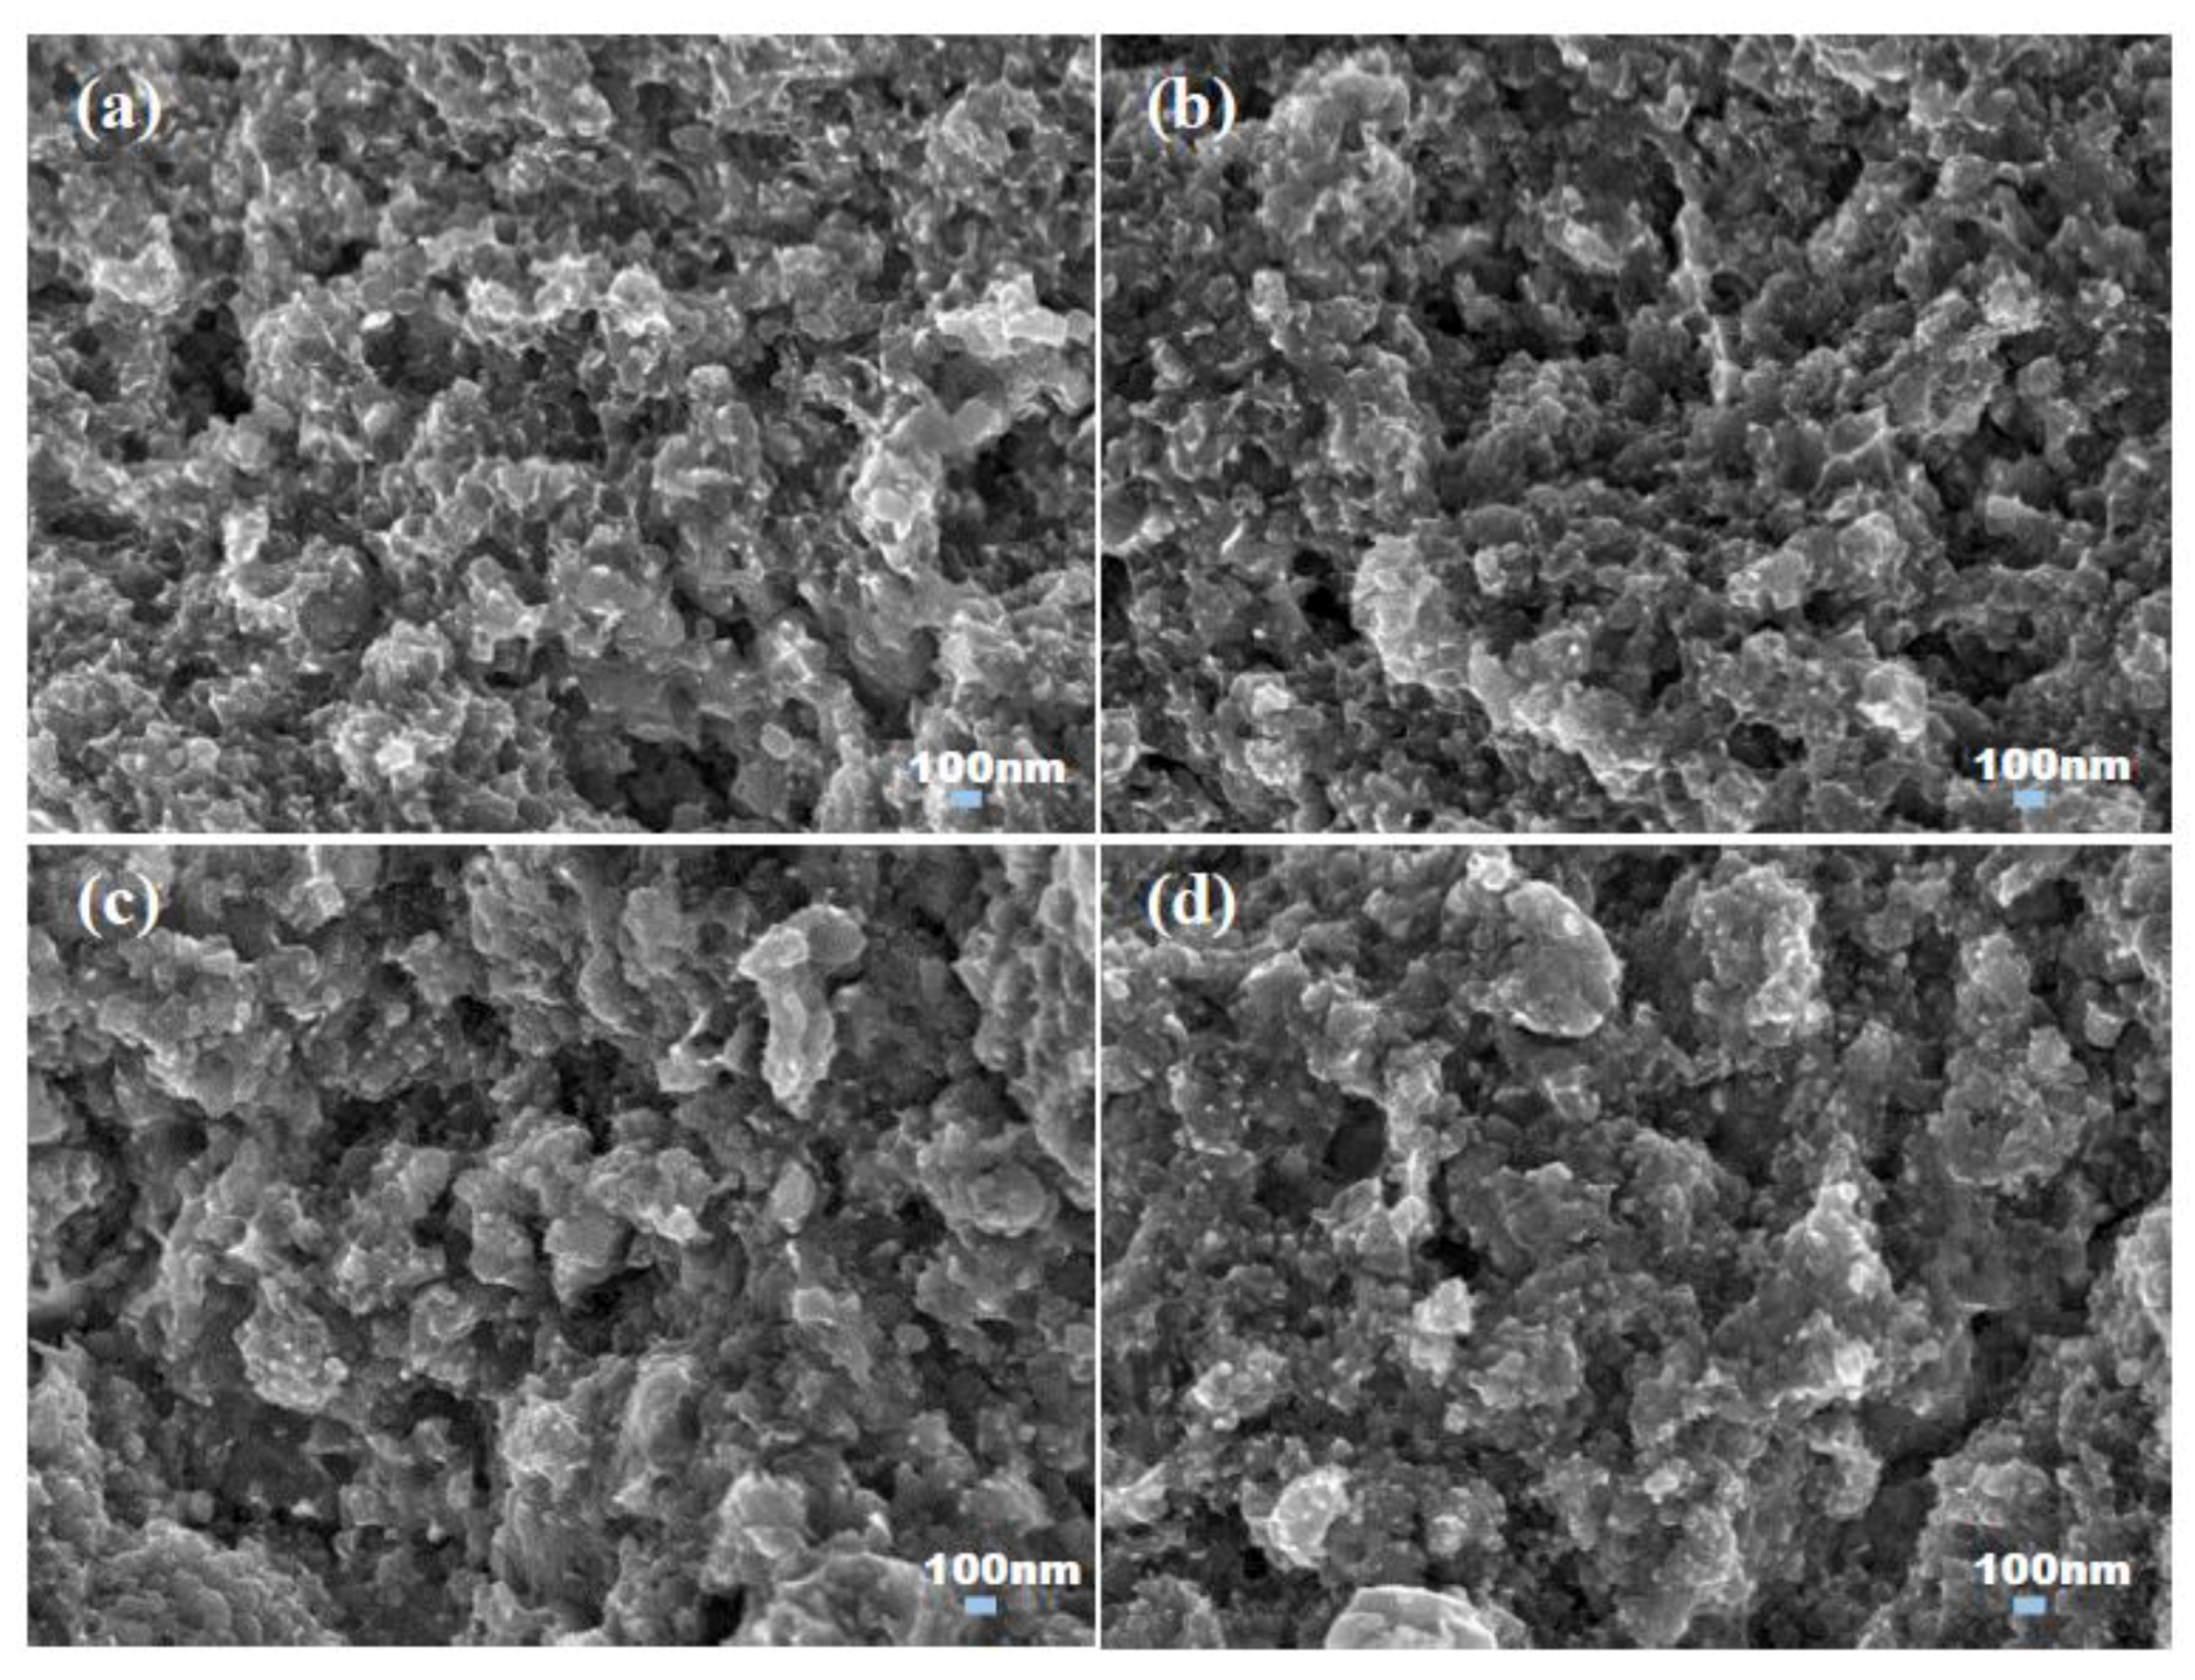
Mechanical milling of the TiC–Cu powder mixtures resulted in the formation of composite agglomerates. The SEM images showing the morphology of the agglomerates of nanocomposites A and B containing 20 and 30 vol % of TiC are presented in Figure 1. With increasing TiC content from 20 to 30 vol %, the size of the agglomerates decreased in both nanocomposites. The agglomerates of nanocomposite B were finer than those of nanocomposite A at the same TiC content. Most of the particles of nanocomposite B were smaller than 10 µm, as can be seen from the SEM images shown in Figure 2. Some large particles were formed due to agglomeration of small particles, reaching a size of 10–30 µm.
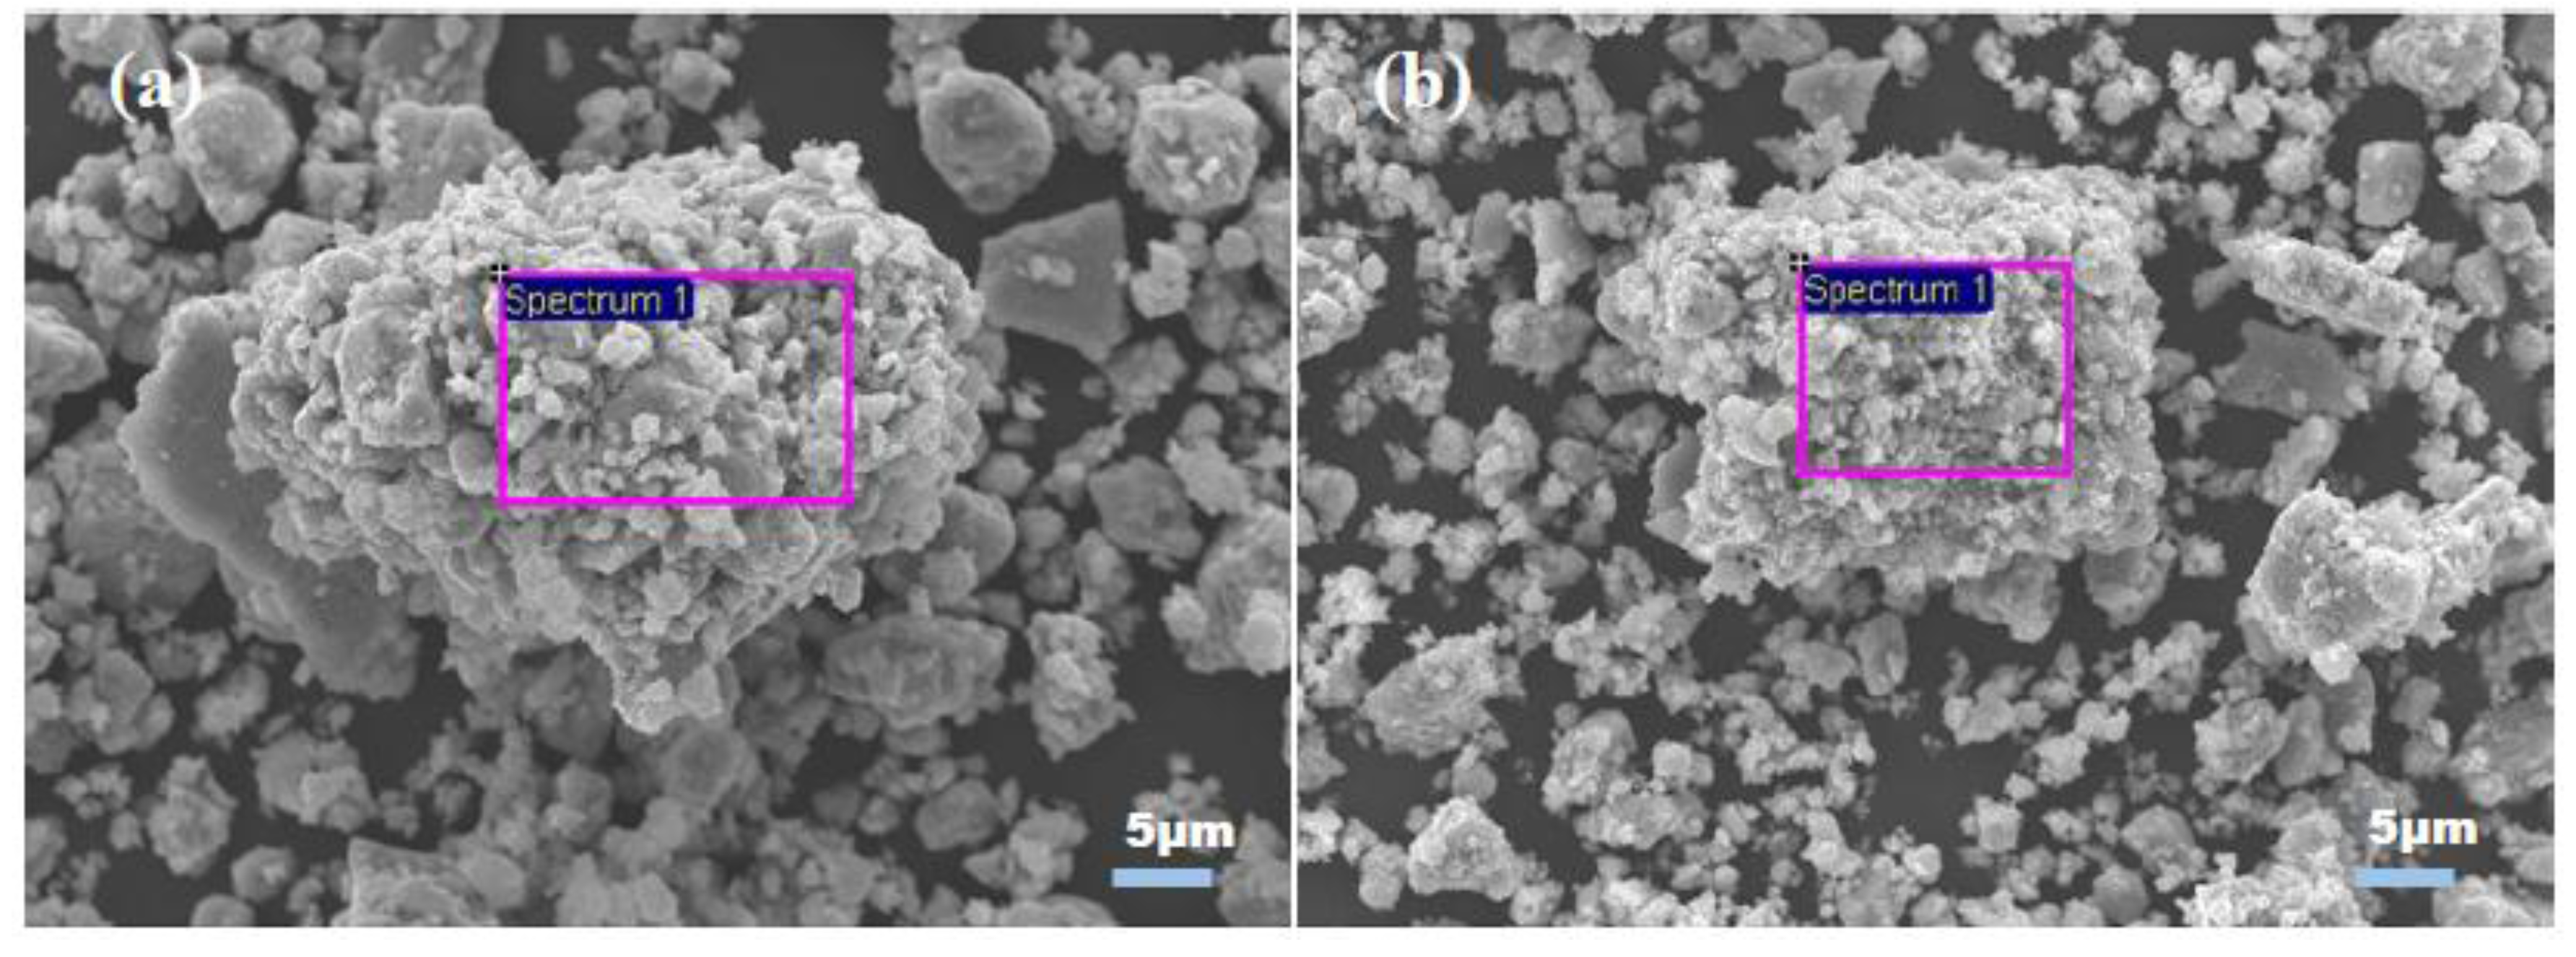
In the ball-milled powders, iron was detected by the EDS analysis (Table 1). The rectangles in the micrographs shown in Figure 2 mark the areas analyzed by the EDS. The presence of iron was due to contamination of the powders from the milling vials and balls. The measured concentrations of iron were much smaller than those detected in the powders subjected to treatment in a horizontal miller [19].
Figure 3 shows the XRD patterns of nanocomposites A and B containing 20 vol % TiC spark plasma sintered at 800 and 900 °C. After sintering, the nanocomposites retained the phase composition of the ball-milled powder mixtures and consisted of two phases, Cu and TiC, as no chemical reaction took place between Cu and TiC. No copper oxides were found in the sintered nanocomposites. The values of the lattice parameters of TiC and Cu are presented in Table 2, Table 3, Table 4 and Table 5. The lattice parameter values obtained from each crystallographic plane were plotted against the Nelson–Riley function f(θ) [20]:
where θ is Bragg’s angle. In this manner, a straight line was obtained. The value of the lattice parameter was estimated by extrapolating the straight line to f(θ) = 0. The obtained values of the lattice parameter of TiC were 4.312 Å and 4.306 Å for nanocomposites A and B, respectively. These values are only slightly smaller than the value reported in the Joint Committee on Powder Diffraction Standards file (JCPDS 311400)—4.33 Å. The values of the lattice parameter of Cu in nanocomposites A and B were 3.613 Å and 3.616 Å, respectively. These values agree with that reported in JCPDS 040836 file (3.615 Å). Good agreement of the calculated lattice parameters with those of pure TiC and Cu phases indicate the absence of any chemical interactions or compositional changes in the phases during sintering.
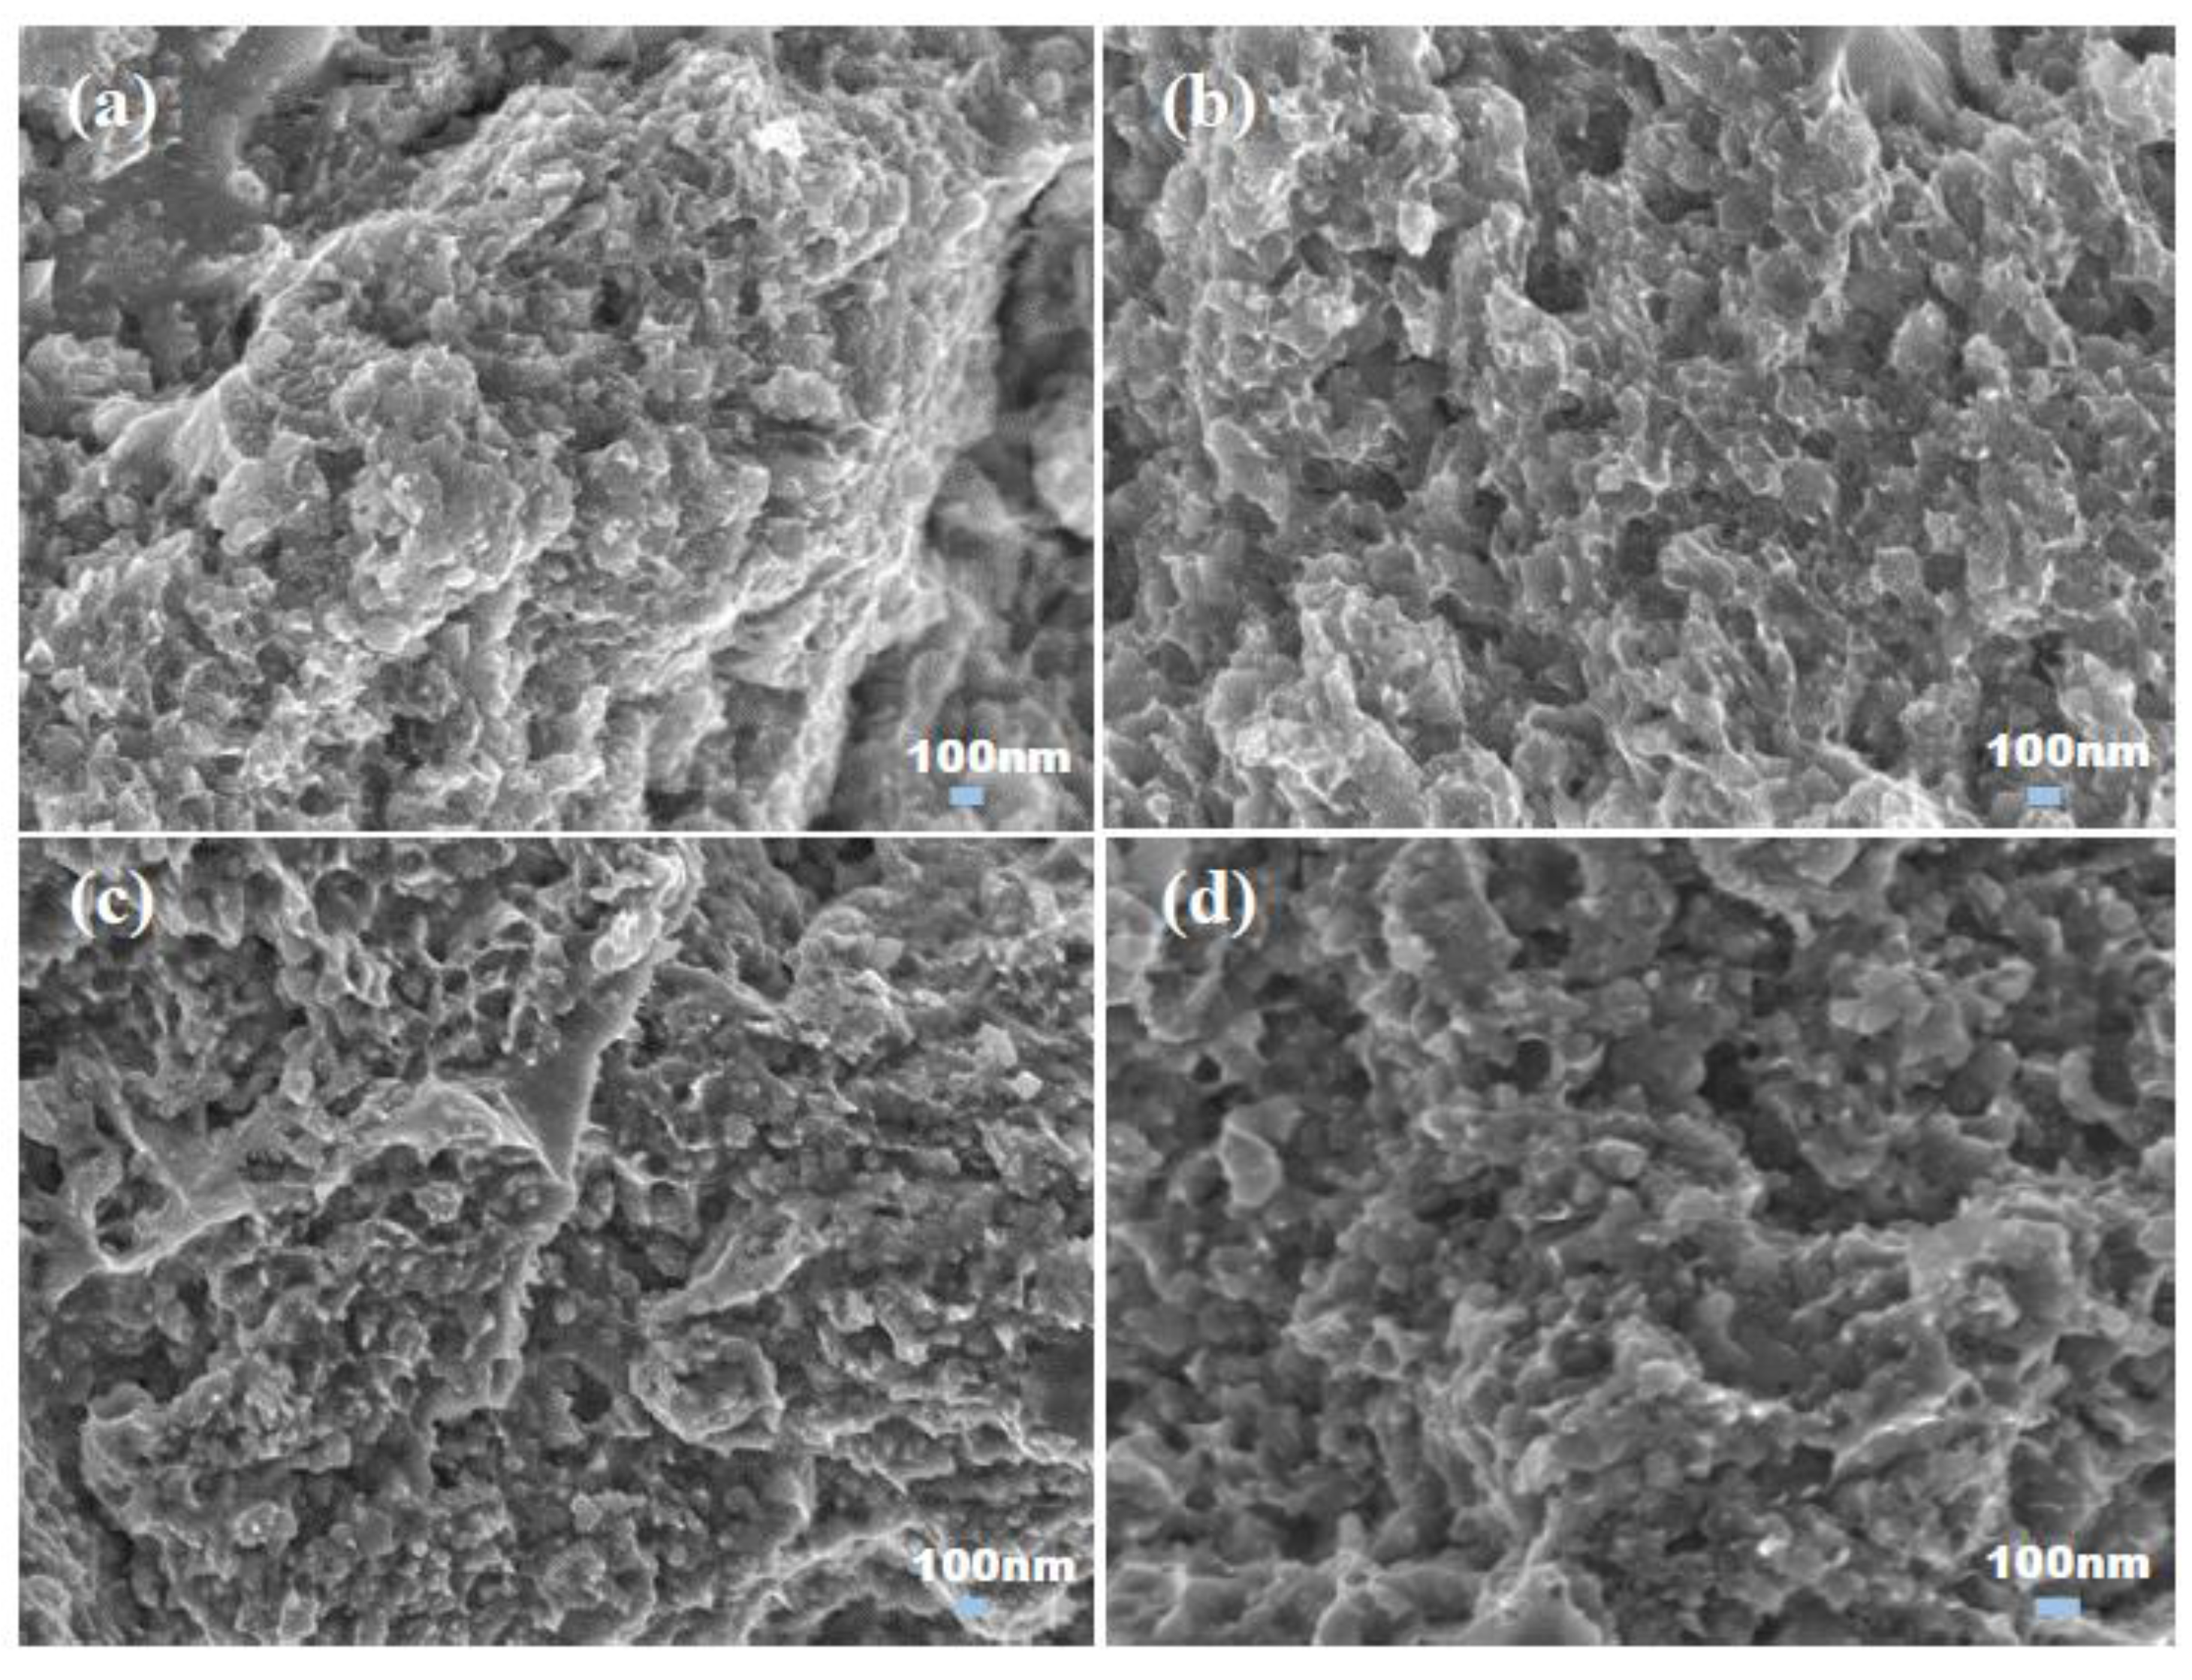
The fracture surfaces of nanocomposites A and B sintered at 800 °C and 900 °C are shown in Figure 4 and Figure 5. The sintered nanocomposites fractured in a ductile mode. The relative densities of nanocomposites A and B increase slightly with an increase in the sintering temperature from 800 to 900 °C (Table 6). As the concentration of TiC increased from 20 to 30 vol %, the relative densities of the nanocomposites decreased. A similar effect was reported by Reddy et al. for the TiC–Cu composites produced by microwave processing [21].
The hardness values of nanocomposites A and B are presented in Table 7. For all concentrations of TiC and sintering temperatures studied, nanocomposite B showed higher hardness than nanocomposite A. An increase in the content of TiC from 20 to 30 vol % in nanocomposite A sintered at 900 °C resulted in an increase in the hardness from 284 to 315 HV. Such an increase can be expected because hard particulate reinforcements act as barriers to the dislocation movement within the copper matrix. In the case of nanocomposite B, an increase in the TiC content led to a slight decrease in the hardness. Indeed, TiC particles can easily agglomerate to form clusters [22]. The agglomeration phenomena can cause deterioration of the mechanical properties of the metal matrix composites. The actual inter-particles distances become larger than the distances expected without the particle agglomeration. As a result, the contribution of the Orowan mechanism to the total strengthening decreases. The hardness values of composites B sintered at 900 °C decreased from 347 to 337 HV as the TiC content increased from 20 to 30 vol %.
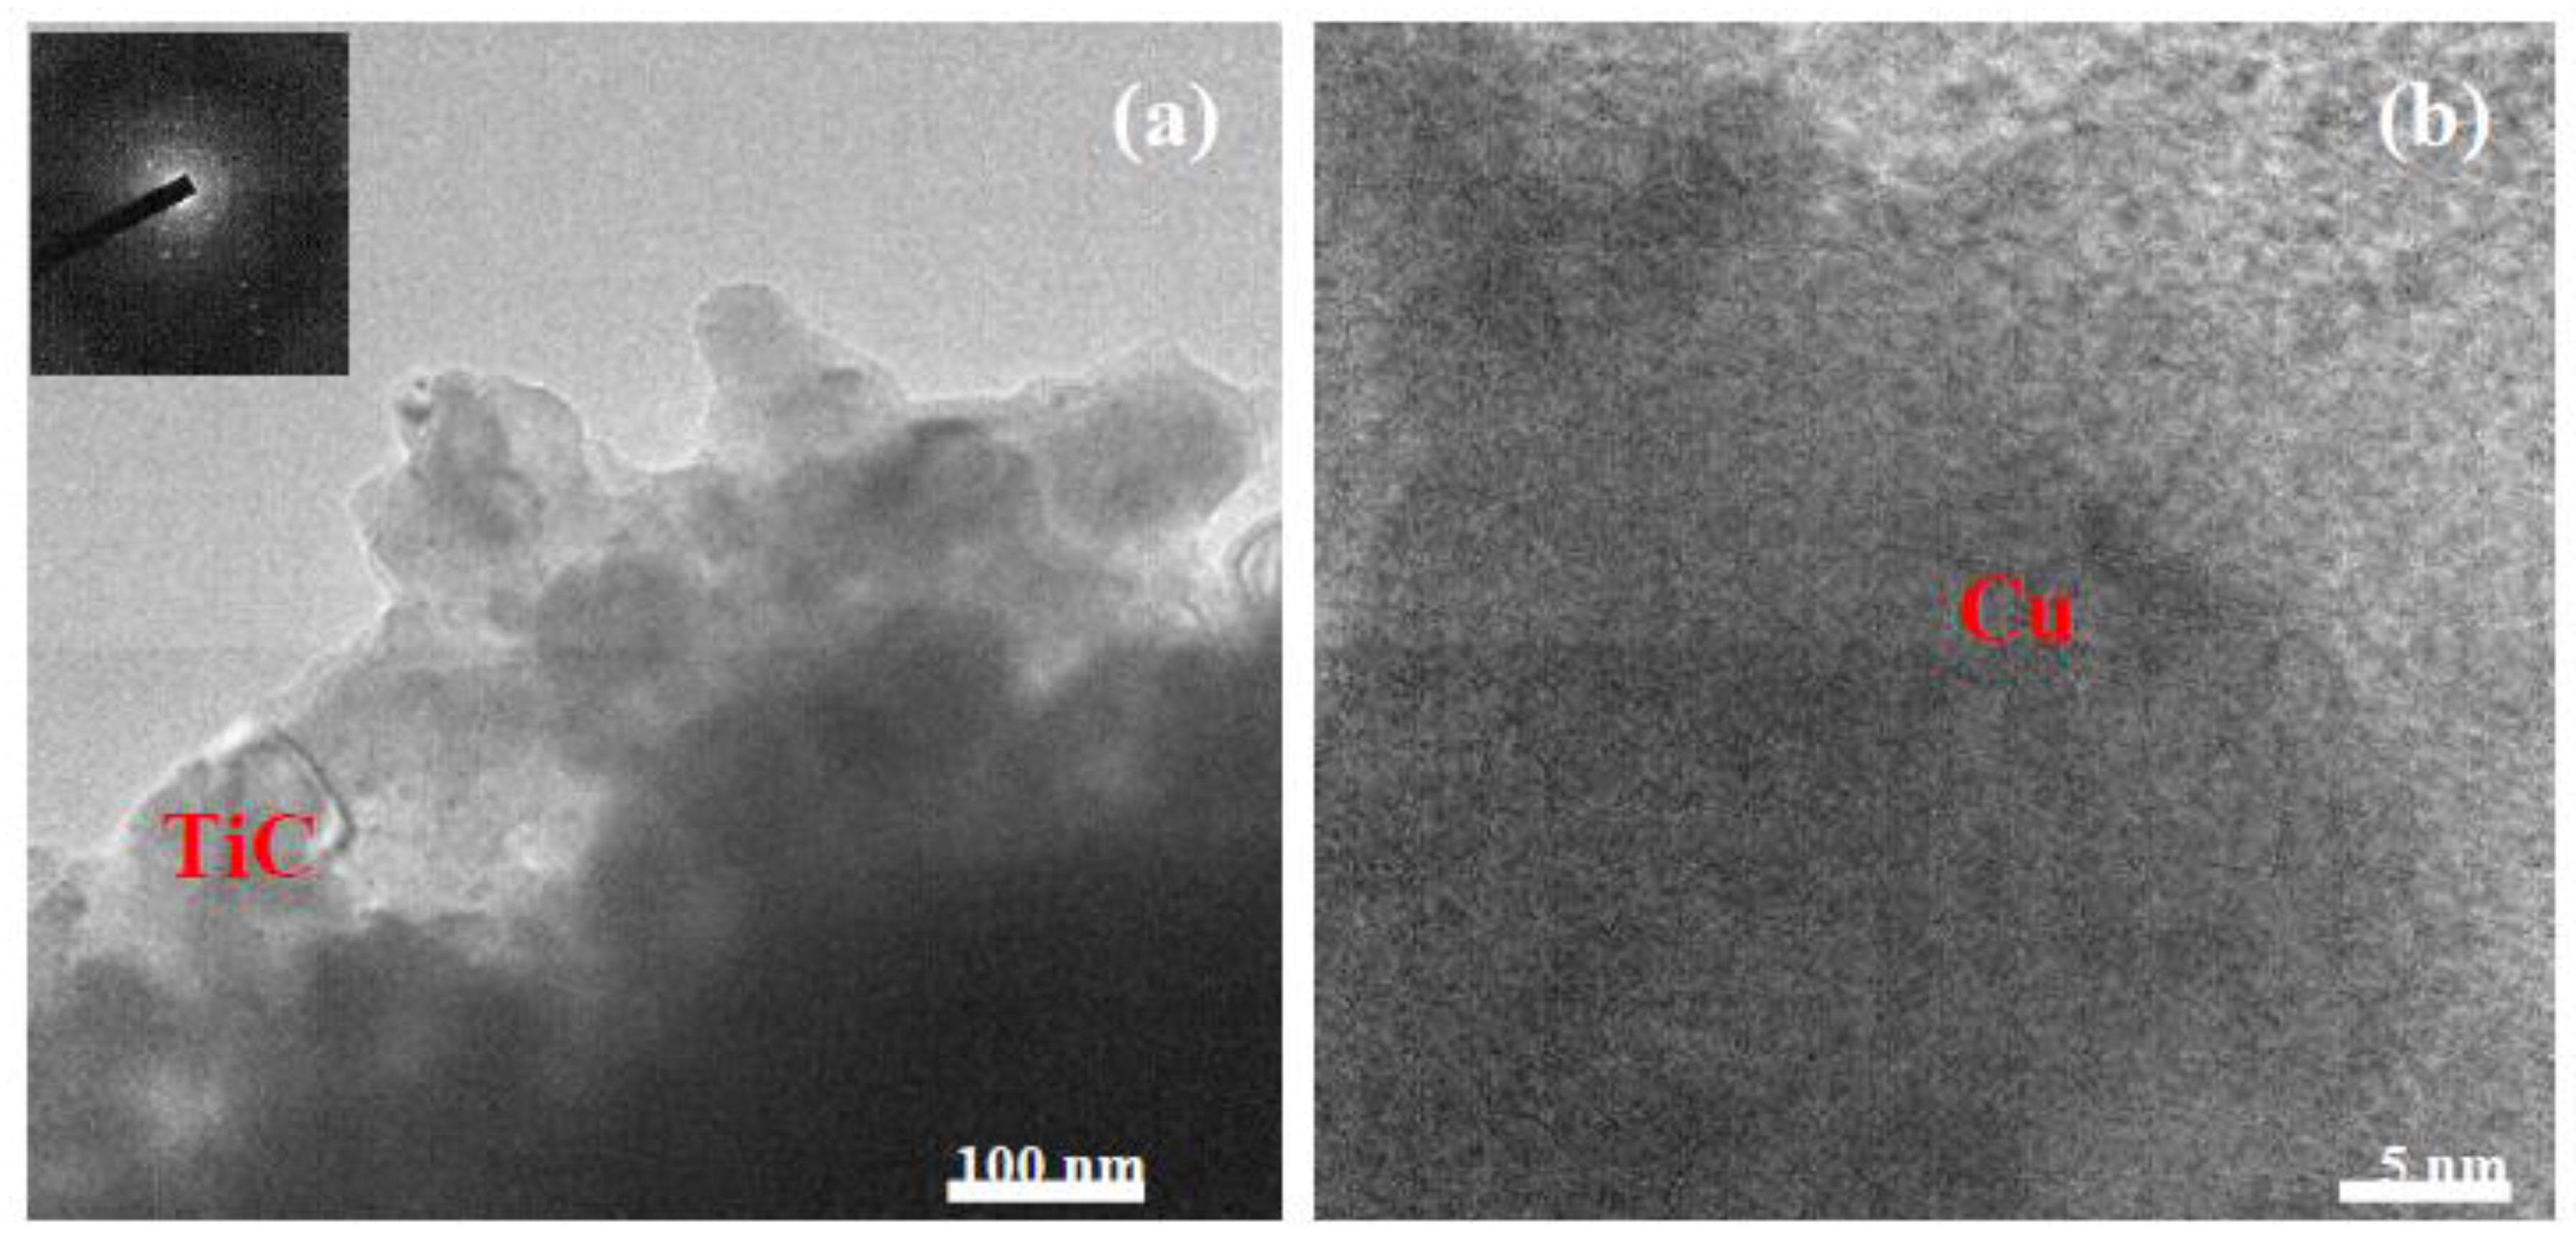
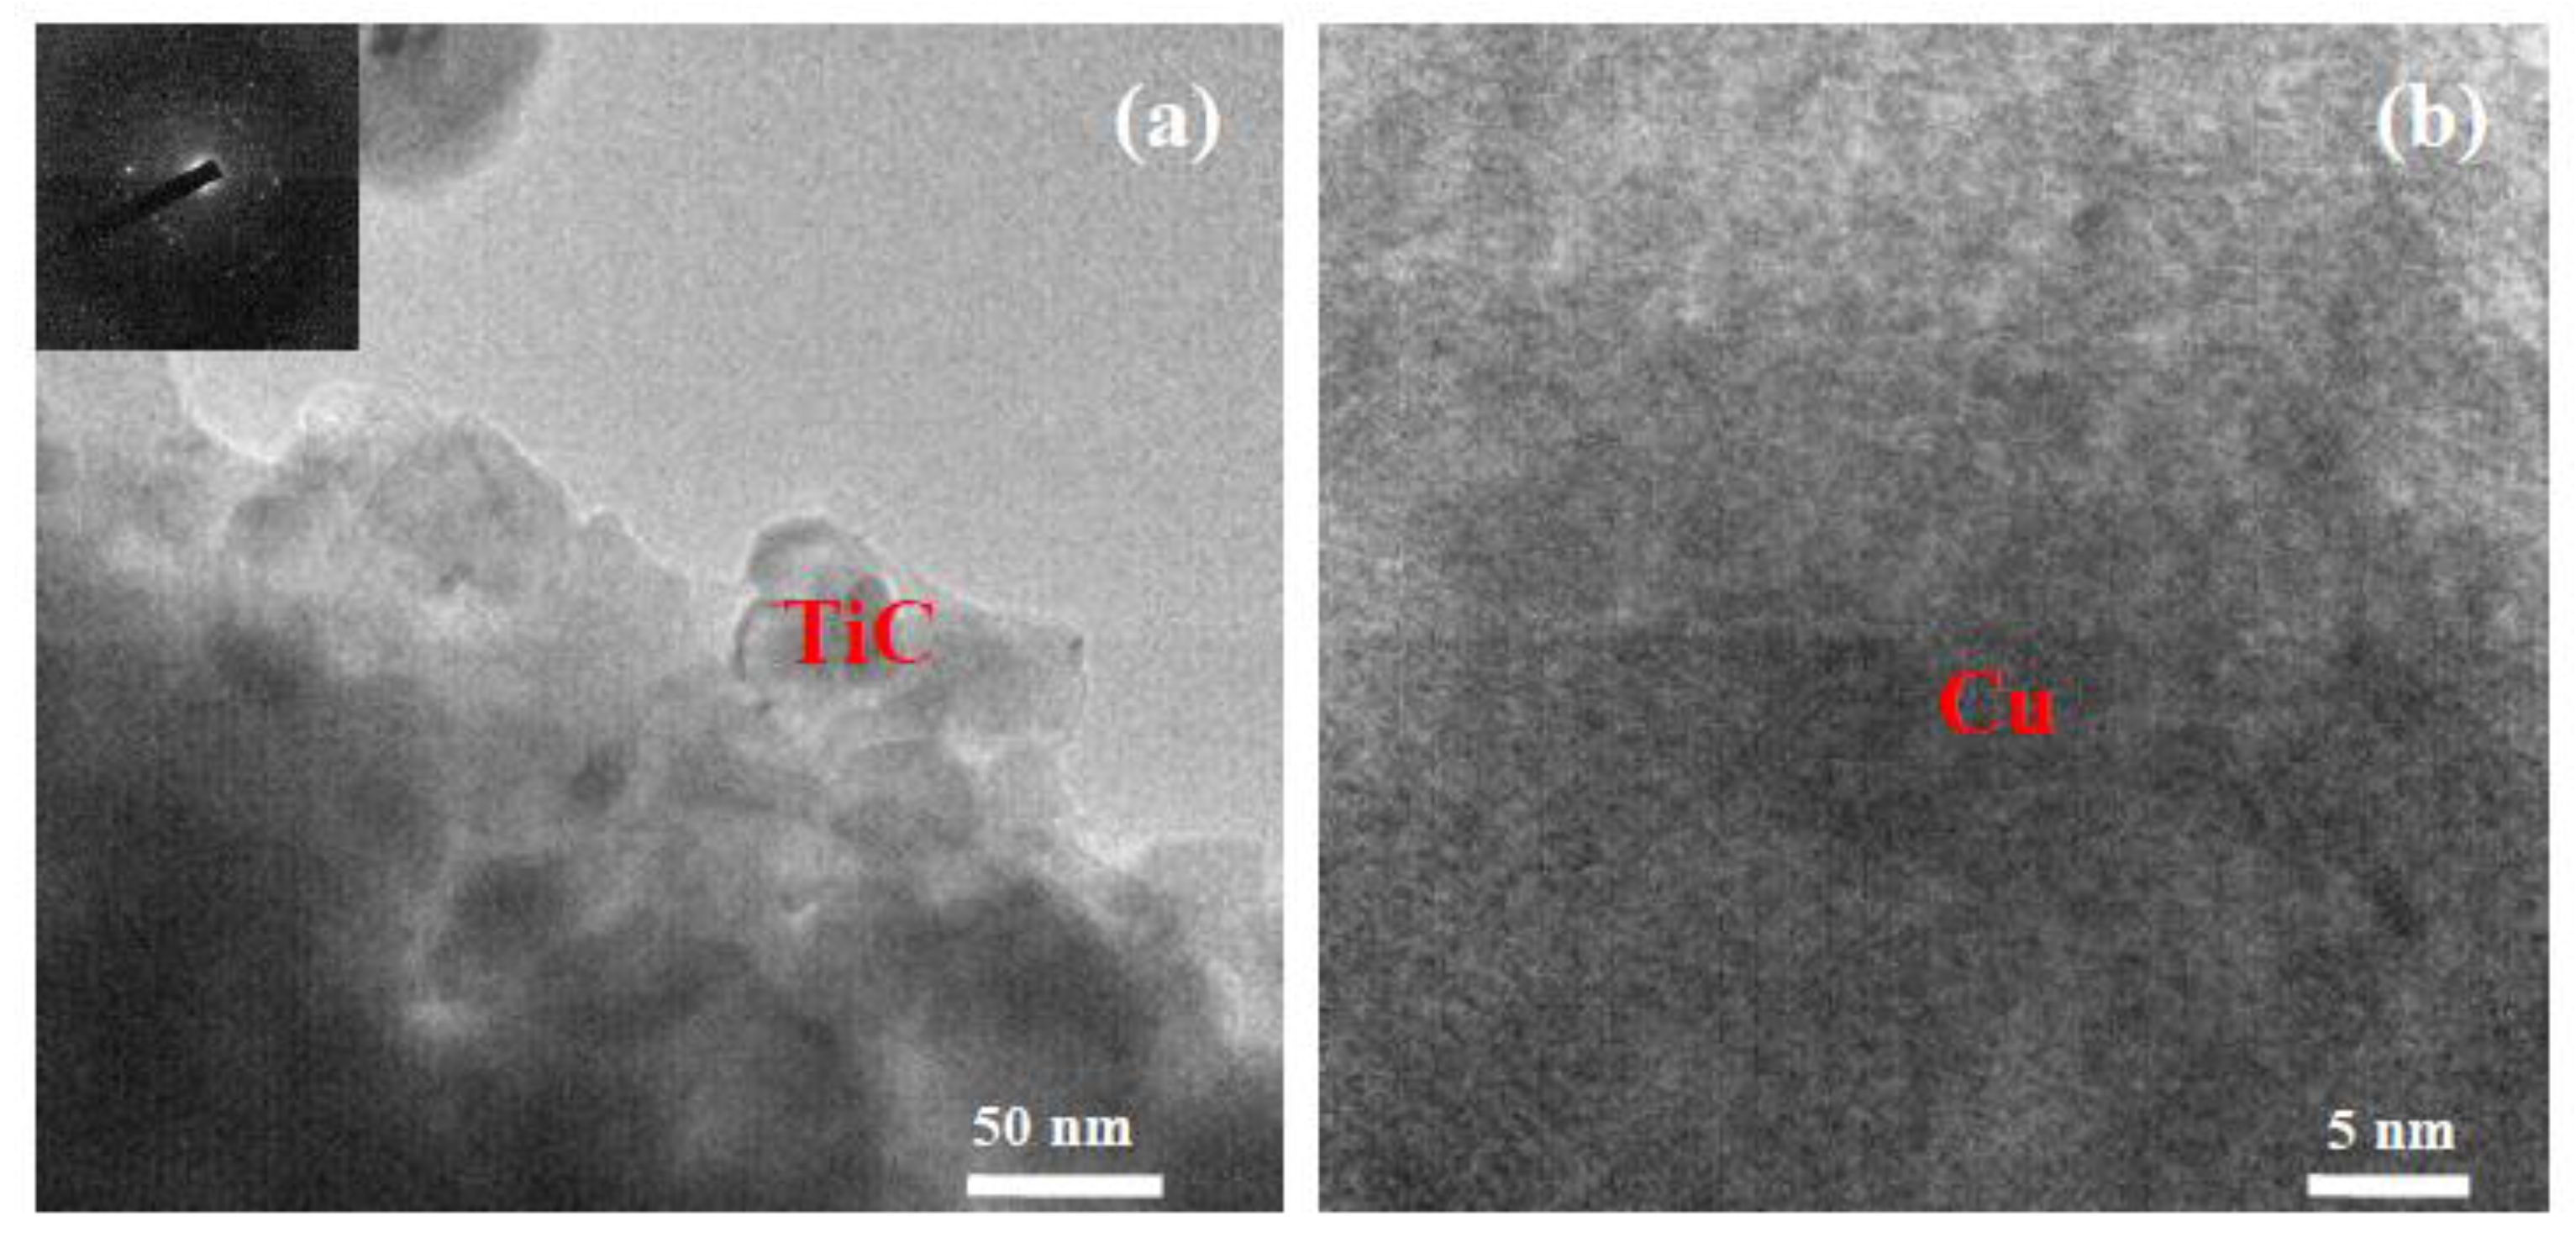
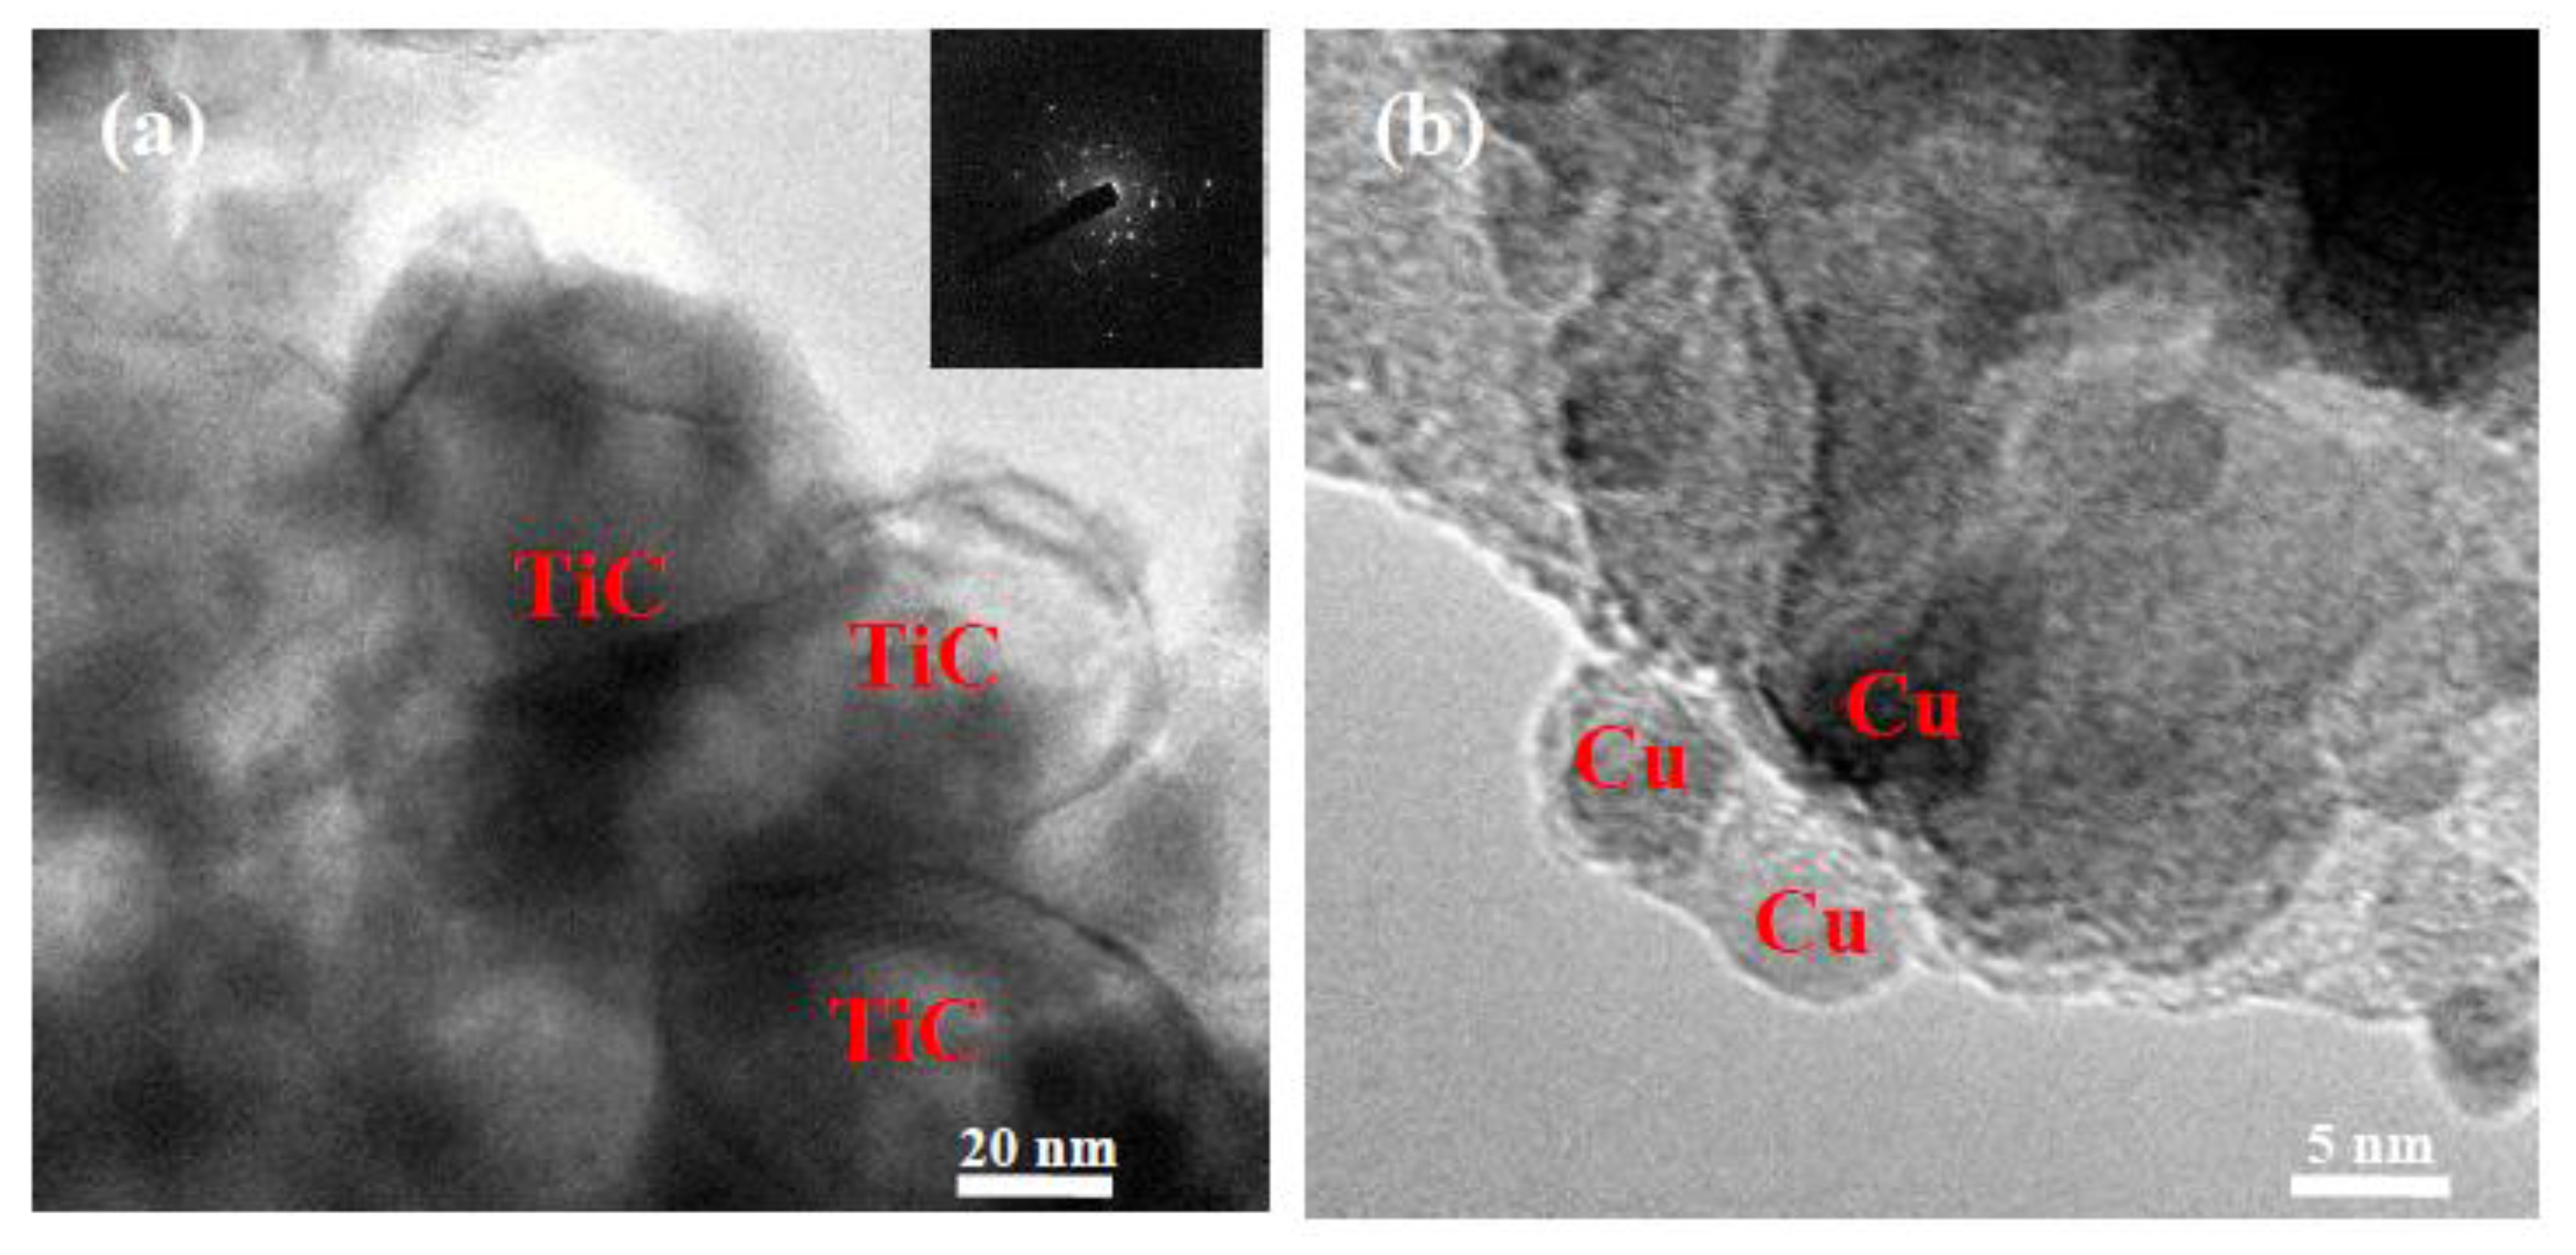
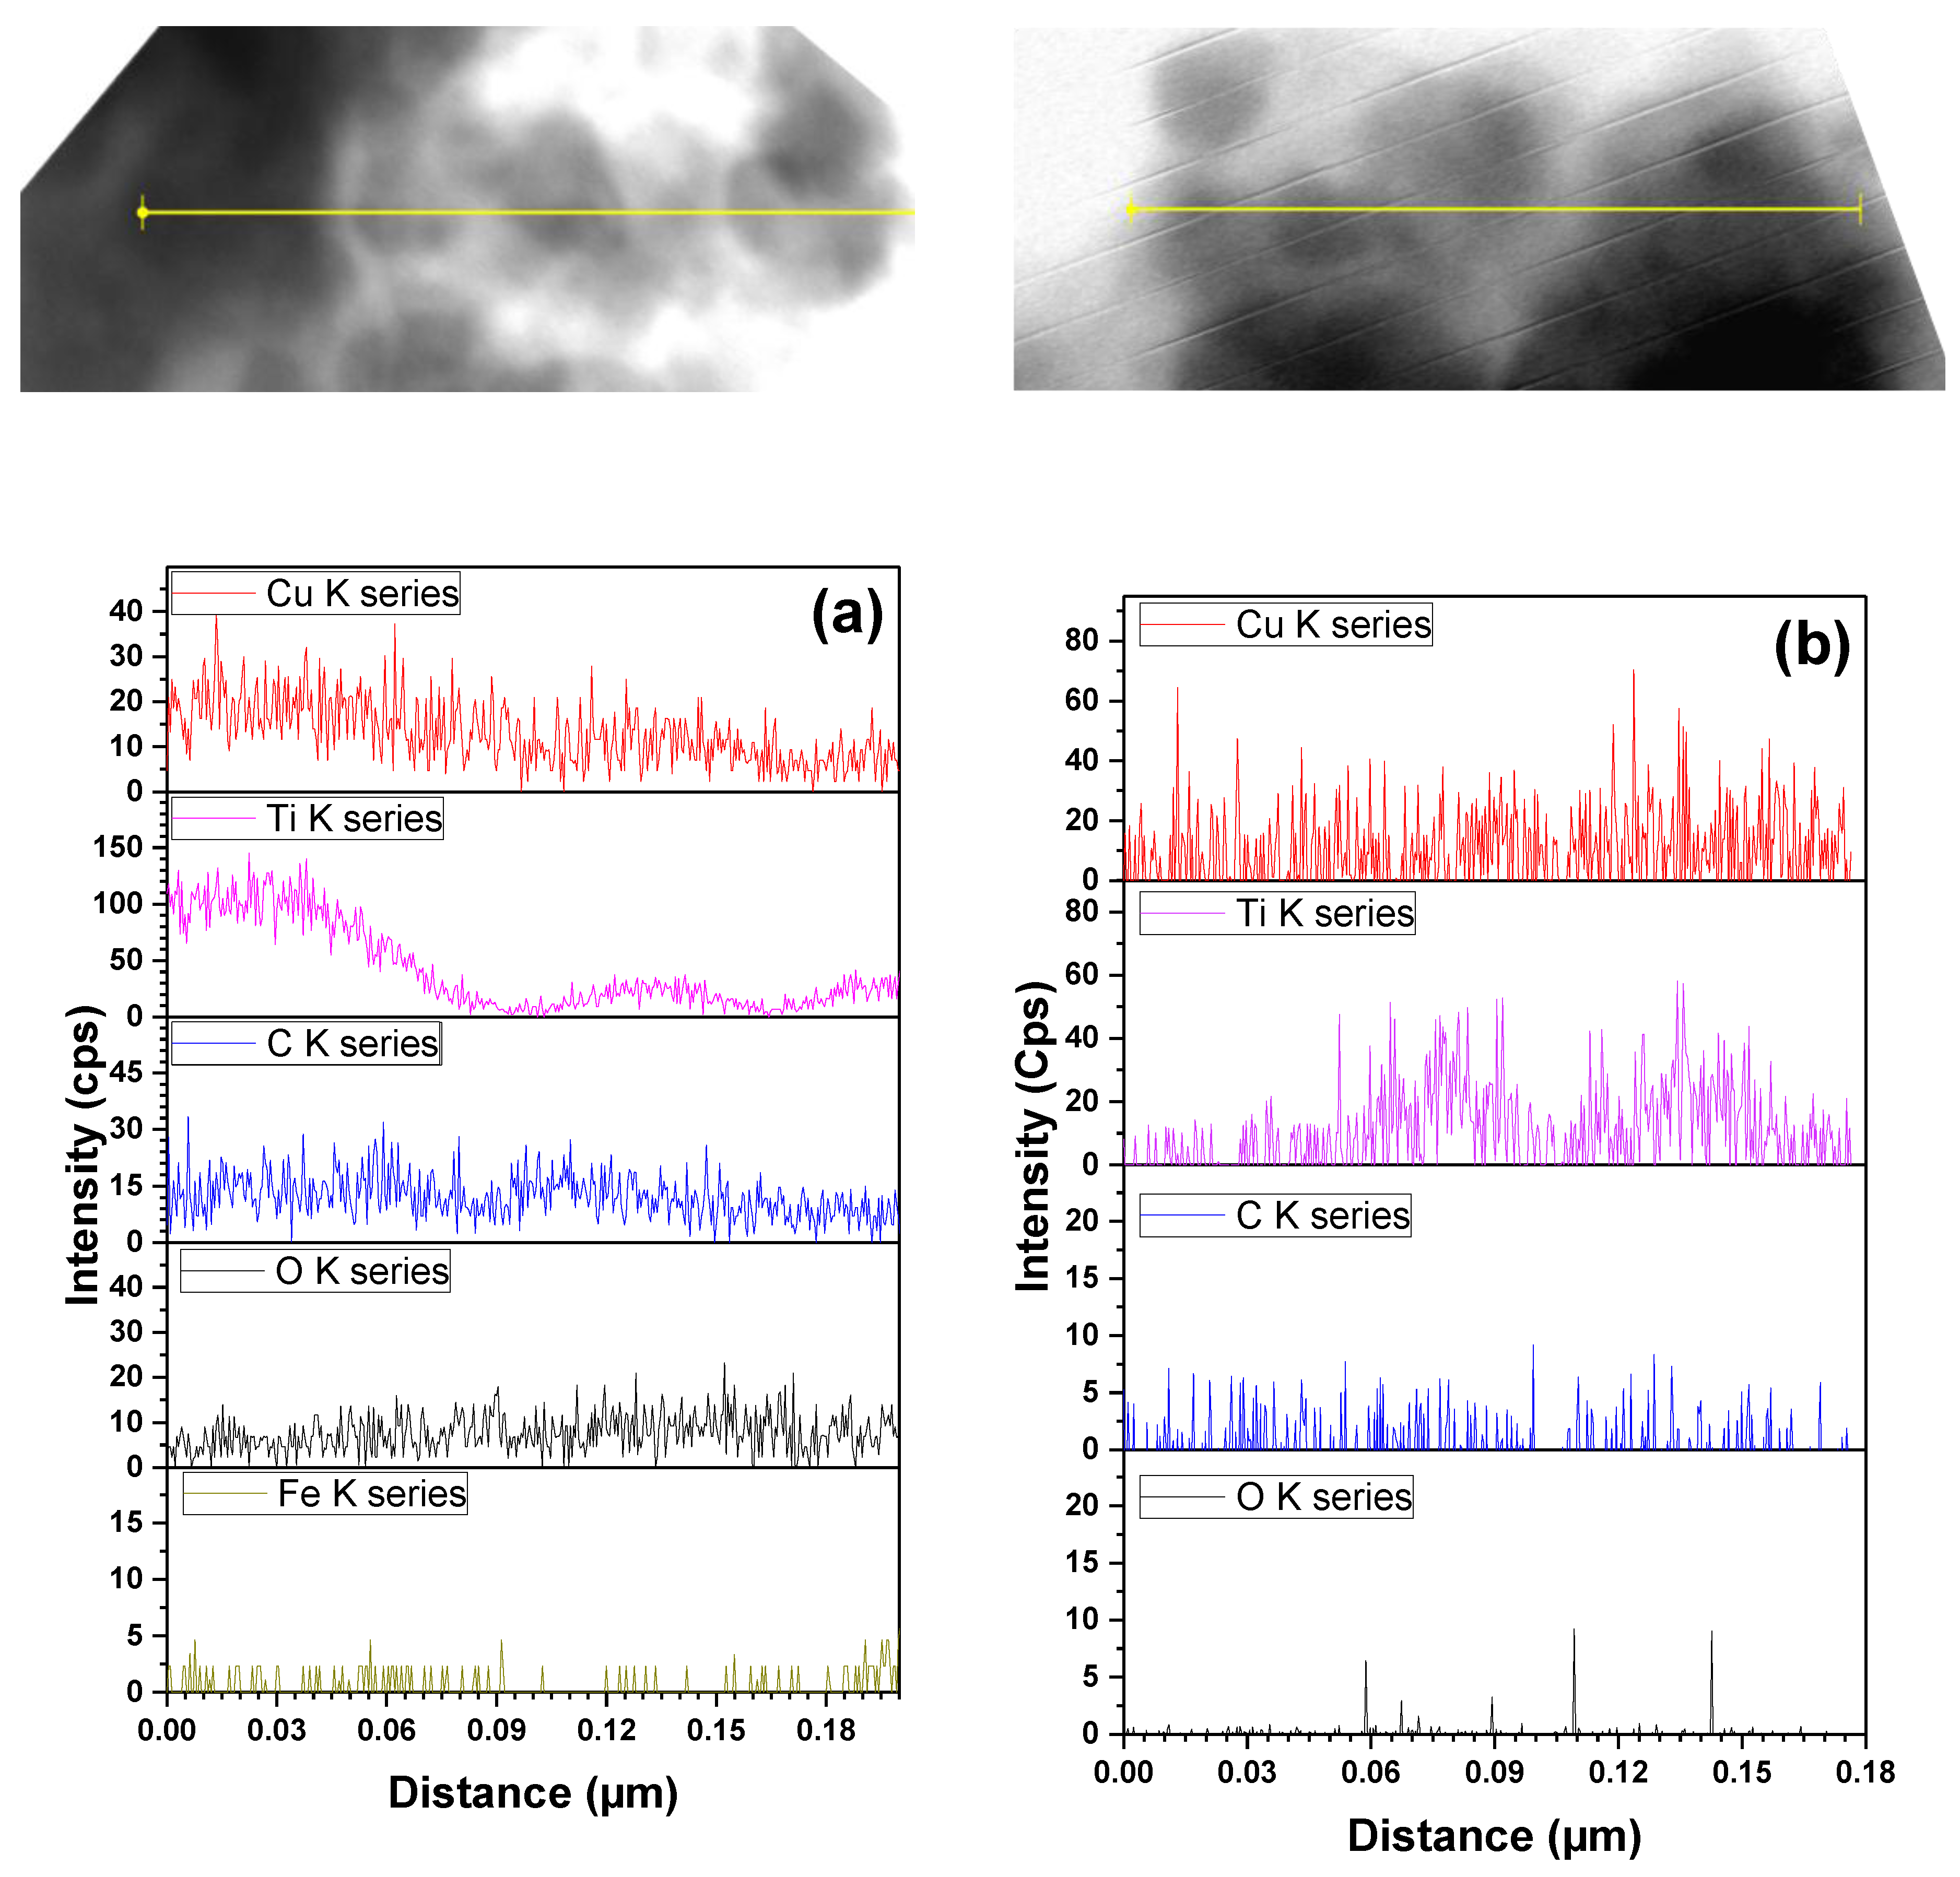
The microstructure of the nanocomposites observed by TEM is presented in Figure 6, Figure 7, Figure 8 and Figure 9. Figure 6a shows a bright-field TEM micrograph of nanocomposite A sintered at 900 °C. It can be seen that TiC nanoparticles are dispersed in the copper matrix. The average crystallite size of copper was about 15 nm, as can be observed from a high-resolution TEM (HRTEM) image in Figure 6b. The selected-area diffraction pattern (SADP) inserted in Figure 6a corresponds to the TiC phase. A similar microstructure can be seen in nanocomposite B, having the same TiC content (Figure 8a,b). The crystallite size of copper in nanocomposite B of the 20 vol % TiC–Cu composition was about 10 nm. In nanocomposites containing 30 vol % of TiC (Figure 7a,b and Figure 9a,b), the crystallite size of Cu was 10 nm (nanocomposite A) and 5 nm (nanocomposite B). So, an increase in the content of the TiC nanoparticles in the copper matrix resulted in a decrease in the size of the copper crystallites in the sintered composites. Indeed, TiC nanoparticles have been shown to restrict grain growth of the copper matrix during sintering [23]. An additional confirmation of good dispersion of the TiC nanoparticles in the copper matrix in the sintered nanocomposites is presented in Figure 10, which shows scanning TEM images and the corresponding EDS profiles of nanocomposites A and B of the 20 vol % TiC–Cu composition: the size of the “waves” on the Ti concentration profiles along the x-axis (distance) corresponds well to the size of the TiC nanoparticles introduced into the copper matrix through ball milling.
As the relative densities of the nanocomposites obtained from two kinds of the copper powder did not show significant differences, it can be concluded that the reason for the nanocomposites produced using the copper nanopowder being harder is a lower crystallite size of the copper matrix preserved in the sintered state compared with the nanocomposites obtained using the micrometer-sized copper powder, as was confirmed by TEM.
4. Conclusions
In this study, TiC–Cu nanocomposites containing 20 and 30 vol % of titanium carbide were obtained by ball milling and SPS using two copper powders with different particle sizes (75 µm and 40 nm) and a TiC nanopowder. In the compacts sintered at 800–900 °C, relative densities of 95.0%–96.5% were achieved. The presence of Cu and TiC as the only phases in the composites was confirmed by the XRD phase analysis. No copper oxides were found in the sintered nanocomposites. The microstructure and hardness of the nanocomposites were investigated depending on the sintering temperature, TiC content, and the particle size of the starting copper powder. Nanocomposites obtained using the 40-nm copper powder showed higher hardness than those obtained using the 75-µm copper powder. The reason for a higher hardness of the TiC–Cu nanocomposites produced using the copper nanopowder was a lower crystallite size of the copper matrix in these composites compared with those obtained from the micrometer-sized copper powder.
Acknowledgments
This research was funded by Vietnam National Foundation for Science and Technology Development (NAFOSTED), grant number 103.02-2011.49.
Author Contributions
Oanh Nguyen Thi Hoang and Viet Nguyen Hoang designed the research, conducted the experiments, and prepared the draft manuscript, Ji-Soon Kim and Dina V. Dudina supervised the project and participated in the discussions, all authors reviewed the manuscript.
Conflicts of Interest
The authors declare no conflict of interest.
References
- Rathod, S.; Modi, O.P.; Prasad, B.K.; Chrysanthou, A.; Vallauri, D.; Deshmukh, V.P.; Shah, A.K. Cast in situ Cu–TiC composites: Synthesis by SHS route and characterization. Mater. Sci. Eng. A 2009, 502, 91–98. [Google Scholar] [CrossRef]
- Palma, R.H.; Sepúlveda, A.O. Creep behavior of two Cu-2 vol % TiC alloys obtained by reaction milling and extrusion. Mater. Sci. Eng. A 2013, 588, 82–85. [Google Scholar] [CrossRef]
- Nemati, N.; Khosroshahi, R.; Emamy, M.; Zolriasatein, A. Investigation of microstructure, hardness and wear properties of Al–4.5 wt % Cu–TiC nanocomposites produced by mechanical milling. Mater. Des. 2011, 32, 3718–3729. [Google Scholar] [CrossRef]
- Akhtar, F.; Askari, S.J.; Shah, K.A.; Du, X.; Guo, S. Microstructure, mechanical properties, electrical conductivity and wear behavior of high volume tic reinforced cu-matrix composites. Mater. Charact. 2009, 60, 327–336. [Google Scholar] [CrossRef]
- Kim, J.S.; Dudina, D.V.; Kim, J.C.; Kwon, Y.S.; Park, J.J.; Rhee, C.K. Properties of Cu-based nanocomposites produced by mechanically-activated self-propagating high-temperature synthesis and spark-plasma sintering. J. Nanosci. Nanotechnol. 2010, 10, 252–257. [Google Scholar] [CrossRef] [PubMed]
- Mula, S.; Panigrahi, J.; Kang, P.C.; Koch, C.C. Effect of microwave sintering over vacuum and conventional sintering of Cu based nanocomposites. J. Alloys Compd. 2014, 588, 710–715. [Google Scholar] [CrossRef]
- Jarfors, A.E.W. Solubility of copper in titanium carbide. Mater. Sci. Technol. 1996, 12, 990–994. [Google Scholar] [CrossRef]
- Ni, S.; Jiang, J.; Chen, J.; Song, D.; Ma, A. Microstructure and properties of in-situ synthesized Cu-1 wt % TiC alloy followed by ECAP and post-annealing. Prog. Nat. Sci. Mater. Int. 2016, 26, 643–649. [Google Scholar] [CrossRef]
- Liang, Y.H.; Wang, H.Y.; Yang, Y.F.; Wang, Y.Y.; Jiang, Q.C. Evolution process of the synthesis of TiC in the Cu–Ti–C system. J. Alloys Compd. 2008, 452, 298–303. [Google Scholar] [CrossRef]
- Karbalaei Akbari, M.; Rajabi, S.; Shirvanimoghaddam, K.; Baharvandi, H.R. Wear and friction behavior of nanosized TiB2 and TiO2 particle-reinforced casting A356 aluminum nanocomposites: A comparative study focusing on particle capture in matrix. J. Compos. Mater. 2015, 49, 3665–3681. [Google Scholar] [CrossRef]
- Shirvanimoghaddam, K.; Hamim, S.U.; Karbalaei Akbari, M.; Fakhrhoseini, S.M.; Khayyam, H.; Pakseresht, A.H.; Ghasali, E.; Zabet, M.; Munir, K.S.; Jia, S.; et al. Carbon fiber reinforced metal matrix composites: Fabrication processes and properties. Compos. Part A Appl. Sci. Manuf. 2017, 92, 70–96. [Google Scholar] [CrossRef]
- Casati, R.; Vedani, M. Metal matrix composites reinforced by nano-particles—A review. Metals 2014, 4, 65–83. [Google Scholar] [CrossRef]
- Akbari, M.K.; Shirvanimoghaddam, K.; Hai, Z.; Zhuiykov, S.; Khayyam, H. Al-TiB2 micro/nanocomposites: Particle capture investigations, strengthening mechanisms and mathematical modelling of mechanical properties. Mater. Sci. Eng. A 2017, 682, 98–106. [Google Scholar] [CrossRef]
- Munir, Z.A.; Quach, D.V.; Ohyanagi, M. Electric current activation of sintering: A review of the pulsed electric current sintering process. J. Am. Ceram. Soc. 2011, 94, 1–19. [Google Scholar] [CrossRef]
- Tokita, M. CHAPTER 11.2.3—Spark plasma sintering (SPS) method, systems, and applications A2—Somiya, shigeyuki. In Handbook of Advanced Ceramics, 2nd ed.; Academic Press: Oxford, UK, 2013; pp. 1149–1177. [Google Scholar]
- Dudina, D.V.; Mukherjee, A.K. Reactive spark plasma sintering: Successes and challenges of nanomaterial synthesis. J. Nanomater. 2013, 2013, 12. [Google Scholar] [CrossRef]
- Dudina, D.V.; Mali, V.I.; Anisimov, A.G.; Bulina, N.V.; Korchagin, M.A.; Lomovsky, O.I.; Bataev, I.A.; Bataev, V.A. Ti3SiC2-Cu composites by mechanical milling and spark plasma sintering: Possible microstructure formation scenarios. Met. Mater. Int. 2013, 19, 1235–1241. [Google Scholar] [CrossRef]
- Ghasali, E.; Pakseresht, A.H.; Alizadeh, M.; Shirvanimoghaddam, K.; Ebadzadeh, T. Vanadium carbide reinforced aluminum matrix composite prepared by conventional, microwave and spark plasma sintering. J. Alloys Compd. 2016, 688, 527–533. [Google Scholar] [CrossRef]
- Zhuang, J.; Liu, Y.; Cao, Z.; Li, Y. The influence of technological process on dry sliding wear behaviour of titanium carbide reinforcement copper matrix composites. Mater. Trans. 2010, 51, 2311–2317. [Google Scholar] [CrossRef]
- Lemine, O.M. Effect of milling conditions on the formation of ZnFe2O4 nanocrystalline. Int. J. Phys. Sci. 2013, 8, 380–387. [Google Scholar]
- Chandrakanth, R.G.; Rajkumar, K.; Aravindan, S. Fabrication of copper–TiC–graphite hybrid metal matrix composites through microwave processing. Int. J. Adv. Manuf. Technol. 2010, 48, 645–653. [Google Scholar] [CrossRef]
- Maity, P.C.; Panigrahi, S.K. Metal and intermetallic matrix in-situ particle composites. Key Eng. Mater. 1995, 104, 313–328. [Google Scholar] [CrossRef]
- Panda, S.; Dash, K.; Ray, B.C. Processing and properties of Cu based micro- and nano-composites. Bull. Mater. Sci. 2014, 37, 227–238. [Google Scholar] [CrossRef]
Figure 1.
Morphology of the milled TiC–Cu powders (a) 20 vol % TiC, nanocomposite A; (b) 20 vol % TiC, nanocomposite B; (c) 30 vol % TiC, nanocomposite A; and (d) 30 vol % TiC, nanocomposite B (SEM images).
Figure 1.
Morphology of the milled TiC–Cu powders (a) 20 vol % TiC, nanocomposite A; (b) 20 vol % TiC, nanocomposite B; (c) 30 vol % TiC, nanocomposite A; and (d) 30 vol % TiC, nanocomposite B (SEM images).

Figure 2.
Morphology of the milled powders (a) 30 vol % TiC, nanocomposite A; and (b) 30 vol % TiC, nanocomposite B (higher-magnification SEM images; the rectangles mark areas from which energy-dispersive spectroscopy (EDS) spectra were taken).
Figure 2.
Morphology of the milled powders (a) 30 vol % TiC, nanocomposite A; and (b) 30 vol % TiC, nanocomposite B (higher-magnification SEM images; the rectangles mark areas from which energy-dispersive spectroscopy (EDS) spectra were taken).

Figure 3.
XRD patterns of nanocomposite A and nanocomposite B containing 20 vol % TiC sintered at 800 and 900 °C.
Figure 3.
XRD patterns of nanocomposite A and nanocomposite B containing 20 vol % TiC sintered at 800 and 900 °C.
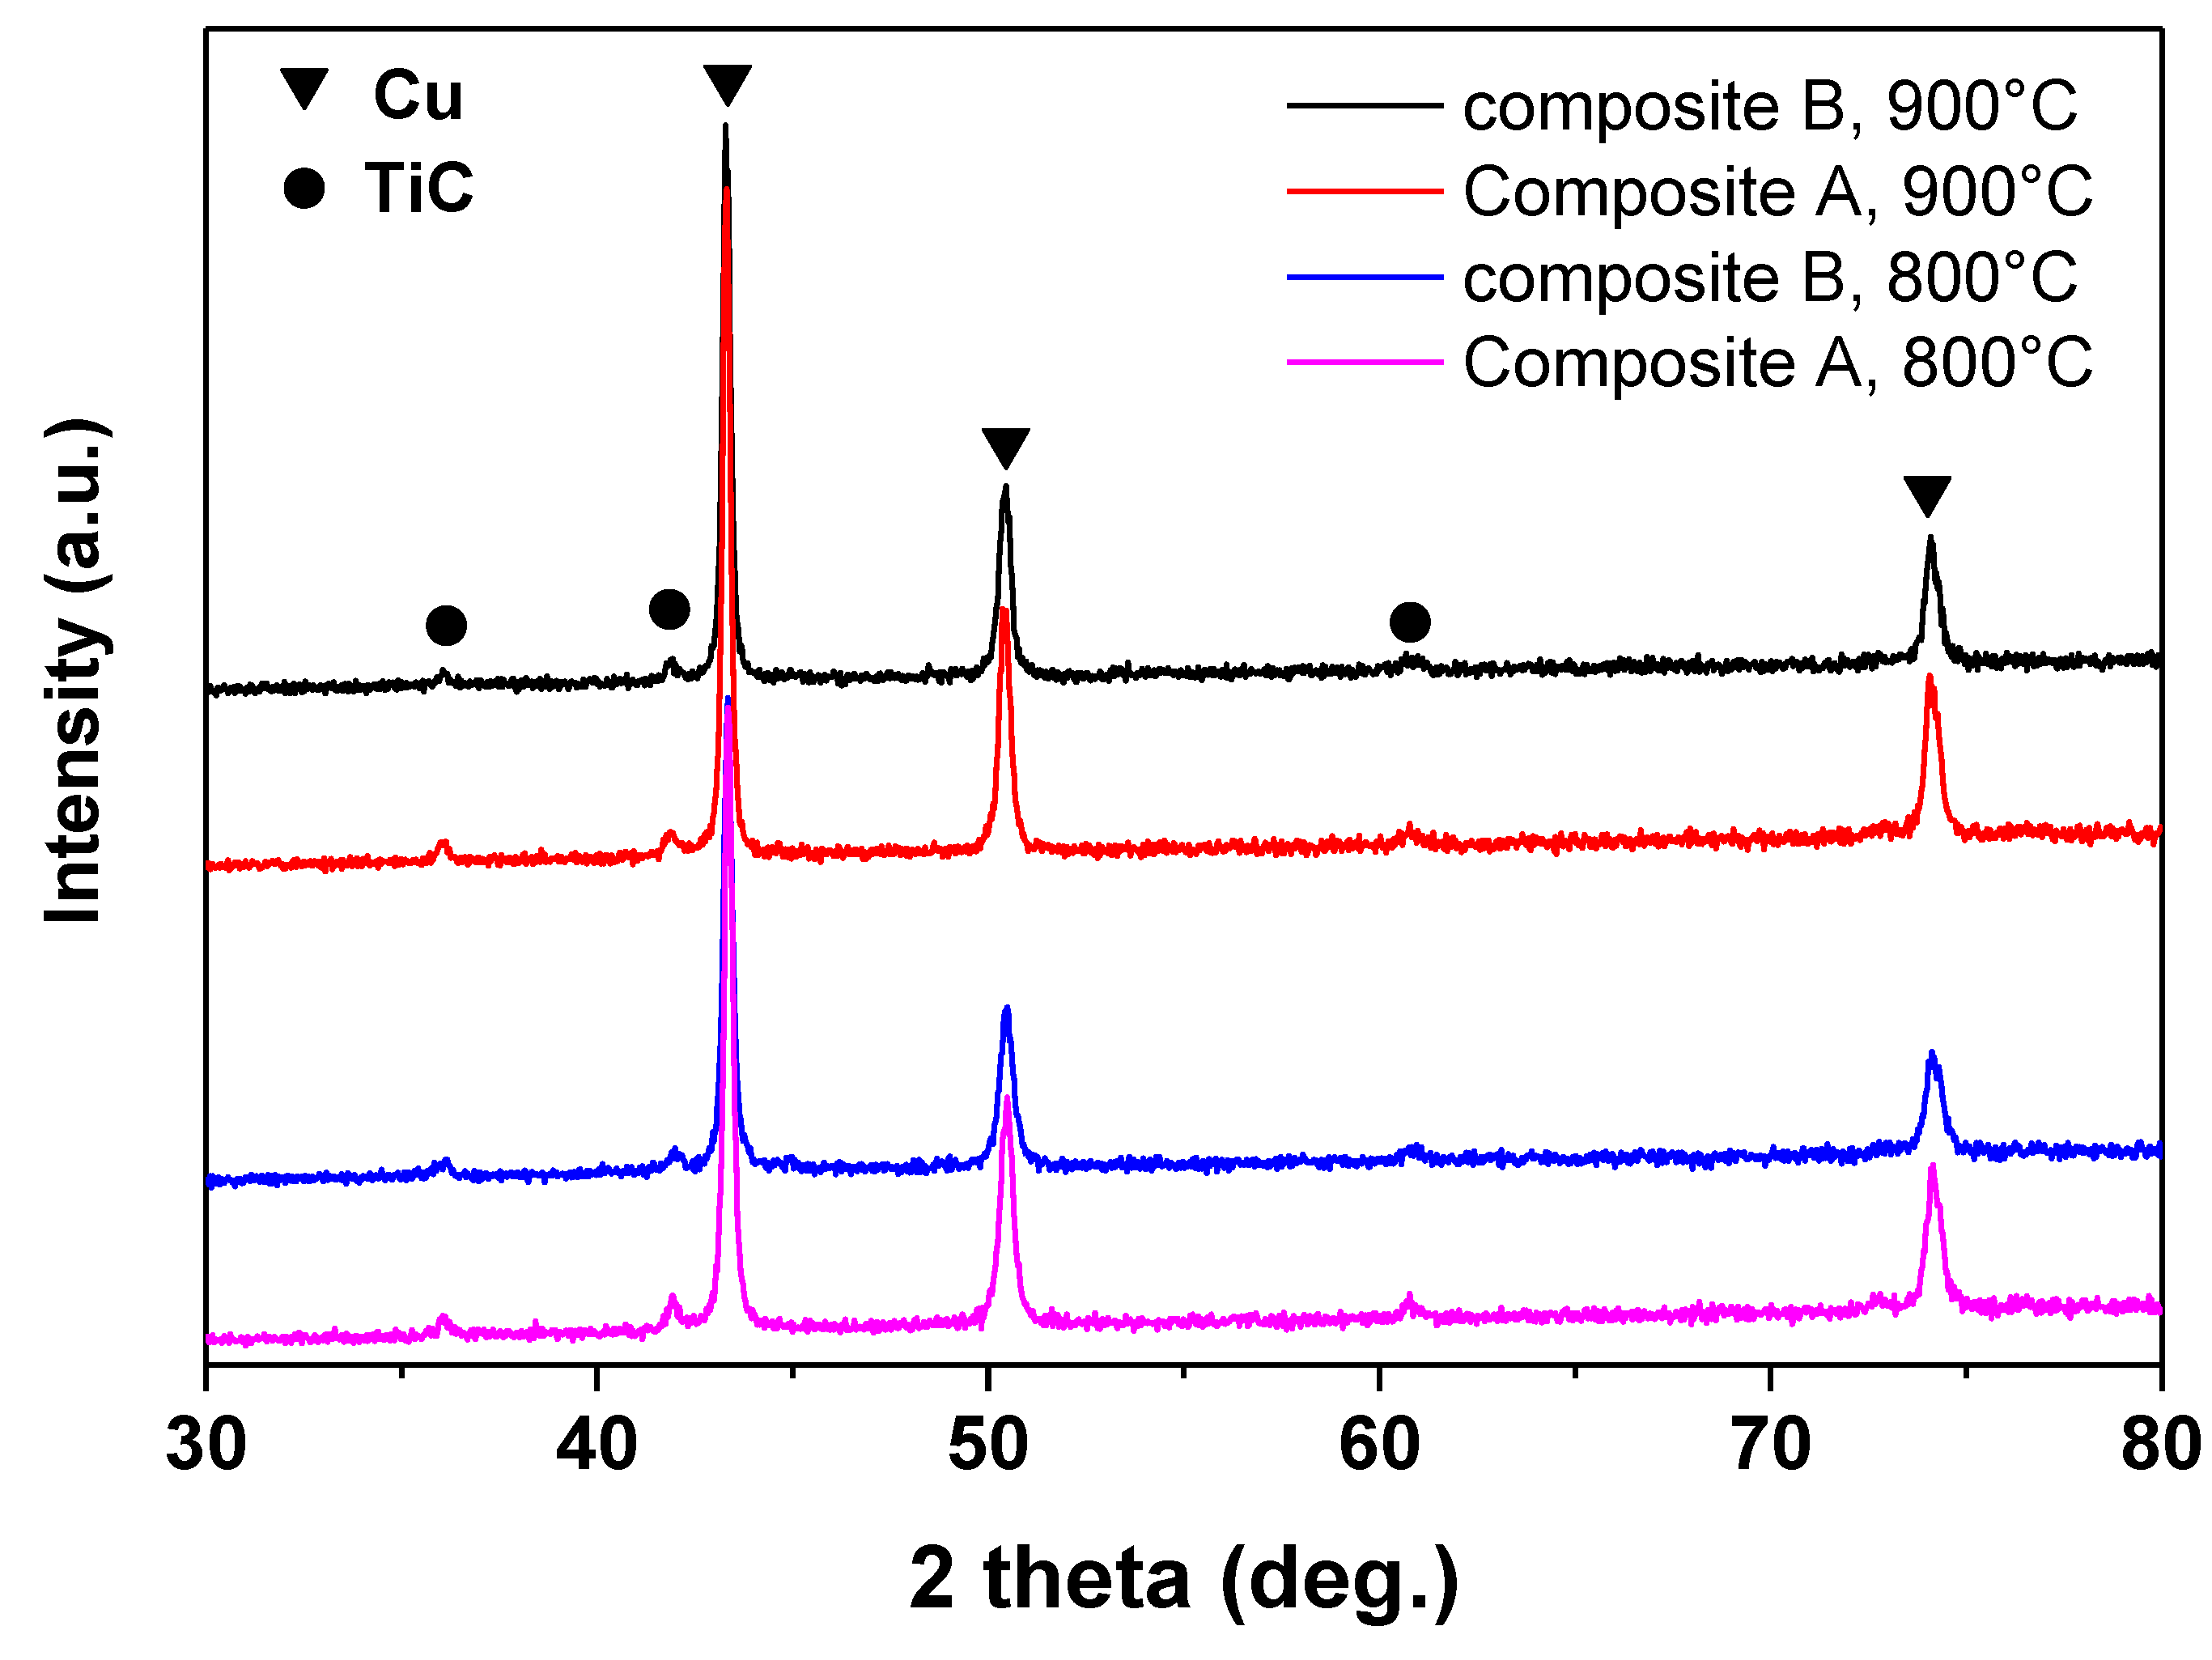
Figure 4.
Fracture surfaces of the TiC–Cu nanocomposites spark plasma sintered at 800 °C: (a) 20 vol % TiC, nanocomposite A; (b) 20 vol % TiC, nanocomposite B; (c) 30 vol % TiC, nanocomposite A; and (d) 30 vol % TiC, nanocomposite B.
Figure 4.
Fracture surfaces of the TiC–Cu nanocomposites spark plasma sintered at 800 °C: (a) 20 vol % TiC, nanocomposite A; (b) 20 vol % TiC, nanocomposite B; (c) 30 vol % TiC, nanocomposite A; and (d) 30 vol % TiC, nanocomposite B.

Figure 5.
Fracture surfaces of the TiC–Cu nanocomposites spark plasma sintered at 900 °C: (a) 20 vol % TiC, nanocomposite A; (b) 20 vol % TiC, nanocomposite B; (c) 30 vol % TiC, nanocomposite A; and (d) 30 vol % TiC, nanocomposite B.
Figure 5.
Fracture surfaces of the TiC–Cu nanocomposites spark plasma sintered at 900 °C: (a) 20 vol % TiC, nanocomposite A; (b) 20 vol % TiC, nanocomposite B; (c) 30 vol % TiC, nanocomposite A; and (d) 30 vol % TiC, nanocomposite B.

Figure 6.
TEM images and selected-area diffraction pattern (SADP) of nanocomposite A of 20 vol % TiC–Cu composition sintered at 900 °C: (a) bright-field image (inset: SADP corresponding to a TiC crystallite); (b) High-resolution TEM (HRTEM) of the Cu matrix.
Figure 6.
TEM images and selected-area diffraction pattern (SADP) of nanocomposite A of 20 vol % TiC–Cu composition sintered at 900 °C: (a) bright-field image (inset: SADP corresponding to a TiC crystallite); (b) High-resolution TEM (HRTEM) of the Cu matrix.

Figure 7.
TEM images and SADP of nanocomposite A of 30 vol % TiC–Cu composition sintered at 900 °C: (a) bright-field image (inset: SADP corresponding to a TiC crystallite); (b) HRTEM of the Cu matrix.
Figure 7.
TEM images and SADP of nanocomposite A of 30 vol % TiC–Cu composition sintered at 900 °C: (a) bright-field image (inset: SADP corresponding to a TiC crystallite); (b) HRTEM of the Cu matrix.

Figure 8.
TEM images and SADP of nanocomposite B of 20 vol % TiC–Cu composition sintered at 900 °C: (a) bright-field image (inset: SADP corresponding to a TiC crystallite); (b) HRTEM of the Cu matrix.
Figure 8.
TEM images and SADP of nanocomposite B of 20 vol % TiC–Cu composition sintered at 900 °C: (a) bright-field image (inset: SADP corresponding to a TiC crystallite); (b) HRTEM of the Cu matrix.

Figure 9.
TEM images and SADP of nanocomposite B of 30 vol % TiC–Cu composition sintered at 900 °C: (a) bright-field image (inset: SADP corresponding to a TiC crystallite); (b) HRTEM of the Cu matrix.
Figure 9.
TEM images and SADP of nanocomposite B of 30 vol % TiC–Cu composition sintered at 900 °C: (a) bright-field image (inset: SADP corresponding to a TiC crystallite); (b) HRTEM of the Cu matrix.
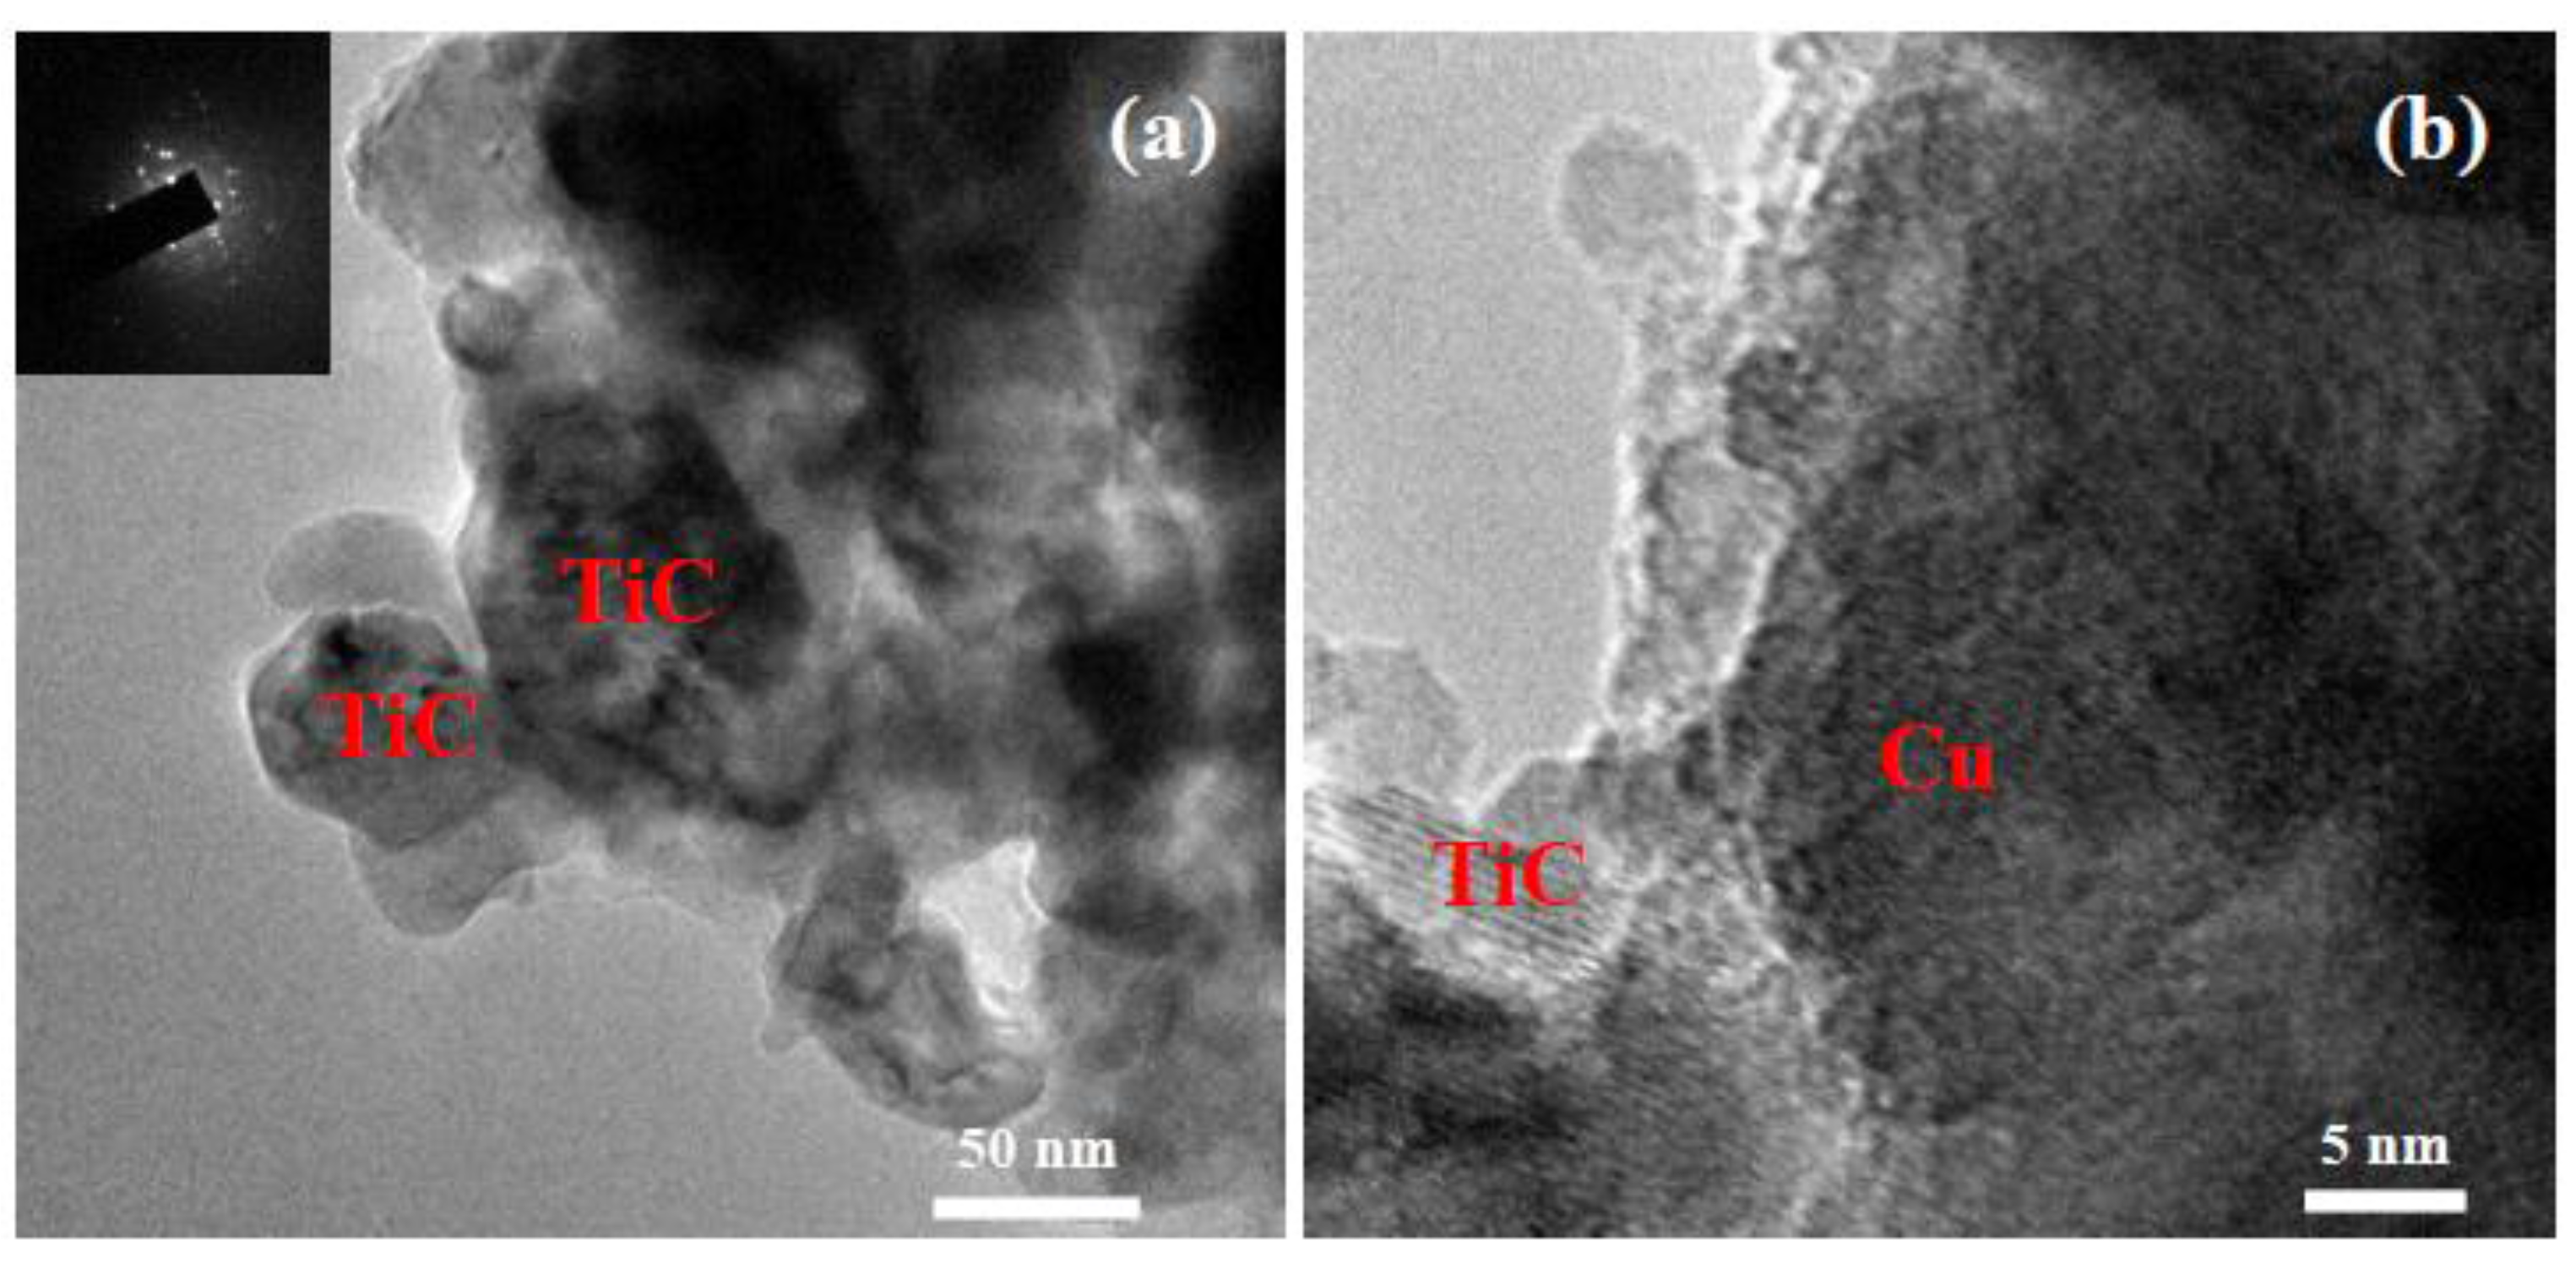
Figure 10.
Scanning TEM images and EDS profiles of the 20 vol % TiC–Cu: (a) nanocomposite A; and (b) nanocomposite B sintered at 900 °C.
Figure 10.
Scanning TEM images and EDS profiles of the 20 vol % TiC–Cu: (a) nanocomposite A; and (b) nanocomposite B sintered at 900 °C.


Table 1.
EDS analysis of the ball milled TiC–Cu powders, nanocomposites A and B containing 30 vol % TiC.
Table 1.
EDS analysis of the ball milled TiC–Cu powders, nanocomposites A and B containing 30 vol % TiC.
| Composite | Concentration, wt % | ||||
|---|---|---|---|---|---|
| Cu | Ti | C | O | Fe | |
| Nanocomposite A | 63.83 | 11.32 | 18.26 | 5.75 | 0.83 |
| Nanocomposite B | 64.23 | 11.32 | 14.04 | 7.78 | 2.63 |
Table 2.
Structural parameters of TiC in nanocomposite A with 20 vol % TiC sintered at 900 °C.
| (hkl) | h2 + k2 + l2 | 2θ | Sin θ | a (Å) | f(θ) | a (Å) from the Nelson–Riley Plot |
|---|---|---|---|---|---|---|
| (111) | 3 | 36.088 | 0.309 | 4.312 | 2.970 | 4.312 |
| (200) | 4 | 41.88 | 0.357 | 4.316 | 2.483 | |
| (220) | 8 | 60.77 | 0.505 | 4.312 | 1.496 |
Table 3.
Structural parameters of TiC in nanocomposite B with 20 vol % TiC sintered at 900 °C.
| (hkl) | h2 + k2 + l2 | 2θ | Sin θ | a (Å) | f(θ) | a (Å) from the Nelson–Riley Plot |
|---|---|---|---|---|---|---|
| (111) | 3 | 36.091 | 0.309 | 4.312 | 2.970 | 4.306 |
| (200) | 4 | 41.885 | 0.357 | 4.315 | 2.483 | |
| (220) | 8 | 60.868 | 0.506 | 4.306 | 1.493 |
Table 4.
Structural parameters of Cu in nanocomposite A with 20 vol % of TiC sintered at 900 °C.
| (hkl) | h2 + k2 + l2 | 2θ (deg.) | a (Å) | f(θ) | a (Å) from the Nelson–Riley Plot |
|---|---|---|---|---|---|
| (111) | 3 | 43.2 | 3.628 | 2.389 | 3.613 |
| (200) | 4 | 50.4 | 3.622 | 1.956 | |
| (220) | 8 | 74.1 | 3.620 | 1.075 |
Table 5.
Structural parameters of Cu in nanocomposite B with 20 vol % of TiC sintered at 900 °C
| (hkl) | h2 + k2 + l2 | 2θ (deg.) | a (Å) | f(θ) | a (Å) from the Nelson–Riley Plot |
|---|---|---|---|---|---|
| (111) | 3 | 43.309 | 3.620 | 2.382 | 3.616 |
| (200) | 4 | 50.41 | 3.622 | 1.956 | |
| (220) | 8 | 74.139 | 3.618 | 1.074 |
Table 6.
Relative densities of the spark plasma sintered (SPS) TiC–Cu nanocomposites.
| SPS Temperature, °C | Relative Density, % | |||
|---|---|---|---|---|
| A 20 vol % TiC–Cu | B 20 vol % TiC–Cu | A 30 vol % TiC–Cu | B 30 vol % TiC–Cu | |
| 800 | 96.4 | 96.2 | 95.2 | 95.8 |
| 900 | 96.5 | 96.4 | 95.5 | 96.0 |
Table 7.
Vickers Hardness of the spark plasma sintered TiC–Cu nanocomposites.
| SPS Temperature, °C | Hardness, HV | |||
|---|---|---|---|---|
| A 20 vol % TiC–Cu | B 20 vol % TiC–Cu | A 30 vol % TiC–Cu | B 30 vol % TiC–Cu | |
| 800 | 280 | 337 | 300 | 332 |
| 900 | 284 | 347 | 315 | 337 |
© 2017 by the authors. Licensee MDPI, Basel, Switzerland. This article is an open access article distributed under the terms and conditions of the Creative Commons Attribution (CC BY) license (http://creativecommons.org/licenses/by/4.0/).
Share and Cite
MDPI and ACS Style
Nguyen Thi Hoang, O.; Nguyen Hoang, V.; Kim, J.-S.; Dudina, D.V. Structural Investigations of TiC–Cu Nanocomposites Prepared by Ball Milling and Spark Plasma Sintering. Metals 2017, 7, 123. https://doi.org/10.3390/met7040123
AMA Style
Nguyen Thi Hoang O, Nguyen Hoang V, Kim J-S, Dudina DV. Structural Investigations of TiC–Cu Nanocomposites Prepared by Ball Milling and Spark Plasma Sintering. Metals. 2017; 7(4):123. https://doi.org/10.3390/met7040123
Chicago/Turabian StyleNguyen Thi Hoang, Oanh, Viet Nguyen Hoang, Ji-Soon Kim, and Dina V. Dudina. 2017. "Structural Investigations of TiC–Cu Nanocomposites Prepared by Ball Milling and Spark Plasma Sintering" Metals 7, no. 4: 123. https://doi.org/10.3390/met7040123
Note that from the first issue of 2016, this journal uses article numbers instead of page numbers. See further details here.