Article

Influence of Thickness and Chemical Composition of Hot-Rolled Bands on the Final Microstructure and Magnetic Properties of Non-Oriented Electrical Steel Sheets Subjected to Two Different Decarburizing Atmospheres

by
Nephtali Calvillo
1,2,
Ma. De Jesús Soria
2,
Armando Salinas
3,
Emmanuel J. Gutiérrez
4,*,
Iván A. Reyes
4 and
Francisco R. Carrillo
2
1
Altos Hornos de México S. A. B. de C. V., Prolongación Juárez, s/n, La Loma, Monclova 25770, Mexico
2
Facultad de Metalurgia, Universidad Autónoma de Coahuila, Carr. 57, km. 5, Monclova 25710, Mexico
3
Centro de Investigación y de Estudios Avanzados del Instituto Politécnico Nacional, Unidad Saltillo, Av. Industria Metalúrgica, 1062, Parque Industrial Saltillo-Ramos Arizpe, Ramos Arizpe 25900, Mexico
4
Catedrático CONACYT-Instituto de Metalurgia de la Universidad Autónoma de San Luis Potosí, Av. Sierra Leona, 550, Lomas 2da Secc., San Luis Potosí 78210, Mexico
*
Author to whom correspondence should be addressed.
Metals 2017, 7(6), 229; https://doi.org/10.3390/met7060229
Submission received: 5 May 2017 / Revised: 2 June 2017 / Accepted: 13 June 2017 / Published: 21 June 2017
(This article belongs to the Special Issue Alloy Steels)

Abstract

:
During electrical steel processing, there are usually small variations in both chemical composition and thickness in the hot-rolled material that may lead to different magnetic properties for the same steel grade. Therefore, it is of great importance to know the effects of such variations on the final microstructure and magnetic properties of these steels. In the present investigation, samples of a specific grade of a commercial hot-rolled grain non-oriented (GNO) electrical steel were taken from different steel batches to investigate the effects of thickness and chemical composition (C, Sn, Mn and Ti) in the hot-rolled material on the final microstructure and magnetic properties (core losses and magnetic permeability) resulting from two different decarburizing annealing cycles. Hot-rolled samples were processed by cold rolling, intermediate annealing, temper-rolling and final decarburization annealing using the same processing parameters. The experimental results show that the minimum core losses and maximum magnetic permeability are obtained with the thinnest steel thickness and the largest grain size. Increasing Sb and Mn contents, and reducing the C and Ti concentrations also improve the magnetic behavior of these steels. It was also found the effect of grain size on the magnetic behavior is more significant than the one of crystallographic texture.

Graphical Abstract

1. Introduction

Nowadays the use of energy deals with some challenges in terms of available resources, environmental and economic impacts [1,2]. Electrical steels play an important role in the energy system including its generation, transmission, distribution and consumption.
Grain non-oriented (GNO) electrical steels are widely used in electrical equipment from the simplest domestic appliances to hybrid and pure electric vehicles [3,4,5]. For these applications, low core losses and high permeability are required [1,2,3,4,5,6,7]; these magnetic properties are strongly influenced by microstructural parameters such as residual stresses, inclusions, grain size and crystallographic texture [8,9,10,11,12]. Processing conditions, chemical composition and final thickness also play a crucial role in determining the magnetic behavior of these steels [13,14]. Therefore, during fabrication of GNO electrical steels, all of the above mentioned parameters must be considered to optimize the magnetic quality of these steels [15,16,17].
There are many previous studies regarding “the individual effects” of C, Ti, Sb, Mn and thickness on the magnetic properties of non-oriented electrical steels [18,19,20,21,22]. Carbon has a significant negative effect on the magnetic properties of electrical steels even when it is present in small amounts [18]. Carbon remains dissolved in Fe in the solid state even after slow cooling, and has a detrimental effect on the magnetic properties. When carbon precipitates as pearlite or free cementite its effect on the magnetic behavior is less significant but negative [18].
Darja et al. [19] studied the effects of Ti on the magnetic properties of semi-processed non-oriented electrical steel sheets. It was observed that core loss increase as the titanium content was increased. SEM analysis revealed that deterioration of the magnetic behavior was caused by the “pinning effect” of complex oxycarbonitrides, complex TiC and complex Ti(C, N).
Li et al. [20] reported that the magnetic behavior of non-oriented electrical steels can be enhanced by a texture improvement due to Sb additions. It was found that the addition of antimony inhibits the development of {111} texture and increases the intensity of Goss and {100} texture.
The influence of hot-band grain size and additions of Al and Mn on the magnetic properties of non-oriented electrical steels with 3% Si was investigated by Cardoso [21]. It was observed that the addition of manganese resulted in larger recrystallized grains after cold rolling and subsequent final annealing. Coarse grains in the hot-band and addition of Mn led to a Goss orientation component after final annealing, which resulted in an increase of the magnetic permeability.
Hunday [22] reported the influence of chemistry (variations in Si, Al, Mn, P) and hot rolling conditions (finishing temperature, the finish mill entry temperature and the transfer bar thickness) on the final magnetic properties of grain non-oriented electrical steels. The hot-rolled material was cold-rolled to a final thickness of 0.65 mm. The effects of final thickness and the amounts of Sb and Ti were not considered by Hunday [22].
Si and Al are intentionally added to these steels to improve their magnetic behavior [23]. When Si content in steel is varied, crystalline anisotropy constant K1, electrical resistivity ρ, and saturation induction Bs change according to the following equations [12]:
K1 = 5.2 − 0.5Si% (104 J/m3)
ρ = 12 + 11Si% (μΩ·cm)
Bs = 2.16 − 0.048Si%
The effect of Al content on these constants is similar to that of Si content. Therefore, depending on the steel grade and its application, the amount of Si + Al can vary from low [24] to high concentrations [25].
Conventionally, GNO electrical steels are processed from hot-rolling by cold rolling, continuous or batch annealing and temper rolling. Finally, laminations are subjected to a long term decarburization annealing. This later is carried out to remove residual stresses, promote grain growth and develop the optimum grain size and crystallographic texture by which the magnetic behavior of these materials can be enhanced [15,16,17,26].
During fabrication of these steels, there are usually small variations in both chemical composition and thickness that may lead to different microstructural characteristics, and thus can produce different magnetic properties even for the same steel grade. Therefore, it is of great importance to know the effects of such variations on the microstructure and magnetic properties of these steels.
In the present investigation, samples of a specific grade of a commercial hot-rolled low Si + Al GNO electrical steel, were taken from different steel batches to investigate the effects of thickness and chemical composition (C, Sn, Mn and Ti) on the final microstructure (grain size, crystallographic texture) and magnetic properties (core losses, magnetic permeability) of steel sheets subjected to two decarburization annealing cycles.

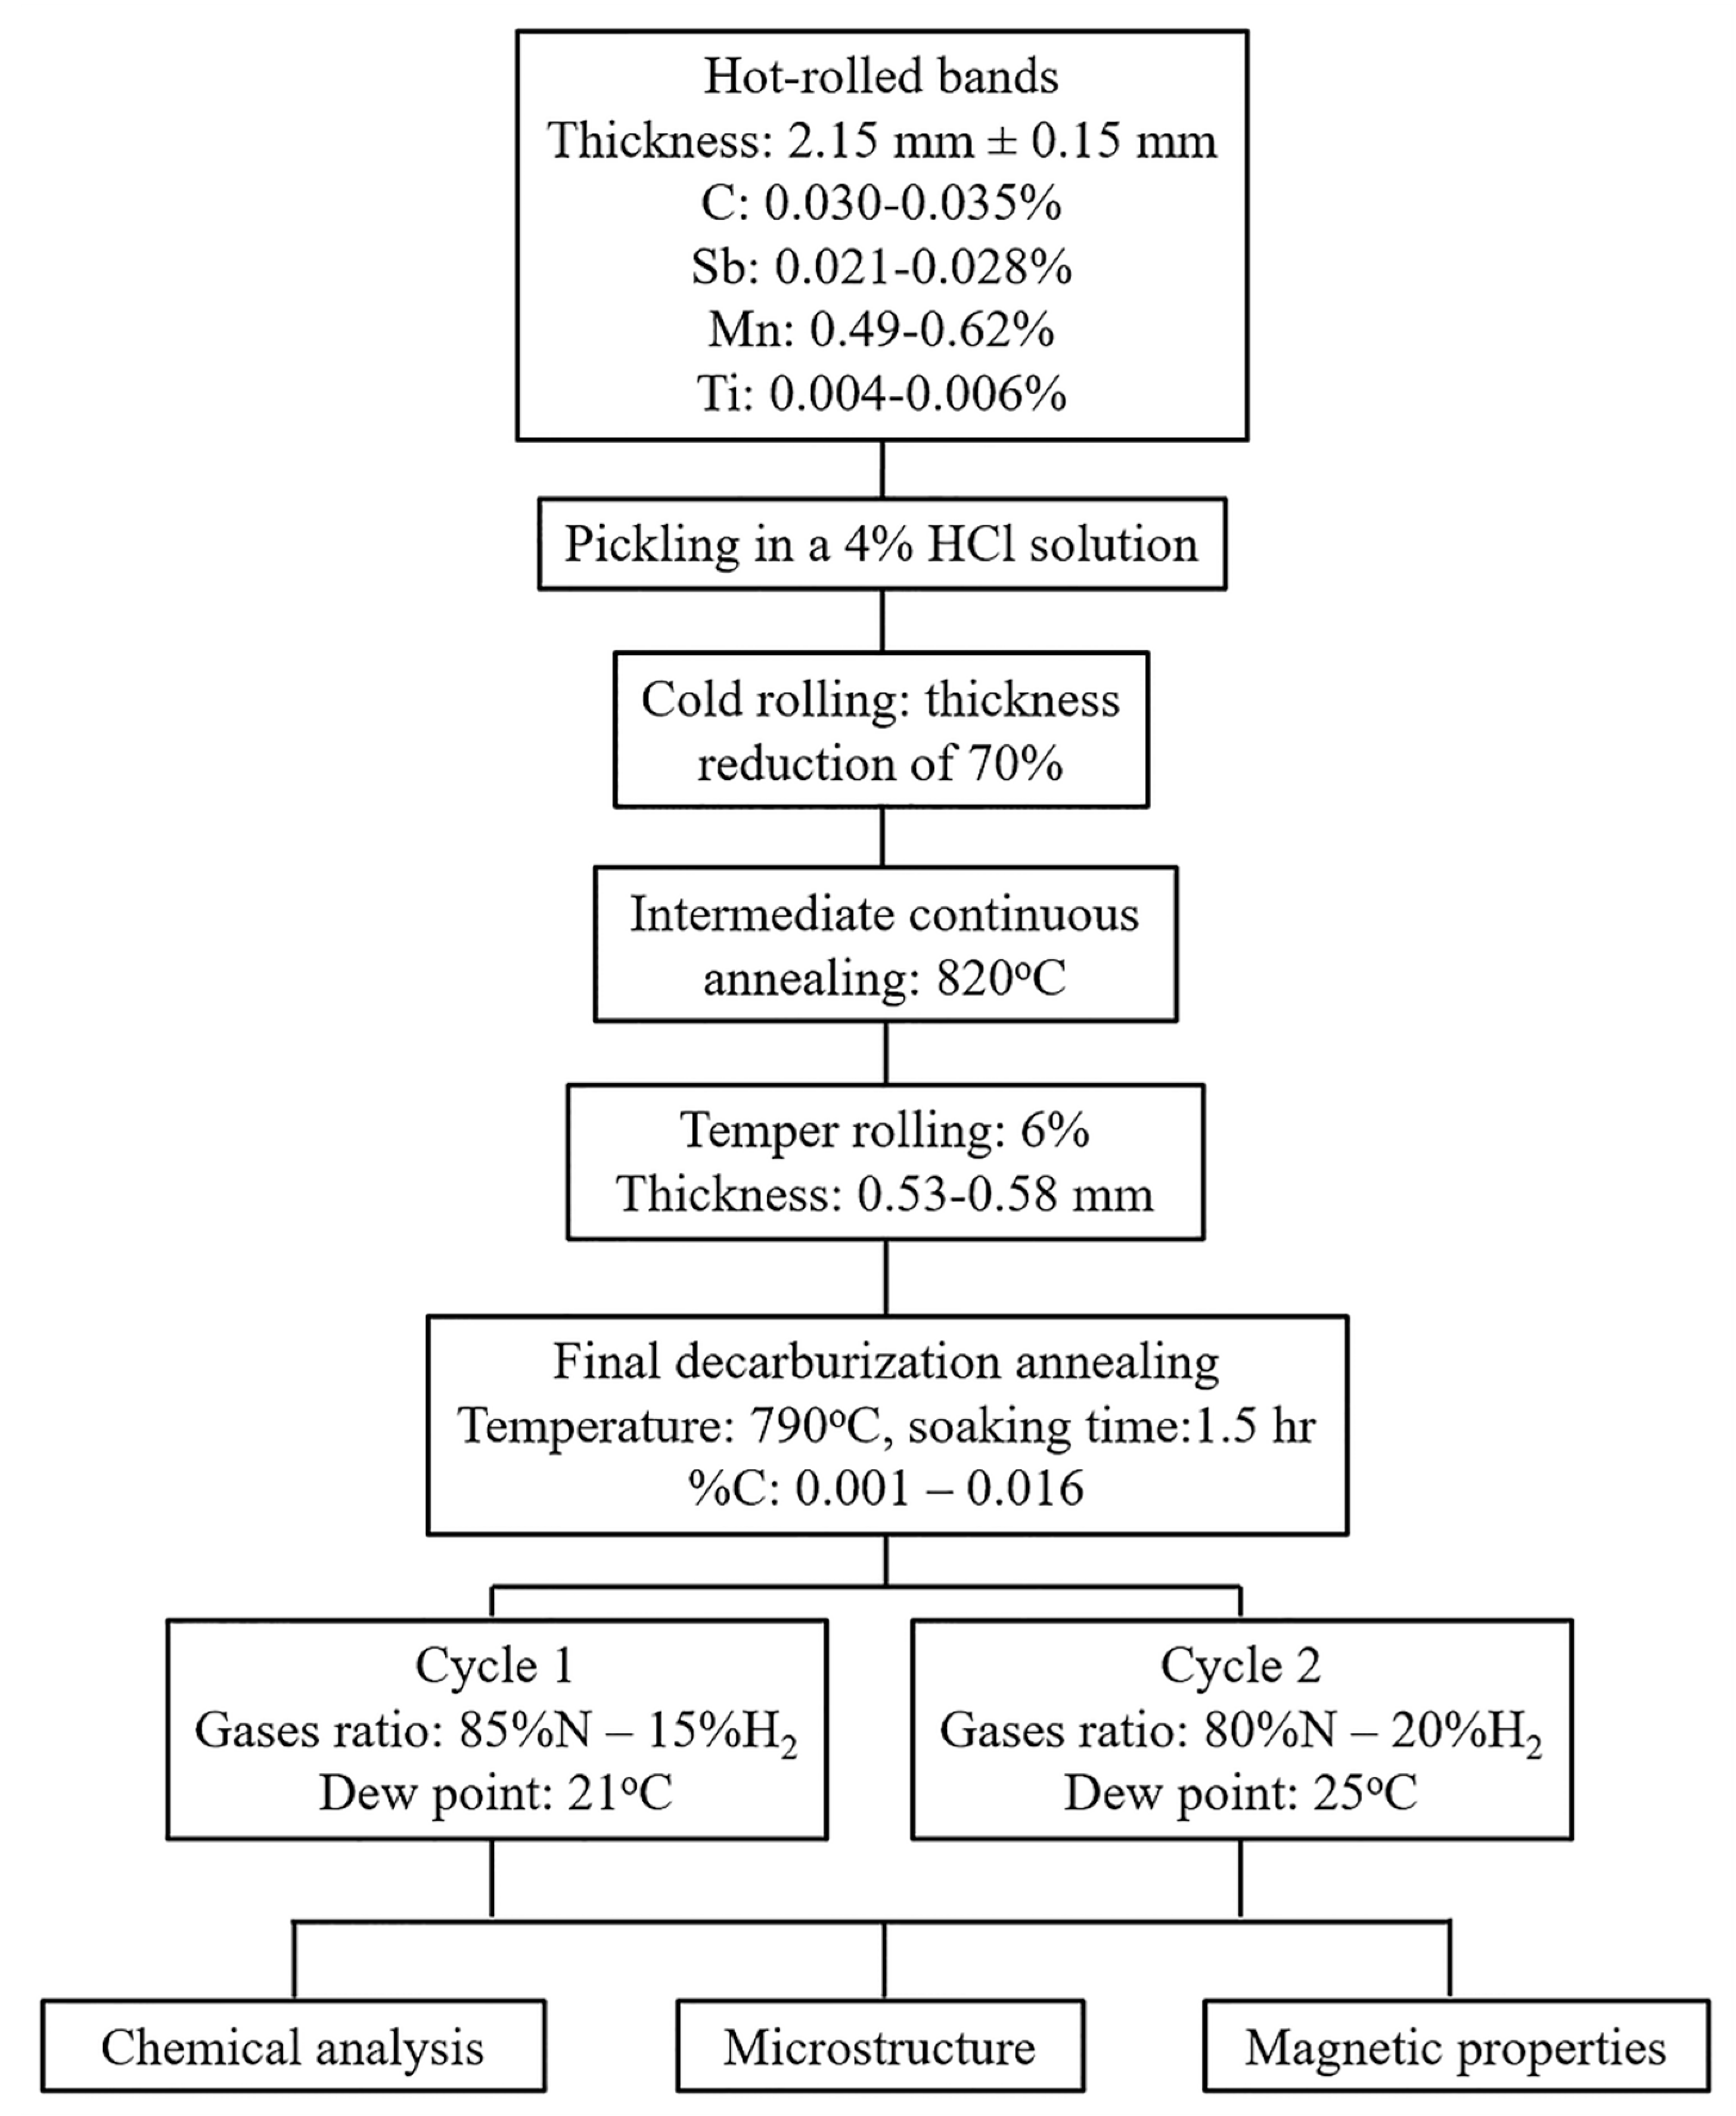
2. Materials and Methods

Samples of commercial hot-rolled GNO electrical steel coils were obtained from a local steelmaker (Altos Hornos de México S. A. B. de C. V., Monclova, México) considering different steel batches of a specific steel grade. Those samples that presented variations in chemical composition and thickness were selected to evaluate their effects on the magnetic properties of these steels. Although grain size and the amount of secondary phases could also vary from batch to batch. It was found experimentally that they were very similar and for this reason, they were not taken into account in the present research.
Table 1 shows the nominal chemical composition of the hot-rolled GNO electrical steel grade investigated in the present work. The experimental composition is not reported due to confidentially and privacy policies of the steel manufacturer. Chemical composition of both hot-rolled strips and annealed steel sheets samples was determined in an Espectrolab spectrometer (SPECTRO Analytical Instruments GmbH, Kleve, Germany) by optical emission spectrometry based on ASTM E403. The variations in the elements of interest in the hot-rolled bands obtained by this technique were: C, 0.030–0.035%; Sb, 0.021–0.028%; Mn, 0.49–0.62% and Ti, 0.004–0.006%. As can be observed in Table 1, the nominal chemical composition of the investigated steel grade does not consider the presence of Ti and Sb and therefore, it is of great importance to know their effects on the magnetic properties of these materials. The effect the Mn concentration is also important, since the amount of this alloying element exceeds the maximum permissible limit in this steel grade.
Figure 1 shows the methodology used in the present work. The as-received hot-rolled strips, which had a thickness variability of 2.15 ± 0.15 mm, were pickled in a 4% HCL solution and cold-rolled by a thickness reduction of 70%. Cold-rolled samples were subjected to a continuous annealing at 820 °C and subsequent temper-rolling with an additional thickness reduction of 6% achieving a final thickness between 0.53 and 0.58 mm.
Longitudinal and transverse samples with respect to the rolling direction, 3 cm wide × 30 cm long, were cut and subjected to a final decarburization annealing at T = 790 °C for 1.5 h. Heat treatments were carried out in a laboratory KF-240-S box-type furnace (Linn High Therm GmbH, Hirschbach, Germany) under wet atmospheres. Two different gas ratios and dew points were considered to promote steel decarburization: 85% N2-15% H2, 21 °C and 80% N2-20% H2, 25 °C (Figure 1 and Figure 2).
Texture analysis at various processing steps was carried out by orientation imaging microscopy (OIM) using a scanning electron microscope Philips XL30 (Company/Philips Electron Optics, Eindhoven, The Netherlands) equipped with a TSL-OIM system. Sample preparation for OIM included grinding to half thickness and the analyzed area for each texture map was 400 μm × 400 μm. The orientation distribution function (ODF) was calculated by the harmonic method (L = 16) using the TSL OIM software (Version 3.5, EDAX, Mahwah, NJ, USA, 2007).
Magnetic properties, core losses and permeability, were measured using a standardized Epstein Frame at a magnetic induction of 1.5 T and a frequency of 60 Hz according to ASTM A343. Sixteen annealed Epstein-type samples (3 cm width × 30 cm length) were used for each measurement. Microstructural evolution before and after the decarburization annealing was followed by optical microscopy Olympus GX51 (Olympus, Tokyo, Japan). Grain size was determined using comparison charts according to ASTM E112.

3. Results and Discussion

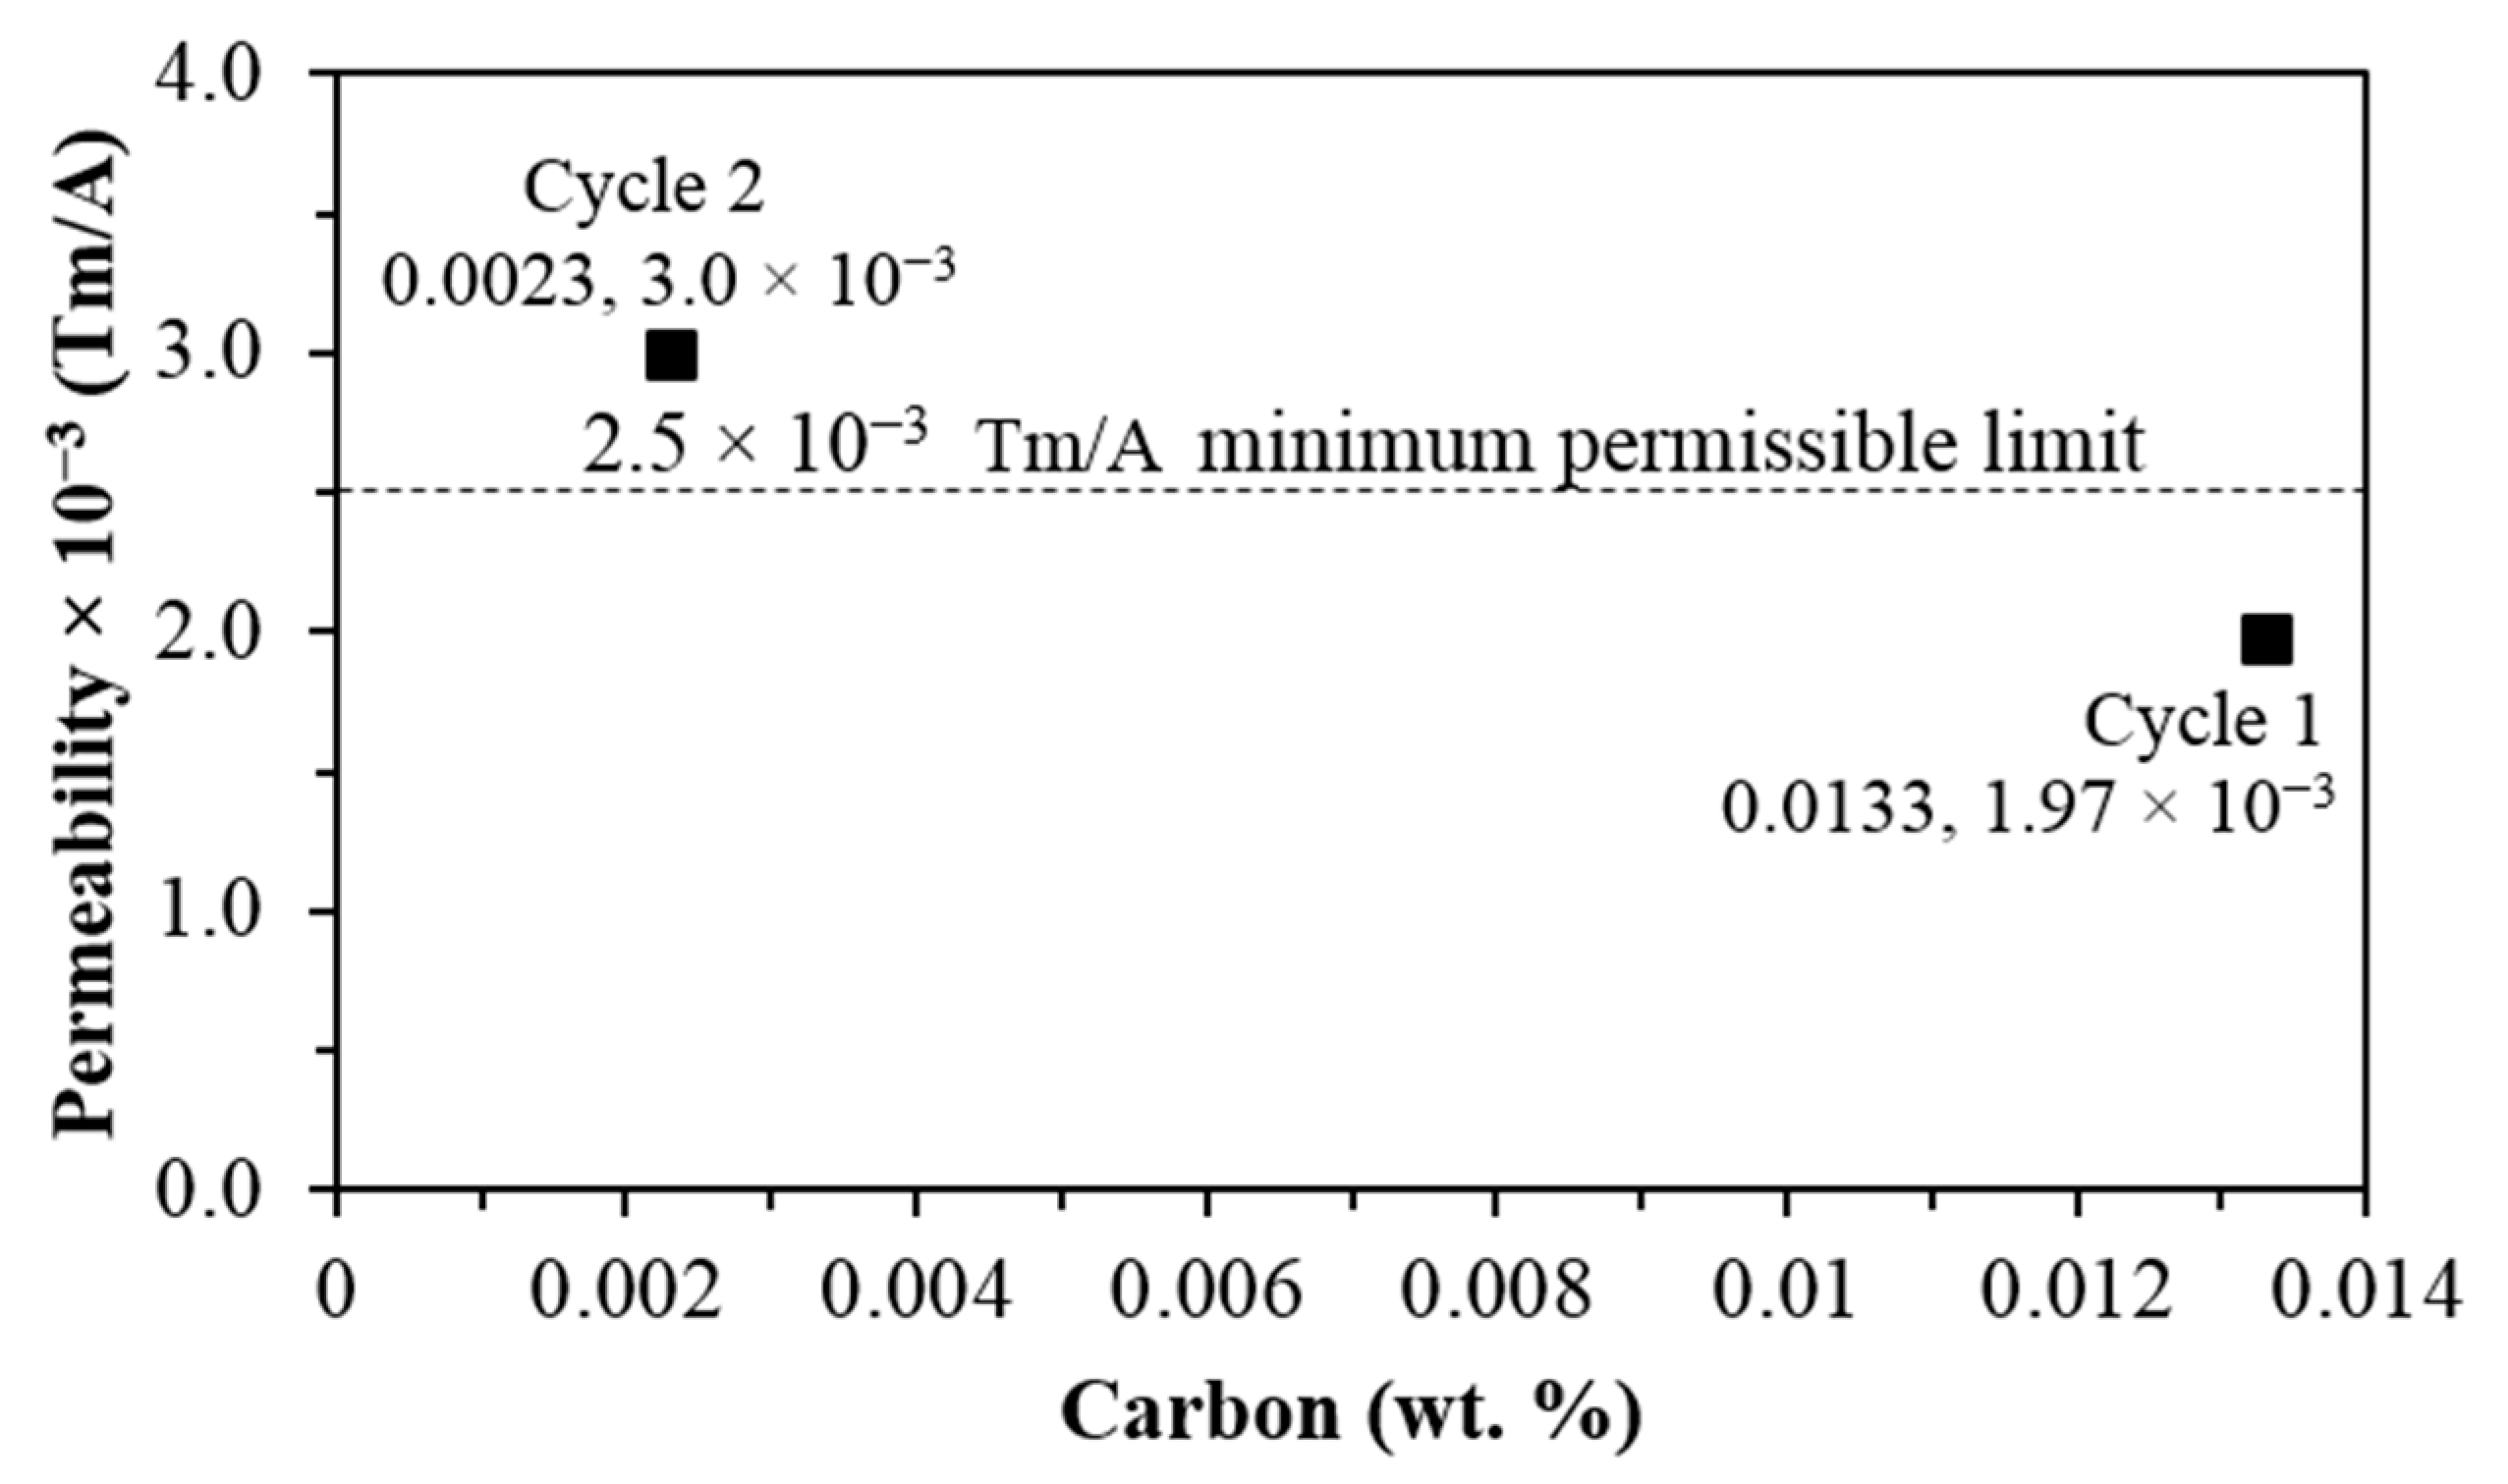
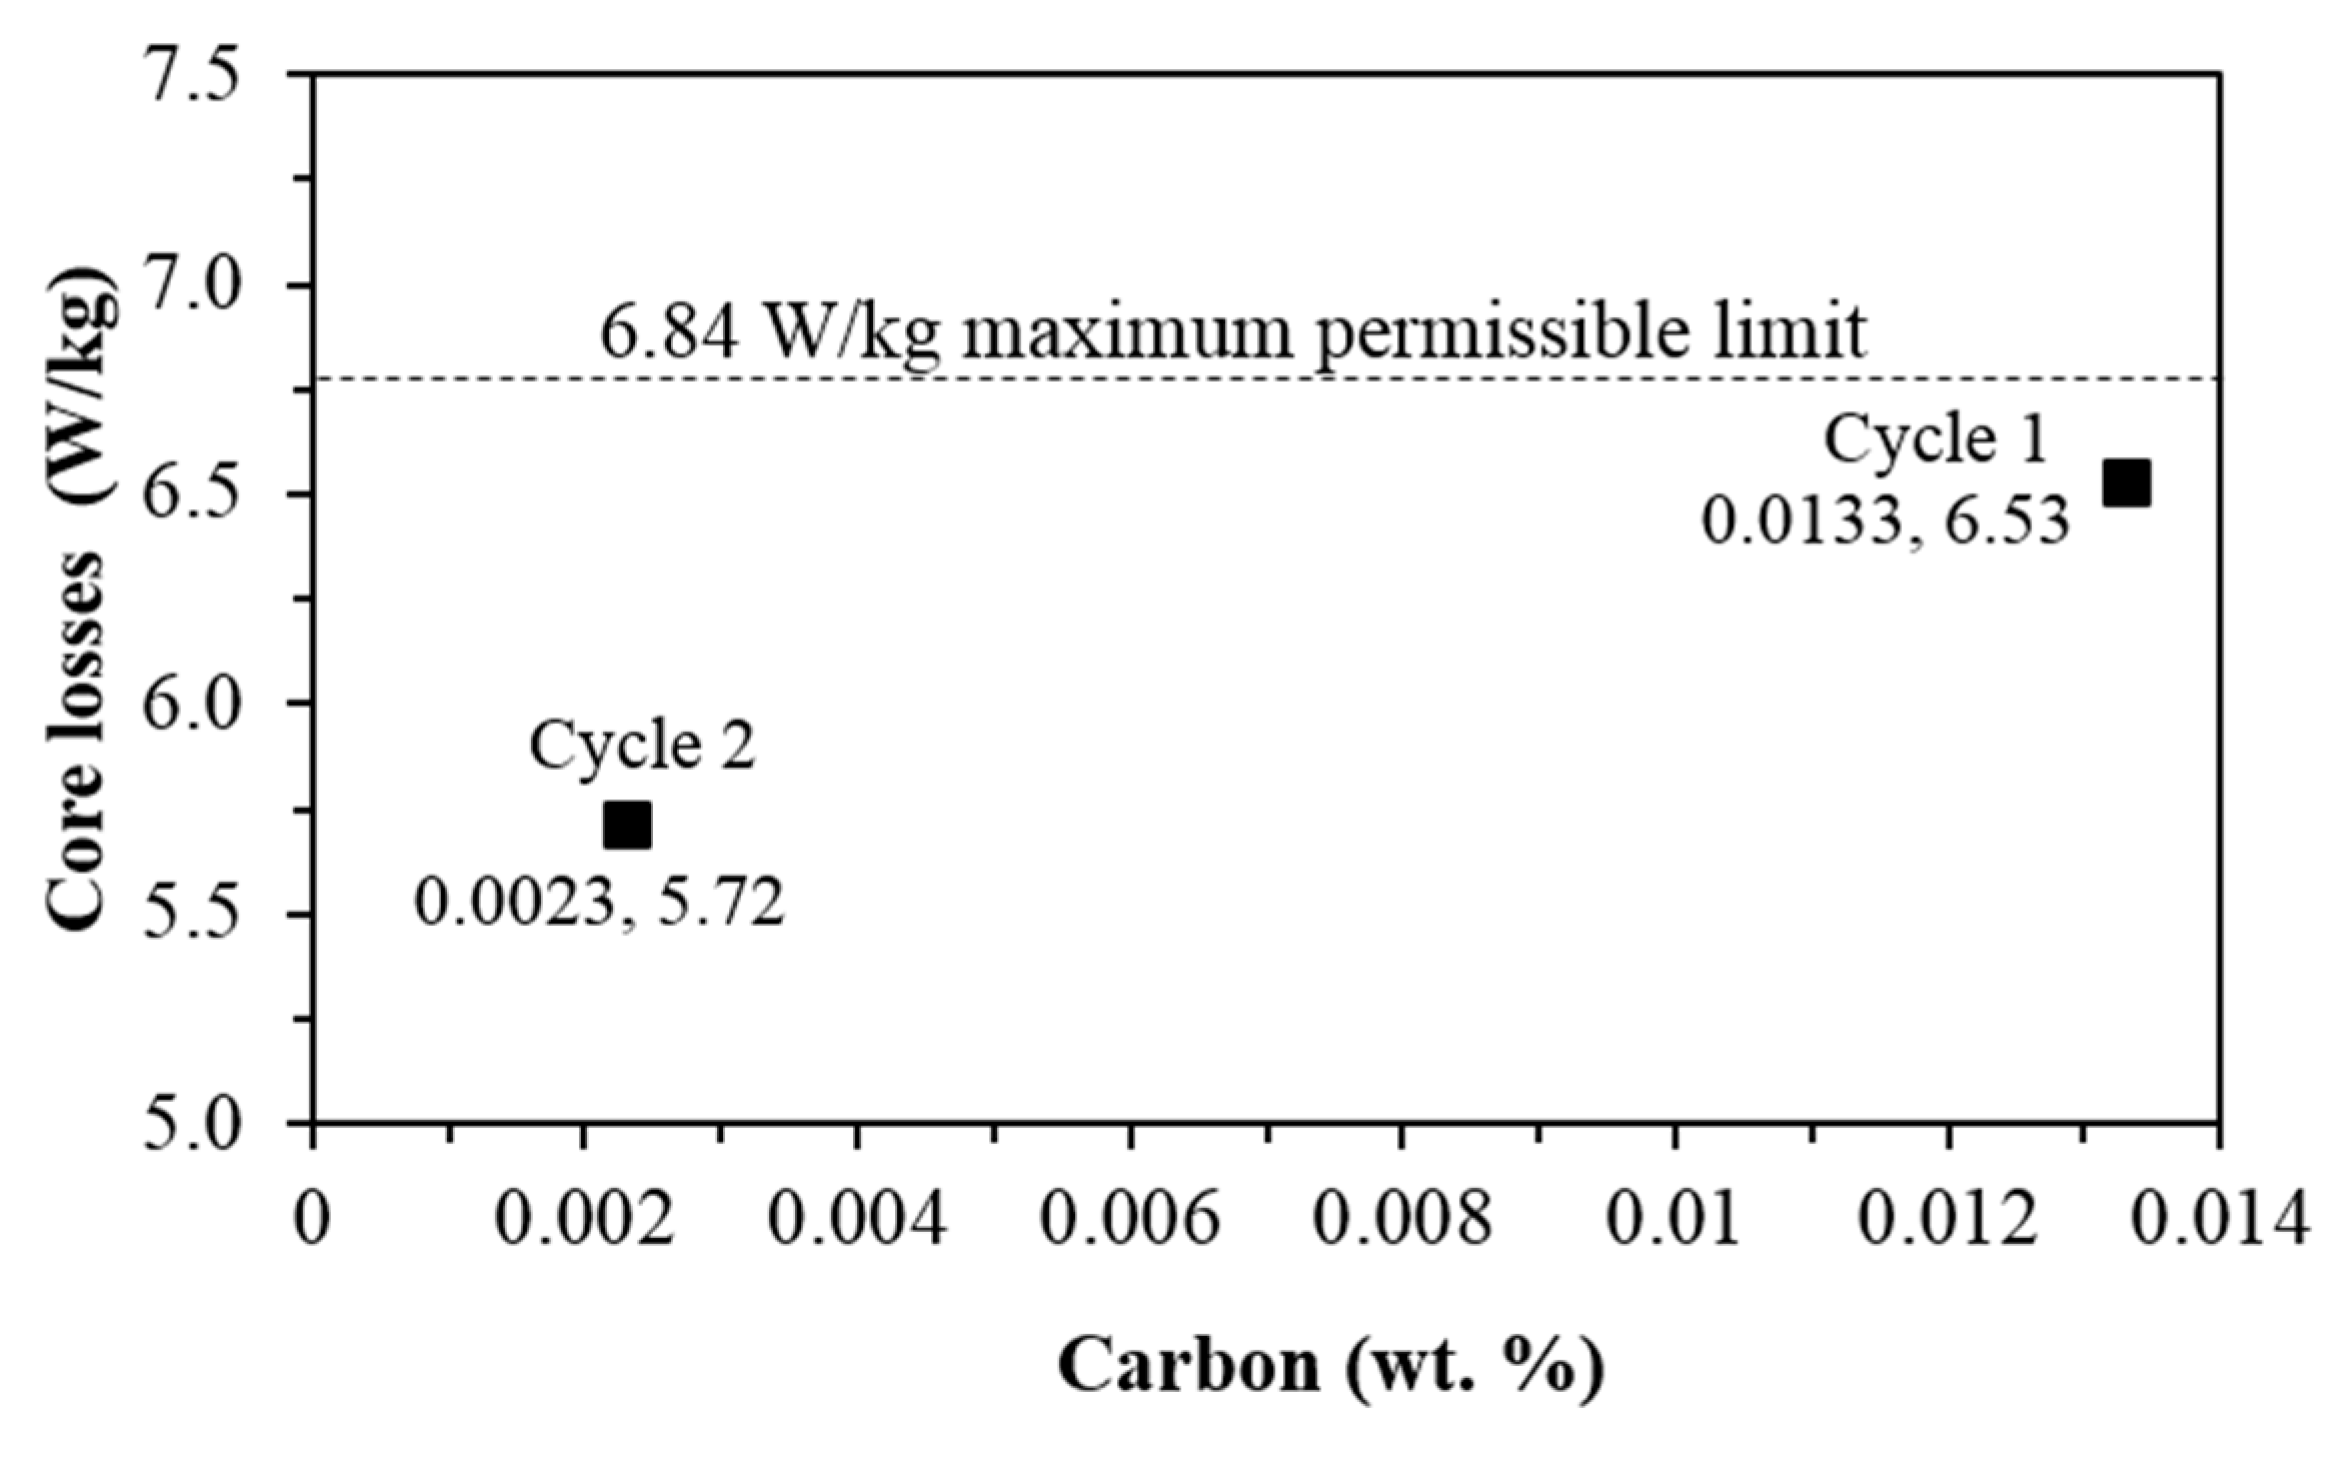
3.1. Effect of Carbon Concentration on Magnetic Properties

Figure 3 and Figure 4 show the average values of carbon concentration, average core losses and magnetic permeability obtained from each decarburizing cycle. Important to mention is that samples subjected to Cycle 2 presented in these Figures had a thickness between 0.53–0.55 mm and those subjected to Cycle 1 had a thickness between 0.551–0.58 mm. As can be seen in Figure 3, the average value of core losses of samples subjected to both Cycle 1 and 2 is below the maximum permissible limit, which means that they both meet the core losses requirements for this steel grade. In contrast, the average magnetic permeability is above the minimum permissible value only in samples subjected to Cycle 2 (Figure 4), which means that the average value of samples subjected to Cycle 1 does not meet the requirements of this steel grade.
Although annealing temperature (T = 790 °C) and soaking time (t = 1.5 h) were the same in both decarburizing cycles, there is a significant difference in the final C content, which is attributed to both thickness and changes in the decarburizing annealing conditions. Carbon content decreases from about 0.0325 wt % (average) to around 0.0133 wt % (average) when using Cycle 1 (85% N2-15% H2 gases ratio, and dew point of 21 °C), and it is reduced up to 0.0023 wt % C (average) when samples are subjected to Cycle 2 (80% N2-20% H2 gases ratio, and dew point of 25 °C). In addition, there exists a strong correlation between the resulting carbon concentration and core losses. The higher the carbon contents, the higher the core losses obtained. For example, core losses of 6.53 and 5.72 W/kg (average) are obtained with carbon concentrations of about 0.013% and 0.0023% C, respectively (Figure 3).
The maximum permissible core losses for the investigated GNO electrical steel grade are 6.84 W/kg, according to standard specifications. This value is indicated in Figure 3 by the dotted line for comparison with the results obtained in the present work in heat treated samples. As can be observed, the average core losses of samples subjected to Cycle 1 is very close to the maximum permissible limit, but core losses of samples annealed according to Cycle 2 are satisfactorily below the limit (Figure 3).
Magnetic permeability also changes significantly with carbon concentration, but in this case, this property increases as the amount of carbon decreases (Figure 4). Magnetic permeability varies from 1.97 × 10⁻³ to 3.00 × 10⁻³ Tm/A in samples subjected to Cycle 1 (0.013% C) and Cycle 2 (0.0023% C), respectively. Important to mention is that the minimum permissible permeability in the investigated electrical steel grade is 2.51 × 10⁻³ Tm/A, according to standard specifications. This value is shown in Figure 4 by the dotted line for comparison with the permeability obtained in samples subjected to the two decarburization annealing. As can be seen in this figure, while permeability of samples processed by Cycle 1 (0.013% C) is significantly lower than the minimum allowed value, the one resulting from Cycle 2 (0.0023% C) is considerably higher (Figure 4).
These results demonstrate that magnetic properties of these steels are enhanced by the reduction of C, which is favored if dew point is increased from 21 to 25 °C, and gases ratio is changed from of 85% N2-15% H2 to 80% N2-20% H2 (Figure 3 and Figure 4).
Some researchers investigate the effect of dew point on the efficiency of decarburization in non-oriented electrical steels [27]. They found that an increase in the dew point result is a faster steel decarburization which is consistent with the results obtained in the present work. The higher decarburization rate was associated with a lower oxidation of steel with the increase of dew point. Apparently, the conditions set for Cycle 1 cause higher oxidation of steel and make carbon removal from steel difficult resulting a lower decarburization rate.
Figure 5 shows the variation of the magnetic properties, core losses and magnetic permeability, as a function of the applied decarburizing annealing cycle. Important to mention is that samples subjected to Cycle 2 presented in this Figure had a thickness between 0.53–0.55 mm and carbon concentrations less than 0.003%, while samples subjected to Cycle 1 had a thickness between 0.551–0.58 mm and carbon concentrations between 0.006% and 0.015%. It is clear that samples with lower C content result in higher permeability and lower core losses being more significant when carbon content is lower than 30 ppm (Figure 5).
Figure 6 presents a contour graph showing the effect of carbon content on the core losses and permeability of samples subjected to Cycle 1 and Cycle 2. Worthy of mention is that the thickness of samples selected for this Figure varied from 0.53 to 0.55 mm in those subjected to Cycle 2 and from 0.551 to 0.58 mm in samples subjected to Cycle 1. The conclusion that can be drawn from this Figure is that the combination of a lower carbon concentration and a thinner thickness result in optimum magnetic properties: lower core losses and higher permeability.
The effect of carbon on the magnetic behavior of electrical steels has been extensively investigated. This alloying element reacts with other elements and forms carbides, which affect significantly the wall domain motion during magnetization of steel [8,28,29,30]. For this reason, samples with lower carbon concentrations result in better magnetic properties.
It can be observed in Figure 6 that when carbon content is about 0.003%, the obtained core losses vary between 5.30 and 6.07 W/kg, and permeability varies from 2.51 × 10⁻³ to 3.52 × 10⁻³ Tm/A. In contrast, with a carbon concentration of about 0.012%, core losses vary from 6.40 to 7.51 W/kg, while permeability changes in the range of 1.63 × 10⁻³–2.01 × 10⁻³ Tm/A, respectively. The variations in the magnetic properties for a given carbon range are related to the combined effects of grain size, thickness, texture and changes in the Ti, Sb and Mn concentrations, which will be discussed in next sections.

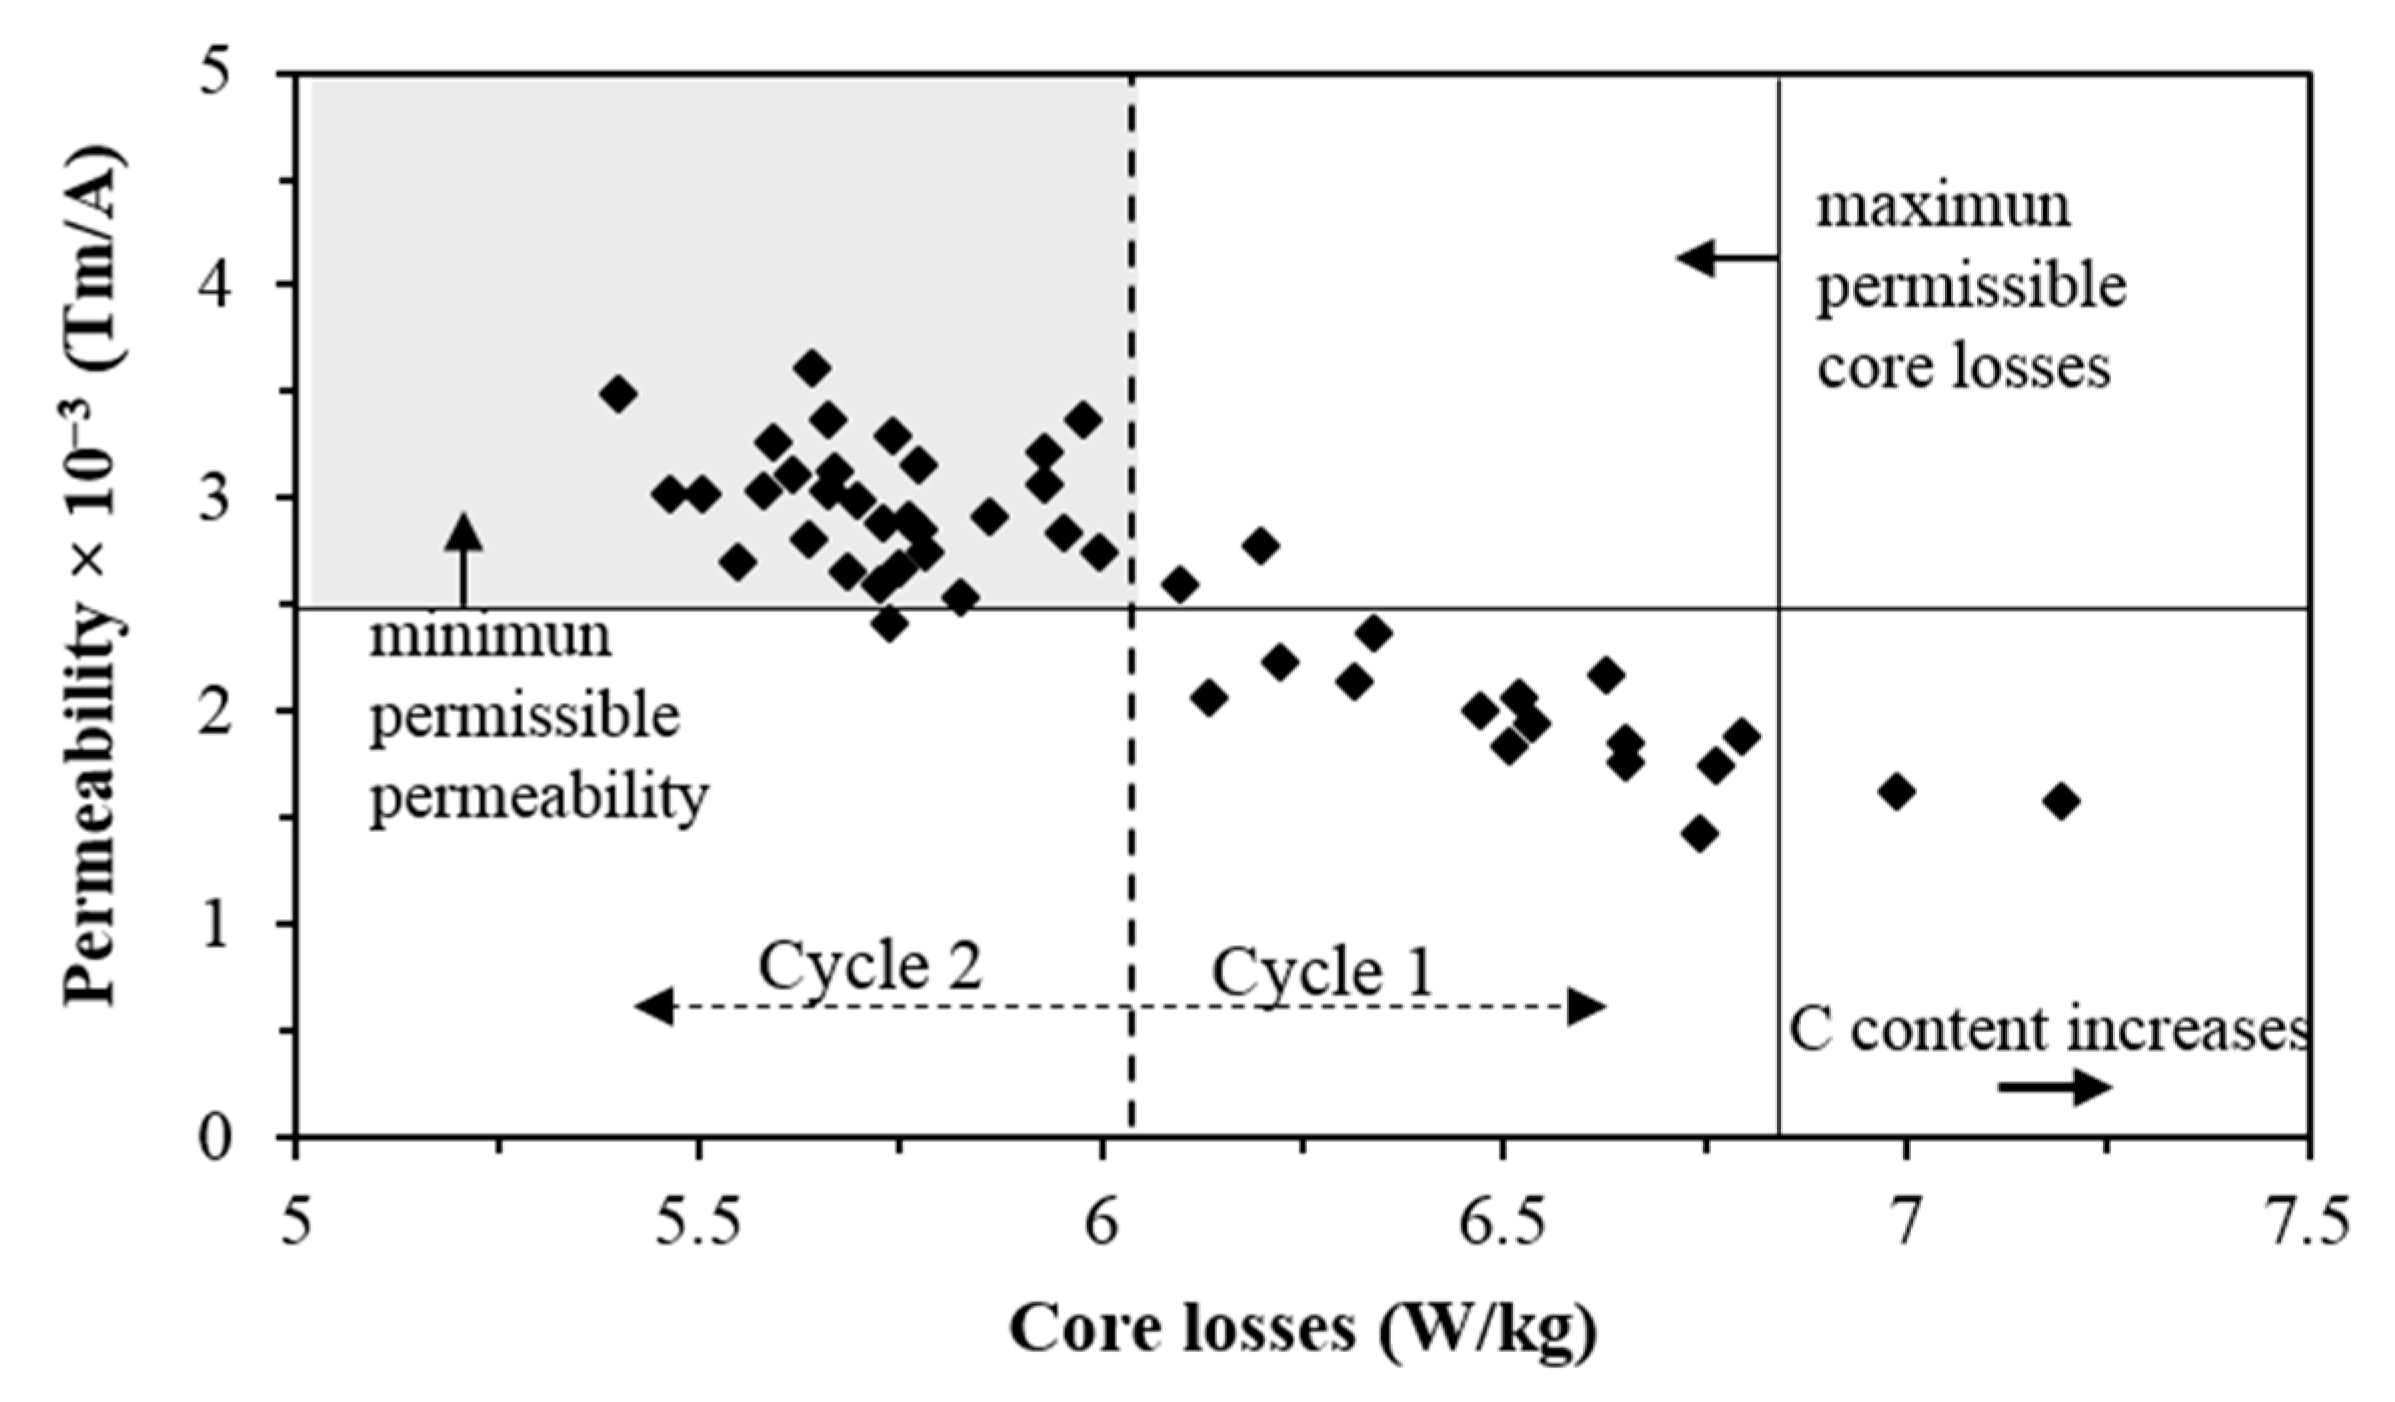
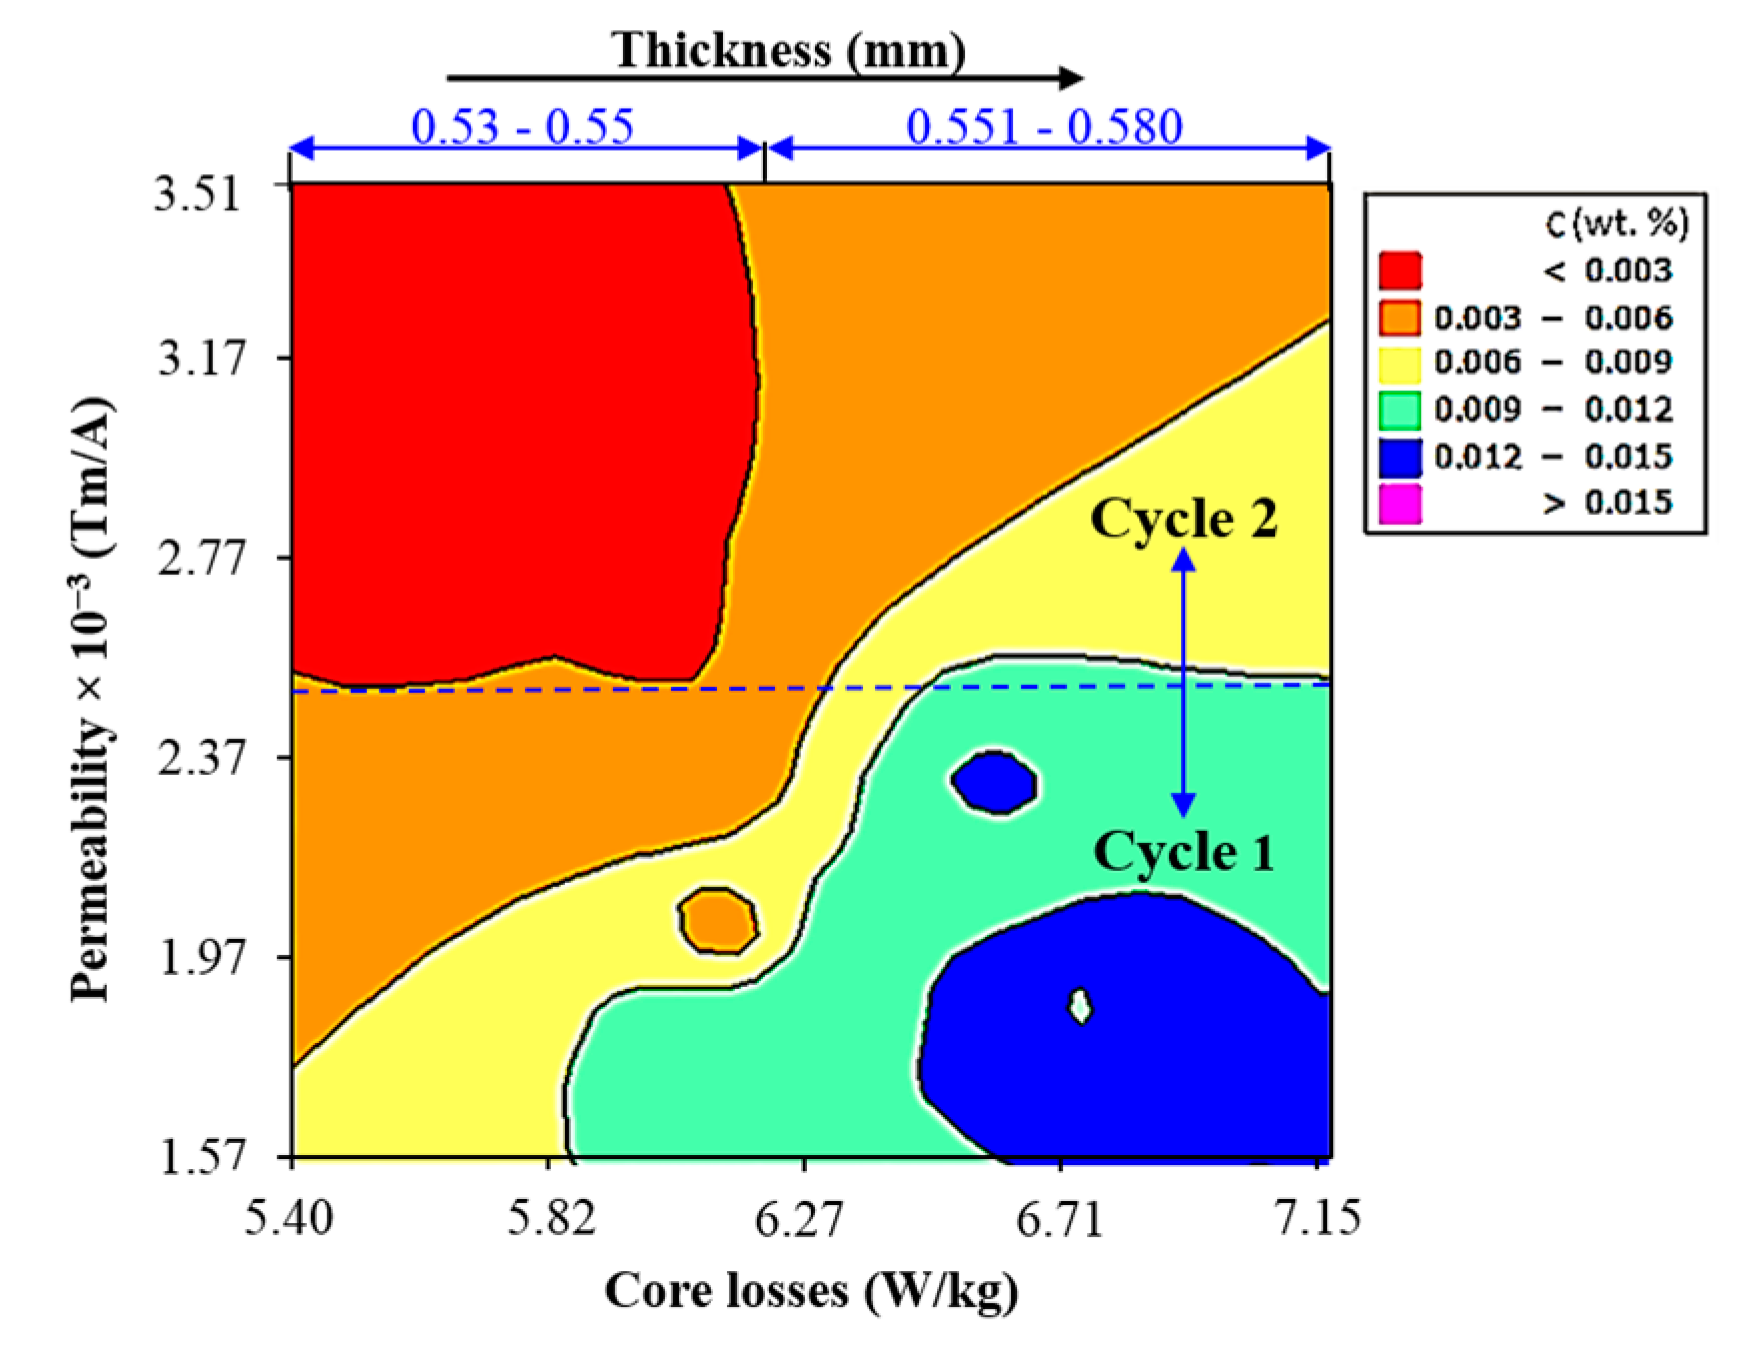
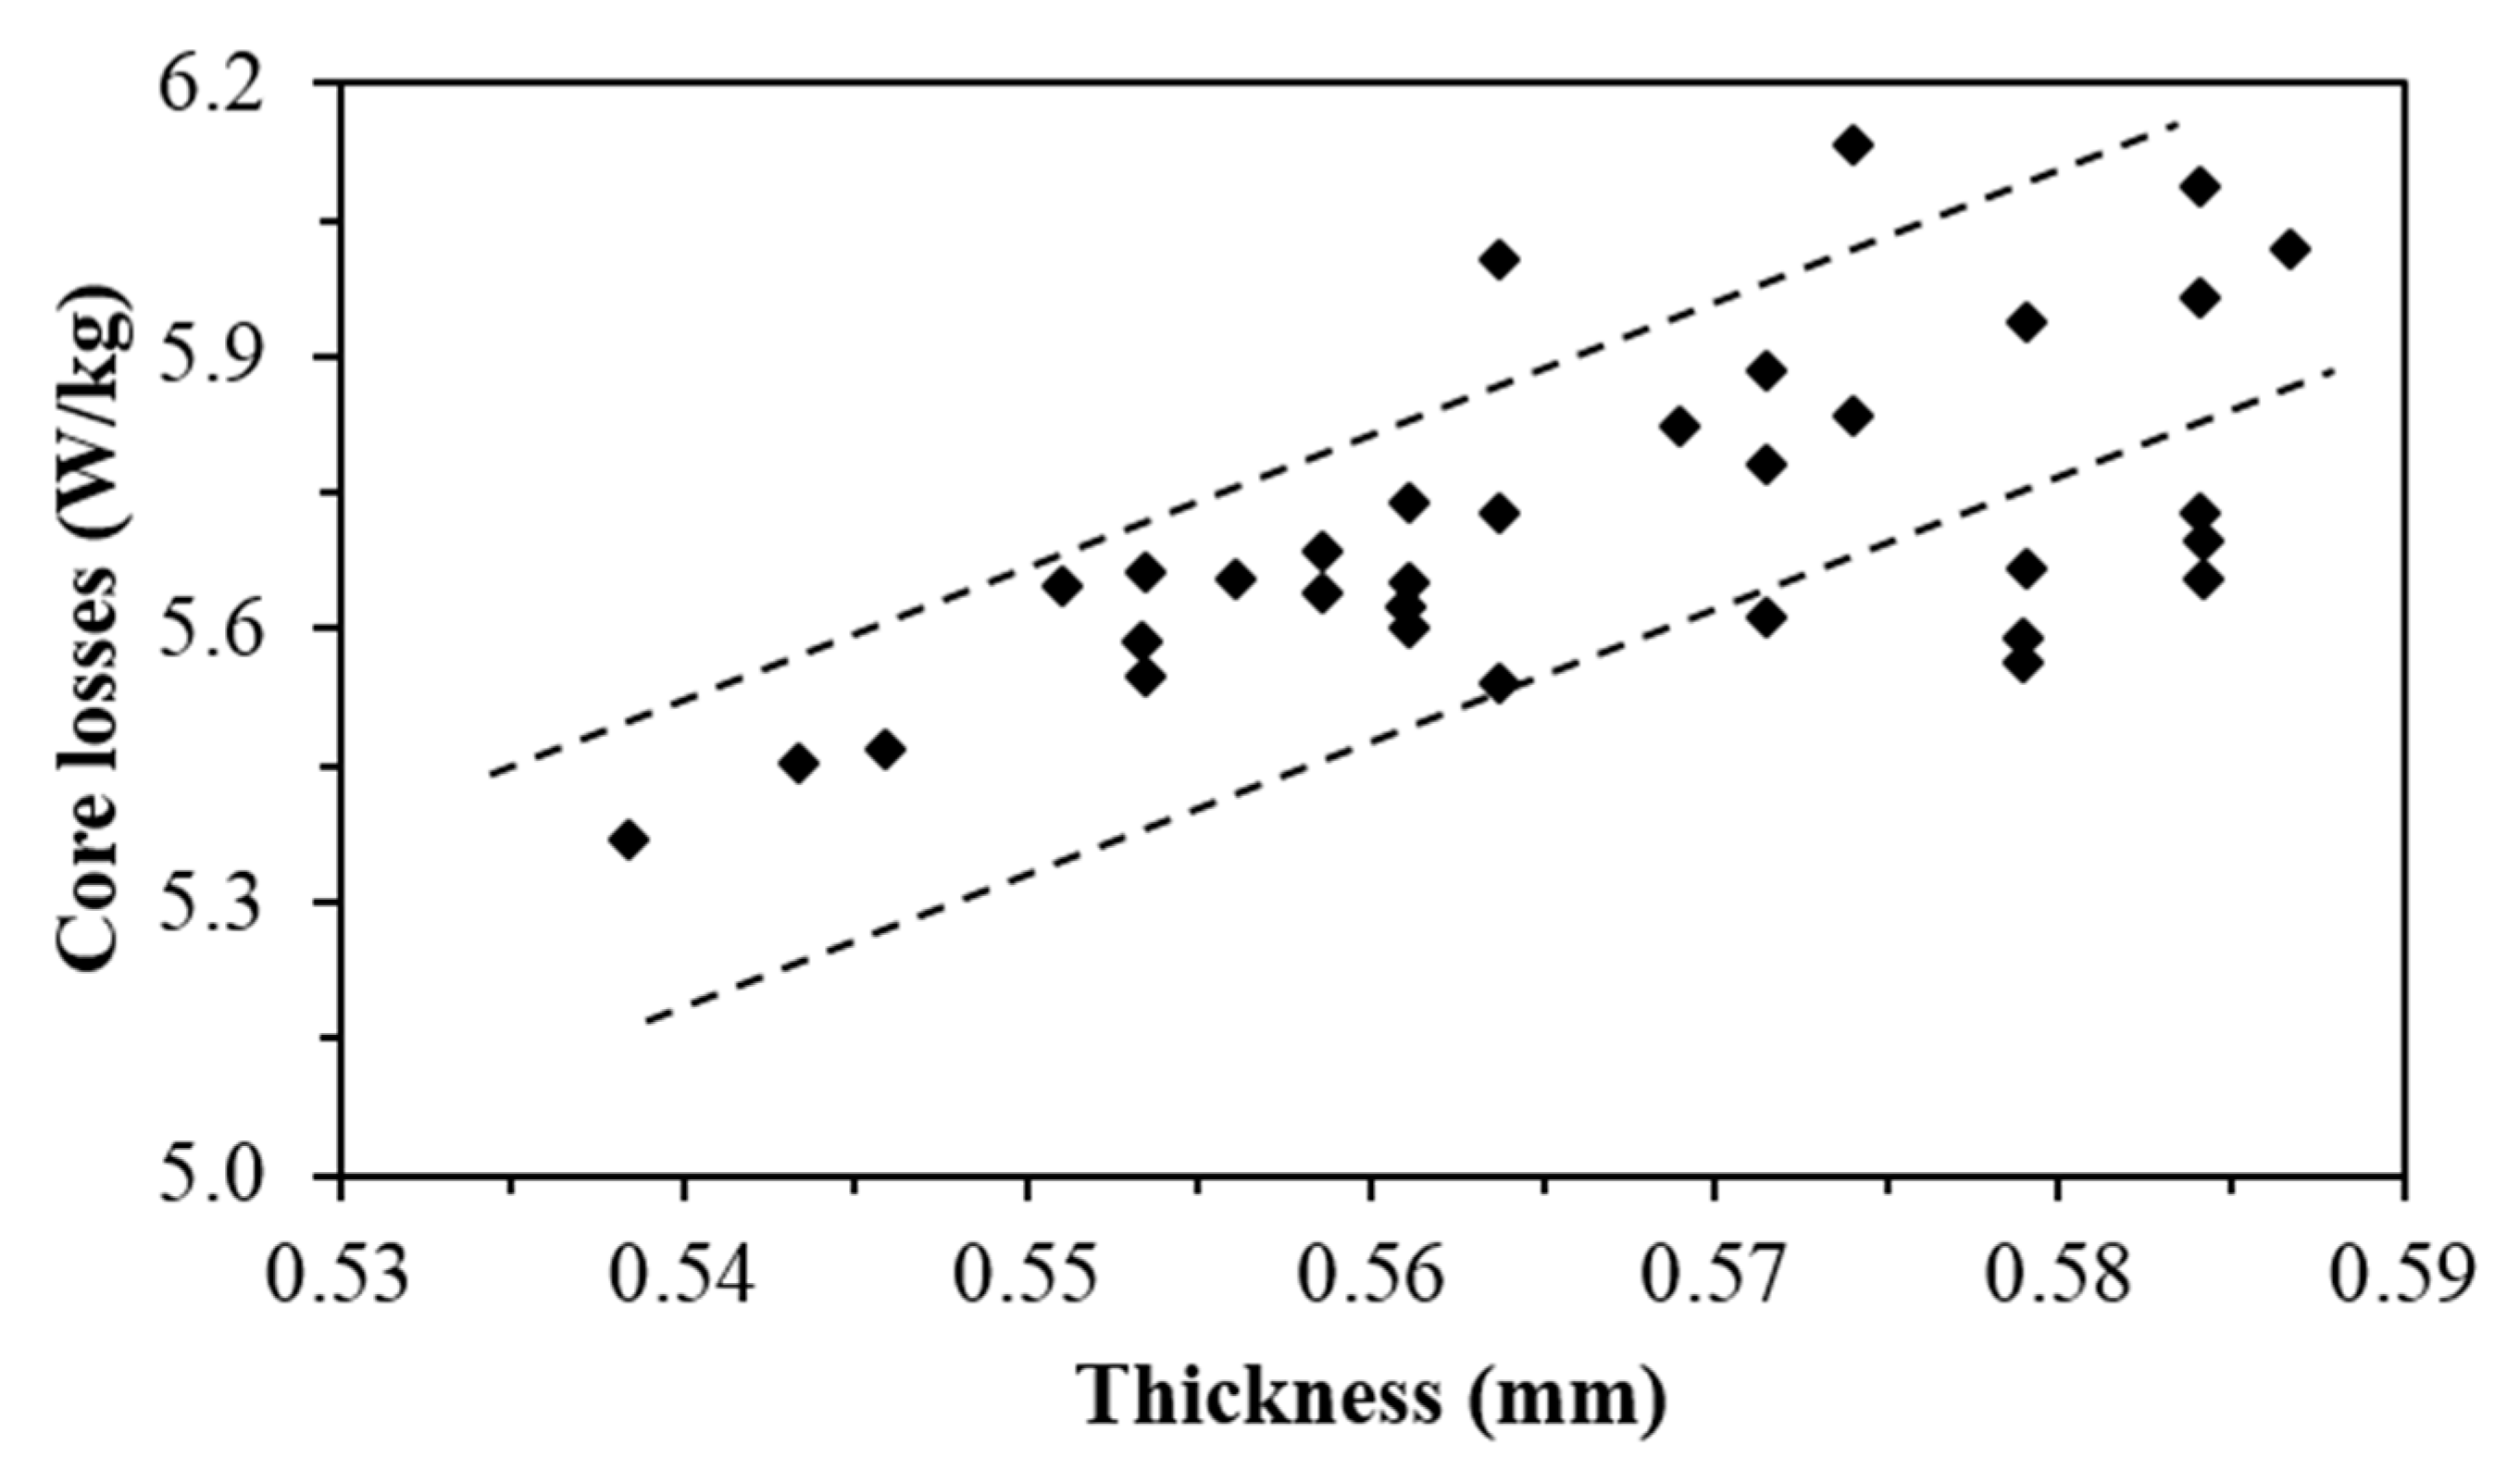
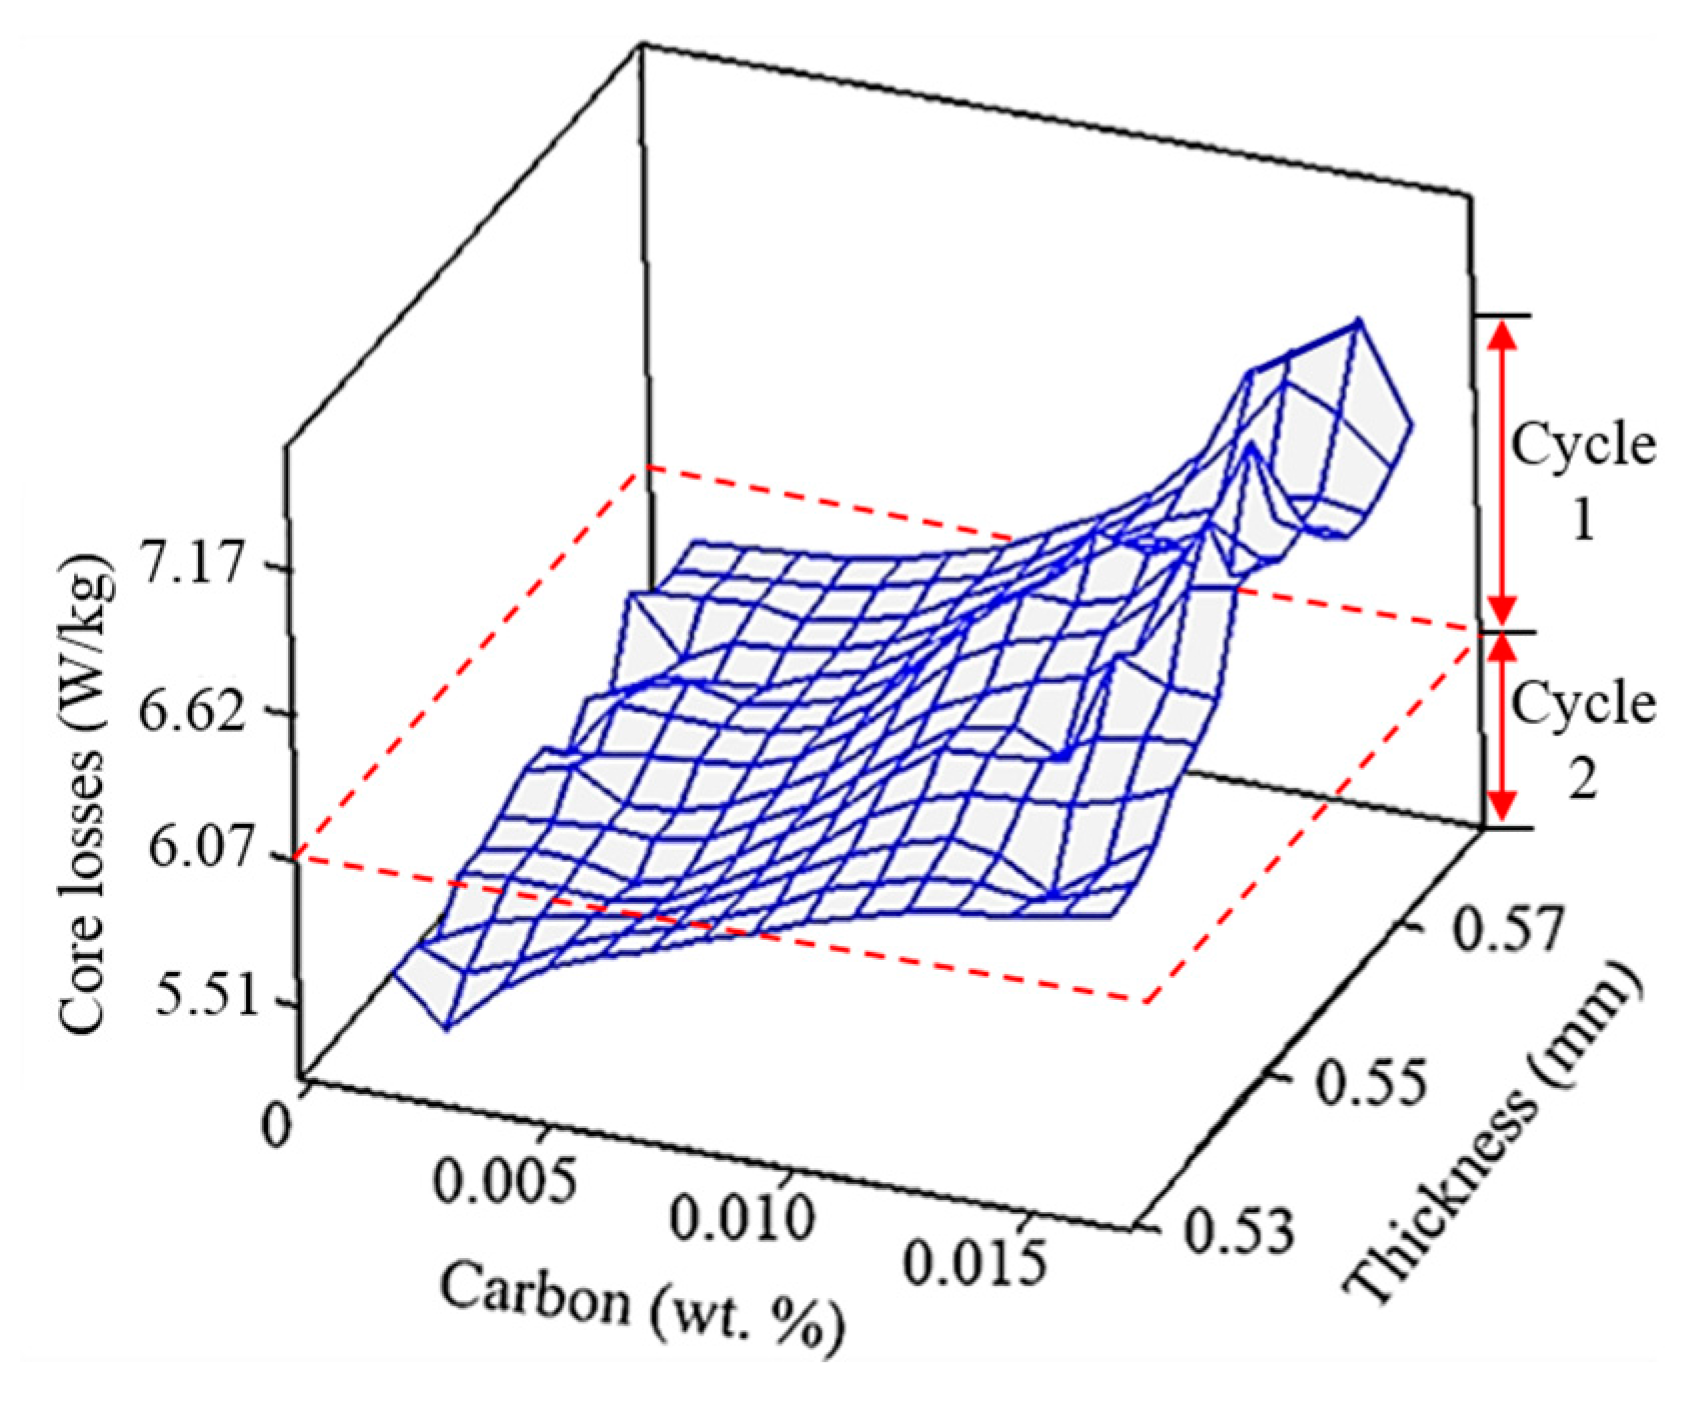
3.2. Influence of Steel Thickness on Core Losses

Figure 7 illustrates core losses of samples subjected to Cycle 2, which showed the lowest values, the thickness in these samples varied from 0.53 to 0.58 mm. As can be seen, core losses increase as the steel thickness is increased. The total core losses are considered as the sum of hysteresis losses (Wh) and eddy current losses (We) [12,15,28,31]. These later, are represented by the following equation [31]:
W e = k ( t f B ) 2 ρ
where k is a constant, t is the sheet thickness, f is the frequency, B is the magnetic flux density, and ρ is the resistivity.
According to Equation (4), reducing the steel thickness t causes a decrease of eddy current losses and contributes to minimize the total core losses, which is in agreement with the results obtained in this work. Eddy current losses are determined by flux per lamination and resistance of the lamination and they are, therefore, dependent on lamination thickness [14,31,32]. If steel thickness is reduced, eddy current losses and consequently total core losses are also decreased as observed in Figure 7.
The combined effects of carbon content and thickness on the magnetic properties of samples subjected to Cycle 1 and Cycle 2 are illustrated in Figure 8. As can be seen, higher thickness and higher carbon concentrations result in higher core losses. It can be concluded then, according to this figure, that to achieve the best performance in terms of magnetic properties, electrical steels must be processed with the minimum possible thickness and the lowest carbon concentration.

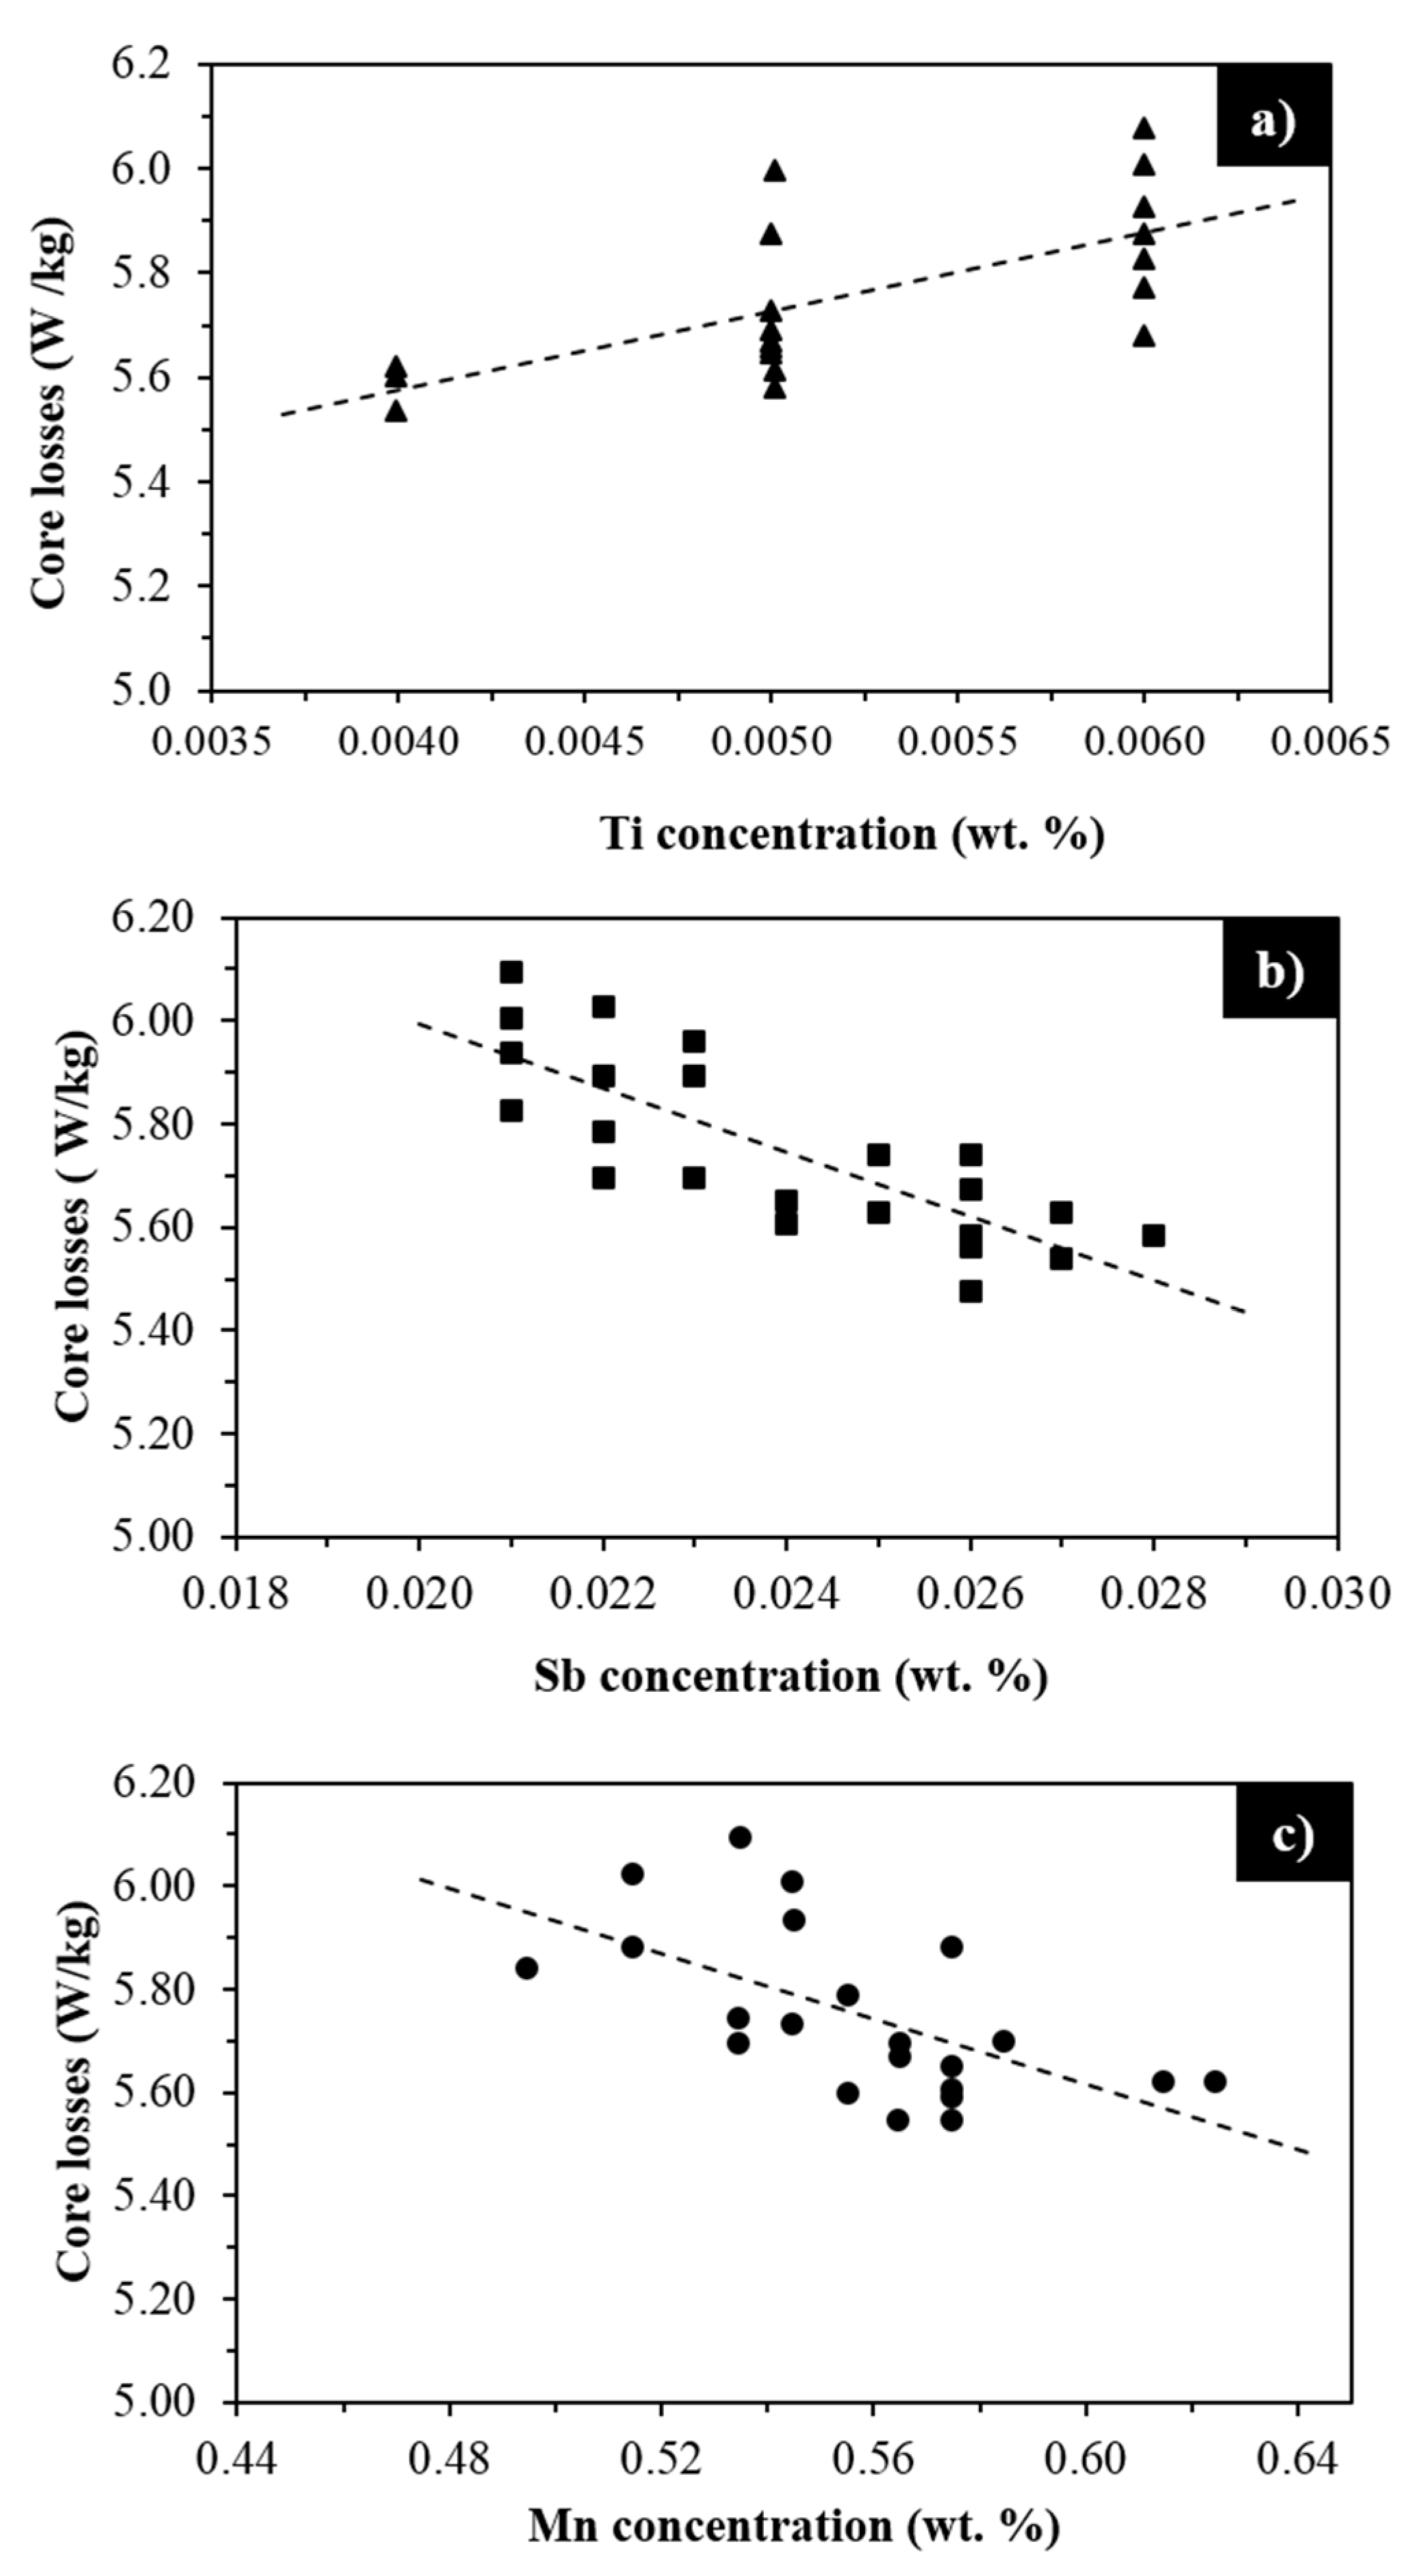
3.3. Effect of Ti, Sb and Mn Concentrations on Core Losses

In order to evaluate the effects of Ti, Sb and Mn on the magnetic properties of annealed samples, only those samples with lower carbon concentration and smaller thickness were considered. This selection was made considering the results presented in previous sections. Figure 9 shows the variation of core losses as a function of Ti, Sn and Mn concentrations in samples with a thickness between 0.53 and 0.55 mm and carbon concentrations lower than 0.003%, which correspond to samples subjected to Cycle 2.
As can be observed, these three elements have a significant influence on the magnetic properties. An increment in the amount of Ti causes an increase of core losses, however, this property is reduced by increasing the content of Sb and Mn resulting in an enhancement of the magnetic quality (Figure 9).
Alloying elements such as Si, Al, Sn, Sb, Mn and Ti (among others), increase the resistivity of steels, ρ, and therefore, according to Equation (4), could lead to a reduction of eddy current losses and consequently to total core losses [11,33,34]. For this reason, these elements are added to satisfy the required magnetic properties of a specific electrical steel grade.
Although Ti increases the steel resistivity by which the magnetic behavior could be enhanced, the results of the present investigation show that Ti has a detrimental effect. It has been reported that Ti has a strong affinity for carbon and nitrogen and forms very stable carbonitrides. Titanium carbonitrides affect the development of favorable textures, and wall domain motion during magnetization of steel sheets, which in turn has a detrimental effect on magnetic properties [34].

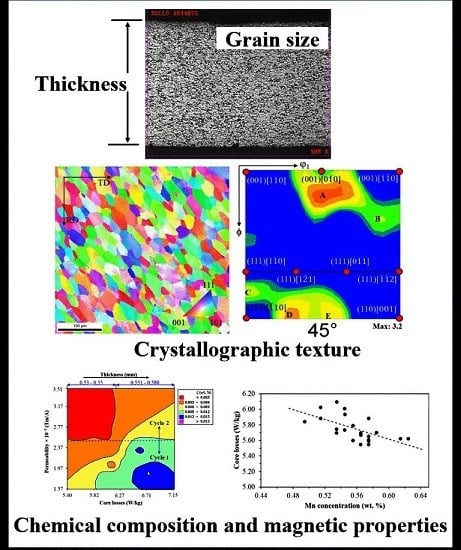
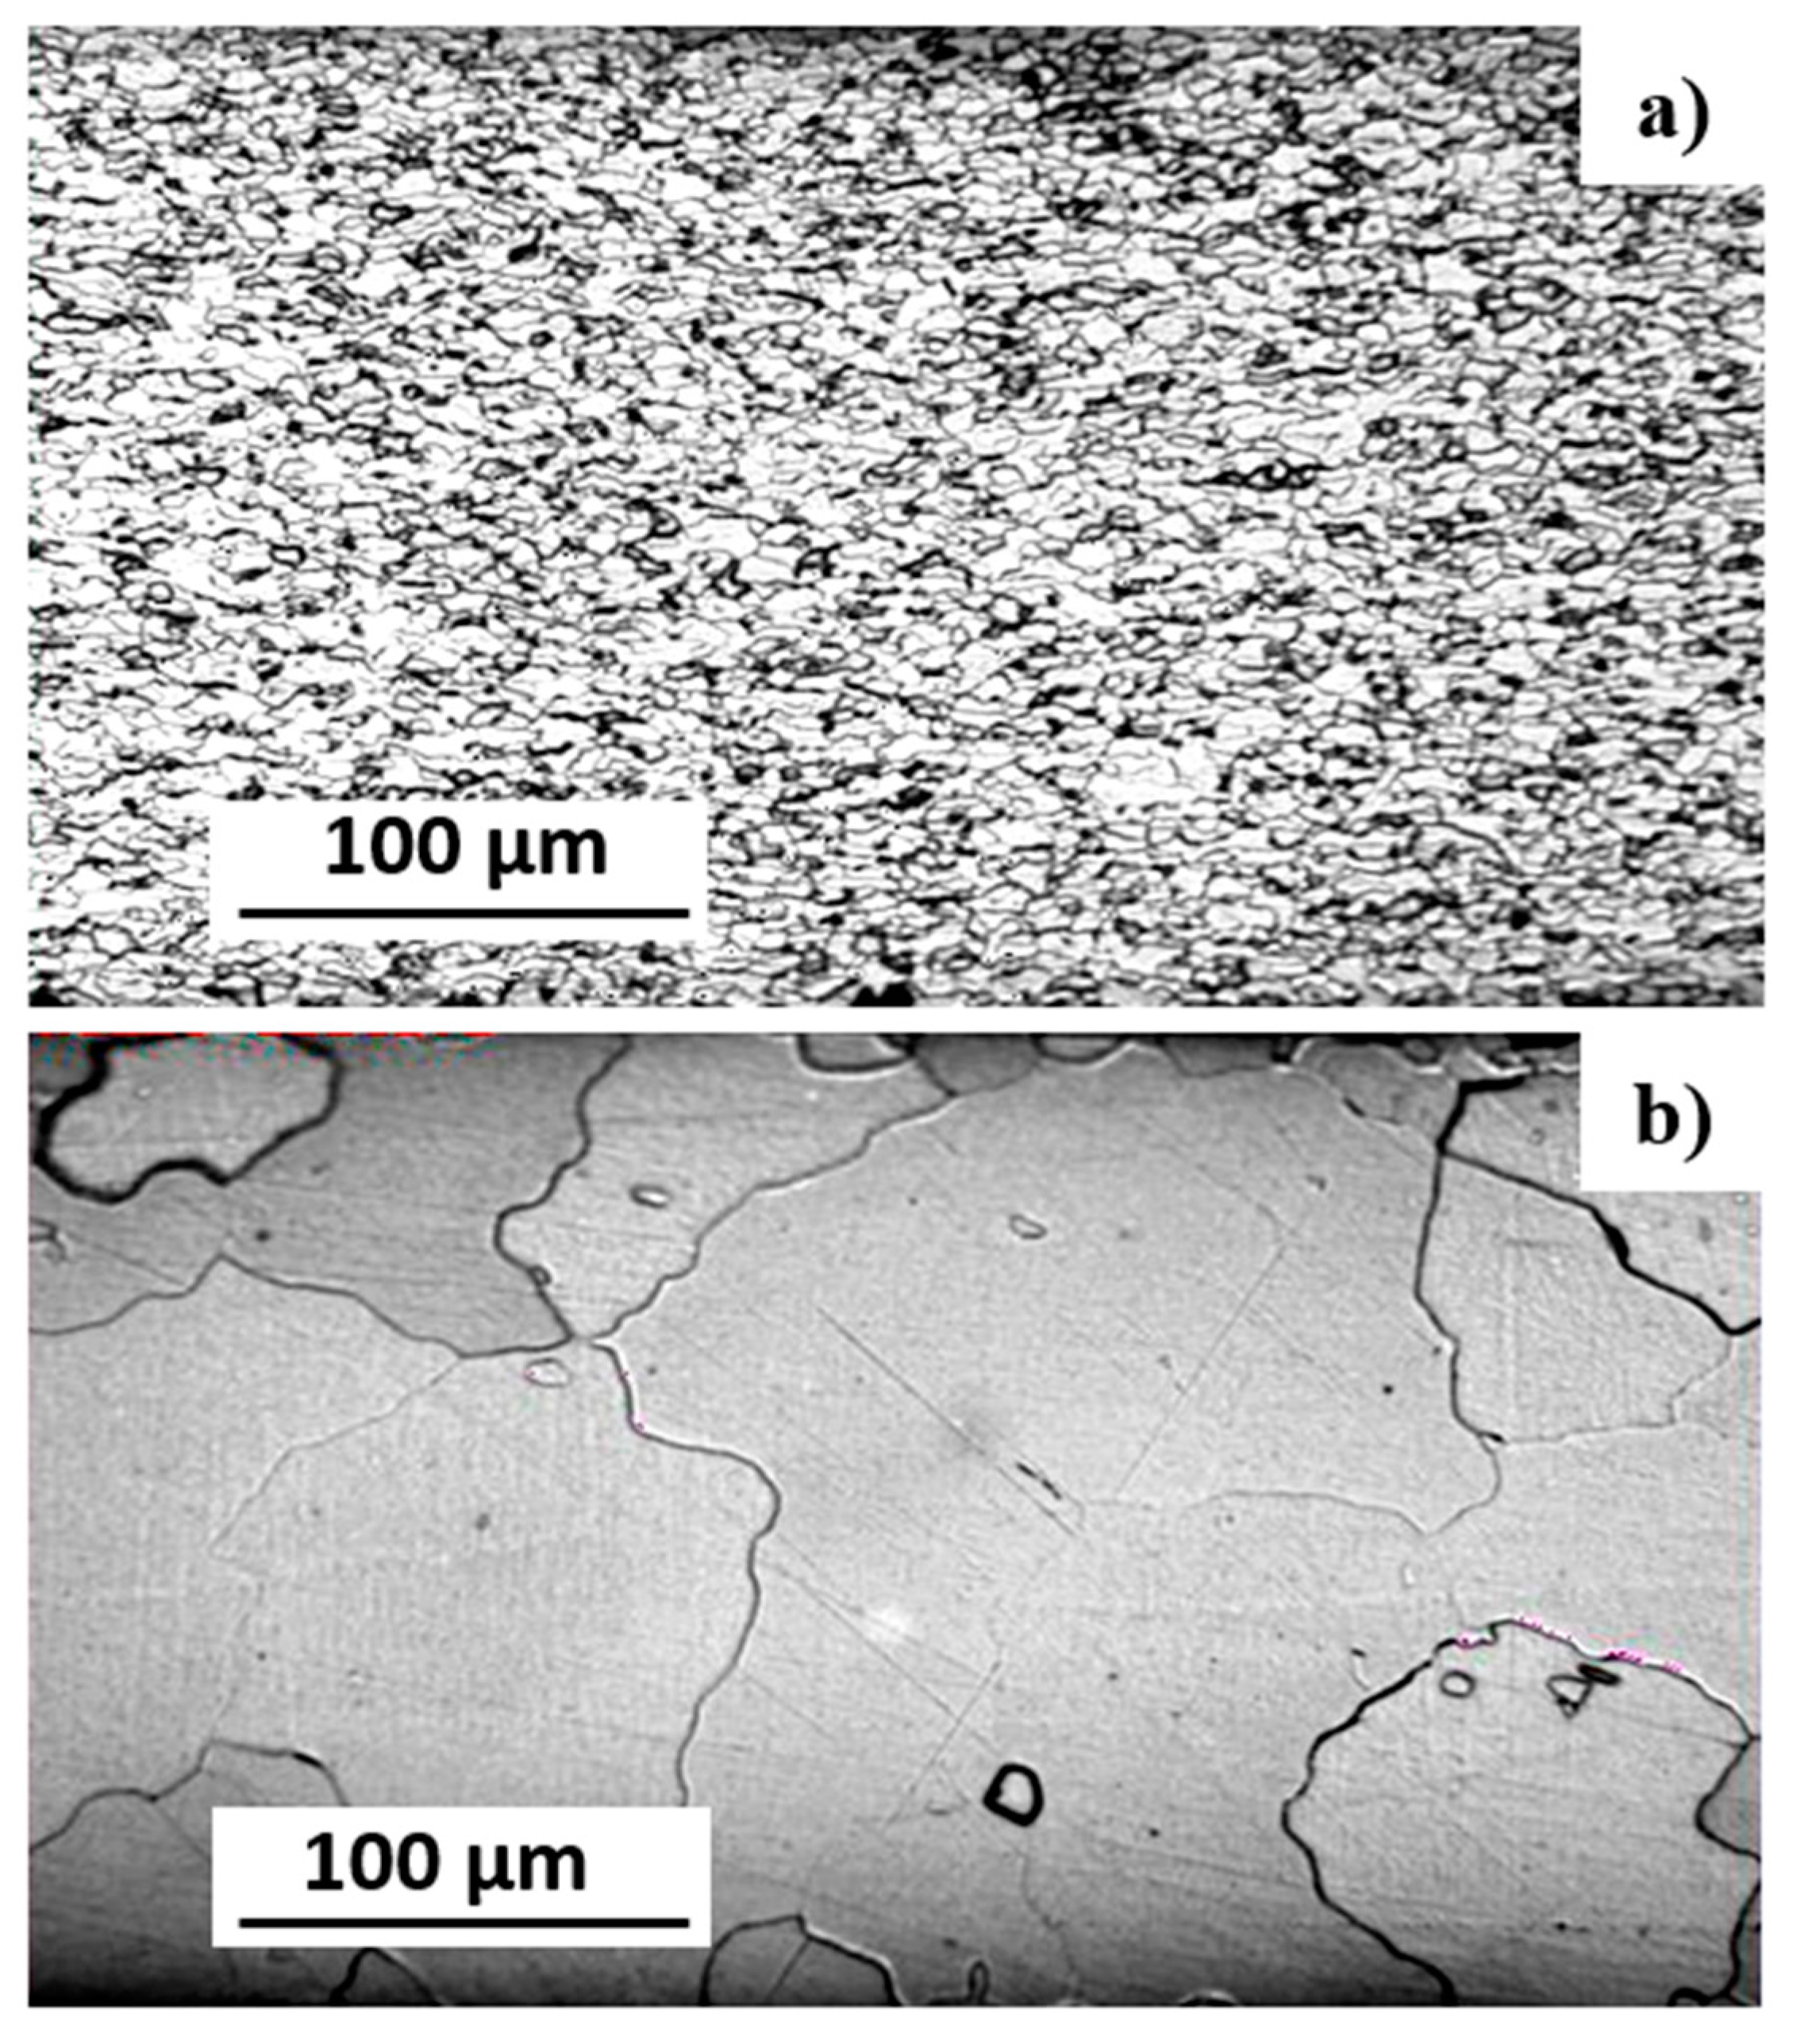
3.4. Effect of Grain Size on Magnetic Properties

Figure 10 shows a comparison between the microstructure of the temper-rolled steel before and after the decarburization annealing. As can be seen, a grain size ASTM 8 is obtained prior to decarburization (Figure 10a). However, after decarburization annealing (Cycle 2) grain size increases changing from ASTM 8 to ASTM 3 (Figure 10b). This result confirms that, the appropriate combination of small plastic deformation during temper-rolling and optimum decarburizing annealing conditions (gases ratio and dew point) favor grain growth during decarburization annealing. This result indicates that magnetic properties of the experimental electrical steels can also be enhanced by increasing grain size. Grain boundaries act as barriers for the domain wall motion during the magnetization process of steel [12]. Therefore, increasing grain size causes a reduction of the amount of obstacles to the magnetization process resulting in an enhancement of the magnetic behavior of these steels. It is well known that when grain size increases, hysteresis losses decrease, while eddy current losses increase. Therefore, there exists an optimum grain size that minimizes the total core losses (hysteresis losses + eddy current losses) [12,15,28,31].
Core loss (at peak induction of 1.5 T, and at frequency of 60 Hz, sinusoidal) is considered an important parameter when deciding on a suitable steel for a particular application. Some associations provide some standards to characterize soft magnetic materials under sinusoidal supplies like the Epstein frame method [35,36] used in the present work. The Epstein frame containing the test specimens (longitudinal and transverse) to be measured constitutes a transformer for which the total losses are measured by the wattmeter method. The total core losses can be obtained by the following equation [36]:
P t = P h + P p [ F 1 . 111 ] 2
where P t = measured specific total losses, in watts per kilogram, P h = apparent hysteresis losses, in watts per kilogram, P p = apparent eddy current losses, in watt per kilogram and P t = measured form factor [36].
It has also been reported that knowledge of the linear losses (longitudinal and transverse) is sufficient for designers to adequately estimate the behavior in a given machine design [8].
On the other hand, a number of theories describe the excess losses as the third component of the total core losses of fully finished, non-oriented electrical steel [37]. This third component was added as a result of the deviation between the measured and the calculated values [37]. Many authors have studied the mechanisms of their formation and there are many contradictory theories that can be found in the literature. Whereas Bertotti ascribes the excess losses to domain-wall processes, there are several authors who correlate the excess losses with the hysteresis losses and describe them as frequency-dependent hysteresis losses [37].
Although it is important to be able to actually measure excess loss as demonstrated in an extensively research literature regarding this topic, some problems abound [8]. For instance, a pure constant amplitude B vector cannot be created or rotated. This can be imposed by computer methods and powerful drive amplifiers, but in real machines such a regime never identically applies [8]. Losses are noted to differ if vector rotation is clockwise or anticlockwise, due probably to unevenness in grain texture. The directions of applied magnetizing field and attained magnetization vectors do not coincide and angular separation varies as the B vector moves [8].
According to the information above mentioned the excess losses, according to Bertotti’s analysis, were not considered.

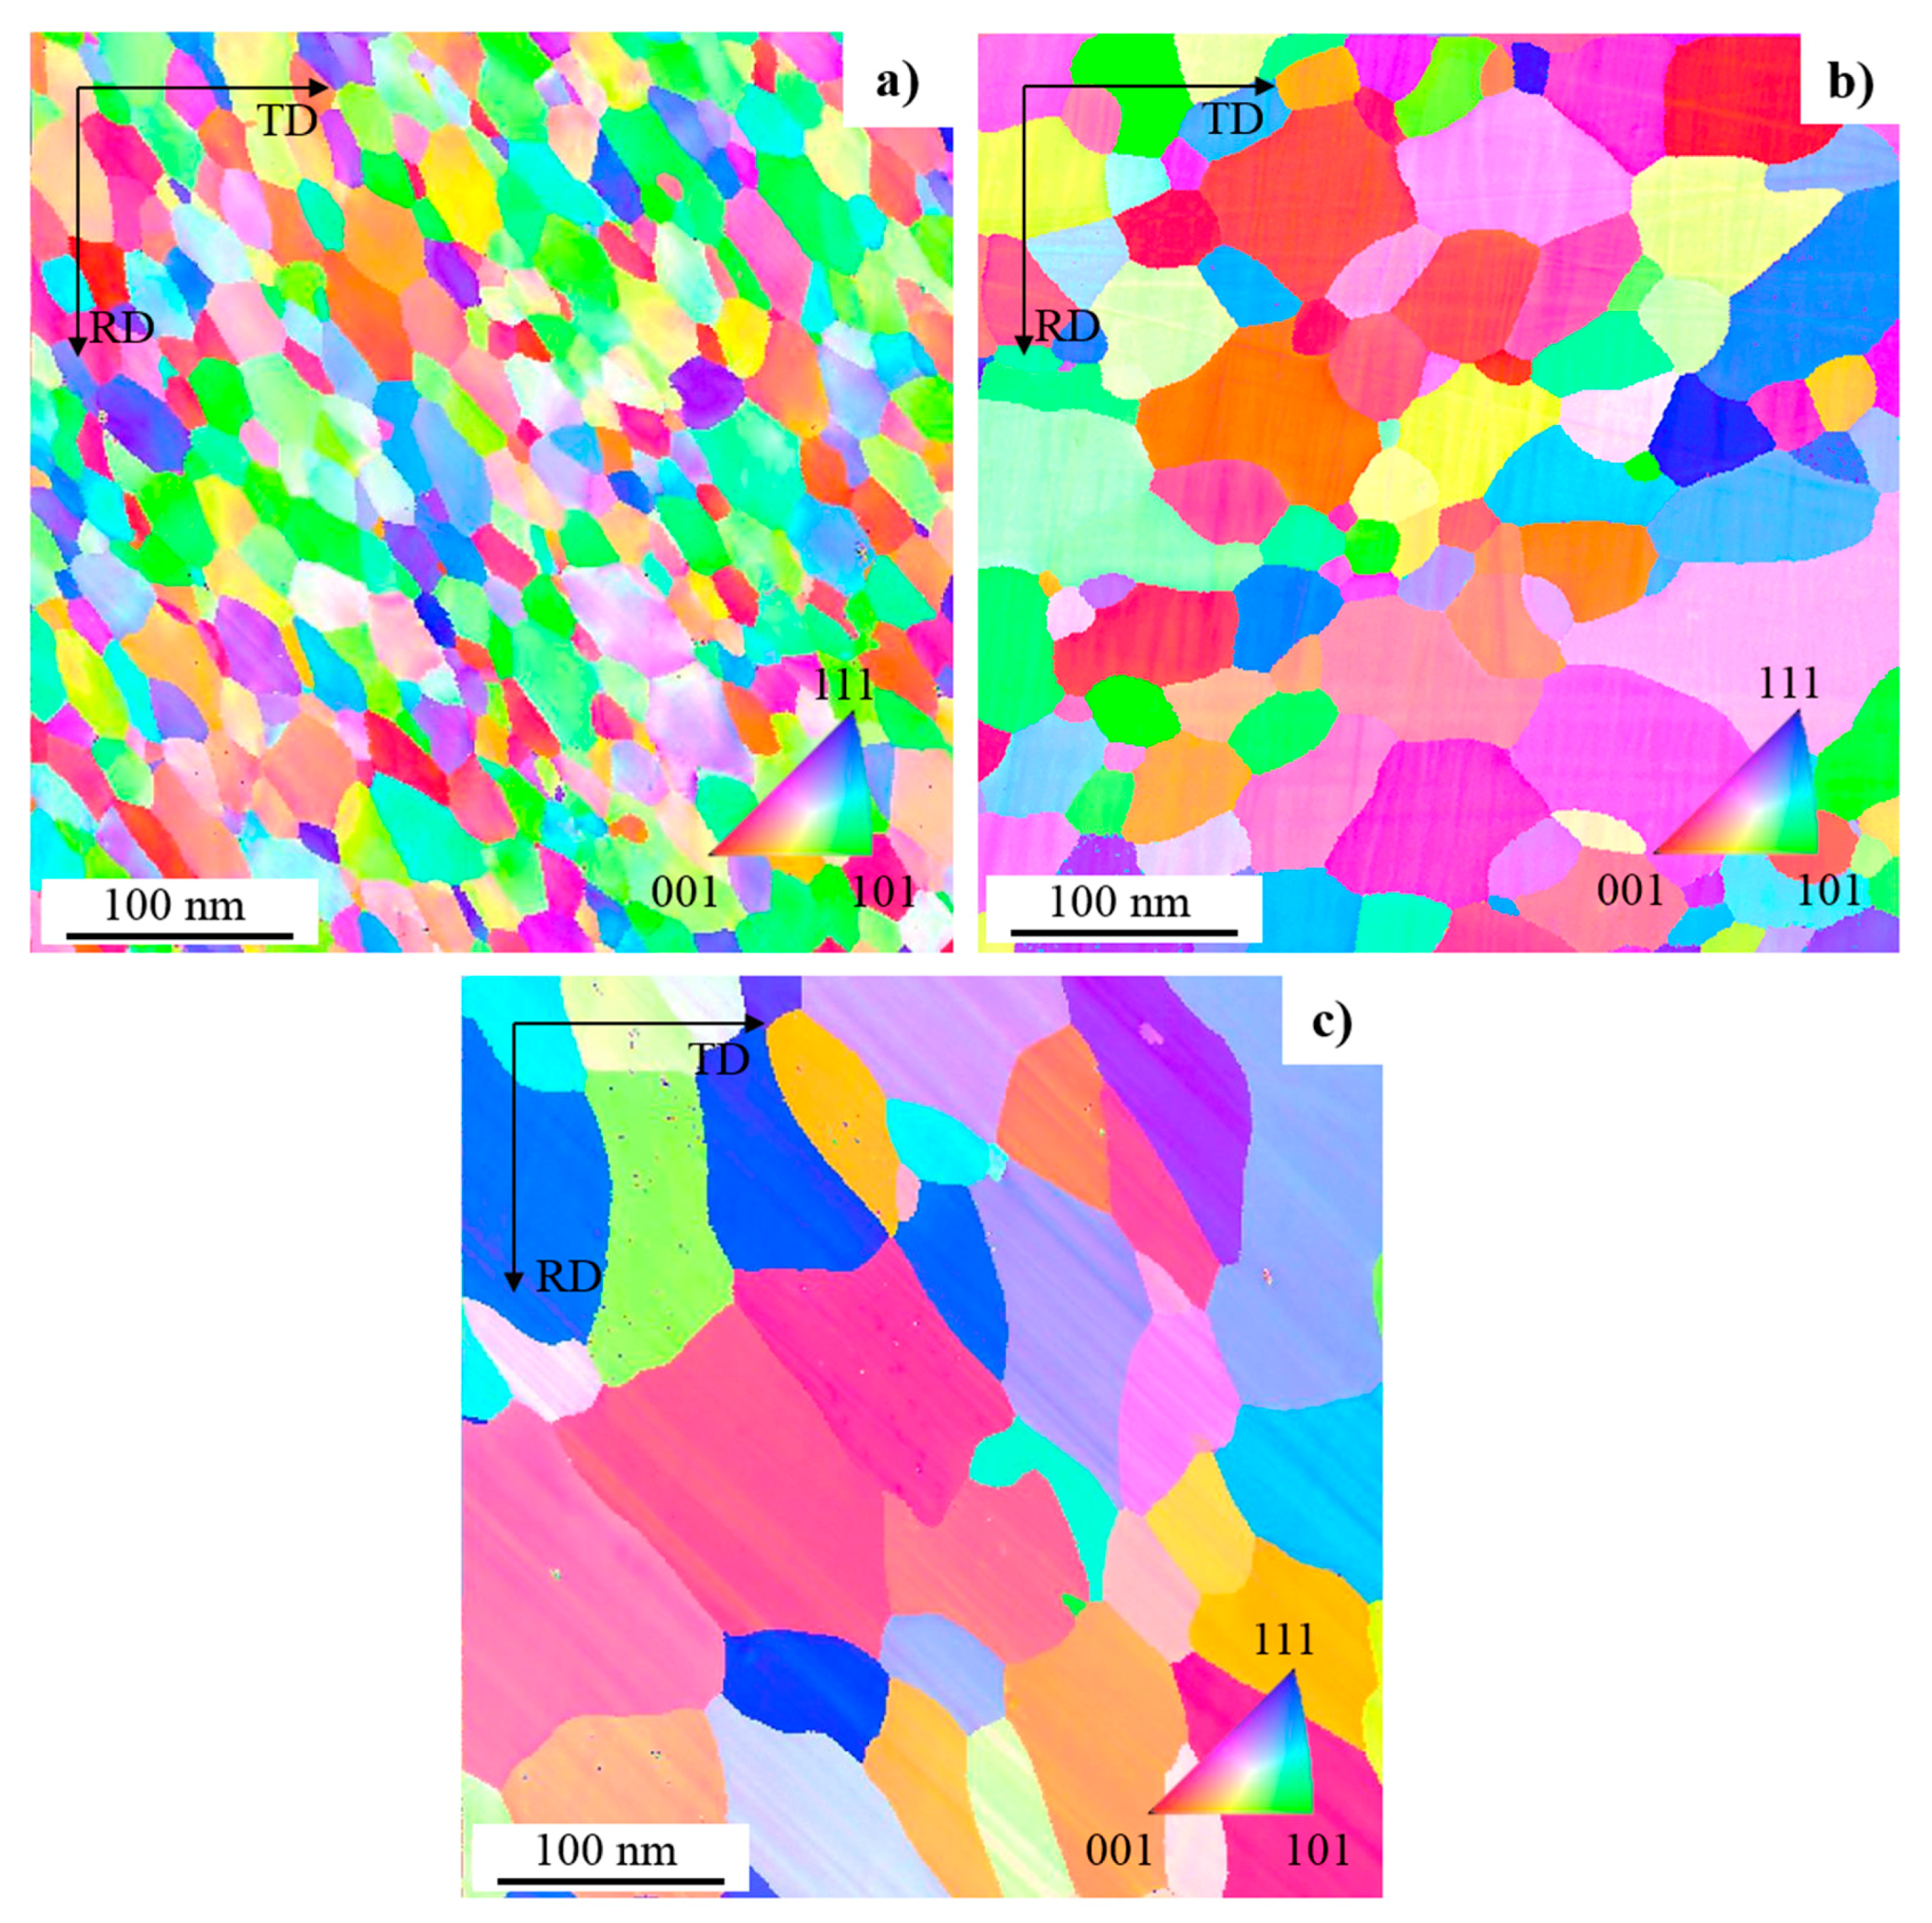
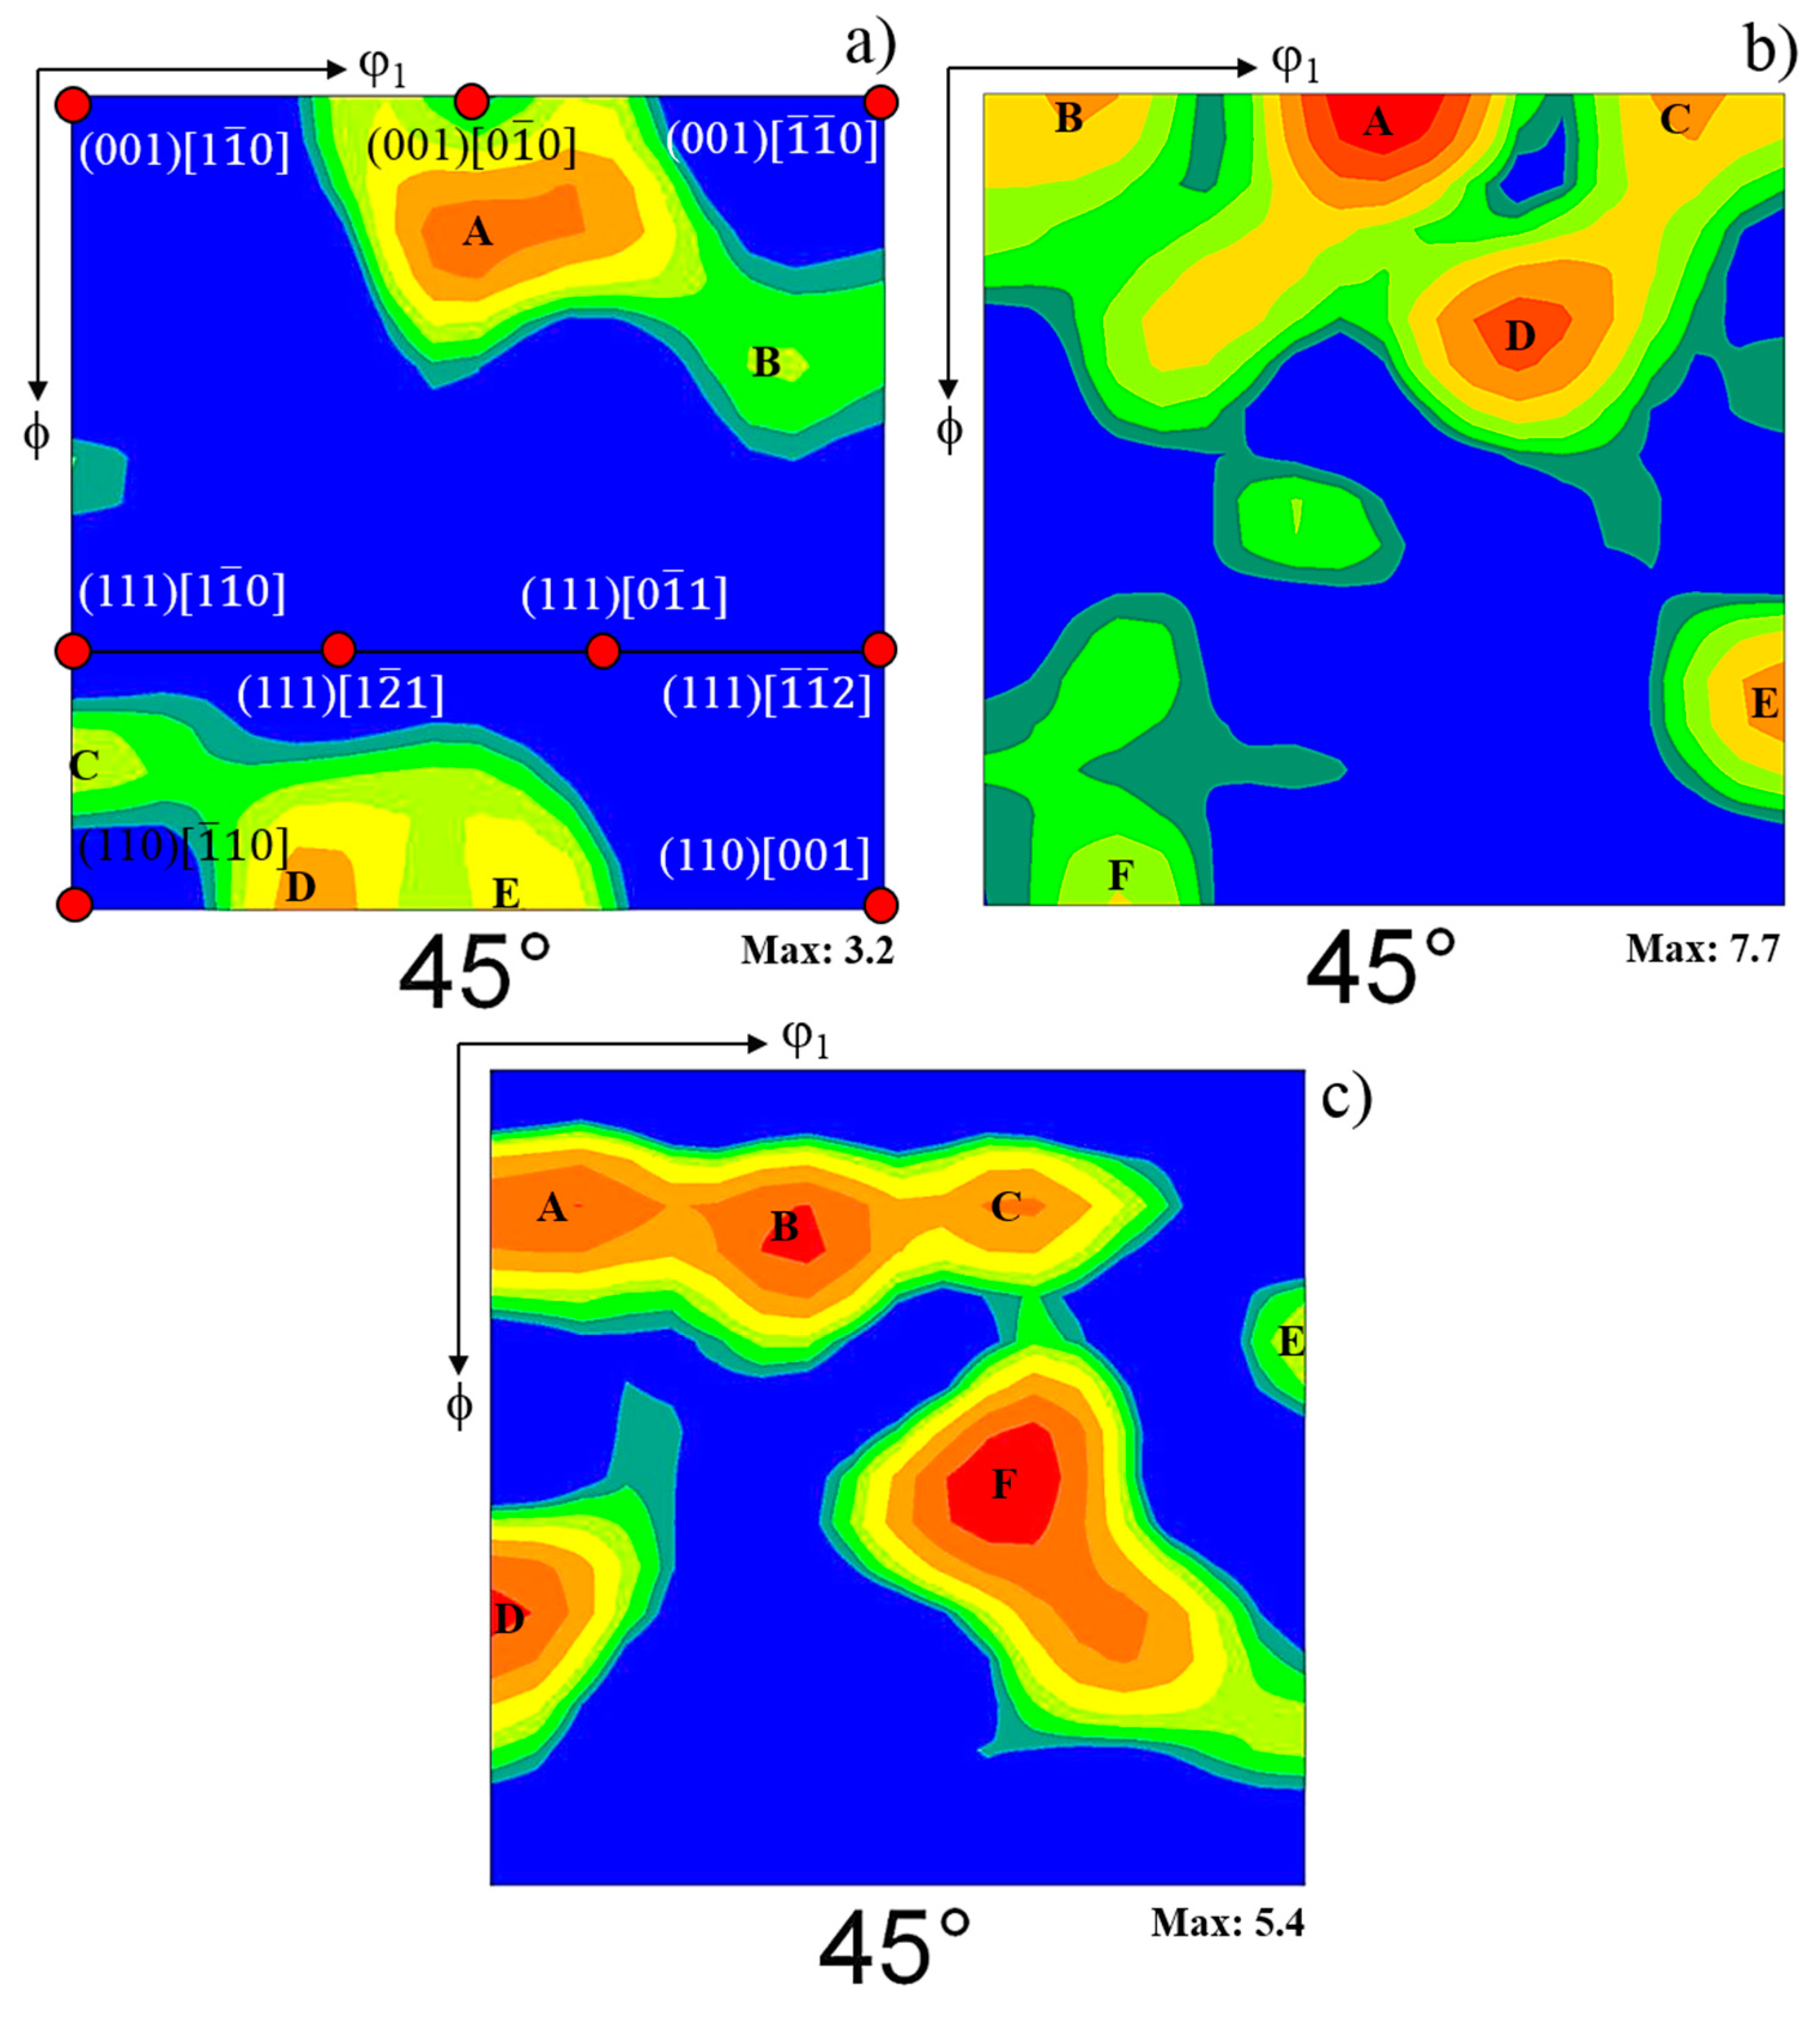
3.5. Effect of Decarburization Annealing on Crystallographic Texture

Analyses by electron backscatter diffraction (EBSD) were carried out to investigate if there was an effect of the decarburizing Cycle on the final texture. To this end the samples used for these analyses were those in the temper-rolled condition, and after being subjected to Cycle 1 and Cycle 2, which had carbon contents of 0.035%, 0.013% and 0.002%, respectively. These samples also had the lowest Ti concentration and the highest Sb and Mn contents. In the case of samples subjected to decarburization annealing they had the same thickness.
Figure 11 shows the orientation maps obtained in samples without decarburization (temper-rolled condition) and with decarburization annealing according to Cycle 1 and Cycle 2. Inverse pole figure (IPF) orientation maps use a basic RGB (red, green and blue) coloring scheme, fit to an inverse pole figure. For cubic phases, full red, green, and blue are assigned to grains whose <100>, <110> or <111> axes, respectively, are parallel to the projection direction of the IPF. Intermediate orientations are colored by an RGB mixture of the primary components. It is noteworthy that IPF has its own limitations; most notable is the coloring of pixels only by the projection-parallel crystallographic axis, independent of rotation about that axis [38,39]. Thus, grains with identical axes parallel to a specified IPF projection direction will have the same color in the IPF-based scheme, but may be in significantly different orientations. For example, two grains with <100> parallel to the surface normal are both colored red, but possess 30° of relative rotation about that axis. IPF-based orientation maps are most useful for displaying materials with strong fiber-textures and for understanding preferred orientations parallel to a sample direction of interest [38,39].
According to this Figure, it can be observed that samples exhibit significant differences in crystallographic texture developed, which means that decarburization annealing can modify this parameter.
On the other hand, ODF’s are 3D representations of “Euler space”, with the three Euler angles (φ1, ϕ, φ2) that describe the orientation of a crystal forming the axes. A crystal’s orientation is represented as a point within that space. The ODF may more clearly reveal component and fiber textures. The best description of a crystallographic texture in polycrystalline materials where a crystal with a volume V1 has an orientation g1, a crystal with volume V2 has an orientation g2 and so on, can be then described quantitatively by the orientation distribution function (ODF) [38,39]. This function can be represented in the Euler space in three dimensions, however, it is generally interpreted in two dimensions maintaining constant one of the three angles (φ1, ϕ, φ2) [38,39].
Figure 12 shows the φ2 = 45° section of the ODF of temper-rolled samples (Figure 12a) and decarburized samples (Figure 12b). In this figure are also shown the ideal texture components of BCC materials [40]. The main texture components that relate to good magnetic quality in annealed non-oriented electrical steels are the cube {001}<001> and rotated cube {001}<011> [28]. In contrast, the so-called γ-fiber texture, represented by {111}<uvw>, is very detrimental for electrical steels because the lowest permeability axis, <111>, is parallel to the normal direction of the sheet and should therefore be avoided [28]. The texture components resulting from temper rolling are: ( 115 ) [ 0 5 ¯ 1 ] , ( 225 ) [ 2 ¯ 3 ¯ 2 ] , ( 773 ) [ 1 1 ¯ 0 ] , ( 110 ) [ 3 3 ¯ 2 ] and ( 110 ) [ 4 4 ¯ 7 ] , represented in Figure 12a by letters A, B, C, D and E, respectively. The most important observation is the presence of orientations around the ( 115 ) [ 0 5 ¯ 1 ] texture component near to the ideal cube texture, and the absence of texture components belonging to γ-fiber texture (Figure 12a).
The texture developed in samples subjected to Cycle 1 is characterized by components ( 001 ) [ 0 1 ¯ 0 ] , ( 001 ) [ 2 3 ¯ 0 ] , ( 001 ) [ 2 ¯ 3 ¯ 0 ] , ( 113 ) [ 1 ¯ 5 ¯ 2 ] , ( 553 ) [ 3 ¯ 3 ¯ 10 ] and ( 110 ) [ 8 8 ¯ 3 ] , repsented by letters A, B, C, D, E and F in Figure 12b, respectively. The components ( 001 ) [ 0 1 ¯ 0 ] , ( 001 ) [ 2 3 ¯ 0 ] and ( 001 ) [ 2 ¯ 3 ¯ 0 ] which have the highest intensity, belong to the so called θ-fiber which is the more beneficial texture to optimize the magnetic behavior of these steels.
In the case of samples subjected to Cycle 2 the main texture components developed are: ( 115 ) [ 1 1 ¯ 0 ] , ( 114 ) [ 4 16 ¯ 3 ] , ( 115 ) [ 6 ¯   29 ¯   7 ] , ( 55 4 ) [ 1 1 ¯ 0 ] , ( 225 ) [ 5 ¯ 5 ¯ 4 ] , ( 334 ) [ 1 ¯   23 ¯   18 ] , represented in Figure 12c by letters A, B, C, D, E and F, respectively. This annealing Cycle promotes the development of orientations near to the ideal ( 111 ) [ 1 1 ¯ 0 ] texture component, which as mentioned above belongs to the most detrimental γ-fiber texture. Cube and rotated cube textures, which are the most beneficial textures for optimizing the magnetic behavior of these steels are not observed after decarburization annealing conducted according to Cycle 2.
As can be seen in Figure 11, the size and volume fraction of grains with their <111> axes parallel to the <001> sample direction is small (Figure 11a). After decarburization annealing of Cycle 1 the size and the amount of these grains increase (Figure 11b) resulting in an increase of the intensity of grains with orientations along the θ-fiber texture (Figure 12a,b). In contrast, samples subjected to Cycle 2 show larger grain size (Figure 11c), a reduction of the volume fraction of grains with orientations belonging to the θ-fiber texture and an increase of the volume fraction of grains with orientations near to the ideal γ-fiber texture.
It is clear that the reduction in carbon concentration during decarburization annealing favors grain growth. The samples with higher carbon content exhibit lower size (Figure 11a), while samples with lower carbon content have a larger grain size (Figure 11b,c). In addition, these results suggest that the decarburizing Cycle not only affects the final grain size, but also the final texture.
If grain size is favored by carbon removal, thus the results obtained suggest that the conditions established in Cycle 2 favored carbon removal and consequently grain growth.
Some researchers investigate the effect of dew point on the efficiency of decarburization [27]. They found that an increase in the dew point result is a faster steel decarburization which is consistent with the results obtained in the present work. They relate the higher was associated to a lower oxidation of steel with the increase of dew point [27]. Apparently, the conditions set for Cycle 1 cause higher oxidation of steel, which retards carbon removal and results in grains with smaller size (compare Figure 11b,c).
Variations in the resulting texture can be explained as a function of the decarburization rate. Samples subjected to Cycle 1 which result in a slower carbon removal present higher intensities of components belonging to θ-fiber. The presence of these components in non-oriented electrical steels subjected to low plastic deformations and subsequent thermal treatment has been explained in terms of the mechanism of strain induced grain boundary migration (SIBM) [41]. Temper-rolling involves stored energy accumulation, which varies with the orientation of the rolling plane according to the sequence E(110) > E(111) > E(100) [41].
Apparently, grains with their planes (001) parallel to the steel surface growth during heat treatment due to their low stored energy according to the ratio before mentioned. The increase of components near to the γ-fiber texture in samples subjected to Cycle 2, could be probably related to the higher mobility of grains <111>//ND [41].
Although tempered-rolled samples and samples subjected to Cycle 1 exhibited a better texture to optimize the magnetic properties of the experimental steels (considering the higher density of texture components belonging to the θ-fiber texture and the absence of the so-called γ-fiber texture), samples subjected to Cycle 2 resulted in better magnetic properties.
Therefore, it can be concluded that the effect of grain size on the magnetic behavior is more significant than the one of texture. It has been reported that grain bourdaries act as barriers to wall-motion.
According to Figure 3, Figure 4, Figure 5 and Figure 6 and Figure 8, magnetic properties are enhanced by the reduction of C concentration. Additionally, the microstructures present in Figure 10 show evidence that decarburization favors grain growth. Therefore, it can be concluded that for the experimental steel, the combined effects of C concentration and grain size are more significant than texture.
On the other hand, it has been reported that additions of Sb favor the development of (100) and (110) texture components at the expense of (111) components resulting in an improvement of the magnetic quality of these steels [20,42]. Manganese is supposed to retards the development of grains with (111) components and favors the development of grains having (100), (200) and (110) texture components [21,43], leading to an improvement of the magnetic properties of these steels.
As can be observed in Figure 12a, samples with temper rolling exhibit a set of orientation components near to the ideal cube texture, (001)[ 0 1 ¯ 0 ], and rotated Goss (110)[ 1 ¯ 10 ] texture components which is consistent with the additions of Sb in the experimental steel, however, after decarburization a completely different behavior is observed suggesting that apart from chemical composition, decarburization conditions also play an important role in determining the final crystallographic textures.

4. Conclusions

From the results obtained in this investigation, it can be concluded that:
(1)
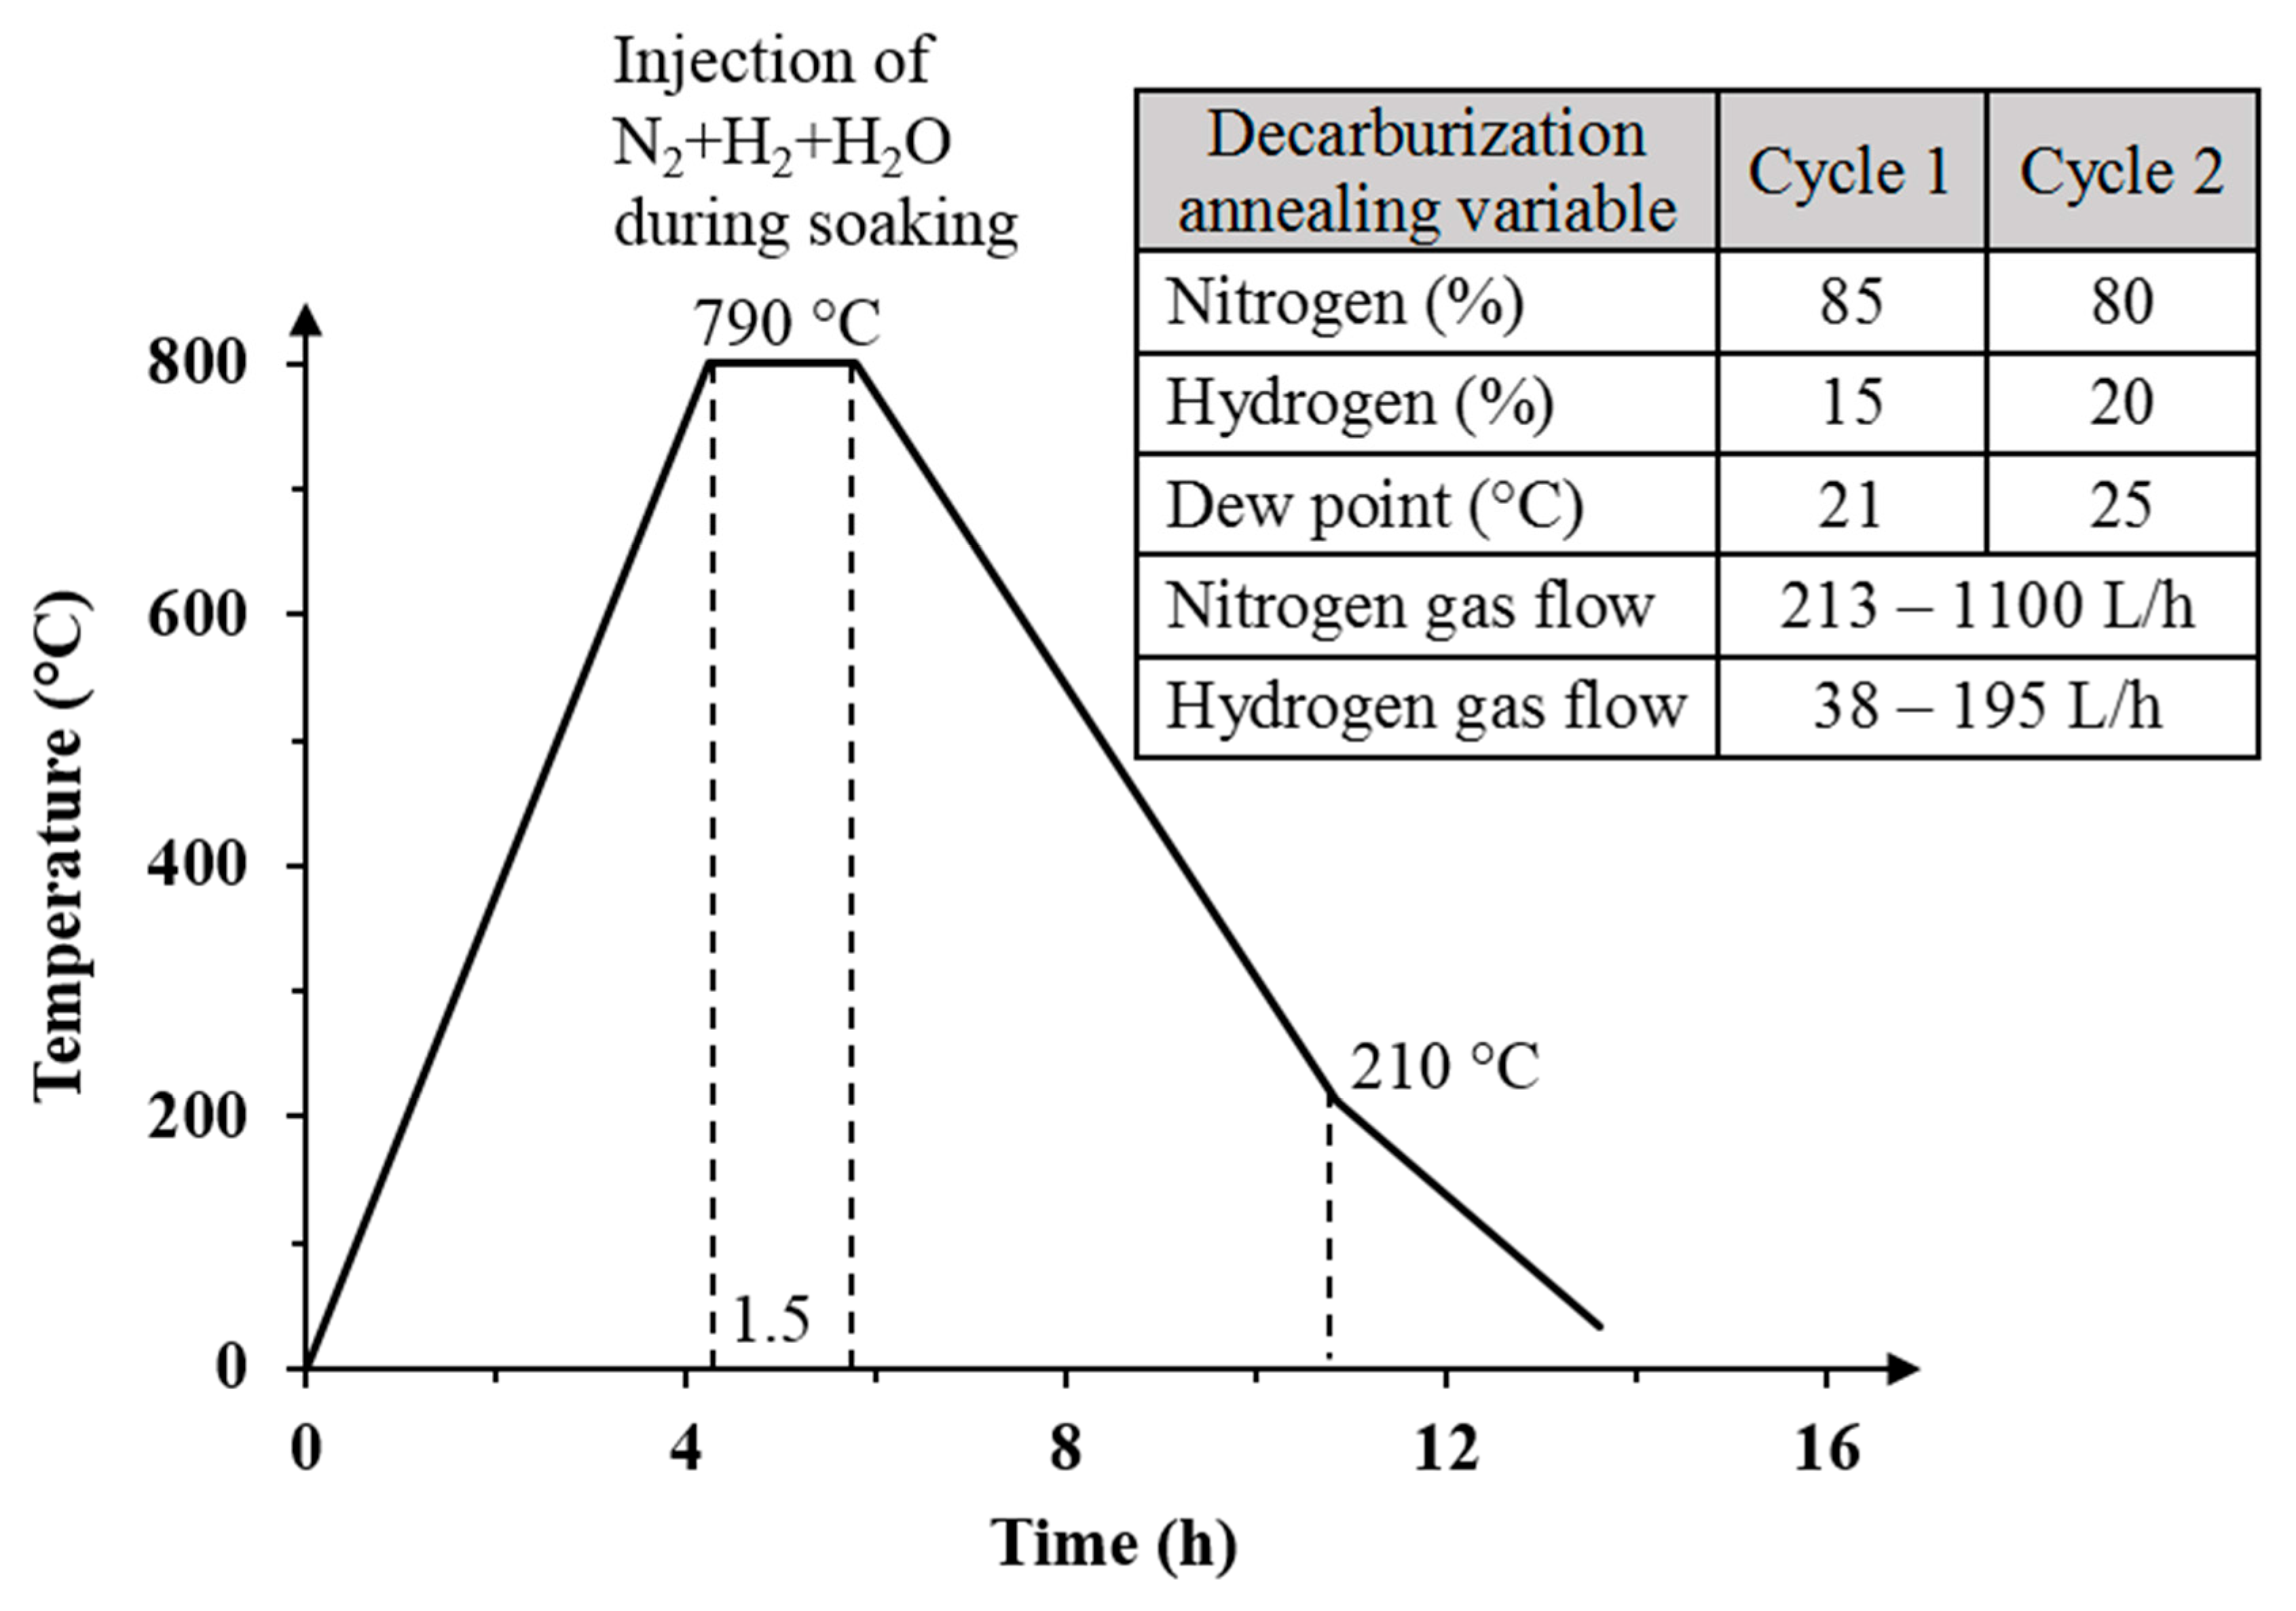
Magnetic properties of the experimental steels are enhanced by the reduction of C, which is favored if dew point is increased from 21 to 25 °C, and gases ratio is changed from of 85% N2-15% H2 to 80% N2-20% H2.
(2)
Grain size is also dependent on decarburizing annealing conditions, it changes from ASTM 8 in the temper rolled condition to about 4 and 3 when applying Cycle 1 (21 °C, 85% N2-15% H2) and Cycle 2 (25 °C, 80% N2-20% H2), respectively.
(3)
Crystallographic texture of temper-rolled samples is characterized by the presence of components near to the ideal cube texture, and the absence of components belonging to γ-fiber texture. Cycle 1 promotes the development of components ( 001 ) [ 0 1 ¯ 0 ] , ( 001 ) [ 2 3 ¯ 0 ] and ( 001 ) [ 2 ¯ 3 ¯ 0 ] which belong to the so called θ-fiber texture, while Cycle 2 favors the development of orientations near to the ideal ( 111 ) [ 1 1 ¯ 0 ] texture component, but in this case cube and rotated cube textures, were not developed.
(4)
Thinner thicknesses, higher concentrations of Sb and Mn, and lower C and Ti contents lead to lower core losses and higher permeability enhancing the magnetic behavior of the experimental GNO electrical steels. Therefore, the best magnetic properties were obtained when applying Cycle 2 independently of the crystallographic texture developed.
(5)
Additions of Mn and Sb increase the resistivity reducing the total core losses. Although Ti was expected to reduce core losses since it also increases the electrical resistivity, an opposite behavior was observed. Apparently, the strong affinity of Ti for carbon and nitrogen promotes the formation of stable carbonitrides which affect the wall domain motion during magnetization causing a detrimental effect on magnetic properties.

Acknowledgments

The authors of the present investigation appreciate all the facilities to carry out the experimental work at Altos Hornos de México S. A. B. de C. V. (AHMSA), Center for Research and Advances Studies of The National Politechnique Institute (CINVESTAV-Saltillo) and at The Institute of Metallurgy of The Autonomous University of San Luis Potosi (IM-UASLP).

Author Contributions

Nepthali Calvillo designed and performed the experiments and characterization of microstructure by optical microscopy; Ma. de Jesús Soria and Francisco R. Carrillo discuss the results and wrote the first draft of the manuscript; Armando Salinas realized the texture measurements by electron backscatter diffraction; Emmanuel J. Gutiérrez and Ivan A. Reyes measure the magnetic properties, review and correct the manuscript. All authors revised and approved the final version of the manuscript.

Conflicts of Interest

The authors declare no conflict of interest.

References

  1. Moses, A.J. Energy efficient electrical steels: magnetic performance prediction and optimization. Scr. Mater. 2012, 67, 560–565. [Google Scholar] [CrossRef]
  2. Gautam, J. Control of Surface Graded Transformation Textures in Steels for Magnetic Flux Carrying Applications. Ph.D. Thesis, Delft University of Technology, Delft, The Netherlands, March 2011. [Google Scholar]
  3. Fischer, O.; Schneider, J. Influence of deformation process on the improvement of non-oriented electrical steel. J. Magn. Magn. Mater. 2003, 254, 302–306. [Google Scholar] [CrossRef]
  4. Jacobs, S.; Hectors, D.; Henrotte, F.; Hafner, M.; Herranz, M.; Hameyer, K.; Goes, P. Magnetic material optimization for hybrid vehicle PMSM drive. World Electr. Veh. J. 2009, 3, 1–9. [Google Scholar]
  5. Sidor, Y.; Kovac, F. Microstructural aspects of grain growth kinetics in non-oriented electrical steels. Mater. Charact. 2005, 55, 1–11. [Google Scholar] [CrossRef]
  6. Bacaltchuk, C.M.B.; Castello, G.A.; Ebrahimi, M. Effect of magnetic field applied during secondary annealing on texture and grain size of silicon steel. Scr. Mater. 2003, 48, 1343–1347. [Google Scholar] [CrossRef]
  7. Park, J.T.; Szpunar, J.A. Effect of initial grain size on texture evolution and magnetic properties in nonoriented electrical steels. J. Magn. Magn. Mater. 2009, 321, 1928–1932. [Google Scholar] [CrossRef]
  8. Beckley, P. Electrical Steels for Rotating Machines, 1st ed.; The Institution of Engineering and Technology: London, UK, 2002; pp. 69–72. [Google Scholar]
  9. Chang, S.K.; Huang, W.Y. Texture effect on magnetic properties by alloying specific elements in non-grain oriented silicon steels. ISJ Int. 2005, 45, 918–922. [Google Scholar] [CrossRef]
  10. Tao, L.H.; Schneider, J.; Long, L.H.; Sun, Y.; Gao, F.; Hu, L.H.; Yu, S.H.; Li, L.; Qiao, G.D.; Yu, L.Z.; et al. Fabrication of high permeability non-oriented electrical steels by increasing <001> recrystallization texture using compacted strip casting processes. J. Magn. Magn. Mater. 2015, 374, 577–586. [Google Scholar]
  11. Landgraf, F.J.G.; Emura, M.; Teixeira, J.C.; de Campos, M.F. Effect of grain size, deformation, aging and anisotropy on hysteresis loss of electrical steels. J. Mag. Mag. Mater. 2000, 215, 97–99. [Google Scholar] [CrossRef]
  12. Matsumura, K.; Fukuda, B. Recent developments of non-oriented electrical steel sheets. IEEE Trans. Magn. 1984, 5, 1533–1537. [Google Scholar] [CrossRef]
  13. Huňady, J.; Černík, M.; Hilinski, E.J.; Predmerský, M.; Magurova, A. Influence of chemistry and hot rolling conditions on high permeability non-grain oriented silicon steel. J. Magn. Magn. Mater. 2006, 304, 620–623. [Google Scholar] [CrossRef]
  14. Tanaka, I.; Yashiki, H. Magnetic properties and recrystallization texture of phosphorus-added non-oriented electrical steel sheets. J. Magn. Magn. Mater. 2006, 304, 611–613. [Google Scholar] [CrossRef]
  15. Salinas, J.; Salinas, A.; Gutiérrez, E.J.; Deaquino, L. Effect of processing conditions on the final microstructure and magnetic properties in non-oriented electrical steels. J. Magn. Magn. Mater. 2016, 406, 159–165. [Google Scholar] [CrossRef]
  16. Chang, S.K. Texture effects on magnetic properties in high-alloyed non-oriented electrical steels. Met. Sci. Heat Treat. 2007, 49, 569–573. [Google Scholar] [CrossRef]
  17. Gutiérrez, E.; Salinas, A.; Deaquino, L.; Márquez, F. High temperature oxidation and its effects on microstructural changes of hot-rolled low carbon non-oriented electrical steels during air annealing. Oxid. Met. 2015, 83, 237–252. [Google Scholar] [CrossRef]
  18. Ramadam, R.; Ibrahim, S.A.; Farag, M.; Elzatahry, A.A.; Es-Saheb, M.H. Processing optimization and characterization of magnetic non-oriented electrical silicon steel. Int. J. Electrochem. Sci. 2012, 7, 3242–3251. [Google Scholar]
  19. Darja, S.; Monika, J.; Jalklic, A.; Cop, A. Correlation of titanium content and core loss in non-oriented electrical steel sheets. Metalurgija 2010, 49, 37–40. [Google Scholar]
  20. Li, N.; Xiang, L.; Zhao, P. Effect of antimony on the structure, texture and magnetic properties of high efficiency non-oriented electrical steel. Adv. Mater. Res. 2013, 602, 435–440. [Google Scholar] [CrossRef]
  21. Cardoso, R.F.D.A.; Brandao, L.; Cunha, M.A.D. Influence of grain size and additions of Al and Mn on the magnetic properties of non-oriented electrical steels with 3 wt % Si. Mater. Res. 2008, 11, 51–55. [Google Scholar] [CrossRef]
  22. Hunday, J.; Cernik, M.; Hilinski, E.; Predmersky, M.; Magurova, A. Influence of chemistry and hot rolling conditions on high permeability non-grain oriented silicon steel. Metals 2005, 15, 17–23. [Google Scholar]
  23. Darja, P. Non-oriented electrical steel sheets. Mater. Technol. 2010, 44, 317–325. [Google Scholar]
  24. Chaudhury, A. Low silicon non-grain-oriented electrical steel: Linking magnetic properties with metallurgical factors. J. Magn. Magn. Mater. 2007, 313, 21–28. [Google Scholar] [CrossRef]
  25. Lee, H.-Y.; Hsiao, I.-C.; Tsai, M.-C. Texture Improvement of 3% Si non-oriented electrical steel. China Steel Tech. Rep. 2015, 28, 1–5. [Google Scholar]
  26. Marra, K.M.; Alvarenga, E.D.A.; Buono, V.T.L. Decarburization kinetics during annealing of a semi-processed electrical steel. ISIJ Int. 2004, 44, 618–622. [Google Scholar] [CrossRef]
  27. Darja, S.P.; Monika, J.; Hans, J.G.; Vasilij, P. Decarburization of non-oriented electrical steel sheets doped with selenium. Mater. Thehnol. 2001, 35, 337–341. [Google Scholar]
  28. Gutiérrez, E.; Salinas, A. Effect of annealing prior to cold rolling on magnetic and mechanical properties of low carbon non-oriented electrical steels. J. Magn. Magn. Mater. 2011, 323, 2524–2530. [Google Scholar] [CrossRef]
  29. Jenkins, K.; Lindenmo, M. Precipitates in electrical steels. J. Magn. Magn. Mater. 2008, 320, 2423–2429. [Google Scholar] [CrossRef]
  30. PremKumar, R.; Samajdar, I.; Viswanathan, N.N.; Singal, V.; Seshadri, V. Relative effect(s) of texture and grain size on magnetic properties in a low silicon non-grain oriented electrical steel. J. Magn. Magn. Mater. 2003, 264, 75–85. [Google Scholar] [CrossRef]
  31. Honda, A.; Obata, Y.; Okamura, S. History and development of non-oriented electrical steel in Kawasaki steel. Kawasaki Steel Tech. Rep. 1998, 39, 13–19. [Google Scholar]
  32. De Campos, M.; Yonamine, T.; Fukuhara, M.; Landgraf, F.J.G.; Achete, C.A.; Missell, F.P. Effect of frequency on the iron losses of 0.5% and 1.5% Si nonoriented electrical steels. IEEE Trans. Magn. 2006, 42, 2812–2814. [Google Scholar] [CrossRef]
  33. Barros, J.; Ros-Yanez, T.; Vandenbossche, L.; Dupré, L.; Melkebeek, J.; Houbaert, Y. The effect of Si and Al concentration gradients on the mechanical and magnetic properties of electrical steel. J. Magn. Magn. Mater. 2005, 290, 1457–1460. [Google Scholar] [CrossRef]
  34. Steniner, D.; Jenko, M.; Jaklič, A.; Čop, A. The correlation between the content of titanium in steel and electromagnetic properties of oriented electrical steel. Metalurgija 2010, 49, 37–40. [Google Scholar]
  35. Lotten, T.M.; Pragasen, P. Core losses in motor laminations exposed to high-frequency or nonsinusoidal excitation. IEEE Trans. Ind. Appl. 2004, 40, 1325–1332. [Google Scholar]
  36. Euraopean coal and steel community. Methods for Determining the Magnetic Properties of Magnetic Steel Sheet and Strip with 25 cm Epstein Frame; European Committee for Standardization: Luxembourg, Luxembourg, 1975. [Google Scholar]
  37. Gasper, N.; Janko, K.; Ales, N.; Darja, S.P. Correlation between the excess losses and the relative permeability in fully finished non-oriented electrical steels. Mater. Tehnol. 2014, 48, 997–1001. [Google Scholar]
  38. Engler, O.; Randle, V. Introduction to Texture Analysis: Macrotexture, Microtexture, and Orientation Mapping, 1st ed.; CRC Press: Boca Raton, FL, USA, 2009. [Google Scholar]
  39. Bunge, H.J. Texture Analysis in Materials Science: Mathematical Methods, 1st ed.; Butterworth-Heinemann: Berlin, Germany, 2013. [Google Scholar]
  40. Castro Cerda, F.M.; Kestens, L.A.; Monsalve, A.; Petrov, R.H. The effect of ultrafast heating in cold-rolled low carbon steel: Recrystallization and texture evolution. Metals 2016, 6, 288. [Google Scholar] [CrossRef]
  41. Kovac, F.; Stoyka, V.; Petryshynets, I. Strain induced grain growth in non-oriented electrical steel. J. Magn. Magn. Mater. 2008, 320, 627–630. [Google Scholar] [CrossRef]
  42. Chang, S.K. Magnetic anisotropies and textures in high-alloyed non-oriented electrical steels. ISIJ Int. 2007, 47, 466–471. [Google Scholar] [CrossRef]
  43. Nakayama, T.; Honjou, N.; Minaga, T.; Yashiki, H. Effects of manganese and sulfur contents and slab reheating temperatures on the magnetic properties of non-oriented semi-processed electrical steel sheets. J. Magn. Magn. Mater. 2001, 234, 55–61. [Google Scholar] [CrossRef]
Figure 1. Methodology used in this work to evaluate the effect of chemical composition and thickness of hot-rolled bands on the final magnetic properties of grain non-oriented (GNO) electrical steels.
Metals 07 00229 g001
Figure 2. Schematic representation of the decarburizing thermal cycle and annealing conditions.
Metals 07 00229 g002
Figure 3. Effect of C content on core losses.
Metals 07 00229 g003
Figure 4. Effect of C concentration on magnetic permeability.
Metals 07 00229 g004
Figure 5. Relationship between magnetic permeability and core losses of decarburized GNO electrical steel.
Metals 07 00229 g005
Figure 6. Contour plot showing the effect of C on magnetic properties.
Metals 07 00229 g006
Figure 7. Effect of thickness on core losses.
Metals 07 00229 g007
Figure 8. Effects of carbon and steel thickness on core losses.
Metals 07 00229 g008
Figure 9. Effect of alloying elements on core losses: (a) Ti, (b) Sb and (c) Mn.
Metals 07 00229 g009
Figure 10. Microstructure of GNO electrical steel: (a) before and (b) after the decarburization annealing.
Metals 07 00229 g010
Figure 11. Electron backscatter diffraction (EBSD) color coded maps of the inverse pole figure [001] of GNO electrical steels obtained after: (a) temper-rolling, and decarburization annealing (b) Cycle 1 and (c) Cycle 2.
Metals 07 00229 g011
Figure 12. φ2 = 45° section of the orientation distribution function of GNO electrical steels after: (a) temper-rolling, and decarburization annealing (b) Cycle 1 and (c) Cycle 2.
Metals 07 00229 g012
Table 1. Nominal chemical composition of the hot-rolled GNO electrical steel grade used in this work (wt %).
CSiAlSMnPCuCrNiMo
0.0350.40.330.00330.550.0130.340.0230.0330.019

