Article

Effect of Carbon Partitioning, Carbide Precipitation, and Grain Size on Brittle Fracture of Ultra-High-Strength, Low-Carbon Steel after Welding by a Quenching and Partitioning Process

1
Department of Engineering Sciences and Mathematics, Luleå University of Technology, SE-97187 Luleå, Sweden
2
Department of Materials Science, Functional Materials, Saarland University, D-66041 Saarbrücken, Germany
*
Author to whom correspondence should be addressed.
Metals 2018, 8(10), 747; https://doi.org/10.3390/met8100747
Submission received: 16 August 2018 / Revised: 17 September 2018 / Accepted: 18 September 2018 / Published: 23 September 2018
(This article belongs to the Special Issue Advances in Low-carbon and Stainless Steels)

Abstract

:
To improve the weld zone properties of Advanced High Strength Steel (AHSS), quenching and partitioning (Q&P) has been used immediately after laser welding of a low-carbon steel. However, the mechanical properties can be affected for several reasons: (i) The carbon content and amount of retained austenite, bainite, and fresh martensite; (ii) Precipitate size and distribution; (iii) Grain size. In this work, carbon movements during the partitioning stage and prediction of Ti (C, N), and MoC precipitation at different partitioning temperatures have been simulated by using Thermocalc, Dictra, and TC-PRISMA. Verification and comparison of the experimental results were performed by optical microscopy, X-ray diffraction (XRD), Scanning Electron Microscop (SEM), and Scanning Transmission Electron Microscopy (STEM), and Energy Dispersive Spectroscopy (EDS) and Electron Backscatter Scanning Diffraction (EBSD) analysis were used to investigate the effect of martensitic/bainitic packet size. Results show that the increase in the number density of small precipitates in the sample partitioned at 640 °C compensates for the increase in crystallographic packets size. The strength and ductility values are kept at a high level, but the impact toughness will decrease considerably.

Graphical Abstract

1. Introduction

The automotive industry focuses on increasing the use of advanced high-strength steels (AHSS) in order to satisfy the current demand for decreasing the fuel consumption by reduced weight and increasing vehicle safety by using these steels in different energy-absorbing components [1]. Usually, these AHSS are produced by thermomechanical processes, which control the microstructure and grain size as well as the precipitation hardening of micro-alloyed steels.
During welding of AHSS, the weld area will be completely changed and the excellent properties (i.e., tensile strength, toughness) will be lost. This means that the welded area could be the best area for crack propagation [2]. Therefore, pre-and/or post-welding treatment is necessary to improve the properties of this zone. Laser welding is a popular method in the industry because it is fast, creates narrow and deep welds, and can be used for different materials and shapes. So, in this work, a quenching and partitioning [3] method has been applied for post-welding treatment in order to control the microstructure [4]. The final structure will contain tempered martensite (which increases the yield strength) with retained austenite (which improves the ductility), and, depending on the Q&P conditions and chemical composition of the steel, some bainite and fresh martensite can also be formed [3,4,5].
However, carbide/nitride precipitation during the partitioning step cannot be avoided, even in low-carbon [6] or in high-carbon, high-silicon steels [7]. Therefore, one of the critical aspects is to monitor the behavior of precipitates during the process. Although precipitates and/or particles are designed to strengthen the material by a precipitation hardening mechanism, they could act as cleavage initiation sites and deteriorate the toughness [8,9,10]. Fairchild et al. [11] showed that a strong inclusion‒matrix bond is why TiN inclusions are potent cleavage initiators in steels even with modest Ti contents. Another study by Di Schino et al. [12] on the effect of Nb microalloying on the heat-affected zone (HAZ) showed that a small difference in Nb content is able to influence the size of the bainitic packet, which results in both toughness and hardness.
Several works have been done on the mechanism of Q&P up to now [4,13,14,15,16,17], while only a few papers have investigated the fracture mechanisms and toughness of Q&P steels [18,19]. Fracture causes could mainly be related to: (i) Kinetics of carbon partitioning and stabilization of retained austenite (RA) in the structure, because it has been shown that increasing volume fraction of RA due to the TRIP effect delays the crack propagation [20]; (ii) Kinetics, size, number density and shape of secondary precipitates; and (iii) Microstructural refinement can be very effective for improving the toughness. Wang et al. [21] found that, when the cleavage crack encounters another packet of martensite, it may be arrested and then largely changes its propagation direction.
Previous studies by the authors [4,22] on the effect of Q&P after laser welding of a low-carbon steel showed that samples partitioned at a higher temperature had the best tensile properties but very low Charpy V impact toughness results. In the present work, in order to investigate the origins of such contradictory results, the abovementioned main issues are studied. Carbon diffusion from α′ to retained austenite was modeled by a diffusion-controlled transformation tool (DICTRA) [23] during quenching and partitioning. The type, size, and distribution of the precipitates were evaluated using a scanning transmission electron microscope (STEM) in order to verify the precipitation prediction modeling by TC–PRISMA. Finally, the effect of the packet size of martensite/bainite laths on crack propagation has been investigated by electron backscatter diffraction (EBSD).

2. Materials and Methods

Laser welding was conducted on 5.5 mm thick sheets of ‘Domex 960’ advanced high strength steel from SSAB (Stockholm, Sweden). This steel is thermomechanically processed (TMP) and was received in TMP condition with a yield strength of 960 MPa and elongation (A5) of approximately 8%. The chemical composition of the steel is given in Table 1, but for Thermocalc simulations, a simplified composition of Fe–0.08 wt % C–1.78 wt % Mn–0.5 wt % Mo–0.187 wt % Ti–0.004 wt % N is assumed. All calculations were carried out with the thermodynamic database TCFE8 [24] and mobility database of MOBFE3 [25].
For the welding, process the keyhole penetration mode, with ytterbium Fiber Laser (YLR Laser–15000, IPG Photonics, Oxford, MA, USA), 5 kW power, travel speed of 1.1 m/min, and Argon shielding gas with a flow rate of 20 L/min, was used. The welded specimens were subjected to post heat treatment immediately after the laser welding. For that, an induction heater was placed above the specimen. The temperature was monitored during the whole procedure of welding and Q&P, by using welded thermocouples located 1.5 mm from the fusion zone (FZ). For the same quenching temperature (QT) of 355 °C (approx. equal to 60% initial martensite), three partitioning temperatures (PT) of 440 °C (20 °C above Ms), 540 °C (half between Ms and Bs), and 640 °C (Bs) and three partitioning times (Pt) were tested.
Tensile testing was performed on cross weld specimens; the tensile axis was kept perpendicular to the rolling direction of the steel sheet, while the weld zone is located exactly in the middle of the dog-bone-shaped A50 samples. Charpy V notch samples were prepared according to the standard EN ISO 6892–1:2009 and testing was conducted on transverse specimens with a notch in the center of FZ. Results showed that all the samples that were partitioned at 640 °C had very low impact toughness.
In order to investigate the reasons, the samples that showed the best and the worst toughness were selected for comparison, see Table 2.
The precipitate characterization was determined from C–replicas taken from weld area (FZ and HAZ) with a FE–SEM Helios Nanolab 600 (FEI, Hillsboro, OR, USA) working with an acceleration voltage of 30 kV and a 1.4 nA beam current. The precipitate sizes were determined by image analysis (I–A) of STEM micrographs using the software A4i© (Aquinto AG, Berlin, Germany). The carbide chemistry was identified in transmission using energy-dispersive X-rays (EDX) (Jeol Ltd., Tokyo, Japan) at 30 kV accelerating voltage. Electron Backscatter Diffraction (EBSD) was carried out on HAZ using an accelerating voltage of 20 kV, a beam current of 11 nA, and a step size of 150 nm and 100 nm for Q&P and base metal (BM) samples, respectively. The raw data were filtered by confidence index (CI) of CI > 0.09 after a CI cleanup and grain dilation (grain tolerance angle 5° and minimum grain size 2). The grains were defined as at least two adjacent points with similar orientation within a range of 15° misorientation.

3. Results and Discussion

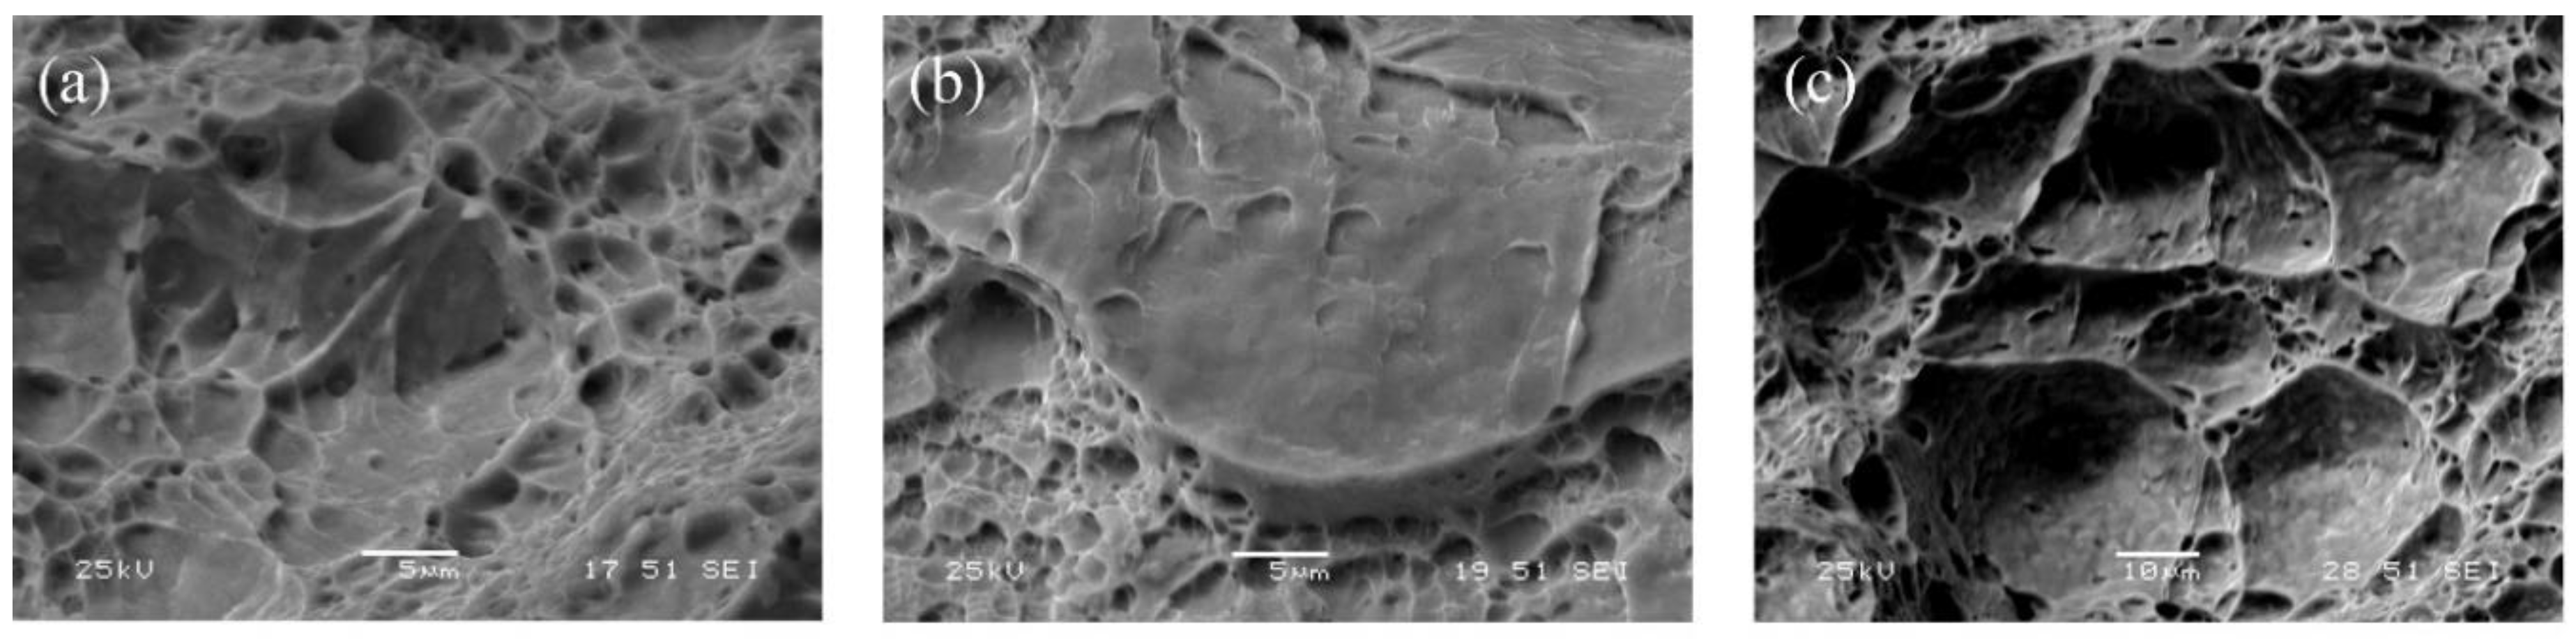
3.1. Fracture Results

Figure 1 shows dimple and cleavage mix-mode fracture in all fractographies, but the average radius of dimples in S(540, 5) (Figure 1a) is smaller than the other samples including the reference weld without any heat treatment (Figure 1c), and S(640, 50) (Figure 1b).

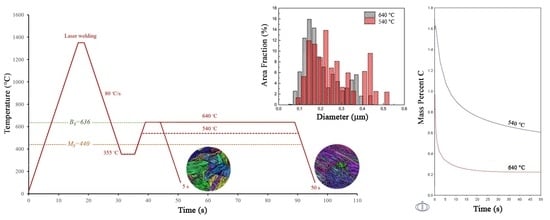
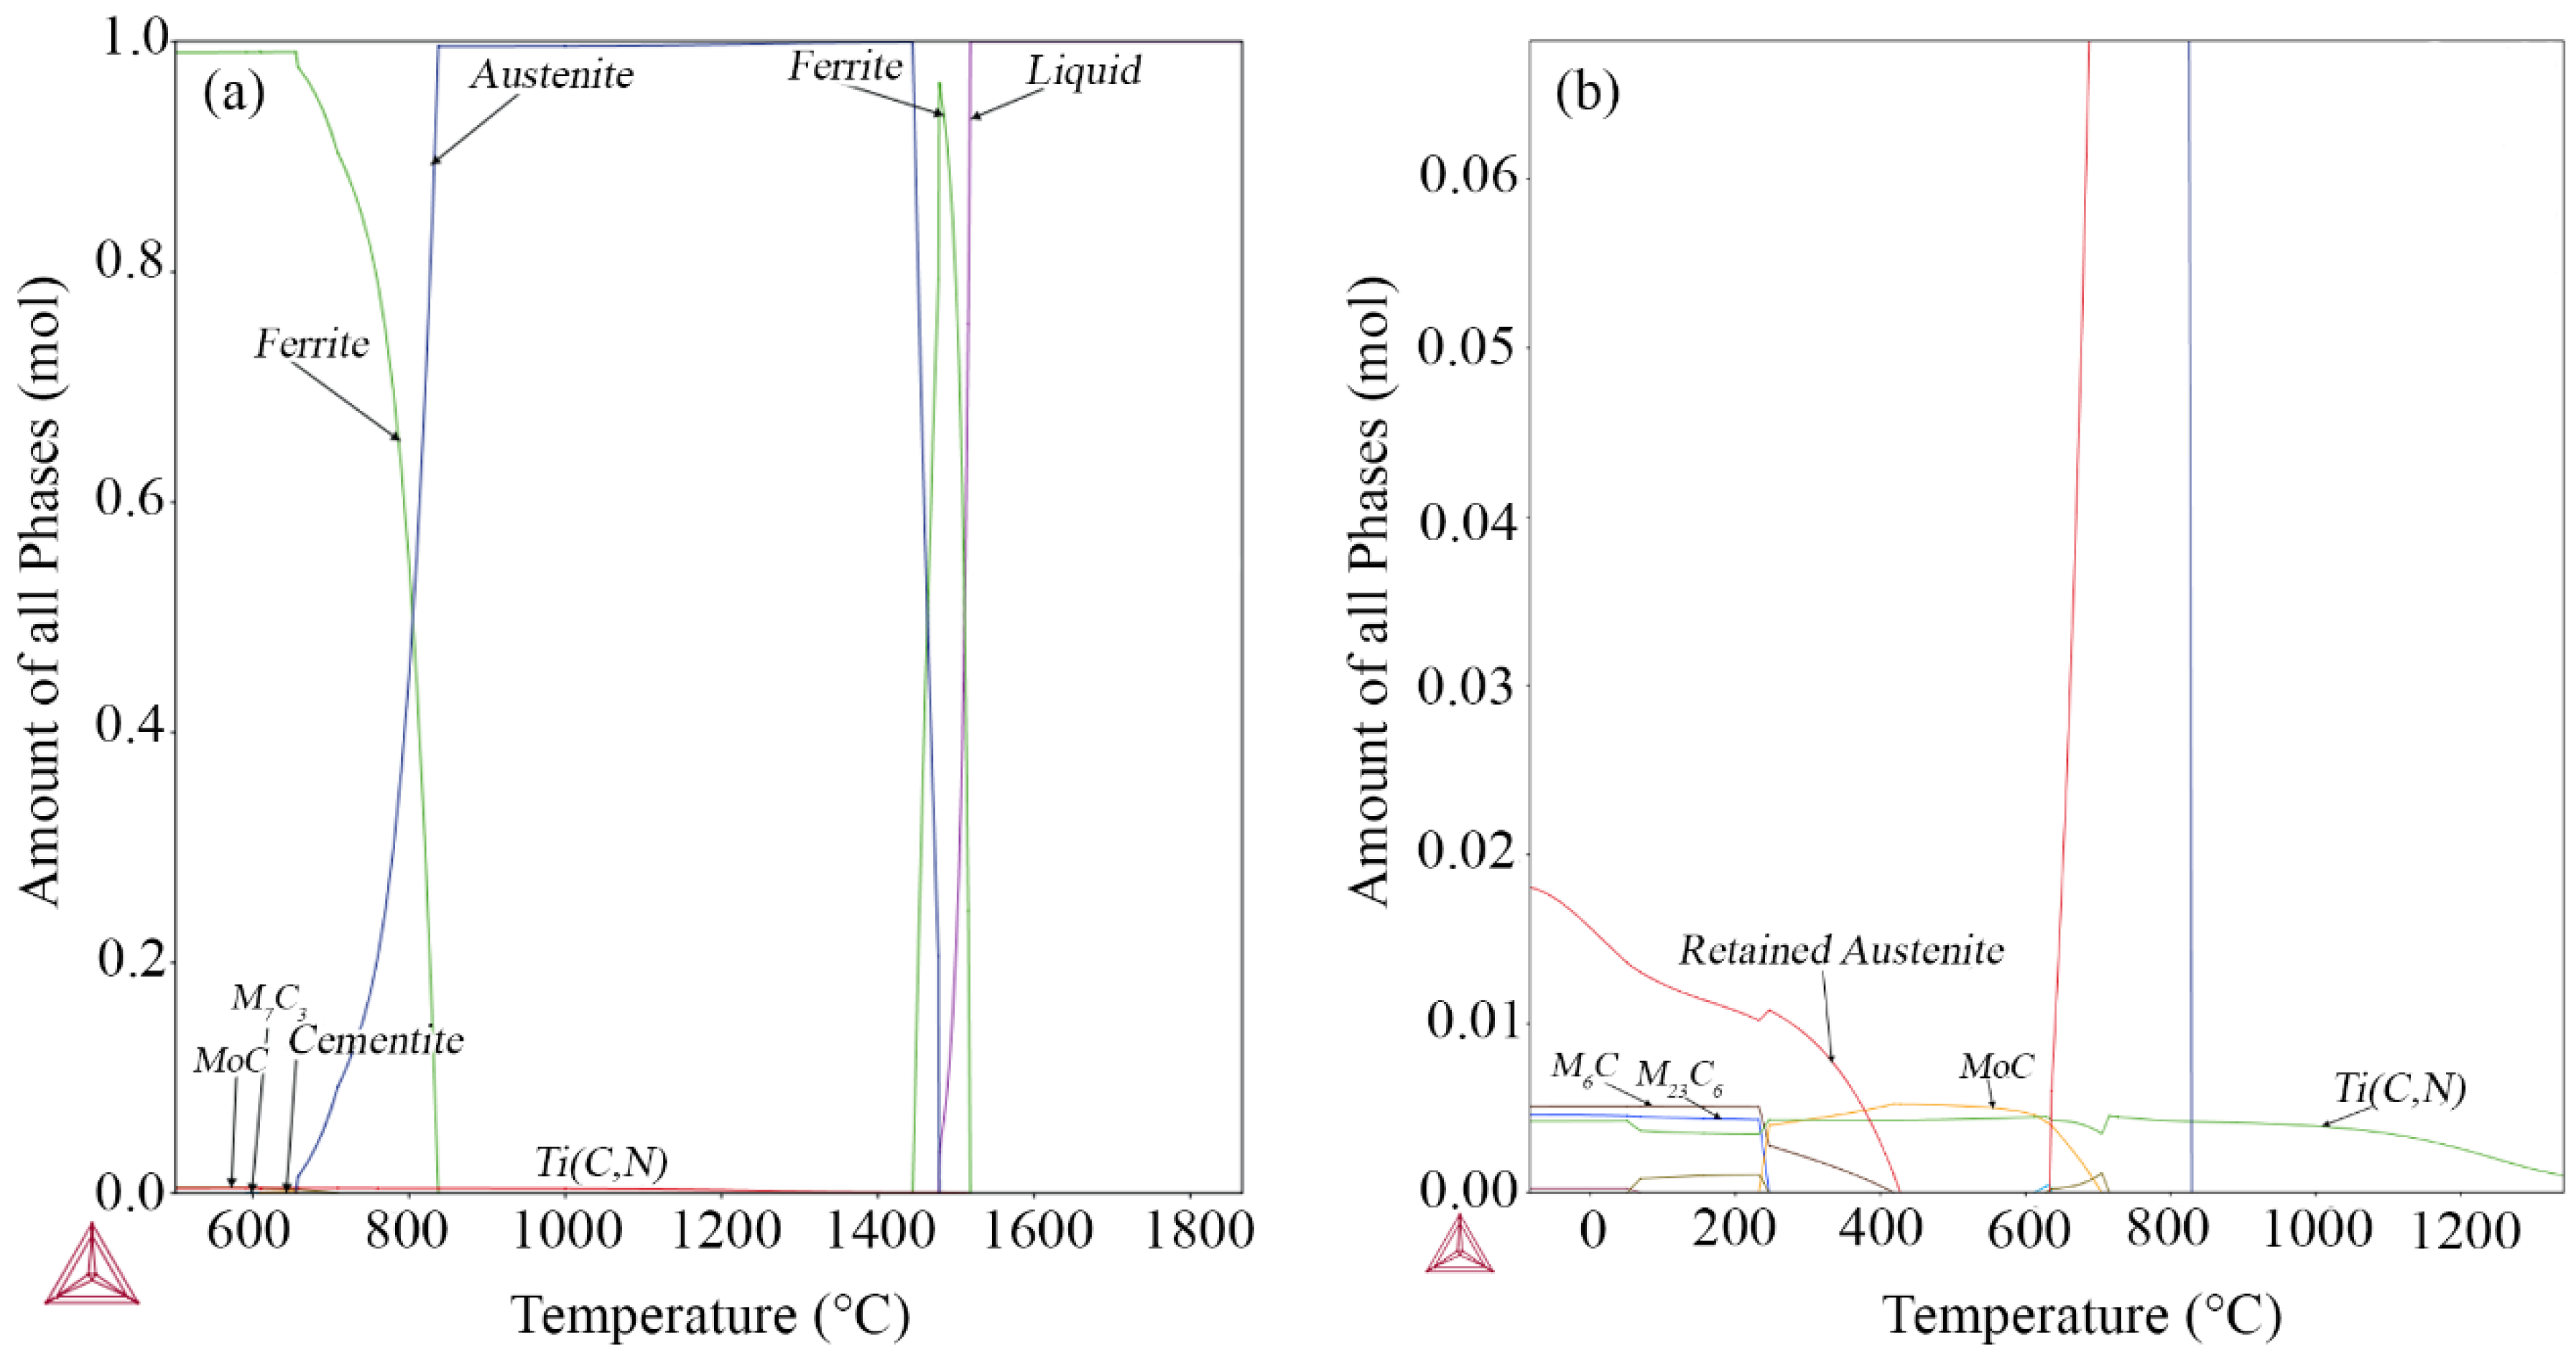
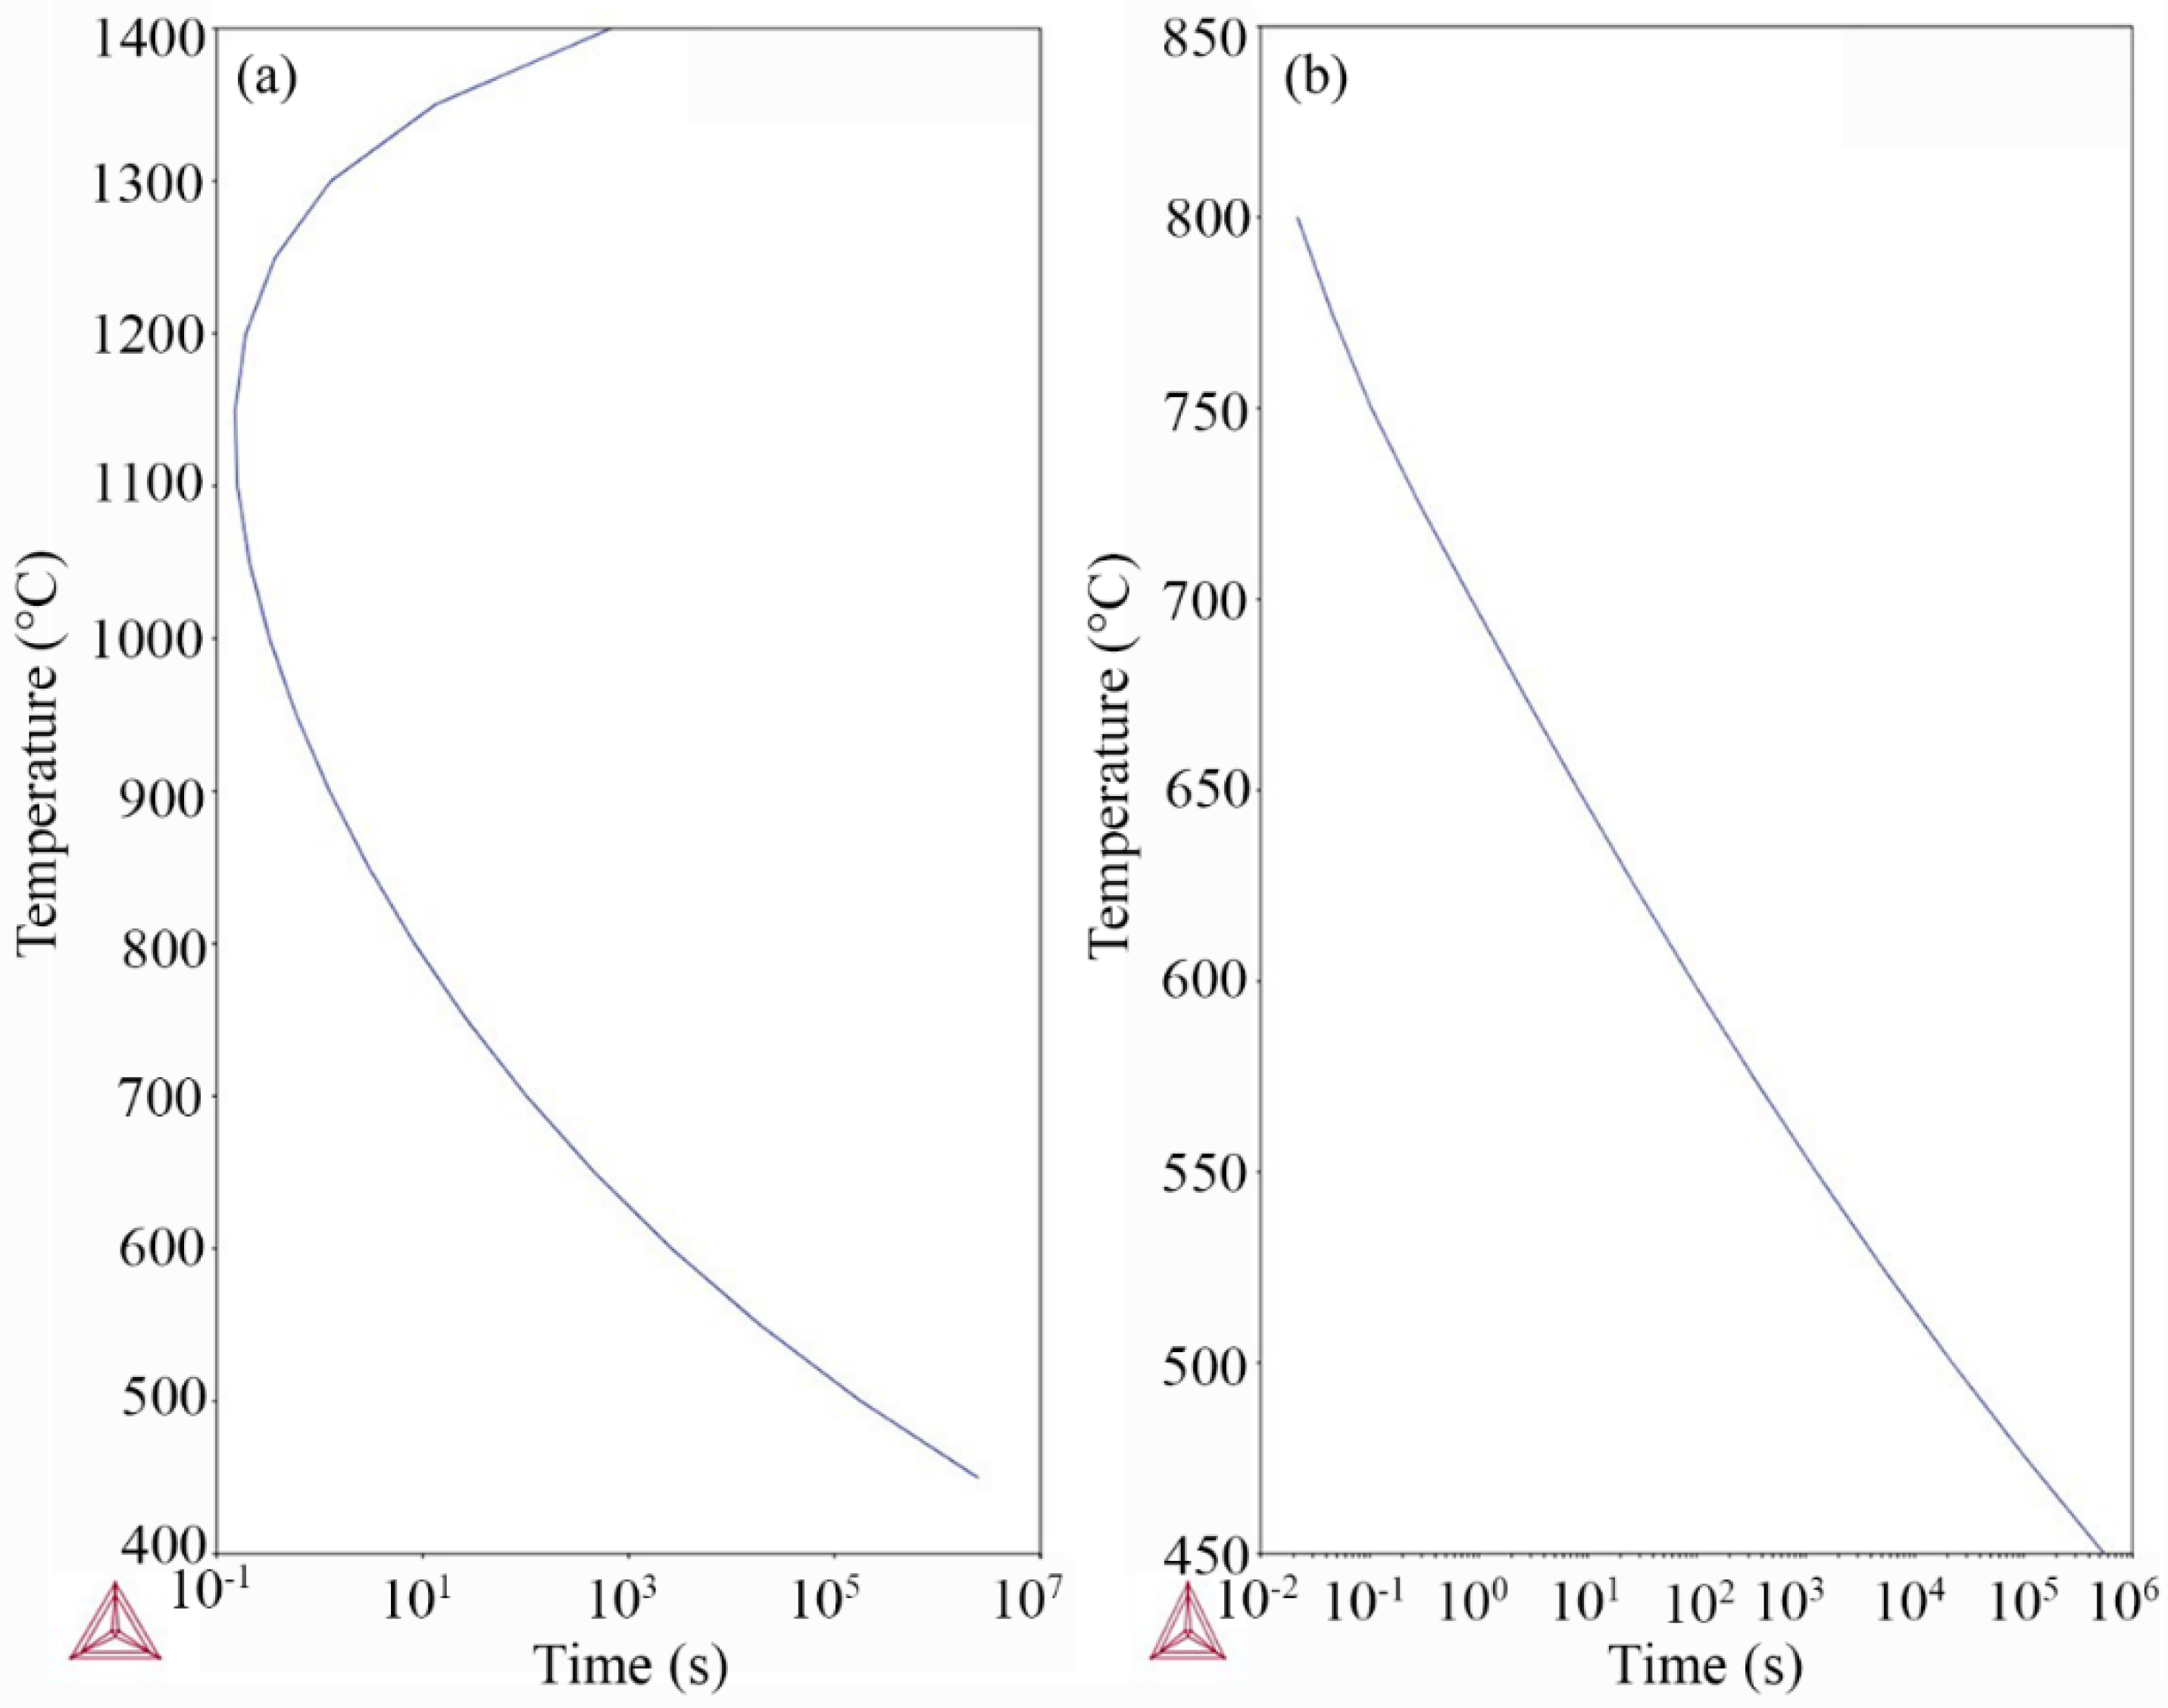
3.2. Thermodynamic Modeling

In order to understand the critical temperatures of phase transformation and formation of stable precipitates in an equilibrium condition of Domex 960, the amount of phases at different temperatures was calculated with Thermocalc [23]. Although the temperatures and amount of phases could be far from the real conditions during Q&P, this calculation could give a good overview of the most stable microconstituents. Figure 2 shows that Ti(C, N) has the highest tendency to form the first carbonitrides in this system. It will start when there is still some liquid in the system and the precipitation will continue until it reaches room temperature. After that, two other carbides (M7C3) and cementite will nucleate around 700 °C, but they are not stable and will disappear very soon around 600 °C, while their amount is also very small (e.g., 0.001 mol). The next important precipitate in this system in the critical temperature range of 440 °C to 640 °C, is MoC, as expected from its enthalpy for carbide formation in comparison with other alloying elements in this steel [26]. The kinetics of nucleation and growth of these elements modeled by the TC–Prisma [23] module are illustrated in Figure 3.
According to Figure 3a, Ti(C, N) nucleates at very high temperature, with a maximum rate at ca. 1150 °C, at which it takes only 0.2 s. At lower temperatures up to 800 °C, the nucleation takes under 10 s. The time for nucleation grows exponentially with decreasing temperature and nucleation takes a longer time than the longest partitioning time used in this work (maximum 50 s). On the other hand, Figure 3b shows that, although nucleation of this carbide (MoC) is very fast, 600 °C is a critical temperature for this Q&P, because below this temperature nucleation takes more than 100 s, which means that nucleation of MoC cannot occur during this heat treatment. In summary, Ti(C, N) precipitation could be an issue during welding and previous Ti(C, N) particles from casting could still remain in the structure, but MoC precipitation occurs during the partitioning stage at 640 °C.

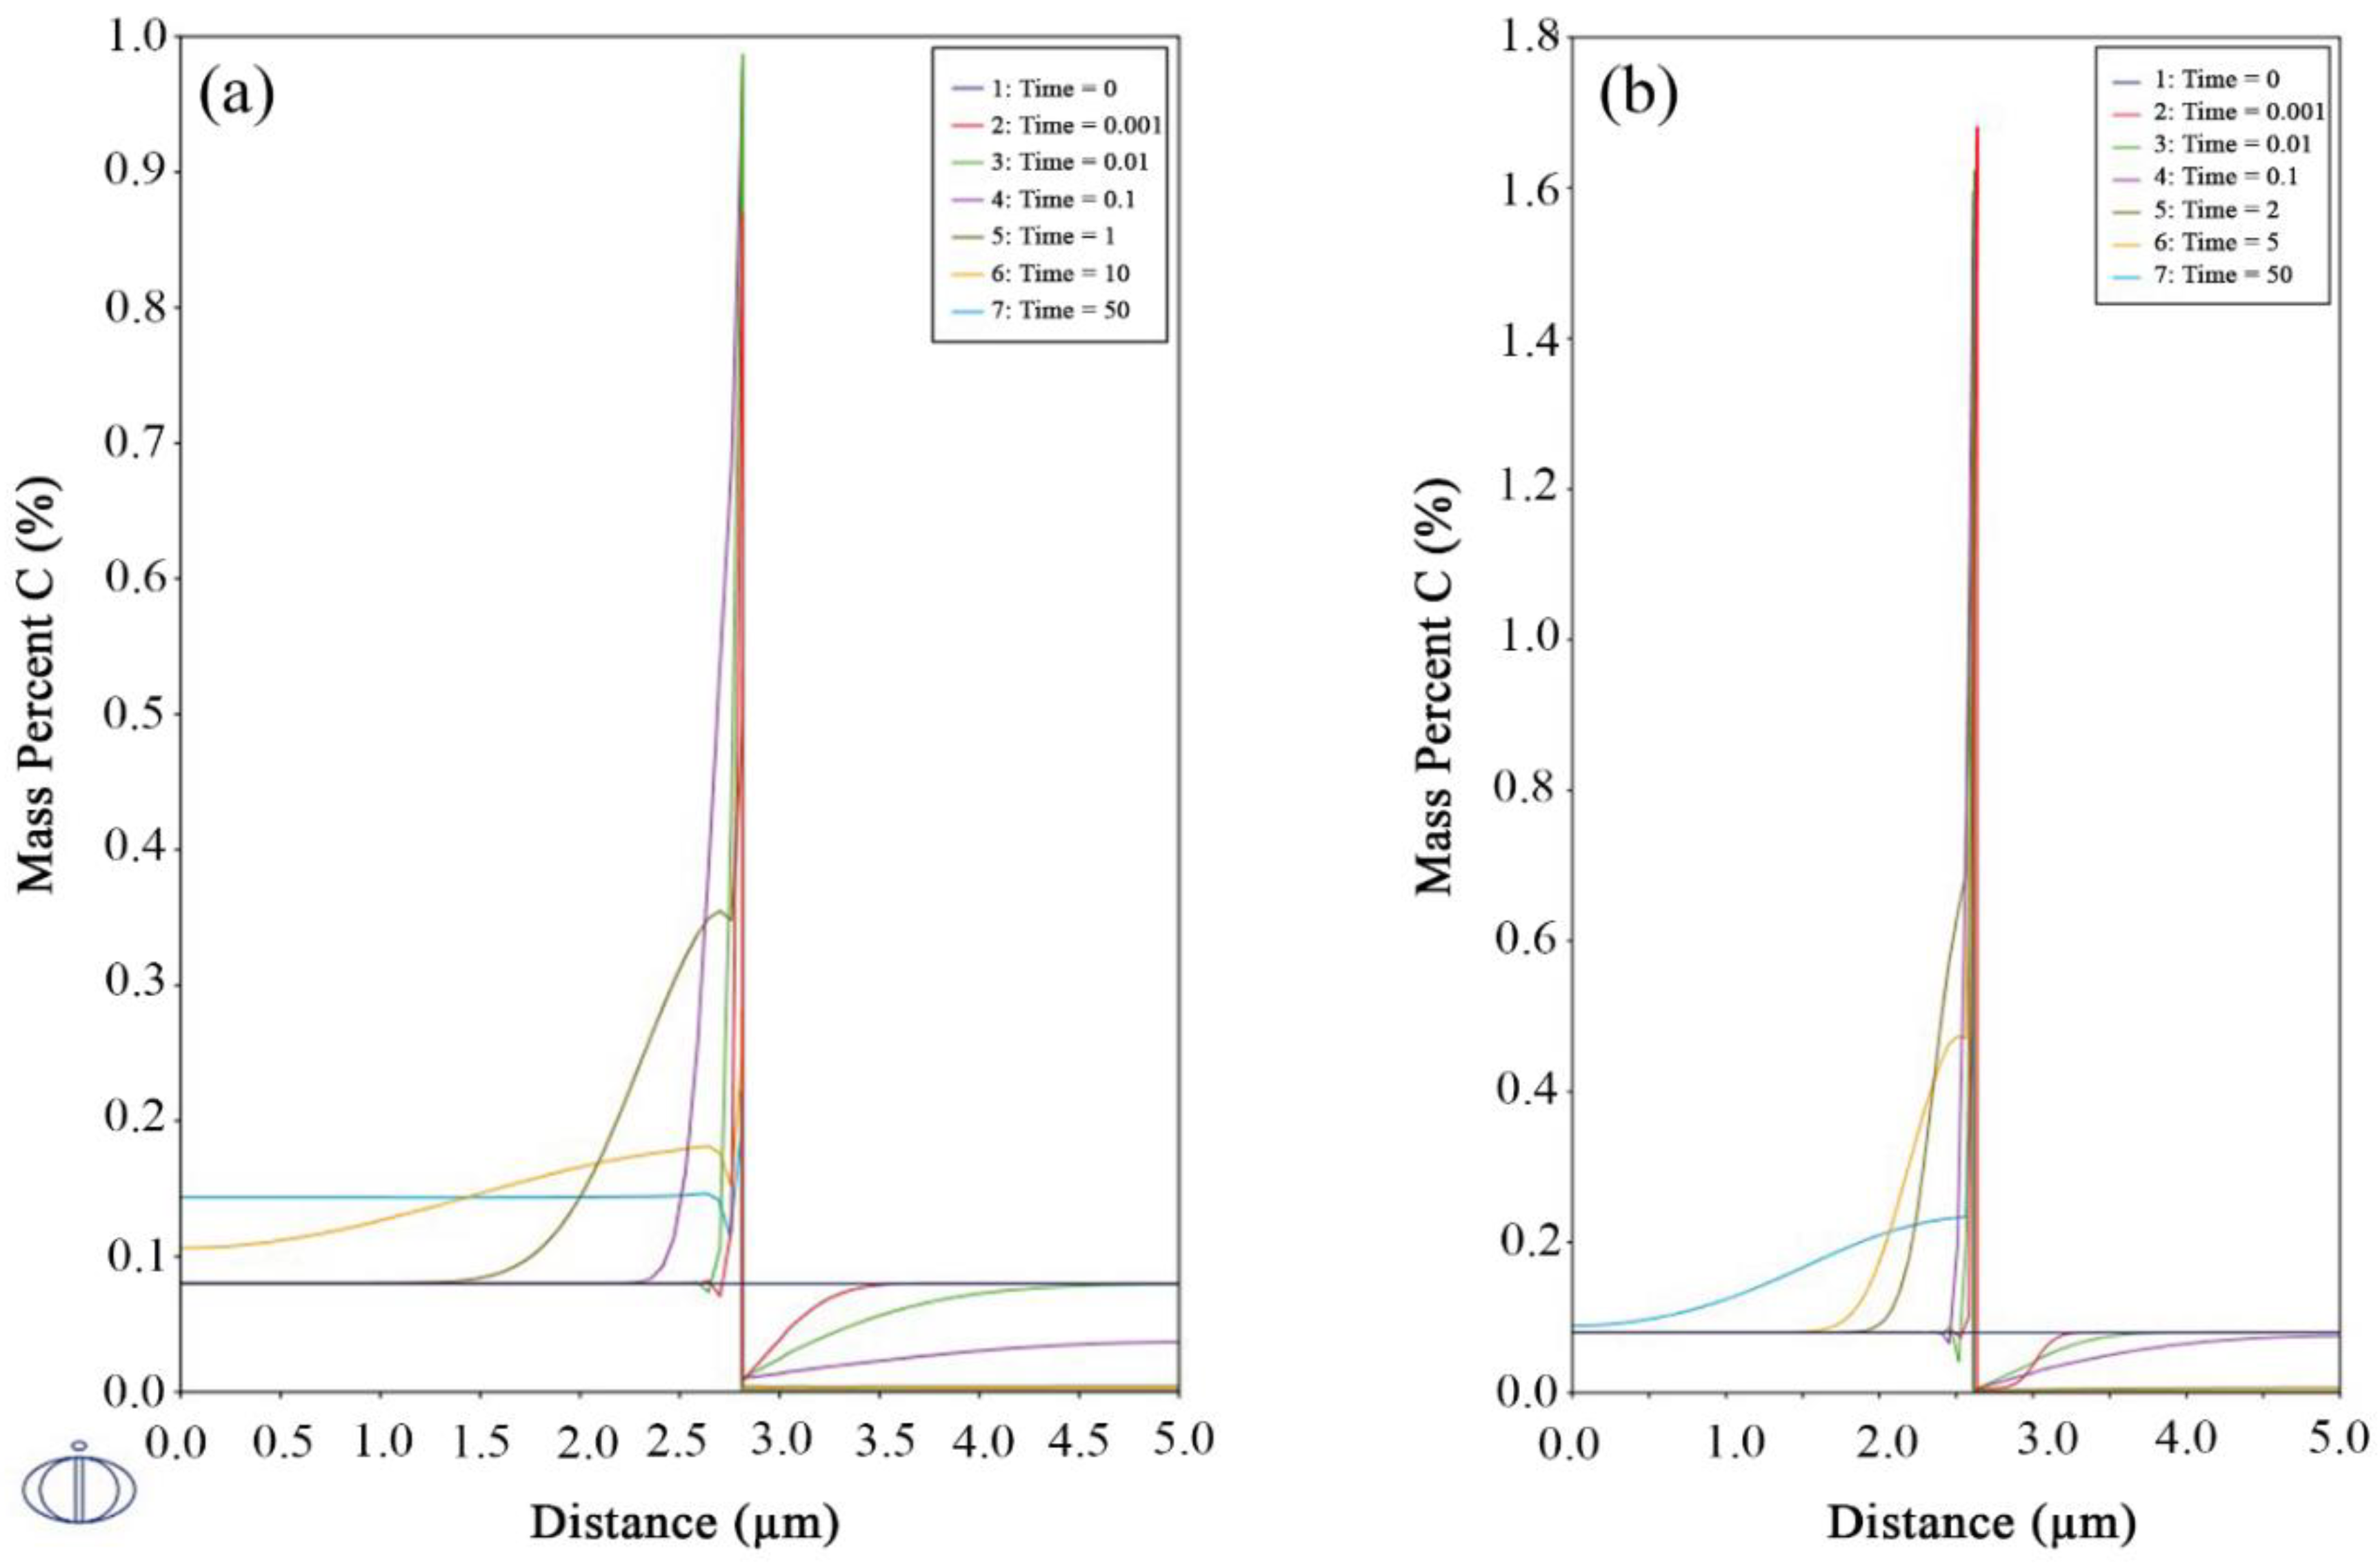
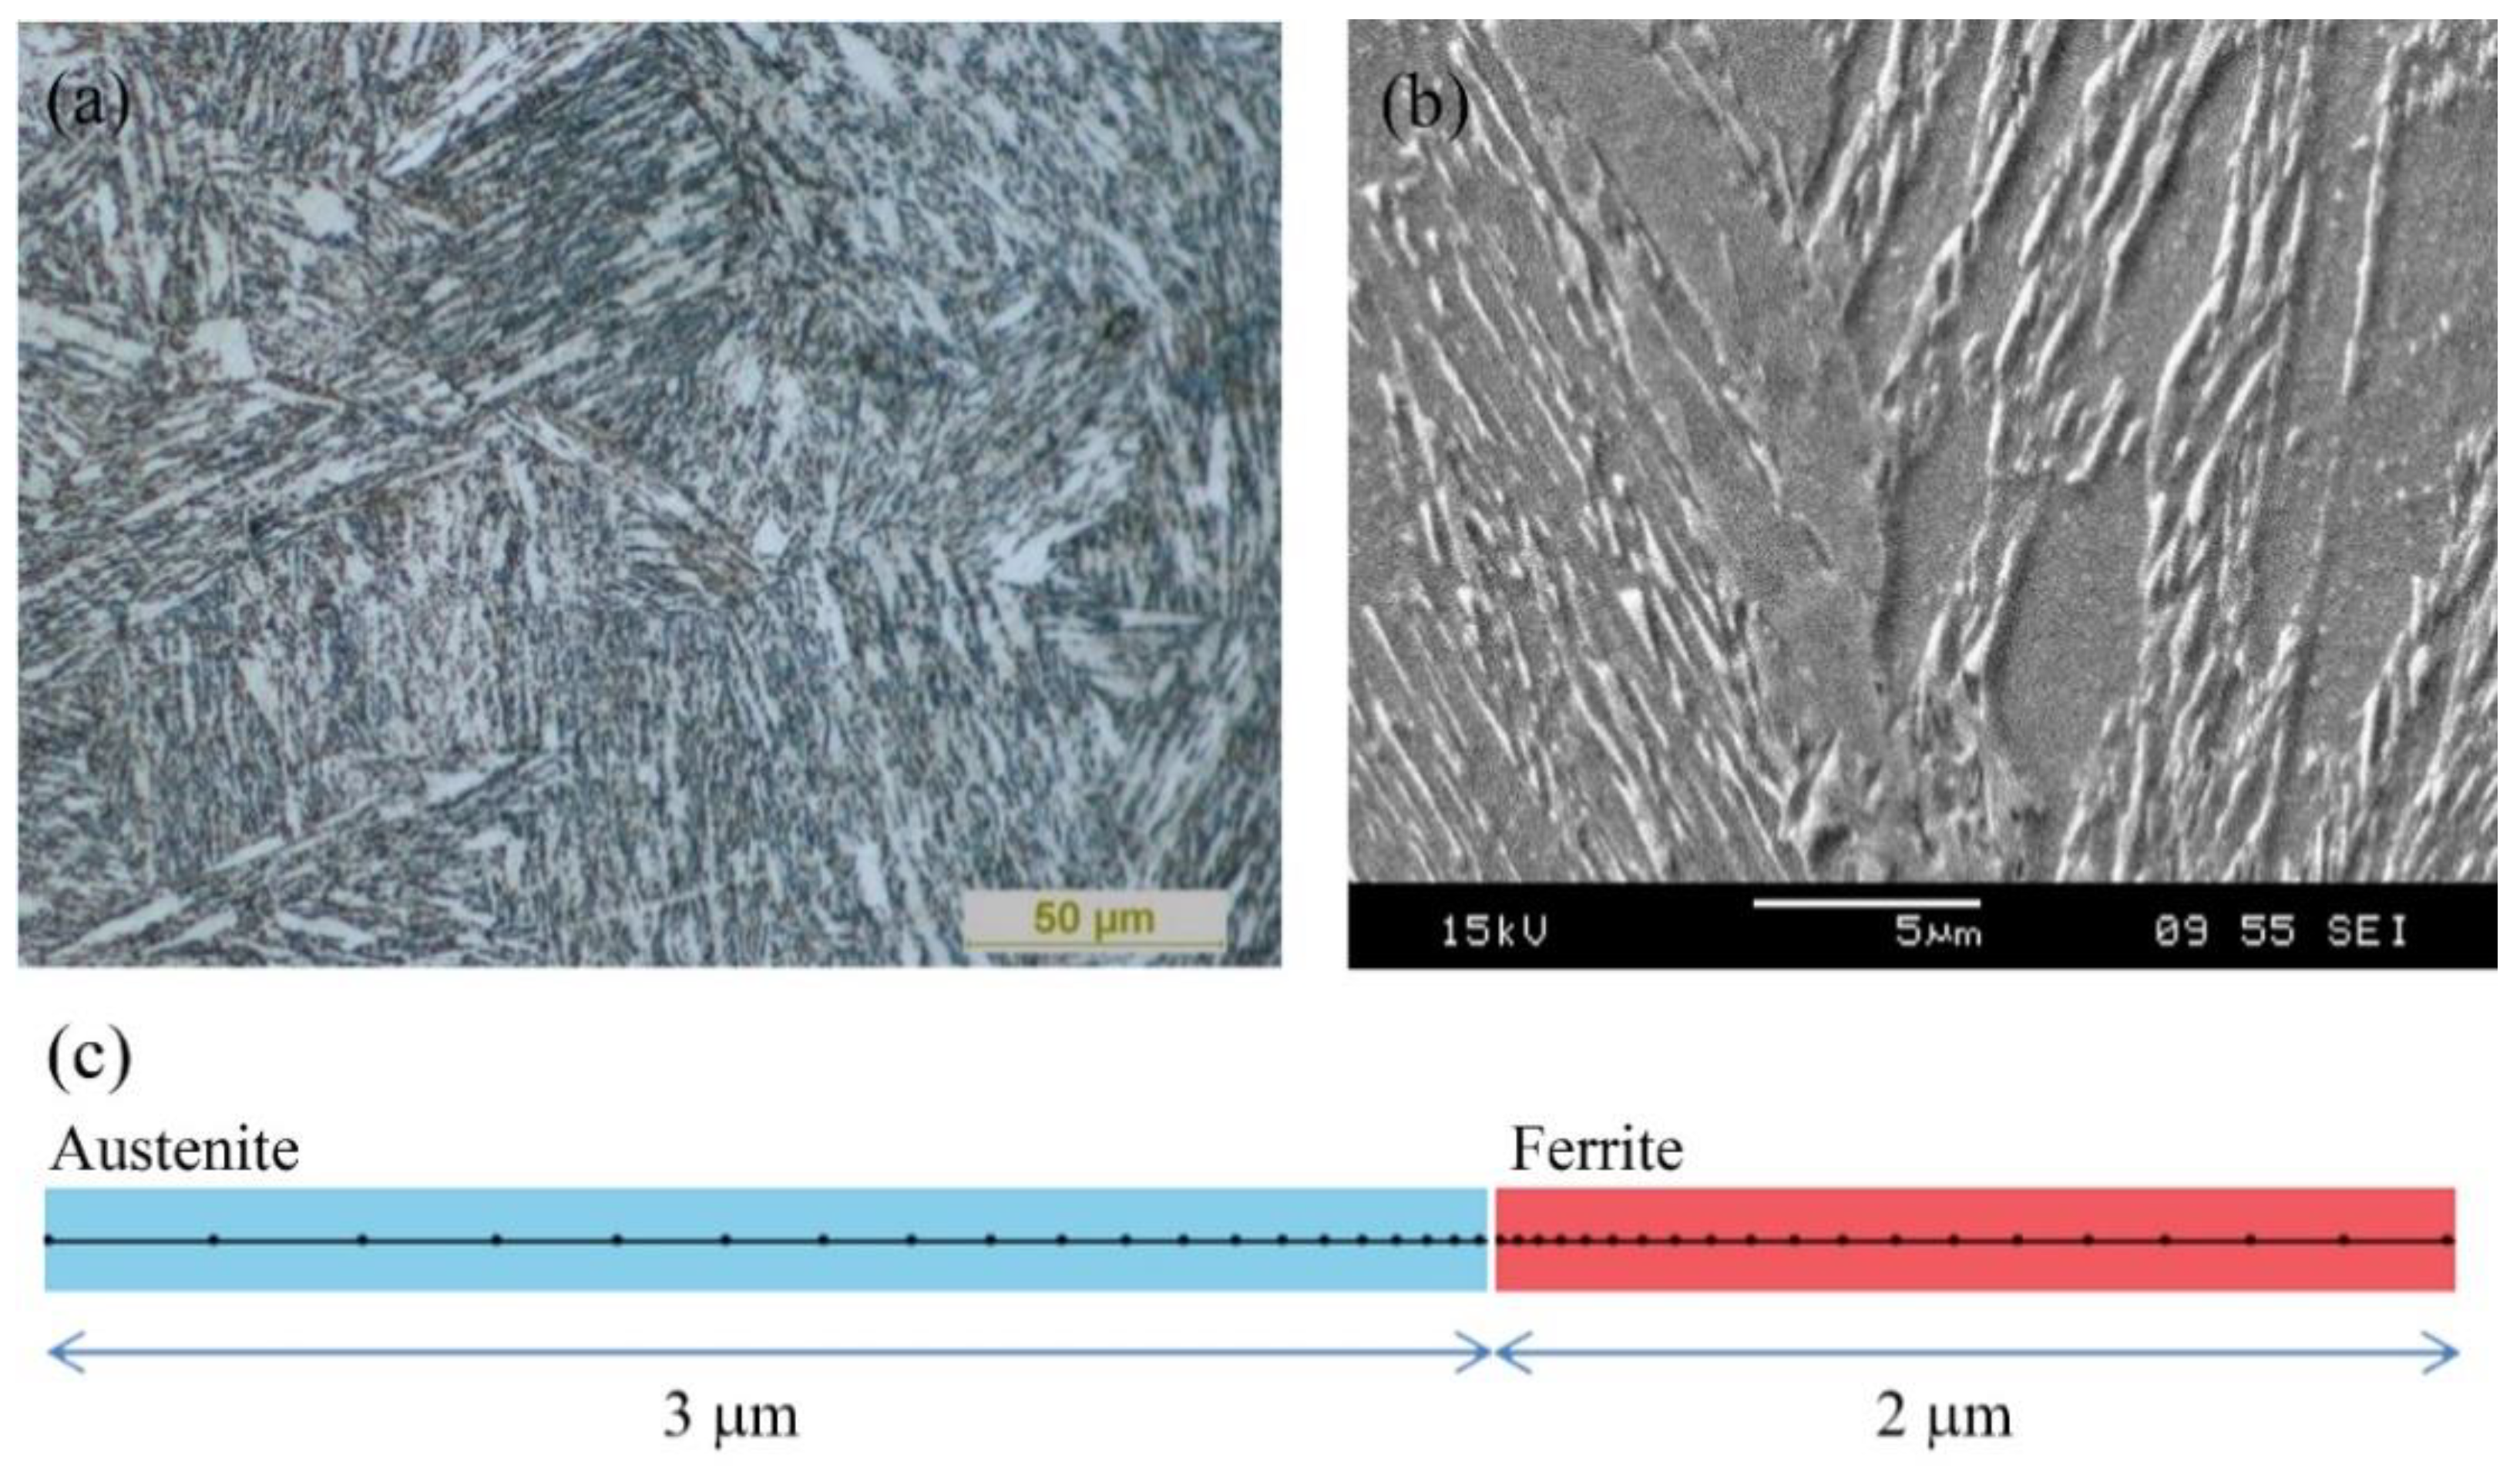
3.3. Carbon Partitioning

Understanding the carbon movement during the partitioning stage at different temperatures with regard to the first quenched martensite and retained austenite grain boundaries has an important role in the prediction of the phase transformations. Comparison between the diffusion coefficient of carbon in austenite (Dcγ) and ferrite (Dcα) in Table 3 shows that for the temperature range of γ + α (440–640 °C in this case) the equilibrium ’D’ is more than 100 times higher in ferrite than austenite. This means that carbon can partition out of martensite rapidly but will then pile up behind the α′/γ grain boundary.
In other words, this velocity is critical for the determination of the area of retained austenite around tempered martensite plates, especially for low-carbon steels, in order to design the structural and mechanical properties of the material, since three different phenomena could occur during the partitioning stage: (i) The amount of austenite’s carbon enrichment to stabilize it after the final quench; (ii) Nucleation and growth of third phases (e.g., bainitic ferrite); and (iii) Carbide precipitation. Nishikawa et al. [27] modeled the influence of the bainite reaction on the kinetics of carbon redistribution during the Q&P process. Simulations indicate that the kinetics of carbon partitioning from martensite to austenite is controlled by carbon diffusion in austenite and is affected only to a small extent by the decomposition of austenite into bainitic ferrite.
Based on microscopy pictures of the samples, a model with 3 μm space for austenite until the next lath of martensite and a 2 μm space for ferrite, which represents martensite in this simulation, in a rectangular linear model with 50 nodes for calculations that are more frequent close to the interface, is assumed (see Figure 4).
Figure 5 shows the simulation results of carbon partitioning at 640 °C and 540 °C. Regarding the fact that Mn drops the chemical potential of carbon in austenite, it is expected that regions with high Mn concentration attract more carbon [13]. Therefore, adding 1.78 wt % Mn to the system makes carbon atoms pile up at the border of γ/α and causes a constant increase of the carbon content of austenite until 0.15 wt % after 50 s at 640 °C. If the partitioning process stops after 2 or 5 s, a small distance of approximately 0.5 μm could be enriched with up to 0.3 wt % C (Figure 5a). As can be seen in Figure 5b, diffusion at 540 °C is much slower and makes the boundary full of carbon up to 1.6 wt %.
In order to find the reason for the very low impact toughness results of samples partitioned at 640 °C while they have very good tensile properties, simulations were focused on S(640, 50) and S(540, 5) for comparison. The effect of temperature is shown in Figure 6a. Figure 6b shows the carbon movement inside austenite close to the martensite interface for these two samples, and the existence of retained austenite after the final quench after partitioning can be predicted.
Minimum estimated amount of C to stabilize austenite, based on different equations [28,29,30,31,32,33] for this steel is 0.9 to 1.2 wt % C at ambient temperature. So, comparing with Figure 6b implies that there is no chance for stabilizing the retained austenite in S(640, 50), but there is some possibility in samples treated at 540 °C or less. This is also confirmed by XRD measurements of these two samples S(540, 5) and S(640, 50).
Wu et al. [34] investigated the effect of austenite on fracture resistance of Q&P and showed that the energy absorption by transformation from austenite to martensite postponed the crack propagation and enhanced the fracture resistance of Q&P steels. Even a small amount of retained austenite at room temperature could have a significant effect on energy absorption during crack propagation.

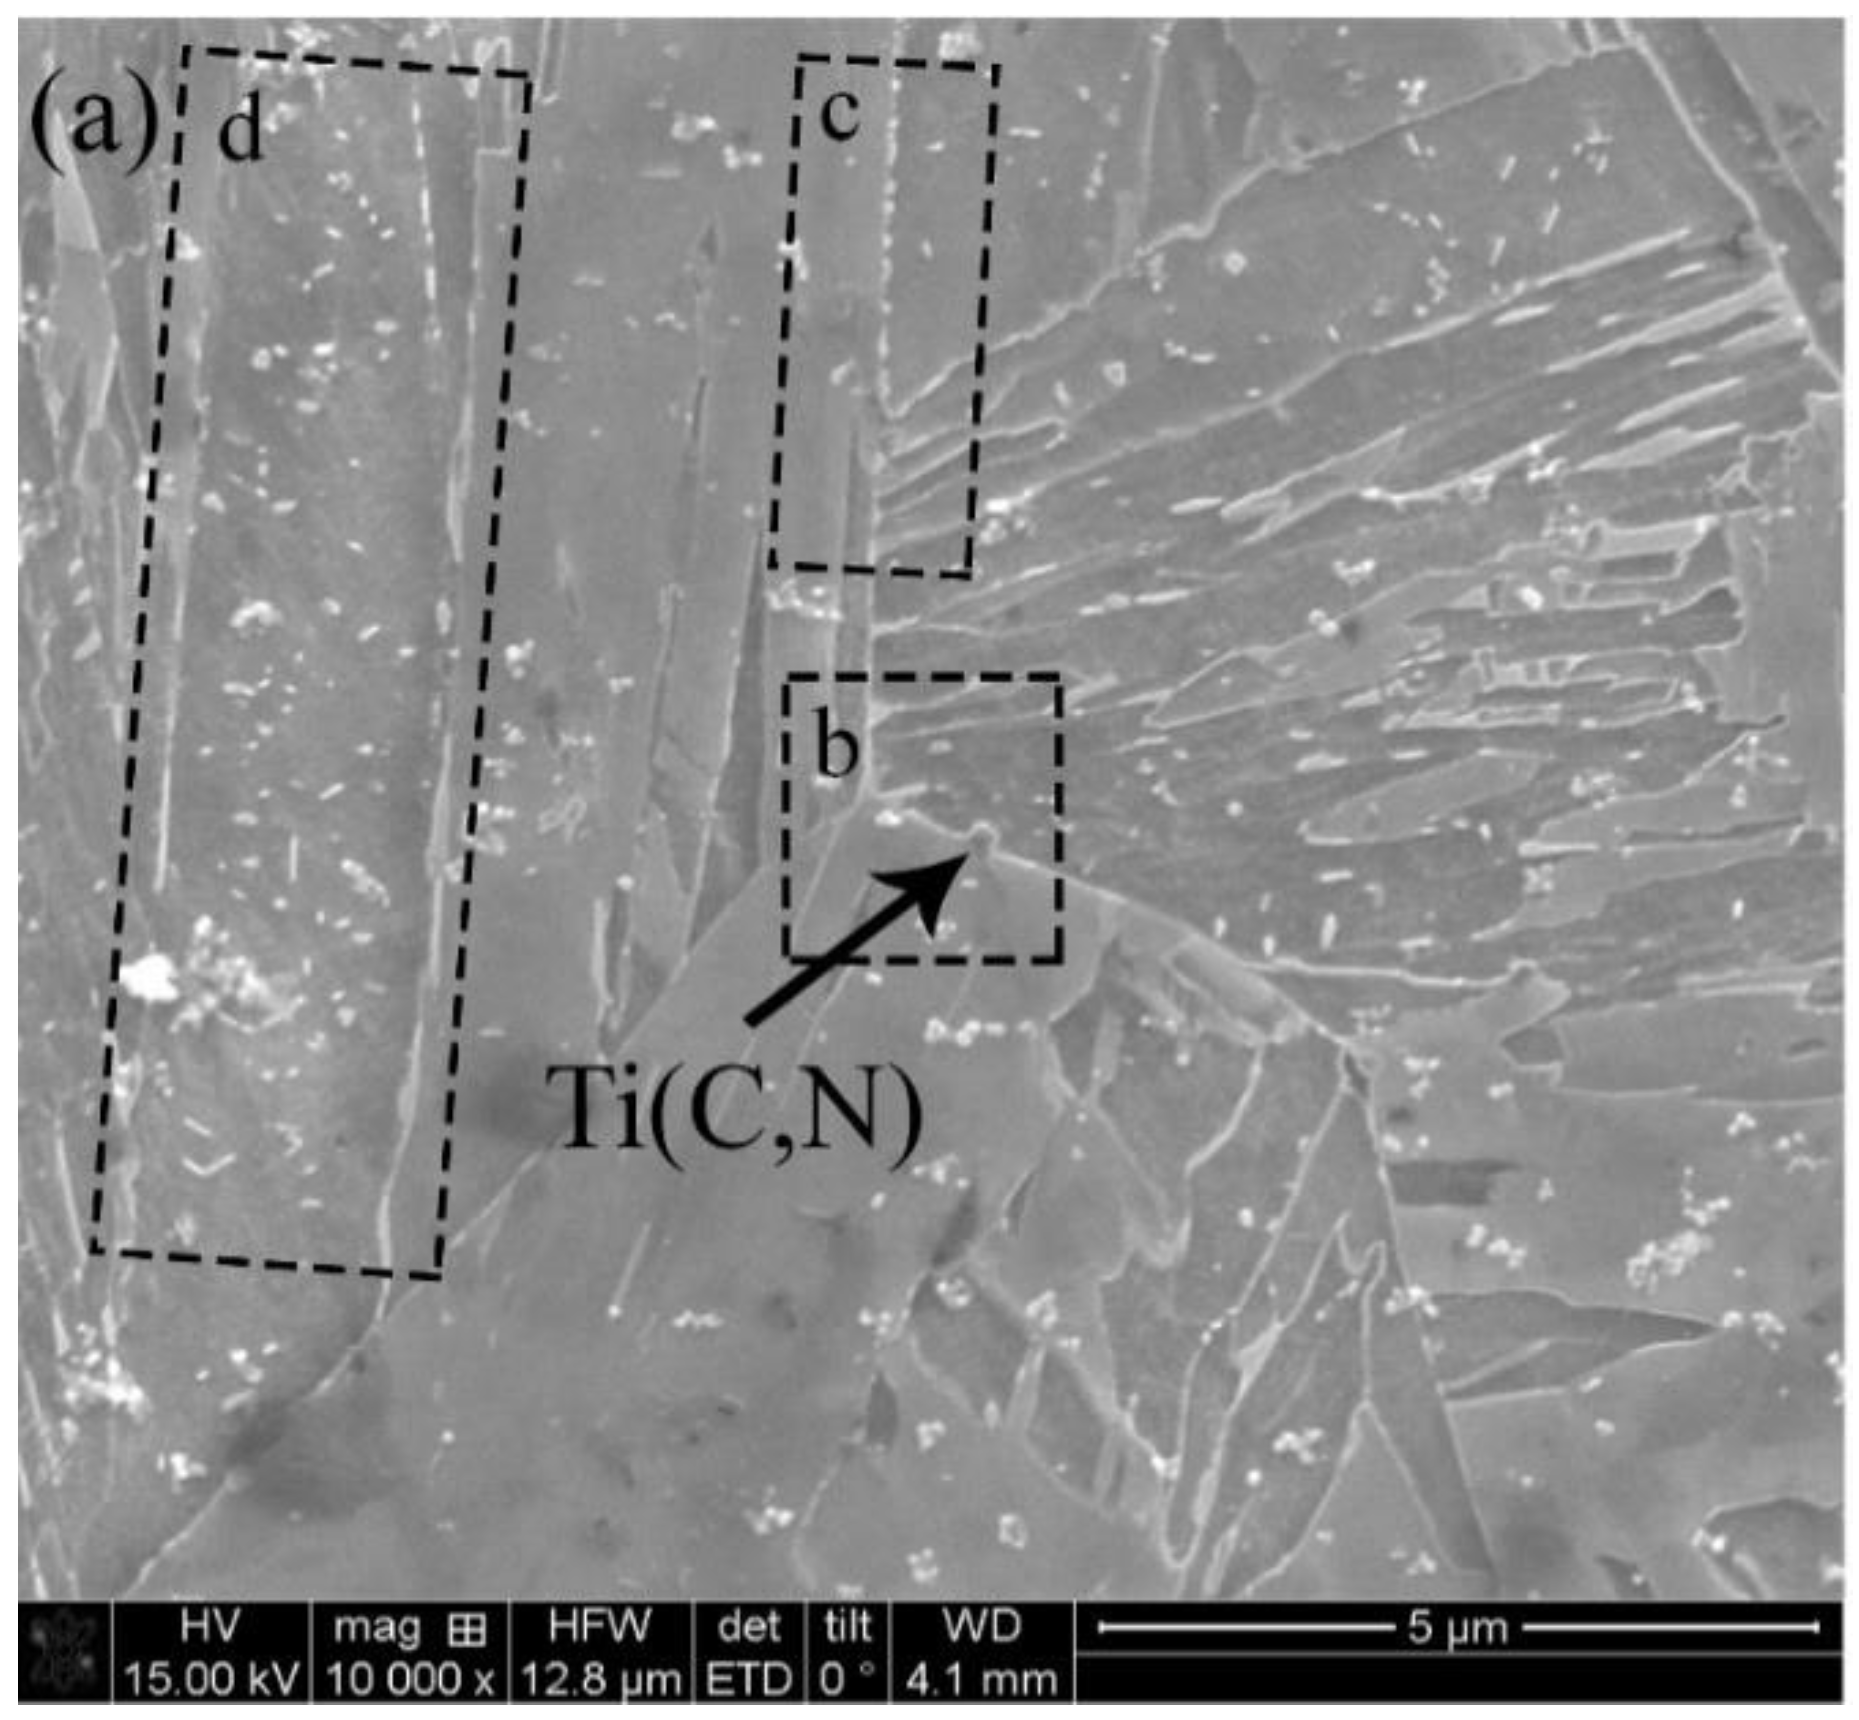
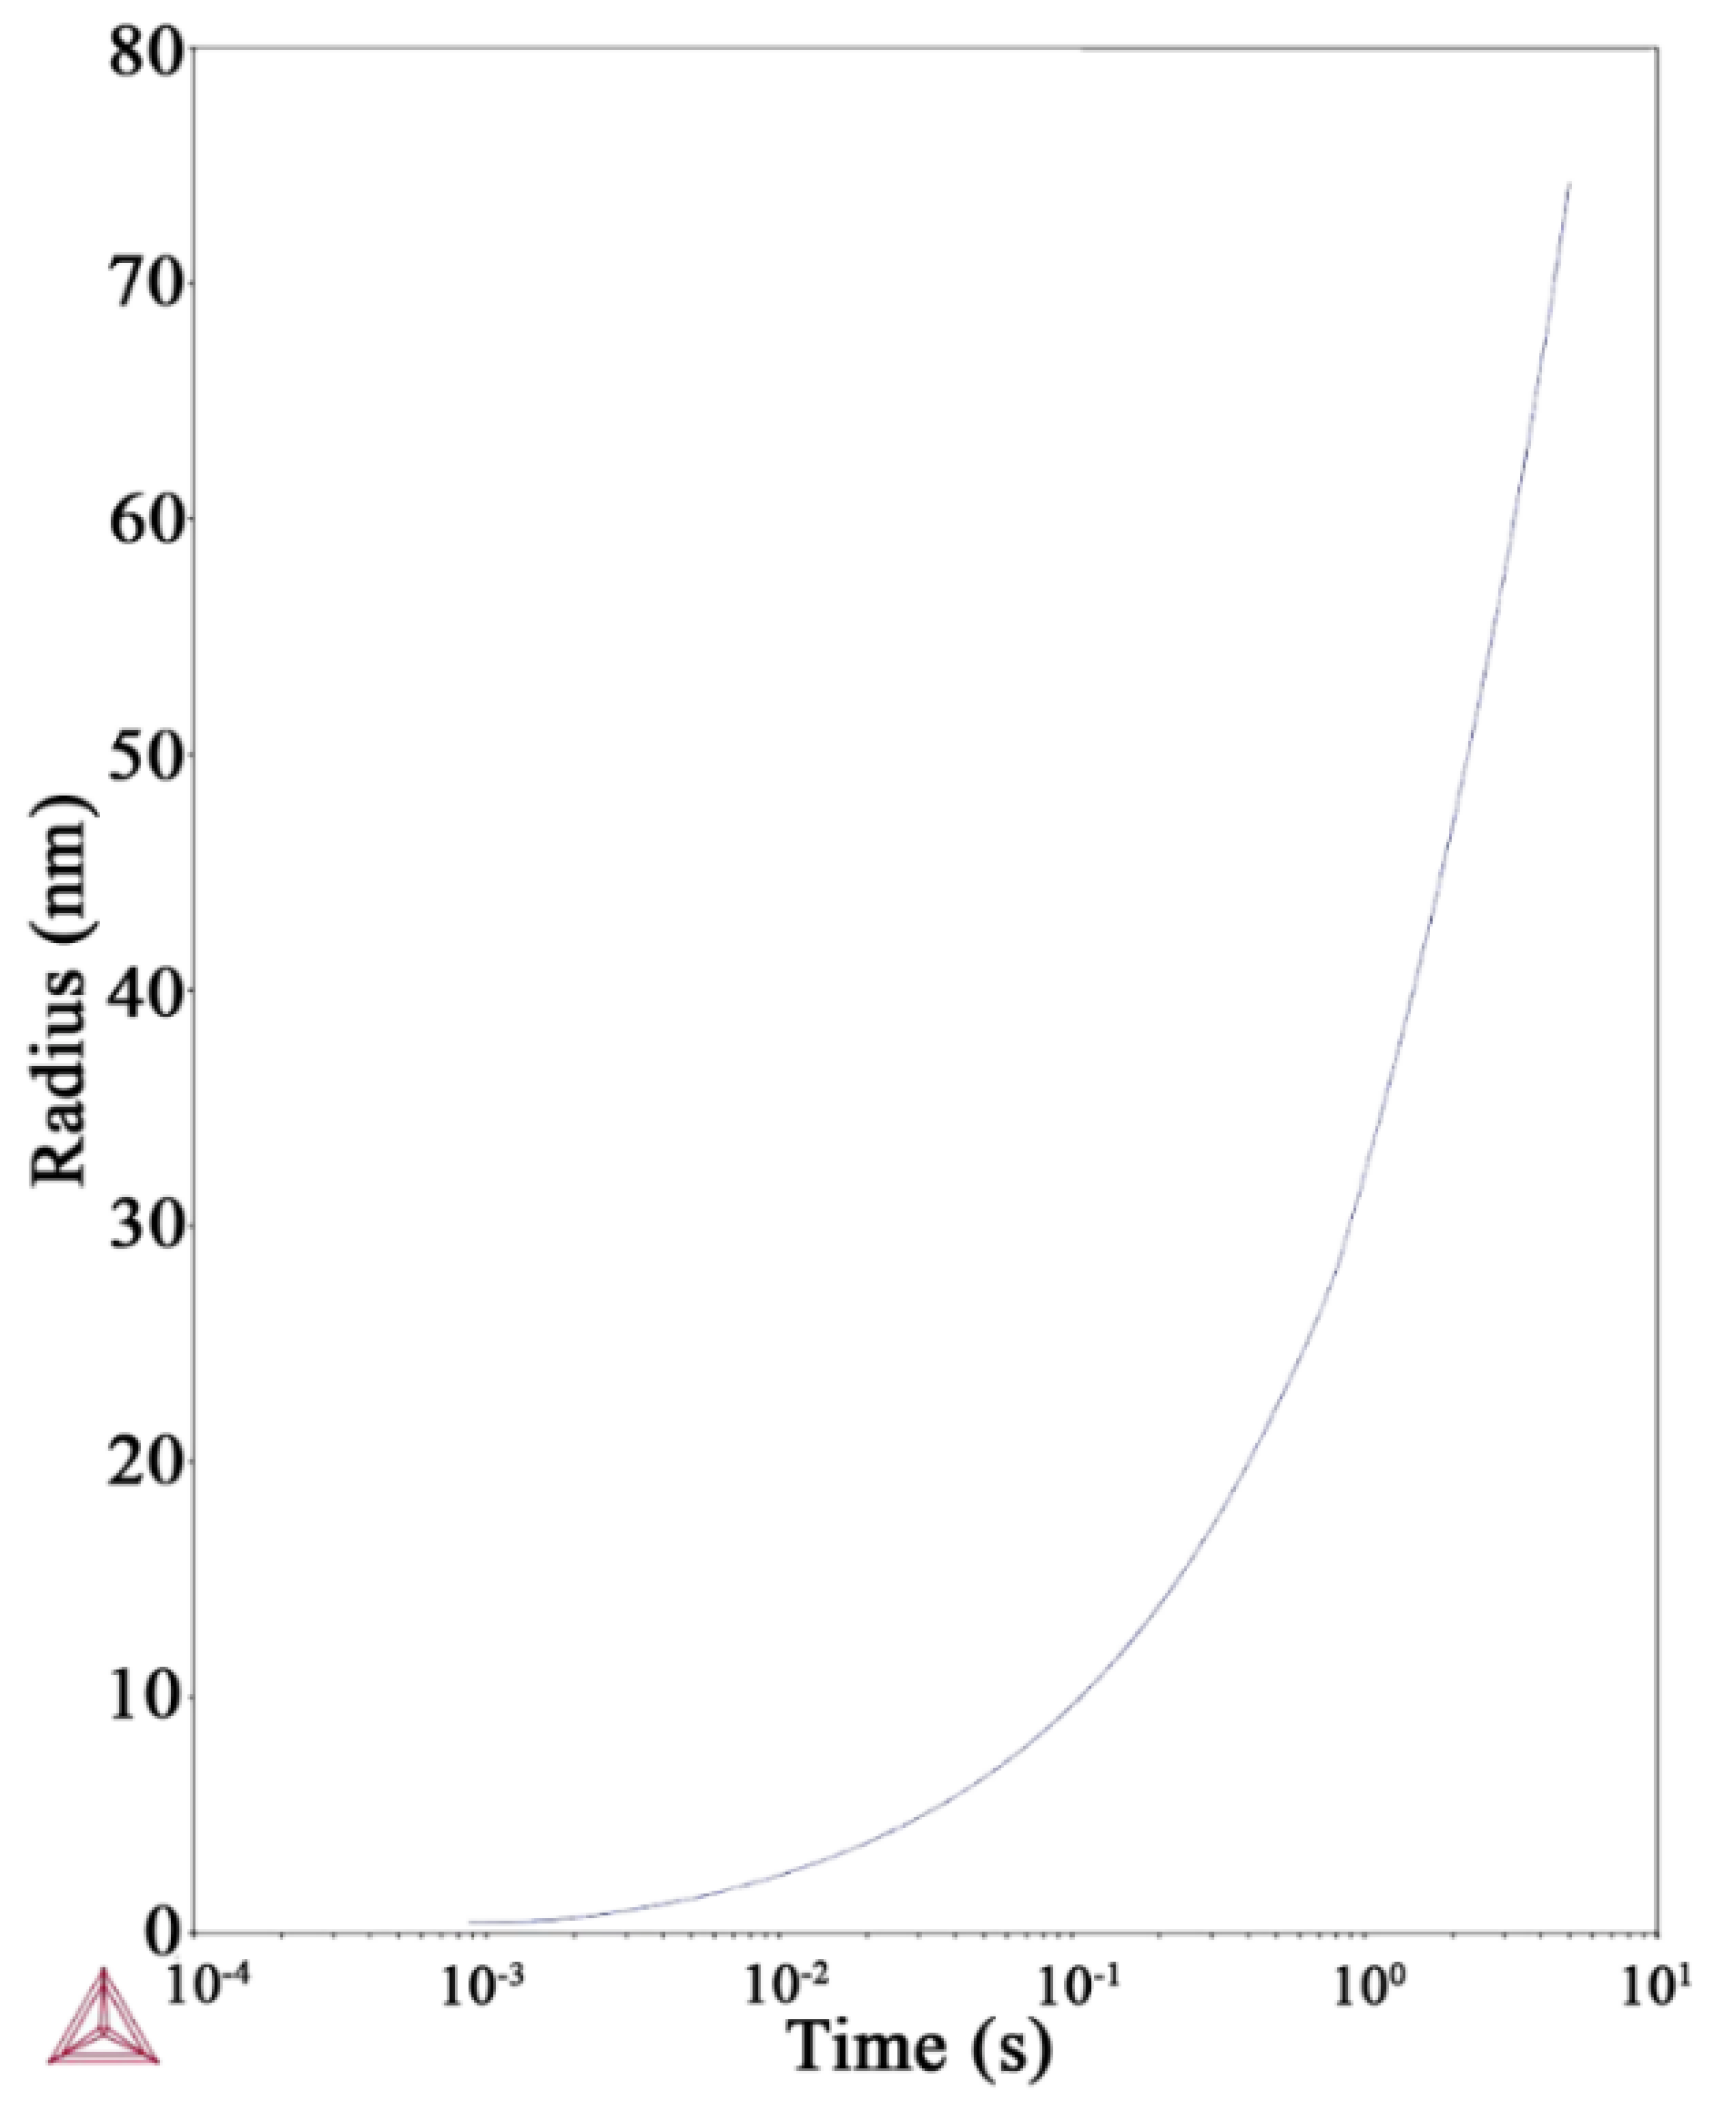
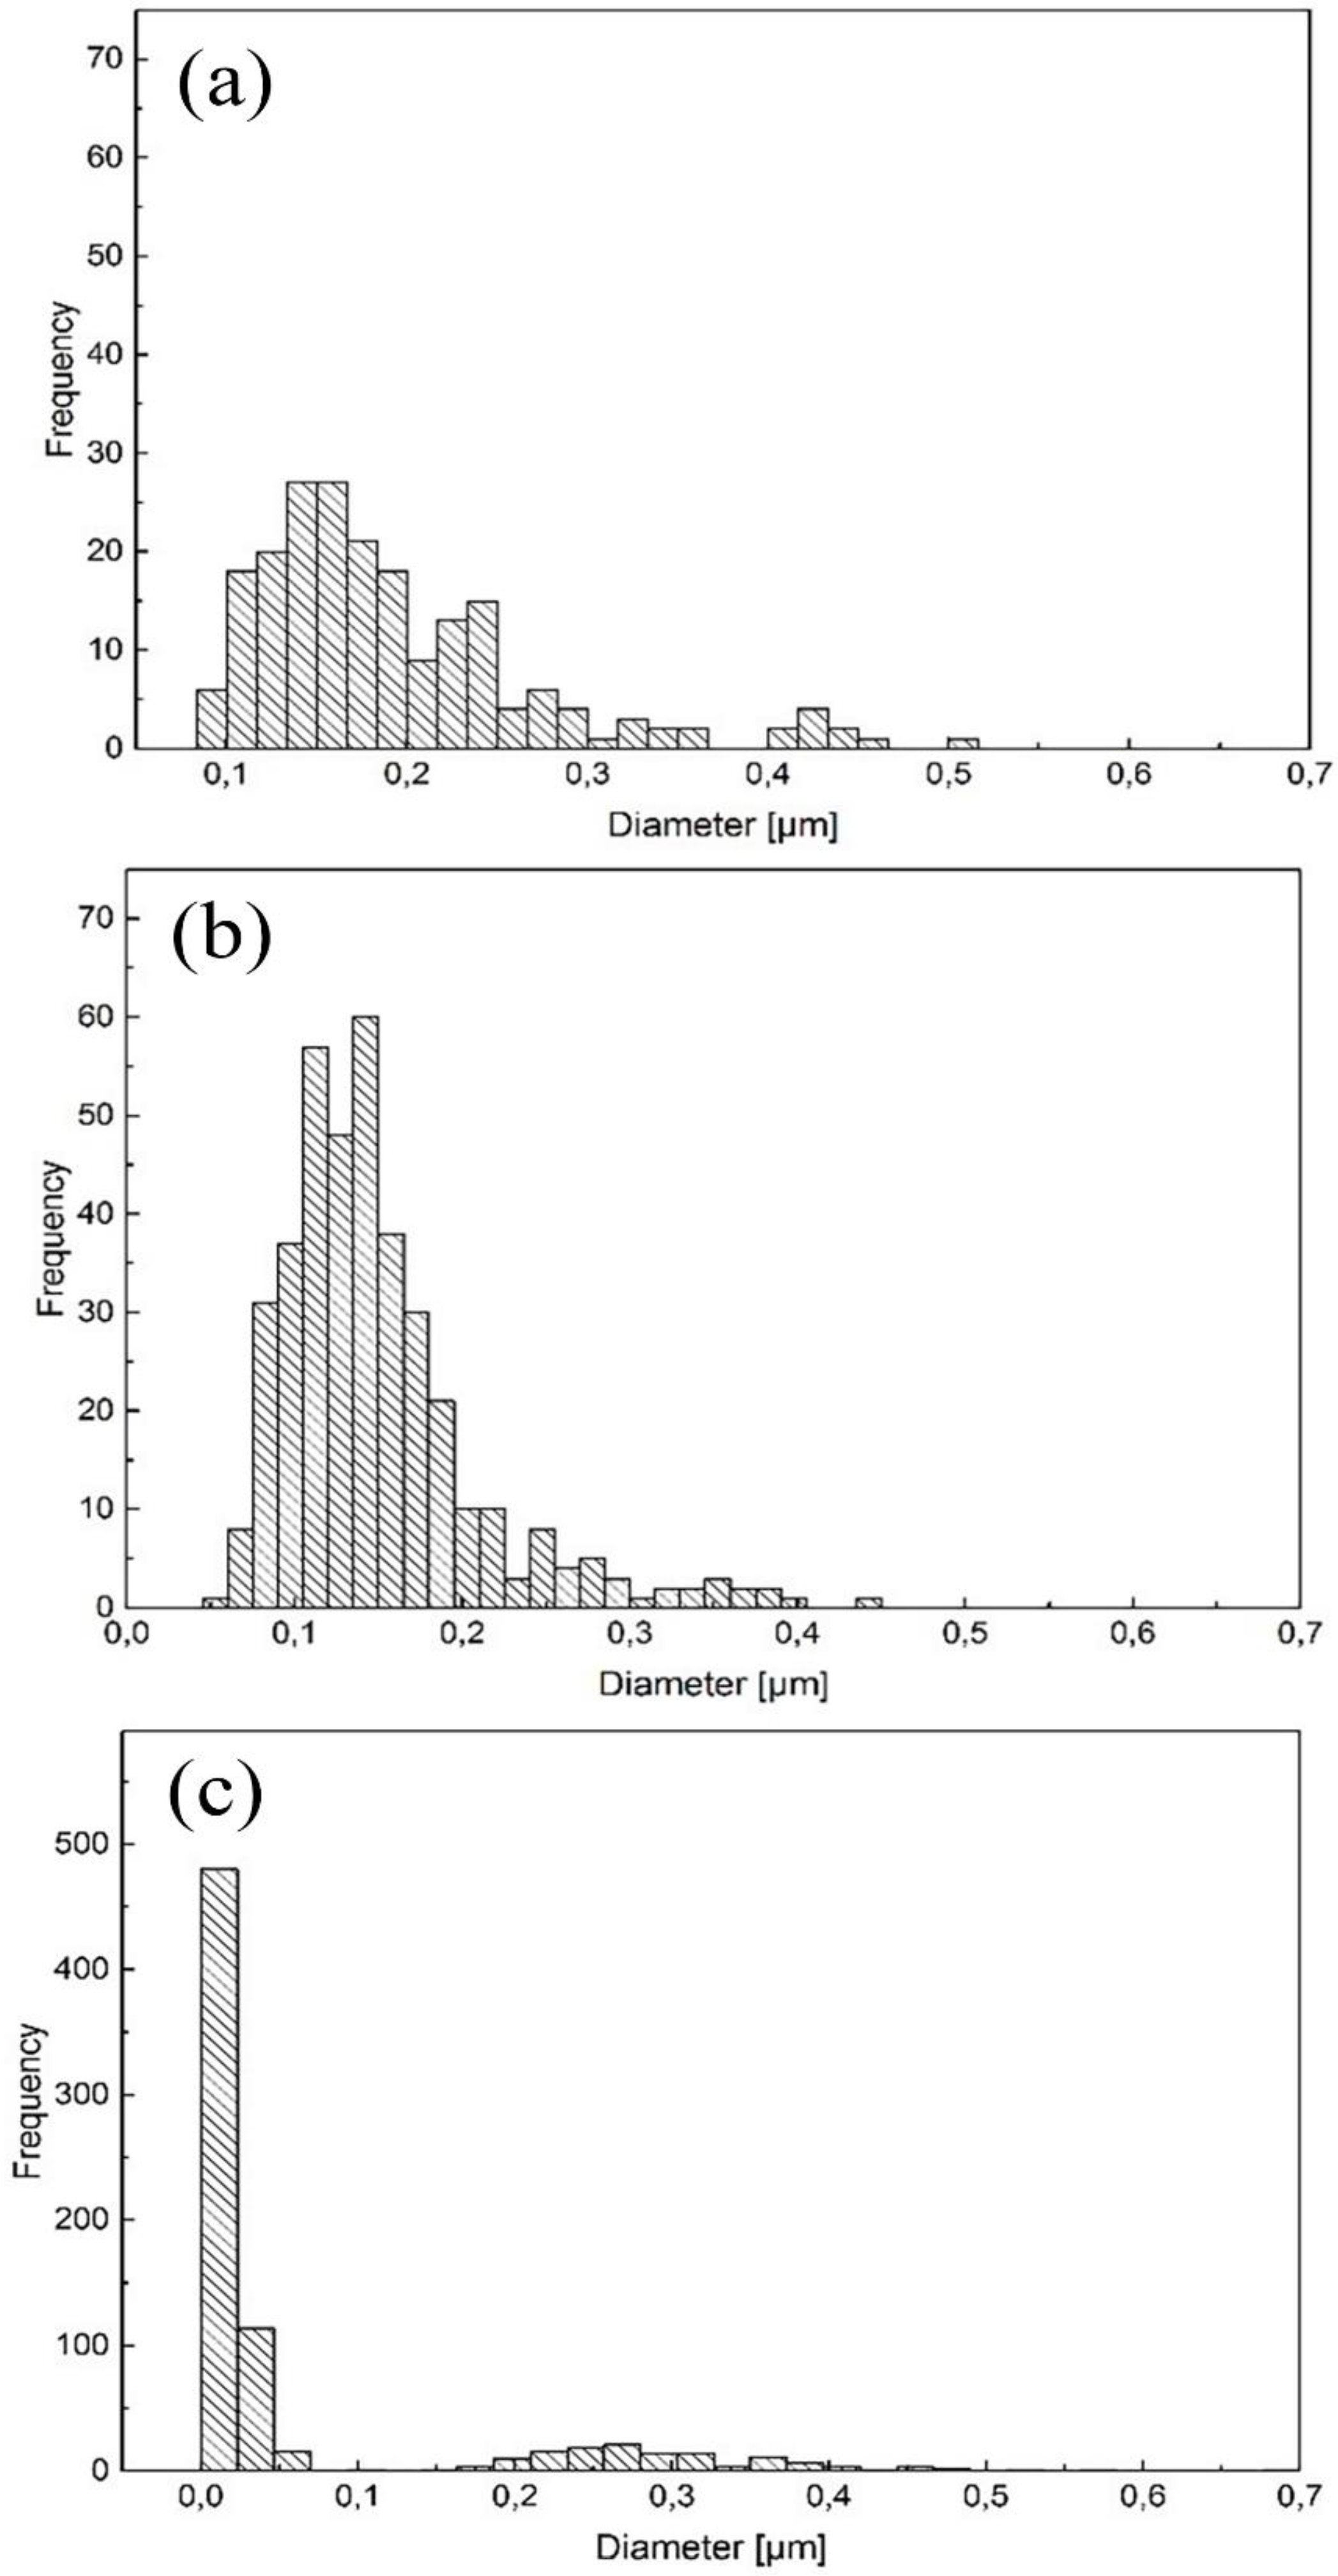
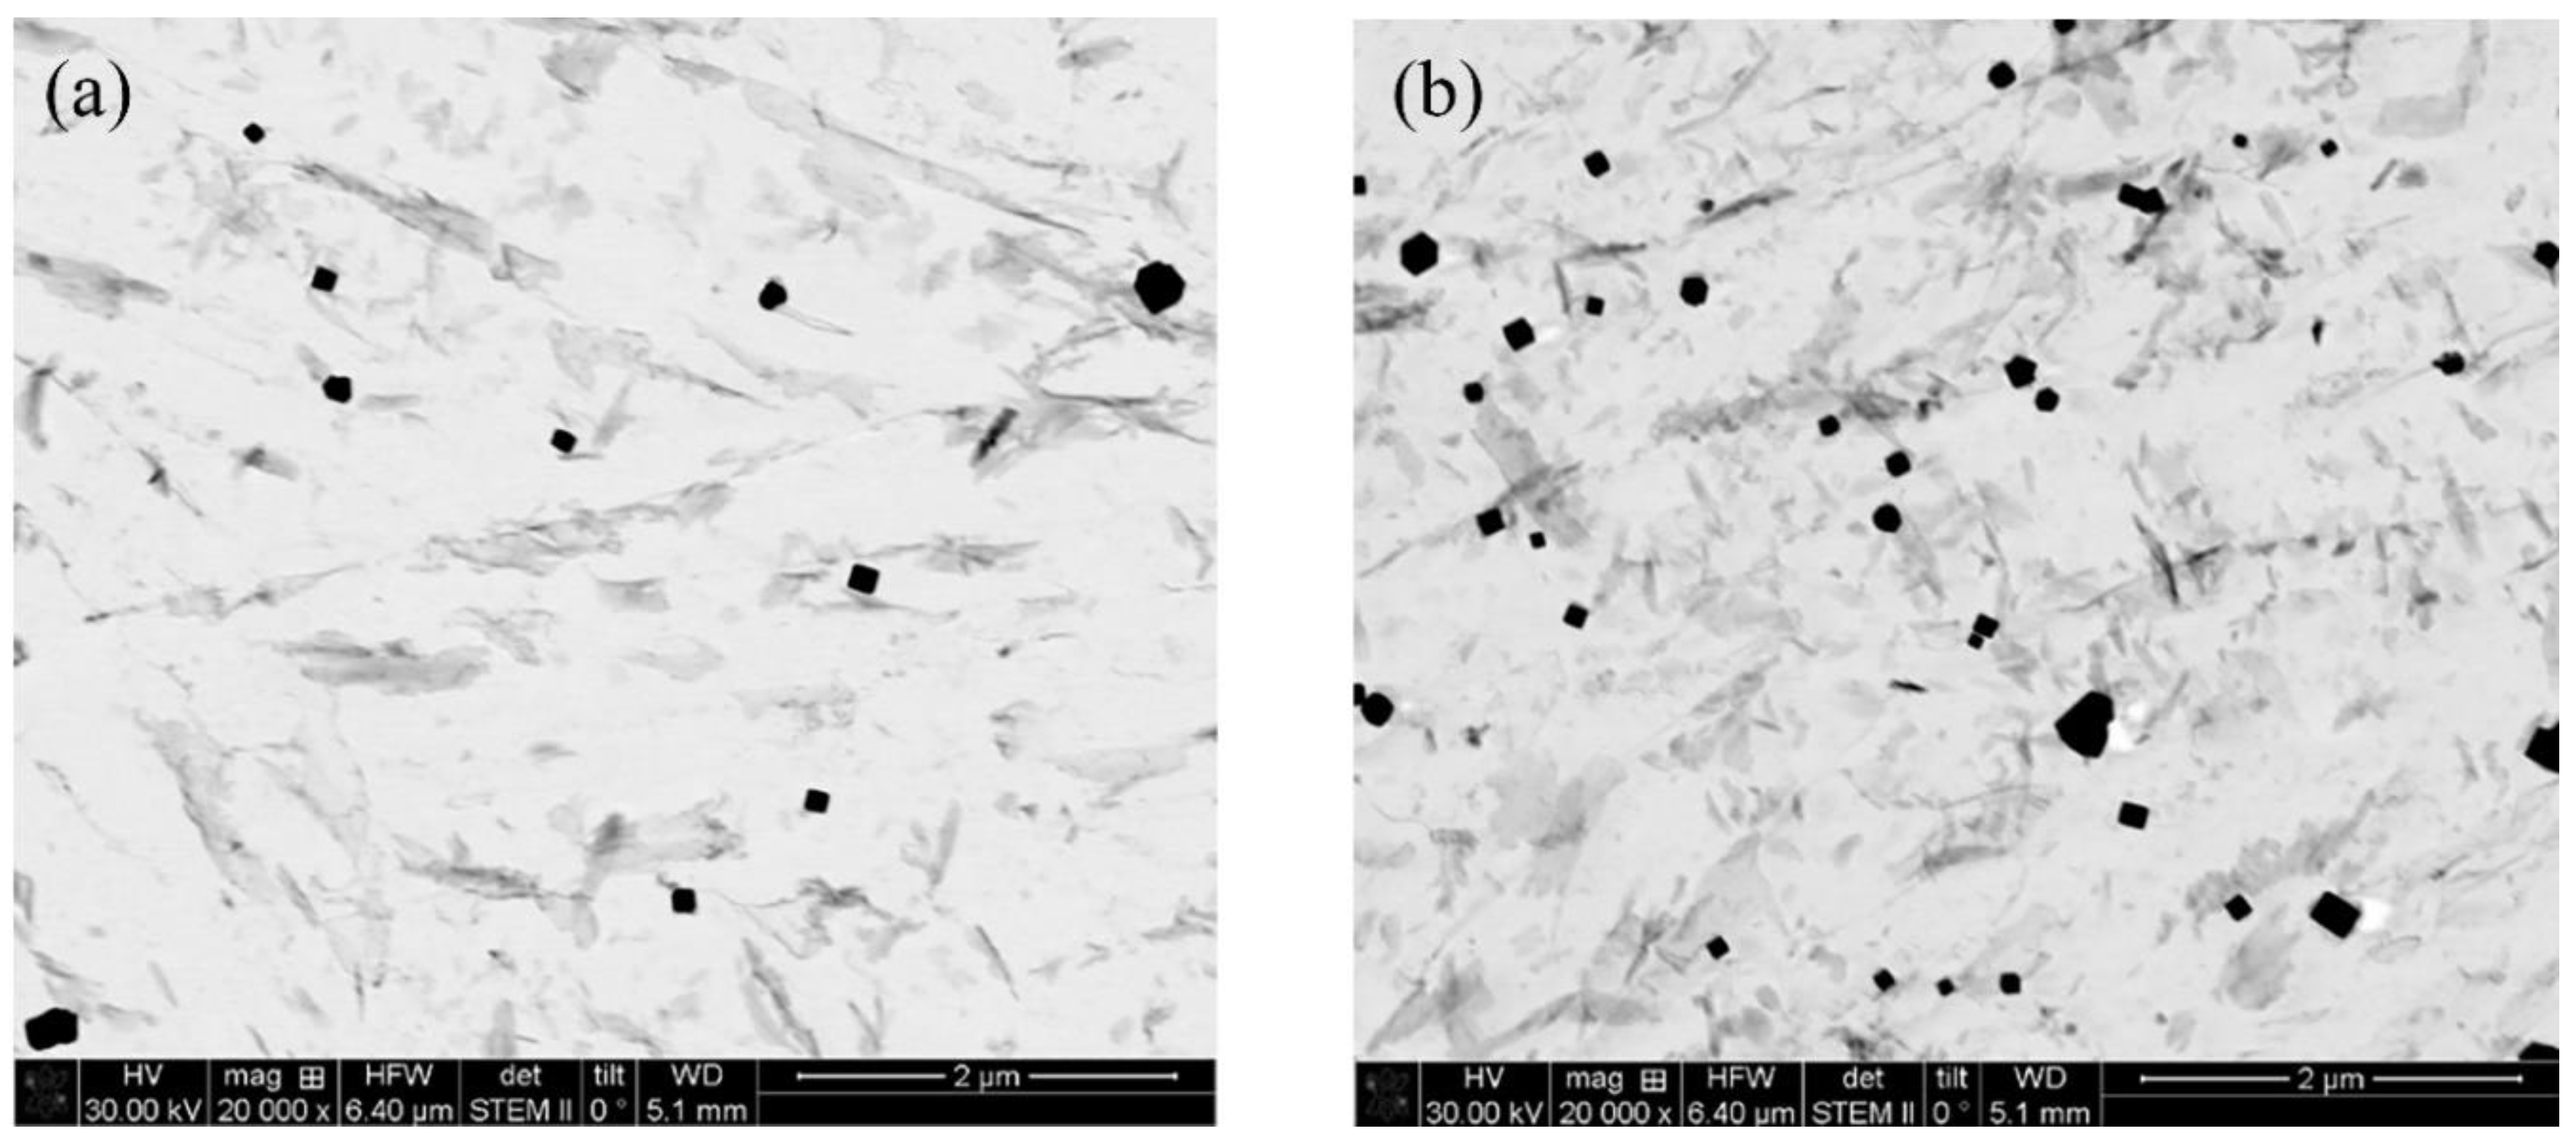
3.4. Kinetics of Precipitation

In Figure 3 it was shown that precipitation of Ti(C, N) can start from the liquid. So, it is difficult to control the size and distribution of the Ti(C, N) particles in the structure. However, SEM pictures of the Q&P-treated sample shows small precipitates as well (Figure 7). EDS study of the particles confirmed the Ti content of these large and sharp-edged particles.
Beside these very large precipitates form during casting, there are some other particles that can nucleate, grow, or coarsen during welding and Q&P treatment. For example, in Figure 7 different particle types can be seen in the HAZ. For example, in region (b) a Ti(C, N) particle nucleated and coarsened during welding and Q&P; region (c) shows accumulation of nucleated carbides at the grain boundary and (d) shows transition carbides that are created during tempering of martensite laths in the partitioning stage.
As reported by Gustafson [35], there are two sizes of TiC particles, one with sparsely distributed particles of micrometer size and a second with densely distributed particles with sizes of a few tens or hundreds of nanometers. In this work, precipitates with the smaller size were studied, under the assumption that the large primary particles are so sparsely distributed that they will not affect the coarsening of the secondary ones, since the coarsening of the large particles is expected to follow a much slower process and has no important influence on the mechanical properties.
Since the precipitates (especially the small ones) from casting will melt in FZ during welding, the most critical area will be HAZ. In order to model the nucleation and growth of precipitation using TC–Prisma, isothermal heating at 1350 °C for 5 s is considered. Figure 8, shows that the equivalent average diameter of Ti(C, N) particles is around 150 nm.
Comparison of the precipitate coarsening rates in corresponding matrix phases using the Thermocalc database shows that increasing the temperature from 540 °C to 640 °C will increase the coarsening rate of Ti(C, N) 1000 times to 1.27 × 10⁻³⁵ m3/s and of MoC 100 times to 3.875 × 10⁻³¹ m3/s.
Quantification of the precipitate size distribution in base material (BM) and in those partitioned at 540 °C and 640 °C was carried out by STEM from carbon replicas of the samples.
Figure 9 shows the particle size distribution for both partitioned samples (at 540 °C and 640 °C) and for the BM. The average particle size was calculated to be 0.263 ± 0.108 µm, 0.207 ± 0.089 µm, and 0.07 ± 0.11 µm for S(540, 5), S(640, 50), and BM, respectively. The precipitates quantification in the BM became more complicated since it presents particles over a large range of sizes. SEM analysis of precipitates show a few large particles (between 0.2 and 0.65 µm) at relatively low magnification (20,000×). However, at higher magnifications (e.g., 80,000×), a large quantity of small particles (<0.2 µm) can be distinguished. For this reason, the analysis of the precipitates in this sample was performed at two different magnifications.
Figure 10 shows STEM images from C replicas corresponding to the samples. An apparently larger particle density can be observed in the sample partitioned at 640 °C, when comparing the same area of both samples (Figure 10a,b). However, the particle density has not been systematically analyzed in this case. Two hundred six and 388 particles were considered for S(540, 5) and S(640, 50), respectively, and this was compared with the base metal (see Figure 9).
Results indicate that the approximate average size of particles in treated samples are 0.263 ± 0.108 µm for the sample partitioned at 540 °C and 0.207 ± 0.089 µm for the one partitioned at 640 °C, while the number density of particles after partitioning at 640 °C is around 1.5 times higher than for 540 °C. This can be seen when comparing Figure 10a,b.
From EDS measurements, it was determined that the particles in samples partitioned at 540 °C and 640 °C are principally MoC (round shaped particles) and Ti(C, N) (rectangular shaped particles).

3.5. Grain Size Effect

As mentioned before, the structure is made of tempered and fresh martensite lathes from the first and second quench and bainite from the partitioning stage. So, the toughness of such structure is increased by a high density of the high angle boundaries created, because this kind of boundary acts as an obstacle for cleavage propagation, forcing the cleavage crack to change its microscopic plane of propagation in order to accommodate the new local crystallography [22,36,37]. In addition, the presence of coarse martensite laths leads to early strain localization, especially when they are in the vicinity of untempered martensite islands [38]. However, the complexity of the lath martensitic/bainitic structure makes the grain size measurement very difficult. For this reason, the region of martensite/bainite lathes with a determined crystallographic orientation is defined as a block [39]. Clusters of blocks form a packet when they share the same (111)γ, to which the corresponding (001)α is almost parallel [40]. Since the blocks and packages present high angle grain boundaries (>11°), the toughness of the material might be influenced by their size [41]. In this study, the effective grain size of the martensite/bainite was determined from EBSD measurements, considering grain boundary misorientation ≥15°. Figure 11 shows the inverse pole figure (IPF) superimposed on the image quality map (IQ) for the treated samples. Results shows that partitioning at a lower temperature (540 °C) leads to a refinement of the effective grain size (block packages), as can be noticed by the change in the color orientation. Kawata et al. [42] showed that the bainite block is coarsened by ausforming, especially for a higher temperature, by formation of preferred variants in a packet. In contrast, the same ausforming treatments refine the lath martensite block. In fact, packet size will influence the ductile–brittle transition temperature (DBTT). As mentioned in Equation (1), DBTT (T) is inversely proportional to the root square of the distance between high-angle grain boundaries (d), where K is a constant [36]:
T = T0 − Kd−2.

4. Conclusions

The aim of this work was to investigate the reason for brittle fracture of the samples from a low-carbon, low-Si AHSS, which were post-weld heat-treated by the Q&P method around Bs temperature (640 °C). Their strength and ductility were the best in comparison with other samples partitioned at lower temperatures, i.e., 540 °C and 440 °C. Results shows that since Dcα′ is much higher than Dcγ carbon diffuses out from martensite and piles up behind the border of α′/γ. The partitioning temperature controls the rate of carbon diffusion, but this amount at the α′/γ border cannot reach the level necessary to stabilize austenite at 640 °C, while it can occur for a small area next to the border at 540 °C. Subsequently, this RA can contribute to eliminating the brittle fracture due to the TRIP effect and increasing the impact toughness.
STEM results of carbon replicas revealed that there are many more very small precipitates (<0.1 μm) in the sample partitioned at 640 °C; this can increase the strength of the material via precipitation strengthening mechanism. On the other hand, EBSD results showed much larger crystallographic packets in this sample, which can result in a lowering of the material strength. The increase of strength by precipitation strengthening and the decrease of the strength due to larger packet size will counteract each other so that the tensile test results of the samples partitioned at 640 °C are still good.

Author Contributions

Concept and design of experiments: F.F. and E.V.; Experiments, simulations, analysis of data and writing the original draft: F.F.; Experiments and revising the paper: M.A.G.; Supervision: E.V. and F.M.

Funding

This research was funded by Erasmus+: Erasmus Mundus Joint Doctorate (EMJD)-Advanced Materials Engineering-DOCMASE, grant number “2011-0020”.

Acknowledgments

The support of the EUSMAT (European School of Materials) via the Ph.D. program ‘DOCMASE’ and Flavio Soldera is gratefully acknowledged by the authors.

Conflicts of Interest

The authors declare no conflict of interest.

References

  1. Opbroek, E. UltraLight Steel: A Global Consortium Changes the Future of Automotive Steel; Xlibris: Bloomington, IN, USA, 2013; ISBN 1479773441. [Google Scholar]
  2. Shome, M.; Tumuluru, M. Welding and Joining of Advanced High Strength Steels (AHSS), 1st ed.; Woodhead Publishing: Cambridge, UK, 2015; ISBN 9780857098580. [Google Scholar]
  3. Speer, J.; Matlock, D.K.; De Cooman, B.C.; Schroth, J.G. Carbon partitioning into austenite after martensite transformation. Acta Mater. 2003, 51, 2611–2622. [Google Scholar] [CrossRef]
  4. Forouzan, F.; Vuorinen, E.; Mücklich, F. Post weld–treatment of laser welded AHSS by application of quenching and partitioning technique. Mater. Sci. Eng. A 2017, 698, 174–182. [Google Scholar] [CrossRef]
  5. Clarke, A.J.; Speer, J.G.; Miller, M.K.; Hackenberg, R.E.; Edmonds, D.V.; Matlock, D.K.; Rizzo, F.C.; Clarke, K.D.; De Moor, E. Carbon partitioning to austenite from martensite or bainite during the quench and partition (Q&P) process: A critical assessment. Acta Mater. 2008, 56, 16–22. [Google Scholar] [CrossRef]
  6. Santofimia, M.J.; Zhao, L.; Sietsma, J. Microstructural Evolution of a Low–Carbon Steel during Application of Quenching and Partitioning Heat Treatments after Partial Austenitization. Metall. Mater. Trans. A 2009, 40, 46–57. [Google Scholar] [CrossRef]
  7. Toji, Y.; Miyamoto, G.; Raabe, D. Carbon partitioning during quenching and partitioning heat treatment accompanied by carbide precipitation. Acta Mater. 2015, 86, 137–147. [Google Scholar] [CrossRef]
  8. Charleux, M.; Poole, W.J.; Militzer, M.; Deschamps, A. Precipitation behavior and its effect on strengthening of an HSLA–Nb/Ti steel. Metall. Mater. Trans. A 2001, 32, 1635–1647. [Google Scholar] [CrossRef]
  9. Soto, R.; Saikaly, W.; Bano, X.; Issartel, C.; Rigaut, G.; Charai, A. Statistical and theoretical analysis of precipitates in dual–phase steels microalloyed with titanium and their effect on mechanical properties. Acta Mater. 1999, 47, 3475–3481. [Google Scholar] [CrossRef]
  10. Toji, Y.; Matsuda, H.; Herbig, M.; Choi, P.; Raabe, D. Atomic–scale analysis of carbon partitioning between martensite and austenite by atom probe tomography and correlative transmission electron microscopy. Acta Mater. 2014, 65, 215–228. [Google Scholar] [CrossRef]
  11. Fairchild, D.P.; Howden, D.G.; Clark, W.A.T. The mechanism of brittle fracture in a microalloyed steel: Part I. Inclusion–induced cleavage. Metall. Mater. Trans. A 2000, 31, 641–652. [Google Scholar] [CrossRef]
  12. Di Schino, A.; Di Nunzio, P.E. Effect of Nb microalloying on the heat affected zone microstructure of girth welded joints. Mater. Lett. 2017, 186, 86–89. [Google Scholar] [CrossRef]
  13. HajyAkbary, F.; Sietsma, J.; Miyamoto, G.; Furuhara, T.; Santofimia, M.J. Interaction of carbon partitioning, carbide precipitation and bainite formation during the Q&P process in a low C steel. Acta Mater. 2016, 104, 72–83. [Google Scholar] [CrossRef]
  14. Clarke, A.J.; Speer, J.G.; Matlock, D.K.; Rizzo, F.C.; Edmonds, D.V.; Santofimia, M.J. Influence of carbon partitioning kinetics on final austenite fraction during quenching and partitioning. Scr. Mater. 2009, 61, 149–152. [Google Scholar] [CrossRef] [Green Version]
  15. Somani, M.C.; Porter, D.A.; Karjalainen, L.P.; Misra, R.D.K. On Various Aspects of Decomposition of Austenite in a High–Silicon Steel During Quenching and Partitioning. Metall. Mater. Trans. A 2014, 45, 1247–1257. [Google Scholar] [CrossRef]
  16. Santofimia, M.J.; Zhao, L.; Sietsma, J. Overview of Mechanisms Involved During the Quenching and Partitioning Process in Steels. Metall. Mater. Trans. A 2011, 42, 3620–3626. [Google Scholar] [CrossRef]
  17. Thomas, G.A.; Speer, J.G. Interface migration during partitioning of Q&P Steel. Mater. Sci. Technol. 2014, 30, 998–1007. [Google Scholar] [CrossRef]
  18. De Knijf, D.; Petrov, R.; Föjer, C.; Kestens, L.A. Effect of fresh martensite on the stability of retained austenite in quenching and partitioning steel. Mater. Sci. Eng. A 2014, 615, 107–115. [Google Scholar] [CrossRef]
  19. De Knijf, D.; Puype, A.; Föjer, C.; Petrov, R. The influence of ultra–fast annealing prior to quenching and partitioning on the microstructure and mechanical properties. Mater. Sci. Eng. A 2015, 627, 182–190. [Google Scholar] [CrossRef]
  20. De Diego-Calderón, I.; Sabirov, I.; Molina-Aldareguia, J.M.; Föjer, C.; Thiessen, R.; Petrov, R.H. Microstructural design in quenched and partitioned (Q&P) steels to improve their fracture properties. Mater. Sci. Eng. A 2016, 657, 136–146. [Google Scholar] [CrossRef]
  21. Wang, C.; Wang, M.; Shi, J.; Hui, W.; Dong, H. Effect of microstructural refinement on the toughness of low carbon martensitic steel. Scr. Mater. 2008, 58, 492–495. [Google Scholar] [CrossRef]
  22. Forouzan, F.; Gunasekaran, S.; Hedayati, A.; Vuorinen, E.; Mucklich, F. Microstructure analysis and mechanical properties of Low alloy High strength Quenched and Partitioned Steel. DiVA 2016, 258, 574–578. [Google Scholar] [CrossRef]
  23. Andersson, J.O.; Helander, T.; Höglund, L.; Shi, P.F.; Sundman, B. Thermo-Calc & DICTRA, Computational tools for materials science. Calphad 2002, 26, 273–312. [Google Scholar]
  24. Thermo-Calc Software TCFE9 Steels/Fe-alloys Database. Available online: https://www.thermocalc.com/products-services/databases/thermodynamic/ (accessed on 20 September 2018).
  25. A.B. MOBFE3: TCS Steels/Fe–Alloys Mobility Database. Thermo–Calc Software. Available online: https://www.thermocalc.com/products-services/databases/mobility/ (accessed on 20 September 2018).
  26. Bhadeshia, H.; Honeycombe, R. Microstructure and properties. In Steels: Microstructure and Properties, 3rd ed.; Butterworth–Heinemann: Cambridge, UK, 2011; ISBN1 0080462928. ISBN2 9780080462929. [Google Scholar]
  27. Nishikawa, A.S.; Santofimia, M.J.; Sietsma, J.; Goldenstein, H. Influence of bainite reaction on the kinetics of carbon redistribution during the Quenching and Partitioning process. Acta Mater. 2018, 142, 142–151. [Google Scholar] [CrossRef]
  28. Payson, P.; Savage, C.H. Martensite reactions in alloy steels. Trans. ASM 1944, 33, 261–280. [Google Scholar]
  29. Grange, R.A.; Stewart, H.M. The temperature range of martensite formation. Trans. AIME 1946, 167, 467–501. [Google Scholar]
  30. Van Bohemen, S. Bainite and martensite start temperature calculated with exponential carbon dependence. Mater. Sci. Technol. 2012, 28, 487–495. [Google Scholar] [CrossRef]
  31. Nehrenberg, A.E. Contribution to Discussion on Grange and Stewart. Trans. Am. Inst. Min. Met. Eng. 1946, 167, 494–498. [Google Scholar]
  32. Haynes, A.G.; Steven, W. The temperature of formation of martensite and bainite in low–alloy steel. J. Iron Steel Inst. 1956, 183, 349–359. [Google Scholar]
  33. Andrews, K.W. Empirical formulae for the calculation of some transformation temperatures. J. Iron Steel Inst. 1965, 203, 721–727. [Google Scholar]
  34. Wu, R.; Li, J.; Li, W.; Wu, X.; Jin, X.; Zhou, S.; Wang, L. Effect of metastable austenite on fracture resistance of quenched and partitioned (Q&P) sheet steels. Mater. Sci. Eng. A 2016, 657, 57–63. [Google Scholar] [CrossRef]
  35. Gustafson, Å. Coarsening of TiC in austenitic stainless steel-experiments and simulations in comparison. Mater. Sci. Eng. A 2000, 287, 52–58. [Google Scholar] [CrossRef]
  36. Díaz–Fuentes, M.; Iza–Mendia, A.; Gutiérrez, I. Analysis of different acicular ferrite microstructures in low–carbon steels by electron backscattered diffraction. Study of their toughness behavior. Metall. Mater. Trans. A 2003, 34, 2505–2516. [Google Scholar] [CrossRef]
  37. Rodriguez–Ibabe, J. The Role of Microstructure in Toughness Behaviour of Microalloyed Steels. Mater. Sci. Forum. 1998, 284–286, 51–62. [Google Scholar] [CrossRef]
  38. Wang, M.; Hell, J.; Tasan, C.C. Martensite size effects on damage in quenching and partitioning steels. Scr. Mater. 2017, 138, 1–5. [Google Scholar] [CrossRef]
  39. Verbeken, K.; Barbé, L.; Raabe, D. Evaluation of the crystallographic orientation relationships between FCC and BCC phases in TRIP steels. ISIJ Int. 2009, 49, 1601–1609. [Google Scholar] [CrossRef]
  40. Morito, S.; Tanaka, H.; Konishi, R.; Furuhara, T.; Maki, T. The morphology and crystallography of lath martensite in Fe–C alloys. Acta Mater. 2003, 51, 1789–1799. [Google Scholar] [CrossRef]
  41. Bhadeshia, H.K.D.H. Bainite in Steels. In Theory and Practice, 3rd ed.; Maney Publishing: Cambridge, UK, 2015; ISBN1 1909662747. ISBN2 9781909662742. [Google Scholar]
  42. Kawata, H.; Sakamoto, K.; Moritani, T.; Morito, S.; Furuhara, T.; Maki, T. Crystallography of ausformed upper bainite structure in Fe–9Ni–C alloys. Mater. Sci. Eng. A 2006, 438, 140–144. [Google Scholar] [CrossRef]
Figure 1. Fracture surface after tensile test of following samples; (a) S(540, 5), shows ductile fracture of HAZ (b) S(640, 50), shows brittle fracture of HAZ and (c) reference weld.
Metals 08 00747 g001
Figure 2. Amount of all phases calculated with Thermocalc: (a) full range of phases; (b) focus on carbides.
Metals 08 00747 g002
Figure 3. Time–temperature–precipitation (TTP) diagrams of (a) Ti(C, N); (b) MoC.
Metals 08 00747 g003
Figure 4. (a) Optical microscopy (OM) and (b) SEM pictures of samples quenched to 350 °C; (c) rectangular model with linear mesh assumed for 3 μm austenite and 2 μm martensite.
Metals 08 00747 g004
Figure 5. Carbon content of (a) Fe–0.08 wt % C–1.78 wt % Mn system at 640 °C; (b) Fe–0.08 wt % C–1.78 wt % Mn system at 540 °C.
Metals 08 00747 g005
Figure 6. Comparison of samples partitioned at 540 °C, 5 s (blue) and 640 °C, 50 s (red), calculated using Dictra. (a) The composition of the interface as a function of the time; (b) carbon content vs. location γ/α interface is at 3 μm distance).
Metals 08 00747 g006
Figure 7. SEM pictures of S(640, 50) displays secondary precipitates at different size and shapes.
Metals 08 00747 g007
Figure 8. Prediction of precipitate size in HAZ considering isothermal heating at 1350 °C for 5 s, resulting in a particle size of around 150 nm.
Metals 08 00747 g008
Figure 9. Measured size distribution of precipitates vs. number of particles for post-welding heat-treated samples (a) at QT = 355 °C and PT = 540 °C for 5 s; (b) at QT = 355 °C and PT = 640 °C for 50 s; (c) base metal.
Metals 08 00747 g009
Figure 10. Comparison between distribution, number density, and shape of the particles in carbon replicas made from the sample: (a) S(540, 5) and (b) S(640, 50).
Metals 08 00747 g010
Figure 11. IPF + IQ picture from EBSD analysis of samples: (a) S(540, 5); (b) S(640, 50).
Metals 08 00747 g011
Table 1. The chemical composition of the steel used in the experiments (wt %).
CSiMnPSAlTiMoCrNiCuVNFe
0.0820.231.790.0080.0010.0380.1840.5030.0640.2960.0160.0120.004Balance
Table 2. Mechanical properties of samples Q&P treated immediately after laser welding. (Energy = Absorbed energy during Charpy V test at 20 °C.)
Sample Code QT (°C)PT (°C)Pt (s)A80 (%)A5 (%)Rp0.2 (MPa)Rm (MPa)Energy (J/cm2)
S(540,5)35554054610051025109
S(640, 50)3556405068103410514
Table 3. Carbon diffusion coefficient in austenite (Dcγ) and ferrite (Dcα) and at different temperatures.
Carbon Diffusion Coefficient440 °C540 °C640 °C
Dcγ3.30 × 10−167.12 × 10−142.82 × 10⁻²¹
Dcα8.54 × 10−134.49 × 10−171.22 × 10⁻¹⁸

