Purification of Aluminium Cast Alloy Melts through Precipitation of Fe-Containing Intermetallic Compounds


IME Institute of Process Metallurgy and Metal Recycling, RWTH Aachen University, 52056 Aachen, Germany
*
Author to whom correspondence should be addressed.
Metals 2018, 8(10), 796; https://doi.org/10.3390/met8100796
Submission received: 19 August 2018
/
Revised: 14 September 2018
/
Accepted: 1 October 2018
/
Published: 4 October 2018
(This article belongs to the Special Issue Sustainable Utilization of Metals - Processing, Recovery and Recycling)
Abstract
:Aluminium secondary materials are often contaminated by impurities such as iron. As the alloy properties are affected by impurities, it is necessary to refine aluminium melts. The formation of Fe intermetallics in aluminium melts can be used to develop a purification technology based on the removal of intermetallic compounds. In this study, the temperature range for effective separation of intermetallics was determined in an industrial-relevant Al–Si–Fe–Mn system with 6 to 10 Si wt. %, 0.5 to 2.0 Fe wt. %, and 0 to 2.0 Mn wt. %. Based on DTA (Differential Thermal Analysis) and SEM (scanning electron microscope) results and following the rules of phase boundary drawing, isopleths were drawn. This method allows to derive the temperature ranges of intermetallic phase stability and can be applied for the assessment of melt-refining parameters.
1. Introduction
In order to achieve legal recycling rate requirements (e.g., regarding end-of-life vehicles, 95% of materials must be recycled), material cycles must be almost completely closed. The recovery of all metals in their pure form, however, is not possible. Secondary recovered materials are often contaminated. The complexity of such materials leads to difficulties in sorting, as well as to impurity pickup during the mechanical treatment processes. As property formation is affected by impurities, aluminium end-of-life scrap is normally used for the production of cast alloys. Since impurities such as iron accumulate in aluminium secondary alloys at values of up to 2 wt. %, it is difficult to produce Al recycling alloys which conform to standards (Table 1). Therefore, it is necessary to refine aluminium melts, as the current practice of diluting primary aluminium is becoming uneconomical. Among all the impurities that need to be removed, iron is a serious challenge.
While many efforts have been made for the removal of iron from primary aluminium and high-purity aluminium [3,4,5,6], only limited attention has been paid to that of secondary aluminium, which contains usually more than 2 wt. % Fe. Conventional ways of iron removal from high iron-containing aluminium melts include filtration, centrifugal separation, and electromagnetic (EM) separation [7,8,9]. All these methods are based on the principle of precipitation of Fe-enriched phases. It is a well-known fact that in the Al–Si–Fe system, a variety of binary and ternary compounds with Al exist, including Al3Fe, Al5FeSi, Al8Fe2Si, Al3FeSi, and Al4FeSi2 [10,11]. On the one hand, the precipitation of these phases impacts the quality of the end products. On the other hand, it can provide a basis for the development of a refining technology with the help of physical separation process, e.g., filtration. Thus, it was the aim of a six-year project at IME (Institute IME Process Metallurgically and Metal Recycling) to find elements that influence the residue–melt composition in order to reduce the concentration of impurities, above all iron. Even if intermetallic compounds are formed, the conditions and separation technique considered are very important for reaching the highest grade of purity. The aim of this work was to determine suitable temperature ranges in the Al–Si–Fe–Mn system in the industrially relevant concentration areas of 6 to 10 Si wt. %, 0.5 to 2.0 Fe wt. %, and 0 to 2.0 Mn wt. %, in which the separation of intermetallics becomes effective.
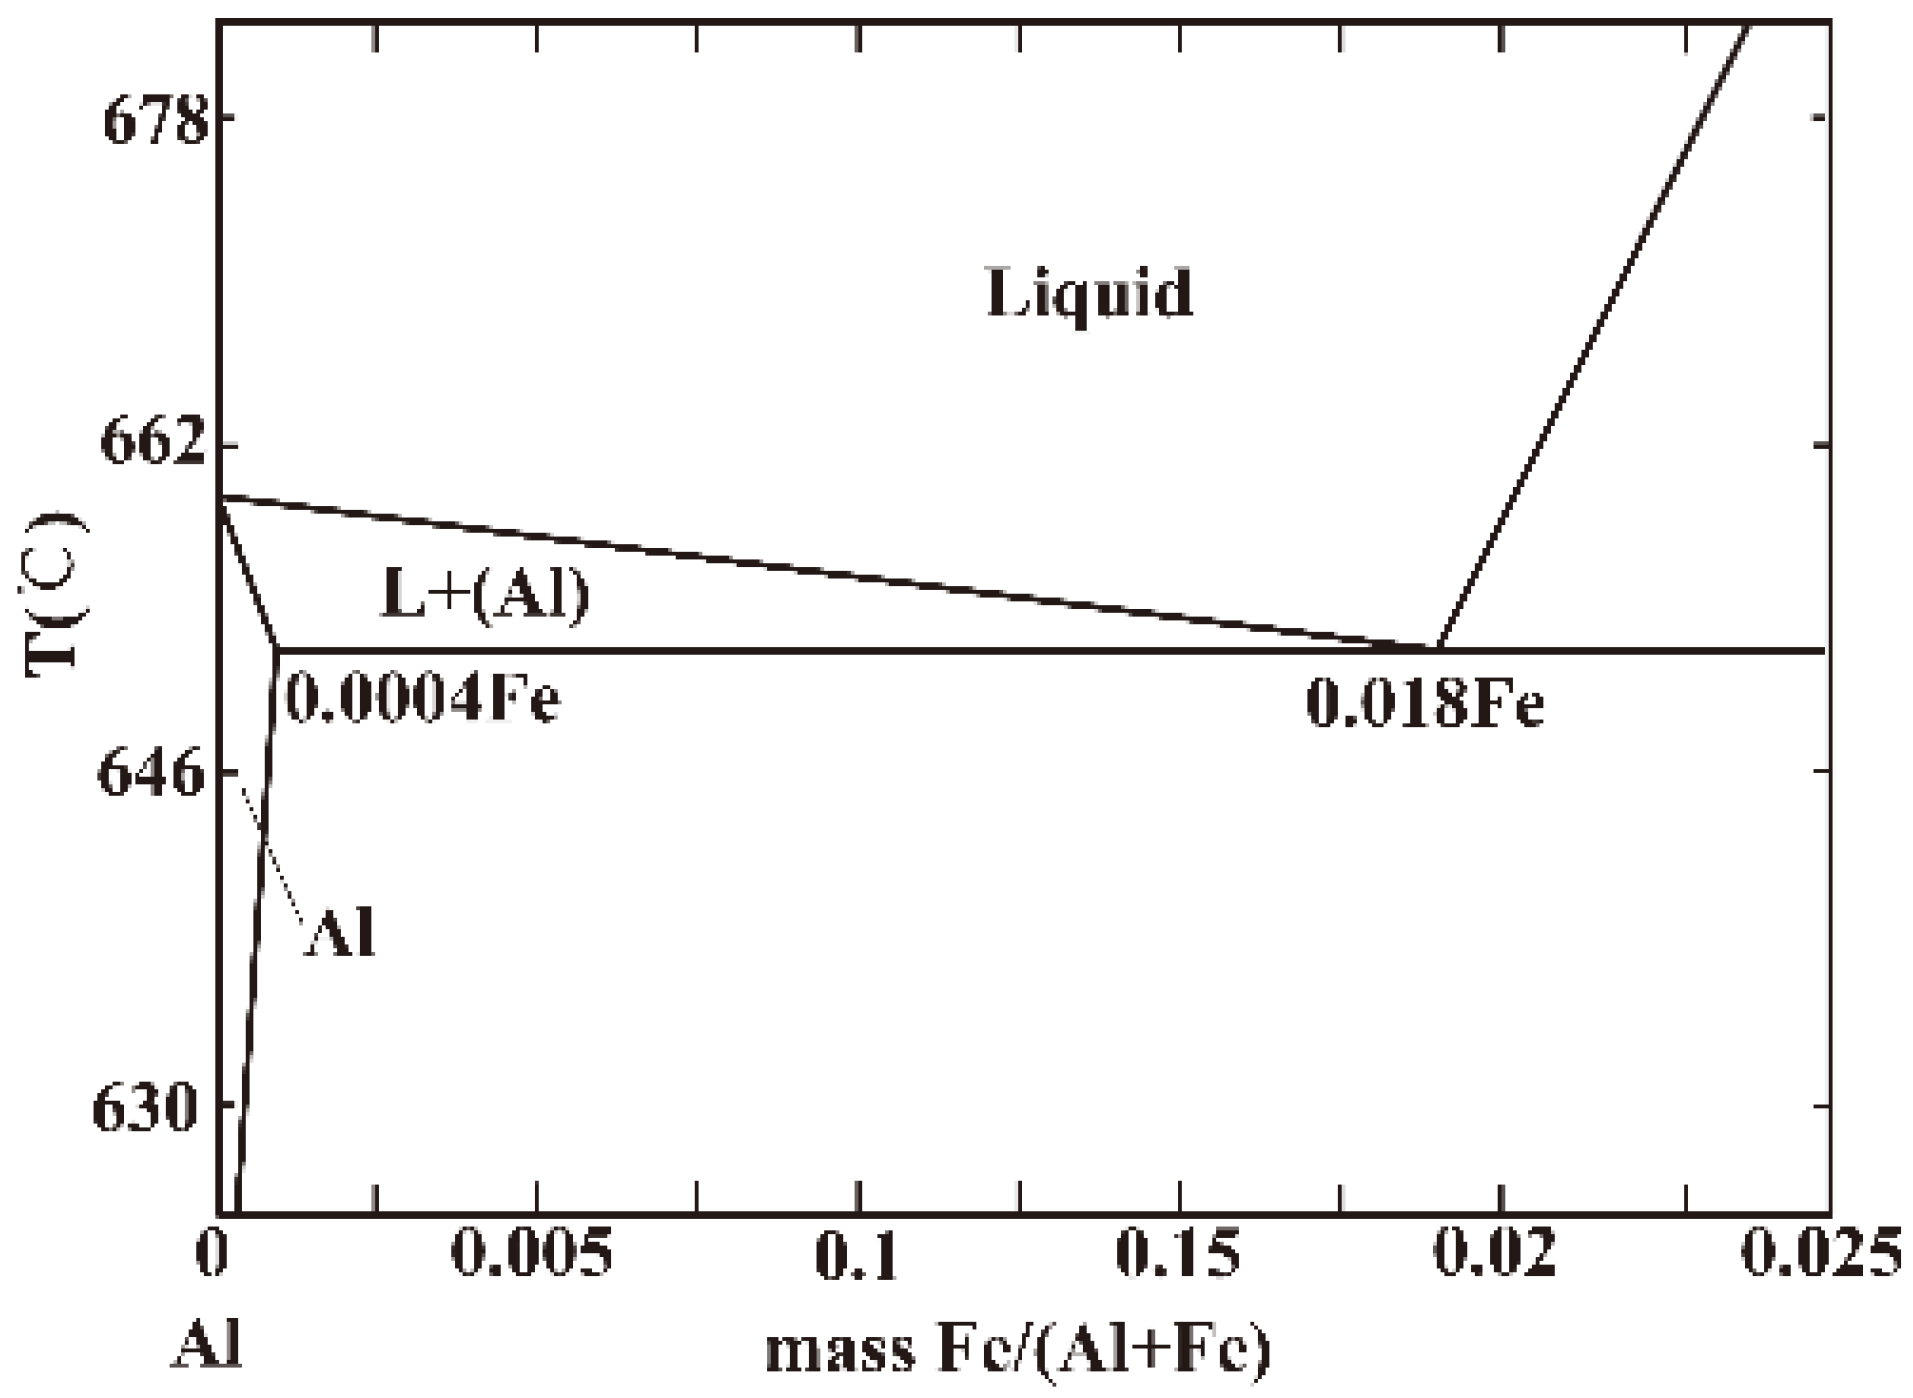
The eutectic iron content in a pure binary Al–Fe melt is 1.8 wt. % at 655 °C [10]. Therefore, in the case of hypereutectic alloys (over 1.8 wt. % Fe), the iron content cannot be reduced by segregation below this value. Iron precipitates in the form of the intermetallic compound Al3Fe, if the temperature falls below the liquidus line (Figure 1). Since this intermetallic phase has a melting point of 1060 °C and is insoluble in molten aluminium, it can be mechanically removed from molten aluminium, e.g., by filtration. Nevertheless, this system has no industrial significance.
Industrial cast alloy compositions are based on the binary system Al–Si, where the ternary eutectic iron content is reduced to 0.7 wt. % at 577 °C [10,11]. In the Al corner of this system, iron is present in the phases Al3Fe, Al8Fe2Si, Al5FeSi, and Al4FeSi2 (Figure 2).
The addition of further alloying elements results in the formation of quaternary or higher alloy systems with complex phase relations. Ternary and quaternary intermetallic compounds with iron are formed in the Al–Si–Fe–Mn system, and iron solubility decreases to 0.29 wt. % at the eutectic point [12]. The current German standards regarding maximum Fe content in cast Al–Si–alloys range between 0.2 and 0.9 wt. % (depending on alloying class) [13]. For the current investigation, the Al–Si–Fe–Mn system was applied because numerous intermetallics are formed in this system, and the residue melt composition can be influenced depending on the Mn/Fe ratio [10,11,12,14,15]. Table 2 summarizes the phases to be expected in the Al–Si–Fe–Mn system.
Until now, no quaternary phase has been clearly identified in this system [10,12,15]. Initially, it was believed that an area of solid solutions existed between Al8Fe2Si and Al15Mn3Si2. Later, this assumption was rejected on the basis of the fact that these compounds had different crystal structures (hexagonal and cubic). The currently accepted version of the phase diagram illustrates a broad range of solid solutions based on the compound Al15Mn3Si2 extending towards the Al–Si–Fe surface [10]. In this variant, manganese is replaced with iron to form the compound with the composition 31 wt. % Fe, 1.5 wt. % Mn, 8 wt. % Si. This broad range of homogeneity is considered as quaternary phase Al15(FeMn)3Si2 [10]. On the other hand, Zakharov A. et al. studied alloys containing 10–14 wt. % Si, 0–3 wt. % Fe, 0–4 wt. % Mn, and proposed the existence of the quaternary compound Al16(FeMn)4Si3 [12]. The formation of this phase would allow a quasi-ternary section Al–Al16(FeMn)4Si3–Si and the formation of two secondary systems on both sides of this section: Al–Al16(FeMn)4Si3–Si–Al5FeSi and Al–Al16(FeMn)4Si3–Si–Al15Mn3Si2.
According to reference [10], the solid solution of iron in the Al15Mn3Si2 phase has a cubic structure with a lattice parameter which decreases because of an increase of Fe content from 1.265 nm (0 wt. % Fe) to 1.25 nm (31.1 wt. % Fe). The quaternary phase found in reference [12] has a face-centered cubic structure with a lattice parameter of a = 1.252 ± 0.04 nm. The similar lattice parameters mean that it cannot be determined which version of the Al–Si–Fe–Mn phase diagram is correct.
In references [11,15], it was proposed that non-equilibrium crystallization had a significant effect on phase composition, especially in Al–Si–Fe alloys. This is because of the inhibition of peritectic reactions, which take a long time to be completed. However, due to numerous intermetallics, this system shows a potential for removing iron and manganese from Al–Si melts. Phase diagrams are a useful tool for presenting the required relations in a metal system.
In comparison with binary systems (only two dimensions), ternary and multi-phase phase diagrams (here and after in this article, “Multi-” refers specially to more than three) are rather complicated. A ternary phase diagram is shown in Figure 3a, where the composition plane forms the base triangle, and phase variations caused by temperature change are illustrated vertically (Figure 3a). Vertical sections (Figure 3b) of a ternary phase diagram—also known as isopleths—have been widely used because of their similarities to binary diagrams. Such sections are two-dimensional planes constructed by cutting the three-dimensional diagrams with a slice which is vertical to the base composition triangle. Once phase areas in an isopleth are clearly clarified, the liquidus and solidus temperatures for certain alloy compositions can be readily read from it.
From the metallurgical practice point of view, multi-phase alloy diagrams involving four or more elements are needed more than binary or ternary diagrams. This is because most commercial alloys contain more than three alloying elements, even without taking impurity into consideration. However, temperature–composition phase diagrams of multi components are extremely inconvenient and highly complicated.
In order to determine the phase variation caused by temperature changes, as well as the composition difference in complex multi-components system, a feasible way is to draw the corresponding three- or two-dimensional sections, in which temperature and concentration of certain component(s) are represented as variables.
For the construction of a two-dimensional isopleth, i.e., temperature–composition diagrams, the following information is usually needed: (1) the general diagram including the number, disposition, and identity of the phases and the respective invariant reaction, and (2) the temperature and compositions along all boundary lines (and surfaces).
The most widely used method of constitutional investigation is Differential Thermal Analysis (DTA). It is capable of locating the liquidus lines and at the same time indicating the general disposition of phases and invariant reactions in the system. Its principle is extremely simple: every occurrence of phase change is accompanied by exothermic and endothermic effects such as heat from the melt crystallization. The delay and acceleration of the cooling speed compared to a reference material is monitored.
2. Materials and Methods
In this research work, approximately 60 alloy compositions were prepared by induction melting within the following concentration ranges: 6 to 10 wt. % Si, 0 to 2 wt. % Fe, and 0 to 2 wt. % Mn. ICP (Spectro ICP-OES Spectro Ciros Vision, Kleve, Germany) analysis was applied to determine the composition of the samples. Differential Thermal Analysis (DTA) (IME, Aachen, Germany) and Scanning Electron Microscopy (SEM) (JEOL JSM-7000F, Tokyo, Japan) with integrated EDX (Energy Dispersive X-ray analysis) (Oxford Instruments, Oxford, UK) were applied to determine phase precipitations and the temperatures of phase transformations.
In order to allow an evaluation in the form of isopleths, three of four element concentrations were kept constant. The groups of investigated alloys and isopleths are shown in Table 3. The manganese content changed from 0 to 2 wt. % by representation on the isopleths in steps of 0.5 wt. %.
Extended experimental equipment for the Differential Thermal Analysis (DTA) (IME, Aachen, Germany) was built, containing a resistance furnace and a differential thermocouple (Figure 4). The differential thermocouple consists of two connected thermocouples. The first one, the working thermocouple, measured the temperature in the sample. The second one, the reference thermocouple, measured the temperature difference which existed during cooling between the samples and the reference substance. Two crucibles, one with the reference substance (Al2O3) and the other with the sample, were placed in a steel block to ensure the same external heat conditions for both crucibles during cooling. As steel has a lower thermal conductivity than Al, this block protected the crucibles from temperature changes in the furnace space. Such changes could influence the temperature data and distort the results.
In order to determine an isopleth with sufficient accuracy, a minimum of five alloys must be investigated. After melting the alloy, the differential thermal analysis commenced. The sample, weighing approximately 20 g, was placed in the crucible (Figure 4) and heated to 750 °C–760 °C. This temperature value was chosen to allow a sufficient superheat. As according to literature data, the melting point of the alloys studied was below or near 700 °C. Subsequently, the furnace was switched off, and the cooling curve with a rate of approx. 4.5 °C/min was recorded.
3. Results and Discussions
3.1. DTA Experimental Results
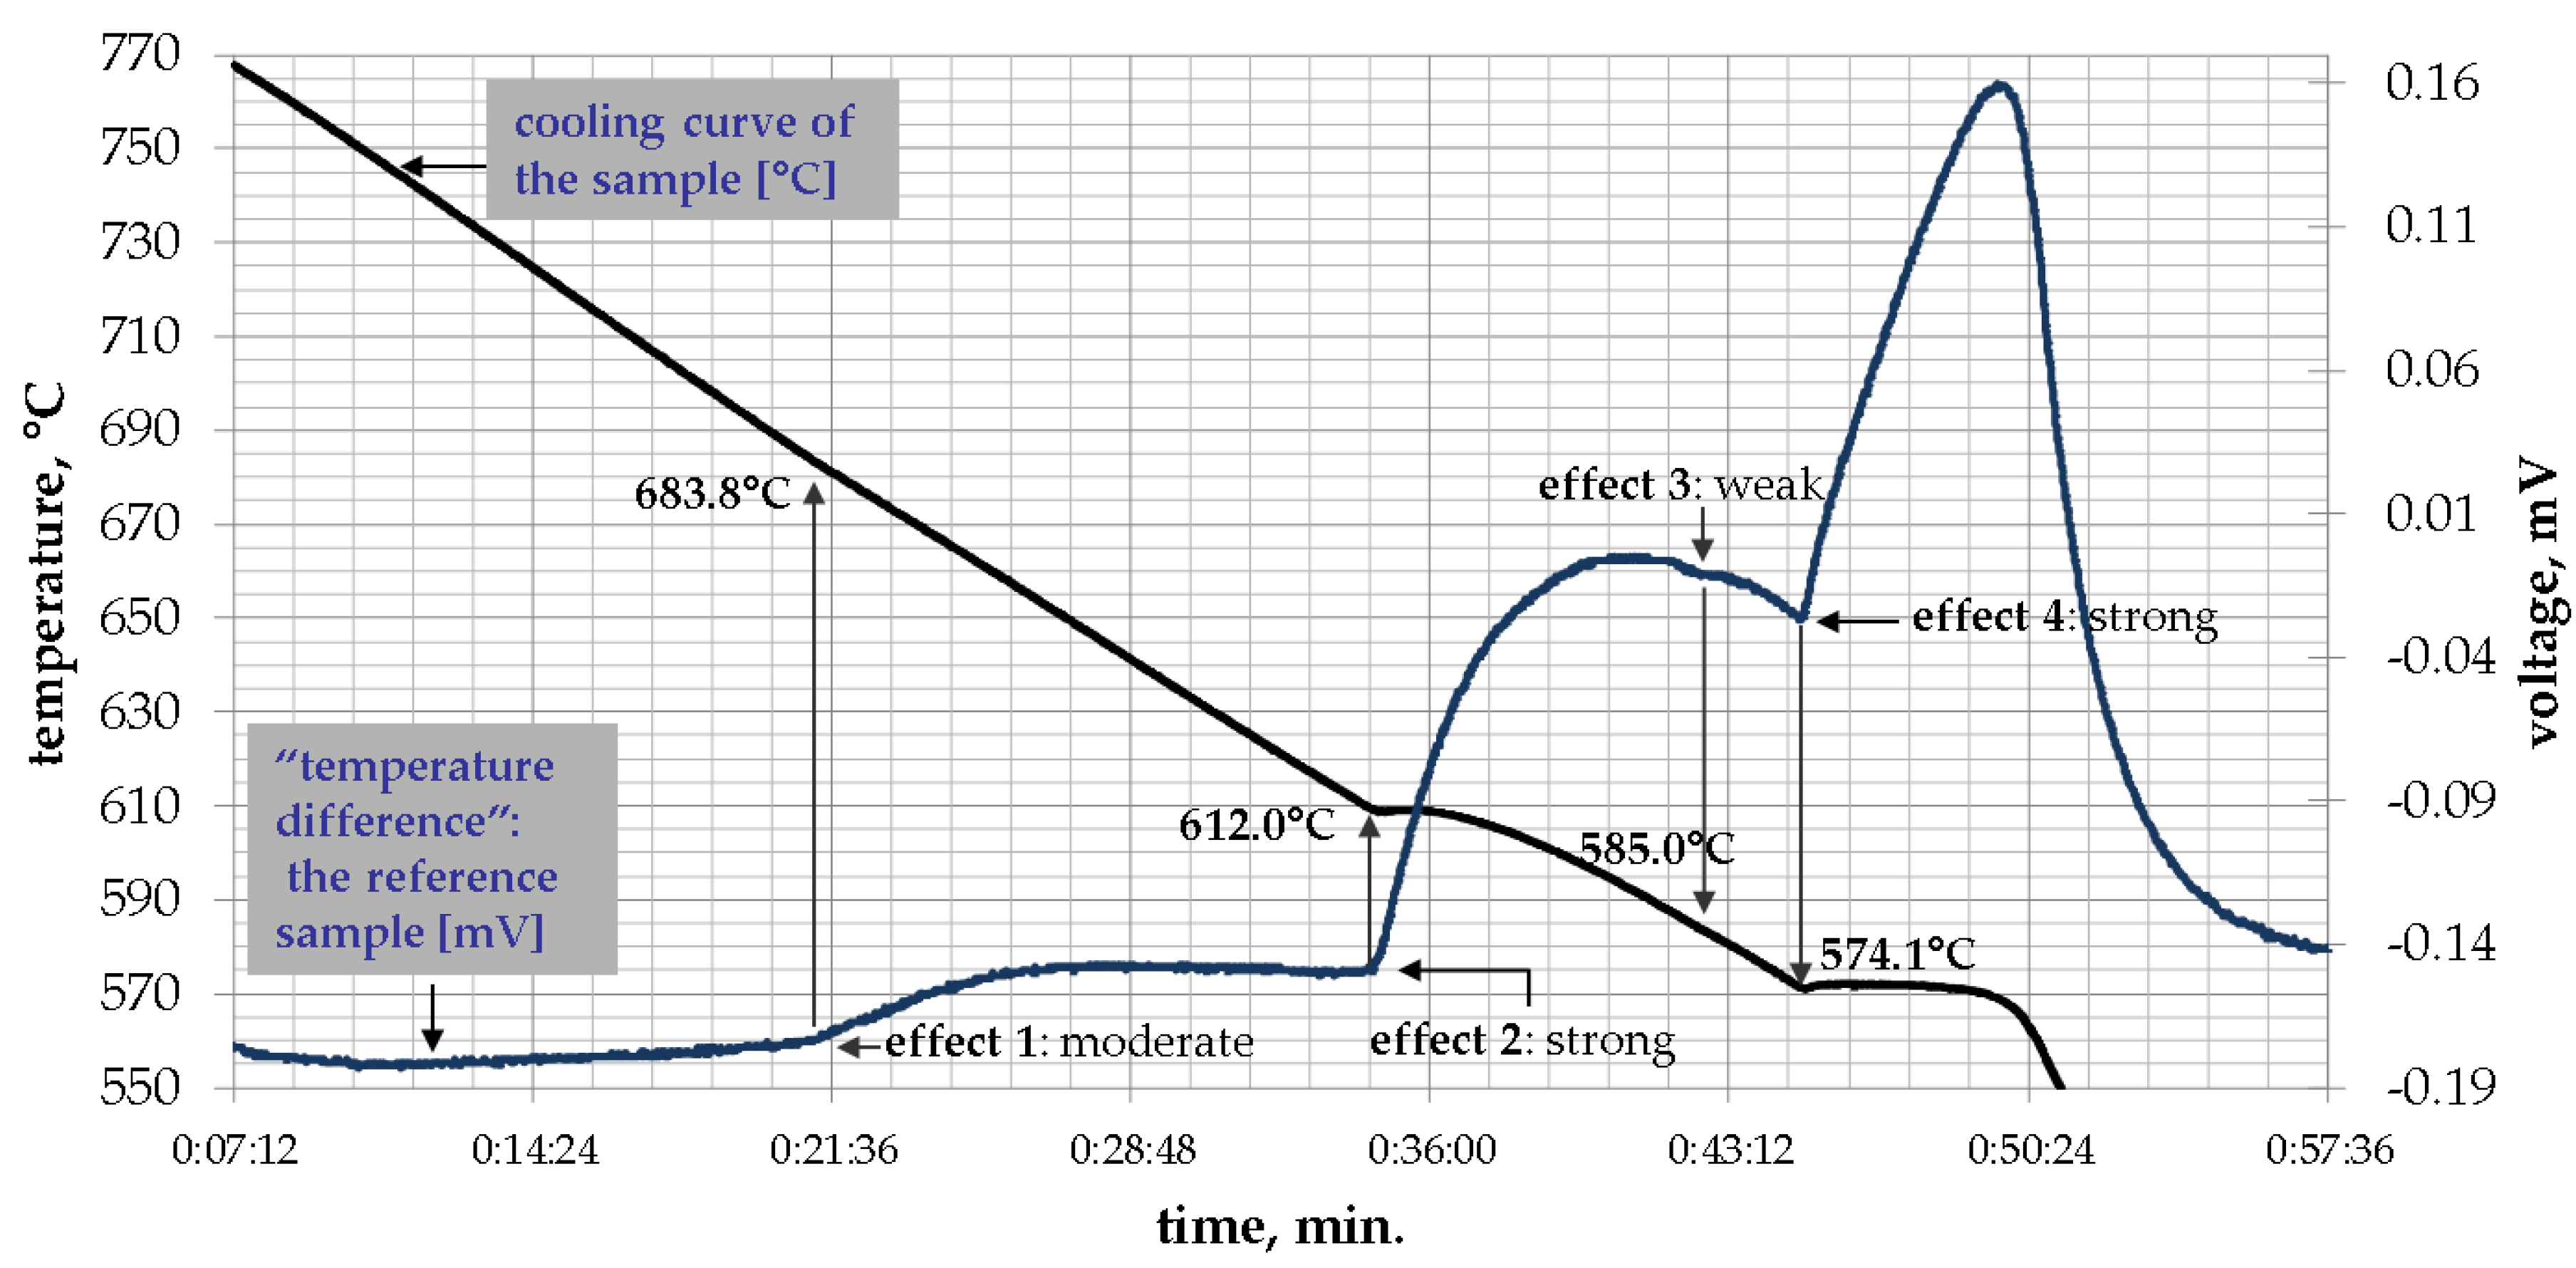
Figure 5 illustrates a cooling curve example for the alloy AlSi8Fe2.0Mn1.0 from isopleth AlSi8Fe2.0–Mn. Two curves are indicated: one for the sample alloy and one for the reference (Al2O3). The curve of the sample demonstrates two significant effects, whereas the reference curve shows four. This is because of the special bonding of the thermocouples (Figure 4), whereby the reference material becomes very sensitive and can detect changes with lower evolutions of heat, e.g., at the liquidus temperature. Therefore, it was presumed that four phase changes occurred in this alloy. Exemplary DTA results are shown in Table 4 for the isopleths AlSi8Fe0.5-Mn, AlSi8Fe1-Mn, AlSi8Fe1.5-Mn, and AlSi8Fe2.0-Mn; all data are published in reference [17]. After recording and evaluating all cooling curves, the temperature–composition diagrams were created for these isopleths.
3.2. Precipitated Phases
Figure 6 shows exemplary SEM examination patterns of the alloys AlSi8Fe2Mn0.5(a) and AlSi8Fe2Mn1.0(b) performed by GfE (Gemeinschaftslabor für Electronenmikroskopie) RWTH (Rheinisch-Westfälische Technische Hochschule) Aachen University. The dark grey crystals are eutectic silicon precipitations. White needle-like precipitations indicate the ternary phase Al5FeSi. The groups of white net-forming precipitations (also known as Chinese script) are clusters of the quaternary phase Al(FeMn)Si. These descriptions of phase shapes were previously accepted, as in references [18,19]. The composition of the precipitations was determined by EDX analysis.
According to the EDX microanalysis of the investigated alloys, the compositions of the phases precipitated were determined and are shown in Table 5. The appearance of the above-mentioned phases depended on their composition, and the extent varied with the Mn content of the alloy, especially for the precipitation of the Al(FeMn)Si phase. Mn content in the quaternary phase increased from 8.42 to 15.68 wt. %, and Fe content decreased from 18.64 to 12.57 wt. %, correspondingly (Figure 7).
The ternary Al5FeSi disappeared after a specific Mn content was reached in the alloy, and the formation of Al16(FeMn)4Si3 was not as clearly determined as reported by A. Zakharov [12]. This was caused by the fact that the Mn content of our Al(FeMn)Si phases changed with the Mn content of the alloys. On the other hand, the diagram version proposed by L. Mondolfo [17] cannot be accepted as fundamental information for drawing the isopleths because of Al5FeSi disappearance (see above). Since phase compositions are significantly influenced by the crystallization conditions, the deviations in the Mn content of the Al(FeMn)Si phases, in comparison to A. Zakharov’s study, must be considered in consequence of different crystallization conditions.
3.3. Developing Isopleths from DTA and Phase Analysis Results
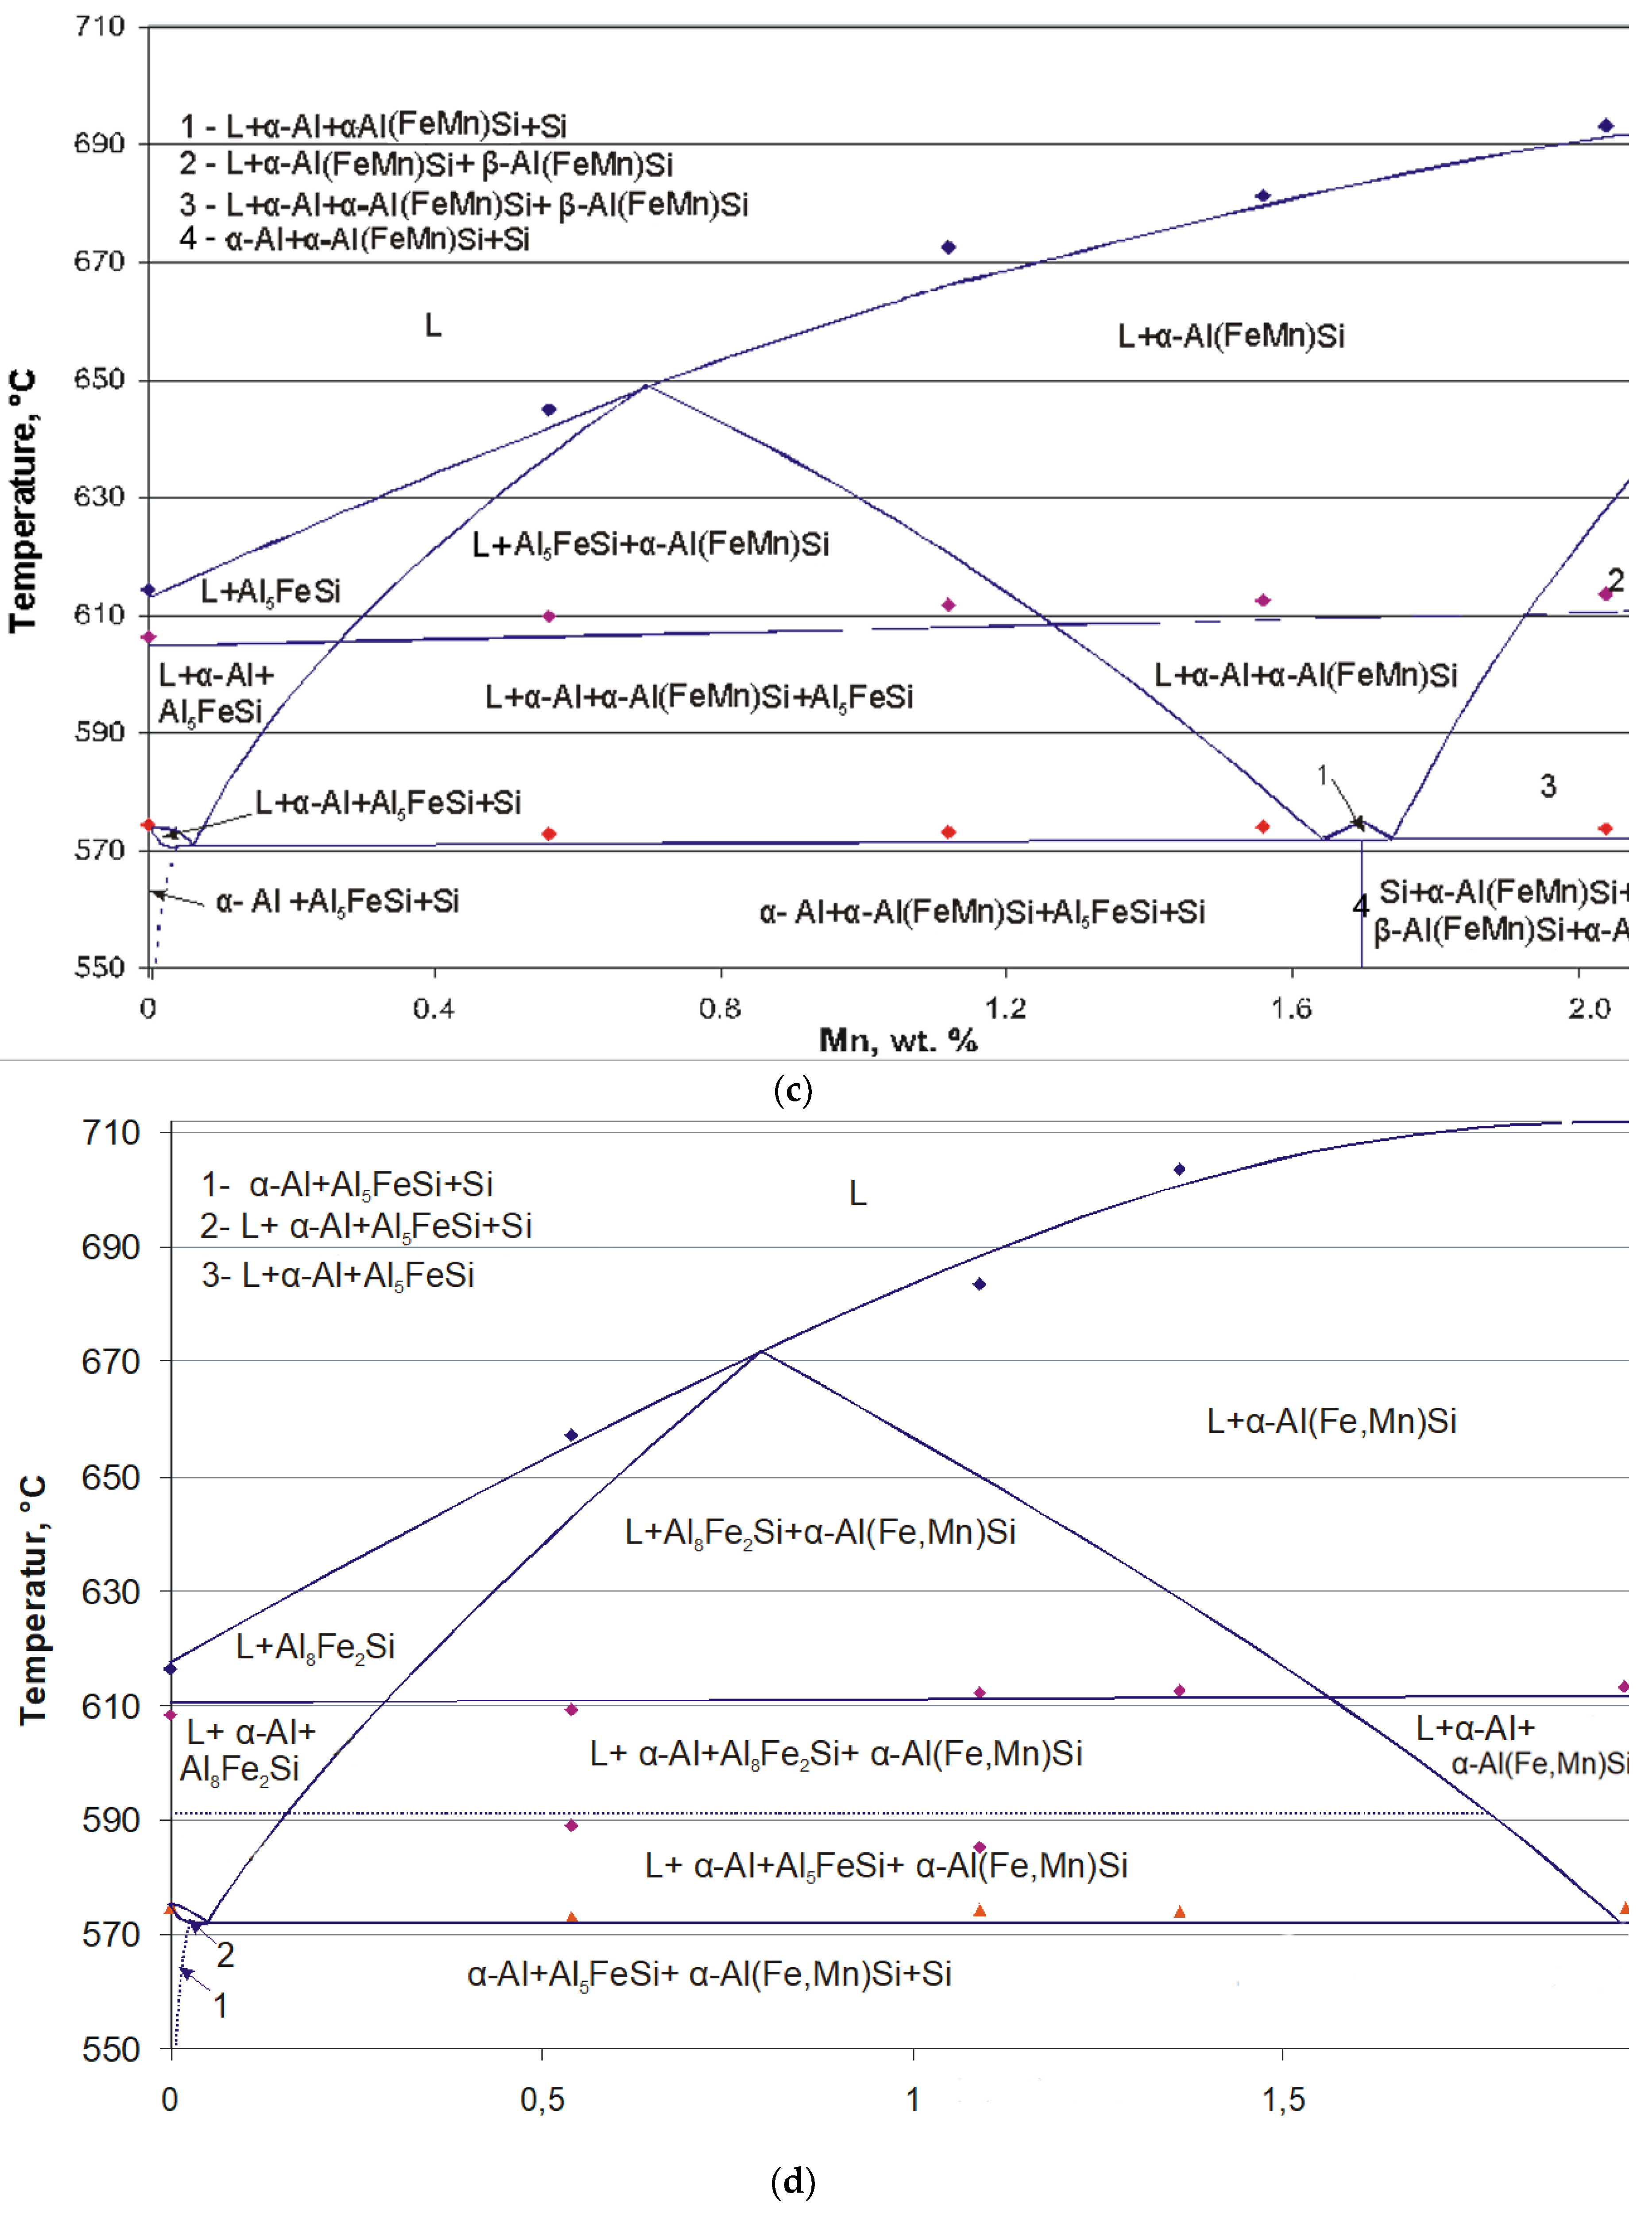
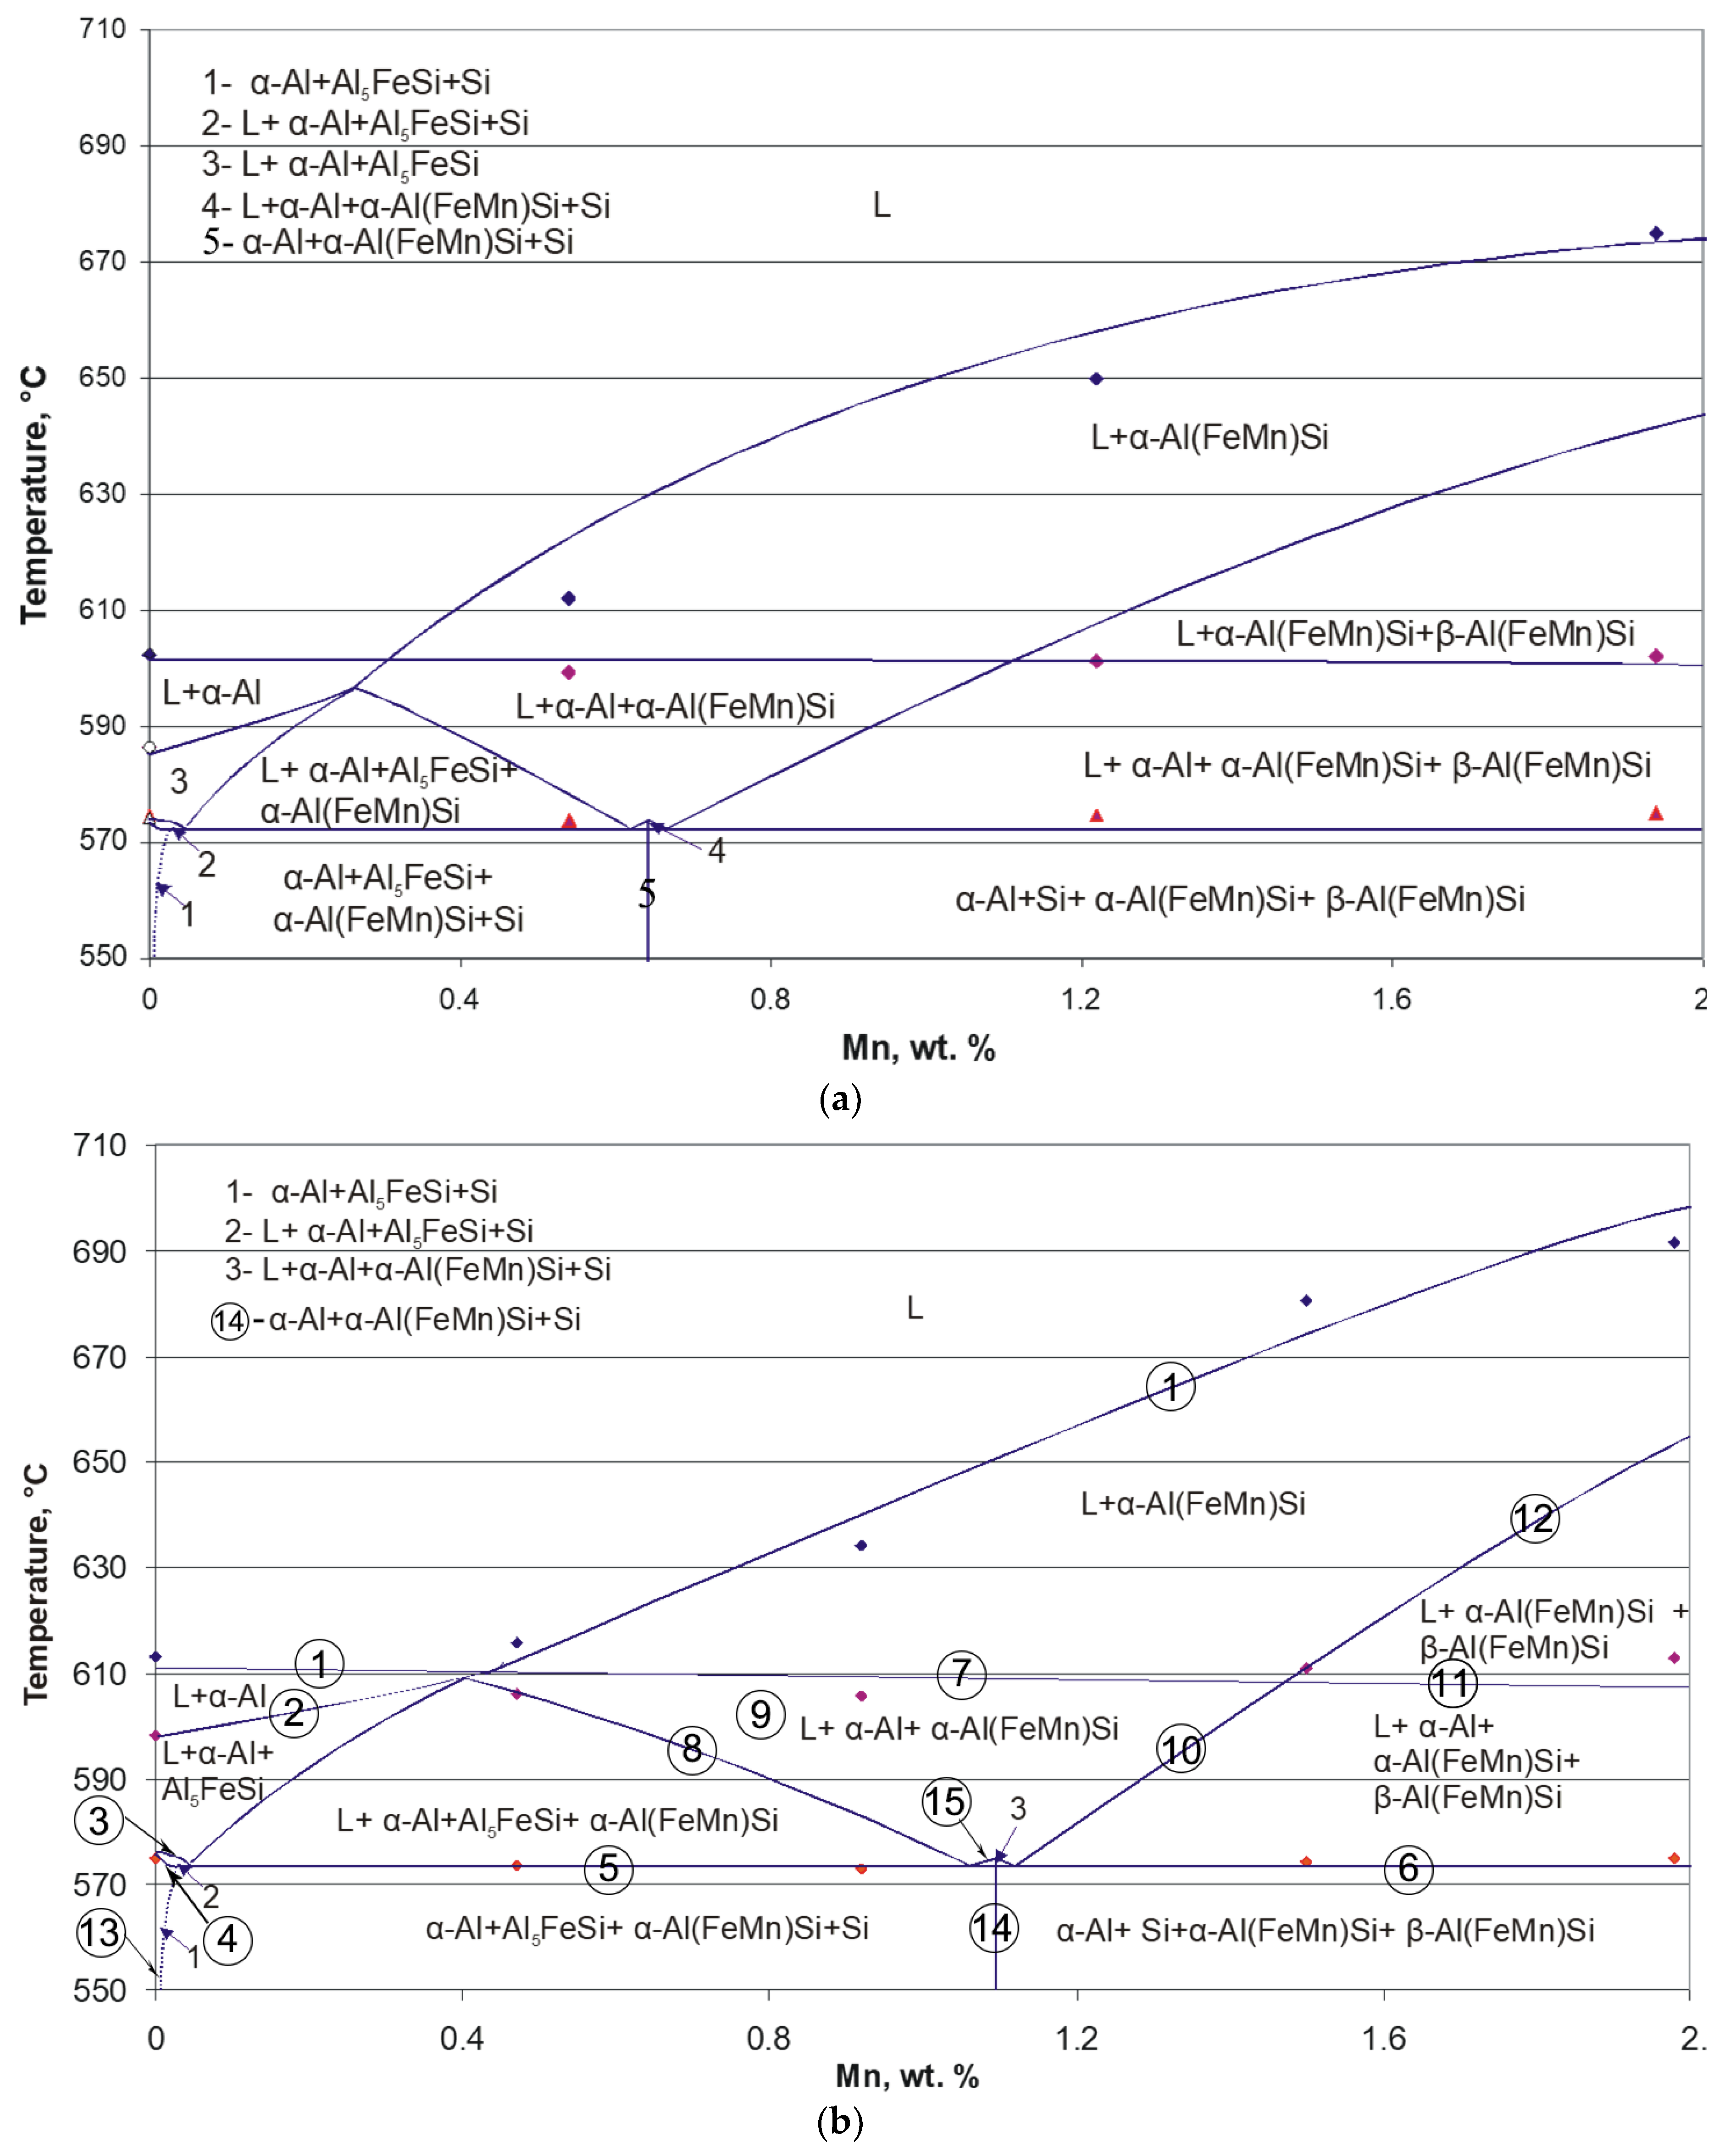
Based on the DTA and SEM results, 12 isopleths were drawn (according to Table 4). All isopleths are published in reference [17]. As examples, four isopleths AlSi8Fe–Mn are shown in Figure 8a–d.
The construction of isopleths was based on the following theory as well as on rules of phase boundary drawing:
- (1)
- The quaternary Al(FeMn)Si are differentiated by the Mn/Fe ratio into α-Al(FeMn)Si if Mn/Fe ≤ 1.1 and β-Al(FeMn)Si if Mn/Fe > 1.1. These three systems are formed depending on the Mn/Fe ratio of the alloy: if Mn/Fe < 1.1, after crystallization, the alloys consist of Al–α-Al(FeMn)Si–Si–Al5FeSi; if Mn/Fe > 1.1, the alloys consist of Al–α-Al(FeMn)Si–Si–β-Al(FeMn)Si; if Mn/Fe = 1.1, only Al–α-Al(FeMn)Si–Si coexist [12].
- (2)
- Crossing the tilted phase boundary line leads to exhaust or precipitation of one phase, whereas passing through the horizontal phase boundary line, where eutectic or peritetic reactions occur, causes exhaust of one phase and precipitation of one phase, respectively. Crossing a point-phase boundary results in either exhaust (precipitation) of two phases or exhaust of one phase and precipitation of the other [20].
In the case of AlSi8Fe1–Mn, α-Al or α-Al(FeMn)Si precipitated primarily, and the liquidus line (marked by ① in Figure 8b) was drawn by fitting the data of the primary precipitation temperature. At the AlSi8Fe1 side, ②, ③, ④ phase boundaries were extended from corresponding points, which indicates, respectively, precipitation of Al5FeSi, Si, and exhaust of the melt. For Mn content from 0.5 to 2 wt. %, the exhaust of melts were caused by two four-phase eutectic reactions:
- (1)
- L + α-Al + α-Al(FeMn)Si + Al5FeSi = α-Al + α-Al(FeMn)Si + Si + Al5FeSi and
- (2)
- L + α-Al + α-Al(FeMn)Si + β-Al(FeMn)Si = α-Al + α-Al(FeMn)Si + Si + β-Al(FeMn)Si
Depending on these reactions, ⑤, ⑥ phase boundaries were drawn. At nearly 610 °C, ⑦, ⑧ phase boundaries were drawn because of not only the DTA results, but also of the fact that a three-phase area should occur between of a two-phase area and a four-phase area. For Mn content of 1.0, it was assumed that the precipitation of α-Al(FeMn)Si would lead to a decrease of Mn concentration in the melt, and therefore α-Al was assumed to precipitate prior to that of Al5FeSi, according to which the phase composition area ⑨ was determined. Lastly, according to rules of phase boundary drawing, ⑩–⑮ phase boundaries were added in the diagram for a complete isopleth.
It is worth noting that in the case of Al Si8Fe1.5–Mn isopleth, ternary phase Al5FeSi or quaternary α-Al(FeMn)Si precipitated primarily, whereas in the case of AlSi8Fe2-Mn isopleth, ternary phase Al8Fe2Si or quaternary α-Al(FeMn)Si precipitated primarily.
In AlSi8Fe2-Mn isopleth, one more phase change occurred before the eutectic equilibrium: L + α-Al + Al8Fe2Si + α-Al(FeMn)Si = L + α-Al + Al5FeSi + α-Al(FeMn)Si (shown as a dotted horizontal line at 591 °C in Figure 8d). Therefore, the ternary Al8Fe2Si was absent in the microstructure of solid alloys.
Serving as a reliable reference for deriving temperature ranges of intermetallic stability in a small continuous range, these isopleths can open part of a process window for the removal of iron from the melt through separation of Fe-enriched intermetallic compounds. For instance, in a melt with 2 wt. % Fe and 1 wt. % Mn (Figure 8d, isopleth AlSi8Fe2.0–Mn), the precipitation of α-Al(FeMn)Si can be controlled by defining the temperature in an interval of 684 °C–643 °C, which could be employed for Fe removal. If the melt is treated in the temperature range of 643 °C–610 °C, the precipitation and segregation of two iron-containing phases, Al8Fe2Si and α-Al(FeMn)Si, can be expected. Below 610 °C, α-Al, α-Al(FeMn)Si, Al8Fe2Si, and Al5FeSi will, respectively, crystallize from the melt. However, with a decreasing temperature, the viscosity of the melt increases rapidly because of a more abundant solid/liquid fraction, which makes phases separation difficult.
4. Conclusions
Alloys of the system Al–Si–Fe–Mn were investigated in the concentration range of 6 to 10 Si wt. %, 0.5 to 2.0 Fe wt. %, and 0 to 2.0 Mn wt. % by DTA and SEM analyses. Intermetallics precipitated during solidification in the form of the ternary Al8Fe2Si, Al5FeSi, quaternary Al(FeMn)Si, and Si. With a decreasing temperature, a series of peritectic reactions took place in the melt. Crystallization of the alloys resulted in two four-phase eutectic reactions:
- (1)
- L + α-Al + α-Al(FeMn)Si + Al5FeSi = α-Al + α-Al(FeMn)Si + Si + Al5FeSi;
- (2)
- L + α-Al + α-Al(FeMn)Si + β-Al(FeMn)Si = α-Al + α-Al(FeMn)Si + Si + β-Al(FeMn)Si.
In the range of the investigated alloys, solid alloy consisted of α-Al–α-Al(FeMn)Si–Si–Al5FeSi after crystallization if Mn/Fe < 1.1, of α-Al–α-Al(FeMn)Si–Si–β-Al(FeMn)Si if Mn/Fe > 1.1, and of α-Al–α-Al(FeMn)Si–Si if Mn/Fe = 1.1.
Based on the results and following the rules of phase boundary drawing, isopleths were constructed. It can be inferred from these isopleths that at low Mn content, the melt precipitates primarily the low Fe-containing intermetallics Al5FeSi or Al8Fe2Si. With the rise of Mn content in the melt, quaternary α-Al(FeMn)Si phase becomes the primary phase, thus a better refining effect can be expected.
The isopleths can serve as an informative reference for the purification of secondary recycling aluminium through the precipitation route from an industrial point of view. An initial idea concerning the process design includes: (1) Composition setting by addition of Mn in the melt, (2) Fe-enriched phase precipitation controlling by holding the melt at a specified temperature, and (3) Precipitated phase physical separation by filtration.
The real quantity of precipitated α-Al(FeMn)Si or β-Al(FeMn)Si and Al5FeSi in the melt at different temperatures is a matter of experimental investigation, which will be presented in future publications.
Author Contributions
A.A. conceptualized the work. B.F. was the principal investigator and supervisor. M.G. performed the experiments. A.A. and M.G. analyzed the data. M.G. wrote and edited the manuscript. C.L. revised the manuscript.
Funding
This research was funded by The DFG (Deutsche Forschungsgemeinschaft)–German Research Society project “Refining of Al–Si melts” FR 1713/5-1.
Acknowledgments
The DFG–German Research Society is greatly appreciated for the support of the project “Refining of Al–Si melts” FR 1713/5-1.
Conflicts of Interest
The authors declare no conflict of interest.
References
- Ostermann, F. Anwendungstechnologie Aluminium, 1st ed.; Springer-Verlag: Berlin/Heidelberg, Germany; New York, NY, USA, 1998; p. 18. ISBN 978-3-662-05788-9. [Google Scholar]
- Liste der Aluminiumgusslegierungen; Angaben von VAR Verband der Aluminiumrecyclingindustrie e.V.: Düsseldorf, Germany, 2004.
- Gao, J.; Shu, D.; Wang, J.; Sun, B. Effects of Na2B4O7 on the elimination of iron from aluminum melt. Scr. Mater. 2007, 57, 197–200. [Google Scholar] [CrossRef]
- Mohanty, B.P.; Subramnian, S.; Hajra, J.P. Electroslag refining of commercial aluminium. (Retroactive coverage). Trans. Indian Inst. Met. 1996, 39, 646–651. [Google Scholar]
- Zhang, J.; Sun, B.; He, B.; Mao, H.; Chen, G.; Ge, A. Principle and control of new-style purification equipment of 5 N high purity aluminum. Chin. J. Mech. Eng. 2006, 42, 64–68. [Google Scholar] [CrossRef]
- Zhao, H.; Lu, H. The development of 85kA three-layer electrolysis cell for refining of aluminium. TMS Light Metals. 2008, 533–535. [Google Scholar]
- Van Der Donk, H.M.; Nijhof, G.H.; Castelijns, C.A.M. The removal of iron from molten aluminum. In Proceedings of the Third International Symposium: Recycling of Metals, and Engineered Materials, Point Clear, AL, USA, 12–15 November 1995; pp. 651–661. [Google Scholar]
- De Moraes, H.L.; De Oliveira, J.R.; Espinosa, D.C.R.; Tenorio, J.A.S. Removal of iron from molten recycled aluminum through intermediate phase filtration. Mater. Trans. 2006, 47, 1731–1736. [Google Scholar] [CrossRef]
- Matsubara, H.; Izawa, N.; Nakanishi, M. Macroscopic segregation in Al-11 mass% Si alloy containing 2 mass% Fe solidified under centrifugal force. J. Jpn. Inst. Light Met. 1998, 48, 93–97. [Google Scholar] [CrossRef]
- Mondolfo, L.F. Aluminium Alloys: Structure and Properties, 1st ed.; Butterworths: London, UK; Boston, MA, USA, 1976; pp. 282–289, 534–536, 529–530, 661–663. ISBN 0408706805. [Google Scholar]
- Petzow, G.; Effenberg, G. Ternary Alloys, 1st ed.; VCH Publishers: New York, NY, USA, 1992; Volume 5, pp. 250–264, 394–438. ISBN 0895738953. [Google Scholar]
- Zakharov, A.M.; Gul’din, I.T.; Arnol’d, A.A.; Matsenko, Y.A. Phase Equlibria in the Al-Si-Fe-Mn System in the 10–14%Si, 0–3%Fe and 0–4%Mn Concentration Ranges. Izvest Vyssh Uchebn Zaved Tsvetn Metall. 1988, 4, 89–94. [Google Scholar]
- DIN EN 1706:1998-06. Available online: https://www.beuth.de/en/standard/din-en-1706/3359595 (accessed on 19 August 2018).
- Villars, P.; Prince, A.; Okamoto, H. Handbook of Ternary Alloy Phase Diagramms, 1st ed.; ASM International: Geauga Country, OH, USA, 1995; Volume 3, pp. 3501–3514, 3597–3621. ISBN 0871705257. [Google Scholar]
- Belov, N.A.; Eskin, D.G.; Aksenov, A.A. Multicomponent Phase Diagrams: Applications for Commercial Aluminium Alloys, 1st ed.; ELSEVIER Ltd.: Oxford, UK, 2005; pp. 1–19. ISBN 0080445373. [Google Scholar]
- Rhines, F.N. Phase Diagrams in Metallurgy, Their Development and Application, 1st ed.; McGraw-Hill Book Company Inc.: New York, NY, USA, 1956; pp. 186, 197, 220–229, 290–302. ISBN 0070520704. [Google Scholar]
- Gnatko, M. Untersuchungen zur Entfernung von Eisen aus Verunreinigten Aluminiumgusslegierungen Durch Intermetallische Fällung. Ph.D. Thesis, RWTH Aachen University, Aachen, Germany, 19 May 2008. [Google Scholar]
- Hanemann, H.; Schrader, A. Ternäre Legierungen des Aluminiums, Atlas Metallographicus, 1st ed.; Band III, Teil 2; Verlag Stahleisen GmbH: Düsseldorf, Germany, 1952; pp. 35–38. [Google Scholar]
- Atlas of Microstructures of Industrial Alloys. In Metals Handbook, 8th ed.; ASM: Metals park, OH, USA, 1961–1972; Volume 7, pp. 256–263.
- Zakharov, A.M. Phase Diagrams of Binary and Ternary Systems, 3rd ed.; Metallurgia: Moskwa, Russia, 1990; pp. 230–239. ISBN 5229005173. [Google Scholar]
Figure 1.
Al–Fe phase diagram calculated with FactSage™.

Figure 2.
Liquidus surface in the Al corner of the Al–Si–Fe system [10].
Figure 2.
Liquidus surface in the Al corner of the Al–Si–Fe system [10].
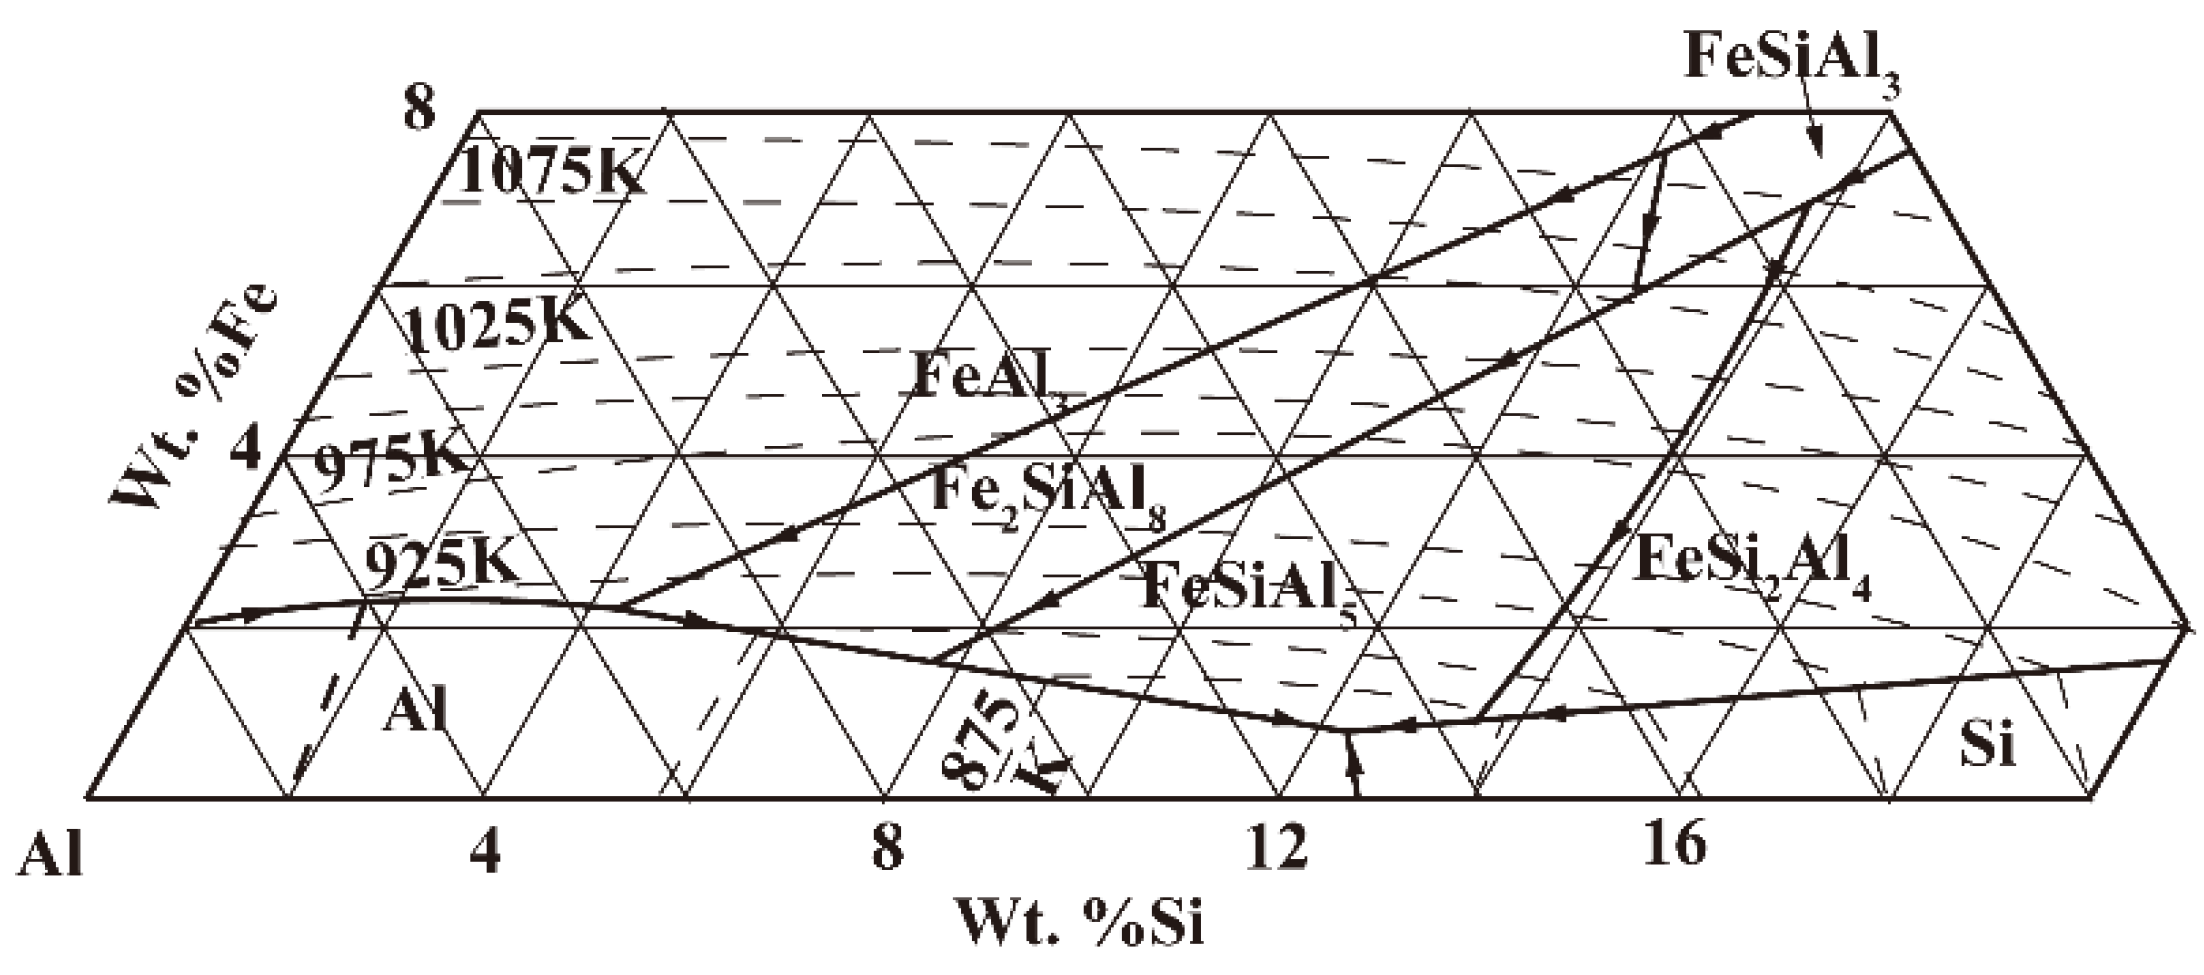
Figure 3.
(a) Temperature–composition space diagram of a ternary system (b) Isopleth through a ternary system [16].
Figure 3.
(a) Temperature–composition space diagram of a ternary system (b) Isopleth through a ternary system [16].
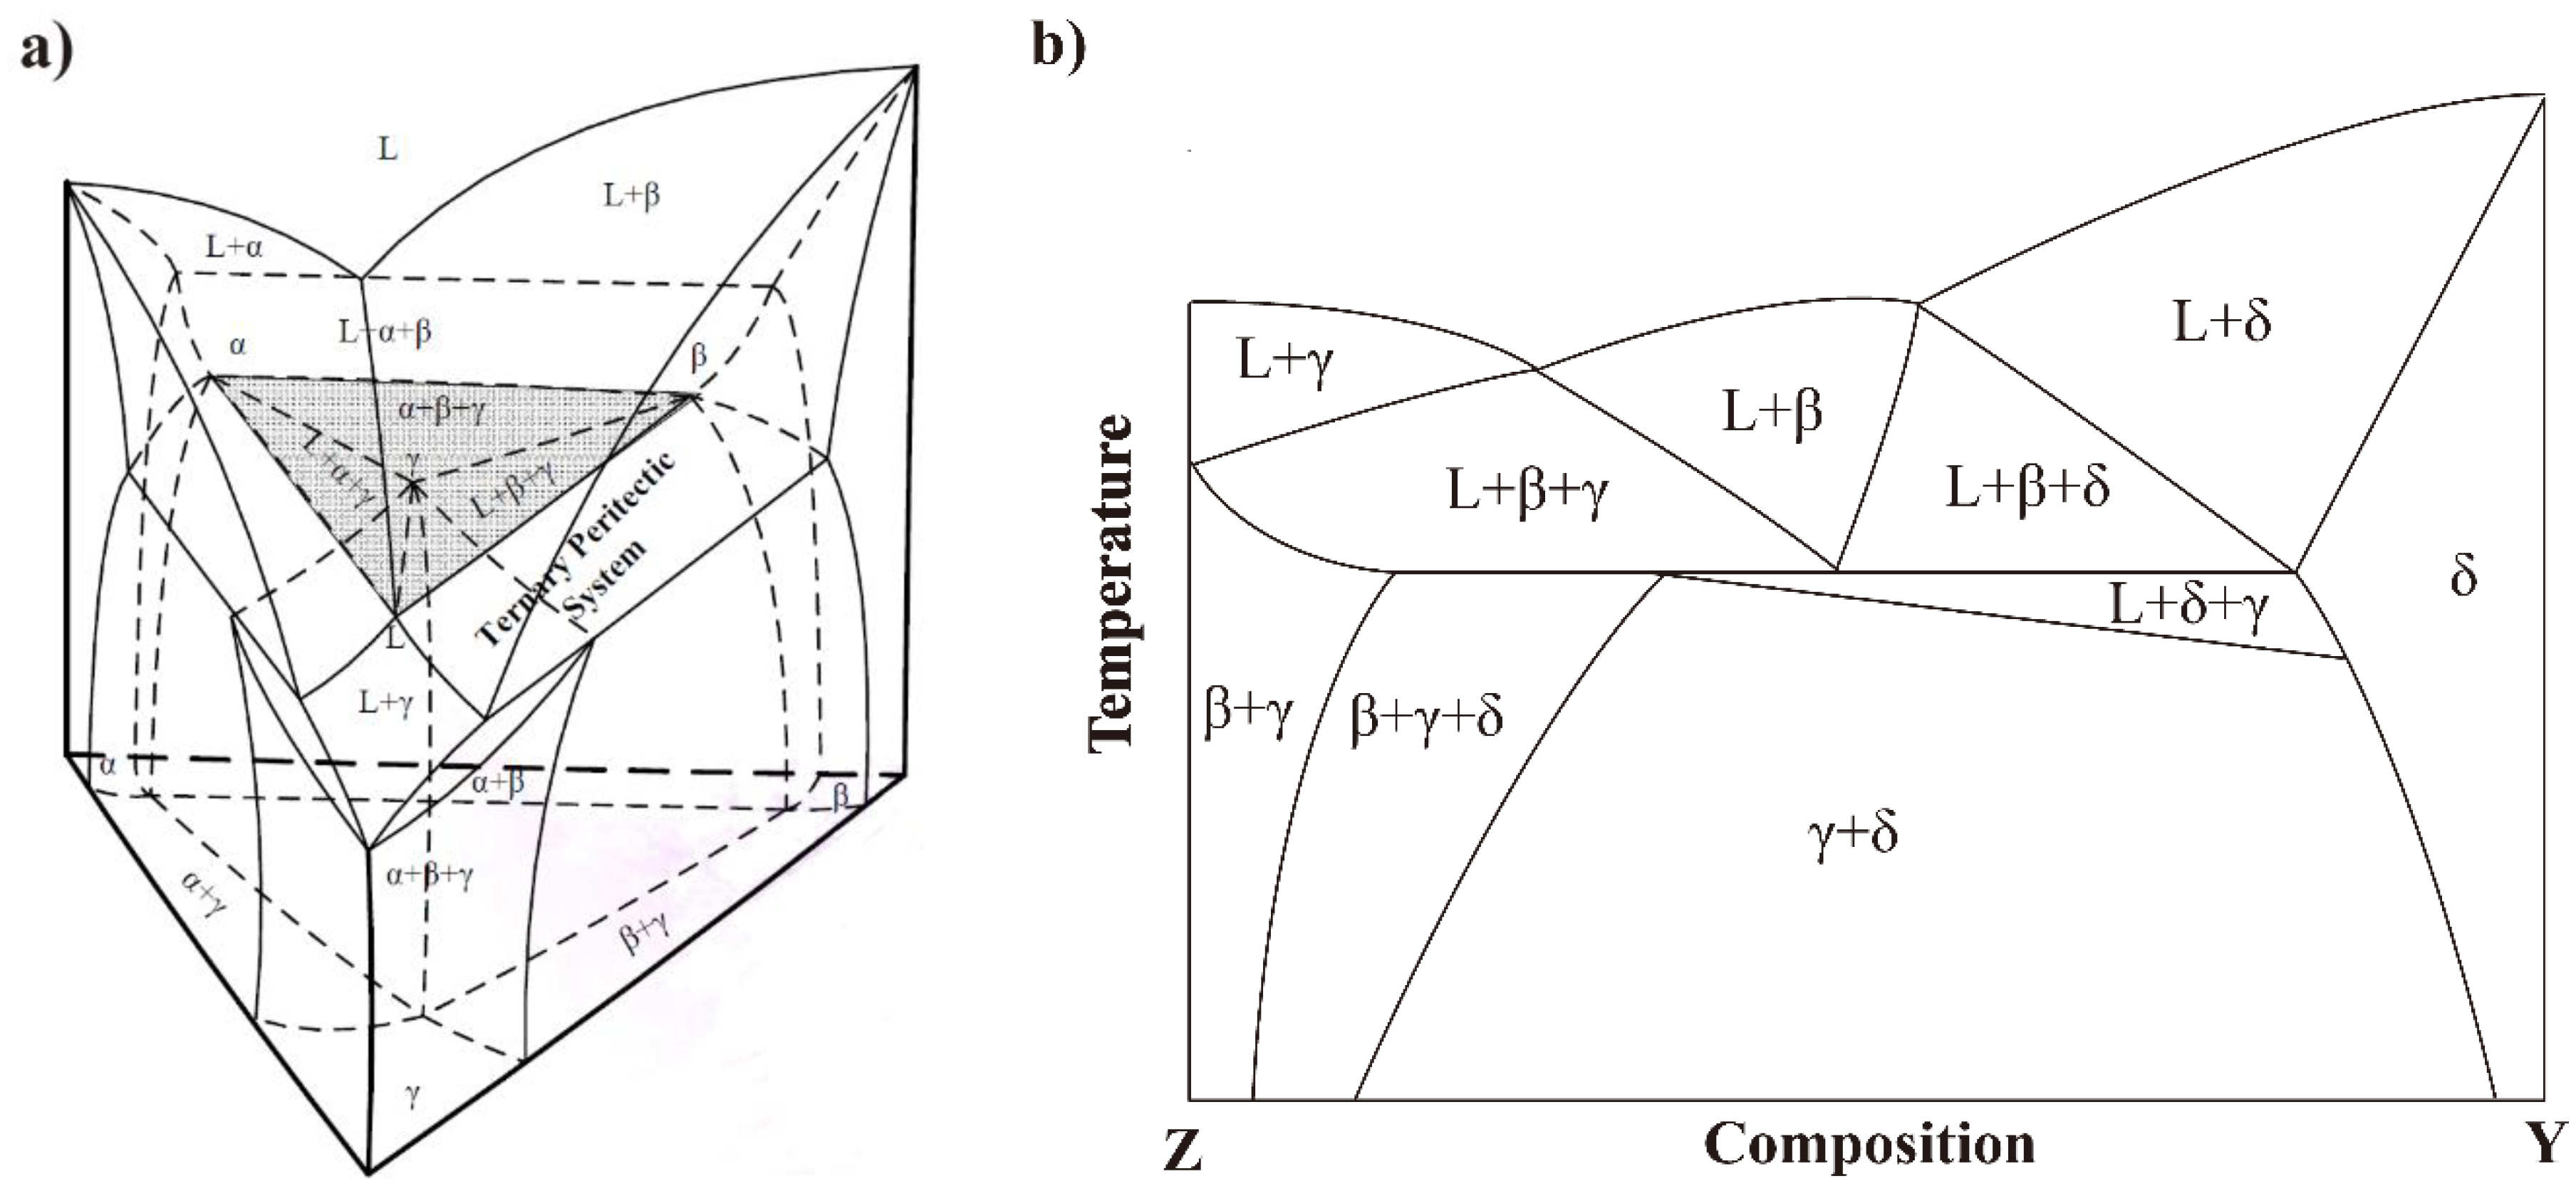
Figure 4.
Equipment for large scale Differential Thermal Analysis (DTA) at IME.
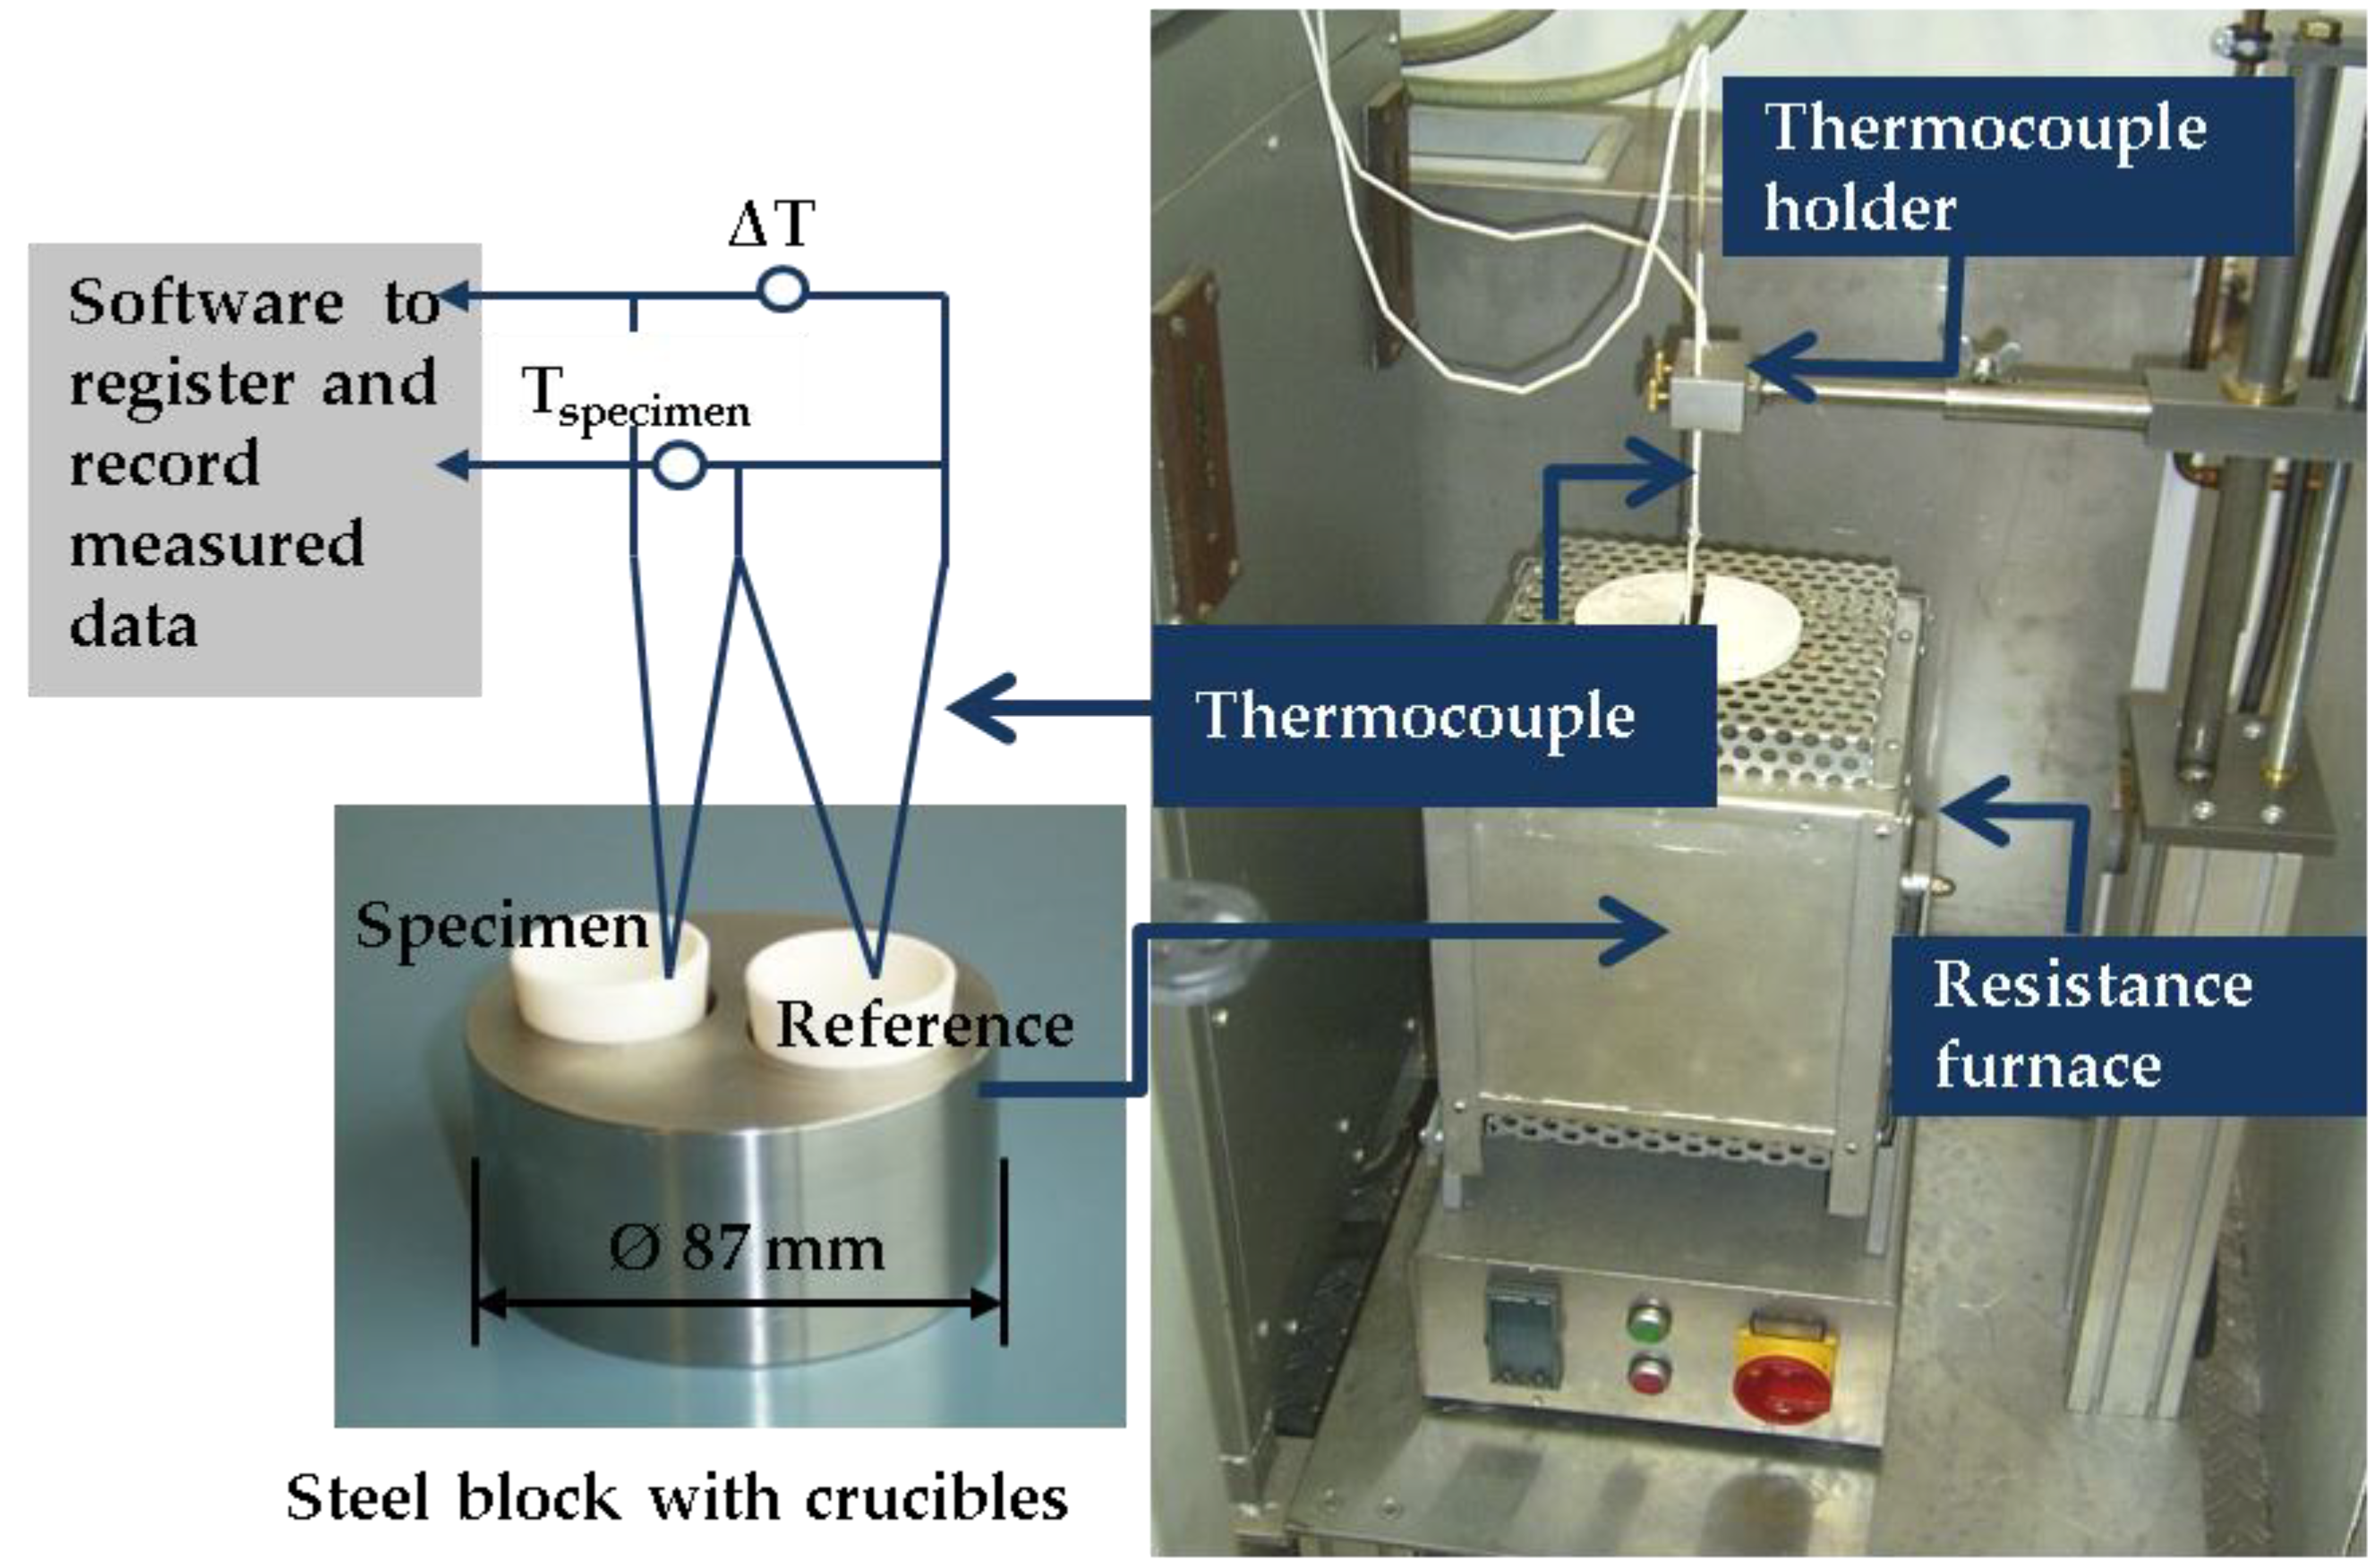
Figure 5.
Cooling curve of the alloy AlSi8Fe2.0Mn1.0 from isopleth AlSi8Fe2–Mn.

Figure 6.
SEM pattern of the microstructure.
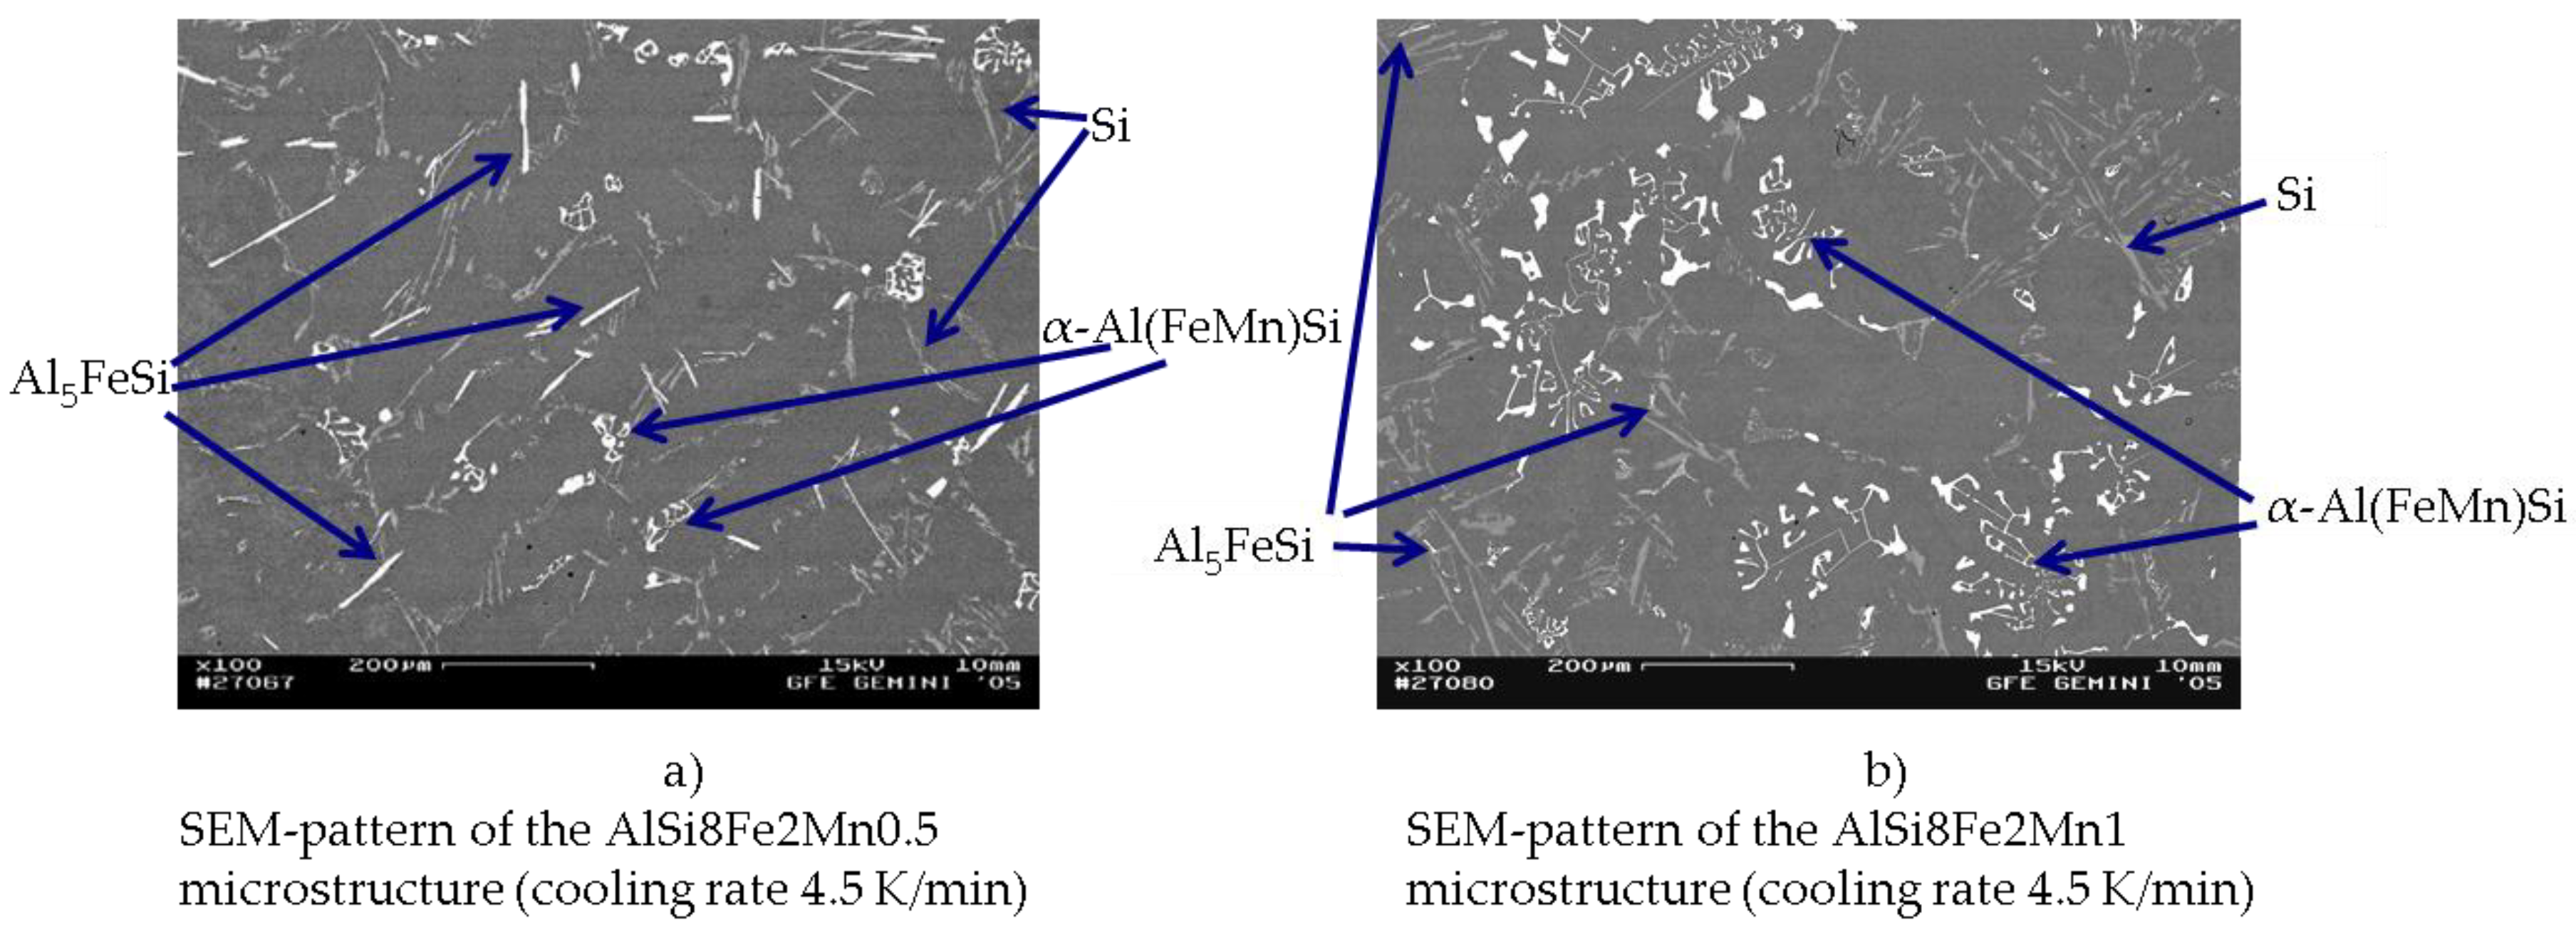
Figure 7.
Composition change in the Al(FeMn)Si phase with increasing Mn content in the alloy group AlSi8Fe1.5–Mn.
Figure 7.
Composition change in the Al(FeMn)Si phase with increasing Mn content in the alloy group AlSi8Fe1.5–Mn.
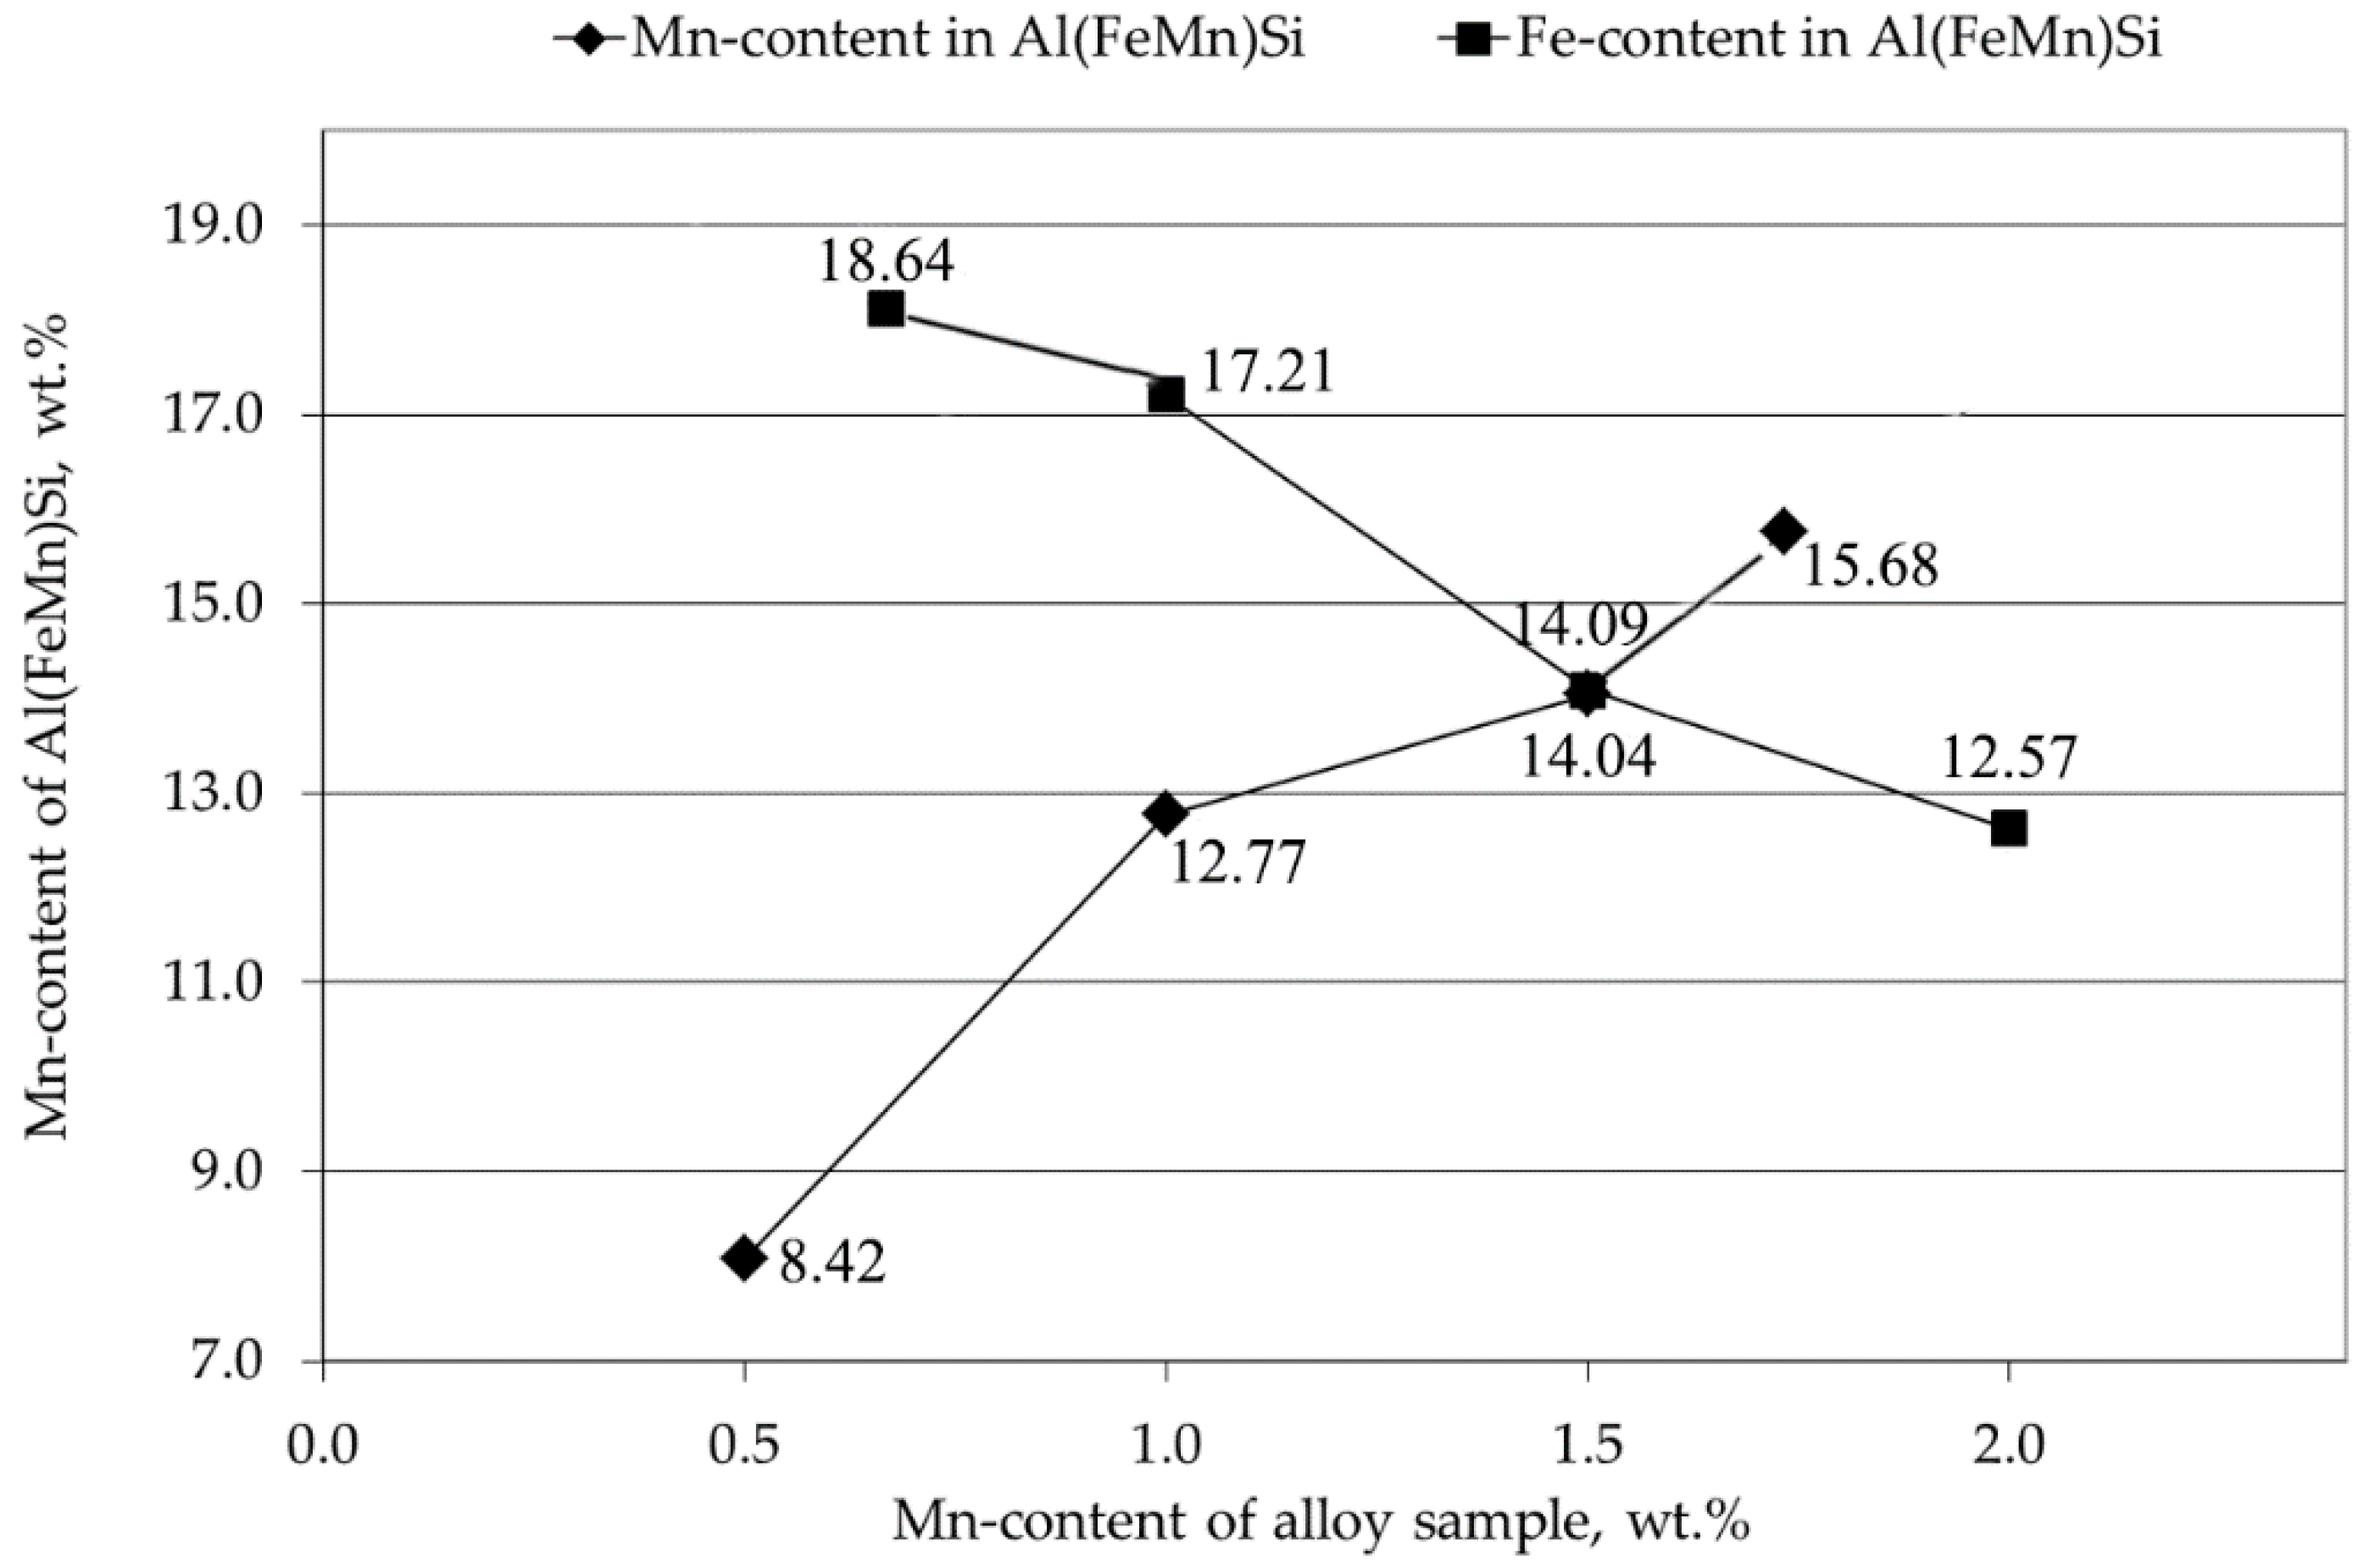
Figure 8.
(a) Isopleth AlSi8Fe0.5–Mn. At 0, 0.5, 1, 1.5, and 2.0 wt. % Mn concentrations, three points were set vertically, according to the DTA results shown in Table 4. (b) Isopleth AlSi8Fe1–Mn. At 0, 0.5, 1, 1.5, and 2.0 wt. % Mn concentrations, three points were set vertically according to the DTA results shown in Table 4. (c) Isopleth AlSi8Fe1.5–Mn. At 0, 0.5, 1, 1.5, and 2.0 wt. % Mn concentrations, three points were set vertically according to the DTA results shown in Table 4. (d) Isopleth AlSi8Fe2–Mn. At 0, 0.5, 1, 1.5, and 2.0 wt. % Mn concentrations, four points were set vertically according to the DTA results shown in Table 4.


| Alloy Identification | Alloy Composition Limits, wt. % | ||||||
|---|---|---|---|---|---|---|---|
| Numerical | Chemical | Si | Fe | Cu | Mn | Mg | Other |
| cast alloys for pressure casting | |||||||
| EN AC-44300 | EN AC-AlSi12(Fe) | 10.5–13.5 | 1.0 | 0.10 | 0.55 | - | 0.55 |
| EN AC-46000 | EN AC-AlSi9Cu3(Fe) | 8.0–11.0 | 1.30 | 2.0–4.0 | 0.55 | 0.05–0.55 | 2.75 |
| cast alloys for common application | |||||||
| EN AC-44200 | EN AC-AlSi12(a) | 10.5–13.5 | 0.55 | 0.05 | 0.35 | - | 0.40 |
| EN AC-46200 | EN AC-AlSi8Cu3 | 7.5–9.5 | 0.8 | 2.0–3.5 | 0.15–0.65 | 0.05–0.55 | 2.45 |
Table 2.
Published data on the expected phases in the Al corner of the Al–Si–Fe–Mn system, data from [10,11,12,14,15].
| Phases | Components, wt. % | |||
|---|---|---|---|---|
| Al | Mn | Fe | Si | |
| Al8Fe2Si | 56.0–62.6 | – | 30.0 | 7.4–11.0 |
| Al5FeSi | 59.4–60.9 | <0,8 | 25.5–26.5 | 12.8–13.3 |
| Al16(FeMn)4Si3 | 53.0–64.6 | 14.6–19.7 | 10.4–15.3 | 10.4–12.0 |
| Al15Mn3Si2 | 58.0–60.3 | 27.7–29.5 | <1.8 | 10.2–10.7 |
| Al4FeSi2 | 46.9–48.0 | <0.8 | 25.9 | 25.3–26.4 |
Table 3.
Groups of investigated alloys leading to the individual isopleth.
| Group | Iron/Manganese Content, wt. % | |||
|---|---|---|---|---|
| Fe/Mn Step 0.5 | Fe/Mn Step 0.5 | Fe/Mn Step 0.5 | Fe/Mn Step 0.5 | |
| AlSi6FeMn | 0.5/0–2 | 1.0/0–2 | 1.5/0–2 | 2.0/0–2 |
| AlSi8FeMn | 0.5/0–2 | 1.0/0–2 | 1.5/0–2 | 2.0/0–2 |
| AlSi10FeMn | 0.5/0–2 | 1.0/0–2 | 1.5/0–2 | 2.0/0–2 |
Table 4.
Results of the evaluation of the cooling curve effects of the alloys from isopleths AlSi8Fe0.5–Mn, AlSi8Fe1–Mn, AlSi8Fe1.5–Mn, and AlSi8Fe2.0–Mn.
Table 4.
Results of the evaluation of the cooling curve effects of the alloys from isopleths AlSi8Fe0.5–Mn, AlSi8Fe1–Mn, AlSi8Fe1.5–Mn, and AlSi8Fe2.0–Mn.
| Alloy | Mn, | Effect 1 | Effect 2 | Effect 3 | Effect 4 |
|---|---|---|---|---|---|
| (Target) | wt. % | T, °C | T, °C | T, °C | T, °C |
| AlSi8Fe0.5 | 0.00 | 602.3 | 586.4 | - | 574.4 |
| AlSi8Fe0.5Mn0.5 | 0.54 | 612.0 | 599.2 | 585.0 | 573.7 |
| AlSi8Fe0.5Mn1.0 | 1.22 | 649.9 | 601.2 | 597.0 | 574.7 |
| AlSi8Fe0.5Mn2.0 | 1.94 | 675.0 | 633.0 | 602.1 | 574.9 |
| AlSi8Fe1.0 | 0.00 | 613.0 | 598.1 | - | 574.9 |
| AlSi8Fe1.0Mn0.5 | 0.47 | 620.7 | 606.0 | 600.0 | 573.5 |
| AlSi8Fe1.0Mn1.0 | 0.92 | 634.2 | 605.7 | 580.0 | 573.0 |
| Al Si8 Fe1.0Mn1.5 | 1.50 | 680.5 | 611.0 | 607.0 | 574.3 |
| Al Si8 Fe1.0Mn2.0 | 1.98 | 691.4 | 640.0 | 612.9 | 574.8 |
| AlSi8Fe1.5 | 0.00 | 614.3 | 606.4 | - | 574.4 |
| AlSi8Fe1.5Mn0.5 | 0.56 | 645.0 | 638.0 | 609.9 | 572.8 |
| AlSi8 Fe1.5Mn1.0 | 1.12 | 672.4 | 614.0 | 611.7 | 573.2 |
| AlSi8Fe1.5Mn1.5 | 1.56 | 681.3 | 612.6 | 576.0 | 574.0 |
| AlSi8Fe1.5Mn2.0 | 2.04 | 693.1 | 630.0 | 613.6 | 573.8 |
| AlSi8Fe2.0 | 0.00 | 616.3 | 608.4 | - | 574.4 |
| AlSi8Fe2.0Mn0.5 | 0.54 | 657.1 | 609.2 | 589.1 | 573.0 |
| AlSi8Fe2.0Mn1.0 | 1.09 | 683.8 | 612.0 | 585.0 | 574.1 |
| AlSi8Fe2.0Mn1.5 | 1.36 | 703.6 | 638.0 | 612.5 | 573.8 |
| AlSi8Fe2.0Mn2.0 | 1.99 | 710.5 | 613.2 | 575.0 | 573.6 |
Table 5.
Composition of detected precipitated phases in all investigated alloys.
| Phase | Components, wt. % | |||
|---|---|---|---|---|
| Al | Mn | Fe | Si | |
| Al matrix | 98.37–99.66 | 0.0–0.45 | 0.0–0.50 | 0.73–2.55 |
| Al5FeSi | 55.02–56.03 | 1.92–2.59 | 23.73–26.21 | 16.86–17.65 |
| α-Al(FeMn)Si | 57.77–61.46 | 8.07–17.39 | 12.62–19.85 | 10.06–13.70 |
| β-Al(FeMn)Si | 56.47–62.58 | 12.63–17.93 | 11.25–13.44 | 10.84–11.34 |
| Si | 0.30–3.50 | - | - | 96.50–99.77 |
© 2018 by the authors. Licensee MDPI, Basel, Switzerland. This article is an open access article distributed under the terms and conditions of the Creative Commons Attribution (CC BY) license (http://creativecommons.org/licenses/by/4.0/).
Share and Cite
MDPI and ACS Style
Gnatko, M.; Li, C.; Arnold, A.; Friedrich, B. Purification of Aluminium Cast Alloy Melts through Precipitation of Fe-Containing Intermetallic Compounds. Metals 2018, 8, 796. https://doi.org/10.3390/met8100796
AMA Style
Gnatko M, Li C, Arnold A, Friedrich B. Purification of Aluminium Cast Alloy Melts through Precipitation of Fe-Containing Intermetallic Compounds. Metals. 2018; 8(10):796. https://doi.org/10.3390/met8100796
Chicago/Turabian StyleGnatko, Marina, Cong Li, Alexander Arnold, and Bernd Friedrich. 2018. "Purification of Aluminium Cast Alloy Melts through Precipitation of Fe-Containing Intermetallic Compounds" Metals 8, no. 10: 796. https://doi.org/10.3390/met8100796
Note that from the first issue of 2016, this journal uses article numbers instead of page numbers. See further details here.