Fatigue Strength Analysis and Fatigue Damage Evaluation of Roller Chain
by
Ryoichi Saito
1,*, 
Nao-Aki Noda
2,
Yoshikazu Sano
2,
Jian Song
2,
Takeru Minami
2,
Yuuka Birou
2,
Arata Miyagi
2 and
Yinsa Huang
2 1
Senqcia Corporation Kanto Works, 5110 Mikajiri Kumagaya-shi, Saitama-ken 360-0843, Japan
2
Mechanical Engineering Department, Kyushu Institute of Technology, 1-1 Sensuicho, Tobata-ku, Kitakyushu-shi 804-8550, Japan
*
Author to whom correspondence should be addressed.
Metals 2018, 8(10), 847; https://doi.org/10.3390/met8100847
Submission received: 29 September 2018
/
Revised: 13 October 2018
/
Accepted: 16 October 2018
/
Published: 18 October 2018
(This article belongs to the Special Issue Wear and Fracture of Steel Manufacturing Apparatus and Tools)
Abstract
:This paper deals with the roller chain commonly used for transmission of mechanical power on many kinds of industrial machinery, including conveyors, cars, motorcycles, bicycles, and so forth. It consists of a series of four components called a pin, a bush, a plate, and a roller, which are driven by a sprocket. To clarify the fatigue damage, in this paper, the finite element method (FEM) is applied to those components under three different types of states, that is, the press-fitting state, the static tensile state, and the sprocket-engaging state. By comparing those states, the stress amplitude and the average stress of each component are calculated and plotted on the fatigue limit diagram. The effect of the plastic zone on the fatigue strength is also discussed. The results show that the fatigue crack initiation may start around the middle inner surface of the bush. As am example, the FEM results show that the fatigue crack of the inner plate may start from a certain point at the hole edge. The results agree with the actual fractured position in roller chains used in industry.
1. Introduction
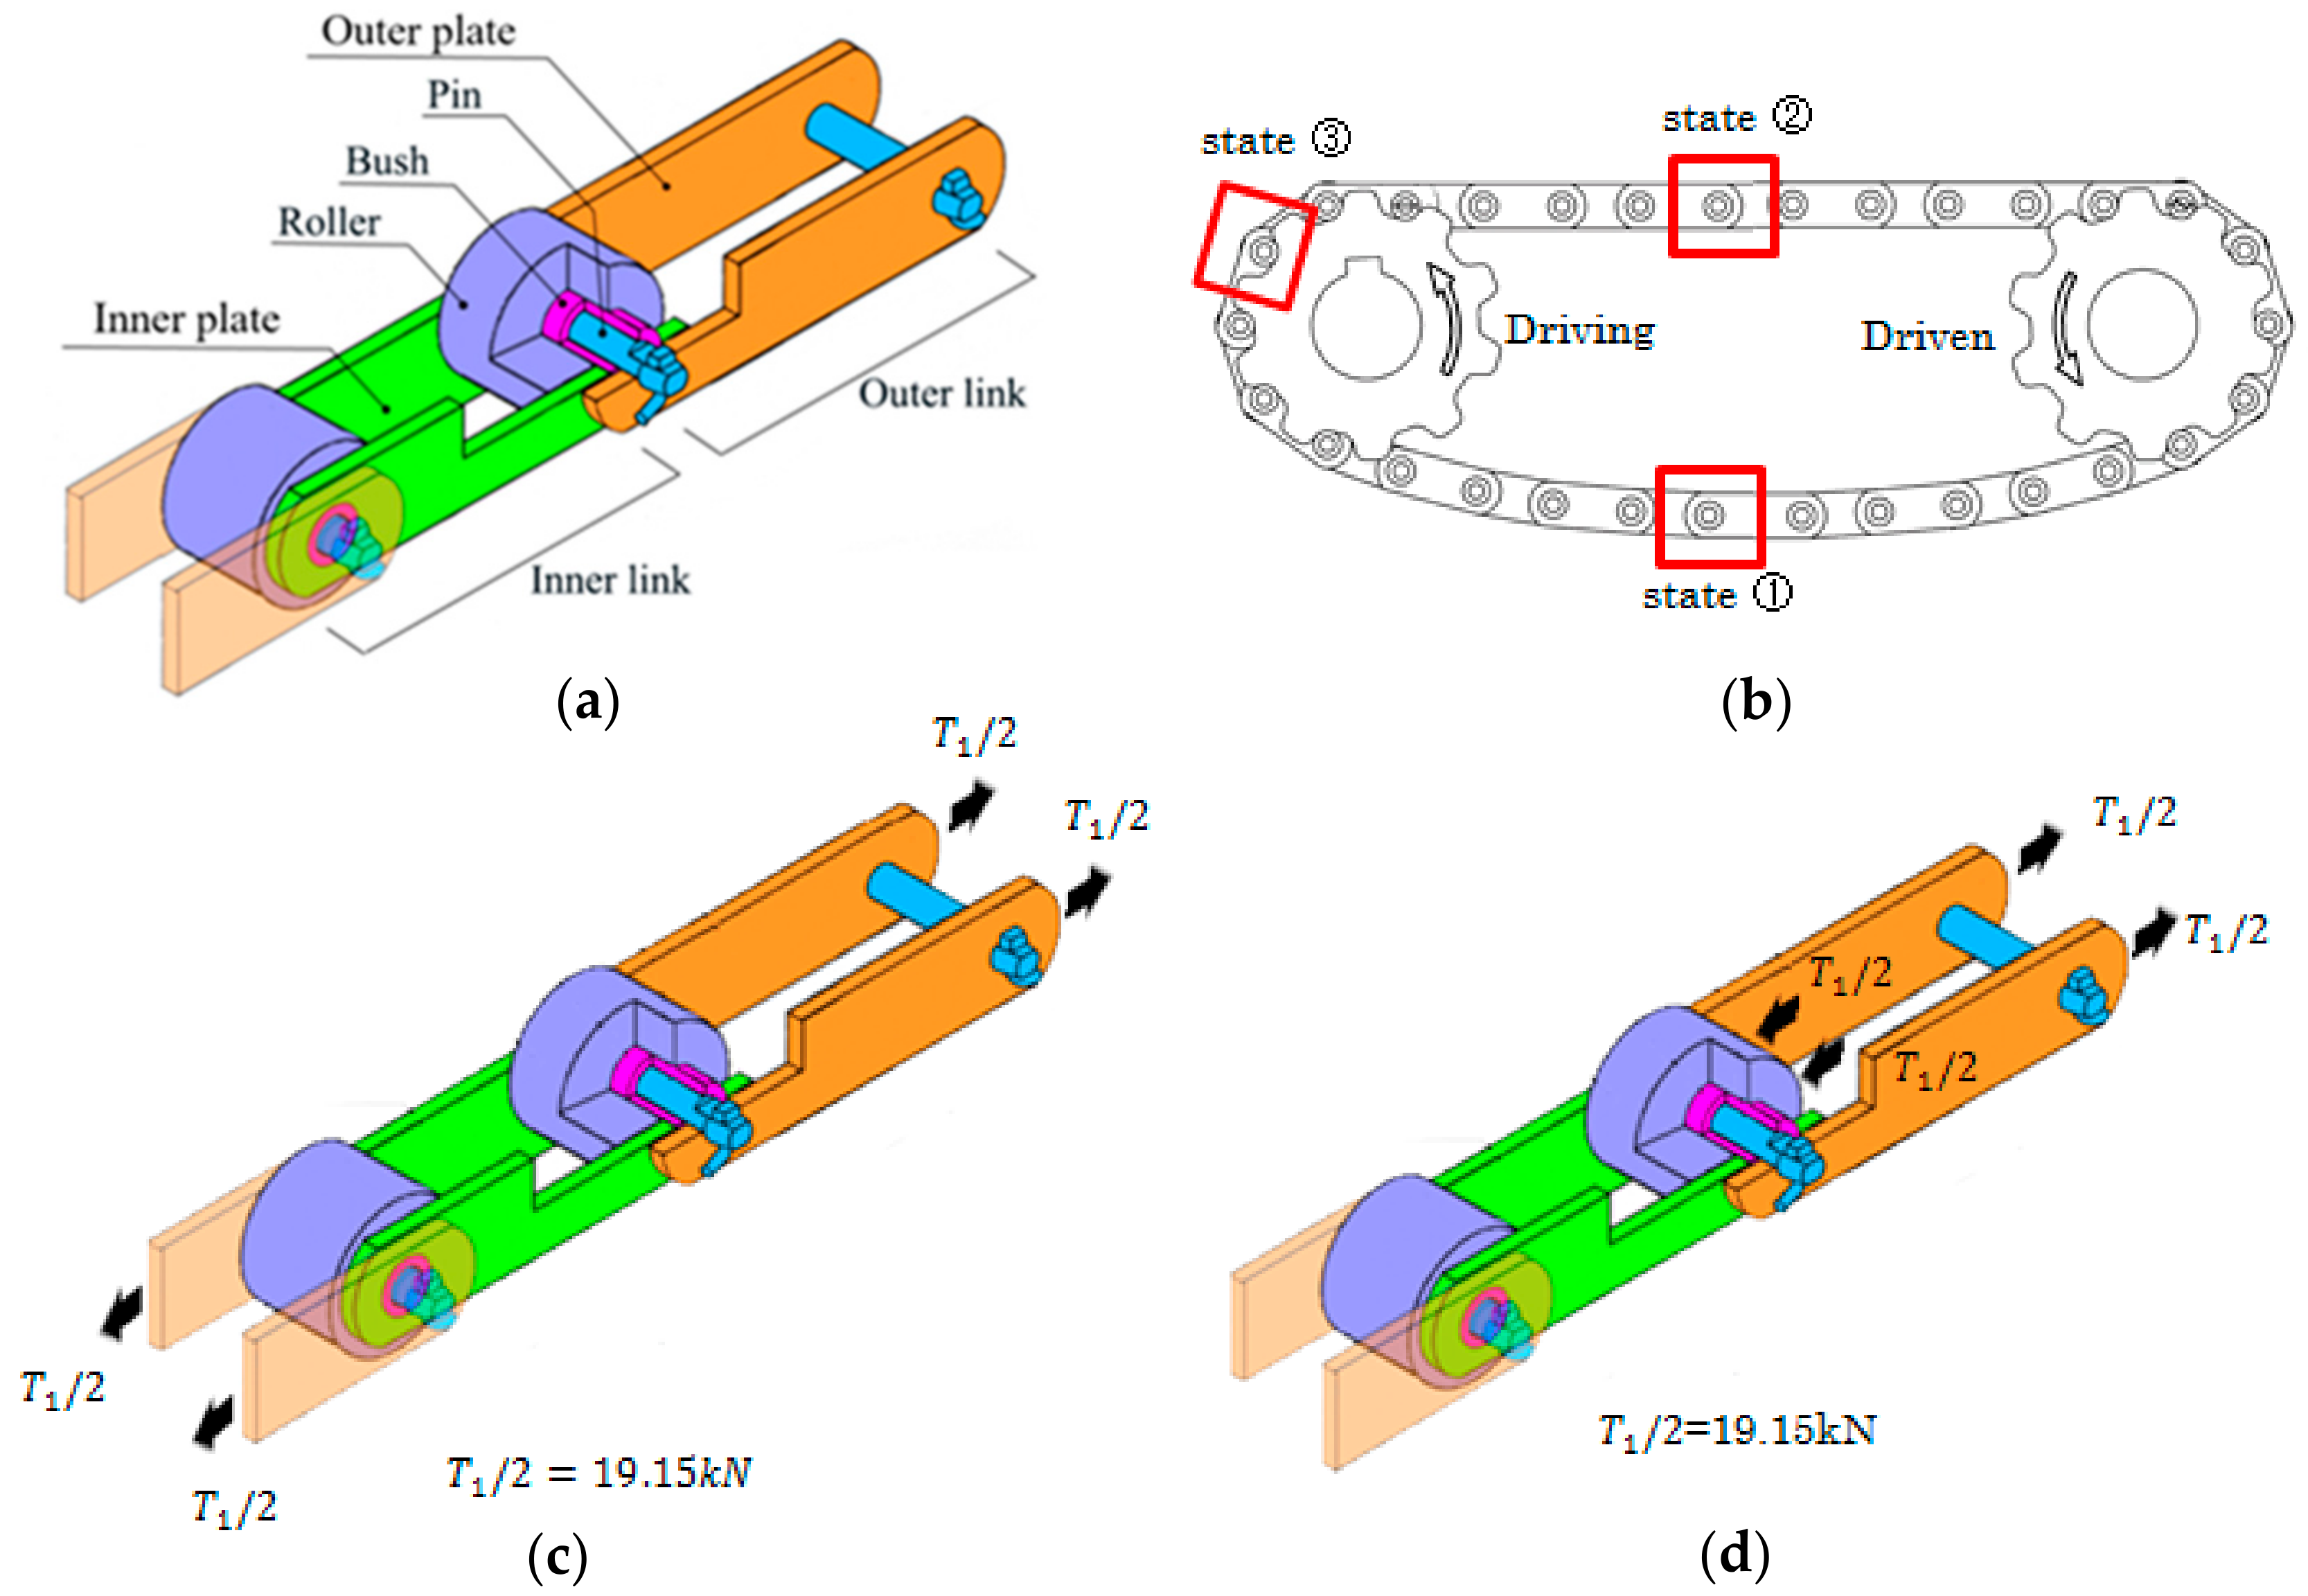
The roller chain is commonly used for transmission of mechanical power on many kinds of industrial machinery including conveyors, cars, motorcycles, bicycles, and so forth. As shown in Figure 1a, the roller chain consists of a series of four components called a pin, a bush, a plate, and a roller. In Figure 1, the driving force is directly transmitted to the chain by the engaged sprocket connected to a power source. Compared with the belt drive, the transmission capacity is larger, the slip is negligibly smaller, and the transmission efficiency is also higher. These advantages of the roller chain are utilized in wide industrial fields such as steel, automobiles, chemistry, food, and electronics. The roller chain is prescribed by the Japanese Industrial Standard (JIS B 1801) in 1952. A lot of efforts have been done to improve the reliability of the roller chain and to extend the fatigue life by introducing high-strength components and by applying new technology to increase wear resistance. In spite of those efforts, however, sometimes fatigue failure has been observed for the bush and pin as well as the link plate during the operation.
In the roller chain in Figure 1c, the pin is inserted at both ends of the link plates, which are subjected to tensile load. In the previous studies, wear between the components were discussed [1,2,3,4,5]. The stress analysis of the link plate was carried out in detail, but the influence of press fitting was not conducted and the state of the roller chain was tensile state only [6,7,8]. The fatigue experiment was conducted for the roller chain as shown in Figure 1 under the tensile state [9,10]. Focusing on the kinematics and dynamics study of the combination of chain and sprocket, the vibration and impact load of the roller chain were studied without analysis of the pin and bush [11,12,13,14,15,16,17,18,19,20,21,22,23,24,25,26,27,28,29]. In this way, no studies are available for the strength of each component in an assembled roller chain and under operation (press-fitting state, tensile state, sprocket-engaging state) and these combinations on the basis of stress analysis.
On the other hand, in recent years, high-performance materials, such as ceramics, are being used as the components of roller chains instead of conventional steel [30]. Since the ceramics are expensive and difficult to be manufactured, the conventional trial and error approach cannot be applied. Therefore, it is necessary to clarify the strength reliability of each component of the roller chain. For example, a perforated plate is commonly used as a model for designers to understand the stress concentration on a link plate with holes [8]. However, as shown in Figure 1, since the link plate is used after a pin is inserted in the hole, the validity of this modeling should be discussed.
Since the previous studies [1,2,3,4,5,6,7,8,9,10,11,12,13,14,15,16,17,18,19,20,21,22,23,24,25,26,27,28,29] have not considered the details of the maximum stress and maximum stress amplitude, this paper focuses on each component, that is, the inner plate, outer plate, bush, and pin in Figure 1, as well as the assembled roller chain structure. In this paper, although the dimensions of the roller chain and the shrink fitting ratio are fixed, the most important dimensions of the roller chain are proportional to the size of the roller chain. Therefore, the present results may be useful for other sizes of roller chains. The position and the magnitude of the maximum and minimum stresses will be obtained. Then, the maximum stress amplitude will be clarified for each component during operation. The strength evaluation obtained by 3D FEM modeling will be compared with the results of 2D FEM modeling. Then, the necessity of three-dimensional analysis will be examined. The severity of each component will be compared to find out the most critical location where it is most likely to be fractured.
2. Materials and Methods
2.1. Structure of Roller Chain
Figure 1 shows the schematic illustration including five components of the roller chain. The bush and the pin are pushed into the inner plate and the outer plate so that they cannot be rotated. Only the roller can rotate around the bush. The outer link consists of a pin and an outer plate. The inner link consists of a bush and an inner plate.
2.2. Calculation of Chain Tension
Figure 2 shows the layout of the model of the roller chain used in this study. The tensile load applied to the chain can be calculated from the motor power. In the tensile state and in the sprocket-engaging state, different stresses are applied to the chain. Here, consider the fundamental tensile force during the operation of the chain. Table 1 shows the specification used to calculate motor power P.
The following formula is used to calculate the required power of the motor P [31]:
Here, T is the maximum tensile load acting on the chain, h is the horizontal distance of the conveyor, d is the vertical distance of the conveyor. V is transfer speed, η is the mechanical transmission efficiency of the transmission section, W is the mass of the conveying section, and μ1 is the coefficient of friction between the chain and the guide rail.
By substituting the data in Table 1 into Formula (1), the tensile force T can be calculated as
Although the chain has two strands, by considering the unbalanced load, the tensile load T1 can be approximated as 1.2 times of T/2 [32].
Since T1 is the total force applied to the two outer plates, T1/2 = 19.15 kN is applied to each plate.
2.3. Dimensions and Mechanical Properties of Each Component
Finite element analysis software MSC.MARC/Mentat 2012 (MSC, Palo Alto, CA, USA) was used and the elastic-plastic analysis was performed by using hexahedral 8-node isoparametric element. Since the plastic zone size was within several millimeters, the present analysis was very close to the elastic analysis. The effect of the plastic zone on the fatigue strength will be explained in Section 6. Considering the symmetry of the problem, the half model in Figure 1 was considered. For contact analysis, direct constraint method was used. Table 2 shows the dimensions of a roller chain considered in this study with the FEM mesh. Table 3 shows the material properties of each component. The clearance between the pin and bush was 0.5 mm, and the clearance between the roller and bush was 0.8 mm. Assume the friction coefficient μ = 0.3. Later, in Section 5, the FEM results in the 2D model will be discussed as shown in Figure 12. The dimensions and mesh size of the 2D model were approximately the same as that of the inner plate in Table 2. The stress on the stress concentration portion obtained from the analysis result of this model was 233 MPa, which is consistent with the theoretical result of a finite plate with a circular hole.
2.4. Analysis Model
Figure 3a is a schematic illustration of the roller chain drive system where a driving force is provided from a sprocket. The applied load varies depending on the position of the chain. Figure 3b–d show the FEM mesh under different boundary conditions. Here, Figure 3b is in press-fitting state (state①), Figure 3c is in tensile state (state②), and Figure 3d is in the engaging state (state③).
Figure 3b shows the state where the pin is pressed into the outer plate and the bush is pressed into the inner plate. The outer plate diameter d = 15.8 mm with the shrink-fitting ratio . The inner plate diameter d = 22.55 mm with the shrink-fitting ratio . The shrink-fitting ratios are larger than the commonly used press-fit ratio [33]. In the press-fit state, there is no external force applied whose situation appears after the engaging state of the chain.
In Figure 3c, the tensile force T1/2 = 19.15 kN in Section 2.2 was applied to the models of the outer and inner plates. Pins were mainly subjected to shear loads from both the plates, and bushes were mainly subjected to bending by the link plate.
In Figure 3d, the roller was pushed by the tooth surface of the sprocket since the chain was engaged with the sprocket. The outer link was subjected to tension to balance the force from the sprocket. Thus, the outer plate was under tension and the inner plate was not under tension. The pin was subjected to the shear force from the outer link and the pin was also subjected to the bending from the bush. The bush contacted the pin at the inner surface and the roller at the outer surface and was subjected to the bending from the outer plate. The mean stress and stress amplitude can be obtained by considering state① and state②, or states② and state③, or states① and state③.
3. Several Examples of Real Failure of Roller Chain
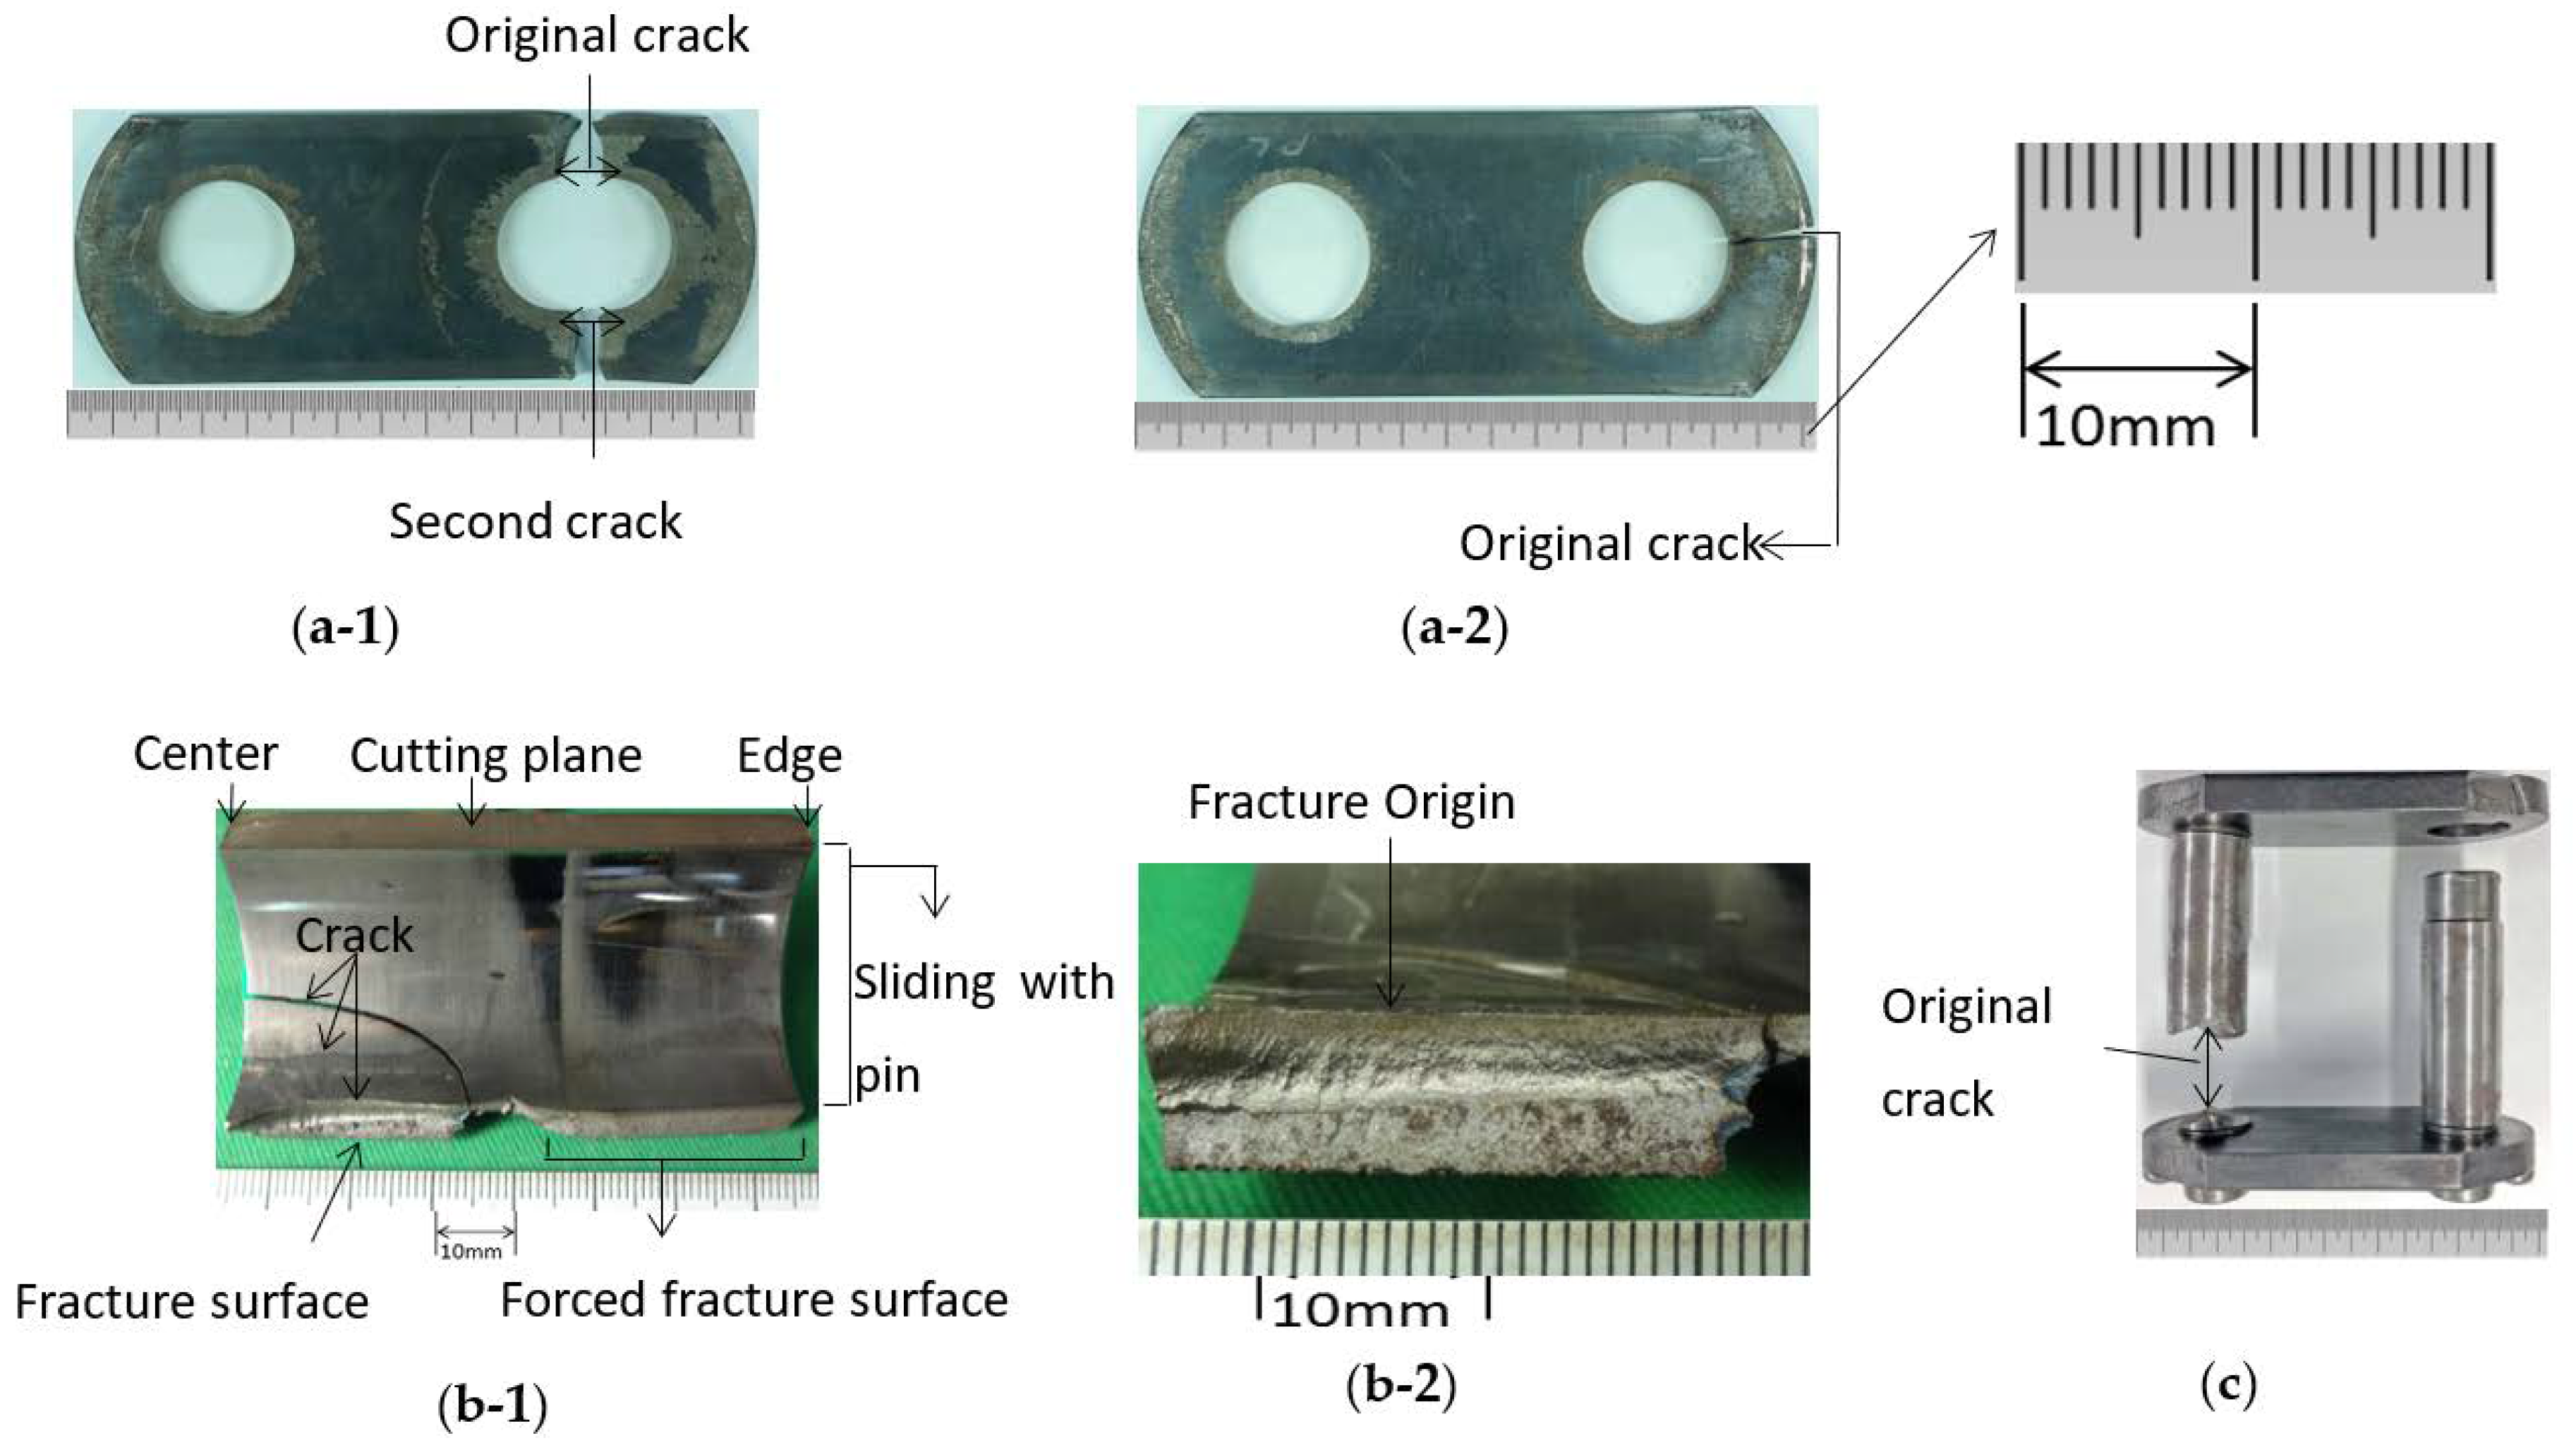
Figure 4 shows several examples of broken components during real operation of the roller chain. The dimensions of Figure 4 are not exactly the same as the dimension in Table 2. However, a similar trend in fracture can be seen in different sizes of the roller chain. Here, Figure 4a shows an example of the broken inner plate, Figure 4b shows an example of the broken bush, and Figure 4c shows an example of the broken pin. From the failure components investigated, it may be conjectured that the most damaged component is the pin, since several pins were fractured around the stress concentration portion due to a stepped corner.
However, in this study, to reduce the computational time, a simple cylinder pin was assumed without step. Therefore, the detail stress was not studied for pins. This paper mainly focuses on breakage of the bush and inner and outer plates.
Figure 4(a-1,a-2) shows examples of the inner plate failure. In Figure 4(a-1), the fatigue crack initiated at θ = 90° of the pin hole and propagated perpendicular to the tensile direction. However, in Figure 4(a-2), the fatigue crack initiated at θ = 0° of the hole edge and propagated in the tensile direction. On the other hand, Figure 4(b-1,b-2) shows an example of the bush failure. In Figure 4(b-1), the fatigue crack initiated at around the central portion of the bush where the sprocket engaged force is applied. From Figure 4(b-2), the fatigue crack initiated at the inner surface of the central portion of the bush and propagated to the outer surface and the z-direction. It is seen that the circumferential stress controls the fractured surface θ = const.
Based on the discussion, the following sections mainly focus on the circumferential stress , since this stress component may control the fatigue crack extension.
4. Results and Discussion
4.1. Stress Analysis Results for Bush
Figure 5 shows the results for the bush under (a) press-fitting state, (b) tensile state, and (c) engaging state. Large compressive stresses appeared at the press-fitting portion of the bush in Figure 5a, and in Figure 5c, relatively large tensile stresses appeared at the inner surface in state③under engaging state. In Figure 5, selected stress values are indicated only at the surface, all inside stresses are also considered, and several stresses are indicated.
The stress values in Figure 5 were chosen by considering the risk of fatigue failure. To evaluate the risk, the following aspects were taken into account, that is, ⓐ the magnitude of tensile stress appeared at each operating condition; ⓑ previous failure information such as the position, maximum tensile direction shown discussed in Section 3; ⓒ the magnitude of stress amplitude appeared during operation. In Figure 5, a total of 5 points were selected in the following way: Point (1) around θ = 6° had the largest tensile stress and Point (2) around θ = 14° had the second largest stress under engaging state. Point (3) around θ = 0° and Point (4) around θ = 83° were selected since they had compressive stress more than two times larger than the maximum tensile stress at Point (1). Table 4 shows the stress amplitude at Points (1), (2), (3), (4) as well as the mean stress from the maximum and minimum stresses during operation. The results in Table 4 are plotted in the fatigue limit diagram as shown in Figure 6. In Table 4, Point (5) around θ = 0° was also considered and plotted in Figure 6 since the stress amplitude was the largest at this point.
The effect of the frictional forces between the bush and the pin can be also discussed in the following way. FEM calculation shows that the maximum compressive stress at the inner surface was 1265 MPa. By assuming that the friction coefficient μ = 0.3, the frictional force can be estimated about 380 MPa [34], which is about 60% of σθmax. Since the frictional stress was small, it may be concluded that the repeated frictional force was not the main reason for crack initiation.
In Figure 6, in order to compare the severity of Points (1)–(5), a modified Goodman line is indicated. In this fatigue limit diagram, tensile strength σB = 1666 MPa in Table 3 was used. The fatigue limit σw0 = 666.4 MPa in Figure 6 can be obtained from the ratio σw0/σB = 0.4 in reference [35]. By taking an example of Point (1), the safety factor (SF) was obtained as shown in Figure 6 from the following equation:
Here, Point A shows the results of Point (1) and Point A’ can be obtained as the intersection point between the extended line and the modified Goodman line. All results in Figure 6 were based on the bush surface stresses, which were larger than the nearby inside stresses. Due to this stress gradient of the bush component, it should be noted that exceeding the modified Goodman line does not mean the corresponding point’s failure. Since Figure 6 shows that all results were within the modified Goodman line, it may be concluded that the bush was completely safe. From Figure 6, it was found that Point (1) had the smallest SF and most severe for the bush. The maximum and minimum stresses were found out from FEM results by comparing the results of several points in the bush.
Let us consider the reason why the maximum tensile stress σθ max appeared on the inner surface of the bush, especially at Point (1). Figure 7a,b shows the bush deformation enlarged by 50 times in the r-direction. Figure 7c shows stress distribution at cross section z = 2.4 mm where the surface stress reached a peak value. As shown in Figure 7c, the bush was subjected to bending moment and flattened so that the maximum tensile stress occurred around θ = 0° at the inner surface of the bush [36]. The stress around Point (1) was the most severe and consistent with the actual damage location observed in Figure 4(b-1,b-2).
4.2. Stress Analysis Result for Inner Plate
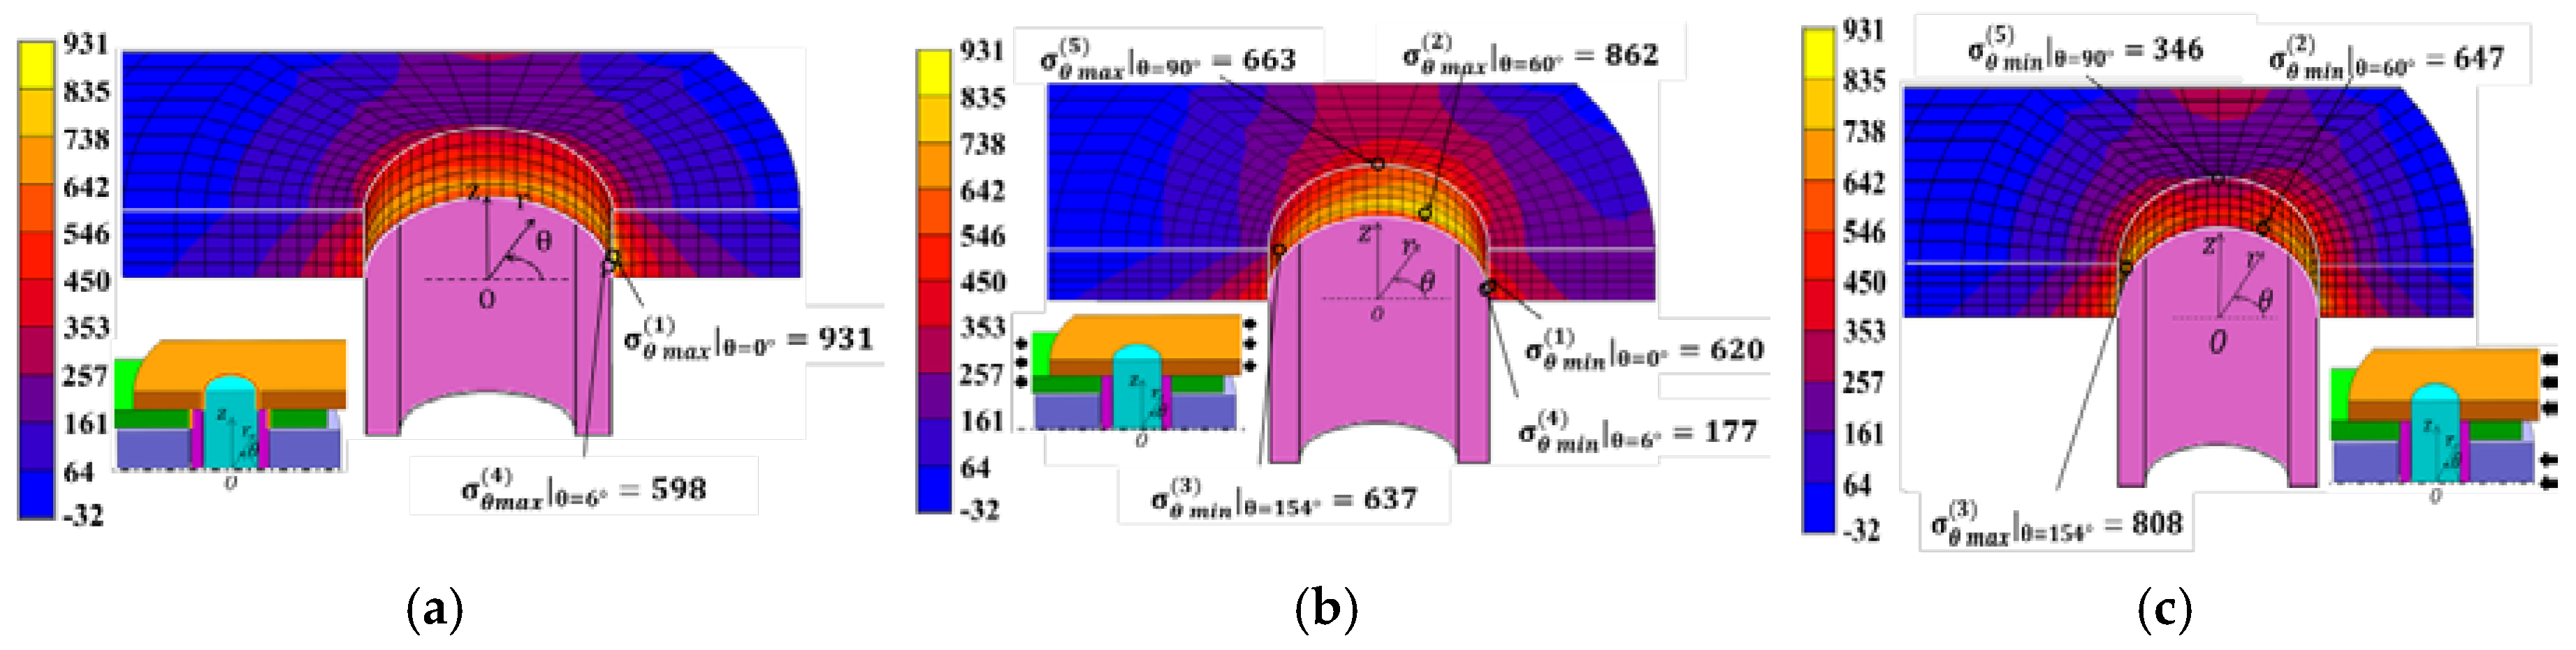
Figure 8 shows the results for the inner plate under (a) press-fitting state, (b) tensile state, and (c) engaging state. Large tensile stresses appeared at the press-fitting portion of the bush in Figure 8a. In Figure 8b, large stresses appeared at θ ≅ 0° and θ ≅ 90°.
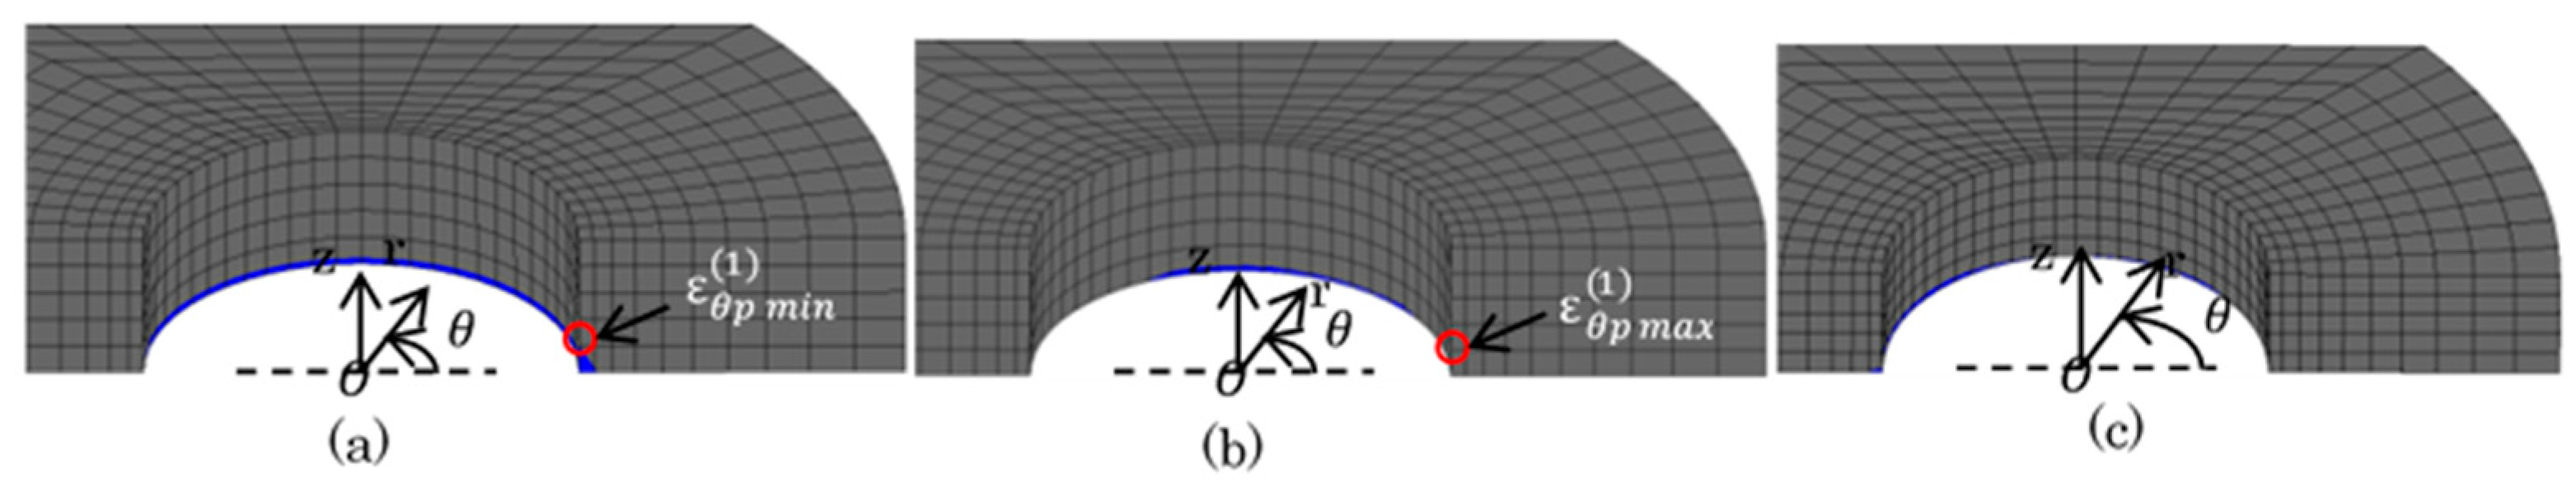
The stress values in Figure 8 were chosen in a similar way to Figure 5. Point (1) around θ = 0° had the largest under (a) press-fitting state, Point (2) around θ = 60° had the largest under (b) tensile state, and Point (3) around θ = 154° had the largest under (c) engaging state. Point (4) around θ = 6° had the largest stress amplitude and Point (5) around θ = 90° had the second largest stress amplitude.
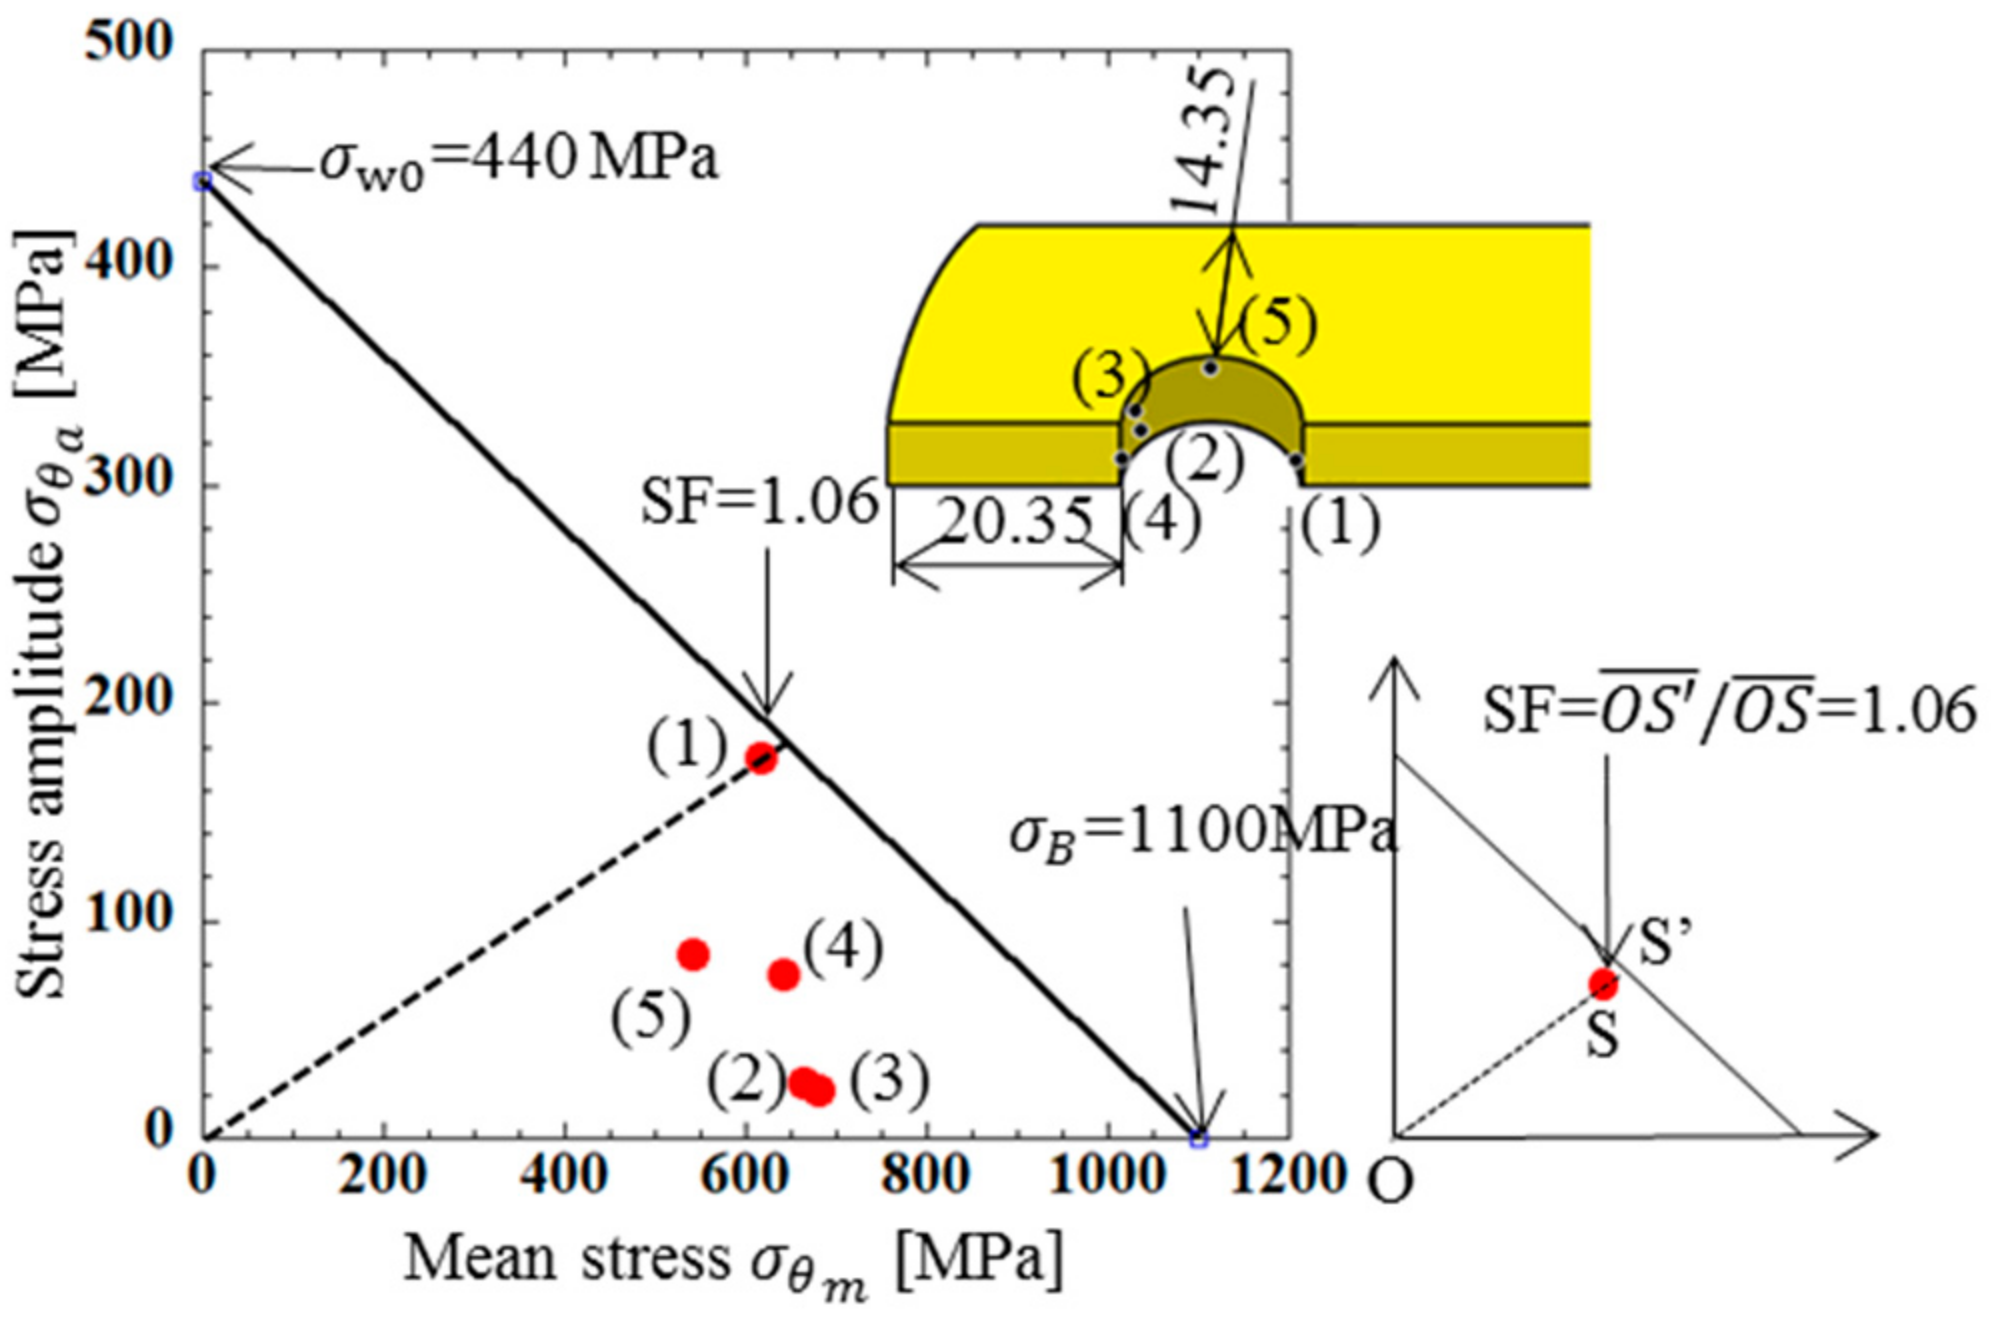
Table 5 shows the stress amplitude at Points (1), (2), (3), (4), (5) as well as the mean stress from the maximum and minimum stresses during operation. The results in Table 5 are plotted in the fatigue limit diagram as shown in Figure 9. In Figure 9, the stress state of the inner plate was close to the fatigue limit. Among them, Point (1), where there was an angle of θ = 6° to the stretching direction, was in the dangerous zone.
4.3. Stress Analysis Result for Outer Plate
Figure 10 shows the results for the outer plate under (a) press-fitting state, (b) tensile state, and (c) engaging state. Similar to the inner plate, the tensile stress near the hole of the outer plate was very high.
The stress values in Figure 10 were chosen in a similar way to Figure 5. Point (1) around θ = 13° had the largest under (a) press-fitting state, Point (2) around θ = 140° had the largest under (b) tensile state, and Point (3) around θ = 148° had the largest under (c) engaging state. Point (4) around θ = 167° and Point (5) around θ = 90° had relatively large stress amplitudes.
Table 6 shows the stress amplitude at Points (1)–(5) as well as the mean stress from the maximum and minimum stresses during operation. The results in Table 6 are plotted in the fatigue limit diagram as shown in Figure 11. The stress states of all the points were on the relatively safe side, among which Point (1), where the stress amplitude was largest, was most dangerous. At Point (1), the maximum stress occurred at an angle θ = 13° from the tensile direction in the press-fit state. In the fatigue limit diagram, the most dangerous points were close to the edge of the hole in the tensile direction, where θ = 0° and θ = 180°.
5. Necessity of Three-Dimensional Modeling
In the previous sections, the strength of the inner and outer plates were discussed by using a 3D model. To simplify the discussion, here, 3D modeling will be discussed by comparing the result with 2D modeling. This is because 2D modeling has been used in the design of the roller chain to calculate the strength of the inner plate and outer plate [8,37].
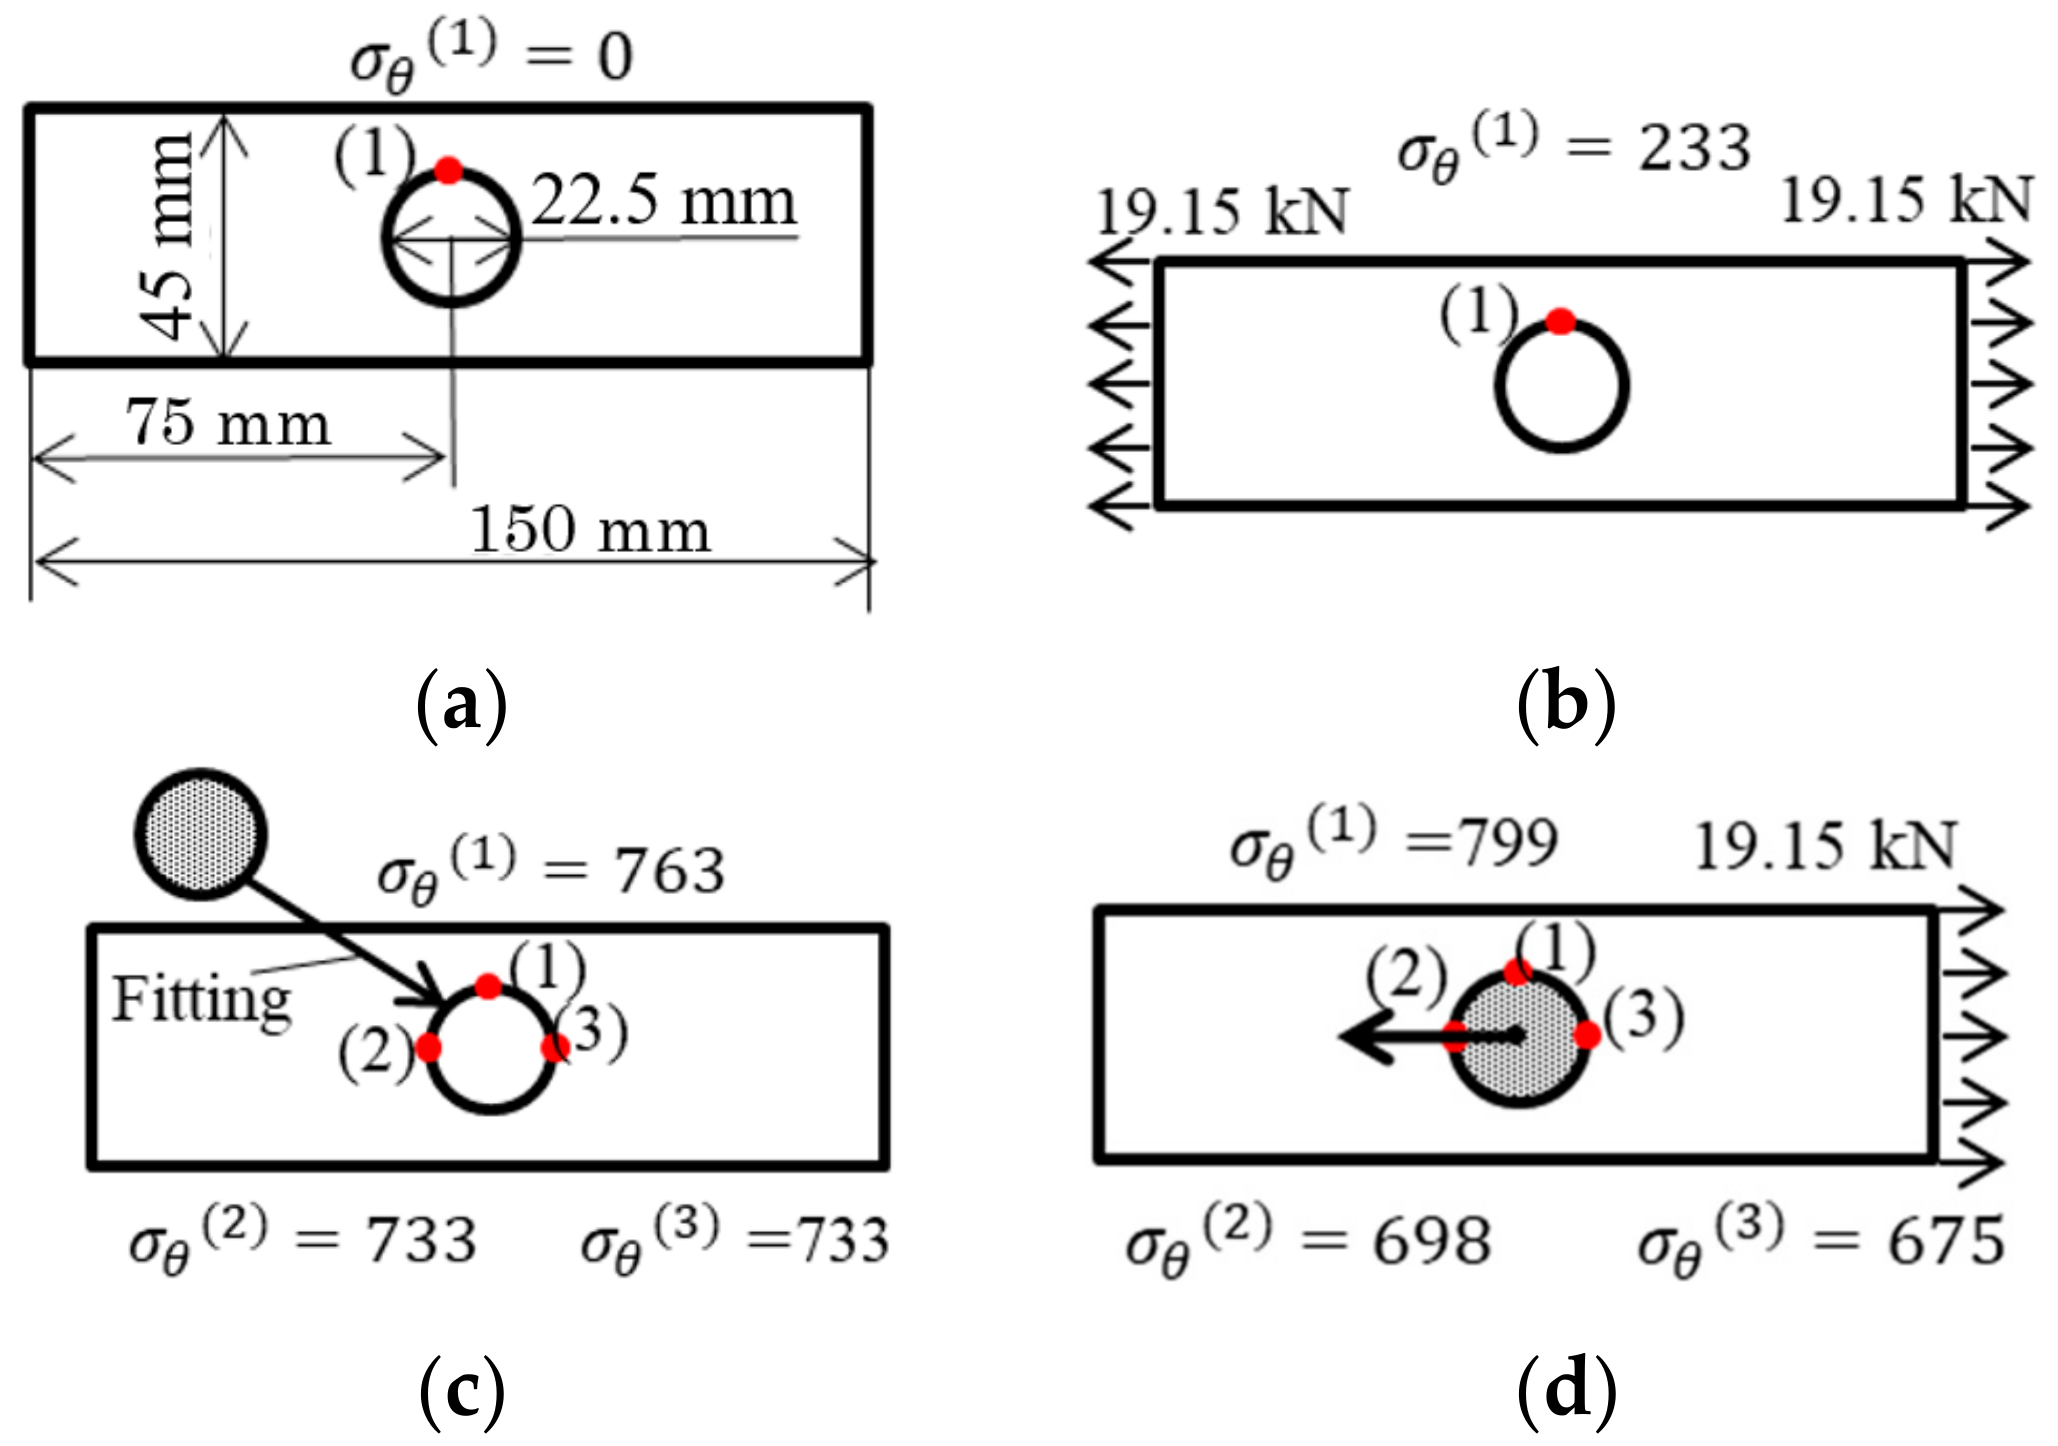
The width of the plate in the 2D model was 45mm. The length of the plate in the 2D model was 150 mm. There was a center circular hole with the diameter of half of the plate width, at the center of the plate used in the analysis. The plate was subjected to a tensile force T1/2 = 19.15 kN. Figure 12 shows the two-dimensional model and boundary conditions used in the analysis. Figure 12a shows the holed plate model without load. Figure 12b shows the holed plate model under tensile. Figure 12c shows the disk-fitted model without load. Figure 12d shows the disk-fitted model under tensile. Compared to the model shown in Figure 12a–d, the chain component and boundary conditions of Figure 12c,d were closer to the actual situation. The holed plate model focused on Point (1) where the maximum stress occurred. The disk-fitted model focused on Point (1) as well as Points (2) and (3), which were along the tensile direction. Table 7 shows the maximum stress σθ max, minimum stress σθ min, stress amplitude σθa, and average stress σθm at each point obtained by FEM analysis. Figure 13 shows the fatigue limit diagram for the 2D plate. From Table 7 and Figure 13, the following can be seen:
- (1)
- From the comparison between the results of the holed plate model in Figure 12a,b, and the results of the disk-fitted model in Figure 12c,d, it can be found that the maximum stress, minimum stress, and average stress of the disk-fitted model in Figure 12c,d are 3 times larger than those of the holed plate model in Figure 12a,b.
- (2)
- (3)
- (4)
The model in Figure 12a,b has been used in design of the roller chain to calculate the strength of the inner and outer plates [8,37]. However, the above (1) to (4) show that the 2D model in Figure 12a–d is not suitable and 3D modeling is necessary.
In this section, the necessity of 3D modeling was discussed. The discussion and approach in this paper are quite general, therefore they can be applied to developing different and new types of roller chains.
6. Effect of Plastic Region in Roller Chain on the Fatigue Strength
In this section, the effect of the plastic zone on the fatigue strength will be discussed because the plastic zone appears for the outer and inner plates due to the press fitting of the pin and bush.
Figure 14, Figure 15 and Figure 16 show the plastic zone under difficult state. In Figure 14, the plastic zone of the bush was within several mm of the region at the upper portion contacted with the plate. Point (3) and (4) in Figure 6 were in the plastic zone. However, the other Points (1), (2), (4), (5) were in the elastic zone. In Figure 15, the plastic zone of the inner plate appeared only at the hole edge z = 0. The plastic zone of the inner plate included Point (1) in Table 5 where the maximum tensile stress appeared. In Figure 16a, a larger plastic zone of the outer plate appeared around the hole edge due to press fitting of the pin. However, the width of the plastic zone was within 2 mm in the r-direction, which is only 14% of ligament of the outer plate.
As described above, since the plastic region was observed, the following is a discussion of damage assessment from the viewpoint of low cycle fatigue. Damage evaluation in low cycle fatigue is evaluated based on Manson–Coffin’s rule shown in the following equation:
Here, is the plastic strain range, is the fatigue ductility coefficient, is the fatigue ductility index, and is the number of iterations until failure.
Table 8 shows the maximum plastic strain , the minimum plastic strain , and plastic strain amplitude for the bush, inner plate, and outer plate. Table 8 also shows the mean stress and stress amplitude by focusing on the most severe point. From Table 8, was much smaller than , which causes low cycle fatigue failure for similar materials SS640 and SCM435 [38]. Therefore, in roller chains is smaller and safe. Since the effect of the plastic zone is not very large, the present analysis is very close to the elastic analysis.
The effect of the plastic region in the roller chain on the fatigue strength was considered in this section. It was found that present elastic analysis is sufficient because the plastic strain amplitude was not very large.
7. Conclusions
In this study, the failure strength was considered for the components of roller chains by applying FEM analysis. This paper focused on each component, that is, the inner plate, outer plate, bush, and pin in Figure 1, as well as assembled roller chain structure. The position and the magnitude of the maximum and minimum stresses were obtained. In addition, the maximum stress amplitude of each component during operation was clarified.
On the basis of used conditions in Table 1, the dimension in Table 2, and materials in Table 3, the following conclusions can be obtained:
- (1)
- (2)
- (3)
- (4)
- The 2D hole model in Figure 12a,b is not suitable for the stress estimation since the pin is inserted in the hole. The results of the 2D pin-inserted model in Figure 12c,d are different from the 3D model. Therefore, 3D modeling is necessary. Since the discussion and approach in this paper are quite general, they can be applied to developing different and new types of roller chains.
- (5)
- The effect of the plastic region in roller chains on the fatigue strength was considered. It was found that present elastic analysis is sufficient because the plastic strain amplitude is not very large.
In this paper, the dimensions of the roller chain and the shrink fitting ratio were fixed. Then, the stress of each component was discussed, as well as the assembled roller chain structure. However, the most important dimensions of the roller chain are proportional to the size of the roller chain. Therefore, the present results may be useful for other sizes of the roller chain. The effect of wear on the fatigue strength will be considered in future studies.
Author Contributions
R.S. conducted the research; N.-A.N. supervised the research; Y.S. advised the research; J.S. and T.M. wrote the paper; Y.B., A.M. and Y.H. performed the FEM simulation.
Funding
This research received no external funding.
Conflicts of Interest
The authors declare no conflict of interest.
References
- Shoji, N.; Hideaki, Y.; Satoshi, N.; Tohru, K. Evaluation of Wear between Pin and Bush in Roller Chain. J. Adv. Mech. Des. Syst. Manuf. 2009, 3, 355–365. [Google Scholar] [CrossRef] [Green Version]
- Jun, T.Z.; Shun, Z.W.; Zhen, X.W. The effects of the wear elongation on the load of a Long-distance transmission chain. Appl. Mech. Mater. Trans. Tech. Publ. 2014, 456, 60–64. [Google Scholar] [CrossRef]
- Xu, S.; Wang, Y.; Meng, F. Study on the reliability evaluation method of the wear life of roller chains. J. Mech. Eng. Sci. 2006, 220, 1569–1574. [Google Scholar] [CrossRef]
- Perawat, T.; Patiparn, N.; Pruet, K. Wear resistance improvement of the roller chain parts at Thai Metro Industry (1973) Co., Ltd. Mater. Today 2018, 5, 9431–9439. [Google Scholar] [CrossRef]
- Metil’kov, S.A.; Berezhnoi, S.B.; Yunin, V.V. Wear of hinges in roller drive chain. Russ. Eng. Res. 2008, 28, 839–844. [Google Scholar] [CrossRef]
- Shoji, N.; Kohta, N.; Satoshi, N.; Tohru, K.; Toshiaki, N.; Takashi, O. Static Stress Analysis of Link Plate of Roller Chain using Finite Element Method and Some Design Proposals for Weight Saving. J. Adv. Mech. Des. Syst. Manuf. 2009, 3, 159–170. [Google Scholar] [CrossRef]
- Tushar, D.B.; Prashant, M.P.; Bhaskar, D.G. Fea Based Study of Effect of Radial Variation of Outer Link in A Typical Roller Chain Link Assembly. Int. J. Mech. Ind. Eng. 2012, 1, 65–70. [Google Scholar]
- Jagtap, M.D.; Gaikwad, B.D.; Pawar, P.M. Study of roller conveyor chain strip under tensile loading. IJMER 2014, 4, 2249–6645. [Google Scholar]
- Krishnakumar, K.; Arockia, S.A. A Review of failure analysis found in industrial roller chains. Int. J. Chem. Tech. Res. 2015, 8, 598–603. [Google Scholar]
- Masao, M. The effect of number of pitches of test pieces on the fatigue life of roller-chains. In Proceedings of the Fujihara Memorial Faculty of Engineering, Keio University; Keio University: Tokyo, Japan, 1961; pp. 146–153. [Google Scholar]
- Hiroshi, S.; Atuo, S. Nonlinear forced vibration of roller chain. Bull. JSME 1975, 18, 1090–1100. [Google Scholar] [CrossRef]
- Binder, R.C.; Cover, W.V. Impact between chain roller chain derives. Adv. Mater. Res. 2011, 291, 1551–1554. [Google Scholar]
- Liu, S.P.; Wang, K.W.; Hayek, S.I.; Trethewey, M.W.; Chen, F.H.K. A global–local integrated study of roller chain meshing dynamics. J. Sound Vib. 1997, 203, 41–62. [Google Scholar] [CrossRef]
- James, C.C.; Glen, E.J. Experimental investigation of link tension and roller-sprocket impact in roller chain drives. Mech. Mach. Theory 1996, 31, 533–544. [Google Scholar] [CrossRef]
- Wasan, S.; Chakrit, S. An Integrating Finite Element Method and Multi-body Simulation for Drive Systems Analysis. Eng. J. 2017, 21, 221–234. [Google Scholar] [CrossRef] [Green Version]
- Baolin, L.; Shuai, F.; Yan, Z. The modal analysis of roller chain drives. Adv. Mater. Res. 2011, 291, 1551–1554. [Google Scholar] [CrossRef]
- Jorge, A.; Candida, M.; Amilcar, R. Planar roller chain drive dynamics using a cylindrical contact force model. Mech. Based Des. Struct. Mach. 2016, 44, 109–122. [Google Scholar] [CrossRef]
- Xu, L.; Yang, Y.; Chang, Z.; Liu, J. Dynamic modeling of a roller chain drive system considering the flexibility of input shaft. Chin. J. Mech. Eng. 2010, 23, 367–374. [Google Scholar] [CrossRef]
- Sine, L.P.; Jone, M.H.; Jorge, A.C.A. A roller chain drive model including contact with guide-bars. Multibody Sys. Dyn. 2004, 12, 285–301. [Google Scholar]
- Chen, C.K.; Freudenstein, F. Toward a more exact kinematics of roller chain drives. J. Mech. Trans. Autom. Des. 1988, 110, 269–275. [Google Scholar] [CrossRef]
- Candida, M.P.; Jorge, A.A.; Amilcar, L.R. A methodology for the generation of planar models for multibody chain drives. Multibody Syst. Dyn. 2010, 24, 303–324. [Google Scholar] [CrossRef]
- Naji, M.R.; Marshek, K.M. The effects of the pitch difference on the load distribution of a roller chain drive. Mech. Mach. Theory 1989, 24, 351–362. [Google Scholar] [CrossRef]
- Suwannahong, W.; Suvanjumrat, C. Analysis of Roller Chain Drive System with Multi-Flexi Body Dynamics Methodology. EDP Sci. 2017, 95. [Google Scholar] [CrossRef]
- Fuglede, N.; Thomsem, J.J. Kinematic and dynamic modeling and approximate analysis of a roller chain drive. J. Sound Vib. 2016, 366, 447–470. [Google Scholar] [CrossRef] [Green Version]
- Wragge-Morley, R.; Yon, J.; Lock, R.; Alexander, B.; Burgess, S. A novel pendulum test for measuring roller chain efficiency. Meas. Sci. Technol. 2018, 29. [Google Scholar] [CrossRef]
- Ambrosio, J.; Malça, C.; Ramalho, A. Cylindrical Contact Force Models for the Dynamics of Roller Chain Drives. Multibody Mech. Syst. 2015, 25, 121–131. [Google Scholar] [CrossRef]
- Lu, P. Supplement of Several Problems in Roller Chain Drive Design. Adv. Mater. Res. 2013, 774, 176–179. [Google Scholar] [CrossRef]
- Xu, L.X.; Li, Y.G. Numerical Simulation on Dynamic Behavior of Intermittent Roller Chain Drives. Appl. Mech. Mater. 2012, 155, 535–539. [Google Scholar] [CrossRef]
- Pedesen, S.L. Model of contact between rollers and sprockets in chain-drive systems. Arch. Appl. Mech. 2005, 74, 489–508. [Google Scholar] [CrossRef]
- Oscar, D.C.; Arthur, A.S. Chain Feed Mechanism for an Induction Heating Furnace. United States Patent US4582972A, 15 April 1986. [Google Scholar]
- Shizuo, A. Chain Conveyor [Conveyor Series 2]; Yakumoshoten Co., Ltd.: Tokyo, Japan, 1961; p. 58. [Google Scholar]
- Senqcia Corporation. Selection of Roller Chain for Transmission; Senqcia Co.: Tokyo, Japan, 2016; p. 74. [Google Scholar]
- Msasakata, N.; Masao, M. Effects of Press-fit of Bushings and Number of Links on Fatigue Strength of Roller Chains. J. Jpn. Soc. Precis. Eng. 1984, 50, 665–671. [Google Scholar] [CrossRef]
- Tadashi, I. Strength of Metal; Yokendo Co., Ltd.: Tokyo, Japan, 1970; p. 127. [Google Scholar]
- Shigeru, H.; Yuu, S. Evaluation of fatigue limit characteristics of lamellar pearlitics steel in consideration of microstructure. Soc. Mater. Sci. 2011, 9, 790–795. [Google Scholar] [CrossRef]
- Teruyoshi, U.; Shigeru, N.; Iwao, K. Stress and Deformation of Thin Curved Tube. J. Jpn. High Press. Inst. 1968, 6, 1328–1336. [Google Scholar]
- Utaro, M. Chain Conveyor; Kogakutosho Co., Ltd.: Tokyo, Japan, 1982; p. 56. [Google Scholar]
- The Japan Society of Mechanical Engineers. JSME Data Book: Fatigue of Metals, IV Low Cycle Fatigue Strength; Japan Society of Mechanical Engineers: Tokyo, Japan, 1983; p. 12. [Google Scholar]
Figure 1.
Schematic illustration of the roller chain: (a) press-fitting state (state①). In this state, pin is fitted into outer plate. Bush is fitted into inner plate. Only roller can rotate; (b) roller chain drive system; (c) tensile state (state②); (d) sprocket-engaging state (state③).
Figure 1.
Schematic illustration of the roller chain: (a) press-fitting state (state①). In this state, pin is fitted into outer plate. Bush is fitted into inner plate. Only roller can rotate; (b) roller chain drive system; (c) tensile state (state②); (d) sprocket-engaging state (state③).

Figure 2.
Layout of the roller chain [m].

Figure 3.
Schematic illustration of the roller chain drive system and the FEM model and boundary conditions for roller chain system: (a) roller chain drive system; (b) press-fitting state (state①); (c) tensile state (state②); (d) sprocket-engaging state (state③).
Figure 3.
Schematic illustration of the roller chain drive system and the FEM model and boundary conditions for roller chain system: (a) roller chain drive system; (b) press-fitting state (state①); (c) tensile state (state②); (d) sprocket-engaging state (state③).

Figure 4.
Examples of the broken parts of the roller chain: (a-1) broken inner plate perpendicular to tensile, (a-2) broken inner plate at tensile direction; (b-1) broken bush, (b-2) broken bush; (c) broken pin at step corner.
Figure 4.
Examples of the broken parts of the roller chain: (a-1) broken inner plate perpendicular to tensile, (a-2) broken inner plate at tensile direction; (b-1) broken bush, (b-2) broken bush; (c) broken pin at step corner.

Figure 5.
Stress distribution for the bush [MPa]: (a) press-fitting state; (b) tensile state; (c) engaging state.
Figure 5.
Stress distribution for the bush [MPa]: (a) press-fitting state; (b) tensile state; (c) engaging state.

Figure 6.
Fatigue limit diagram for bush [MPa].

Figure 7.
Bush deformation and at inner surface: (a) bush deformation [50 times enlarged in the r-direction]; (b) A–A cross section deformation [50 times enlarged in the r-direction]; (c) at inner surface in Figure 8b.
Figure 7.
Bush deformation and at inner surface: (a) bush deformation [50 times enlarged in the r-direction]; (b) A–A cross section deformation [50 times enlarged in the r-direction]; (c) at inner surface in Figure 8b.

Figure 8.
Stress distribution for the inner plate [MPa]: (a) press-fitting state; (b) tensile state; (c) engaging state.
Figure 8.
Stress distribution for the inner plate [MPa]: (a) press-fitting state; (b) tensile state; (c) engaging state.

Figure 9.
Fatigue limit diagram for inner plate [MPa].

Figure 10.
Stress distribution for the outer plate [MPa]: (a) press-fitting state; (b) tensile state; (c) engaging state.
Figure 10.
Stress distribution for the outer plate [MPa]: (a) press-fitting state; (b) tensile state; (c) engaging state.

Figure 11.
Fatigue limit diagram for outer plate [MPa].

Figure 12.
Stress estimation by 2D models [MPa]: (a) holed plate without load; (b) holed plate under tensile; (c) disk fitted without load; (d) disk fitted under tensile.
Figure 12.
Stress estimation by 2D models [MPa]: (a) holed plate without load; (b) holed plate under tensile; (c) disk fitted without load; (d) disk fitted under tensile.

Figure 13.
Fatigue limit diagram for 2D plate.

Figure 14.
Plastic region of bush ( ![Metals 08 00847 i001]() : plastic region): (a) press-fitting state; (b) tensile state; (c) sprocket-engaging state.
: plastic region): (a) press-fitting state; (b) tensile state; (c) sprocket-engaging state.
 : plastic region): (a) press-fitting state; (b) tensile state; (c) sprocket-engaging state.
Figure 14.
Plastic region of bush ( ![Metals 08 00847 i001]() : plastic region): (a) press-fitting state; (b) tensile state; (c) sprocket-engaging state.
: plastic region): (a) press-fitting state; (b) tensile state; (c) sprocket-engaging state.
: plastic region): (a) press-fitting state; (b) tensile state; (c) sprocket-engaging state.
Figure 15.
Plastic region of inner plate ( ![Metals 08 00847 i001]() : plastic region): (a) press-fitting state; (b) tensile state; (c) sprocket-engaging state.
: plastic region): (a) press-fitting state; (b) tensile state; (c) sprocket-engaging state.
: plastic region): (a) press-fitting state; (b) tensile state; (c) sprocket-engaging state.
Figure 16.
Plastic region of outer plate ( ![Metals 08 00847 i001]() : plastic region): (a) press-fitting state; (b) tensile state; (c) sprocket-engaging state.
: plastic region): (a) press-fitting state; (b) tensile state; (c) sprocket-engaging state.
: plastic region): (a) press-fitting state; (b) tensile state; (c) sprocket-engaging state.

Table 1.
Specification of the conveyer chain.
| Note | Definition | Value and Unit |
|---|---|---|
| P | Motor power (Base) */(Maximum) | 11 kW/18 kW |
| T | Chain tension (2 strands) | 63.8 kN |
| h | Horizontal distance of conveyor | 38.40 m |
| d | Vertical distance of conveyor | 18.58 m |
| V | Transfer speed | 10 m/min |
| η | Mechanical transmission efficiency | 0.8 |
| ― | Number of chain line | 2 |
| W1 | Per chain mass | 14 kg/m |
| W2 | Apron mass | 68 kg/m |
| W = 2W1 + W2 | Total mass | 0.94 kN/m |
| μ1 | Friction coefficient between the chain and the guide rail | 0.18 |
* It is used here.
Table 2.
Roller chain dimensions and mesh size [mm].
| Items | Outer plate | Inner plate | Pin | Bush | Roller |
|---|---|---|---|---|---|
| Diameter Inner | 15.8 | 22.55 | 15.8 | 16.30 | 23.35 |
| Diameter Outer | 15.8 | 22.55 | 15.8 | 22.55 | 65 |
| Length | 153 | 153 | 33.6 | 25.6 | 16 |
| Width | 44.5 | 44.5 | ― | ― | ― |
| Thickness | 8.0 | 8.0 | ― | ― | ― |
| Mesh size | 0.9~5.2 | 1.3~5.3 | 0.3~0.9 | 0.9~1.3 | 1.3~3.7 |
Table 3.
Material properties of roller chain for FEM analysis.
| Items | Plate | Pin | Bush | Roller |
|---|---|---|---|---|
| Material (JIS) | SS640 | SCM435 | SCM435 | S45C |
| Young’s modulus [GPa] E | 206 | 206 | 206 | 206 |
| Poisson’s ratio ν | 0.3 | 0.3 | 0.3 | 0.3 |
| Yield stress [MPa] | 970 | 1080 | 1390 | 780 |
| Tensile strength [MPa] | 1100 | 1180 | 1666 | 1012 |
| Friction coefficient μ | 0.3 | 0.3 | 0.3 | 0.3 |
Table 4.
Maximum stress σθmax and minimum stress σθmin, mean stress σθm and stress amplitude σθa for bush [MPa].
Table 4.
Maximum stress σθmax and minimum stress σθmin, mean stress σθm and stress amplitude σθa for bush [MPa].
| Position | σθ max | σθ min | σθ m | σθ a | SF |
|---|---|---|---|---|---|
| (1) | 638 | 15 | 327 | 312 | 1.45 |
| (2) | 343 | 14 | 179 | 165 | 2.73 |
| (3) | −1293 | −1923 | −1608 | 315 | - |
| (4) | −1207 | −1499 | −1353 | 146 | - |
| (5) | −830 | −1267 | −1049 | 219 | - |
Table 5.
Maximum stress σθ max σθ max and minimum stress σθ min, mean stress σθ m and stress amplitude σθ a for inner plate [MPa].
Table 5.
Maximum stress σθ max σθ max and minimum stress σθ min, mean stress σθ m and stress amplitude σθ a for inner plate [MPa].
| Position | σθ max | σθ min | σθ m | σθ a | SF |
|---|---|---|---|---|---|
| (1) | 931 | 620 | 776 | 156 | 0.94 |
| (2) | 862 | 647 | 755 | 108 | 1.10 |
| (3) | 808 | 637 | 723 | 86 | 1.16 |
| (4) | 598 | 177 | 388 | 211 | 1.23 |
| (5) | 663 | 346 | 505 | 159 | 1.19 |
Table 6.
Maximum stress σθ max and minimum stress σθ min, mean stress σθ m and stress amplitude σθ a for outer plate [MPa].
Table 6.
Maximum stress σθ max and minimum stress σθ min, mean stress σθ m and stress amplitude σθ a for outer plate [MPa].
| Position | σθ max | σθ min | σθ m | σθ a | SF |
|---|---|---|---|---|---|
| (1) | 792 | 443 | 617 | 175 | 1.06 |
| (2) | 688 | 639 | 664 | 25 | 1.52 |
| (3) | 701 | 658 | 680 | 22 | 1.50 |
| (4) | 717 | 568 | 643 | 75 | 1.28 |
| (5) | 627 | 458 | 543 | 85 | 1.44 |
Table 7.
Maximum stress and minimum stress , mean stress and stress amplitude in Figure 12 [MPa].
Table 7.
Maximum stress and minimum stress , mean stress and stress amplitude in Figure 12 [MPa].
| Model | Position | σθ max | σθ min | σθ m | σθ a | SF |
|---|---|---|---|---|---|---|
| 2D holed plate model | (1) | 233 | 0 | 117 | 117 | 2.70 |
| 2D disk fitting plate model | (1) | 799 | 763 | 781 | 18 | 1.31 |
| (2) | 733 | 698 | 716 | 18 | 1.44 | |
| (3) | 733 | 675 | 704 | 29 | 1.43 |
Table 8.
Strains of three kinds, maximum plastic strain εθp max, minimum plastic strain εθp min, and plastic strain amplitude Δεθp in the three components, and comparing with the evaluation by stresses.
Table 8.
Strains of three kinds, maximum plastic strain εθp max, minimum plastic strain εθp min, and plastic strain amplitude Δεθp in the three components, and comparing with the evaluation by stresses.
| Component | Plastic Strain [%] | Stress [MPa] | |||||
|---|---|---|---|---|---|---|---|
| /0.5 | σθ m | σθ a | SF | ||||
| Bush | 0 | −0.0313 | 0.031 | 0.062 | 327 | 312 | 1.45 |
| Inner plate | 0.0146 | 0.0002 | 0.014 | 0.028 | 776 | 156 | 0.94 |
| Outer plate | 0.567 | 0.559 | 0.008 | 0.016 | 617 | 175 | 1.06 |
© 2018 by the authors. Licensee MDPI, Basel, Switzerland. This article is an open access article distributed under the terms and conditions of the Creative Commons Attribution (CC BY) license (http://creativecommons.org/licenses/by/4.0/).
Share and Cite
MDPI and ACS Style
Saito, R.; Noda, N.-A.; Sano, Y.; Song, J.; Minami, T.; Birou, Y.; Miyagi, A.; Huang, Y. Fatigue Strength Analysis and Fatigue Damage Evaluation of Roller Chain. Metals 2018, 8, 847. https://doi.org/10.3390/met8100847
AMA Style
Saito R, Noda N-A, Sano Y, Song J, Minami T, Birou Y, Miyagi A, Huang Y. Fatigue Strength Analysis and Fatigue Damage Evaluation of Roller Chain. Metals. 2018; 8(10):847. https://doi.org/10.3390/met8100847
Chicago/Turabian StyleSaito, Ryoichi, Nao-Aki Noda, Yoshikazu Sano, Jian Song, Takeru Minami, Yuuka Birou, Arata Miyagi, and Yinsa Huang. 2018. "Fatigue Strength Analysis and Fatigue Damage Evaluation of Roller Chain" Metals 8, no. 10: 847. https://doi.org/10.3390/met8100847
Note that from the first issue of 2016, this journal uses article numbers instead of page numbers. See further details here.