Recycling Decisions in 2020, 2030, and 2040—When Can Substantial NdFeB Extraction be Expected in the EU?


1
Department of Business Administration and Environmental Management, Institute of Management and Economics, Clausthal University of Technology, Julius-Albert-Straße 2, 38678 Clausthal-Zellerfeld, Germany
2
Department of Mineral and Waste Processing, Institute of Mineral and Waste Processing, Waste Disposal and Geomechanics, Clausthal University of Technology, Walther-Nernst-Straße 9, 38678 Clausthal-Zellerfeld, Germany
*
Author to whom correspondence should be addressed.
Metals 2018, 8(11), 867; https://doi.org/10.3390/met8110867
Submission received: 30 September 2018
/
Revised: 12 October 2018
/
Accepted: 17 October 2018
/
Published: 24 October 2018
(This article belongs to the Special Issue Sustainable Utilization of Metals - Processing, Recovery and Recycling)
Abstract
:In recent years, China’s dominant role in the rare earth market and the associated impacts have strengthened the interest in the recovery of rare earth elements (REE) from secondary resources. Therefore, numerous research activities have been initiated aiming at the recovery of REEs from different types of waste streams, which includes, inter alia, neodymium-iron-boron (NdFeB) magnets. Although several research projects have successfully been completed, most experts do not expect an industrial implementation in Europe within the next years. This article analyses the reasons for this situation, addressing the availability of sufficient amounts of NdFeB wastes, the technology readiness level of the developed processes in Europe, as well as the economic aspects. Based on these analyses, an estimation of a realistic timeframe for the industrial implementation of NdFeB recycling in Europe is deduced and critically discussed.
1. Introduction
Since the 1980s, China has become the dominant producer of rare earth elements (REE), reaching market shares of up to 97% in 2010. In 2017, China mined about 81% of the world production (approx. 130,000 t/year), and is the only country that operates the full production chain from ores to REE metals at the industrial scale. Despite its monopolistic position, the REE prices remained stable on relatively low levels before 2010 due to the uncontrolled and unregulated growth of the Chinese REE industry, which resulted in low production costs but caused tremendous environmental damage. Therefore, the security of the supply was not questioned and interest in alternative REE sources was generally low. This situation changed drastically when China introduced export restrictions and duties for REEs in 2010, leading to massive price increases around 2011 and serious concerns about the security of the supply outside China. Since then, prices for rare earth compounds and metals declined significantly due to excess supply. Furthermore, China abandoned the export restrictions and duties in 2015 after the World Trade Organization upheld a ruling in favor of the United States, the European Union, and Japan’s claims that China violated trade rules. Nevertheless, there are still mid- and long-term supply risks, as China will presumably stay the dominant REE producer in the next decade [1,2,3].
In answer to China’s policy, many projects regarding primary production, recycling, substitution, as well as associated topics, such as the material flow analysis of REEs, have been initiated in recent years [4,5,6,7]. Regarding primary production, 442 projects were listed in December 2012 [4]. However, less than five have reached industrial scale, the most notable being Lynas Corporation Ltd., which has mining operations in Australia and refining operations in Malaysia [1]. As there are no competitive REE deposits in Europe [4], the European Union (EU) focuses on the recovery of REEs from secondary resources and substitution. Although first research and development projects have already been completed, only very few entered, or will enter, industrial scale [5,6,7].
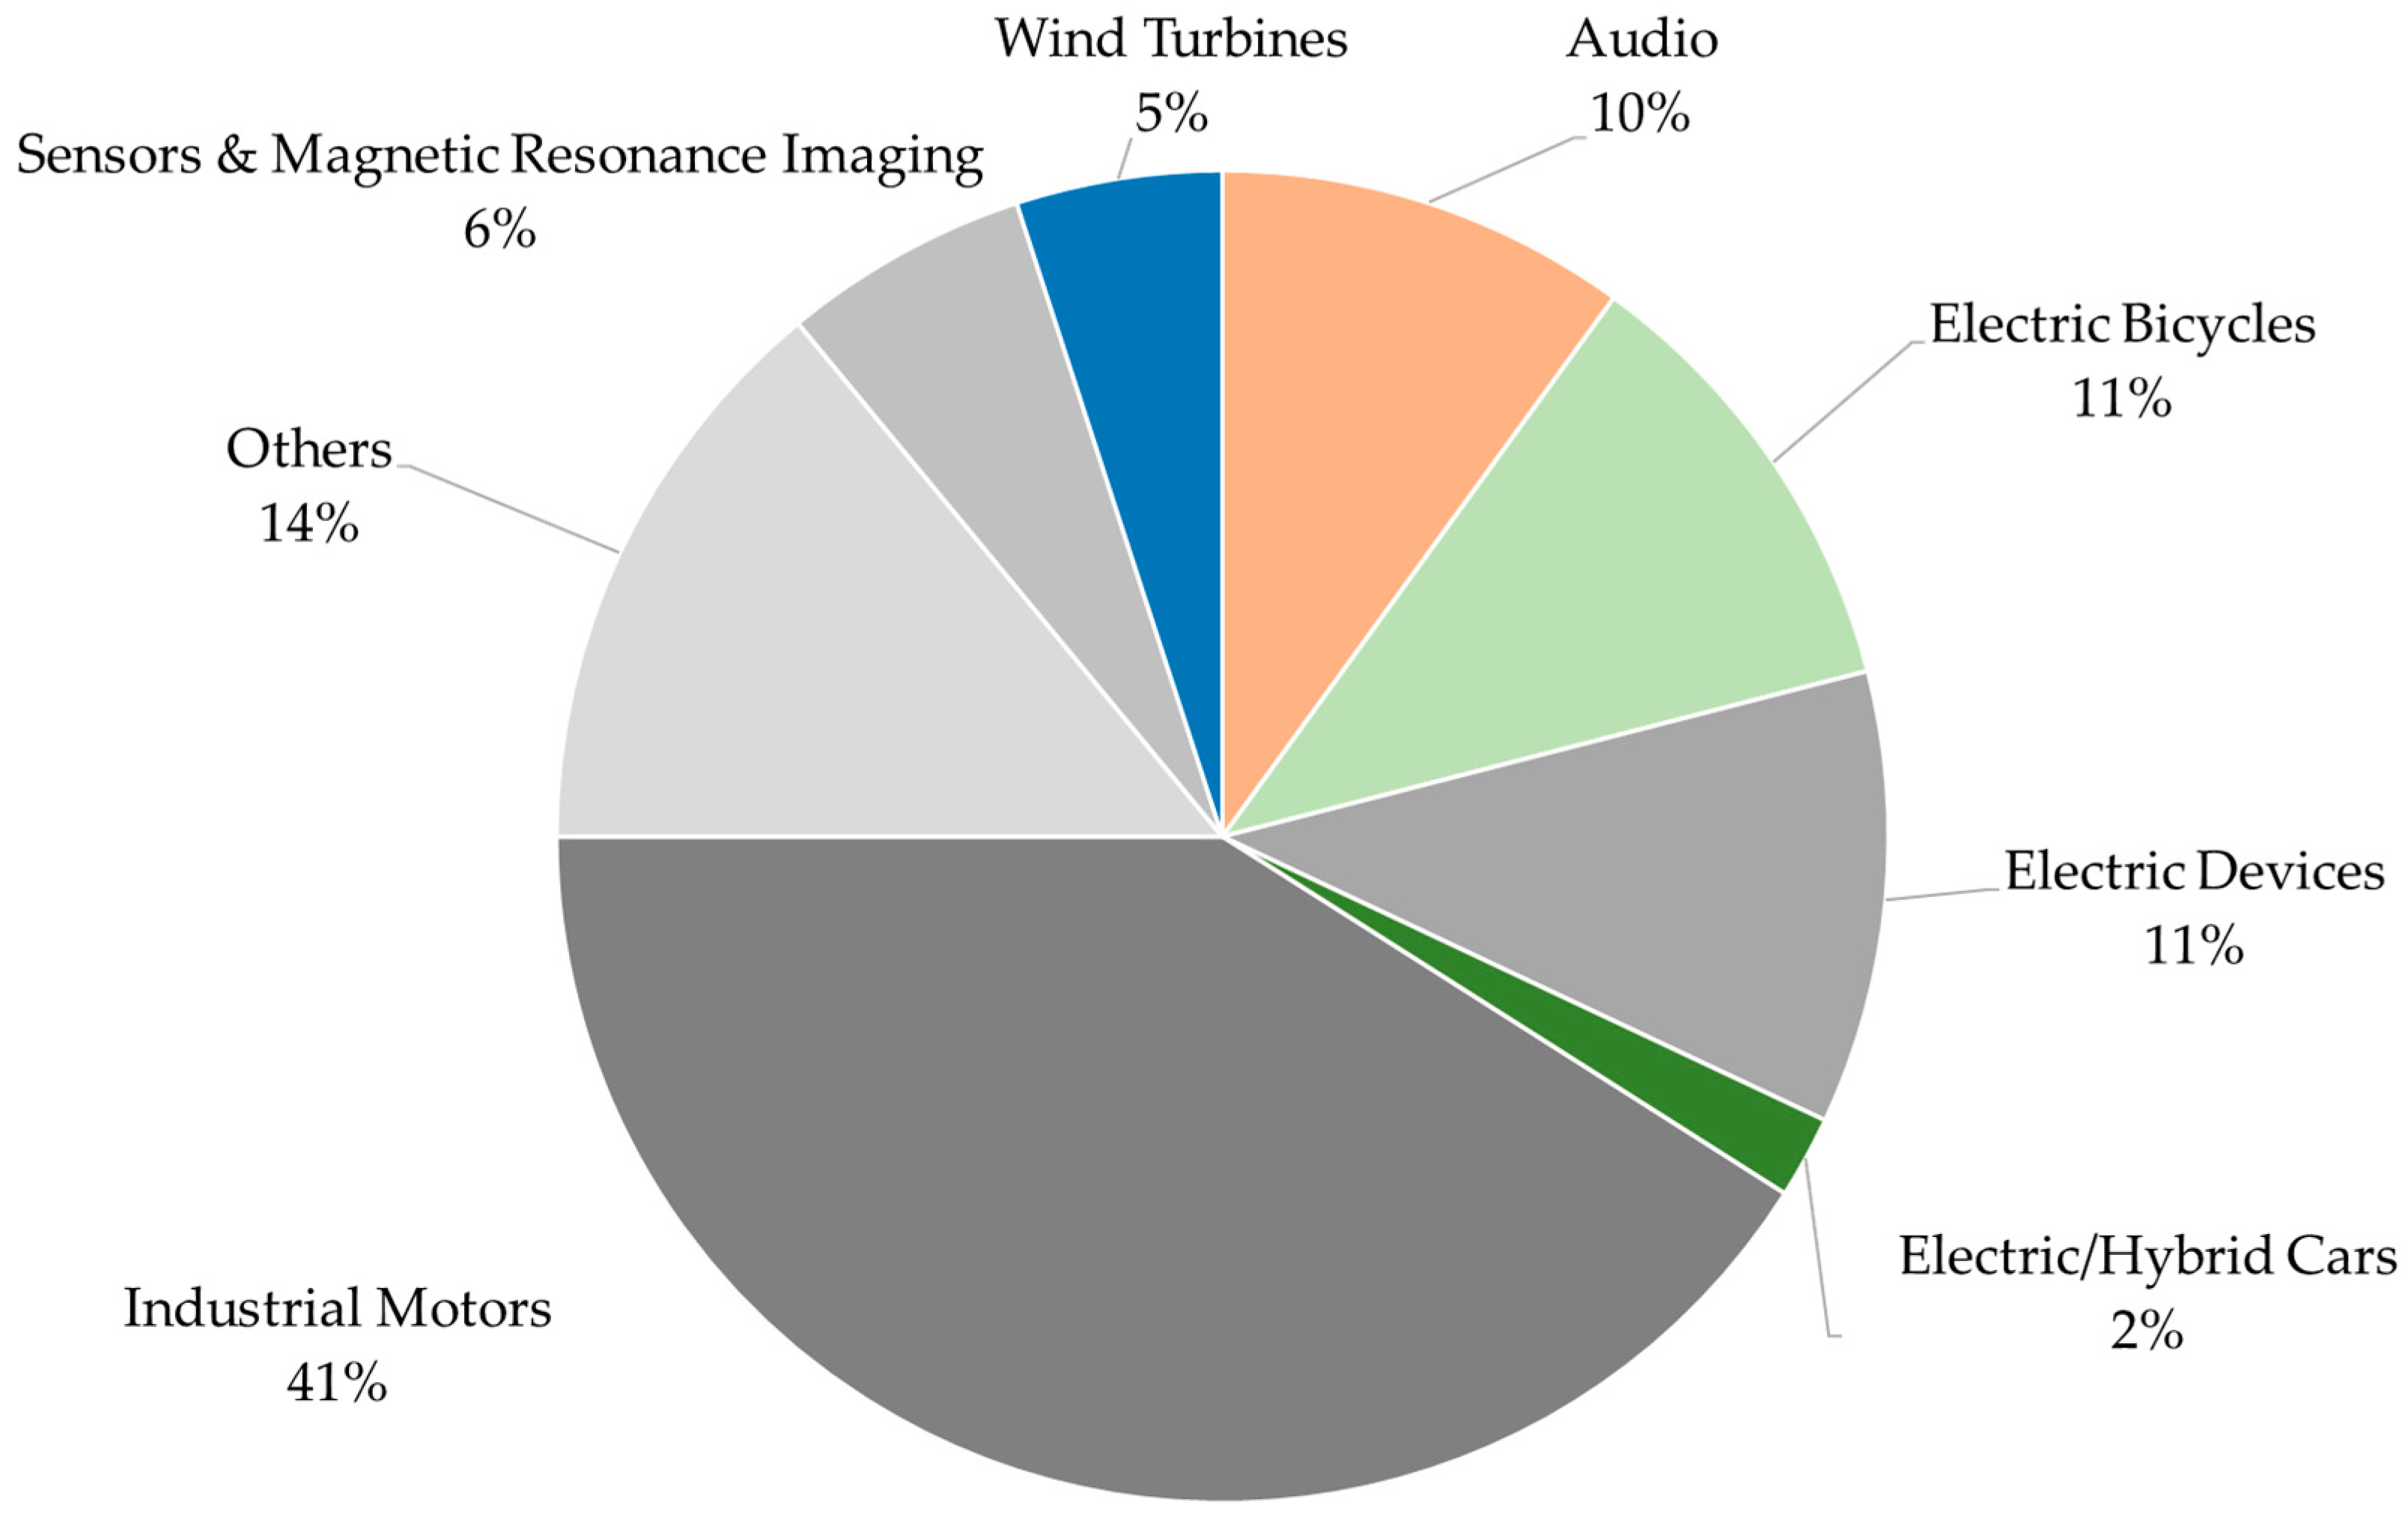
This article analyses the reasons for this development in the case of neodymium-iron-boron (NdFeB) magnets, which are the main application for the REEs neodymium (Nd) and dysprosium (Dy) and represent a major share of the REE market by volume (22%) as well as by value (37%) [8]. NdFeB magnets are currently the strongest permanent magnets and are used in various applications (see Figure 1). Due to the high number of applications and expected high growth rates, mainly driven by electromobility and wind turbines, NdFeB magnets presumably bear a high recycling potential [9,10].
After providing background knowledge about NdFeB magnets (Section 2), in this study, an attempt was made to enlighten this contradictory situation by using a holistic approach, starting with an estimation of the theoretical European recycling potential until 2040 (Section 3). Based on this, a more realistic scenario for the availability of NdFeB scrap is deduced, considering technological as well as economic aspects (Section 4). In Section 5, the implications are critically discussed.
2. NdFeB Magnets
Sintered NdFeB magnets are the strongest permanent magnets available today. Global production in 2014 was 112,000 t, of which about 88% were produced in China, followed by Japan. Europe and other regions have only minor market shares [12].
The excellent magnetic properties can be traced back to the strongly magnetic matrix phase Nd2Fe14B, featuring high saturation polarization and high magnetic anisotropy. Because of the low Curie temperature and low corrosion resistance of pure Nd2Fe14B, the properties are usually enhanced by alloying other REEs and cobalt. Typically, the alloys contain between 60–70 wt% iron (Fe), 28–35 wt% REEs (Pr, Nd, Tb, and Dy), 1–2 wt% boron (B), and 0–4 wt% cobalt (Co). The benefit of adding Dy in place of Nd is that it improves coercivity and therefore temperature tolerance. At the highest end of possible operating temperatures (approx. 200 °C), NdFeB magnets contain up to 10 wt% Dy. Terbium (Tb) can perform in a similar function but is rarely used due to its high price. Praseodymium (Pr) can directly substitute Nd to some extent without a severe impact on the magnetic properties. Co is commonly added to improve the corrosion resistance. For further improvement of the corrosion resistance, the magnets are phosphated or coated with organic or metallic coatings [6].
The most important trend in research, development, and production of sintered NdFeB magnets aims at an increase in coercivity using less Dy for economic reasons, as well as minimization of the related remanence losses. The most promising approaches to achieve this target are a further reduction of the grain size and the grain boundary diffusion process. Though the first approach has not been industrially implemented so far, the grain boundary diffusion process was introduced industrially some years ago [13].
3. Theoretical Recycling Potential of NdFeB Magnets in the European Union until 2040
In this section, the theoretical recycling potential of NdFeB magnets from the main applications, being electric vehicles (propulsion motors), auxiliary motors in passenger cars (electric and with internal combustion engine), electric two-wheeled vehicles, industrial motors, wind turbines, magnetic resonance imaging (MRI), hard disk drives (HDD), and audio devices, will be estimated for the years 2018–2040. As the relative share of other applications (currently 14%) is supposed to decrease due to expected high growth rates of electromobility and wind power [10], they are excluded.
The theoretical recycling potential was defined as the total amount of NdFeB magnets from end-of-life applications excluding post-production wastes. Post-production wastes were not considered as their amount of approx. 60 t/year [14] was low in comparison to the potential from post-consumer wastes (see Section 3.4) and was not expected to increase in the EU. To establish a benchmark, in this section, it was assumed that there were no losses through export and that 100% of the products were recycled after their life cycle, with a technical recycling efficiency of 100%. In this way, the theoretical recycling potential of NdFeB magnets could be assessed. More realistic recycling rates were later assumed in Section 4 for a direct comparison. The period under review was chosen up to the year 2040 to take into account, on the one hand, the long life cycle of major applications and, on the other hand, to have an acceptable forecast accuracy. A possible substitution of NdFeB magnets was not considered as alternative technologies are often less efficient (e.g., permanent magnet-free propulsion motors for electric vehicles), and extreme price increases of NdFeB magnets, which would favor substitution, are unlikely. Furthermore, a replacement of NdFeB by new materials is not expected within the next years. Therefore, the introduction of a new magnet material would only significantly affect the market after our considered time horizon due to the long lifespan of most considered products. Regarding the magnet composition, a simplified REE composition of 32 wt% Nd and Dy, 67 wt% Fe, and 1 wt% B was assumed. As Pr and Tb are minor constituents and substitutes for the aforementioned elements, they were not considered.
The most important assumptions for the calculations for each application are explained in Section 3.1. In Section 3.2, the sales data estimation is presented. These results are used to calculate the return flows in Section 3.3.
3.1. Key Assumptions for the Considered Applications
In Table 1, assumptions for average magnet content, percentage of application containing NdFeB magnets, Nd/Dy ratio, average lifespan, and related standard deviation are summarized. Further details are given in the following.
The product segment of electric vehicles is grouped into hybrid electric vehicles (HEV) and electric vehicles (EV). HEVs include mild, full, and plug-in hybrid electric vehicles. Whereas HEVs are typically equipped with permanent magnet motors, due to the limited space, some car manufacturers prefer magnet-free motors for EVs despite lower power densities and efficiencies. As propulsion motors are operated at elevated temperatures, comparatively high average Dy contents were assumed [15]. At present, even higher Dy concentrations up to 10% are observed, but these concentrations are expected to decrease (see Section 2).
All passenger vehicles contain auxiliary motors, which are partly equipped with NdFeB magnets. The magnet content varies. For this study, an average magnet content of 175 g/vehicle was assumed based on [9].
In the market of electric two-wheeled vehicles, a distinction is made between pedelecs, electric bicycles (e-bikes), electric scooters, and electric motor bicycles. Pedelecs require pedalling to activate the motor. In contrast, e-bikes can drive solely electric without pedalling. It is important to note that the term e-bike is often synonymously used for pedelecs, e-bikes, and e-scooters in literature [38]. In this paper, only pedelecs and e-bikes were considered and summarized in the following under the term e-bikes. Electric scooters and electric motor bicycles represent niche markets in the EU and were therefore neglected. According to [39], since 2015 all electric bicycles are equipped with permanent magnet motors. In 2007, the share was 47.1%. For the calculations, a linear increase between 2007 and 2015 was assumed.
The main application of NdFeB magnets is in industrial motors (see Figure 1). They exist in a wide range of sizes and power classes, and are used, for example, in conveyers, pumps, and robots. The data and assumptions were mainly based on a study conducted in Germany by the Institute for Applied Ecology [25].
Currently, three types of wind turbines are produced: Traditional drive train, direct drive, and hybrid systems. Only the last two designs contain NdFeB magnets. Direct drive systems require less maintenance than the other systems as they operate without gears. Therefore, they are the preferred technology for the offshore sector [40]. In contrast to most other applications, a detailed database of installed on- and offshore wind turbines in Europe is available and enabled a direct assignment of the respective magnet content.
According to field strength, magnetic resonance imaging (MRI) devices can be classified into low-, mid-, and high-field systems. Only low-field systems contain NdFeB magnets, whereas the other systems use electromagnets. The global compound annual growth rate is estimated at 3% including the high-growth markets, India and China [41]. As this study focusses on the EU, a lower annual growth rate of 2% was assumed.
While e-bikes, electric vehicles, and wind turbines represent fast growing markets, the market share of hard disk drives (HDD) is declining [36]. They are continuously replaced by faster solid-state-drives (SSD), which do not contain magnets. The HDDs are divided into 2.5′′ and 3.5′′ drives with global market shares of 40% and 60%, respectively [35].
3.2. Methodology for the Prediction of Sales Data
The general approach to predict the future sales in the different industrial branches is to extrapolate the sales trends from a combination of past sales data and available forecasts.
As an example, the prediction of future HDD sales is outlined. Figure 2 shows exemplarily our predicted sales data for HDDs for the EU market. The data was based on past sales and a prediction from a worldwide study published by Statista [36]. We assumed a proportional relationship between sales and gross domestic product (GDP) in a region, allowing the estimate of sales on the EU market from the global market. Utilizing annual GDP data [26], we derived the annual GDPEU/GDPWorld-ratio to receive the portion of HDD sales in the EU market. For example, in 2016 the EU accounted for approx. 21% of the global GDP, leading to the assumption that 90.4 million out of the 424.1 million HDDs were sold in this market. In Figure 2, the resulting sales data is depicted (blue diamonds).
It is clear that due to the technical advantages of SSDs over HDDs, the latter experienced a declining market share starting from around the year 2010. To capture this trend, we used a multinomial least-square fit with an exponential estimation function to predict the sales () in the year ():
It can be expected [42] that HDD sales will decline and slowly approach zero as customers switch to the new SSD technology. The function given in Formula (1) was therefore chosen for its asymptotical properties. It is well known that an exponential function of this type can be linearized to find the unknown parameters and by ordinary least squares. The best-fit parameters were (t-Test, p < 0.000) and (t-Test, p < 0.000), and resulted in an adjusted R-squared value of 0.9998. In Figure 2, the consequential estimation function (red curve) and the corresponding sales values (red diamonds) are depicted.
If the trend for other applications was not clearly asymptotical, polynomial estimation functions were more suitable for complex trends and were selected. A similar approach was used for other applications in the case of incomplete sales data to close gaps via interpolation. Whenever forecasts on sales were available, the data points were incorporated into the predictions.
By applying this method, we were able to estimate annual sales for the time span until 2040, which was relevant to our return flow calculations. It should be noted that a possible increase in uncertainty for sales estimates in the distant future is unproblematic because the corresponding return flows will not be relevant for the considered time span.
3.3. Methodology for the Calculation of Return Flows
To illustrate the calculation of return flows, we utilized the following example. Sales data for the years 2015–2018 were considered: In the year 2015, sales amounted to 1000 units, in the year 2016, to 3000 and, after a year without sales, 5000 units were sold in the year 2018.
We assumed the lifetime to be normally distributed with mean and standard deviation . Therefore, the return year of unit was a normally distributed random variable , where was the sales year of that unit . In general, the probability density function was given by Formula (2):
The three distinct probability density functions for the units 1 to 1000 with sales year , the units 1001 to 4000 with and the units 4001 to 9000 with are shown in Figure 3. As we can see from Figure 3, eventual inaccuracies, caused by a negative lifetime, have a probability close to 0%. With the expected lifetimes, considered in the real data set, being larger than , the probability was even lower than in this example.
The expected returns in a specific year (i.e., returns between and ) were then given by Formula (3):
Following the example, we expect units to return in the year 2022. A simulation of the exemplary sales data can illustrate the result. In Figure 4, we see the absolute returns obtained from the above probability densities. The blue bars show the returns of the 1000 units that where produced in 2015, the red bars the returns of the 3000 units produced in 2016, and the orange bars the returns of the 5000 units that were produced in the year 2018. In 2022, the returns amounted to 83 + 704 + 1145 units, which were produced in the years 2015, 2016, and 2018, respectively. The resulting 1932 units were close to the theoretical value 1929.38 and we could expect a convergence to the latter value when averaging multiple simulations.
This methodology was applied to the real sales data we derived in the previous section for all sources of NdFeB magnets. The usual timeframe of input data was 1995–2040 and the returns were calculated for the years 2018–2040.
3.4. Results
By applying this stochastic approach to the sales data from Section 3.2, we obtained the expected unit returns for the desired years. Both are shown in Figure 5. Depending on the average lifespan, the sales trends were only depicted for their relevant time spans. For example, in case of wind turbines, the average lifespan was years. Consequently, only sales data until around 2025 will be impactful for the return flow estimates.
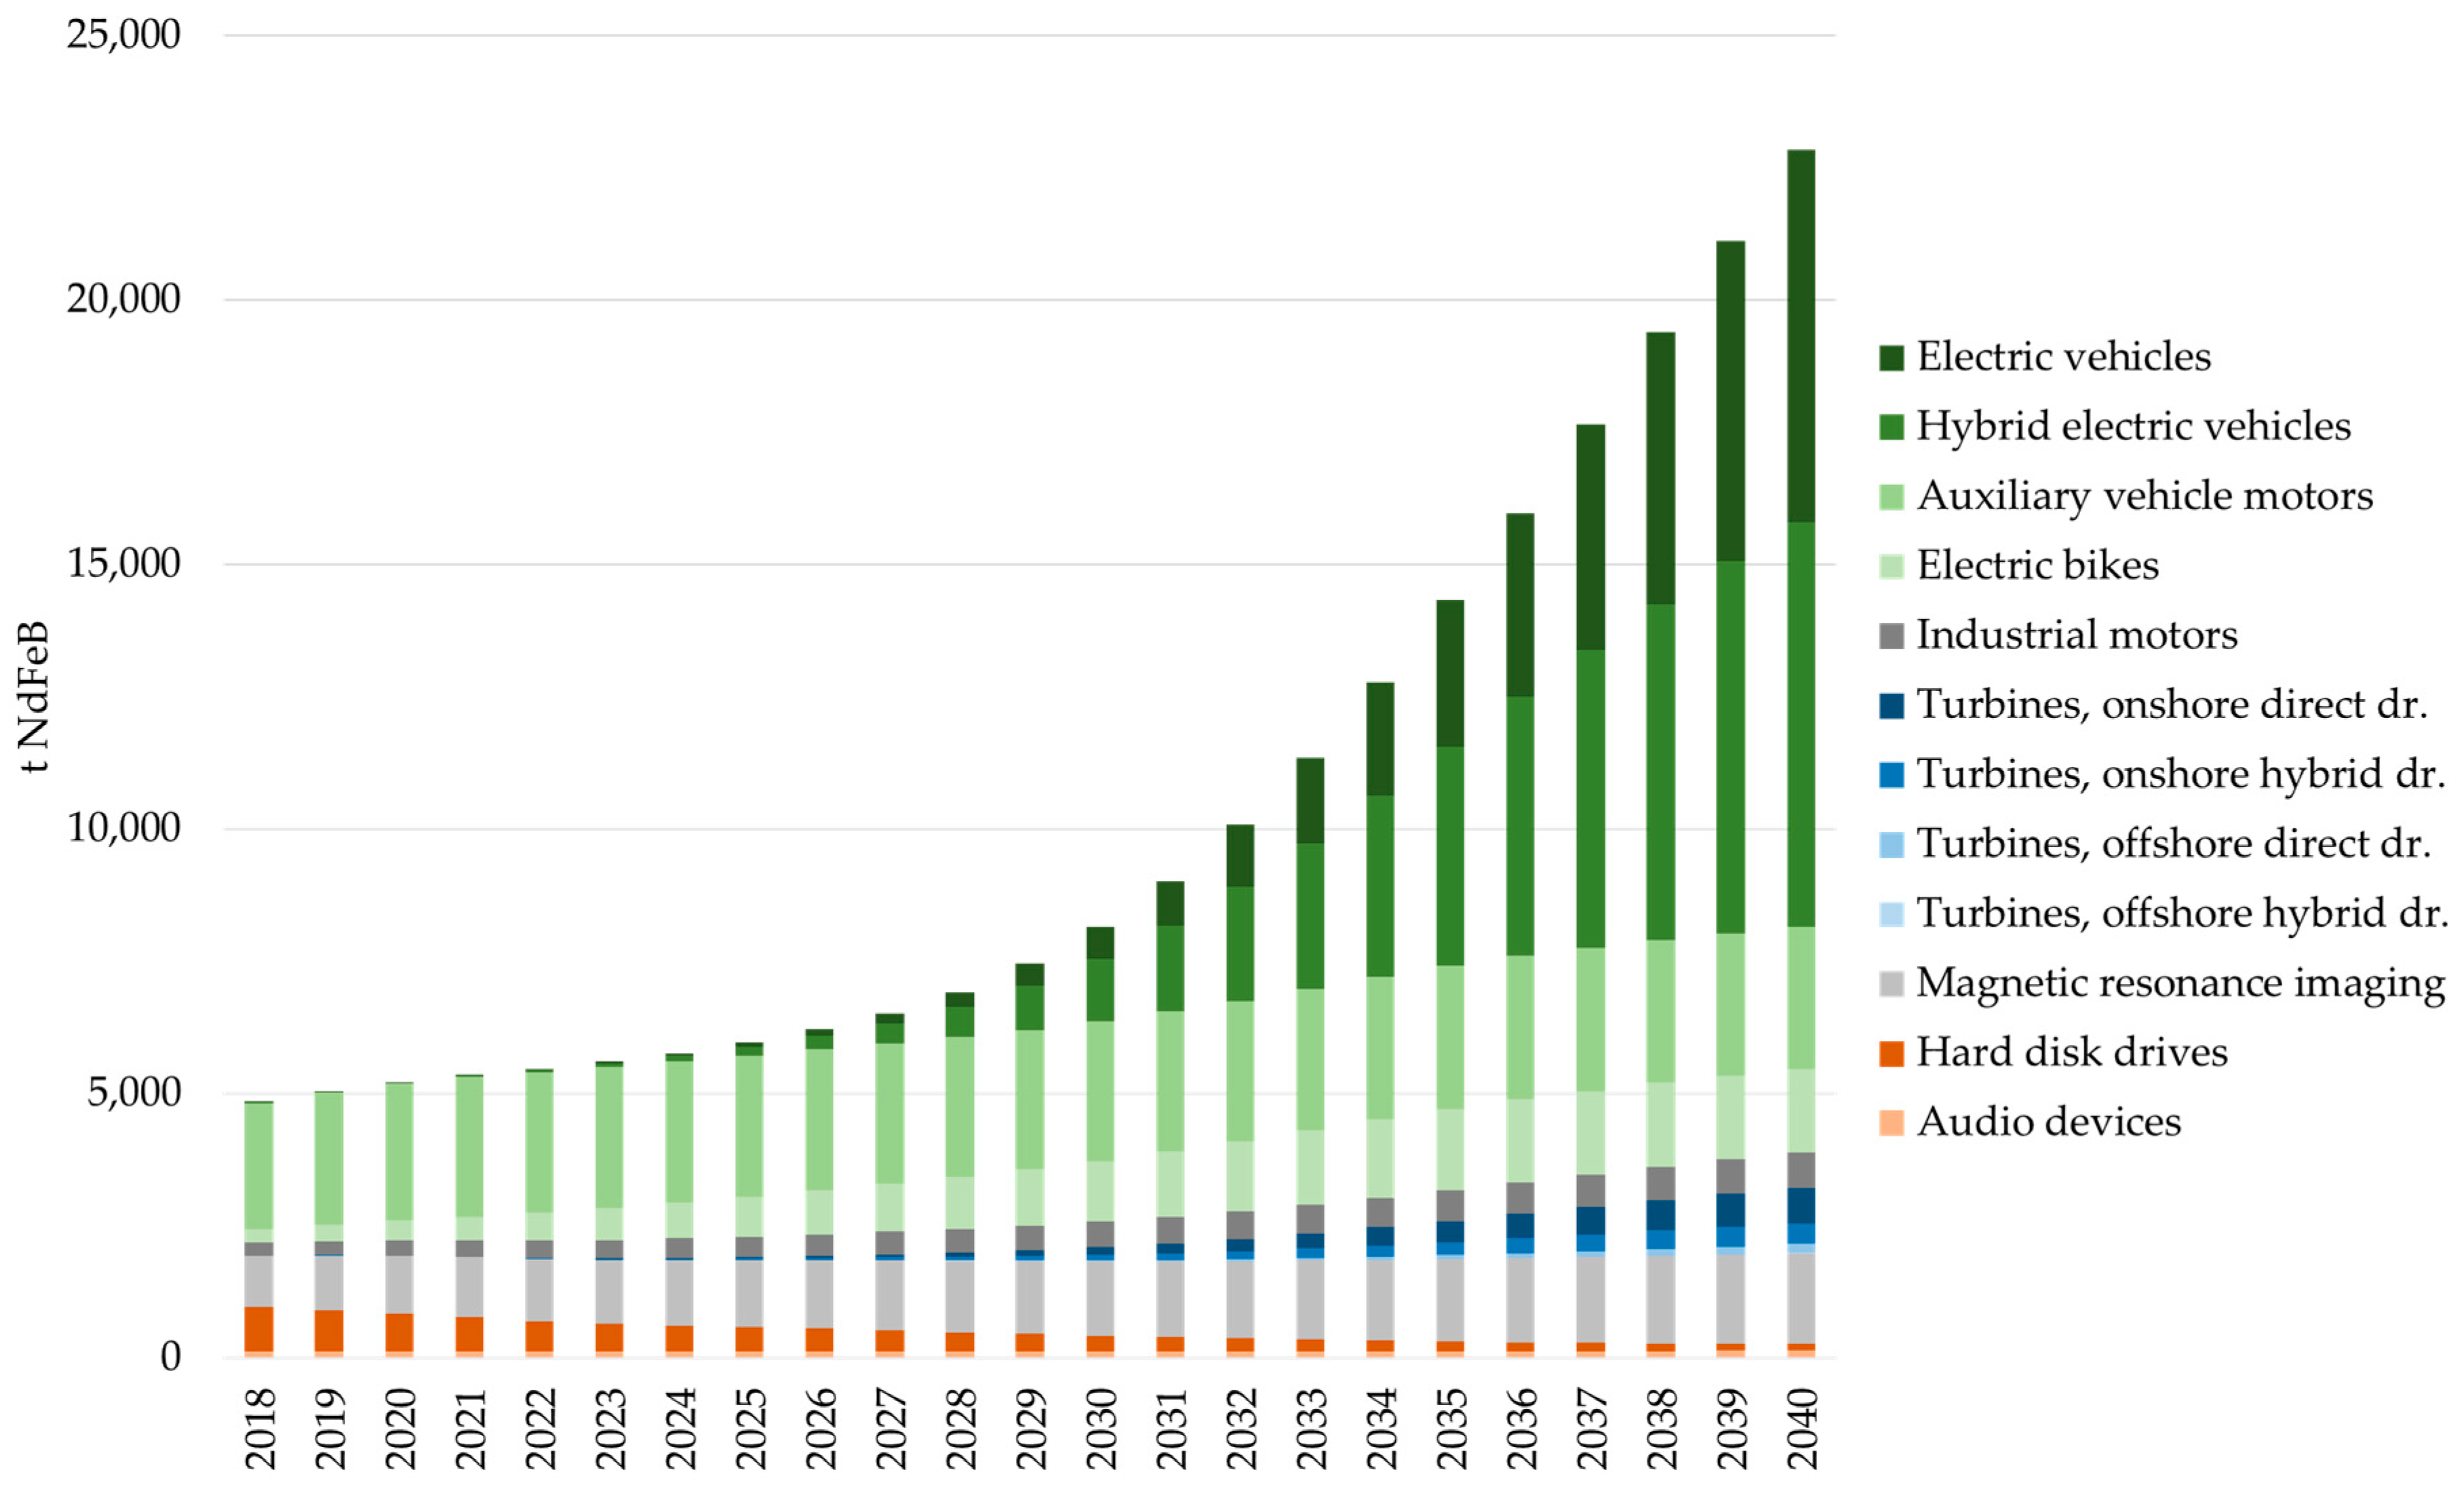
Considering the magnet content per unit (see Table 1), we obtained the resulting amounts of magnets per application in tons per year (Figure 6). It can be seen that the annual theoretical recycling potential increases only slightly in the next 10 years. In this first period, auxiliary vehicle motors, magnet resonance imaging, and electronic devices dominate. From 2028 on, a strong increase can be expected, which is mainly caused by the expected market penetration of (H)EVs and e-bikes. The share of wind turbines will increase from 2030, but remains comparatively low until 2040. The total theoretical recycling potential from 2016–2040 is about 233,000 t of NdFeB, corresponding to 66,600 t Nd and 7900 t Dy.
4. Estimation of the Practical Recycling Potential in the European Union until 2040
The recycling chain of NdFeB magnets consists of the steps: Collection, magnet extraction, and recycling of the extracted magnets, and was recently reviewed by [8]. According to this review, currently, no recycling of NdFeB wastes takes place. However, our own market studies, in collaboration with scrap dealers and electronic scrap recycling companies, revealed that in today’s industrial practice, collection of post-production wastes and limited extraction of NdFeB magnets from different applications takes place in the EU [14,43,44]. The magnet scraps are exported to China and Japan for metallurgical recycling. At present, approximately 150 t are exported annually, whereof about 40% originate from magnet production. Whereas the amount of production scrap has been relatively constant in recent years, increasing amounts of scrap from other applications, such as HDDs, MRI devices, and wind turbines, are observed [14,43].
The low traded amount of NdFeB wastes in comparison to the theoretical potential indicates that an extraction is not economic in most cases. The economic feasibility of the magnet extraction depends on the market prices for NdFeB scraps, which are strongly connected to the REE prices, and the extraction costs. The scrap prices fluctuated between 4 and 15 US$/kg in the last years [43].
For the recycling of extracted magnets, different approaches are currently under development in Europe, which can be classified into direct reuse, reprocessing of the alloys, and raw material recovery, all bearing a series of advantages and disadvantages. At present, none of the approaches is developed beyond pilot scale [5,8,15].
Theoretically, a direct reuse of the magnets would be economically and environmentally the most favourable way of recycling, due to the low energy demand as well as consumption of auxiliary and operating materials. However, in practice, reuse cannot be expected due to progress of development regarding NdFeB magnets and applications, difficulties in the non-destructive extraction of the brittle magnets, and cleaning without compromising the dimensions [5,8,15].
Prerequisites for reprocessing of the alloy are that magnet scraps are of known and homogeneous composition and a thorough removal of any impurities, such as glue residues and coatings, is undertaken, as the magnetic properties deteriorate even at low impurity concentrations (ppm range). For the actual reprocessing of the magnetic alloys, several processes are under investigation, such as re-melting of the alloy, purely mechanical comminution, and comminution after hydrogen decrepitation. All these options allow feeding of the cleaned magnet scrap into the established production chain for NdFeB magnets. The main drawback of these routes is that contamination with trace impurities cannot be prevented, which causes a deterioration of the magnetic properties. Therefore, reprocessing of alloys cannot be considered a practical way for the production of high-end magnets, a market segment in which European producers are active [5,8,15].
For raw material recovery, various approaches and processes have been developed in recent years, which can be classified into gas-phase extraction, pyrometallurgical methods, and hydrometallurgical methods. Despite disadvantages such as high consumption of chemicals and the production of wastewater, hydrometallurgical processes can be regarded as the most promising way. Reasons for this are their flexibility, with respect to the chemical composition of the wastes, impurity removal, and their ability to treat metallic and oxidized NdFeB wastes (e.g., grinding sludges from magnet production) [5,8,15].
Within the German research project “Recycling of components and strategic metals of electric drive motors”, a life cycle assessment (LCA) was conducted for reuse, reprocessing of the alloy by comminution after hydrogen decrepitation, and a hydrometallurgical process route. The LCA was carried out according to ISO 14040/44 based on small pilot-scale data and reviewed by an independent external expert. The LCA revealed that all these recycling options show clear environmental advantages in comparison to the primary production of neodymium and dysprosium [45].
4.1. Assumptions for the Practical Recycling Scenario
In the following, the assumptions for the realistic recycling scenario are explained for each application based on literature review, interviews with market participants, and our own investigations.
For electric motors, semi-automated extraction technologies for magnets from rotors were developed within a German research project, which can, in principal, be transferred to motors from other applications [15]. However, the scale-up to industrial scale will require at least several years. In case of electric motors, it was assumed that (partly) automated extraction technologies will be available from 2026 onwards at an industrial scale. Therefore, no recycling will take place before 2026 from electric motors. As a European-wide implementation of the extraction technology will require at least several years, a linearly increasing magnet extraction rate from 0% in 2025 to 50% in 2040 was assumed.
For (H)EVs a European recycling rate of 50% was adopted from [46] for all end-of-life vehicles. It was assumed that only traction motors will be extracted from vehicles and dismantled for specific treatment, whereas magnets from auxiliary motors will be lost in the shredding process. An economic assessment of the recycling of propulsion motors concluded that a magnet extraction is economically feasible [15].
For e-bikes, a significantly lower recycling rate of only 5% was estimated. Due to the lack of data on the market for second hand bikes, unknown disposal routes, and the young e-bike market, this rate is a noteworthy uncertainty factor in the calculations. From an economic point of view, magnet extraction is currently uneconomic considering German labour costs, but might be feasible in Eastern and Southern Europe [21].
In case of industrial motors, a recycling rate of 10% was assumed due to high export rate of second-hand motors to non-European countries [25]. Furthermore, the profitability strongly depends on the motor size. Therefore, only mid- and large-size motors were of interest.
In case of wind turbines, it was assumed that 90% of all wind turbines are recycled after their use in the EU, with a magnet extraction efficiency of 90% resulting in an overall rate of 81% from the theoretical potential. The high rates seem to be realistic as the owners are responsible for the dismantling of the turbines, reuse of the turbines in other wind parks after more than 20 years cannot be expected, and the high amounts of large magnets represent a significant monetary value.
Little information is available on the recycling of magnetic resonance imaging devices. As they occasionally appear on the scrap market [43], a recycling rate of 5% was assumed. Like industrial motors, many second-hand devices are probably exported to developing countries. The extraction of magnets from MRI devices requires demagnetization of the magnets to remove them from the steel frame, but has economic potential due to the high amount of magnets (2–3 t) per unit.
For electronic products, it was assumed that only magnets from hard disk drives are extracted to a certain extent, which already takes place today in sheltered workshops and by prison inmates in Germany, due to the lower labor costs in comparison to the regular labor market [44]. An extraction using regular workers is uneconomic [21]. An extraction of magnets from audio devices was neglected, as they do not appear on the scrap market due to the prohibitive extraction costs [21]. The extraction rate for HDDs was estimated to be 2% of the theoretical potential in the EU. According to our market research, the current extraction rate in Germany is approx. 5%, but this rate cannot be projected to the EU due to the lower recycling standards, especially in Eastern and Southern Europe.
4.2. Possible Scenario for the Availability of NdFeB Scrap in the EU
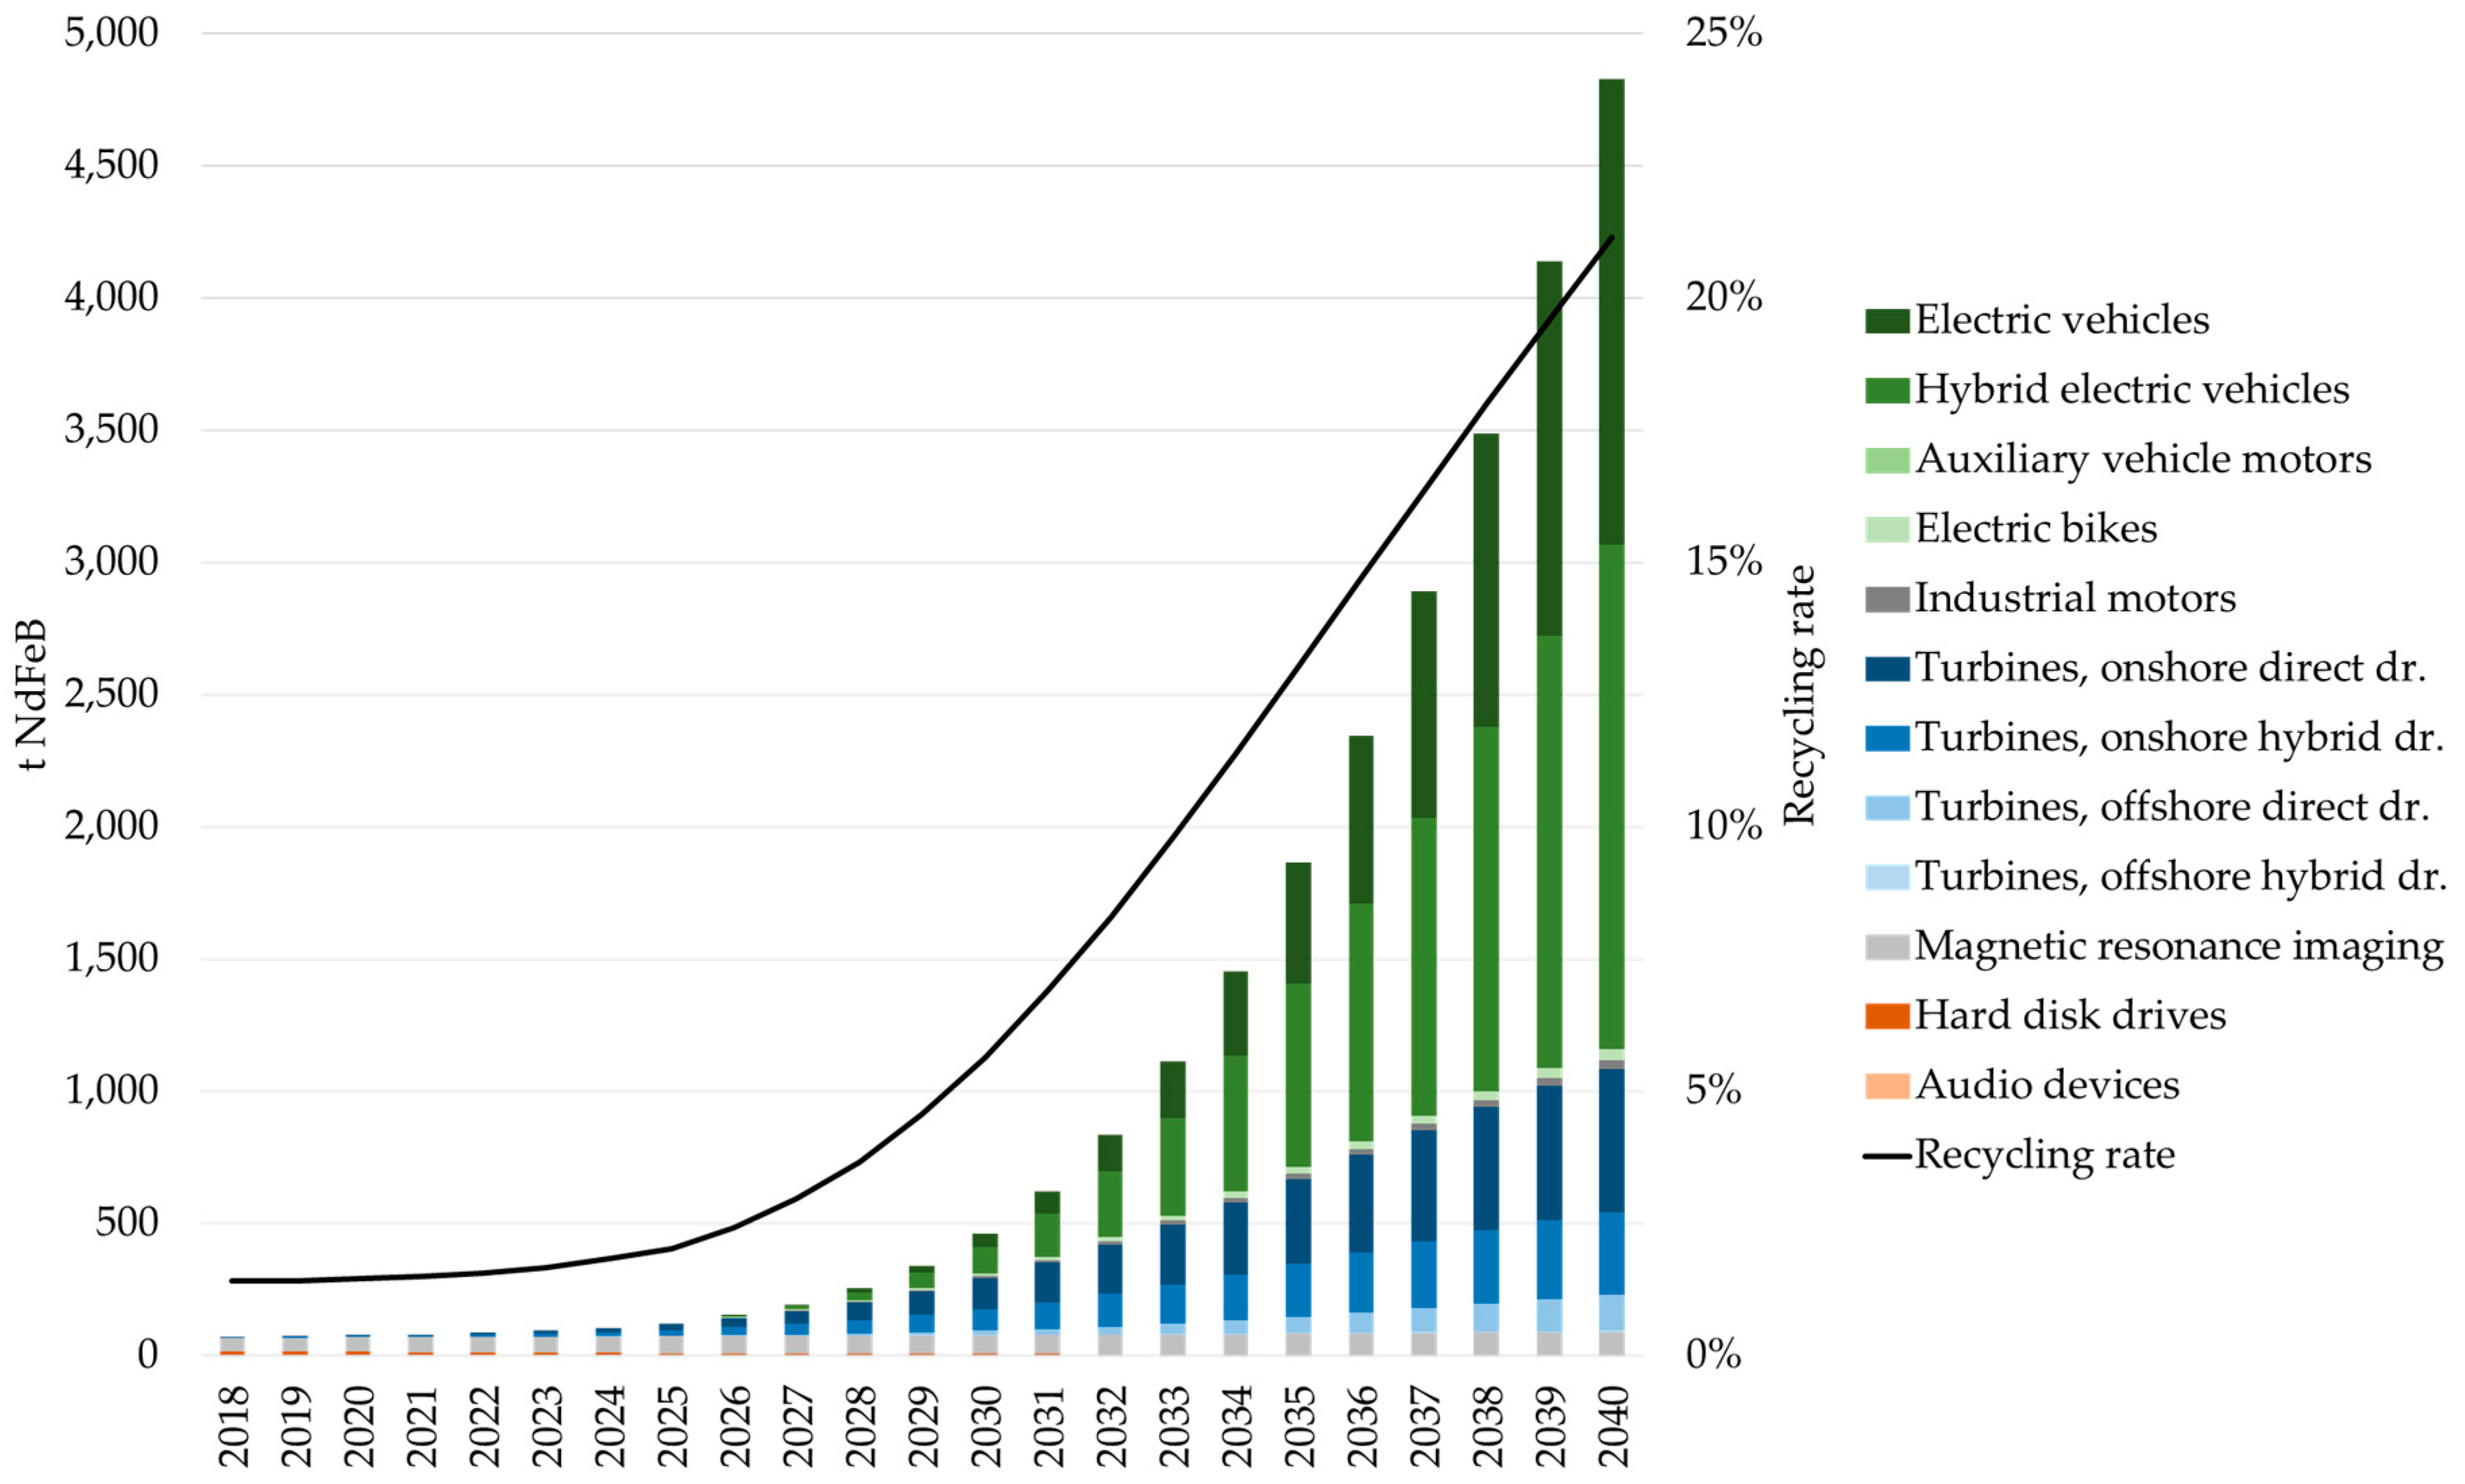
Based on the theoretical recycling potential and the assumptions in Section 4.1, we obtained the return flows depicted in Figure 7. The general trend was comparable with Figure 6, but on a much lower level. The scenario predicted an annual recycling rate increase from 1% to 21% of the theoretical potential. The overall recycling potential from 2018–2040 was about 25,700 t of NdFeB (see Table 2), corresponding to 7100 t Nd and 1100 t Dy. In comparison to the global consumption of these elements for NdFeB magnets, the impact on the REE market will be low. According to [10], the global demand for Nd/Pr and Dy/Tb was 28,900 t and 2000 t, respectively, in 2013, and is expected to increase to an annual demand of 62,400 t Nd/Pr and 7200 t Dy/Tb until 2035.
The highest recycling potential will stem from mobility and wind turbines, which shows strong growth after 2028. Before 2028, the amounts do not exceed 250 t/year, 1,000 t will be reached around 2033, which is considered the minimum amount for an industrial recycling plant [47]. The predicted return flows in 2018 are in accordance with the information we received from interviews with scrap dealers, who estimated the market volume to be 60–80 t without production wastes from magnet producers.
5. Discussion and Conclusions
Since the REE crisis, a lot of research regarding the recycling of NdFeB magnets has been conducted and several companies have discussed the development of NdFeB magnet recycling as a business segment. Despite all these activities, industrial recycling of NdFeB wastes does not take place in the EU. Instead, collected scrap is exported to China and Japan for recycling. This is desirable from an environmental point of view [15], but does not reduce the import dependencies of European companies, a proclaimed objective of many political initiatives.
This study shows that the main reason for this situation is the insufficient amount of NdFeB scrap to feed an industrial plant. According to our appraisal, the necessary volumes above 1000 t/year cannot be expected before 2033. Furthermore, at present, the necessary recycling technology is not available at an industrial scale in Europe. However, considering the predicted slow increase of available NdFeB waste in the upcoming years, there is enough time to scale-up the developed approaches.
Although NdFeB magnet recycling is currently not a profitable business segment for recycling companies, our forecast shows that a strong increase of the available scrap amounts can be expected in the future. Therefore, companies should regularly review industrial trends and scrap market developments to enter the market at an optimal time.
Regarding future research and development, our study shows that an emphasis should be laid on an efficient extraction of NdFeB magnets from mobility applications and wind turbines. In comparison, most other applications are of minor importance for economic reasons, due to expected technological changes, and export to non-EU countries for second use.
Furthermore, a critical discussion regarding the funding of research and development in the field of metallurgical recycling of NdFeB magnets is necessary. Considering the small market share of European magnet producers (approx. 1%), the demand for neodymium and dysprosium metal, which are both primarily used for the production of NdFeB magnets, is low. Both metals are mainly imported to the EU in the form of magnets or magnet containing products. Therefore, the future markets for recycled neodymium and dysprosium are presumably in Asia.
However, a funding stop would inevitably lead to a major loss of metallurgical and material expertise in Europe, which has been (re)built in recent years, and to a further consolidation of Europe’s dependency on Asia. Considering the importance of NdFeB magnets for the European automotive and other industries, this development bears major risks. However, to avert these risks a fundamental reorientation in the European raw material policy would be required.
Author Contributions
H.Y.S.-M. and T.E. conceived the paper. T.E. wrote Section 1, Section 2 and Section 5 and interviewed the industry experts. M.F.H. and M.V.R. conducted the literature review. M.V.R. performed the calculations in Section 3 and Section 4, which were supervised by H.Y.S.-M. and wrote Section 3.2 and Section 3.3. T.E. and M.V.R. wrote all other sections.
Funding
This research received no external funding.
Acknowledgments
We acknowledge support by Open Access Publishing Fund of Clausthal University of Technology.
Conflicts of Interest
The authors declare no conflict of interest.
References
- Ober, J.A. Mineral Commodity Summaries. 2018. Available online: https://pubs.er.usgs.gov/publication/70194932 (accessed on 18 October 2018).
- Schüler-Zhou, Y. Chinas Rohstoffpolitik Für Seltene Erden. 2018. Available online: https://www.giga-hamburg.de/en/publication/chinas-rohstoffpolitik-f%C3%BCr-seltene-erden (accessed on 18 October 2018).
- Rare Earth Elements: A Review of Production, Processing, Recycling, and Associated Environmental Issues. 2012. Available online: https://nepis.epa.gov/Exe/ZyPURL.cgi?Dockey=P100EUBC.txt (accessed on 26 September 2018).
- Elsner, H. Seltene Erden–Stand heute. In Proceedings of the GDMB Special Metals Expert Committee, Schwäbisch Gmünd, Germany, 8 October 2015. [Google Scholar]
- Binnemans, K.; Jones, P.T.; Blanpain, B.; van Gerven, T.; Yang, Y.; Walton, A.; Buchert, M. Recycling of rare earths: A critical review. J. Clean. Prod. 2013, 51, 1–22. [Google Scholar] [CrossRef]
- Lucas, J.; Lucas, P.; Le Mercier, T.; Rollat, A.; Davenport, W. Rare Earth Recycle; Elsevier: Amsterdam, The Netherlands, 2015; pp. 333–350. [Google Scholar]
- Jowitt, S.M.; Werner, T.T.; Weng, Z.; Mudd, G.M. Recycling of the rare earth elements. Curr. Opin. Green Sustain. Chem. 2018, 13, 1–7. [Google Scholar] [CrossRef]
- Yang, Y.; Walton, A.; Sheridan, R.; Güth, K.; Gauß, R.; Gutfleisch, O.; Buchert, M.; Steenari, B.-M.; van Gerven, T.; Jones, P.T.; et al. REE recovery from end-of-life NdFeB permanent magnet scrap: A critical review. J. Sustain. Metall. 2017, 3, 122–149. [Google Scholar] [CrossRef]
- Glöser-Chahoud, S.; Pfaff, M.; Tercero Espinoza, L.A.; Faulstich, M. Dynamische materialfluss-analyse der magnetwerkstoffe neodym und dysprosium in Deutschland. In Proceedings of the 4th Symposium Rohstoffeffizienz und Rohstoffeinnovationen, Tutzing, Germany, 17–18 February 2016; Teipel, U., Reller, A., Eds.; Fraunhofer Verlag: Stuttgart, Germany, 2016; pp. 258–288. [Google Scholar]
- Marscheider-Weidemann, F.; Langkau, S.; Hummen, T.; Erdmann, L.; Tercero Espinoza, L.A.; Angerer, G.; Marwede, M.; Benecke, S. Rohstoffe Für Zukunftstechnologien 2016; Deutsche Rohstoffagentur (DERA) in der Bundesanstalt für Geowissenschaften und Rohstoffe (BGR): Berlin, Germany, 2016. [Google Scholar]
- Globale Verwendungsstrukturen der Magnetwerkstoffe Neodym und Dysprosium: Eine szenariobasierte Analyse der Auswirkung der Diffusion der Elektromobilität auf den Bedarf an Seltenen Erden. Available online: http://hdl.handle.net/10419/142767 (accessed on 18 October 2018).
- Global and China NdFeB Industry Report, 2015–2018. Available online: https://www.giiresearch.com/report/rinc312750-global-china-ndfeb-industry-report.html (accessed on 18 October 2018).
- Katter, M. Entwicklungstrends bei pulvermetallurgisch hergestellten Seltenerd-Dauermagneten. Fraunhofer Workshop Magnetwerkstoffe–vom Design bis zum Recycling. Available online: http://www.pulvermetallurgie.com/cms/File/Anmeldung_interaktiv.pdf (accessed on 23 October 2018).
- Elwert, T.; Clausthal University of Technology, Clausthal-Zellerfeld, Germany. Anon. Magnet Industry Expert. Personal communication, 2015. [Google Scholar]
- Elwert, T.; Goldmann, D.; Roemer, F.; Schwarz, S. Recycling of NdFeB magnets from electric drive motors of (hybrid) electric vehicles. J. Sustain. Metall. 2017, 3, 108–121. [Google Scholar] [CrossRef]
- Global EV Outlook 2017. 2017. Available online: https://www.iea.org/publications/freepublications/publication/GlobalEVOutlook2017.pdf (accessed on 18 October 2018).
- Prognose der Anteile verschiedener Automobil-Antriebsarten an den Kfz-Neuzulassungen in der Europäischen Union in den Jahren 2016 bis 2030. Available online: https://de.statista.com/statistik/daten/studie/666782/umfrage/automobil-antriebsarten-in-der-eu-prognose/ (accessed on 11 September 2018).
- Number of New Car Registrations in Germany from 1955 to 2019 (In Millions). Available online: https://www.statista.com/statistics/587730/new-car-registrations-germany/ (accessed on 11 September 2018).
- EU Passenger Car Production. Available online: https://www.acea.be/statistics/article/eu-passenger-car-production (accessed on 11 September 2018).
- The Automobile Industry Pocket Guide. Available online: https://www.acea.be/uploads/publications/ACEA_Pocket_Guide_2018-2019.pdf (accessed on 13 September 2018).
- Elwert, T.; Schwarz, S.; Bergamos, M.; Kammer, U. Entwicklung einer industriell umsetzbaren recycling-technologiekette für NdFeB-magnete—Semarec. In Recycling und Rohstoffe; Thiel, S., Thomé-Kozmiensky, E., Goldmann, D., Eds.; Thomé-Kozmiensky Verlag GmbH: Nietwerder, Germany, 2018; pp. 253–271. [Google Scholar]
- Number of electric bicycles sold in the European Union (EU) from 2006 to 2016, (in 1000 units). Available online: https://www.statista.com/statistics/397765/electric-bicycle-sales-in-the-european-union-eu/ (accessed on 11 September 2018).
- Bicycle Market 2017 Edition: Industry and Market Profile. Available online: http://www.conebi.eu/wp-content/uploads/2018/09/European-Bicyle-Industry-and-Market-Profile-2017-with-2016-data-update-September-2018.pdf (accessed on 11 September 2018).
- Zweirad-Industrie-Verband. Zahlen—Daten—Fakten zum Deutschen E-Bike-Markt 2017: E-Bikes mit Rekordzuwächsen. Available online: https://www.ziv-zweirad.de/fileadmin/redakteure/Downloads/Marktdaten/PM_2018_13.03._E-Bike-Markt_2017.pdf (accessed on 11 September 2018).
- Buchert, M.; Manhart, A.; Sutter, J. Untersuchung zu Seltenen Erden: Permanentmagnete im industriellen Einsatz in Baden-Württemberg: Freiburg. 2014. Available online: https://www.oeko.de//oekodoc/2053/2014-630-de.pdf (accessed on 18 October 2018).
- United Nations Conference on Trade and Development. Gross Domestic Product: Total and per Capita, Current and Constant (2010) Prices, Annual. Available online: http://unctadstat.unctad.org/wds/TableViewer/tableView.aspx?ReportId=96 (accessed on 11 September 2018).
- Wind in Power 2017: Annual Combined Onshore and Offshore Wind Energy Statistics. Available online: https://windeurope.org/wp-content/uploads/files/about-wind/statistics/WindEurope-Annual-Statistics-2017.pdf (accessed on 11 September 2018).
- Global Offshore Wind Farms Database. Available online: https://www.4coffshore.com/windfarms/ (accessed on 11 September 2018).
- Serrano-González, J.; Lacal-Arántegui, R. Technological evolution of onshore wind turbines-a market-based analysis. Wind Energy 2016, 19, 2171–2187. [Google Scholar] [CrossRef] [Green Version]
- Renewables 2017—Analysis and Forecasts to 2022. 2017. Available online: https://www.iea.org/publications/renewables2017/ (accessed on 18 October 2018).
- World Energy Outlook 2017. 2017. Available online: https://www.iea.org/weo2017/ (accessed on 18 October 2018).
- Wind Energy in Europe: Scenarios for 2030. Available online: https://windeurope.org/wp-content/uploads/files/about-wind/reports/Wind-energy-in-Europe-Scenarios-for-2030.pdf (accessed on 11 September 2018).
- Zepf, V. Das verkannte recyclingpotential der seltenen erden—quantitative ergebnisse für neodym in Deutschland. In Recycling und Rohstoffe; Thomé-Kozmiensky, K.J., Goldmann, D., Eds.; Thomé-Kozmiensky Verlag GmbH: Nietwerder, Germany, 2015; pp. 463–476. [Google Scholar]
- Elwert, T.; Hoffmann, M.; Schwarz, S. Can recycling of NdFeB magnets be expected in Europe before 2030? In EMC 2017 Proceedings; Waschki, U., Ed.; GDMB Verlag GmbH: Clausthal-Zellerfeld, Germany, 2017; Volume 3, pp. 1263–1278. [Google Scholar]
- WDC Unit Shipments of Hard Disk Drives (HDD) Worldwide by Size from 2013 to 2014 (In Millions). Available online: https://www.statista.com/statistics/407893/wdc-global-shipment-figures-for-hard-disk-drives/ (accessed on 11 September 2018).
- Worldwide Unit Shipments of Hard Disk drives (HDD) from 1976 to 2020 (In Millions). Available online: https://www.statista.com/statistics/398951/global-shipment-figures-for-hard-disk-drives/ (accessed on 11 September 2018).
- Schulze, R.; Buchert, M. Estimates of global REE recycling potentials from NdFeB magnet material. Resour. Conserv. Recycl. 2016, 113, 12–27. [Google Scholar] [CrossRef]
- Weinert, J.; VanGelder, E. Encyclopedia of Electrochemical Power Sources; Elsevier: Amsterdam, The Netherlands, 2009; pp. 292–301. [Google Scholar]
- Hoenderdaal, S.; Tercero Espinoza, L.; Marscheider-Weidemann, F.; Graus, W. Can a dysprosium shortage threaten green energy technologies? Energy 2013, 49, 344–355. [Google Scholar] [CrossRef]
- Lacal Arántegui, R.; Serrano González, J. The Technology, Market and Economic Aspects of Wind Energy in Europe. 2015. Available online: https://www.evwind.es/2015/06/26/the-technology-market-and-economic-aspects-of-wind-energy/52993 (accessed on 18 October 2018).
- Sriram Radhakrishnan. MRI System Market by Architecture Type (Open MRI and Close MRI), by Field Strength (High field system, Medium field system and Low Field System)—Global Opportunity Analysis and Industry Forecast 2014–2022. 2016. Available online: https://www.giiresearch.com/report/amr676714-mri-system-market-by-architecture-type-open-mri.html (accessed on 18 October 2018).
- Shipments of Hard and Solid State Disk (HDD/SSD) Drives Worldwide from 2015 to 2021 (In Millions). Available online: https://www.statista.com/statistics/285474/hdds-and-ssds-in-pcs-global-shipments-2012-2017/ (accessed on 29 September 2018).
- Elwert, T.; Clausthal University of Technology, Clausthal-Zellerfeld, Germany. Anon. Scrap Industry Expert. (Innova Recycling GmbH, Goslar, Germany). Personal communication, 2016. [Google Scholar]
- Elwert, T.; Clausthal University of Technology, Clausthal-Zellerfeld, Germany. Anon. WEEE Recycling Expert. (ELPRO Elektronik-Produkt Recycling GmbH, Braunschweig, Germany). Personal communication, 2016. [Google Scholar]
- Walachowicz, F.; March, A.; Fiedler, S.; Buchert, M.; Sutter, J.; Merz, C. Recycling von Elektromotoren—MORE: Ökobilanz der Recyclingverfahren. 2014. Available online: https://www.researchgate.net/publication/272809889_Recycling_von_Elektromotoren_MOtor_REcycling_-_MORE (accessed on 18 October 2018).
- Kohlmeyer, R.; Sander, K.; Jung, M.; Wagner, L. Klärung des verbleibs von außer betrieb gesetzten fahrzeugen. In Recycling und Rohstoffe; Thomé-Kozmiensky, K.J., Thiel, S., Thomé-Kozmiensky, E., Goldmann, D., Eds.; Thomé-Kozmiensky Verlag GmbH: Nietwerder, Germany, 2017; pp. 285–304. [Google Scholar]
- Elwert, T.; Clausthal University of Technology, Clausthal-Zellerfeld, Germany. Anon. Recycling Industry Expert. (Siemens AG, München, Germany). Personal communication, 2018. [Google Scholar]
Figure 1.
Shares of the different applications in the global neodymium-iron-boron (NdFeB) magnet market in the year 2012 [11].
Figure 1.
Shares of the different applications in the global neodymium-iron-boron (NdFeB) magnet market in the year 2012 [11].

Figure 2.
Sales data (blue diamonds), best-fit function (red curve), and forecast (red diamonds) for hard disk drives (HDDs).
Figure 2.
Sales data (blue diamonds), best-fit function (red curve), and forecast (red diamonds) for hard disk drives (HDDs).
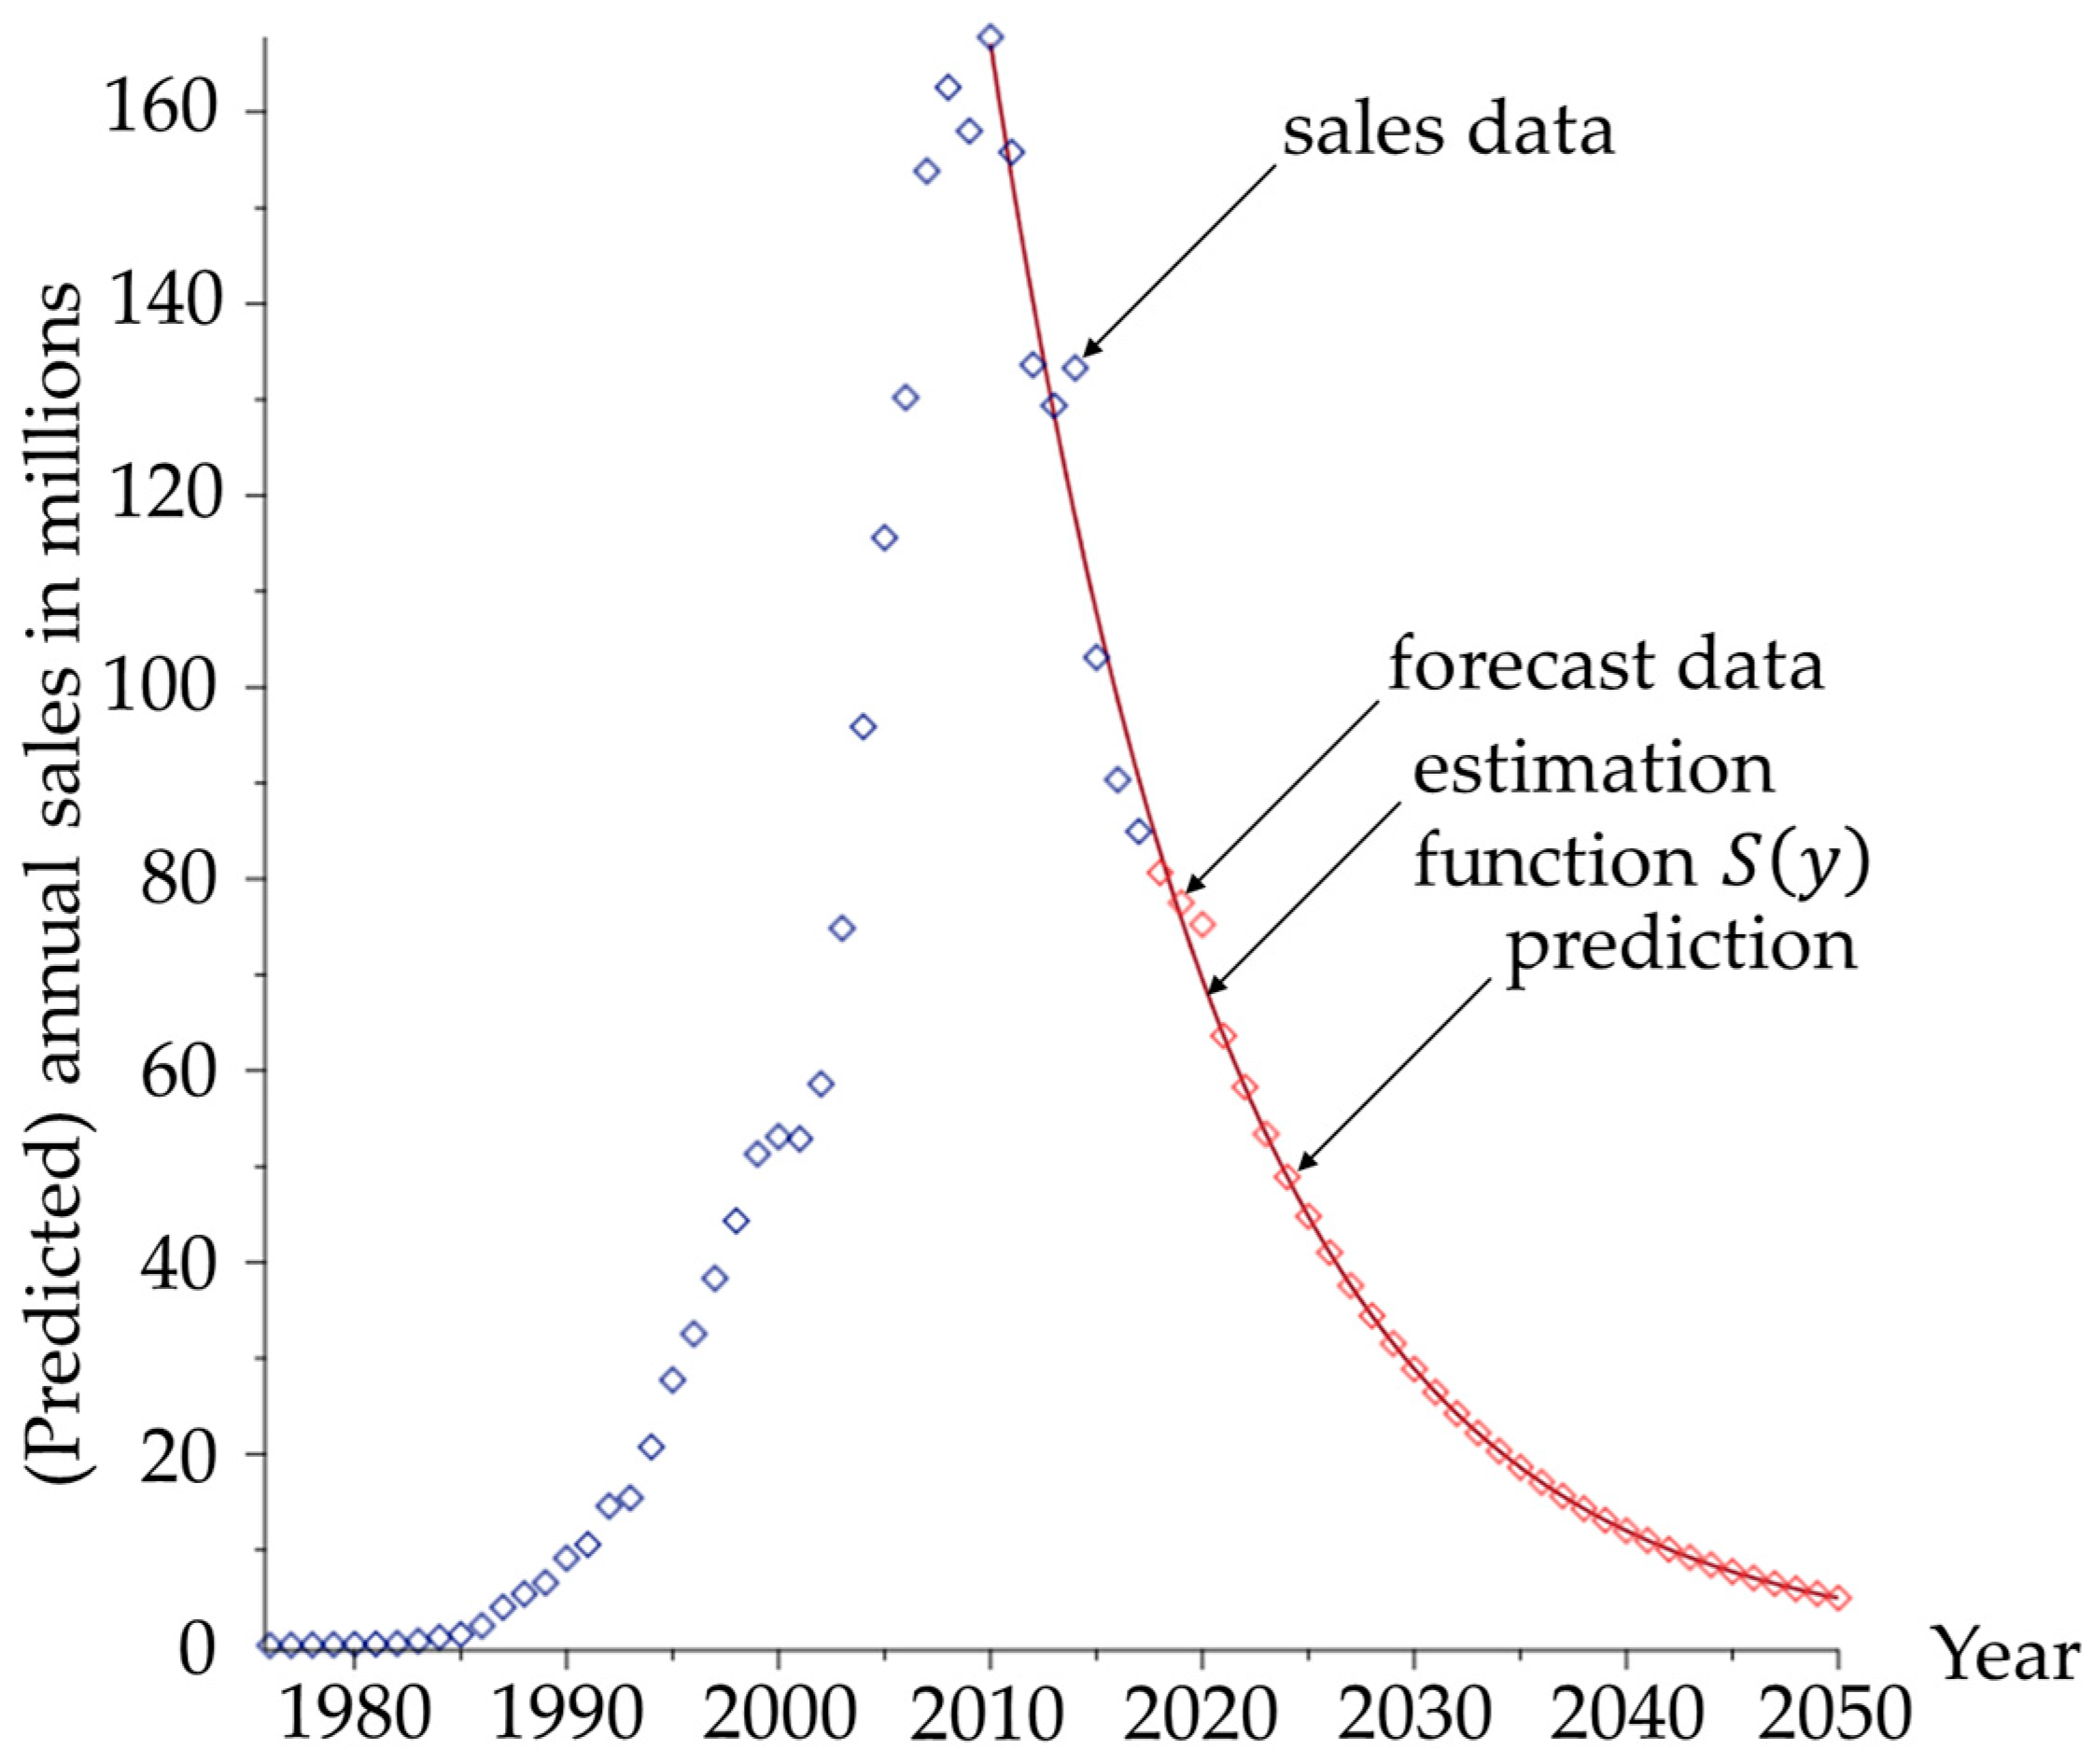
Figure 3.
Probability density functions for the return year of units, which were sold in the years 2015, 2016, and 2018, respectively.
Figure 3.
Probability density functions for the return year of units, which were sold in the years 2015, 2016, and 2018, respectively.
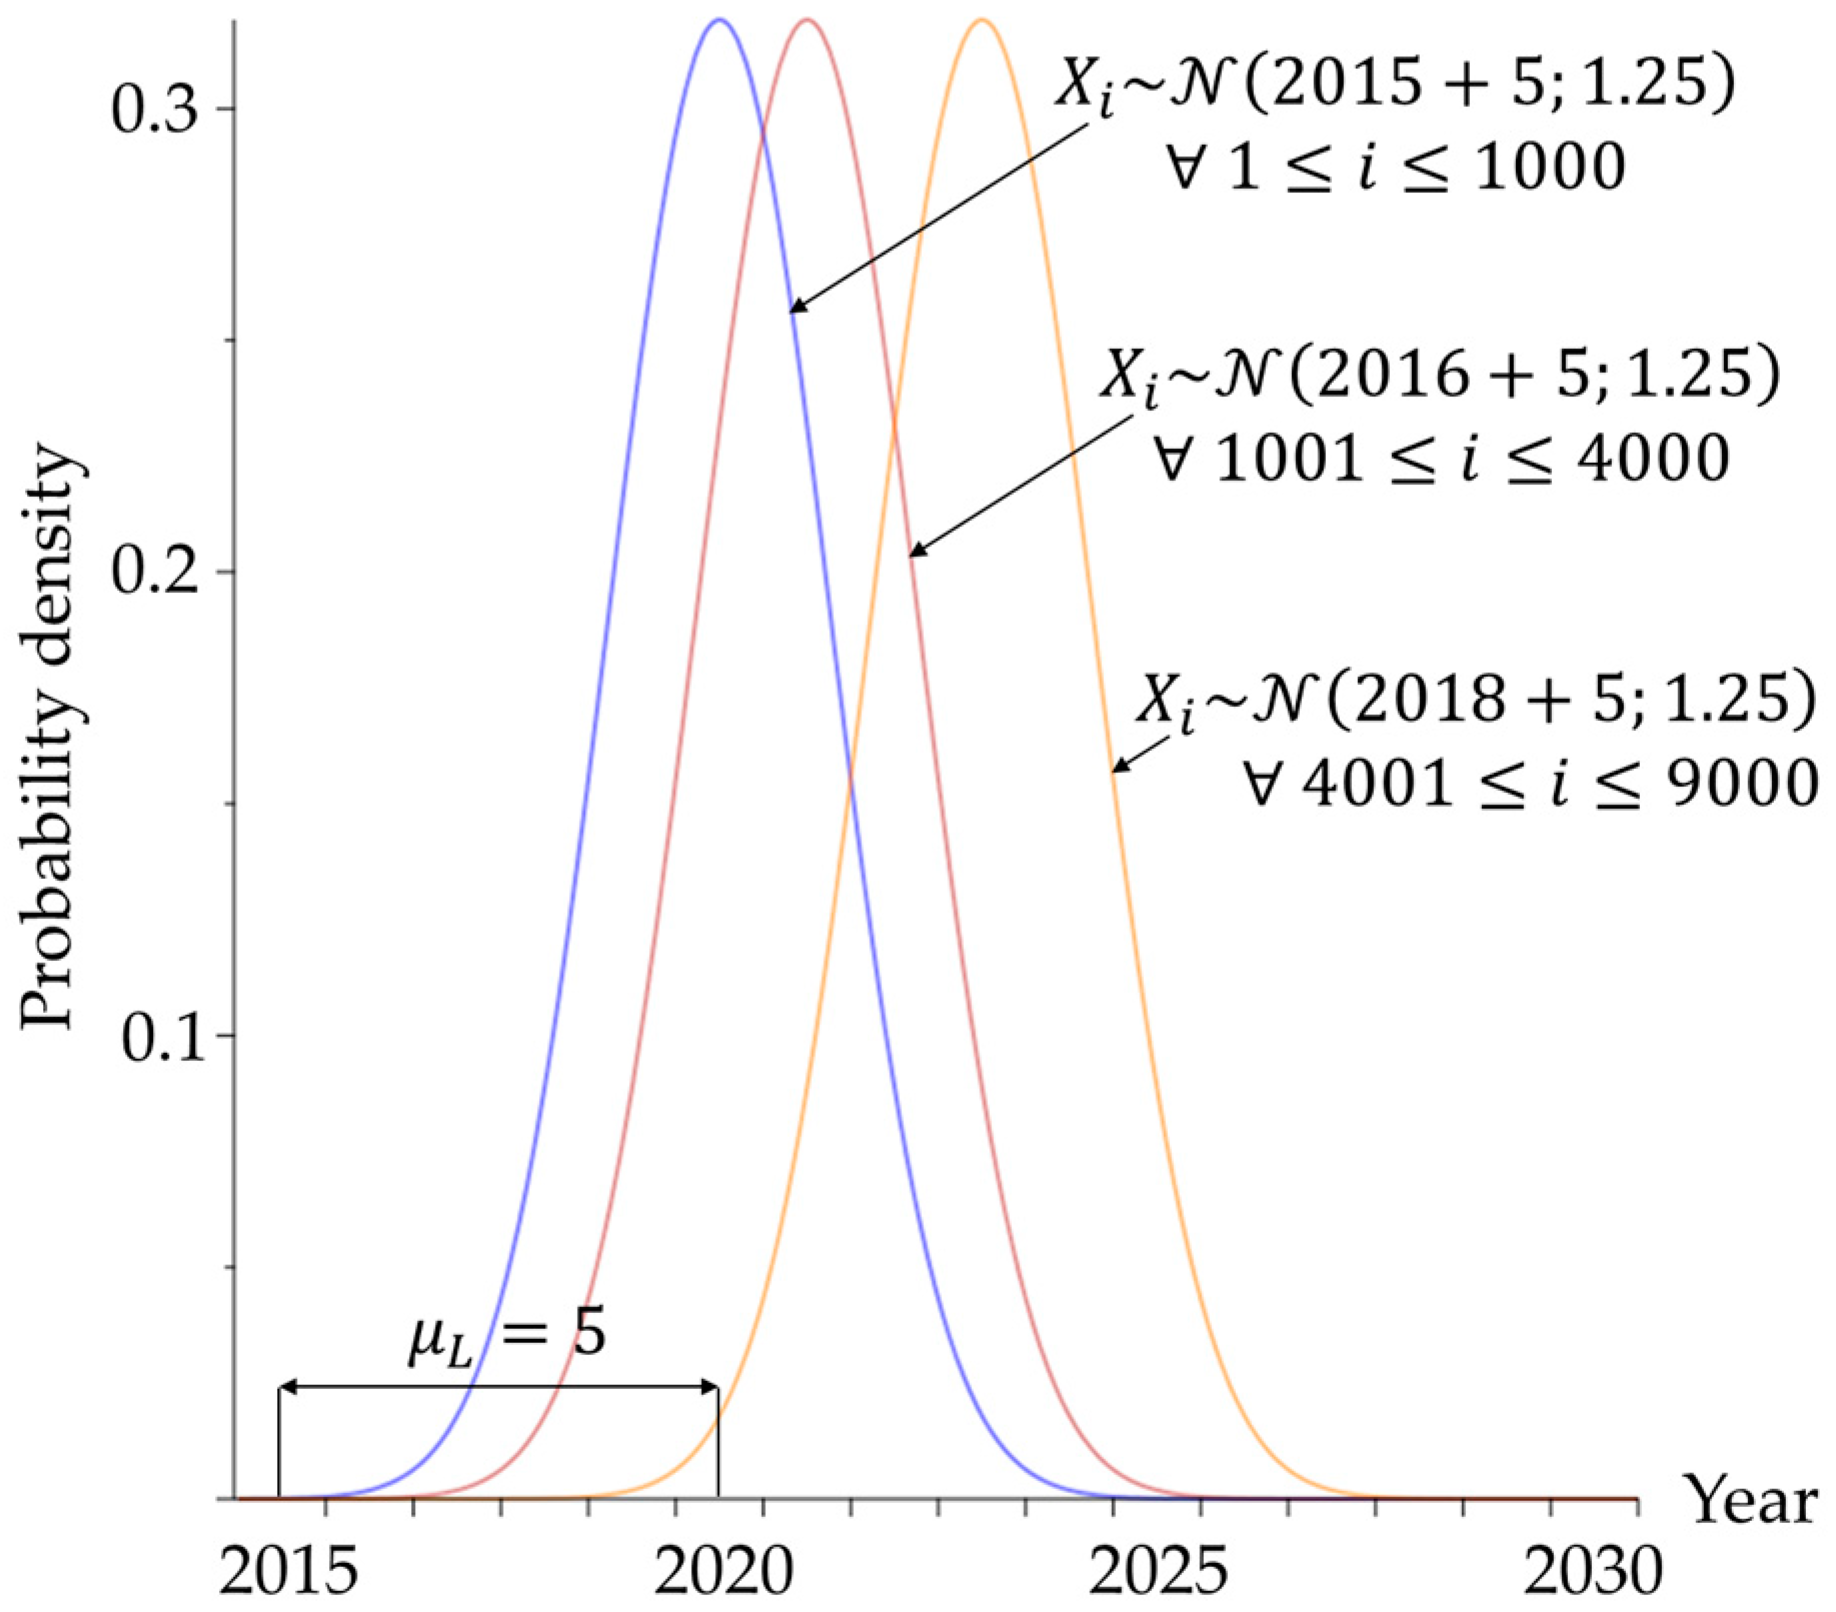
Figure 4.
Simulated absolute return flows superimposed (left) and stacked (right). For the year 2022, the simulation (one run) provides a value of 1932 units. The exact expected return derived from the calculation for this given year was 1928.39 units.
Figure 4.
Simulated absolute return flows superimposed (left) and stacked (right). For the year 2022, the simulation (one run) provides a value of 1932 units. The exact expected return derived from the calculation for this given year was 1928.39 units.

Figure 5.
Sales (blue) and returns (red) by application. Y-axes units vary whilst x-axes depict year dates. The relevant range of sales trends is shorter, if the associated average lifespan is high (e.g., wind turbines).
Figure 5.
Sales (blue) and returns (red) by application. Y-axes units vary whilst x-axes depict year dates. The relevant range of sales trends is shorter, if the associated average lifespan is high (e.g., wind turbines).

Figure 6.
Potential return flows by application in tons of NdFeB.

Figure 7.
Estimation of the realistic return flows by application in tons of NdFeB and overall recycling rate.
Figure 7.
Estimation of the realistic return flows by application in tons of NdFeB and overall recycling rate.

Table 1.
Literature based assumptions.
| Application | Average Magnet Content | Nd/Dy [%] 3 | µL; σL [a] 4 | Sales Data Sources | |
|---|---|---|---|---|---|
| Electric Vehicles | 2500 g | [15] | 27/5 | 15; 3.75 | [16,17,18,19] |
| Hybrid Electric Vehicles | 1500 g | [15] | 27/5 | 15; 3.75 | [16,17,18,19] |
| Auxiliary Vehicle Motors | 175 g | [9] | 29/3 | 15; 3.75 | [20] |
| Electric Bikes | 270 g | [21] | 29/3 | 5; 1.25 | [22,23,24] |
| Industrial Motors 1 | - | 28/4 | - | [25,26] | |
| Wind Turbines, Direct Drive 2 | 650 kg/MW | [11] | 28/4 | 22; 5.50 | [27,28,29,30,31,32] |
| Wind Turbines, Hybrid Drive 2 | 160 kg/MW | [11] | 28/4 | 22; 5.50 | [27,28,29,30,31,32] |
| Magnetic Resonance Imaging | 2.5 t | [33] | 31/1 | 12; 3.00 | [11,34] |
| Hard Disk Drives | 5.67 g | [21] | 32/0 | 6; 1.50 | [26,35,36] |
| Audio Devices 1 | - | 32/0 | - | [34] | |
Table 2.
Comparison of the theoretical potential and realistic returns of NdFeB in tons accumulated from 2018 up to 2040.
Table 2.
Comparison of the theoretical potential and realistic returns of NdFeB in tons accumulated from 2018 up to 2040.
| Application | Theoretical Potential Returns [t NdFeB] | Estimated Realistic Returns [t NdFeB] | |
|---|---|---|---|
| Electric Vehicles | 36,336 | 7097 | (28%) |
| Hybrid Electric Vehicles | 49,320 | 9140 | (36%) |
| Auxiliary Vehicle Motors | 60,861 | 0 | (0%) |
| Electric Bikes | 23,832 | 292 | (1%) |
| Industrial Motors | 10,575 | 232 | (1%) |
| Wind Turbines, Direct Drive | 5776 | 4678 | (18%) |
| Wind Turbines, Hybrid Drive | 3066 | 2483 | (10%) |
| Magnetic Resonance Imaging | 31,585 | 1579 | (6%) |
| Hard Disk Drives | 8704 | 174 | (1%) |
| Audio Devices | 2836 | 0 | (0%) |
| Total | 232,891 | 25,675 | (100%) |
© 2018 by the authors. Licensee MDPI, Basel, Switzerland. This article is an open access article distributed under the terms and conditions of the Creative Commons Attribution (CC BY) license (http://creativecommons.org/licenses/by/4.0/).
Share and Cite
MDPI and ACS Style
Reimer, M.V.; Schenk-Mathes, H.Y.; Hoffmann, M.F.; Elwert, T. Recycling Decisions in 2020, 2030, and 2040—When Can Substantial NdFeB Extraction be Expected in the EU? Metals 2018, 8, 867. https://doi.org/10.3390/met8110867
AMA Style
Reimer MV, Schenk-Mathes HY, Hoffmann MF, Elwert T. Recycling Decisions in 2020, 2030, and 2040—When Can Substantial NdFeB Extraction be Expected in the EU? Metals. 2018; 8(11):867. https://doi.org/10.3390/met8110867
Chicago/Turabian StyleReimer, Maximilian V., Heike Y. Schenk-Mathes, Matthias F. Hoffmann, and Tobias Elwert. 2018. "Recycling Decisions in 2020, 2030, and 2040—When Can Substantial NdFeB Extraction be Expected in the EU?" Metals 8, no. 11: 867. https://doi.org/10.3390/met8110867
Note that from the first issue of 2016, this journal uses article numbers instead of page numbers. See further details here.