Microstructure Evolution of a High Nb Containing TiAl Alloy with (α2 + γ) Microstructure during Elevated Temperature Deformation


1
State Key Laboratory of Solidification Processing, Northwestern Polytechnical University, Xi’an 710072, China
2
National & Local Joint Engineering Research Center for Precision Thermal Forming Technology of Advanced Metal Materials, Northwestern Polytechnical University, Xi’an 710072, China
3
Shaanxi Key Laboratory of High-Performance Precision Forming Technology and Equipment, Northwestern Polytechnical University, Xi’an 710072, China
*
Authors to whom correspondence should be addressed.
Metals 2018, 8(11), 916; https://doi.org/10.3390/met8110916
Submission received: 7 October 2018
/
Revised: 3 November 2018
/
Accepted: 4 November 2018
/
Published: 7 November 2018
(This article belongs to the Special Issue Intermetallic Alloys)
Abstract
:In order to verify the correctness of the transition of deformation mechanism with the change in deformation parameters and to reveal the types and mechanism of dynamic recrystallization of γ grains during compression deformation, microstructure characterization of Ti-43.5Al-8Nb-0.2W-0.2B (at. %) alloy after isothermal compression deformation were performed. When the alloy was deformed at 1000 °C/10−2 s−1, the initial γ grains are elongated and significantly refined and the fraction of low angle grain boundaries (LAGB) of γ grains is obviously increased and the texture intensity remains unchanged, which indicates that the compression deformation in dislocation creep region is dominated by intragranular deformation and dynamic recrystallization (DRX) of γ grains. Besides, the lattice rotation at grain boundary serrations may be responsible for the nucleation of new recrystallized γ grains, and the following growth process may be achieved by the migration of γ grain boundaries. However, when the alloy deformed at 1050 °C/10−4 s−1 and 1000 °C/10−4 s−1, the γ grains maintain equiaxed shapes and distribute more uniformly and the fraction of LAGB of γ grains is slightly raised and the texture sharpness decreases, which indicates that the compression deformation in grain boundary sliding (GBS) region is mainly controlled by GBS of γ grains and DRX occurs simultaneously within some coarse γ grains.
1. Introduction
Weight-reduction is becoming more and more critical for structural applications in the aerospace and automotive industries. The realization routine of the weight-reduction consists of two parts: material and structural design [1,2]. γ-TiAl based alloys have been widely considered as novel lightweight high-temperature structural materials, which possess high specific strength and stiffness, good resistance against oxidation and corrosion, and good creep properties [3,4]. However, this kind of intermetallic alloy characterized by mixed metallic and covalent bonding is substantially hard to deform due to its intrinsic brittleness and high flow stress [5,6]. On the other hand, in order to reduce weight, most of the structural components used in aerospace are designed with the complex shape of thin-web and high-rib [1], which are difficult to form, especially for those made of brittle γ-TiAl based alloys. But, isothermal precision forging process with the advantage of superplasticity of the fine-grained γ-TiAl based alloys under low strain rates (10−3 s−1–10−5 s−1) and suitable deformation temperatures is a promising method to form those complex components with excellent mechanical properties [7,8]. In addition, comparing with that fine grain titanium alloys were generally obtained via multiple passes of multiaxial deformation around phase transition temperature [9,10], γ-TiAl based alloys with ideal equiaxed microstructure can be easily produced by a few steps uniaxial canned forging due to being prone to dynamic recrystallization (DRX) of γ-TiAl phase during deformation [11,12]. As we know, in the practical isothermal forging process, the deformation of the billet is mainly conducted under compressive stress state, and the deformation at different stages of the process and in different parts of the billet could be controlled by different mechanisms (i.e., dislocation creep versus grain boundary sliding (GBS)) corresponding to different deformation conditions (i.e., non-superplastic condition versus superplastic condition). However, the pioneering research works regarding isothermal compression deformation of γ-TiAl alloys [13,14,15,16,17] and superplasticity of γ-TiAl alloys via tension deformation [18,19,20,21,22] rarely involve the above issues. Therefore, in previous works [23,24] a deformation mechanism transition from dislocation creep to GBS with increasing deformation temperature and decreasing strain rate was revealed via the investigation of the isothermal compression of a fine-grained high Nb containing TiAl alloy with a (α2 + γ) microstructure. The results of flow behavior analysis and preliminary microstructure characterization suggested that dislocation creep and GBS contribute independently and additively to the strain rate. Besides, the occurrence of DRX can be found in the specimens after compression at different deformation parameters corresponding to both of the dominate mechanisms whether dislocation creep or GBS. The DRX is a specific feature for γ-TiAl alloys under superplasticity conditions, which is quite unexpected since it is well known that in metals the localization of superplasticity flow in fine grained areas hinders the development of recrystallization in coarse grains, and the reason is probably due to a lower mobility of dislocations in grains and a higher stored energy in the ordered state of γ-TiAl alloys as compared to metals [25,26].
Therefore, in the present work, the subsequent detailed microstructure analysis on the specimens deformed at different strains and parameters corresponding to different deformation mechanisms via characterization of phase morphology and constituent, grain size, misorientation distribution of γ phase and texture of γ phase based on electron backscattered diffraction (EBSD) was conducted in order to further verify the correctness of the earlier conclusion about the transition of deformation mechanism between dislocation creep and GBS and to reveal the types and mechanism of DRX of γ phase during compression deformation.
2. Materials and Methods
The high Nb containing γ-TiAl alloy with the nominal composition of Ti-43.5Al-8Nb-0.2W-0.2B in at. % was investigated. In order to obtain fine (α2 + γ) microstructure, the thermal-mechanical process route from melting to canned-forging and primary annealing was adopted, detailed in Ref. [11]. The isothermal compression tests were carried out on a Thermecmastor-Z thermal-mechanical simulator made by the Fuji Corporation of Japan at 950 °C, 1000 °C, and 1050 °C with constant strain rates of 10−2 s−1, 10−3 s−1, and 10−4 s−1, up to a compressive reduction ratio of 60% (ε = 0.92). Besides, in order to evaluate the effect of strain on deformation, the other compressive reduction ratios of 10% (ε = 0.11) and 30% (ε = 0.36) were adopted at 1000 °C with two strain rates of 10−2 s−1 and 10−4 s−1 respectively. The chosen deformation temperatures are far enough away from the phase transition temperature, and the phase constitution remains stable during deformation. Besides, the deformation parameter range was tested via superplastic tension deformation in previous works [11,12]. Cylindrical specimens with 8 mm in diameter and 12 mm in length were machined from the forged-pancakes. The compression direction of the specimens is parallel to the axial direction of the pancake, which is the canned-forging direction. In order to keep the deformation and temperature distribution throughout specimens being uniform, some specific methods and measures were applied in the compression tests, detailed in Ref. [24].
The microstructural measurements of the specimens prior to compression and after compression sectioned parallel to the compression direction were performed by scanning electron microscope (SEM) in backscattered electron (BSE) mode and EBSD and conducted on a HITACHI SU 3500 (HITACHI Corporation, Tokyo, Japan) equipped with EBSD system. The specimens for SEM and EBSD were prepared by standard mechanical grinding and electropolishing on a Struers Lectropol-5 (Struers Corporation, Ballerup, Denmark) in a solution of 5% perchloric acid, 35% n-butyl alcohol and 60% methanol. To obtain the detailed orientation information, the scanning area of 100 × 70 μm2 with a step size as small as 0.2 μm was adopted, on the other hand, to obtain the wider orientation information for texture characterization, the scanning area was set to 600 × 400 μm2 with a step size of 0.6 μm (Initial microstructure and microstructure of specimen deformed at 1000 °C/10−2 s−1 and 1000 °C/10−4 s−1). Due to the slight tetragonality (c/a ratio is only 1.02) of γ-TiAl lattice, it cannot be resolved by EBSD and often leads to misindexing [11,27]. Hence in the present work, the pseudo-cubic L10 lattice was treated as normal face centered cubic (fcc) lattice. And grain boundaries with misorientations (θ) between 2° and 15° were considered as low angle grain boundaries (LAGB), then high angle grain boundaries (HAGB) are those θ ≥ 15°. The boundaries with 58.5° ≤ θ ≤ 61.5° were thought to be twin boundaries (TB). Besides, determination of the grain size in this study was according to the assumption that grains > 10 pixels in area (one grain) were thought to be valid [11,28].
3. Results and Discussion
3.1. The Effect of Compression Parameters on Microstructure Evolution
Figure 1a shows the microstructures of the alloy prior to the isothermal compression deformation. It can be observed that the microstructure mainly consists of equiaxed γ grains (dark), intergranular α2 phase (grey) and a few β/βo phase (light-grey) after canned-forging and primary annealing. The microstructure is almost fully recrystallized, except for a few remnant lamellar colonies or coarse grains. The volume fraction of these three phases is about 80%, 15%, and 5% respectively. The mean γ grain size (where the mean is calculated in terms of number of grains) is measured to be 3.83 μm with a standard derivation of 2.27 μm (without specification each later mean grain size is calculated in terms of number of grains). According to the distribution statistics of γ grain misorientation, the grain boundaries can be found mainly consist of LAGB (9%), HAGB (91%) and annealing TB (20%).
In previous works [23,24], based on the strain rate dependence of flow stress (the double logarithmic relationship between shear modulus compensated peak stress and diffusion compensated strain rate under different deformation conditions as shown in Figure 2 in Ref. [23] and in Figure 6 in Ref. [24], the compression parameters (950–1050 °C and 10−2 s−1–10−4 s−1) can be divided into three categories with increasing temperatures and decreasing strain rates: dislocation creep region, transition region and GBS region. Correspondingly, when the specimens deformed at parameters in dislocation creep region, the compression deformation is dominated by dislocation creep mechanism and fulfilled mainly through intragranular dislocation sliding and climbing in γ grains. While in GBS region, the superplastic deformation is occurred, and the GBS of γ/γ grains and γ/α2 grains is responsible for the compression deformation. But in transition region, both dislocation creep and GBS play a same or similar role to total compression deformation. In order to further clarify the above conclusions about the transition of deformation mechanism, the detailed microstructure characterization on the specimens after compression deformation under 1000 °C with the strain rate of 10−2 s−1, 5 × 10⁻⁴ s−1, and 10−4 s−1 and under 1050 °C with the strain rate of 10−4 s−1 corresponding to dislocation creep dominated region, transition region and GBS dominated region respectively was conducted. As shown in Figure 1b and Figure 2b, significant change of the microstructure can be observed after deformation at 1000 °C with the strain rate of 10−2 s−1 comparing with the initial state. The initial γ grains are elongated along the direction perpendicular to the compressive axial, and they are composed of much smaller equiaxed DRX grains. Due to the occurrence of DRX, the mean γ grain size is decrease from 3.83 μm down to 0.94 μm (Figure 3a,b). This indicates that the compression deformation is dominated by intragranular dislocations sliding and climbing in γ grains which leading to the occurrence of DRX of γ grains. Besides, the fraction of LAGB, HAGB, and TB is nearly unchanged comparing with the initial state (Figure 4a,b), which implies nearly complete recrystallization of γ grains. However, after deformation at 1000 °C with the strain rate of 5 × 10⁻⁴ s−1, the γ grains still present an equiaxed shape with relatively clear grain boundaries, but the mean grain size refined from 3.83 μm to 2.71 μm as shown in Figure 3a,c. This indicates that DRX of γ grains caused by intragranular deformation and GBS of γ/γ grains and γ/α2 grains may occur simultaneously during the compression deformation. With regard to the specimen deformed at 1050 °C with the strain rate of 10−4 s−1, less variation of the microstructure can be observed from Figure 1 and Figure 2, the grain size of γ phase stays nearly the same (mean grain size of 4.19 μm versus 3.83 μm). But the mean γ grain sizes prior to and after deformation in terms of area fraction of grains differ quite a bit (6.85 μm versus 9.67 μm). This is due to the inhomogeneity of microstructure (see more TB and LAGB distributed in the remnant lamellar and coarse grains shown in Figure 2d) and the small scanning area of 100 × 70 μm2 with some randomness of the deformed specimen. Also, the special multi-peak distribution of γ grain size in histogram can be observed in Figure 3e. However, the histogram of γ grain size of specimen deformed at 1000 °C with the strain rate of 10−4 s−1 derived from the large area (600 × 400 μm2) scanning orientation information (Figure 3d) accords well with Gaussian distribution which shows that comparing with initial state the γ grains after deformation at this condition in fact distribute more uniformly but refine slightly. This indicates that the compression deformation under the strain rate of 10−4 s−1 is mainly controlled by GBS. Meanwhile, due to being prone to DRX of γ phase, the refinement of coarse grains via the development of recrystallization in them commonly leads to more uniform distribution of total γ grains. On the other hand, from Figure 4 it also can be found that the fractions of γ phase LAGB of specimens deformed at 1000 °C with the strain rate of 5 × 10⁻⁴ s−1 and at 1050 °C with the strain rate of 10−4 s−1 are respectively 16% and 19% larger than the others around 10% which with nearly complete recrystallization state of γ grains. The large fractions of LAGB generally imply incomplete recrystallization and inhomogeneous distribution of grains. But, it’s hard to avoid randomness in choosing the regions of microstructure to be characterized due to the small scanning area of 100 × 70 μm2.
Combining with the preliminary flow curves analysis and microstructure characterization via SEM in BSE mode in previous works [23,24] and the above detailed microstructure characterization via EBSD in the present work, it can be therefore concluded that γ phase DRX takes place during the compression deformations throughout the whole conditions whether non-superplastic dislocation creep mechanism dominated (e.g., 1000 °C/10−2 s−1) or superplastic GBS mechanism dominated (e.g., 1050 °C/10−4 s−1). The recrystallized γ grain size decreases with the increasing strain rate and decreasing deformation temperature (Figure 2). In general, the combined effect of deformation temperature and strain rate on compression deformations is often expressed by the Zener-Hollomon parameter (Z), as defined in Equation (1):
where Q is the apparent activation energy and R the gas constant. The relationship between the Zener-Hollomon parameter (Z) and the stable dynamically recrystallized γ grain size (DDRX-γ) including mean grain size calculated by number and area fraction of γ grains is given in Figure 5. It is observed that there exists a double logarithmic relationship between Z and DDRX-γ for the present alloy, which agrees well with early studies on the non-superplastic deformation of as-cast Ti-43Al-4Nb-1.4W-0.6B alloy [29] and the superplastic deformation of fine grained Ti-47Al-2Cr-0.2Si alloy [30]. Besides, according to Equation (1), the used value of Q in it is critical to the calculation accuracy of Z. As above described, the compression deformation under different parameters of present fine grained γ-TiAl alloy is related to a transition of deformation mechanism between dislocation creep and GBS, which leading to the inapplicability of the average value of Q under different deformation conditions other literatures commonly used [13,14,15,16,17] in the present work. In those literatures, the value of Q does not change with deformation parameters. Therefore, the varied Q with deformation parameters obtained via the methods detailed in our previous work [24] and which reflects the change of dominated deformation mechanism was selected. The value of Q decreases from 382.6 kJ/mol to 356.2 kJ/mol with the increasing deformation temperature (950–1050 °C) and decreasing strain rate (10−2 s−1–10−4 s−1). The calculated values of Z under different deformation conditions via Equation (1) are shown in Table 1. The stable dynamically recrystallized γ grain size determined by Z is inversely proportional to Z. With the development of deformation, if the γ grain size in local regions is smaller than the stable one, the dynamic grain growth of γ grain will occur (e.g., the growth of recrystallized fine grains and the growth of initial grains during superplastic deformation). On the other hand, the grain refinement of γ grain via DRX will occur if the γ grain size in local regions is larger than the stable one. In superplastic deformation, DRX and dynamic grain growth may both play roles in the achievement of GBS by maintaining the grain size GBS required and accommodating the local strain induced by GBS, which may benefit for the microstructure homogenization of γ-TiAl alloys.
3.2. The Effect of Strains on Microstructure Evolution
As mentioned above, the variation of γ grain size distribution (Figure 3) and of γ grain boundary misorientation distribution (Figure 4) with compression parameters indicates that the present alloy deformed up to the compressive reduction ratio of 60% (ε = 0.92) is close to the complete recrystallized state of γ grains, and deformation substructures in γ grains have disappeared under this state. In particular, the γ grain boundary misorientation distribution which represents the division of the LAGB, HAGB, and TB proportion shows little significant regular pattern with deformation parameters, which is helpful to reveal the underlying mode of deformation and mechanism of DRX. Therefore, the situation during the development of γ phase DRX was considered, and the microstructures of specimens deformed up to the compressive reduction ratio of 10% (ε = 0.11) and 30% (ε = 0.36) were characterized by SEM in BSE mode and EBSD shown in Figure 6, Figure 7, Figure 8 and Figure 9. It can be observed that the microstructures of specimens after slight deformation (ε = 0.11) at 1000 °C with the strain rate of 10−2 s−1 and 10−4 s−1 (Figure 6a,c) remain roughly the same comparing with the initial state (Figure 1a). There is no obvious increase in the volume fraction of recrystallized γ grains. From the EBSD-derived phase maps (contrasting Figure 7a,b with Figure 2a), very few small recrystallized γ grains scattered at grain boundaries can be seen, and the decreased mean γ grain size from initial 3.83 μm (Figure 3a) to 2.54 μm and 3.12 μm (Figure 8a,c) represents the slight increase of the number of small recrystallized γ grains in deformed specimens. Besides, more large elongated γ grains than initial state with large fraction of LAGB in them can be observed in the specimen deformed at 1000 °C with the strain rate of 10−2 s−1 (Figure 7a), and also more large equiaxed γ grains than initial state with large fraction of LAGB in them can be observed in the specimen deformed at 1000 °C with the strain rate of 10−4 s−1 (Figure 7c). The fraction of LAGB of the specimen after deformation at 1000 °C with the strain rate of 10−2 s−1 increases significantly from initial 9% to 27% (Figure 9a), that of the specimen after deformation at 1000 °C with the strain rate of 10−4 s−1 increases to 21% (Figure 9b). Large volume fraction of small recrystallized γ grains and large non-recrystallized γ grains in deformed specimens leads to the non-uniform and multi-peak distributions of γ grain size shown in Figure 8a,c. All of this indicates the beginning of γ grain DRX for the specimens deformed at 1000 °C with the strain rate of 10−2 s−1 and 10−4 s−1 under the strain of 0.11. On the other hand, most of the large γ grains in the deformed specimens are larger than the stable dynamically recrystallized grain, so these large γ grains are initial ones to be refined, and more large γ grains in Figure 7a,c may be due to the small scanning area of 100 × 70 μm2 with certain degrees of randomness. With the rise of strain from 0.11 to 0.36, the microstructure of the specimen deformed at 1000 °C with the strain rate of 10−2 s−1 shows a sharp increase in the volume fraction of small recrystallized γ grains and some elongated non-recrystallized large γ grains remained with very large fraction of LAGB (34%) in them (Figure 6b and Figure 7b). Comparing with Figure 8a,b and Figure 3b, it can be observed that the area fraction of γ grains which smaller than 2 μm increases obviously from ~4% to ~47%. As convergence of distribution shapes in Figure 3b and Figure 8b, the multi-peak distribution in Figure 8a is gradually replaced by the single peak distribution in Figure 8b. The mean γ grain size (1.04 μm) of the specimen deformed under the strain of 0.36 is very close to that (0.94 μm) of the specimen deformed under the strain of 0.92, but the difference on the mean γ grain sizes in terms of area fraction of grains is relatively large (3.76 μm versus 1.67 μm). This implies that with DRX going on the number of small recrystallized γ grains increases significantly but there still remains a certain amount of elongated non-recrystallized large γ grains which takes a substantial proportion of area (see the larger area fraction of γ grains with large size shown in Figure 8b against Figure 3b). Besides, from Figure 9a,b and Figure 10a it can be found that with the rise of strain to 0.11 and then to 0.36 the fraction of LAGB which mainly refers to those with boundary misorientation less than 10° increases rapidly (from 9% to 27% and then to 34%). However the fraction of LAGB with boundary misorientation between 10° and 15° firstly increases then decreases with a very small variation range, which is related to the DRX model (continuous dynamic recrystallization (CDRX) or discontinuous dynamic recrystallization (DDRX)) of γ grains and was discussed in the following section. The sharply increased volume fraction of small recrystallized γ grains and fraction of LAGB (34%) in elongated non-recrystallized large γ grains of the specimen deformed at 1000 °C with the strain rate of 10−2 s−1 with the increase of strain also indicates that the compression deformation in dislocation creep region is dominated by the intragranular dislocations sliding and climbing and DRX of γ grains. However, with regard to the specimen deformed under 1000 °C with the strain rate of 10−4 s−1 as the increase of strain from 0.11 to 0.36, the shape of γ grains always maintains equiaxed and few small recrystallized γ grains can be found (Figure 6d and Figure 7d) due to the stable recrystallized γ grain size of 3.58 μm under this deformation condition which close to the initial 3.83 μm, and the volume fraction of non-recrystallized large γ grains decreases which also can be verified by the return to zero of area fractions of γ grains with size larger than 12 μm shown in Figure 8d. But, comparing with Figure 3d and Figure 8d, it can be observed that the mean γ grain size of 2.54 μm of the specimen after deformation at 1000 °C with the strain rate of 10−4 s−1 up to the strain of 0.36 is smaller than the stable recrystallized γ grain size of 3.58 μm of the specimen deformed at this condition up to the strain of 0.92. This is because that the γ grains with size less than 2 μm in Figure 8d require further growth and the γ grains with size greater than 8 μm in Figure 8d require further refinement in the following process of deformation, which both contribute to the increase of area fractions of γ grains with size in the range of 4 μm to 7 μm in Figure 8d towards to those in Figure 3d. In addition, the variations of fraction of LAGB on the deformation parameters of 1000 °C with the strain rate of 10−4 s−1 and 10−2 s−1 display a remarkable difference via comparative observations on Figure 9 and Figure 10. With the rise of strain to 0.11, the fraction of LAGB of specimen deformed at 1000 °C with the strain rate of 10−4 s−1 firstly increases from the initial value of 9% to 21%, and then it decreases to 10% same as the value under the complete recrystallized state of γ grains (ε = 0.92) when the strain up to 0.36. The above observations and analyses indicate further that the compression deformation under 1000 °C with the strain rate of 10−4 s−1 in GBS region is mainly controlled by GBS in most fine γ grained areas but DRX occurs within some coarse γ grains which improves the homogeneity of microstructure.
3.3. DRX of γ Grains
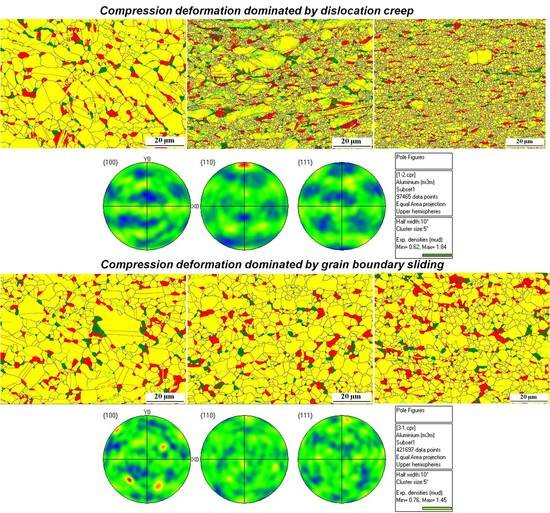
About the DRX mechanism of single phase intermetallic compound γ-TiAl, Hasegawa et al. [31] proposed that in low Z (lnZ = 15.2–19.7) deformation conditions the DRX of γ-TiAl developed mainly via the process in which new grains are formed by strain-induced migration (SIBM) of grain boundaries with the occurrence of sharp fiber texture in γ-TiAl, and in high Z (lnZ = 19.7–22.2) deformation conditions DRX carried out through the nucleation and growth of new grains in the vicinity of grain boundaries where the deformation occurred severely but with no sharp texture appeared. However, as for the present situation of this article, although the values of lnZ in the range from 31.5 to 23.2 (Table 1) of present alloy compressively deformed under various parameters greater than the maximum value of 22.2 in Ref. [31] corresponding to the high Z deformation conditions, both the values of the maximum pole density (PMAX) of γ grains are less than 2 as shown in Figure 11 and Figure 12 whenever the specimen deformed at 1000 °C with the strain rate of 10−2 s−1 (31.5 relatively high Z in present work) or at 1000 °C with the strain rate of 10−4 s−1 (24.7 relatively low Z in present work). On the other hand, it also can be found that with the decrease of Z from lnZ = 31.5 (1000 °C with the strain rate of 10−2 s−1) to lnZ = 24.7 (1000 °C with the strain rate of 10−4 s−1) in the present work the texture intensity of γ grains decreases, but the opposite change rule that texture intensity increases with the decrease of Z shows in Ref. [31] which due to the above-mentioned variation on processes of DRX. Specifically, comparing the value of Z (lnZ = 31.5) in present work with that (lnZ = 19.7–22.2) in Ref. [31], the deformation at 1000 °C with the strain rate of 10−2 s−1 which dominated by DRX of γ grains can be regarded as belonging to high Z deformation conditions. So the DRX of present alloy deformed at 1000 °C with the strain rate of 10−2 s−1 may also develop via the nucleation and growth of new grains which originated by the formation of lattice rotation at serrations in the vicinity of grain boundaries. But the low value of PMAX of γ grains (~2) in present work may be due to the high fraction of twins in present high Nb containing alloy. Besides, the element of Nb promotes the occurrence of DRX and twins in γ-TiAl phase [11,25,32], and high fraction of twins inhibit the development of texture during the migration of grain boundaries [31]. With regard to the deformation at 1000 °C with the strain rate of 10−4 s−1, the value of Z (lnZ = 24.7) is still greater than that (lnZ = 19.7–22.2) in Ref. [31], the deformation at 1000 °C with the strain rate of 10−4 s−1 could also be regarded as belonging to high Z deformation conditions. However, the deformation at 1000 °C with the strain rate of 10−4 s−1 is mainly controlled by GBS in most fine γ grained areas and which takes up a larger share of the deformation leading to the lower actual values of Z in some coarse γ grained areas to be recrystallized than the overall value (lnZ = 24.7), and the actual values may come into the range of low Z (lnZ = 15.2–19.7) deformation conditions in Ref. [31]. So the DRX of coarse γ grains of present alloy deformed at 1000 °C with the strain rate of 10−4 s−1 may also proceed through the SIBM. But the decrease of texture intensity of γ grains with the decrease of Z (from 31.5 to 24.7) exact opposite of what in Ref. [31] is because of the grain rotation caused by the GBS of fine γ grains and high fraction of twins in γ grains. After all, another DRX process via the nucleation and growth of new grains in the vicinity of grain boundaries and with high fraction of twins in γ grains more impossibly causes the increase of texture intensity of γ grains, so the DRX model of coarse γ grains of present alloy deformed at 1000 °C with the strain rate of 10−4 s−1 can not be determined.
Unlike Hasegawa et al. [31], some other scholars [29,33,34,35] discussed the effect of deformation parameters represented by the values of Z on DRX of γ-TiAl alloys in terms of (i) continuous dynamic recrystallization (CDRX) as well as (ii) discontinuous dynamic recrystallization (DDRX). CDRX mainly refers to the process that DRX develops via subgrains or lattices rotation up to become recrystallized grains through absorbing dislocations and increasing misorientations of those subgrains [26,33,34]. But DDRX mainly refers to the process of strain-induced migration of grain boundaries [26,33,34]. For instance, Wang et al. [33] reported that the DRX model in cast Ti-43Al-4Nb-1.4W-0.6B-0.2Y alloy is DDRX at the low value of Z and becomes to CDRX with the increase of the Z value. But Wang et al. [34] and Li et al. [29] proposed that the DRX model in powder metallurgy Ti-47Al-2Cr-2Nb-0.2W-0.15B alloy and cast Ti-43Al-4Nb-1.4W-0.6B alloy transits from DDRX to CDRX with the decrease of Z caused by the increase of strain. Together, it can be inferred that the lattice rotation at grain boundary serrations may be responsible for the nucleation of new recrystallized γ grains in present TiAl alloy deformed at the high Z condition of 1000 °C with the strain rate of 10−2 s−1. But the following growth of the new recrystallized γ grains may be achieved by the migration of grain boundaries, which can be verified from the variation of γ grain boundary misorientation with strain as shown in Figure 10a. In general, the recrystallization process dependent on subgrains or lattices rotation is related to the increase of fractions of LAGB with boundary misorientation in the range of 10° and 15°, such as the significant increase appeared at the strain transition from 0.1 to 0.3 in superalloy 718 [35] and at the strain transition from 0.35 to 0.7 in powder metallurgy Ti-47Al-2Cr-2Nb-0.2W-0.15B alloy [34]. But in the present work, after above 0.11, with further increasing strain, the fractions of LAGB with boundary misorientation in the range of 10° and 15° continue to fall in both cases whatever 1000 °C with the strain rate of 10−2 s−1 (relatively high Z) or 1000 °C with the strain rate of 10−4 s−1 (relatively low Z) as shown in Figure 10, which indicates that the process of subgrains or lattices rotation dose not occupy the leading role in the course of γ grain DRX of present alloy. With regard to the specimen deformed at the low Z condition of 1000 °C with the strain rate of 10−4 s−1, the DRX of γ grains may generate and develop via the same model with that at the high Z condition of 1000 °C with the strain rate of 10−2 s−1. Otherwise, the DRX of γ grains may proceed via strain-induced migration of grain boundaries all through the deformation at the low Z condition of 1000 °C with the strain rate of 10−4 s−1.
3.4. Texture of γ Grains
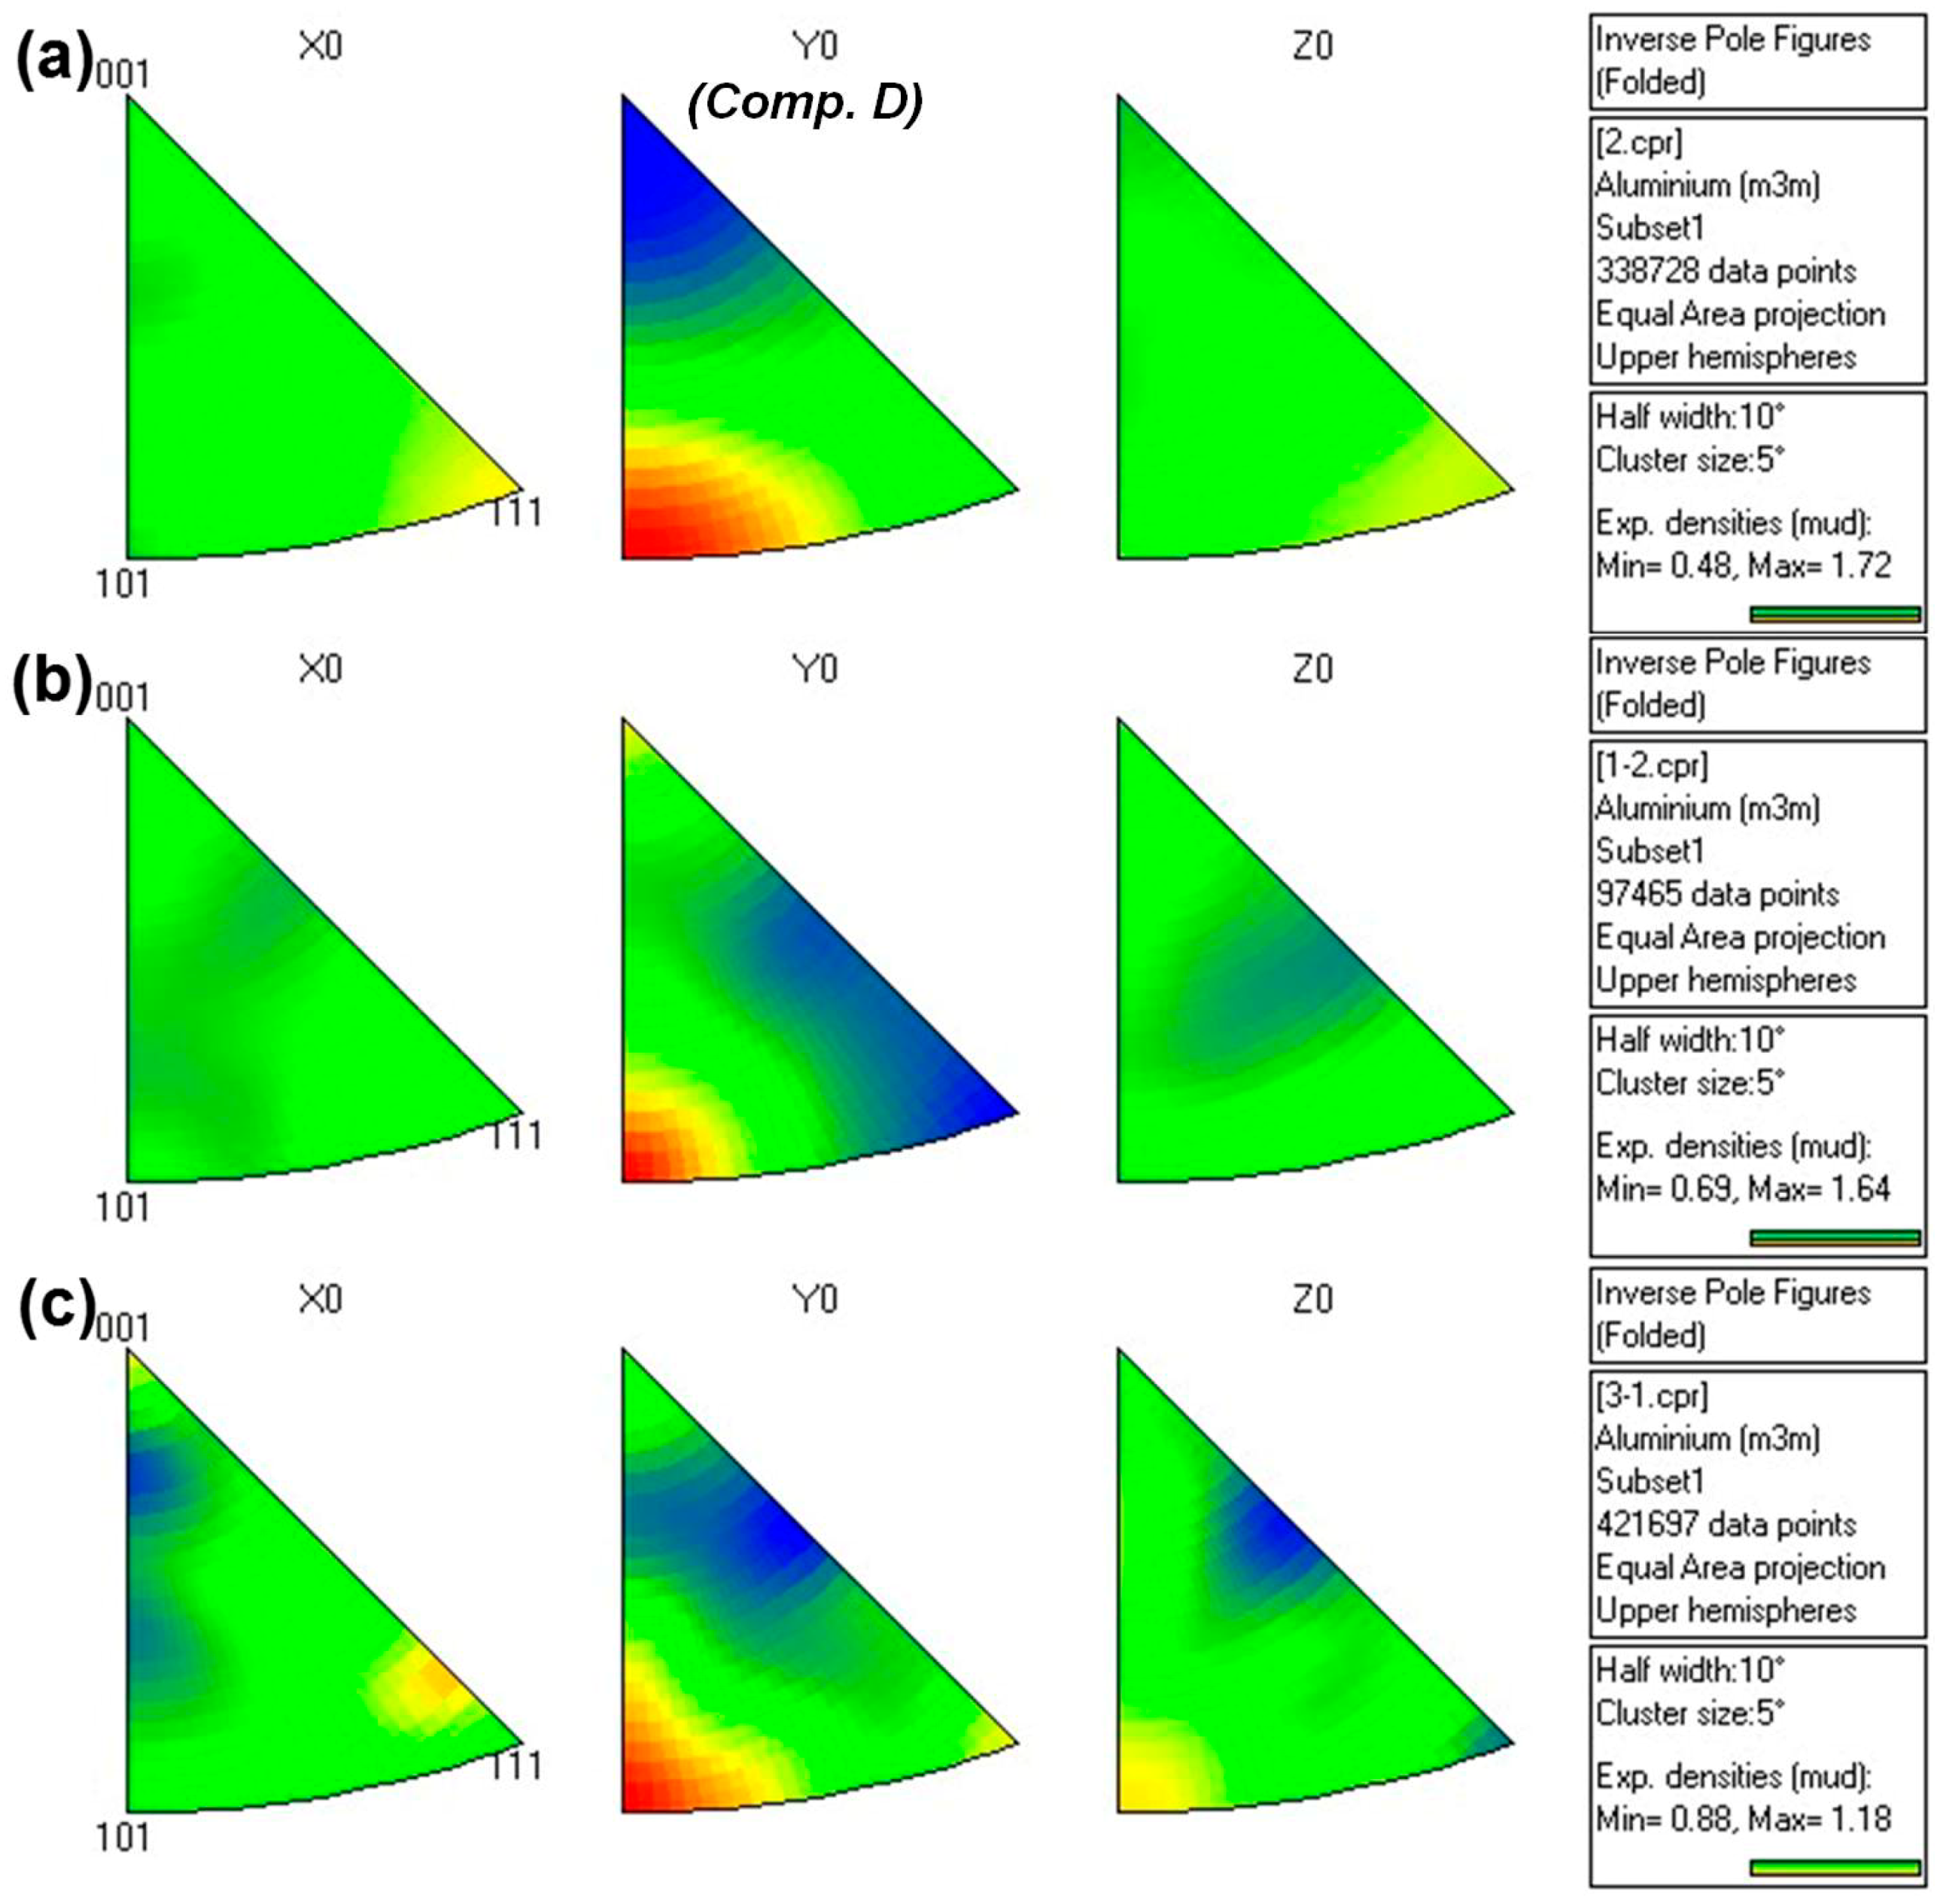
Because that the slight tetragonal L10 lattice of γ-TiAl phase with the c/a ratio of 1.02 which cannot be resolved was treated as normal fcc lattice during the collection process of grain orientation information by EBSD in the present work, only pole figures and inverse pole figures of cubic system for present γ-TiAl alloy were constructed as shown in Figure 11 and Figure 12. Therefore, the common fiber texture near {032) which often occurred in compression deformation of γ-TiAl phase [30,31,36] was approximately substituted by the fiber texture near {110} which often appeared in compression deformation of fcc metals such as copper and Aluminum [26,31]. However, the trend of the variation of texture intensity on deformation parameters can be really reflected by this approximate method. It can be observed from Figure 11 that the alloy deformed at 1000 °C with the strain rate of 10−2 s−1 shows the similar regular pole density distribution with the initial one and the value of PMAX near 2. But the pole density of the alloy after deformation at 1000 °C with the strain rate of 10−4 s−1 distributes more randomly than that of the alloy deformed at 1000 °C with the strain rate of 10−2 s−1, and the value of PMAX also decreases. The inverse pole figures (Figure 12) show the same law that with the decrease of Z (from 1000 °C with the strain rate of 10−2 s−1 to 10−4 s−1) the intensity of the fiber texture near {101} decreases. The variation of texture intensity on deformation parameters also indicates that the compression deformation at 1000 °C with the strain rate of 10−2 s−1 in dislocation creep region is dominated by intragranular deformation and DRX of γ grains and the texture intensity (the value of PMAX) remains around 2 via the above Section described DRX model. But the compression deformation at 1000 °C with the strain rate of 10−4 s−1 in GBS region is controlled by GBS and the texture intensity decreases due to the γ grains rotation caused by GBS.
4. Conclusions
Detailed microstructure analysis on Ti-43.5Al-8Nb-0.2W-0.2B (at. %) alloy with the microstructure consisted of fine equiaxed γ and α2 grains after isothermal compression deformation in temperature range of 950–1050 °C under strain rate range of 10−2 s−1–10−4 s−1 at strain of 0.11, 0.36 and 0.92 were conducted. The main conclusions are summarized below:
(1) The elongated initial γ grains and the significantly decreased size of recrystallized γ grains and the obviously increased fraction of LAGB of γ grains of the alloy after compression deformation at 1000 °C with the strain rate of 10−2 s−1 indicates that the compression deformation in dislocation creep region is dominated by intragranular dislocations sliding and climbing in γ grains which leading to the occurrence of DRX of γ grains. As a contrast, the unchanged equiaxed shape of γ grains and the more uniformly distributed γ grains and the slightly raised fraction of LAGB of γ grains of the alloy compressively deformed at 1000 °C with the strain rate of 10−4 s−1 and at 1050 °C with the strain rate of 10−4 s−1 indicates that the compression deformation in GBS region is mainly controlled by GBS of γ grains and DRX occurs simultaneously within some coarse γ grains which improves the homogeneity of microstructure.
(2) The lattice rotation at grain boundary serrations may be responsible for the nucleation of new recrystallized γ grains in the alloy deformed at the high Z condition of 1000 °C with the strain rate of 10−2 s−1, and the following growth process may be achieved by the migration of γ grain boundaries. But the model of DRX proceeded in coarse γ grain areas of the alloy deformed at the low Z condition of 1000 °C with the strain rate of 10−4 s−1 can not be determined.
(3) The variation of texture intensity on deformation parameters also indicates that the compression deformation of the alloy at 1000 °C with the strain rate of 10−2 s−1 in dislocation creep region is dominated by intragranular deformation and DRX of γ grains. But the compression deformation of the alloy at 1000 °C with the strain rate of 10−4 s−1 in GBS region is controlled by GBS and the texture intensity decreases due to the γ grains rotation caused by GBS.
Author Contributions
Y.C., L.Z., Y.L. and B.T. designed the experiments. The isothermal compression tests were performed by Y.C., L.Z. and Y.L. Y.C. prepared the samples and performed the SEM and EBSD measurements together with L.Z. Y.C. analyzed the EBSD data and Y.L. performed the texture analysis. The manuscript was written by Y.C. and intensively discussed with J.L., B.T. and H.K.
Funding
This work was financially supported by the Major State Research Development Program of China (2016YFB0701303) and the National Natural Science Foundation of China (51771150) and the Natural Science Basic Research Project of Shaanxi (2018JM5174) and the Aeronautical Science of Foundation of China (2015ZE53057) and the “111” Project (B08040).
Conflicts of Interest
The authors declare no conflict of interest.
References
- Shan, D.; Xu, W.; Han, X.; Huang, X. Study on isothermal precision forging process of rare earth intensifying magnesium alloy. Mater. Sci. Eng. B 2012, 177, 1698–1702. [Google Scholar] [CrossRef]
- Stark, A.; Rackel, M.; Tankoua, A.T.; Oehring, M.; Schell, N.; Lottermoser, L.; Schreyer, A.; Pyczak, F. In situ high-energy X-ray diffraction during hot-forming of a multiphase TiAl alloy. Metals 2015, 5, 2252–2265. [Google Scholar] [CrossRef]
- Clemens, H.; Mayer, S. Design, processing, microstructure, properties, and applications of advanced intermetallic TiAl alloys. Adv. Eng. Mater. 2013, 15, 191–215. [Google Scholar] [CrossRef]
- Kim, Y.W.; Kim, S.L. Advances in Gammalloy materials-processes-application technology: Successes, dilemmas, and future. JOM 2018, 70, 553–560. [Google Scholar] [CrossRef]
- Loria, E.A. Gamma titanium aluminides as prospective structural materials. Intermetallics 2000, 8, 1339–1345. [Google Scholar] [CrossRef]
- Wu, X. Review of alloy and process development of TiAl alloys. Intermetallics 2006, 14, 1114–1122. [Google Scholar] [CrossRef]
- Imayev, V.; Imayev, R.; Khismatullin, T.; Güther, V.; Beck, W.; Fecht, H.J. Superplastic behavior of Ti-43Al-7(Nb, Mo)-0.2B alloy in the cast+heat-treated condition. Scr. Mater. 2007, 57, 193–196. [Google Scholar] [CrossRef]
- Tetsui, T.; Shindo, K.; Kaji, S.; Kobayashi, S.; Takeyama, M. Fabrication of TiAl components by means of hot forging and machining. Intermetallics 2005, 13, 971–978. [Google Scholar] [CrossRef]
- Bézi, Z.; Krállics, G.; EI-Tahawy, M.; Pekker, P.; Gubicza, J. Processing of ultrafine-grained titanium with high strength and good ductility by a combination of multiple forging and rolling. Mater. Sci. Eng. A 2017, 688, 210–217. [Google Scholar] [CrossRef]
- Mamedov, A.; Ozturk, H.; Makas, T. Investigation of mechanical and microstructural properties of Ti-6Al-4V alloy depending on hot forging process parameters. Procedia Eng. 2017, 207, 2155–2160. [Google Scholar] [CrossRef]
- Cheng, L.; Li, J.; Xue, X.; Tang, B.; Kou, H.; Bouzy, E. Superplastic deformation mechanisms of high Nb containing TiAl alloy with (α2 + γ) microstructure. Intermetallics 2016, 75, 62–71. [Google Scholar] [CrossRef]
- Cheng, L.; Li, J.; Xue, X.; Tang, B.; Kou, H.; Perroud, O.; Bouzy, E. Effect of β/B2 phase on cavitation behavior during superplastic deformation of TiAl alloys. J. Alloys Compd. 2017, 693, 749–759. [Google Scholar] [CrossRef]
- Sun, Y.; Wan, Z.; Hu, L.; Ren, J. Characterization of hot processing parameters of powder metallurgy TiAl-based alloy based on the activation energy map and processing map. Mater. Des. 2015, 86, 922–932. [Google Scholar] [CrossRef]
- Zhang, D.; Li, H.; Liang, X.; Wei, Z.; Liu, Y. Microstructure characteristic for high temperature deformation of powder metallurgy Ti-47Al-2Cr-0.2Mo alloy. Mater. Des. 2014, 59, 415–420. [Google Scholar] [CrossRef]
- Godor, F.; Werner, R.; Lindemann, J.; Clemens, H.; Mayer, S. Characterization of the high temperature deformation behavior of two intermetallic TiAl-Mo alloys. Mater. Sci. Eng. A 2015, 648, 208–216. [Google Scholar] [CrossRef]
- Kong, F.; Cui, N.; Chen, Y.; Wang, X.; Xiong, N. Characterization of hot deformation behavior of as-forged TiAl alloy. Intermetallics 2014, 55, 66–72. [Google Scholar] [CrossRef]
- Schwaighofer, E.; Clemens, H.; Lindemann, J.; Stark, A.; Mayer, S. Hot-working behavior of an advanced intermetallic multi-phase γ-TiAl based alloy. Mater. Sci. Eng. A 2014, 614, 297–310. [Google Scholar] [CrossRef] [Green Version]
- Niu, H.; Kong, F.; Chen, Y.; Zhang, C. Low-temperature superplasticity of forged Ti-43Al-4Nb-2Mo-0.5B alloy. J. Alloys Compd. 2012, 543, 19–25. [Google Scholar] [CrossRef]
- Zhang, C.; Zhang, K. Superplasticity of a γ-TiAl alloy and its microstructure and cavity evolution in deformation. J. Alloys Compd. 2010, 492, 236–240. [Google Scholar] [CrossRef]
- Wang, Y.; Wang, J.; Yang, J. Superplastic behavior of a high-Cr TiAl alloy in its cast state. J. Alloys Compd. 2004, 364, 93–98. [Google Scholar] [CrossRef]
- Imayev, R.; Salishchev, G.; Senkov, O.; Imayev, V.; Shagiev, M.; Gabdullin, N.; Kuznetsov, A.; Froes, F. Low-temperature superplasticity of titanium aluminides. Mater. Sci. Eng. A 2001, 300, 263–277. [Google Scholar] [CrossRef]
- Imayev, R.; Shagiev, M.; Salishchev, G.; Imayev, V.; Valitov, V. Superplasticity and hot rolling of two-phase intermetallic alloy based on TiAl. Scr. Mater. 1996, 34, 985–991. [Google Scholar] [CrossRef]
- Chu, Y.; Li, J.; Zhao, F.; Tang, B.; Kou, H. Flow behavior and constitutive relationship for elevated temperature compressive deformation of a high Nb containing TiAl alloy with (α2 + γ) microstructure. Mater. Lett. 2018, 210, 58–61. [Google Scholar] [CrossRef]
- Chu, Y.; Li, J.; Zhao, F.; Tang, B.; Kou, H. Characterization of the elevated temperature compressive deformation behavior of high Nb containing TiAl alloys with two microstructures. Mater. Sci. Eng. A 2018, 725, 466–478. [Google Scholar] [CrossRef]
- Appel, F.; Paul, J.D.H.; Oehring, M. Gamma Titanium Aluminide Alloys: Science and Technology; Wiley-VCH: Weinheim, Germany, 2011. [Google Scholar]
- Humphreys, F.J.; Hatherly, M. Recrystallization and Related Annealing Phenomena, 2nd ed.; Elsevier: Amsterdam, The Netherlands, 2004. [Google Scholar]
- Zambaldi, C.; Zaefferer, S.; Wright, S.I. Characterization of order domains in γ-TiAl by orientation microscopy based on electron backscatter diffraction. J. Appl. Crystallogr. 2009, 42, 1092–1101. [Google Scholar] [CrossRef] [Green Version]
- Mingard, K.P.; Day, A.P.; Quested, P.N. Recent developments in two fundamental aspects of electron backscatter diffraction. IOP Conf. Ser. Mater. Sci. Eng. 2014, 55, 012011. [Google Scholar] [CrossRef] [Green Version]
- Li, J.; Liu, Y.; Wang, Y.; Liu, B.; He, Y. Dynamic recrystallization behavior of an as-cast TiAl alloy during hot compression. Mater. Charact. 2014, 97, 169–177. [Google Scholar] [CrossRef]
- Bartels, A.; Kestler, H.; Clemens, H. Deformation behavior of differently processed γ-titanium aluminides. Mater. Sci. Eng. A 2002, 329, 153–162. [Google Scholar] [CrossRef]
- Hasegawa, M.; Yamamoto, M.; Fukutomi, H. Formation mechanism of texture during dynamic recrystallization in γ-TiAl, nickel and copper examined by microstructure observation and grain boundary analysis based on local orientation measurements. Acta Mater. 2003, 51, 3939–3950. [Google Scholar] [CrossRef]
- Cheng, L.; Chang, H.; Tang, B.; Kou, H.; Li, J. Deformation and dynamic recrystallization behavior of a high Nb containing TiAl alloy. J. Alloys Compd. 2013, 552, 363–369. [Google Scholar] [CrossRef]
- Wang, Y.; Liu, Y.; Yang, G.; Li, J.; Liu, B.; Wang, J.; Li, H. Hot deformation behaviors of β phase containing Ti-43Al-4Nb-1.4W-based alloy. Mater. Sci. Eng. A 2013, 577, 210–217. [Google Scholar] [CrossRef]
- Wang, G.; Xu, L.; Tian, Y.; Zheng, Z.; Cui, Y.; Yang, R. Flow behavior and microstructure evolution of a P/M TiAl alloy during high temperature deformation. Mater. Sci. Eng. A 2011, 528, 6754–6763. [Google Scholar] [CrossRef]
- Wang, Y.; Shao, W.; Zhen, L.; Zhang, X. Microstructure evolution during dynamic recrystallization of hot deformed superalloy 718. Mater. Sci. Eng. A 2008, 486, 321–332. [Google Scholar] [CrossRef]
- Bartels, A.; Schillinger, W. Micromechanical mechanism of texture formation in γ-TiAl. Intermetallics 2001, 9, 883–889. [Google Scholar] [CrossRef]
Figure 1.
Scanning electron microscope (SEM) images in backscattered electron (BSE) mode of the alloy prior to (a) and after compression deformation under 1000 °C with the strain rate of 10−2 s−1 (b) and 5 × 10⁻⁴ s−1 (c) and under 1050 °C with the strain rate of 10−4 s−1 (d).
Figure 1.
Scanning electron microscope (SEM) images in backscattered electron (BSE) mode of the alloy prior to (a) and after compression deformation under 1000 °C with the strain rate of 10−2 s−1 (b) and 5 × 10⁻⁴ s−1 (c) and under 1050 °C with the strain rate of 10−4 s−1 (d).

Figure 2.
EBSD-derived phase maps with highlighted boundaries showing the microstructure of the alloy prior to (a) and after compression deformation under 1000 °C with the strain rate of 10−2 s−1 (b) and 5 × 10⁻⁴ s−1 (c) and under 1050 °C with the strain rate of 10−4 s−1 (d). (Yellow—γ phase, red—α2 phase, green—β/βo phase; blue line—high angle grain boundaries (HAGB), green line—low angle grain boundaries (LAGB), red line—twin boundaries (TB)).

Figure 3.
Histogram of γ grain size of the alloy prior to (a) and after compression deformation under 1000 °C with the strain rate of 10−2 s−1 (b) and 5 × 10⁻⁴ s−1 (c) and 10−4 s−1 (d) and under 1050 °C with strain rate of 10−4 s−1 (e).
Figure 3.
Histogram of γ grain size of the alloy prior to (a) and after compression deformation under 1000 °C with the strain rate of 10−2 s−1 (b) and 5 × 10⁻⁴ s−1 (c) and 10−4 s−1 (d) and under 1050 °C with strain rate of 10−4 s−1 (e).

Figure 4.
Histogram of γ grain boundary misorientation of the alloy prior to (a) and after compression deformation under 1000 °C with the strain rate of 10−2 s−1 (b) and 5 × 10⁻⁴ s−1 (c) and 10−4 s−1 (d) and under 1050 °C with the strain rate of 10−4 s−1 (e).
Figure 4.
Histogram of γ grain boundary misorientation of the alloy prior to (a) and after compression deformation under 1000 °C with the strain rate of 10−2 s−1 (b) and 5 × 10⁻⁴ s−1 (c) and 10−4 s−1 (d) and under 1050 °C with the strain rate of 10−4 s−1 (e).
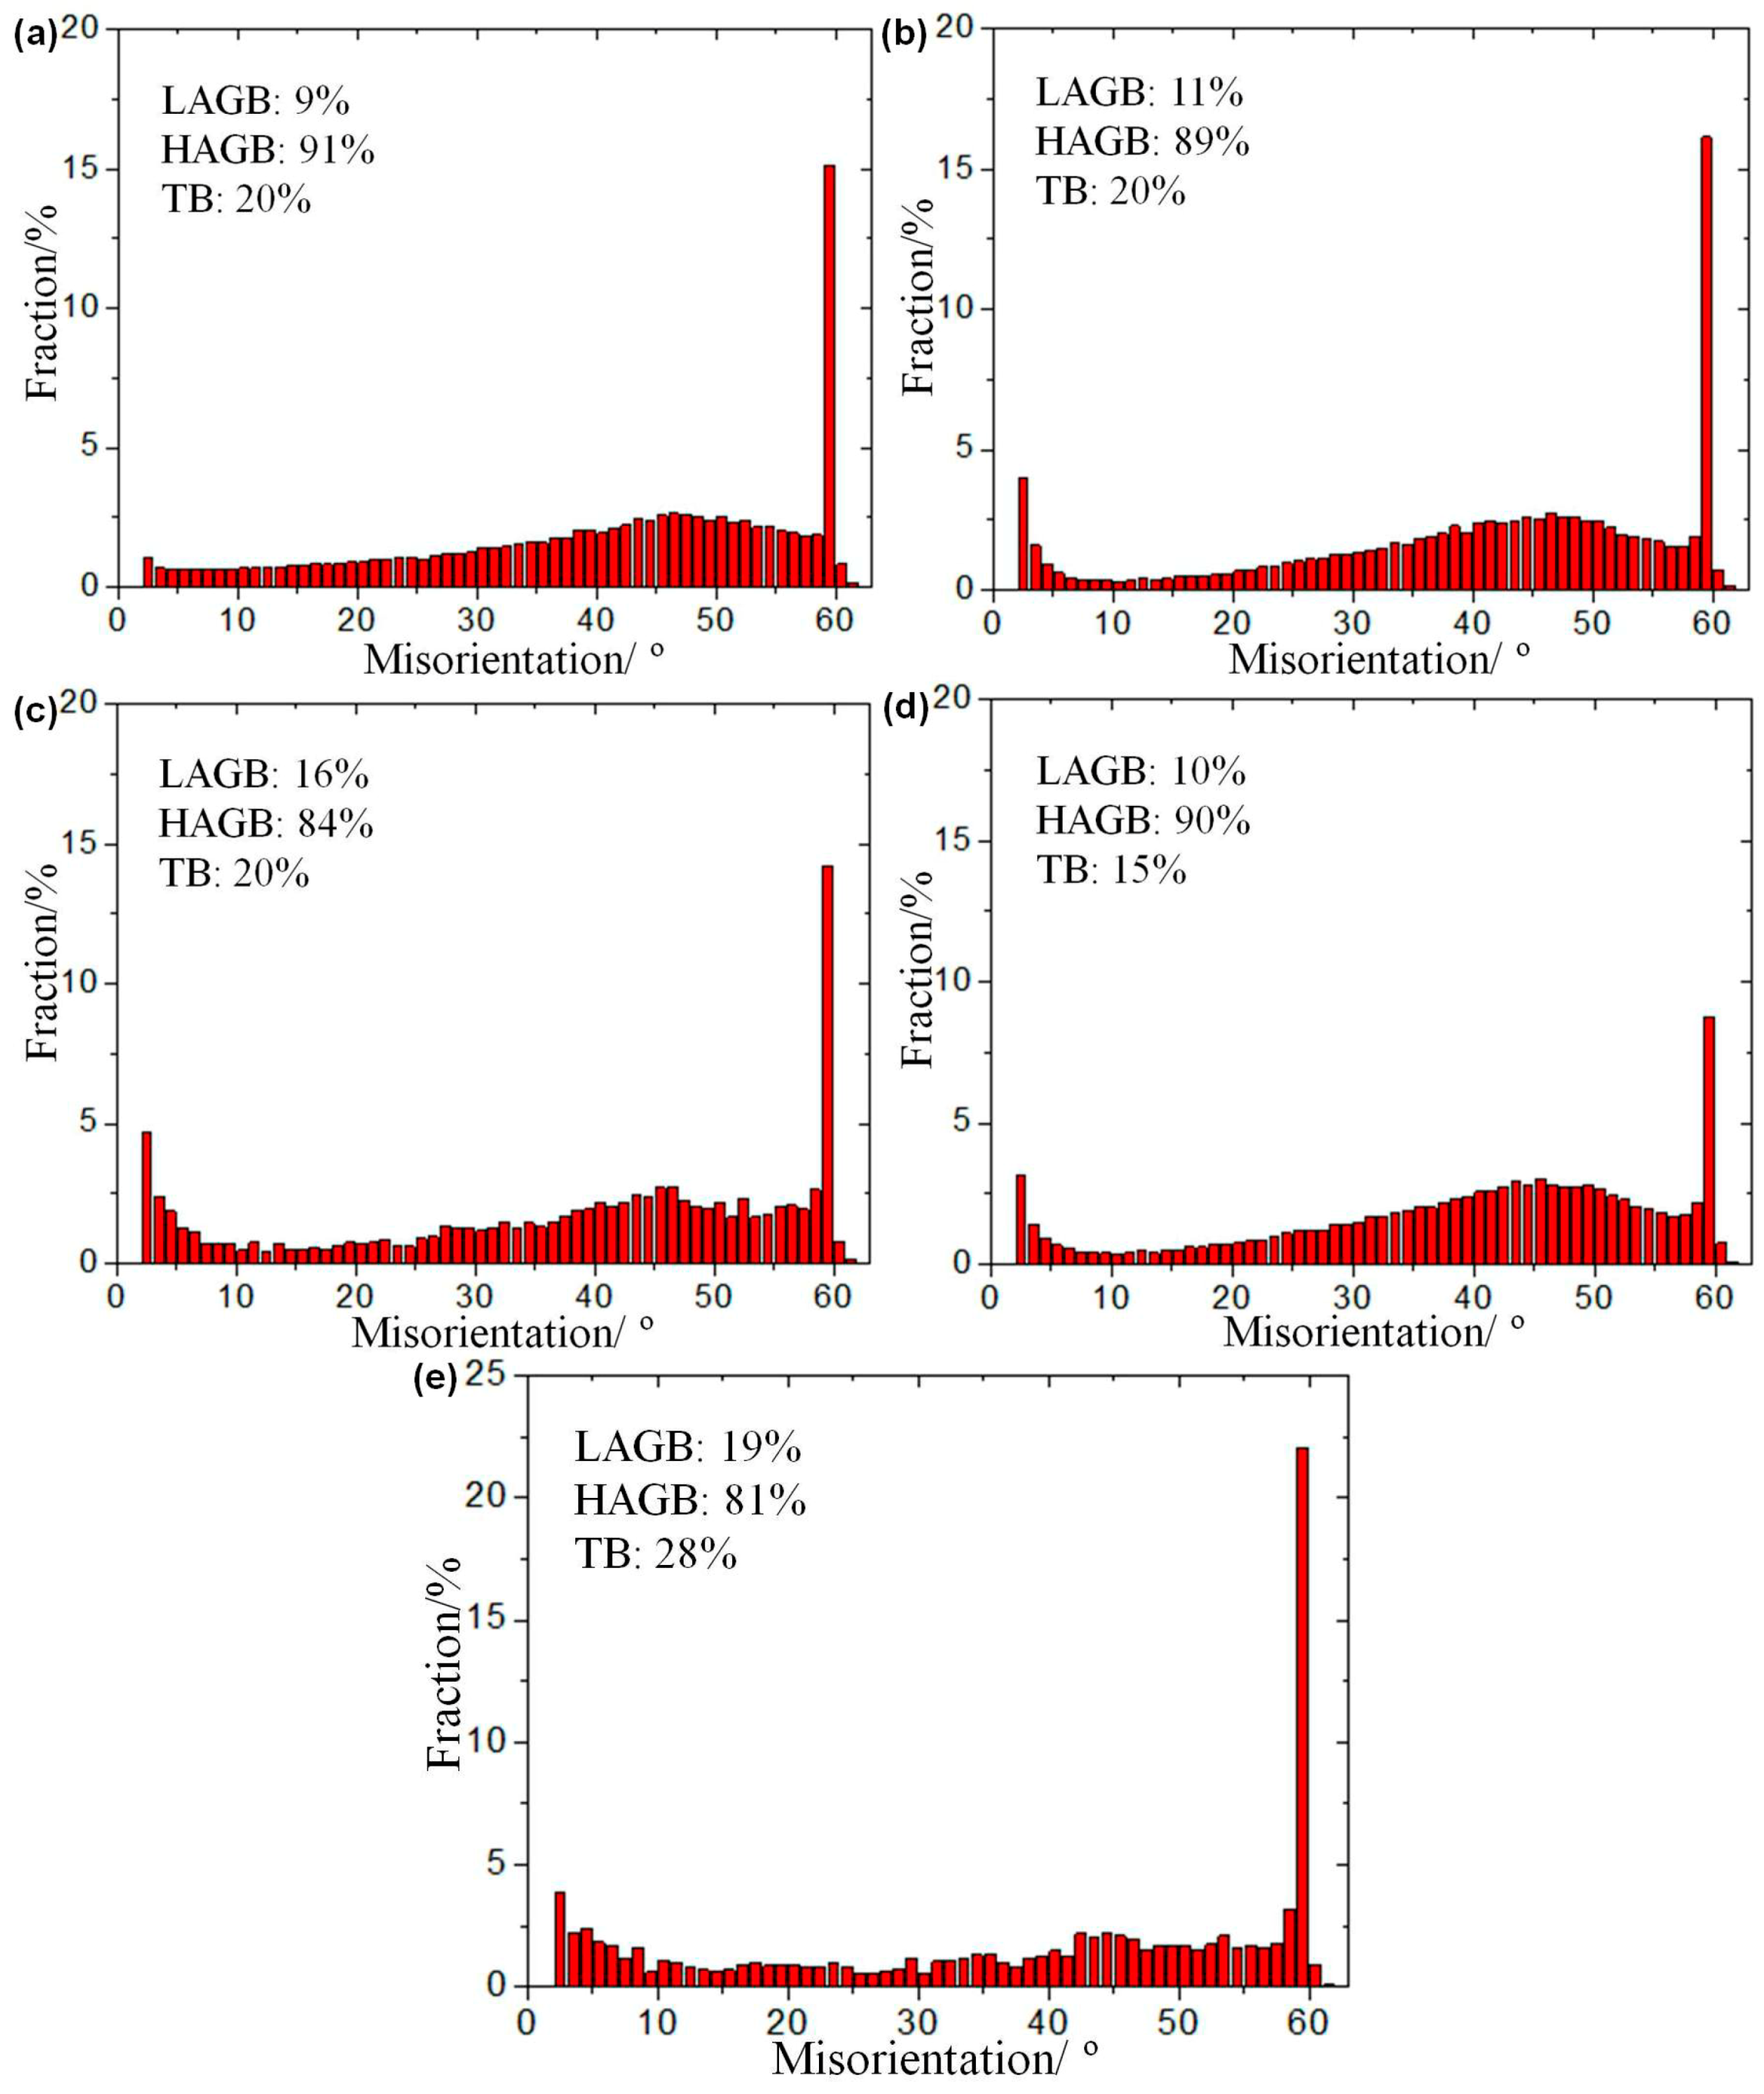
Figure 5.
Zener-Hollomon parameter dependence of dynamic recrystallization (DRX) γ grain size of the alloy under different deformation condition.
Figure 5.
Zener-Hollomon parameter dependence of dynamic recrystallization (DRX) γ grain size of the alloy under different deformation condition.
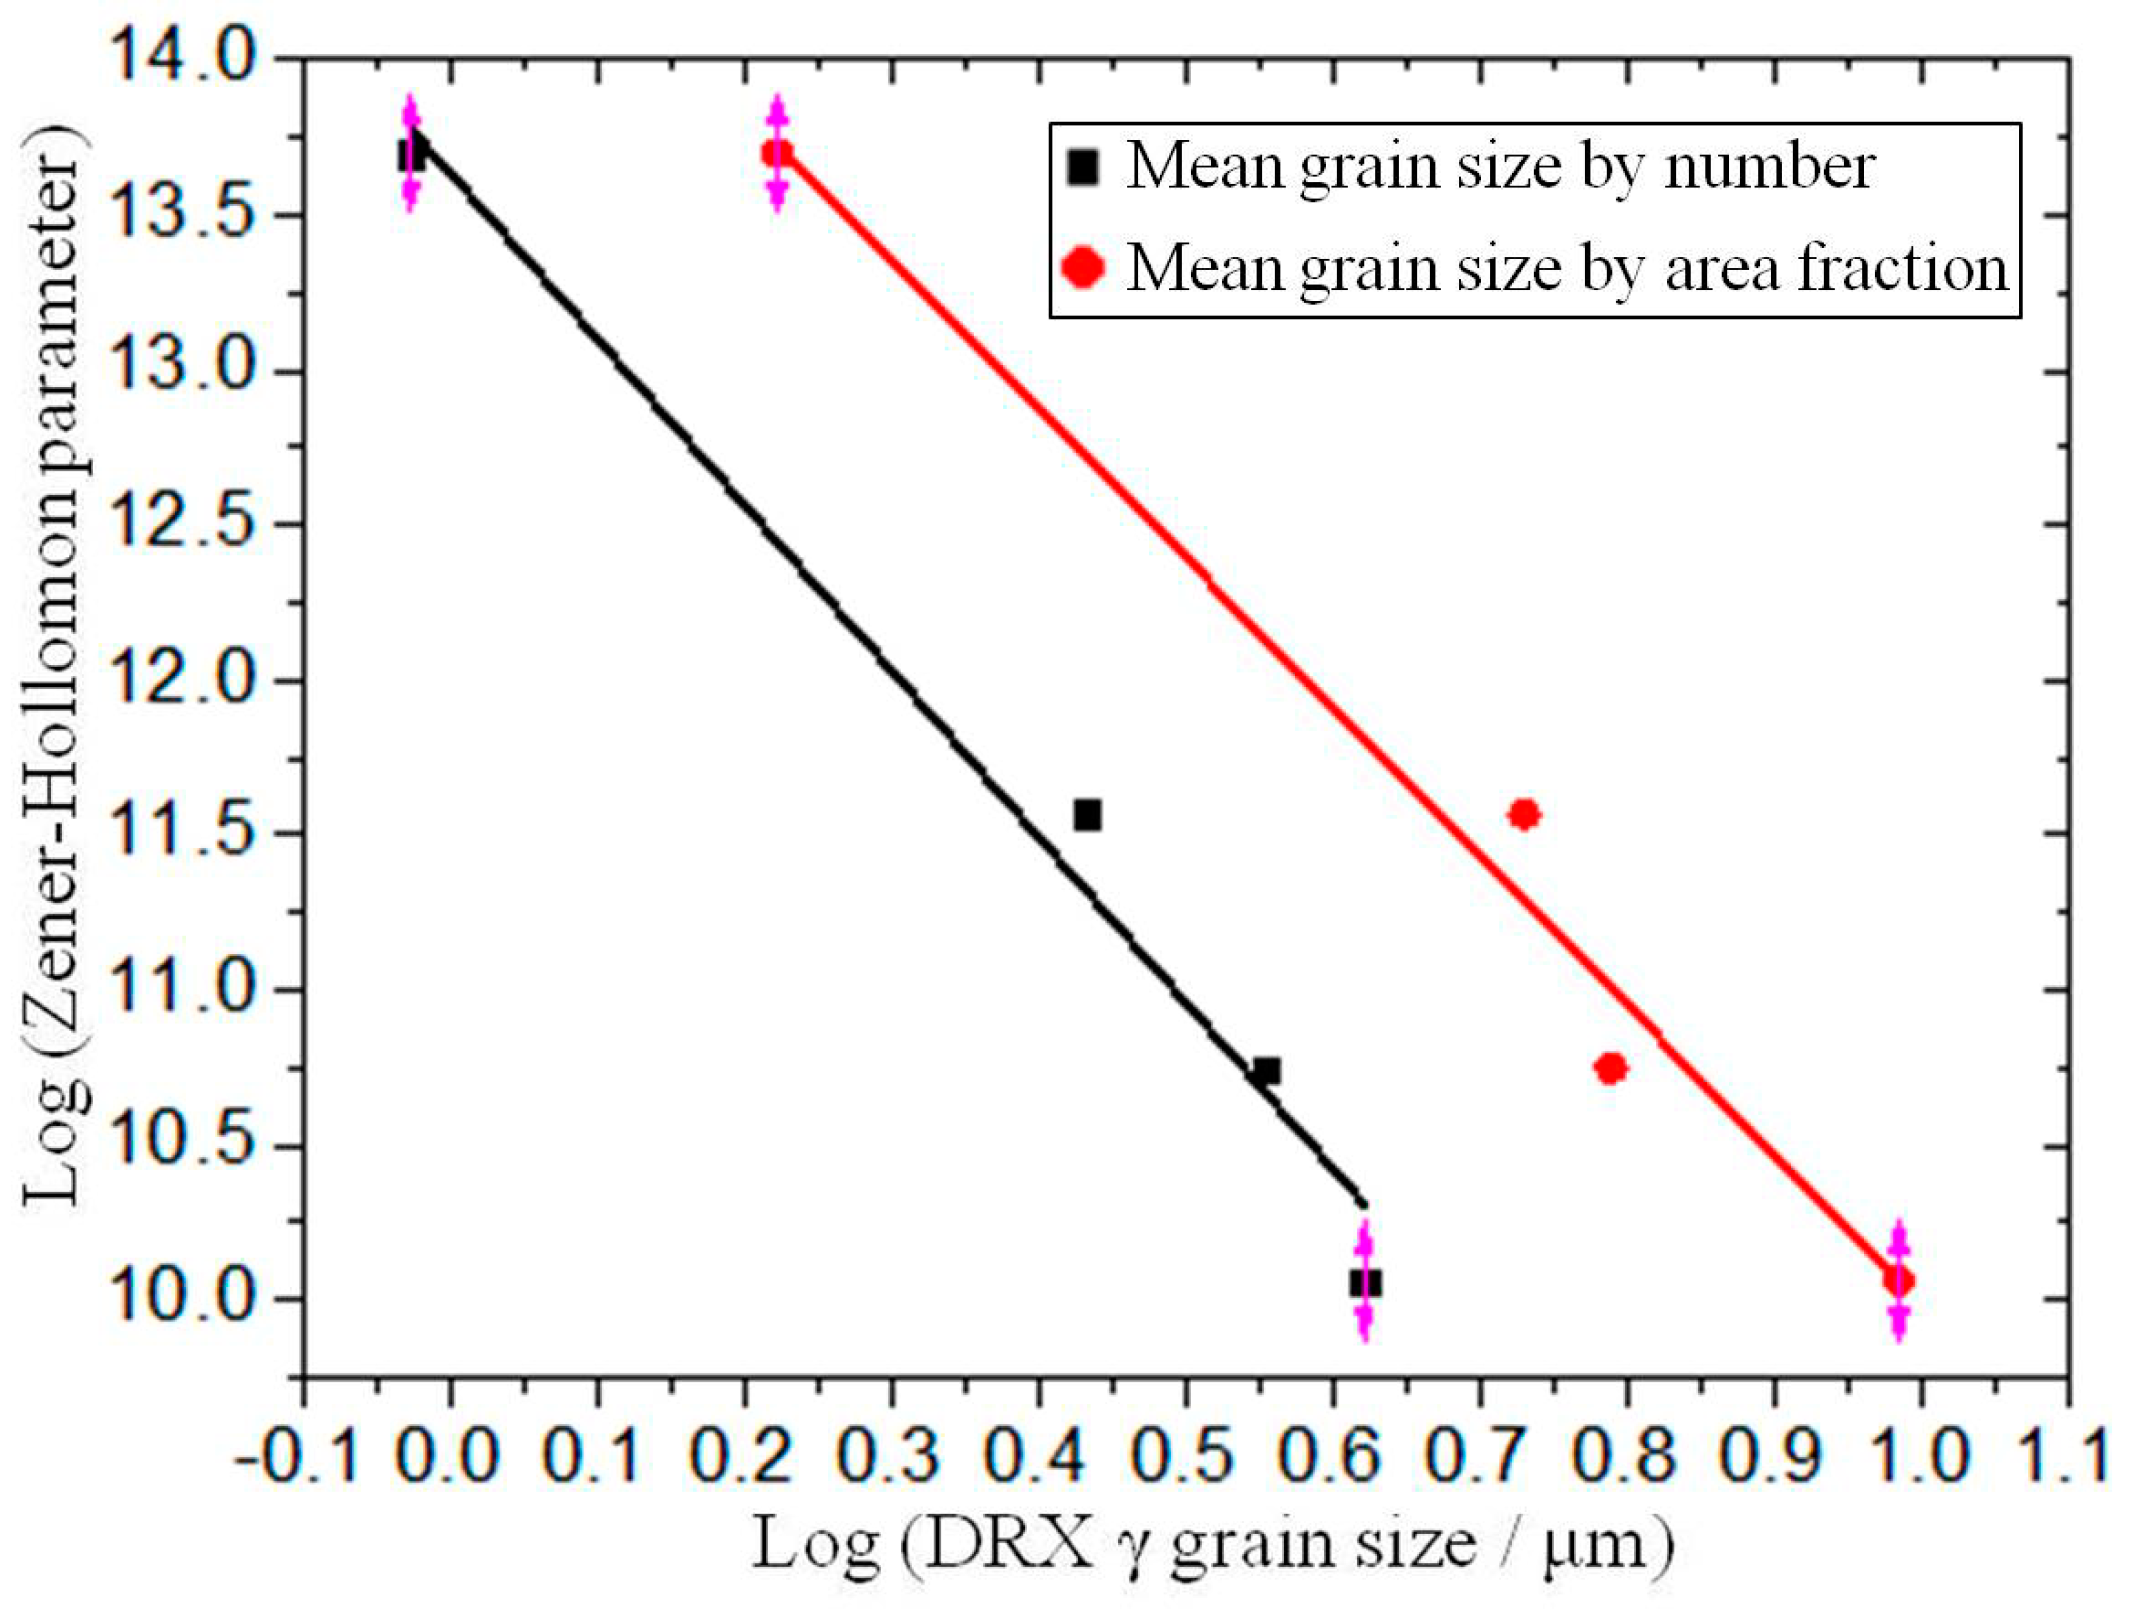
Figure 6.
SEM images in BSE mode of the alloy after compression deformation under 1000 °C/10−2 s−1/ε = 0.11 (a), 1000 °C/10−2 s−1/ε = 0.36 (b), 1000 °C/10−4 s−1/ε = 0.11 (c) and 1000 °C/10−4 s−1/ε = 0.36 (d).
Figure 6.
SEM images in BSE mode of the alloy after compression deformation under 1000 °C/10−2 s−1/ε = 0.11 (a), 1000 °C/10−2 s−1/ε = 0.36 (b), 1000 °C/10−4 s−1/ε = 0.11 (c) and 1000 °C/10−4 s−1/ε = 0.36 (d).

Figure 7.
Electron backscattered diffraction (EBSD)-derived phase maps with highlighted boundaries showing the microstructure of the alloy after compression deformation under 1000 °C/10−2 s−1/ε = 0.11 (a), 1000 °C/10−2 s−1/ε = 0.36 (b), 1000 °C/10−4 s−1/ε = 0.11 (c) and 1000 °C/10−4 s−1/ε = 0.36 (d). (Yellow—γ phase, red—α2 phase, green—β/βo phase; blue line—HAGB, green line—LAGB, red line—TB).
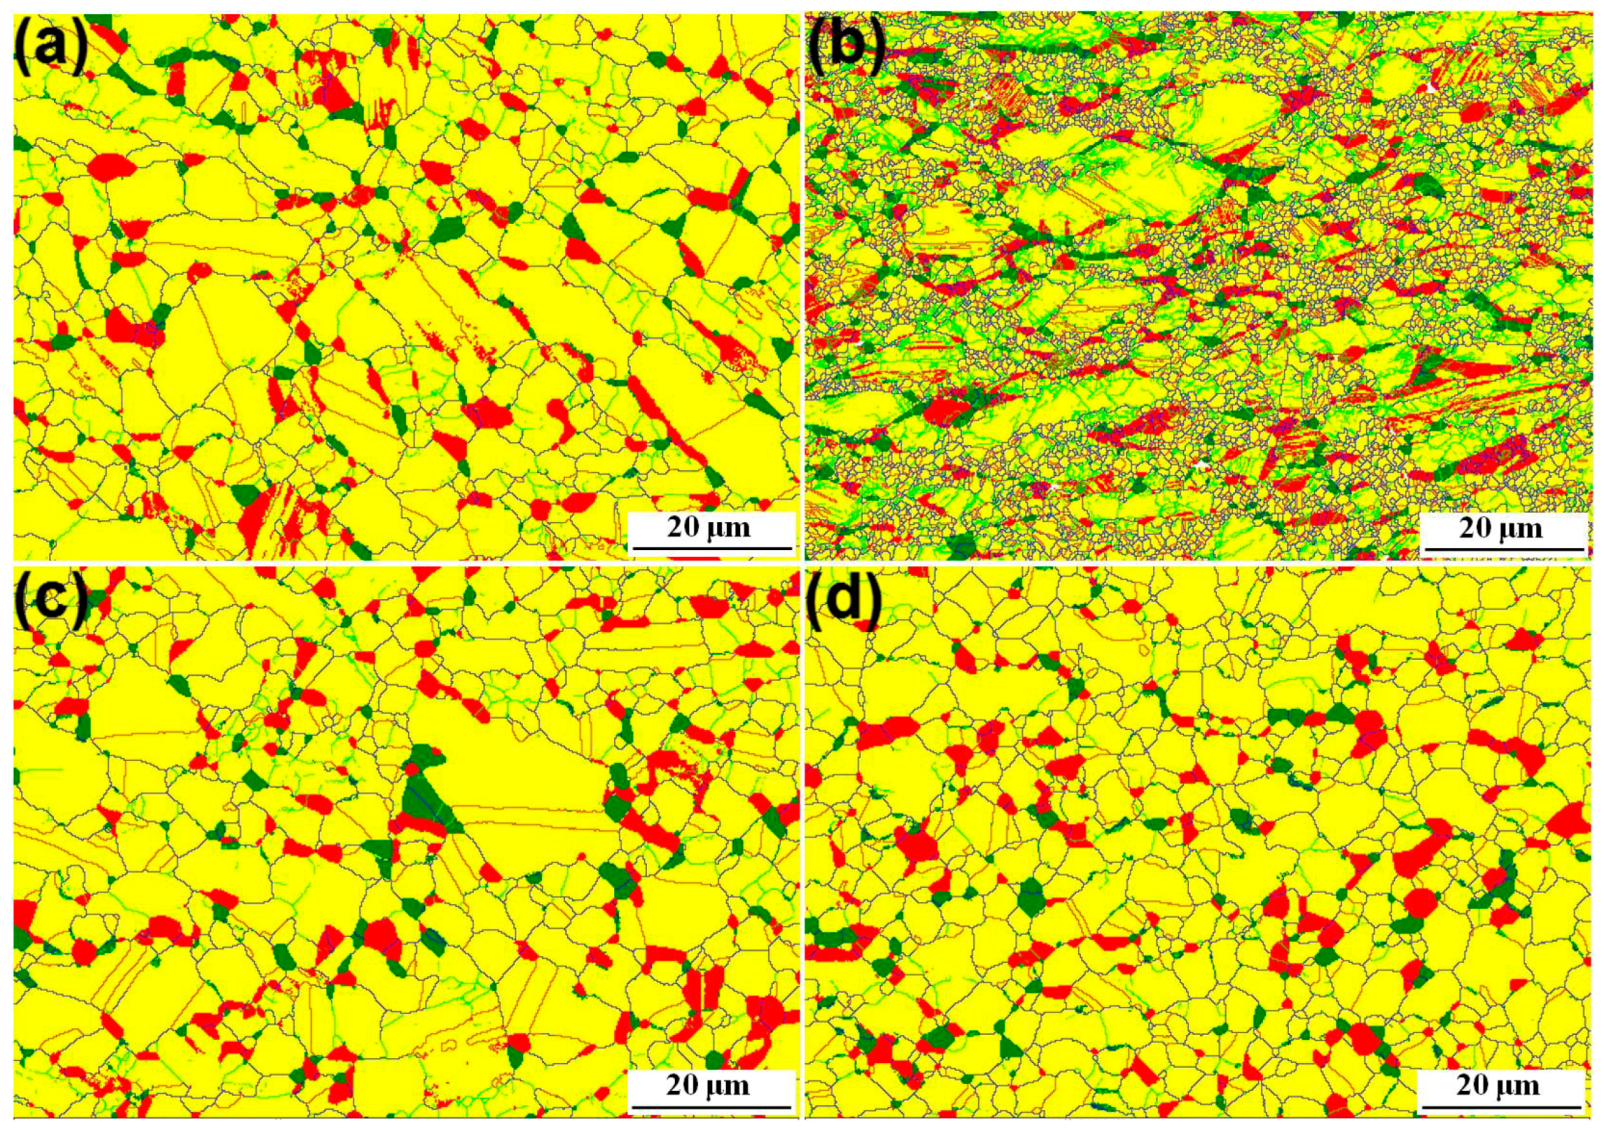
Figure 8.
Histogram of γ grain size of the alloy after compression deformation under 1000 °C/10−2 s−1/ε = 0.11 (a), 1000 °C/10−2 s−1/ε = 0.36 (b), 1000 °C/10−4 s−1/ε = 0.11 (c) and 1000 °C/10−4 s−1/ε = 0.36 (d).
Figure 8.
Histogram of γ grain size of the alloy after compression deformation under 1000 °C/10−2 s−1/ε = 0.11 (a), 1000 °C/10−2 s−1/ε = 0.36 (b), 1000 °C/10−4 s−1/ε = 0.11 (c) and 1000 °C/10−4 s−1/ε = 0.36 (d).

Figure 9.
Histogram of γ grain boundary misorientation of the alloy after compression deformation under 1000 °C/10−2 s−1/ε = 0.11 (a), 1000 °C/10−2 s−1/ε = 0.36 (b), 1000 °C/10−4 s−1/ε = 0.11 (c) and 1000 °C/10−4 s−1/ε = 0.36 (d).
Figure 9.
Histogram of γ grain boundary misorientation of the alloy after compression deformation under 1000 °C/10−2 s−1/ε = 0.11 (a), 1000 °C/10−2 s−1/ε = 0.36 (b), 1000 °C/10−4 s−1/ε = 0.11 (c) and 1000 °C/10−4 s−1/ε = 0.36 (d).

Figure 10.
Histogram of γ grain boundary misorientation at different angle scopes for the alloy deformed to different strains at 1000 °C with the strain rate of 10−2 s−1 (a) and 10−4 s−1 (b).
Figure 10.
Histogram of γ grain boundary misorientation at different angle scopes for the alloy deformed to different strains at 1000 °C with the strain rate of 10−2 s−1 (a) and 10−4 s−1 (b).

Figure 11.
Pole figure of γ phase for the alloy prior to (a) and after compression deformation under 1000 °C with the strain rate of 10−2 s−1 (b) and 10−4 s−1 (c).
Figure 11.
Pole figure of γ phase for the alloy prior to (a) and after compression deformation under 1000 °C with the strain rate of 10−2 s−1 (b) and 10−4 s−1 (c).
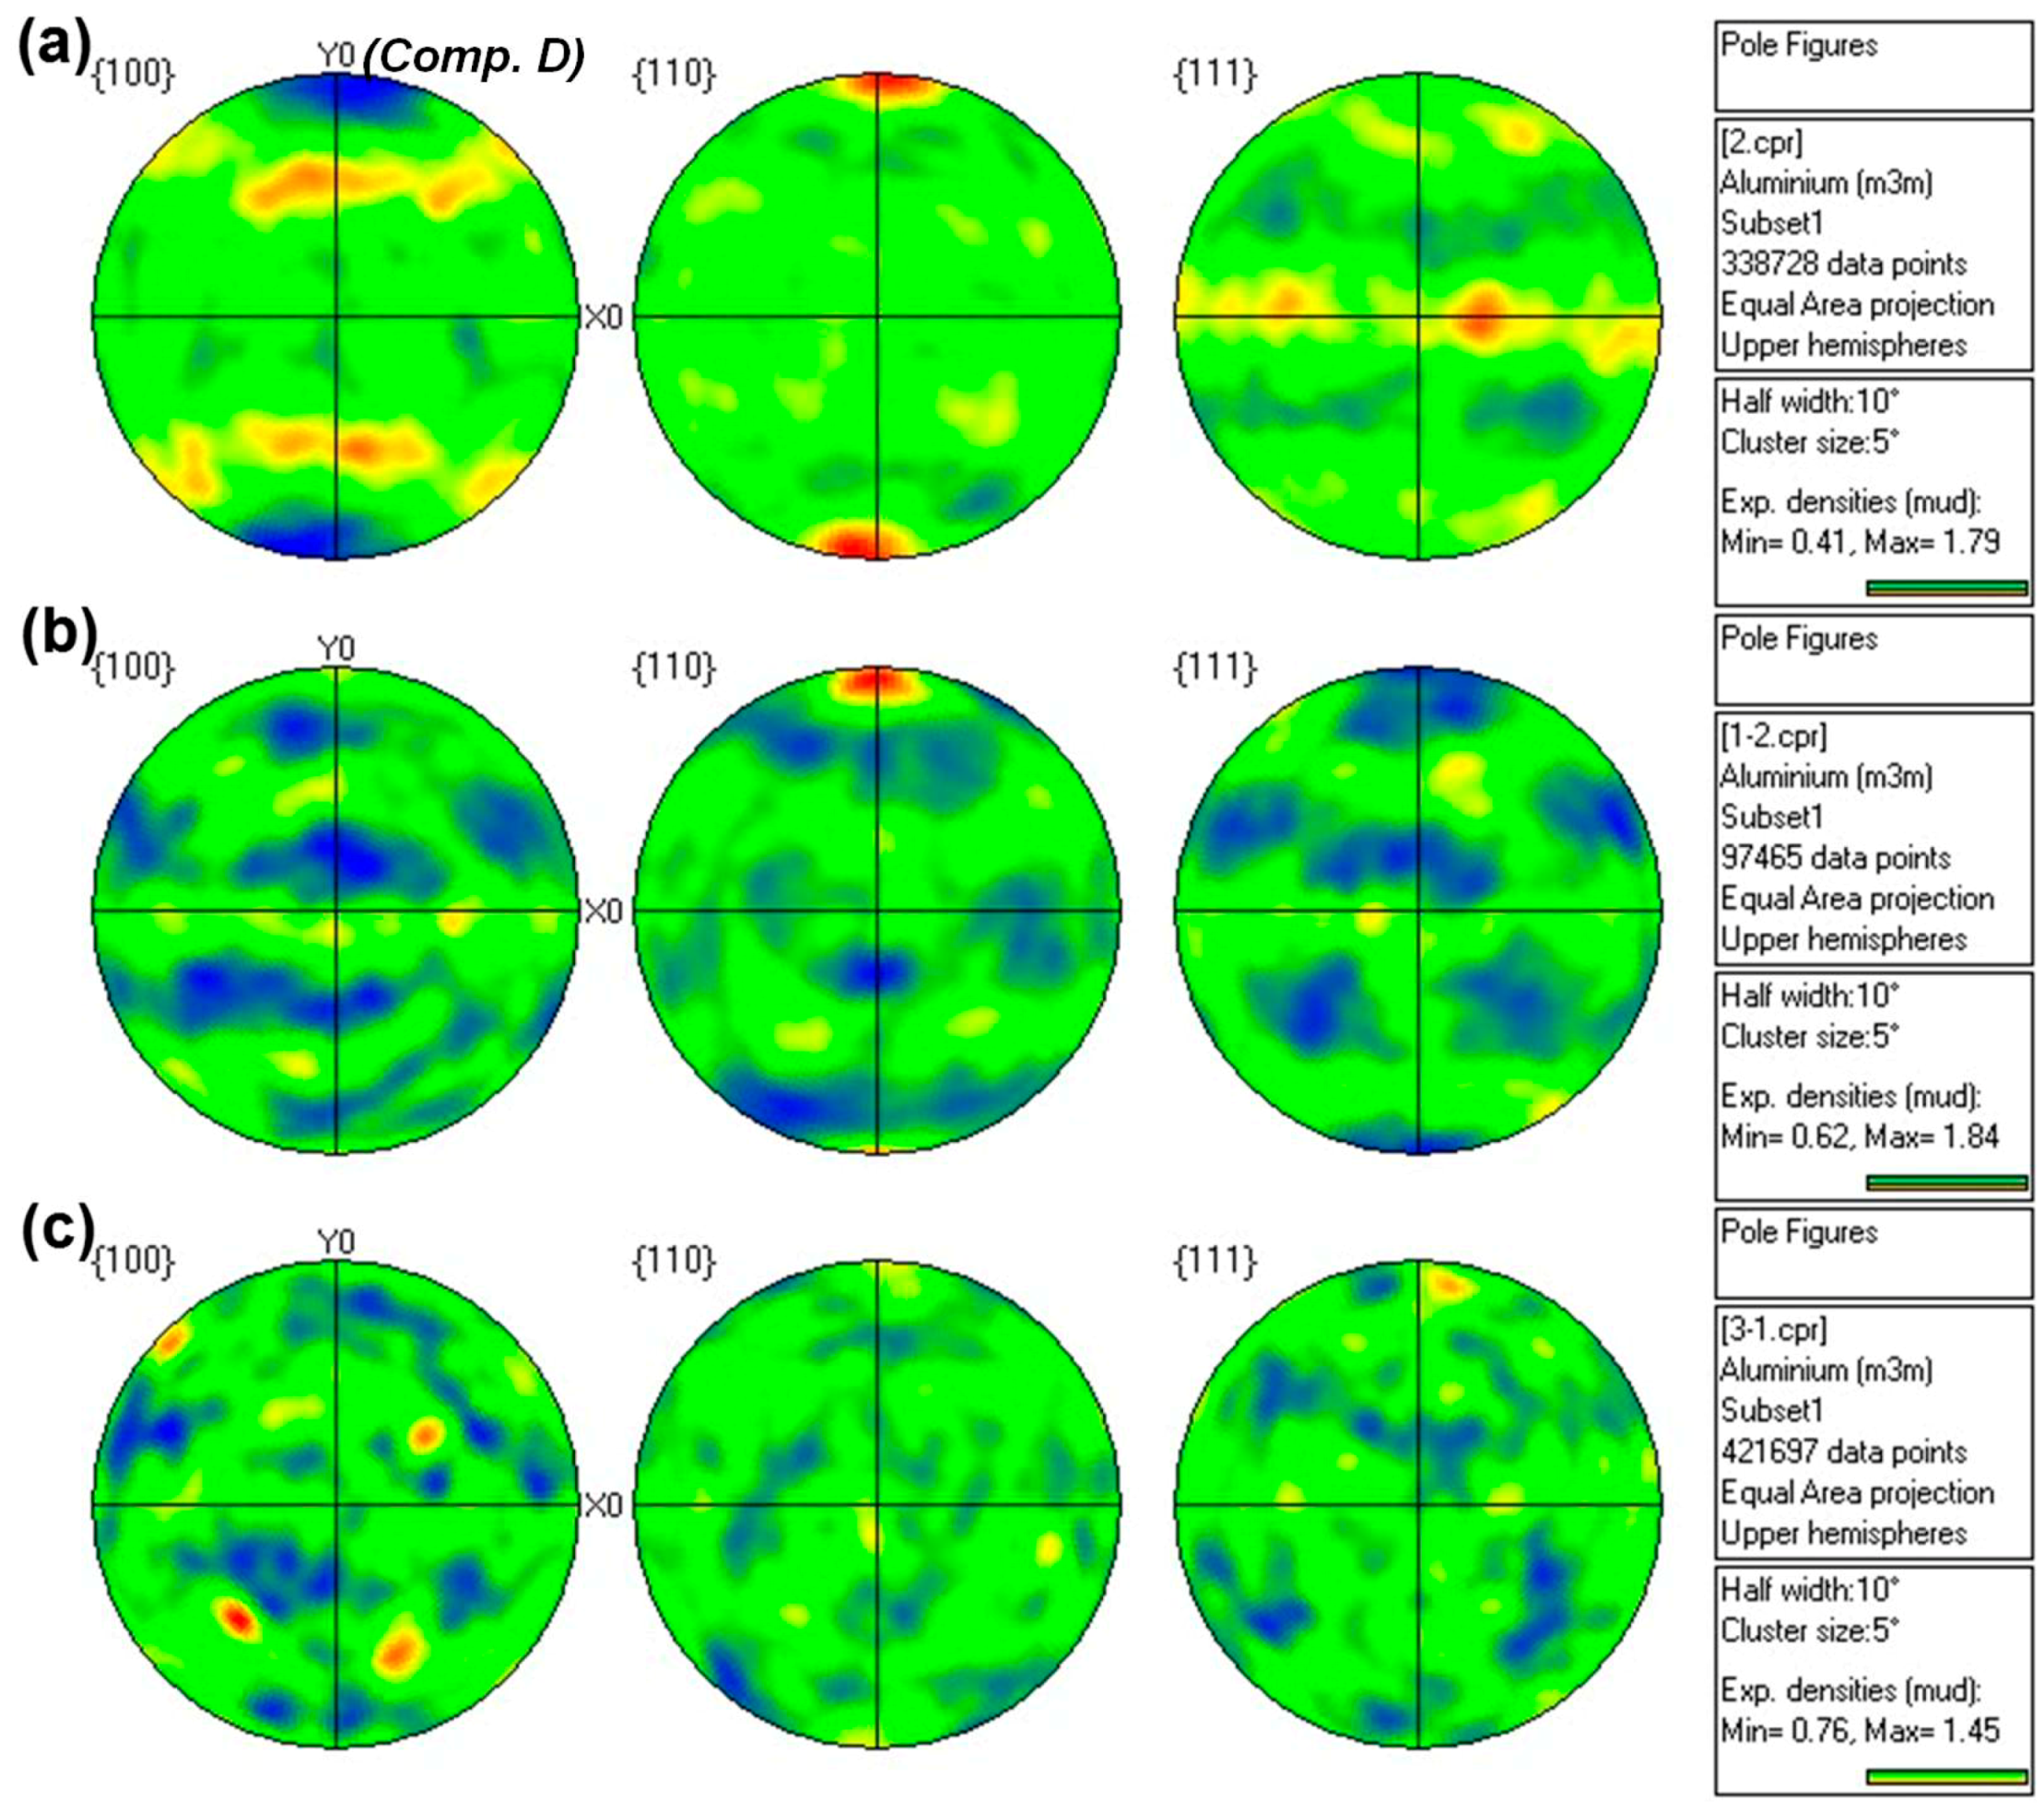
Figure 12.
Inverse pole figure of γ phase for the alloy prior to (a) and after compression deformation under 1000 °C with the strain rate of 10−2 s−1 (b) and 10−4 s−1 (c).
Figure 12.
Inverse pole figure of γ phase for the alloy prior to (a) and after compression deformation under 1000 °C with the strain rate of 10−2 s−1 (b) and 10−4 s−1 (c).


Table 1.
The calculated values of Z under different deformation conditions.
| Deformation Condition | Ln(Z) | Log(Z) |
|---|---|---|
| 1000 °C/10−2 s−1 | 31.5 | 13.7 |
| 1000 °C/5 × 10−4 s−1 | 26.6 | 11.6 |
| 1000 °C/10−4 s−1 | 24.7 | 10.7 |
| 1050 °C/10−4 s−1 | 23.2 | 10.1 |
© 2018 by the authors. Licensee MDPI, Basel, Switzerland. This article is an open access article distributed under the terms and conditions of the Creative Commons Attribution (CC BY) license (http://creativecommons.org/licenses/by/4.0/).
Share and Cite
MDPI and ACS Style
Chu, Y.; Li, J.; Zhu, L.; Liu, Y.; Tang, B.; Kou, H. Microstructure Evolution of a High Nb Containing TiAl Alloy with (α2 + γ) Microstructure during Elevated Temperature Deformation. Metals 2018, 8, 916. https://doi.org/10.3390/met8110916
AMA Style
Chu Y, Li J, Zhu L, Liu Y, Tang B, Kou H. Microstructure Evolution of a High Nb Containing TiAl Alloy with (α2 + γ) Microstructure during Elevated Temperature Deformation. Metals. 2018; 8(11):916. https://doi.org/10.3390/met8110916
Chicago/Turabian StyleChu, Yudong, Jinshan Li, Lei Zhu, Yan Liu, Bin Tang, and Hongchao Kou. 2018. "Microstructure Evolution of a High Nb Containing TiAl Alloy with (α2 + γ) Microstructure during Elevated Temperature Deformation" Metals 8, no. 11: 916. https://doi.org/10.3390/met8110916
Note that from the first issue of 2016, this journal uses article numbers instead of page numbers. See further details here.