Article

Effect of Small Additions of Cr, Ti, and Mn on the Microstructure and Hardness of Al–Si–Fe–X Alloys

by
Víctor A. Aranda
1,2,
Ignacio A. Figueroa
2,*,
Gonzalo González
2,
J. Alejandro García-Hinojosa
1 and
Gabriel A. Lara-Rodríguez
2
1
Departamento de Ingeniería Metalúrgica, Facultad de Química, Universidad Nacional Autónoma de México, Circuito exterior, Ciudad Universitaria, Coyoacán, Ciudad de México 04510, Mexico
2
Instituto de Investigaciones en Materiales, Universidad Nacional Autónoma de México, Circuito exterior, Ciudad Universitaria, Coyoacán, Ciudad de México 04510, Mexico
*
Author to whom correspondence should be addressed.
Metals 2019, 9(2), 136; https://doi.org/10.3390/met9020136
Submission received: 1 December 2018 / Revised: 10 January 2019 / Accepted: 11 January 2019 / Published: 27 January 2019
(This article belongs to the Special Issue Intermetallic Alloys)

Abstract

:
The Al–Si–Fe system has drawn the attention of the scientific community due to its capacity to replace parts in several manufacturing industries, as this alloy system is very sensitive to small additions of transition metals. Therefore, the aim of this work is to study the effect of Cr, Ti, and Mn additions in the Al–20Si–5Fe (wt. %) alloy and to study the modification of the iron intermetallic and the microstructural refinement through the formation of secondary phases. Al–20Si–5Fe–X (X = Cr, Mn and Ti at 1.0, 3.0, and 5.0 wt. %) alloy ingots were prepared by arc melting furnace. The elemental chemical analysis was performed by X-ray fluorescence spectrometry (XRF). The microstructure of all samples was investigated by scanning electron microscopy and X-ray diffraction. Finally, microhardness was measured in order correlate the hardness with the formation of the different compounds. The highest hardness was found for the alloy with the 5 wt. % Cr. The addition of Ti and Mn raised the hardness by ~35 HVN (Vickers microhardness) when compared to that of AlSiFe master alloy. Important changes were also observed in the microstructure. Depending on the Cr, Ti, and Mn additions, the resulting microstructure was dendritic (CrFe), acicular (Ti5Si3), and “bone like” (Mn0.2Fe0.8), respectively.

1. Introduction

Aluminum (Al) alloys have many applications, especially in the automotive and the aeronautical industry [1,2,3]. In recent years, AlSiFe based alloys have been of interest of the scientific community due to their ability to replace cast iron parts in several manufacturing industries. The properties of these alloys are greatly dependent on the morphology, size, and distribution of primary silicon (Si) particles [4,5,6,7,8]. This importance has been based, mainly, on the mechanical and chemical properties, such as tensile stress, ductility and corrosion resistance. Iron (Fe) is one of the most important impurities in Al alloy castings, as it forms intermetallics such as α (Fe2SiAl8) and β (FeSiAl5) [7,8], which affect the mechanical properties.
It has been demonstrated that alloying Al-based alloys with transition metals such as Fe, Mn, or Cr considerably improves the thermal stability of these alloys, being important for applications at elevated temperatures. These elements have low diffusion coefficients and low solubility in the Al solid solution, forming thermally stable phases [3].
Manganese (Mn) is the most common alloying addition; this has been used to modify the morphology and type of intermetallic phases, in Al cast alloys. It has been reported that additions of Cr can have a similar effect, but the microstructural details are not that clear [2,9]. This element (Cr) occupies the same crystal site in the body center cubic (BCC), Al15X3Si2 structure (where X = Fe, Mn, Cr). The morphology of this intermetallic phase has been reported as Chinese script, star-like, or polygonal. These complex intermetallic compounds have high density and tend to segregate at the bottom of Al melts [10]. There are few publications about the effect of Titanium (Ti) on Al–Si–Fe ternary alloys at levels above 1 wt. % [1]. Wang et al. reported the benefits of Ti as a grain-refining agent and the formation of very hard intermetallics that embrittled the investigated Al alloys [11].
The intermetallic compounds presented in this study, in general terms, are formed with increasing the amount of alloy elements, resulting in complex microstructures and degrading the mechanical properties. These compounds have many applications in different materials, e.g. in high entropy alloys (HEAs) and stainless steels, just to mention a few. However, for stainless steels, the addition of Cr, Ti, and Mn are widely used in components designed for high temperature applications like superheaters and chemical reactor chambers [12]. The σ-CrFe intermetallic compound can be found in several alloy families, which is characterized for having few slip systems, becoming brittle and hard. For conventional engineering alloys, this intermetallic is usually considered as detrimental phase, since it is considered as a precursor of the initiation of cracks and the propagation of fracture [13]. On the other hand, the Ti5Si3 intermetallic has been studied as a candidate material for high temperature applications, due to its high melting point (2130 °C), low density (~ 4.26 g/cm3), capacity to retain high strength up to 1200 °C, and good oxidation resistance [14].
From the above, it is clear that a more detailed investigation is highly pertinent. The technological attractiveness of this alloy requires an investigation, with alloying additions above 1 wt. % in order to evaluate the probable formation of other phases that could influence, in conventional solidification, the mechanical properties of such alloys. Therefore, the aim of this work is to study the effect of Cr, Ti, and Mn additions on the Al–20Si–5Fe (wt. %) alloy microstructure. The modification of the Al3FeSi2 intermetallic, the refinement of the microstructure and the formation of secondary phases will also be assessed.

2. Materials and Methods

Several alloy ingots with the nominal composition of Al–20Si–5Fe-X (X = 1.0, 3.0 and 5.0 wt. %) were prepared by arc melting mixtures of Al (99.9%), Si (99%), Fe (99.98%), Cr (99.9%), Ti (99.6%), and Mn (99%). The weighed elements were melted on a water-cooled copper hearth in the arc furnace to produce alloy buttons of mass typically between 3 and 5 g (Compact Arc Melter MAM-1, Edmund Bühler, Bodelshausen, Germany). The argon arc melting chamber was pumped down to a rough vacuum and flushed out with argon 3 times to ensure a low oxygen starting atmosphere. The chamber was then evacuated to <10−5 torr (10−3 Pa) before being backed filled to 1/3 atm (~30 KPa) of high purity Ar gas. A Ti button of mass 10 g was melted in the chamber prior to the melting of the alloy sample in order to minimize residual oxygen in the chamber, and thus minimize oxidation of the alloy (known as oxygen “gettering”).
Each alloy ingot was re-melted at least six times to ensure good chemical homogeneity, and then an elemental chemical analysis was performed by means of a Bruker Titan S1 X-ray fluorescence spectrometry (XRF) (Billerica, MA, US). The ingots were cut and mounted in Bakelite for the metallographic characterization, following the ASTM E-03. Then the samples were etched using Kroll´s reagent (5 mL HNO3, 10mL HF, 85 mL H2O) for 4 s.
The microstructure of all samples was investigated by scanning electron microscopy (SEM-JEOL D6000, (Tokyo, Japan). Phase composition was determined by X-ray diffraction with a Bruker D8 advance difractometer, with Cu-Kα radiation (Billerica, MA, US). Finally, Vickers microhardness (HVN) was measured with a Shimadzu microdurometer (Kyoto, Japan); model HMV-G, with a load of 4.903 N (HV 0.5 kgf) for 10 seconds (ASTM E-384). The experimental error was calculated following the student´s t distribution with 95% of confidence.

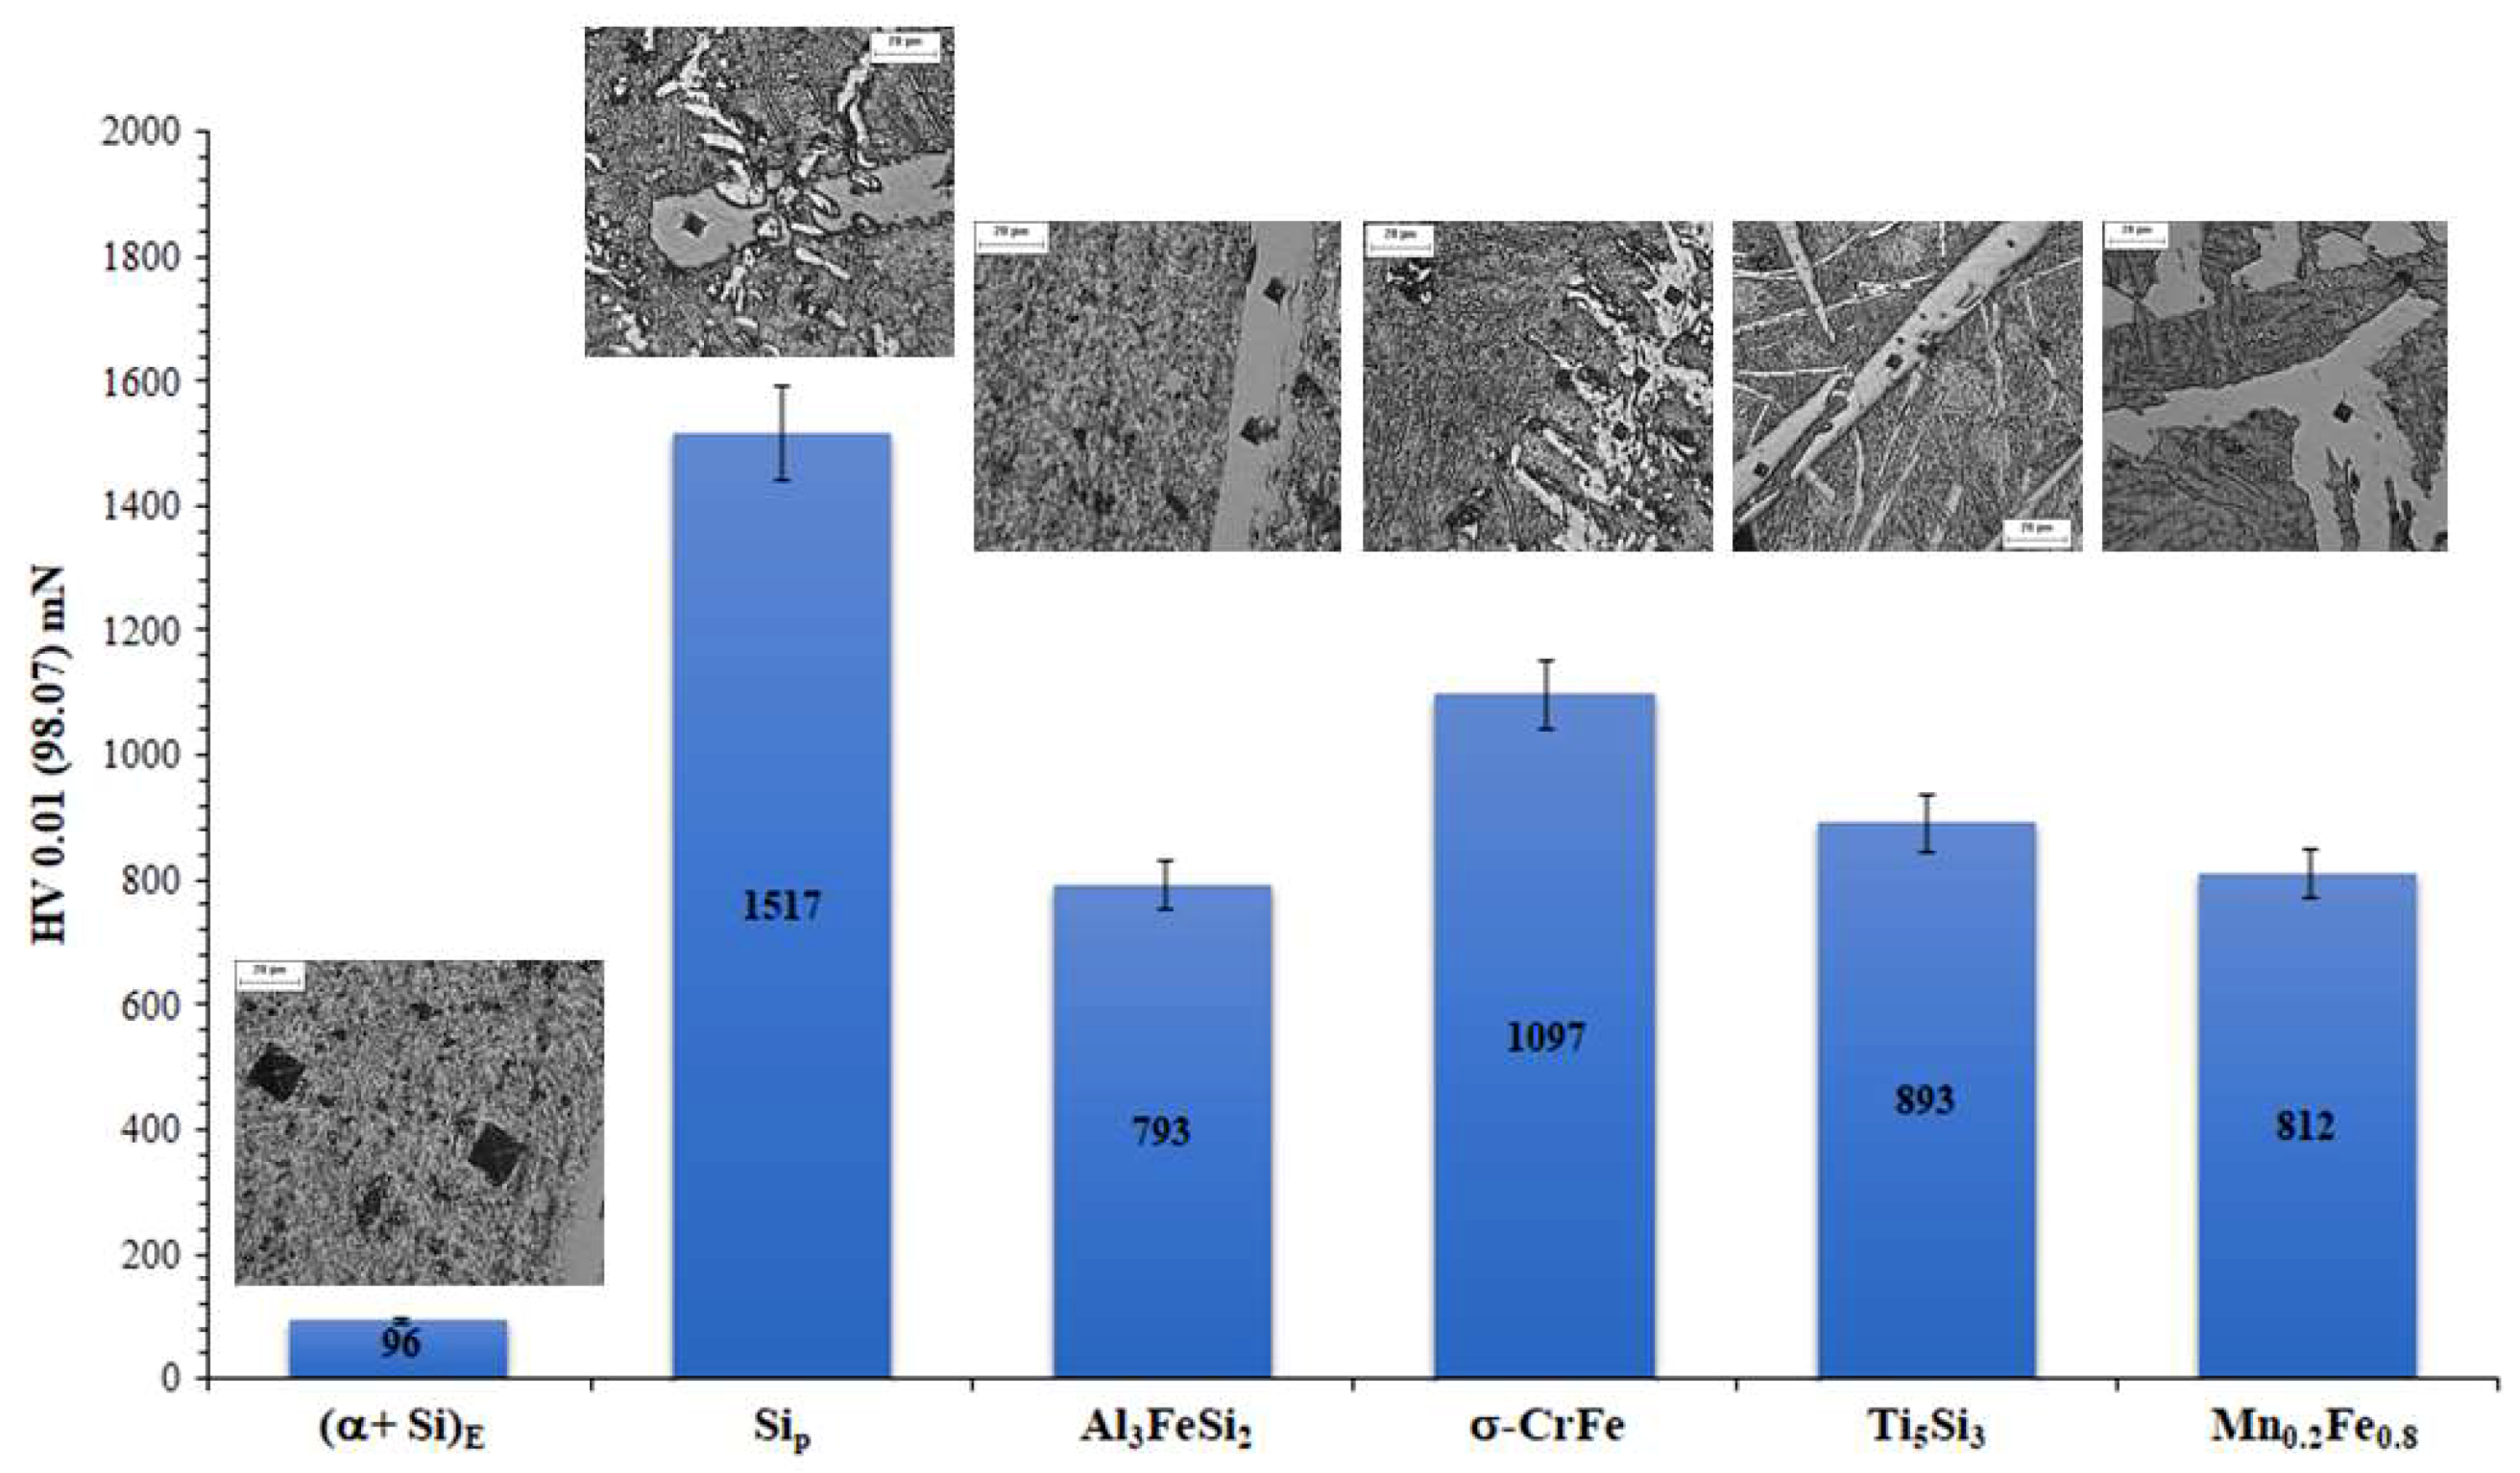
3. Results and Discussion

Table 1 shows the difference between nominal and experimental compositions obtained by chemical analysis (XRF). The chemical analysis results showed that the actual compositions of the Al–20Si–5Fe–X (X = Cr, Mn and Ti at 1.0, 3.0 and 5.0 wt. %) remained relatively close to the respective nominal values, with a weight loss produced during the arc melting of ~0.5 wt. %. In terms of Si, the difference could be attributed to the fluorescence effect, as atomic number “Z” difference is “1”, thus it increments the Al counts and drops Si ones.

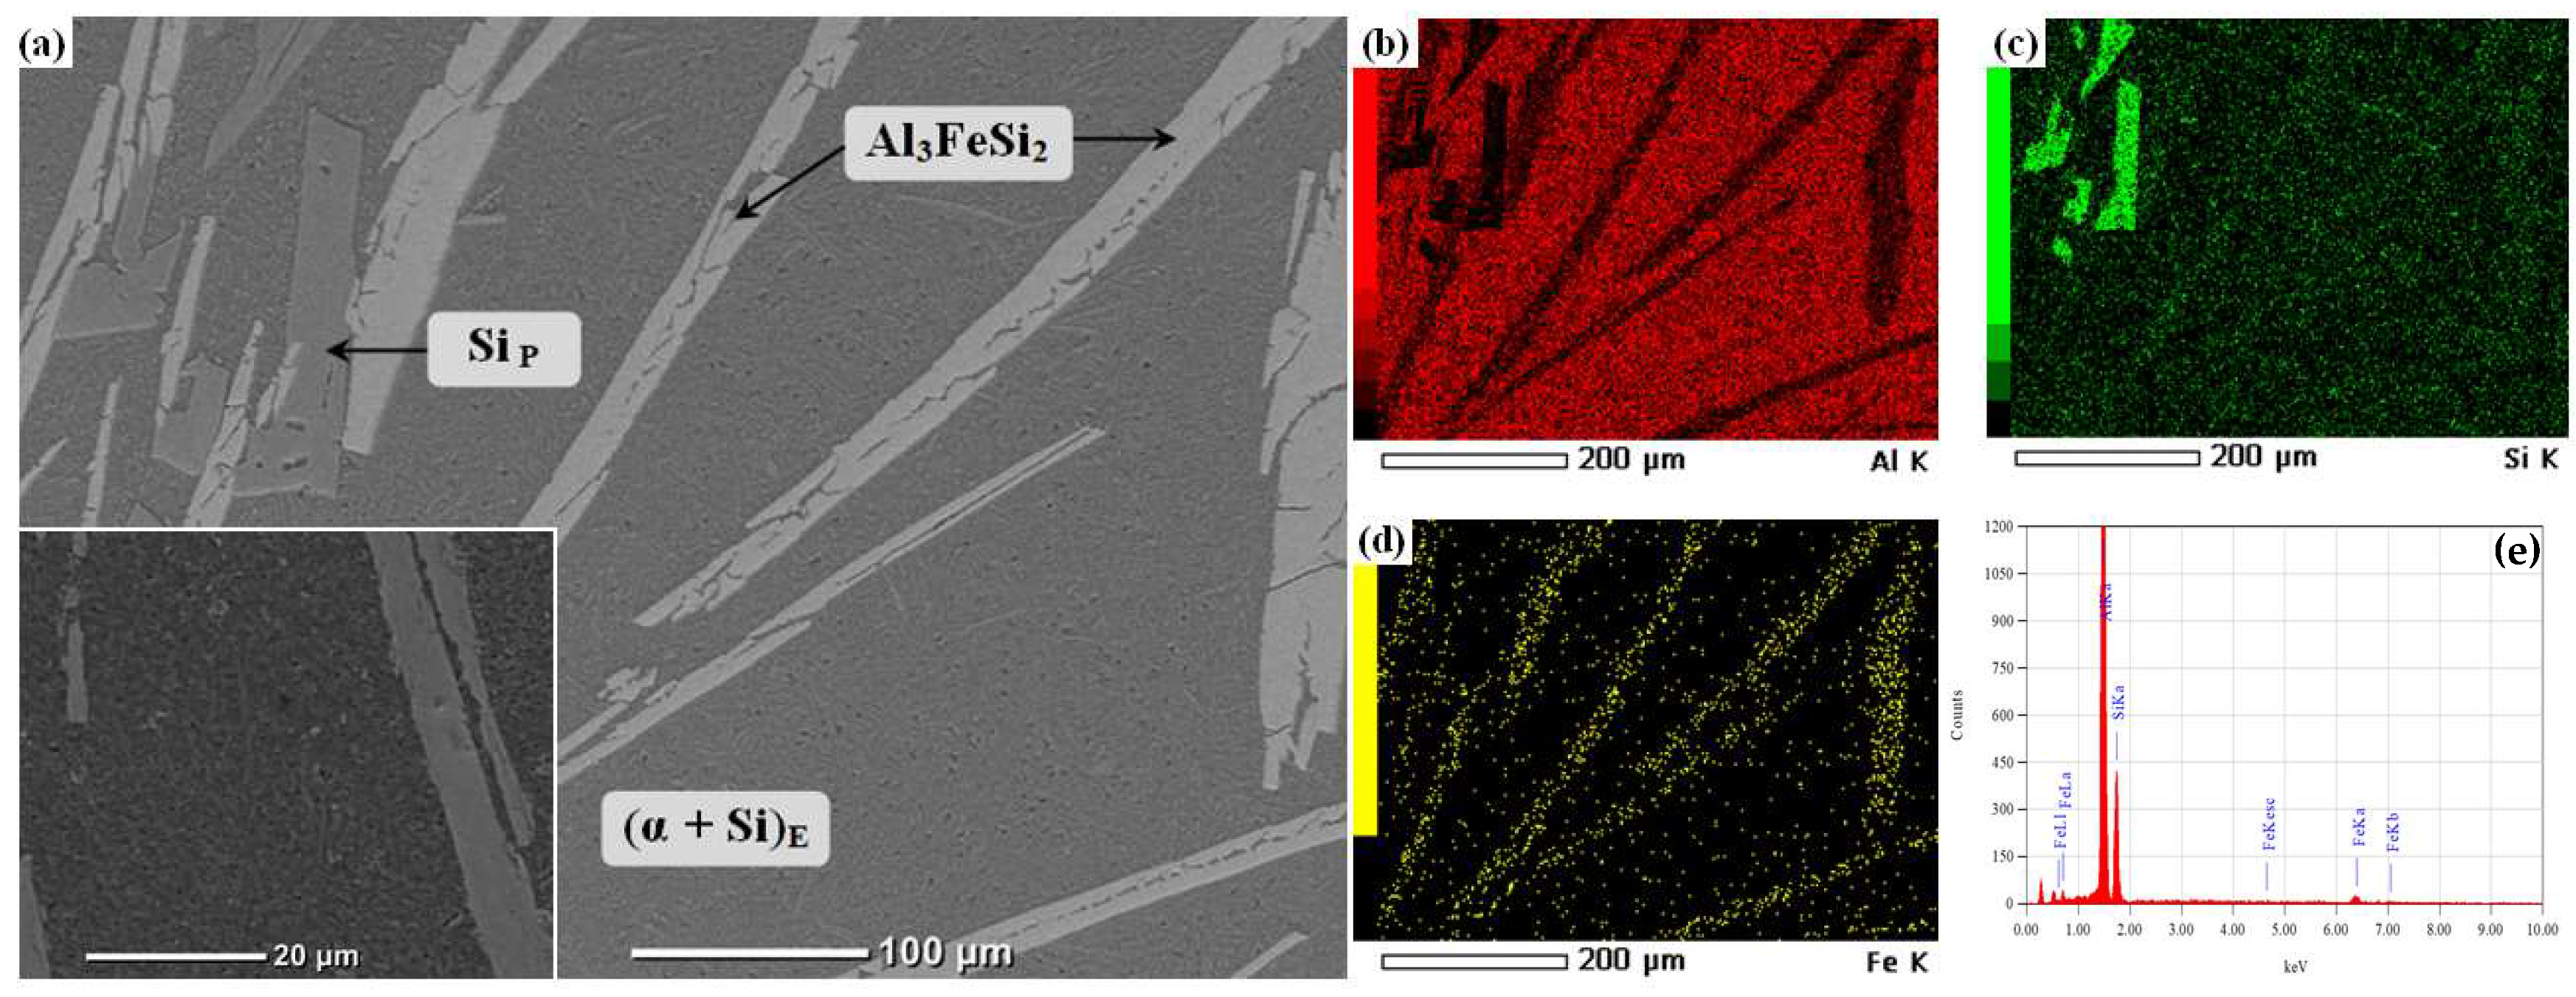
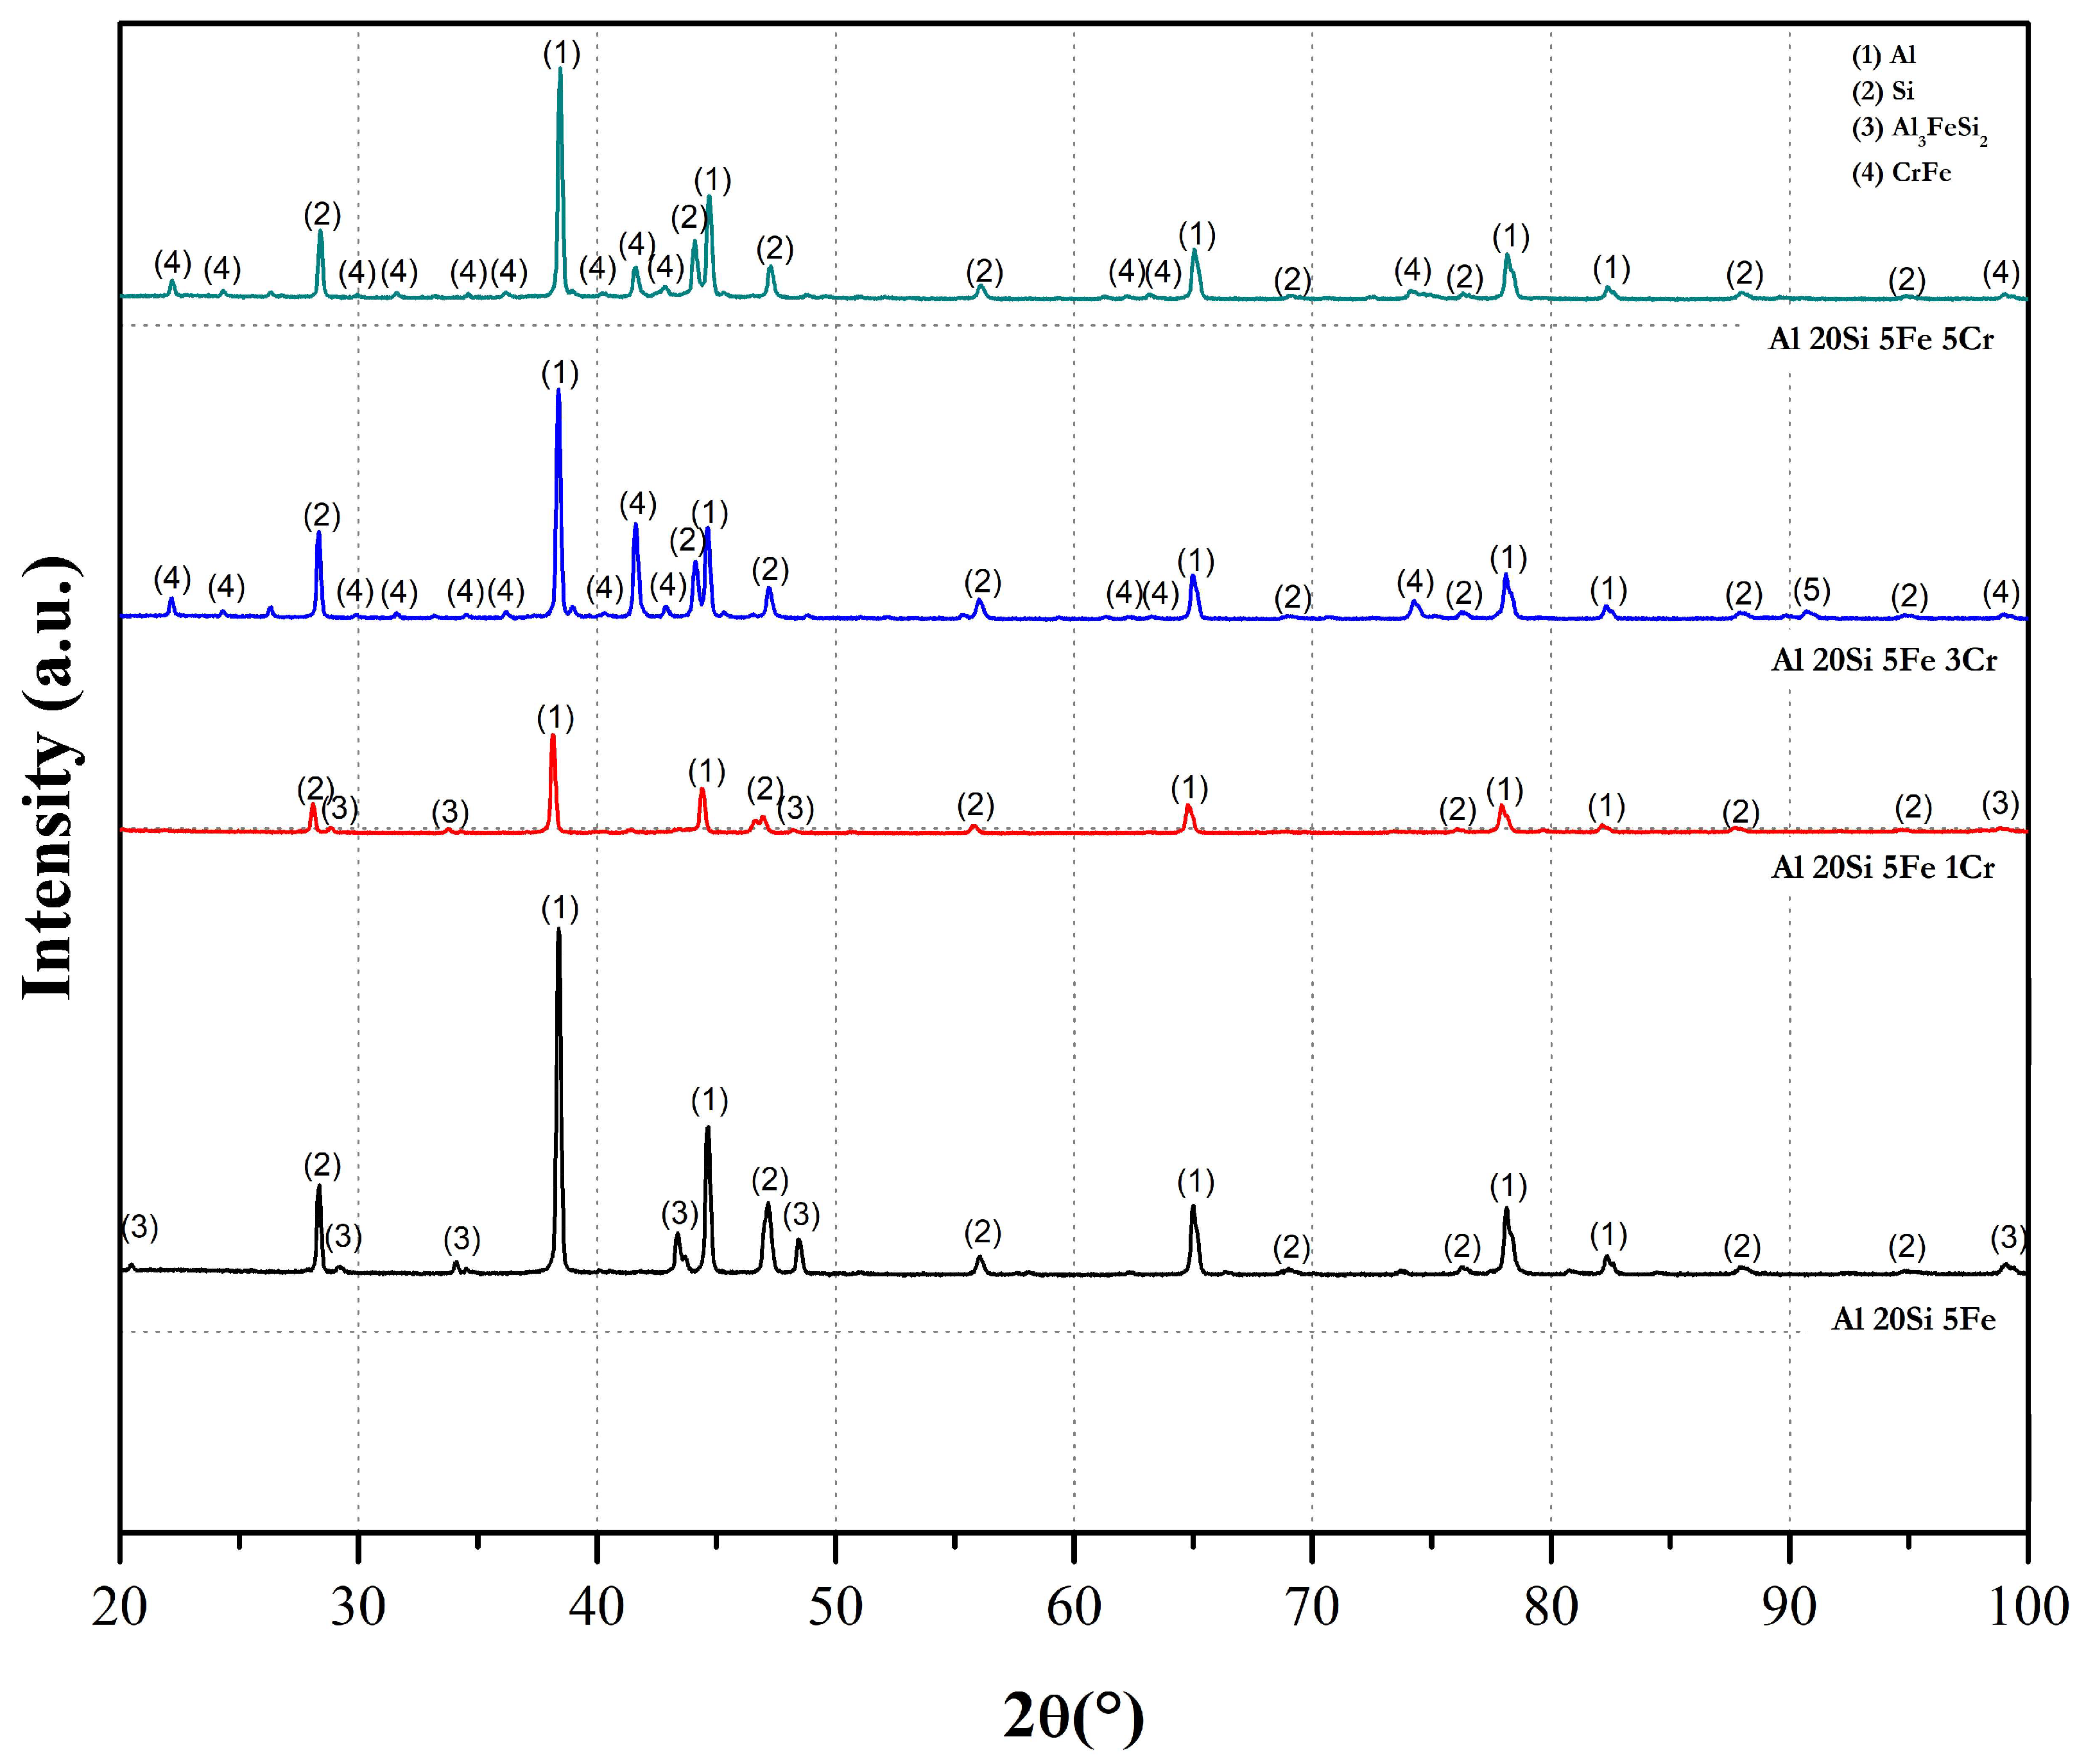
3.1. Analysis of the Al–20Si–5Fe Master Alloy

Figure 1a shows the SEM image of the Al–20Si–5Fe master alloy, where several characteristic phases were observed. The EDS mapping allowed the chemical distributing visualization of such phases, i.e. the presence of α-Al [15] (Figure 1b), (α+Si)E (insert in Figure 1a), primary silicon [16] precipitates (Figure 1c) and the presence of Al3FeSi2 [17] iron (s.g. (140) a = b = 6.0640 Å, c = 9.5260 Å) intermetallic (Figure 1d), confirming the EDS analysis (Figure 1e).
In the Al–Fe–Si ternary system [6,7], there are more than 15 reported binary or ternary compounds. This system seems somewhat complex, explaining why, among these phases, the intermetallic β-Al5FeSi is not always properly identified, as it has a number of closely related phases with low crystal symmetry. Another phase that has been also reported and detected in this work was the Al3FeSi2, with an amount of Fe ranging from 26.5 to 29.5 wt. % and Si from 24 to 38 wt. % [7]. The experimental results obtained by EDS (Energy Dispersive X-ray Spectroscopy) were Fe (22.1 wt. %) and Si (31.3 wt. %). The difference between the theoretical and experimental values is due to that the X-ray photon emission volume could be larger than the intermetallic particle size, interacting with the Al matrix.

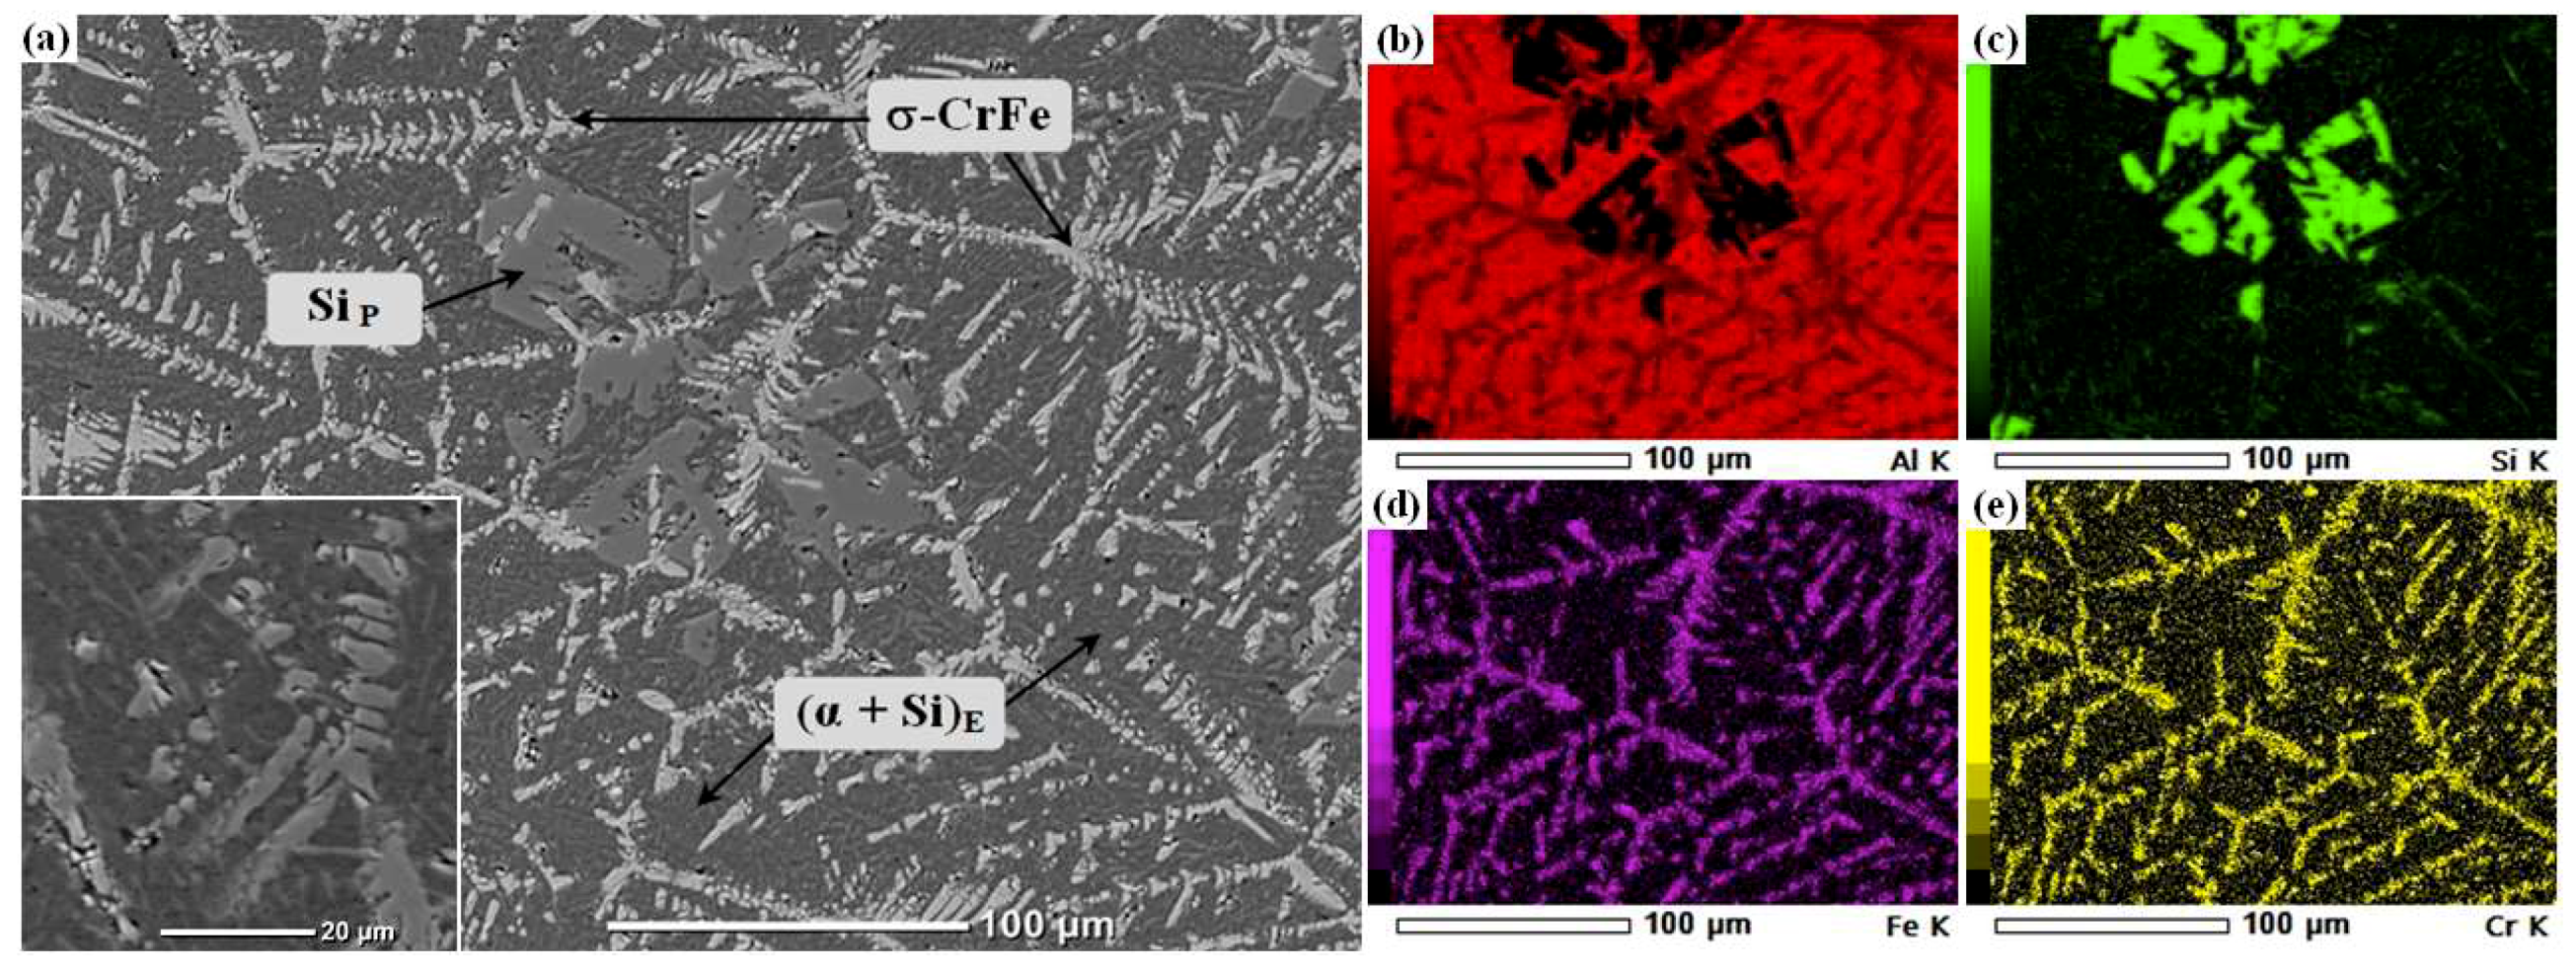
3.2. Analysis of Al–20S–5Fe Base Alloy with Chromium Additions

Figure 2 shows the diffraction patterns of Cr additions in the Al20–Si5–Fe master alloy. Three phases were observed, agreeing well with the results shown in Figure 1. It is worth mentioning that as the amount of Cr additions increased, an additional σ-CrFe phase was observed (s.g. (136) a = b = 8.796 Å, c = 4.561 Å) [18].
Figure 3 shows that with the addition of 1 wt. % Cr the formation of the σ-CrFe phase is evident (red circles). At current level of Cr, the amount σ-CrFe is rather low, being undetectable by XRD. The elemental chemical composition (EDS) of the rosette (σ-CrFe) was Si (14.08 wt. %), Fe (11.45 wt. %), and Cr (11.21 wt. %) and for the needle shaped phase, Si (31.27 wt. %), Fe (17.33 wt. %), and Cr (2.43 wt. %).
The addition of 3 wt. % Cr considerably modified the morphology of the ternary Al3FeSi2 intermetallic, as shown in Figure 4. The amount of such intermetallic compound dropped and the formation of the σ-CrFe phase was promoted. In terms of crystal growth, it can be noted that the original needle Al3FeSi2 compound gave way to a dendritic σ-CrFe phase. Presumably, most of the Si atoms ejected from the Al3FeSi2 intermetallic compound were segregated as primary Si. This morphology is due to the low solubility of Cr in Al alloys, which leads to the formation of the σ-CrFe phase.
Figure 5 shows how the σ-CrFe compound is modified as the amount of Cr increases. It was observed that the primary Si increased considerably, this was also attributed to the aforementioned process.
Figure 6 shows that by increasing the amount of alloying element, the hardness of the material tends to increase, reaching a value of about 220 ± 18 HVN. This behavior was associated to the formation of the σ-CrFe phase. It was observed that as the amount of Cr in the alloy increases, the growth of Al3FeSi2 intermetallic is suppressed; causing the formation of the hard σ-CrFe phase that predominates in the microstructure of the alloy. On the other hand, the hardness was also influenced by the distance between the formed phases, as when increasing the amount of Cr content, the softer (α+Si)E drops (HV = 96) and the formation of harder intermetallic phases is promoted.

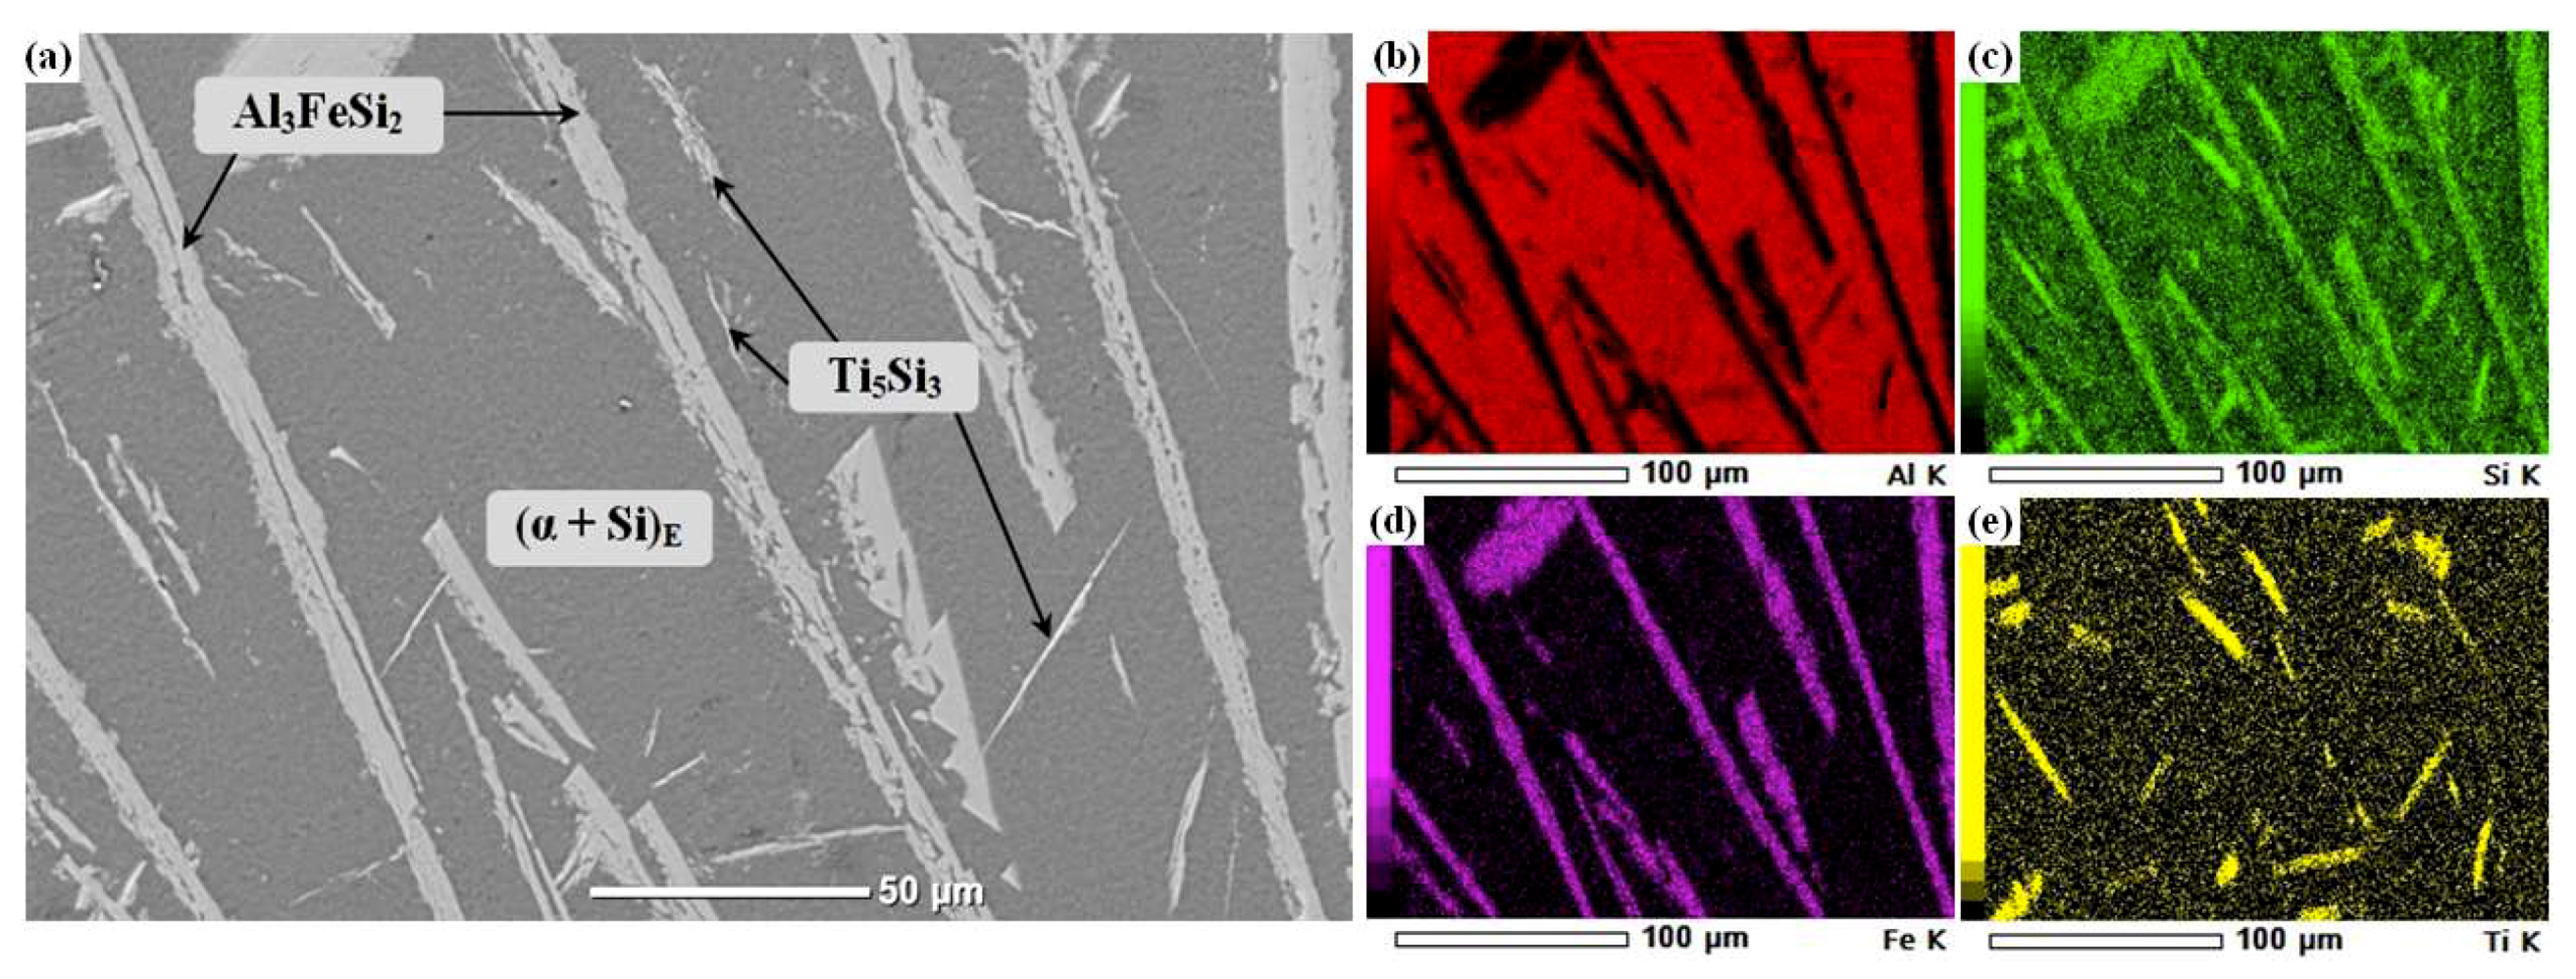
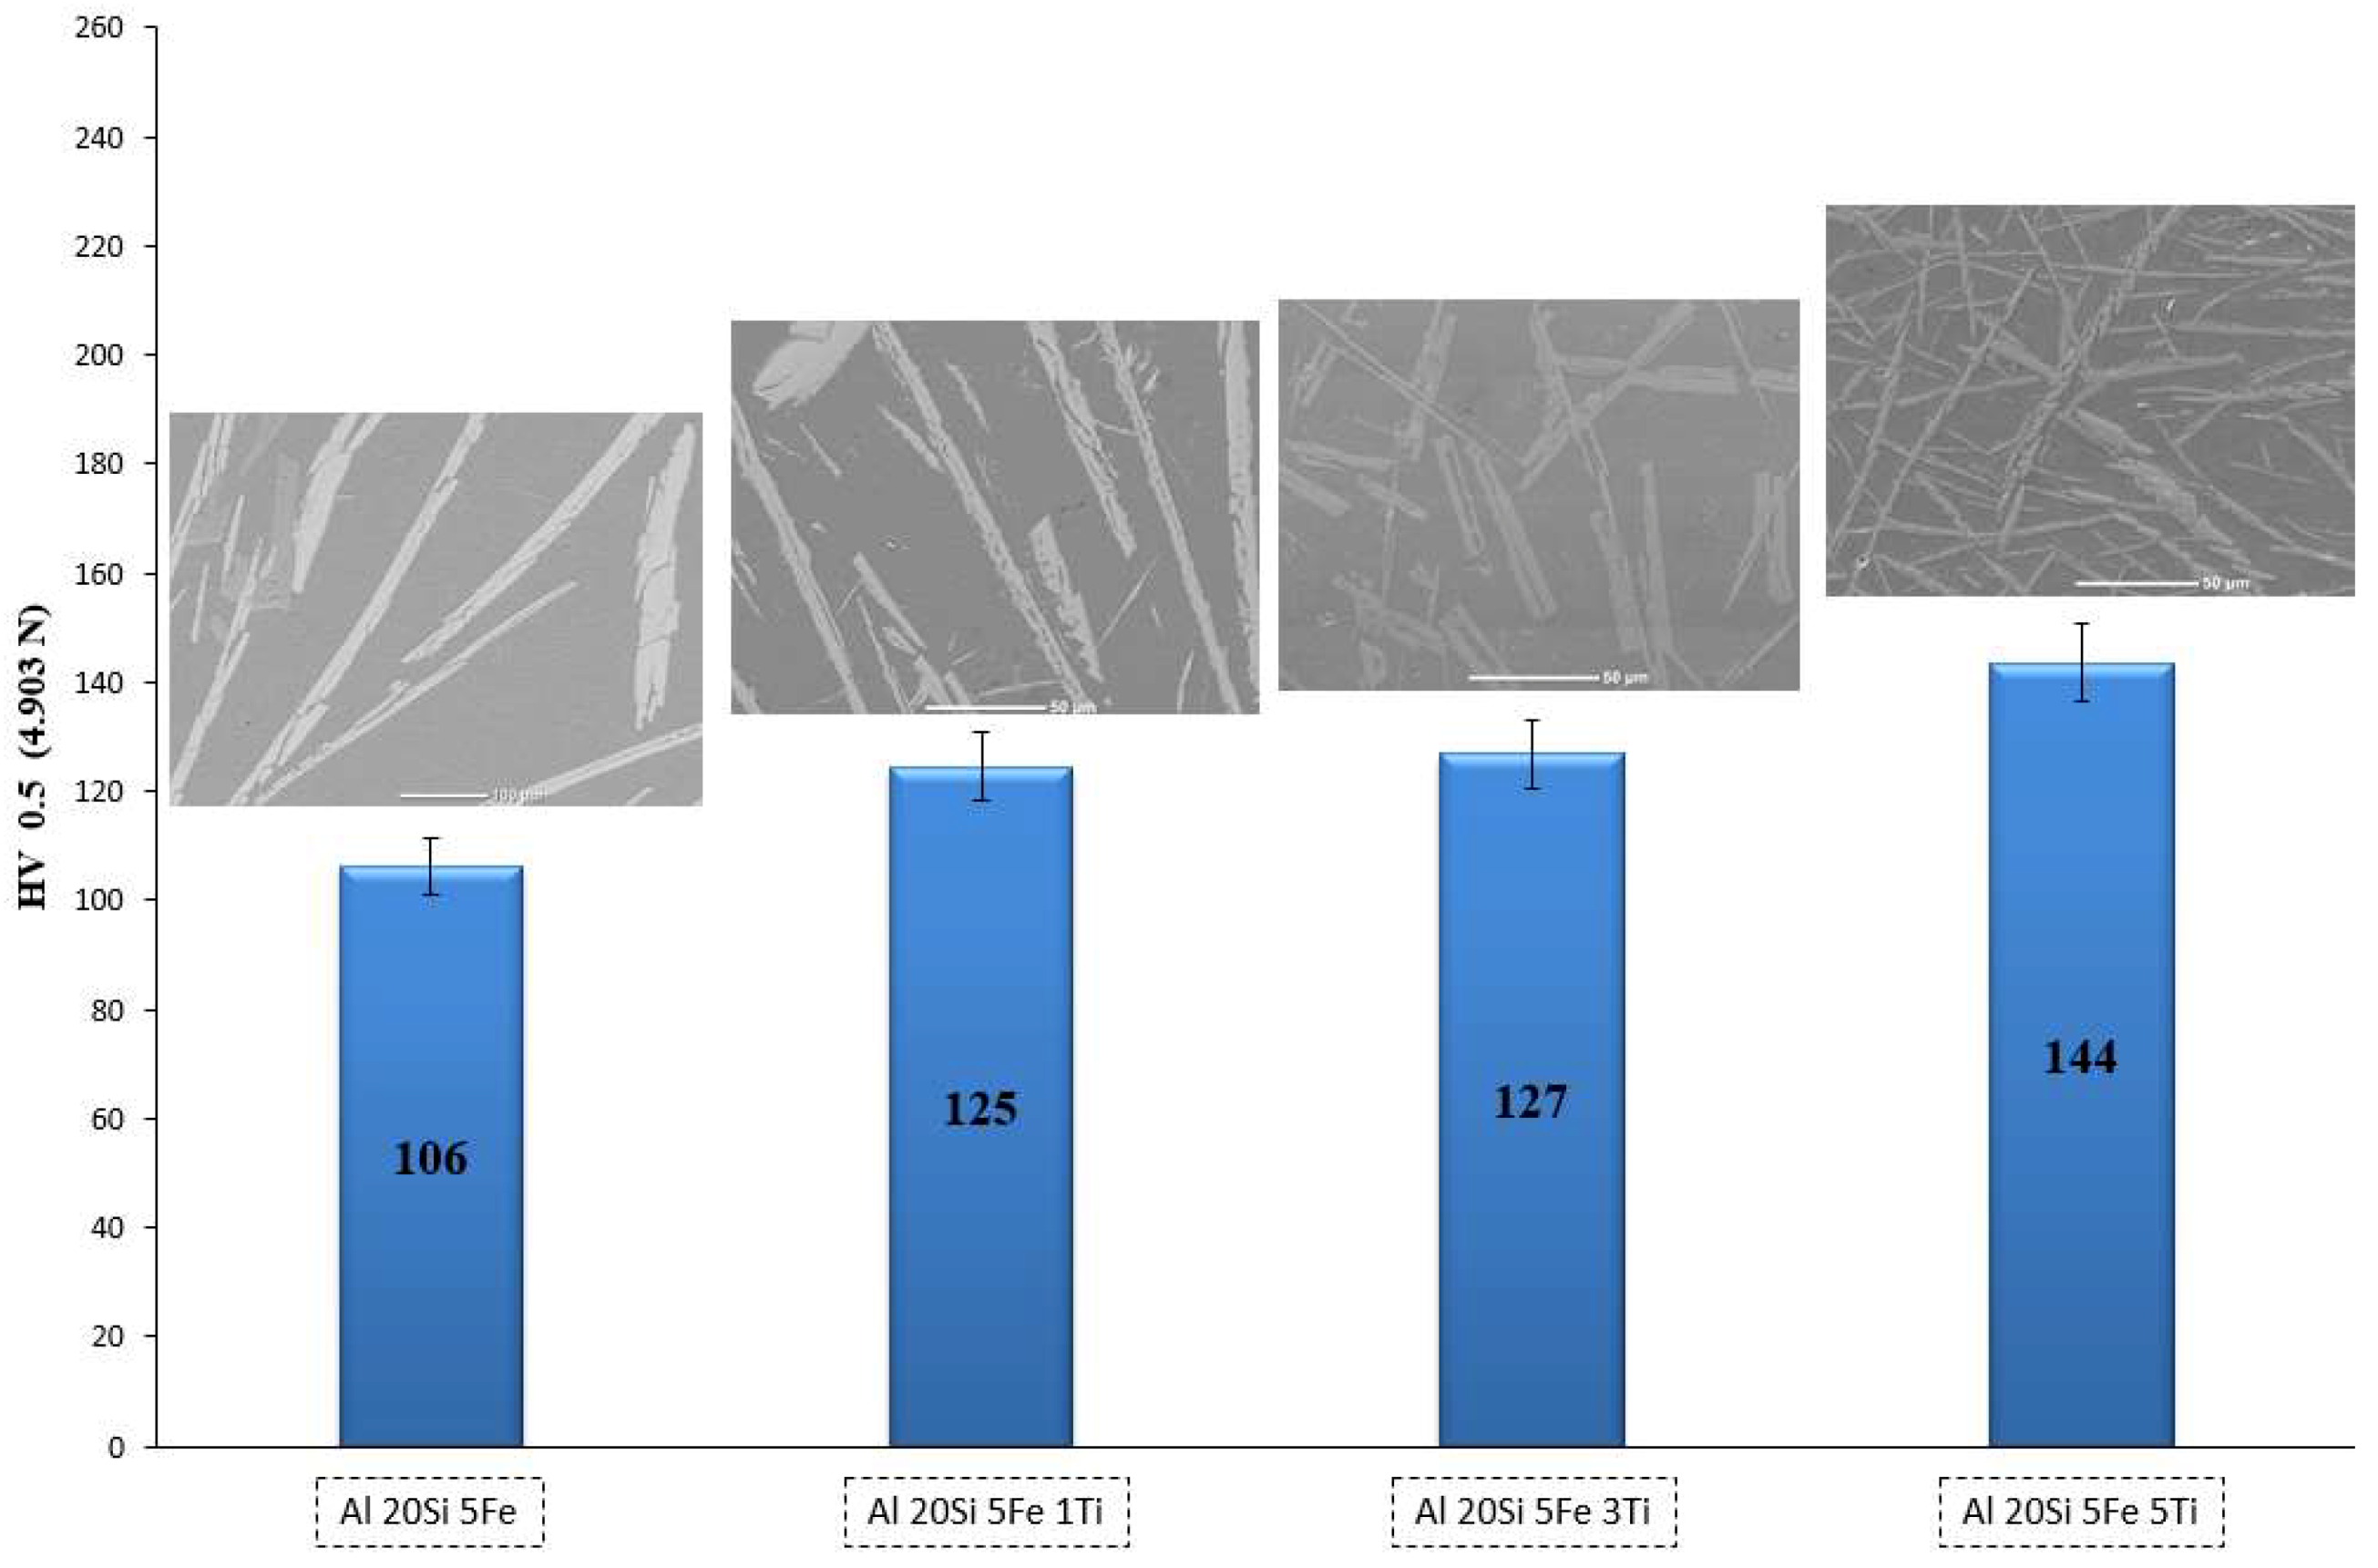
3.3. Analysis of Al–20Si–5Fe Base Alloy with Titanium Additions

Figure 7 shows the diffraction patterns of Ti additions in the Al20–Si5–Fe master alloy. As the amount of Ti additions increases, an additional Ti5Si3 phase (s.g. (193) a = 7.4440 Å, c = 5.1430 Å) was promoted [19]. The results presented in this section will show the microstructure evolution as a function Ti content (above 1 wt. %) and its effect on the hardness behavior.
Figure 8 shows the microstructures of the Al–20Si–5Fe with 1 wt. % Ti addition. Here, it is evident the formation of a new acicular Ti5Si3 compound (Figure 9e). However, with this amount of Ti, the X-ray Bragg peaks are rather weak for this phase.
Figure 9 illustrates the α-Al and SiE, together with the acicular Ti5Si3 and Al3FeSi2 compounds. It can be seen that when 3 wt. % of Ti is added, the Sip disappeared, the formation and grow of Ti5Si3 phase was observed and the shortening of Al3FeSi2 compound was detected. The formation of the acicular Ti5Si3 (Figure 9e) was due to the large negative heat of mixing between Ti and Si (−66 kJ/mol) [20]. As observed in Figure 9, the perpendicularity of such acicular Ti5Si3 compound did stop the expected growth of Al3FeSi2 (Figure 9d), causing a refining effect.
When adding 5 wt. % of Ti, the microstructure did change drastically, as shown in Figure 10. It can be observed that Ti played the most important role when the nucleation started, forming the Ti5Si3 compound (TL ~2000 °C). In this case, as the Ti content increased, not only the Sip reacted with Ti, but also the Eutectic silicon (SiE) is partially consumed, forming a large amount of Ti5Si3 (Figure 10e). The formation of Ti5Si3, as was the first to crystallize, created a physical obstacle for the acicular growth of the Al3FeSi2 compound (Figure 10d), shortening even more its needled shape structure. As expected, the amount of Al3FeSi2 compound was the same (limited only for the Fe content in the alloy), this can be observed in the XRD patterns, as the intensity of this phase remained constant for all Ti additions. Since Si is used to form Ti5Si3 and Al3FeSi2, the amount of SiE drops, segregating α–Al rich areas (Figure 10b,c). Therefore, the size of the α–Al rich phase rises as the Ti content increases
Figure 11 shows the microhardness results of the alloy with Ti additions. It is observed that Ti did not modify, considerably, the microstructure of the alloy. Therefore, its hardness, even at the highest concentration of Ti, only increased ~ 37 ± 7 points in HV. This behavior could be attributed to the absence of primary Si in this alloy. Therefore, the effect of Ti additions on the microhardness was not that significant.

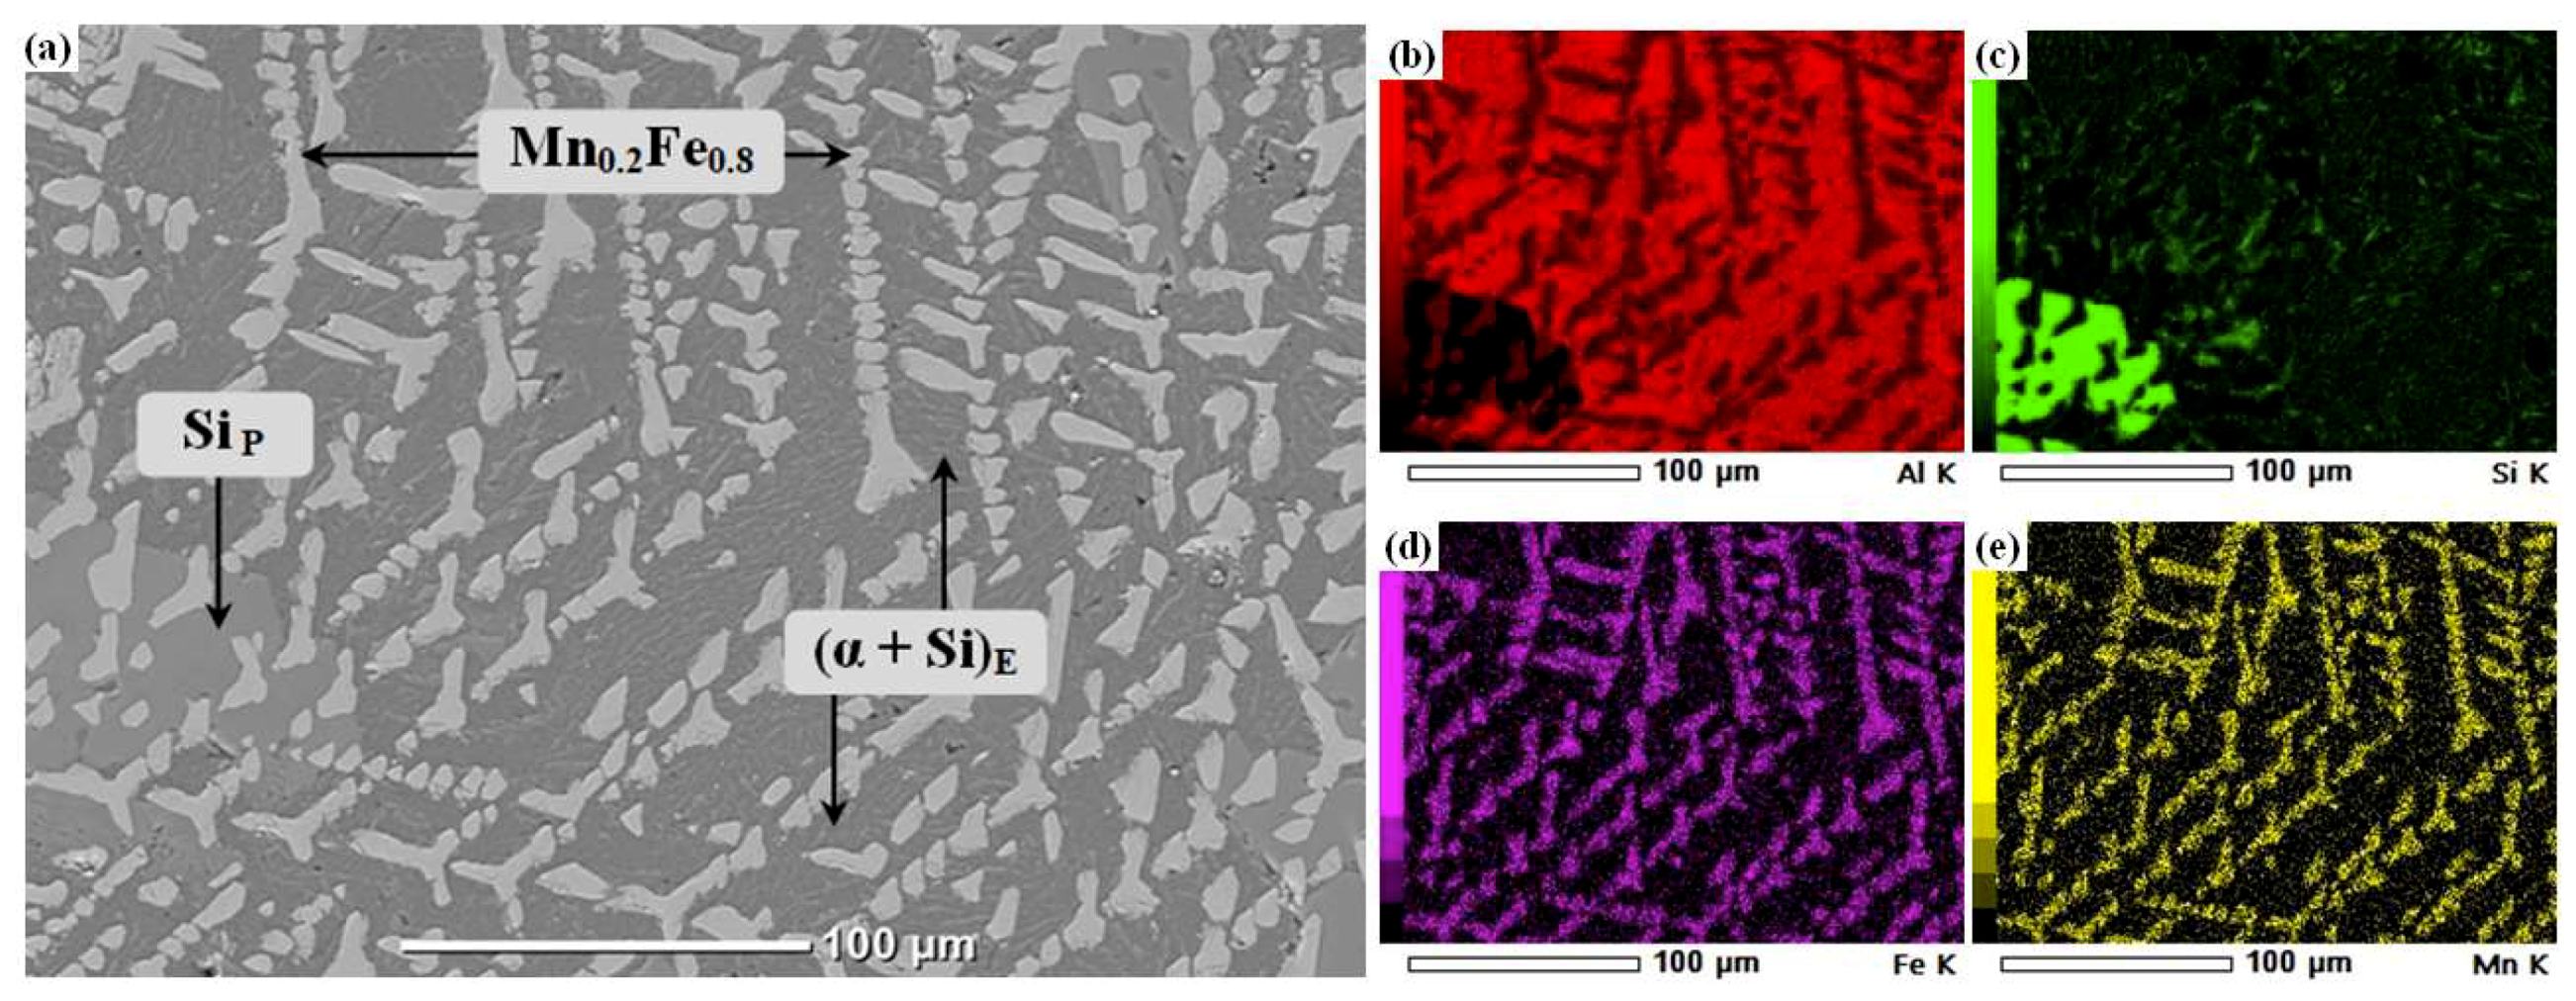
3.4. Analysis of Al–20Si–5Fe Base Alloy with Manganese Additions

Figure 12 shows the diffraction patterns of Mn additions in the Al20–Si5–Fe master alloy. It was observed that, as the amount of Mn additions increases, the formation of the Mn0.2Fe0.8 phase also increased [21]. According to the XRD and SEM results, even at 1 wt. % Mn addition, this phase was observed. Please note that this phase is almost overlapped with that of the α-Al peak. However, these overlapped peaks displayed shoulders, supporting this statement. Besides, with the SEM elemental mapping the existence of this phase was also confirmed. Thermodynamically, the formation of the Mn0.2Fe0.8 phase (s.g. (229) a = 2.9 Å) is attributed to the poor solubility of Mn in Al.
Figure 13 confirms the phases detected by XRD. Here, the amount of Mn0.2Fe0.8 is rather small and the Al3FeSi2 and the (α+Si)E phases are the main contributors of the resulting microstructure. The quantity of this minor phase is limited by the amount Mn in the alloy. For the sample with 3 wt. % Mn, the binary compound Mn0.2Fe0.8 grew considerably, i.e. from 10 to 50 microns, acquiring a well-defined rosette morphology (Figure 14). On the other hand, the ternary compound Al3FeSi2 became slightly shorter; a plausible explanation for this microstructure was the significant growth of the Mn0.2Fe0.8 compound that fractured the Al3FeSi2 intermetallic compound. Finally, with 5 wt. % of Mn (Figure 15) the microstructure changed drastically, showing a “fractured bone” morphology. This type of morphology is quite rare and difficult to find in the literature. From the microstructure, it is observed that the ternary Al3FeSi2 disappeared completely and the Mn0.2Fe0.8 compound took its place. Another point to consider in the microstructure was the formation of Sip. It is thought that the growth of this phase can be attributed to the formation of the Mn0.2Fe0.8 and the disappearance of the Al3FeSi2 phases, leaving this element (Sip) to grow on its own. Similarly, the SiE suffered a strong change when compared to the alloys with 1 and 3 wt. % Mn. In this case, the growth of SiE is more visible and the acicular shape of this phase is more pronounced.
Figure 16 shows the effect of the Mn additions on the Al–Si–Fe master alloy. It can be seen that the microhardness increased as a function of Mn concentration. It is clear that the microhardness, in general terms, for these alloys, is a consequence of the average hardness of all phases involved in the microstructure. In particular, the formation of the primary Si (1517 ± 193 HVN). For the 5 wt. % Mn alloy this phase was the main responsible of such microhardness increment.
Figure 17 shows the microhardness values for each phase that was determined in this work. It is worth mentioning that the alloying elements generated different microstructures and compounds in the studied alloys. For instance, a dendritic shaped microstructure (σ-CrFe) was observed for the Cr containing samples. The alloy with 5 wt. % Cr showed the highest Vickers hardness of the whole set of alloys produced. It is thought that the formation of σ-CrFe, Sip, and the microstructure refinement caused such increment. For the alloys with Ti, an acicular (Ti5Si3) morphology was identified and for those alloys. The increment in hardness was not linear with respect to the Ti additions, perhaps the formation of a softer α–Al rich phase contributed to this behavior. With the Mn additions, the microstructure observed moved from a well-defined needle shaped morphology to a “fractured bone” one (Mn0.2Fe0.8). Analogously, the Mn0.2Fe0.8 and Ti5Si3 phases played an important role in the hardness increment for the alloys with Mn and Ti, respectively. The microhardness for each specific alloy was highly dependent on the compound (phase) formed during the solidification. The highest value of microhardness (>1500 HVN) was obtained for the primary Si (Sip) and the lowest values was 96 HVN for the eutectic matrix.

4. Conclusions

The Al–Si–Fe master alloy showed a needle shaped iron intermetallic, with a hardness of 106 ± 7 HVN. In general terms, the changes in the microstructure with the additions of Cr, Ti, and Mn were gradual, observing a completely different microstructure at 5 wt. % for all alloying additions. The additions of Cr increased the hardness, with values higher than 200 HVN. This was associated to the microstructural modification, as with the addition of Cr, the original Al3FeSi2 phase changed to a harder dendritic shaped σ-CrFe compound. The Ti additions increased around 37 points HVN. With Ti the microstructural modification was significant, as the acicular phase Ti5Si3 was observed even at 1 wt. % Ti. However, the addition of 5 wt. % Ti caused the segregation of eutectic Si around this binary intermetallic. With 5 wt. % Mn the microstructure of the master alloy changed drastically. In this composition, only primary silicon, (α+Si)E and the binary intermetallic Mn0.2Fe0.8 phases were observed. The compound formed (σ-CrFe, Ti5Si3, Mn0.2Fe0.8) by the Cr, Ti, and Mn additions showed higher hardness than that of the master alloy Al3FeSi2 intermetallic.

Author Contributions

I.A.F. conceived and designed the experiments, V.A.A. performed the experiments. V.A.A., G.G., and J.A.G.-H. analyzed the data. G.A.L.-R. contributed with reagents, materials, and analytical tools. V.A.A., I.A.F., and G.G. wrote the paper.

Funding

This research was funded by UNAM-DGAPA-PAPIIT through grant No. IN102319. The National Council for Science and Technology (CONACYT) of Mexico supported V.A. Aranda with PhD Scholarship CVU: 419791.

Acknowledgments

A. Tejeda, F. García, A. López-Vivas, F. Silvar, O. Novelo, C. Flores Morales, J. Romero and C. Ramos are acknowledged for their valuable technical support.

Conflicts of Interest

The authors declare no conflict of interest.

References

  1. Shah, S.K.; Czerwinski, F.; Kasprzak, W.; Friedman, J.; Chen, D.L. Efffect of Cr, Ti, V and Zr Micro-additions on Microstructure and Mechanical Properties of the Al–Si–Cu–Mg cast alloy. Metall. Mater. Trans. A 2016, 47, 2396–2409. [Google Scholar] [CrossRef]
  2. Gustafsson, G.; Thorvaldsson, T.; Dunlop, G.L. The Influence of Fe and Cr on the Microstructure of Cast Al–Si–Mg Alloys. Metall. Mater. Trans. A 1986, 17, 45–52. [Google Scholar] [CrossRef]
  3. Dám, K.; Prus, F.; Vojtech, D. Structural and mechanical characteristics of the Al–23Si–8Fe–5Mn alloy prepared by combination of centrifugal spraying and hot die forging. Mat. Sci. Eng. A-Struct. 2014, 610, 197–202. [Google Scholar] [CrossRef]
  4. Gorny, A.; Manickaraj, J.; Cai, Z.; Shankar, S. Evolution of Fe based intermetallic phases in Al–Si hypoeutectic casting alloys: Influence of the Si and Fe concentrations, and solidification rate. J. Alloy. Compd. 2013, 577, 103–124. [Google Scholar] [CrossRef]
  5. Khalif, W.; Samuel, F.H.; Gruzleski, J.E.; Doty, H.W.; Valtierr, S. Nucleation of Fe-Intermetalic Phases in the Al–Si–Fe Alloys. Metall. Mater. Trans. A 2005, 36, 1017–1032. [Google Scholar] [CrossRef]
  6. Khalif, W.; Samuel, F.H.; Gruzleski, J.E. Iron Intermetallic Phases in the Al Corner of the Al–Si–Fe. Metall. Mater. Trans. A 2003, 34, 807–825. [Google Scholar] [CrossRef]
  7. Pontevichi, S.; Bosselet, F.; Barbeau, F.; Peronnet, M.; Vial, J.C. Solid-Liquid Phase Equilibria in the Al–Fe–Si System at 727 °C. J. Phase Equilib. Diffus. 2004, 25, 528–537. [Google Scholar] [CrossRef]
  8. Lu, L.; Dahle, A.K. Iron-Rich Intermetallic Phases and Their Role in Casting Defect Formation in Hypoeutectic Al–Si Alloys. Metall. Mater. Trans. A 2005, 36, 819–835. [Google Scholar]
  9. Narayanan, L.A.; Samuel, F.H.; Gruzleski, J.E. Dissolution of Iron Intermetallics in Al-Si Alloys through Nonequilibrium Heat Treatment. Metall. Mater. Trans. A 1995, 26, 2161–2174. [Google Scholar] [CrossRef]
  10. Ferraro, S.; Bjurenstedt, A.; Seifeddine, S. On the Formation of Sludge Intermetallic Particles in Secondary Aluminum Alloys. Metall. Mater. Trans. A 2015, 46, 3713–3722. [Google Scholar] [CrossRef]
  11. Wang, B.; Xue, S.; Wang, J.; Lin, Z. Effect of combinative addition of mischmetal and Titanium on the microstructure and mechanical properties of hypoeutectic Al–Si alloys used for brazing and/or welding consumables. J Rare Earths 2017, 35, 193–202. [Google Scholar] [CrossRef]
  12. Guan, K.S.; Xu, X.D.; Zhang, Y.Y.; Wang, Z.W. Cracks and precipitate phases in 321 stainless steel weld of flue gas pipe. Eng. Fail. Anal. 2005, 12, 623–633. [Google Scholar] [CrossRef]
  13. Chen, M.; Lan, L.; Shi, X.; Yang, H.; Zhang, M.; Quiao, J. The tribological properties of Al0.6CoCrFeNi high-entropy alloy with the σ phase precipitation at elevated temperature. J. Alloy. Compd. 2019, 777, 180–189. [Google Scholar] [CrossRef]
  14. Tang, Z.; Williams, J.J.; Tho, A.J.; Akinc, M. High temperature oxidation behavior of Ti5Si3-based intermetallics. Intermetallics 2008, 16, 1118–1124. [Google Scholar] [CrossRef]
  15. Swanson, T. Standard X-ray Diffraction Powder Patterns; Dept. of Commerce, National Bureau of Standards: Washington, DC, USA, 1953; Volume I, p. 11.
  16. Bond, W.L.; Kaiser, W. Calculated from ICSD using POWD-12++ (1997). J. Phys. Chem. Solids 1960, 16, 44. [Google Scholar] [CrossRef]
  17. Zeng, L. ICDD Grant-in-Aid (2001); Schubert, K., Burkhardt, K., Gold, W., Panday, P., Naturwissenschaften, Eds.; Guangxi Univ., Inst. of Materials Science: Nanning, Guangxi, China, 1965; Volume 52, p. 301. [Google Scholar]
  18. Yakel, H.L. Atom Distributions in Sigma Phases: I. Fe and Cr Atom Distributions in a Binary Sigma Phase Equilibrated at 1063, 1013 and 923 K. Acta Crystallogr. Sec. B Struct. Sci. 1983, 39, 20. [Google Scholar] [CrossRef]
  19. Kajitani, T.; Kawase, T.; Yamad, K.; Hirabayashi, M. Site Occupation and Local Vibration of Hydrogen Isotopes in Hexagonal Ti5Si3 H(D)1-x. Trans. Jpn. Inst. Met. 1986, 27, 639. [Google Scholar] [CrossRef]
  20. Takeuchi, A.; Inoue, A. Classification of Bulk Metallic Glasses by Atomic Size Difference, Heat of Mixing and Period of Constituent Elements and Its Application to Characterization of the Main Alloying Element. Mater. Trans. 2005, 46, 2817–2829. [Google Scholar] [CrossRef] [Green Version]
  21. Sumiyam, K.; Ohshim, N.; Nakamur, Y. Magnetic Properties of Metastable α-Mn Type Mn1-yFey Alloys Produced by Vapor Quenching. Phys. Status Solidi A 1986, 98, 229. [Google Scholar] [CrossRef]
Figure 1. (a) Backscattered electron image of the Al–20Si–5Fe master alloy, eutectic microstructure as insert. Elemental mapping of (b) aluminum, (c) silicon, (d) iron, and (e) Energy Dispersive X–ray Spectroscopy pattern. Sip = Primary silicon, (α+Si)E = Eutectic.
Metals 09 00136 g001
Figure 2. X-ray diffraction pattern of the Al–20Si–5Fe master alloy and the Cr additions.
Metals 09 00136 g002
Figure 3. (a) Backscattered electron image (BEI) of AlSiFe with 1 wt. % Cr alloy. Elemental mapping of (b) aluminum, (c) silicon, (d) iron, and (e) chromium. Sip = Primary silicon, (α+Si)E = Eutectic.
Metals 09 00136 g003
Figure 4. (a) Backscattered electron image of AlSiFe with 3 wt. % Cr, eutectic microstructure as insert. Elemental mapping of (b) aluminum, (c) silicon, (d) iron, and (e) chromium. Sip = Primary silicon, (α+Si)E = Eutectic.
Metals 09 00136 g004
Figure 5. (a) Backscattered electron image of AlSiFe with 5 wt. % Cr alloy. Elemental mapping of (b) aluminum, (c) silicon, (d) iron, and (e) chromium. Sip = Primary silicon, (α+Si)E = Eutectic.
Metals 09 00136 g005
Figure 6. Microhardness of the Al–20Si–5Fe alloy with several Cr additions.
Metals 09 00136 g006
Figure 7. X-ray diffraction pattern of the Al–20Si–5Fe masters alloy and the Ti additions.
Metals 09 00136 g007
Figure 8. (a) Backscattered electron image of AlSiFe with 1 wt. % Ti alloy. Elemental mapping of (b) aluminum, (c) silicon, (d) iron, and (e) titanium. (α+Si)E = Eutectic.
Metals 09 00136 g008
Figure 9. (a) Backscattered electron image of AlSiFe with 3 wt. % Ti alloy, eutectic microstructure as insert. Elemental mapping of (b) aluminum, (c) silicon, (d) iron, and (e) titanium. (α+Si)E = Eutectic.
Metals 09 00136 g009
Figure 10. (a) Backscattered electron image of AlSiFe with 5 wt. % Ti alloy. Elemental mapping of (b) aluminum, (c) silicon, (d) iron, and (e) titanium. (α+Si)E = Eutectic.
Metals 09 00136 g010
Figure 11. Microhardness of the Al–20Si–5Fe alloy with several Ti additions.
Metals 09 00136 g011
Figure 12. X-ray diffraction pattern of the Al–20Si–5Fe masters alloy and the Mn additions.
Metals 09 00136 g012
Figure 13. (a) Backscattered electron image of AlSiFe with 1 wt. % Mn alloy. Elemental mapping of (b) aluminum, (c) silicon, (d) iron, and (e) manganese. (α+Si)E = Eutectic.
Metals 09 00136 g013
Figure 14. (a) Backscattered electron image of AlSiFe with 3 wt. % Mn alloy, eutectic microstructure as insert. Elemental mapping of (b) aluminum, (c) silicon, (d) iron, (e) manganese. (α+Si)E = Eutectic.
Metals 09 00136 g014
Figure 15. (a) Backscattered electron image of AlSiFe with 5 wt. % Mn alloy. Elemental mapping of (b) aluminum, (c) silicon, (d) iron, and (e) manganese. Sip = Primary silicon, (α+Si)E = Eutectic.
Metals 09 00136 g015
Figure 16. Microhardness of the Al–20Si–5Fe alloy with several Mn additions.
Metals 09 00136 g016
Figure 17. Microhardness of the different phases obtained.
Metals 09 00136 g017
Table 1. Nominal and experimental alloy compositions.
Nominal Composition
(wt. %)
Experimental Composition
(wt. %)
AlloyAlSiFeCrTiMn
Al 20Si 5Fe79.016.04.9---
Al 20Si 5Fe 1Cr79.115.54.41.2--
Al 20Si 5Fe 3Cr76.317.43.72.6--
Al 20Si 5Fe 5Cr75.116.13.05.9--
Al 20Si 5Fe 1Ti78.913.16.7-1.3-
Al 20Si 5Fe 3Ti78.114.44.4-3.0-
Al 20Si 5Fe 5Ti74.213.15.7-7.3-
Al 20Si 5Fe 1Mn79.815.14.4--0.8
Al 20Si 5Fe 3Mn78.314.84.3--2.6
Al 20Si 5Fe 5Mn74.317.83.7--4.2

