A Combined Method to Model Dynamic Recrystallization Based on Cellular Automaton and a Phenomenological (CAP) Approach


1
Faculty of Materials Engineering, Sahand University of Technology, Tabriz 513351996, Iran
2
Department of Mechanical and Industrial Engineering, Qatar University, Doha 2713, Qatar
3
Department of Mechanical Engineering, Faculty of Engineering, North Tehran Branch, Islamic Azad University, Tehran 1651153311, Iran
*
Authors to whom correspondence should be addressed.
Metals 2018, 8(11), 923; https://doi.org/10.3390/met8110923
Submission received: 24 August 2018
/
Revised: 18 October 2018
/
Accepted: 24 October 2018
/
Published: 8 November 2018
(This article belongs to the Special Issue Dynamic Recrystallization Behavior of Metallic Materials)
Abstract
:Titanium alloys with high stacking-fault energy show continuous dynamic recrystallization (CDRX) instead of discontinuous dynamic recrystallization (DDRX) during high-temperature deformation. During the CDRX mechanism, new recrystallized grains are generated by the progressive increasing of the low-angle boundary misorientations. In the present work, the CDRX phenomenon was modeled by using a cellular automaton (CA)-based method. The size of seeds was determined based on a phenomenological approach, and then the number and distribution of recrystallized grains as well as the topological changes were applied by utilizing the CA approach. In order to verify the capacity of the proposed model for predicting the microstructural characteristics, the experimental data of the hot-compressed TiNiFe alloy were used. Results showed that the presented model can accurately estimate the fraction of the recrystallized area. Moreover, the macroscopic flow curves of the alloy were well predicted by the present model.
1. Introduction
Hot deformation characteristics of metals and alloys are interesting subjects which have been extensively investigated. One of the most important softening processes to achieve grain refinement and thereby desired mechanical properties is the dynamic recrystallization (DRX) [1]. Therefore, understanding and modeling the DRX phenomenon can provide an accurate control of the microstructure development during high-temperature deformation. The discrete mesoscale simulation of microstructures in which both the kinetics and energies are locally traced is a promising tool for estimating the microstructural features [2,3].
DRX coexists and competes with the dislocation storage process. This phenomenon can take place slowly and continuously (CDRX) or fast and discontinuously (DDRX) [4]. In the case of CDRX, the stored strain energy is released by the formation of subgrains with a progressive transformation of low-angle grain boundaries into high-angle grain boundaries [5,6], while during DDRX, new recrystallized grains are nucleated along the initial grain boundaries and grow towards the area with higher dislocation density [7] to decrease the stored strain energy [8]. In other words, the new DRX nuclei are generated via the bulging mechanism [9] and grow by consuming the work-hardened neighboring grains.
Various approaches exist for modeling the microstructural development of alloys, such as phase field [10,11], Monte Carlo [12,13,14], boundary-dynamic model [15], phase field [16,17] and the vertex model [18,19]. Among these approaches, the Cellular Automaton (CA) method is widely utilized for understanding the nature of DRX behavior due to its advantages of determinacy and calibration capacity in the time and length scales [20,21]. In fact, the CA approach has been introduced to combine two models: a simple and scalable switching model, and a physical boundary dynamics model [2].
Transition rules of cell state defined by using arbitrary constitutive equations can be easily implemented in a CA model, making it an adaptable tool for modeling various complicated processes [22]. A CA model consists of algorithms executing the local probabilistic [23] or deterministic [24] transformation rules in a grid of uniform cells. In the literature, there are numerous CA-based studies focused on SRX and DDRX. Several works have assessed the ability of CA modeling to predict the grain size and fraction of recrystallized area during the SRX phenomenon [25,26,27,28]. However, most of the published works in the field of DRX modeling by using CA are limited to the alloys experiencing the DDRX softening mechanism. Jin et al. [29] have presented a CA model based on the physical metallurgy and mathematical statistics theorem to estimate the microstructural characteristics during DRX. They have used a dislocation-related nucleation method and metallurgical principles for determining the nucleation kinetics and the growth kinetics of recrystallized grains, respectively. It has been shown that CA-based models coupled with a geometry deformation module are interesting tools to model DRX due to their capacity in tracing the changes in grain morphology [30,31,32]. Jin et al. [33] also evaluated a modified CA model to predict the microstructure during DRX for an oxygen-free high-conductivity copper. They implemented the input parameters by using an adaptive response surface method. Recently, Haipeng et al. [34], Zhang et al. [35] and Li et al. [36] have studied influences of the hot deformation variables on the microstructural features of recrystallized grains via the CA approach, and proved the high precision of the simulated results. Azarbarmas and Aghaie-Khafri [37] have lately presented a CA model coupled with a rate-dependent model to simulate the DDRX phenomenon during the hot deformation of Inconel 718, and showed the good ability of the CA model in coupling with other models.
In the existing literature, most of the DRX modeling works based on the CA method are limited to the DDRX phenomenon, and there are limited works that model the microstructure during CDRX. In this investigation, the microstructure of the TiNiFe alloy experiencing CDRX is modeled by using the CA method coupled with the phenomenological approach. Results of the proposed model were verified by using the experimental data existing in the literature.
2. Continuous Dynamic Recrystallization (CDRX)
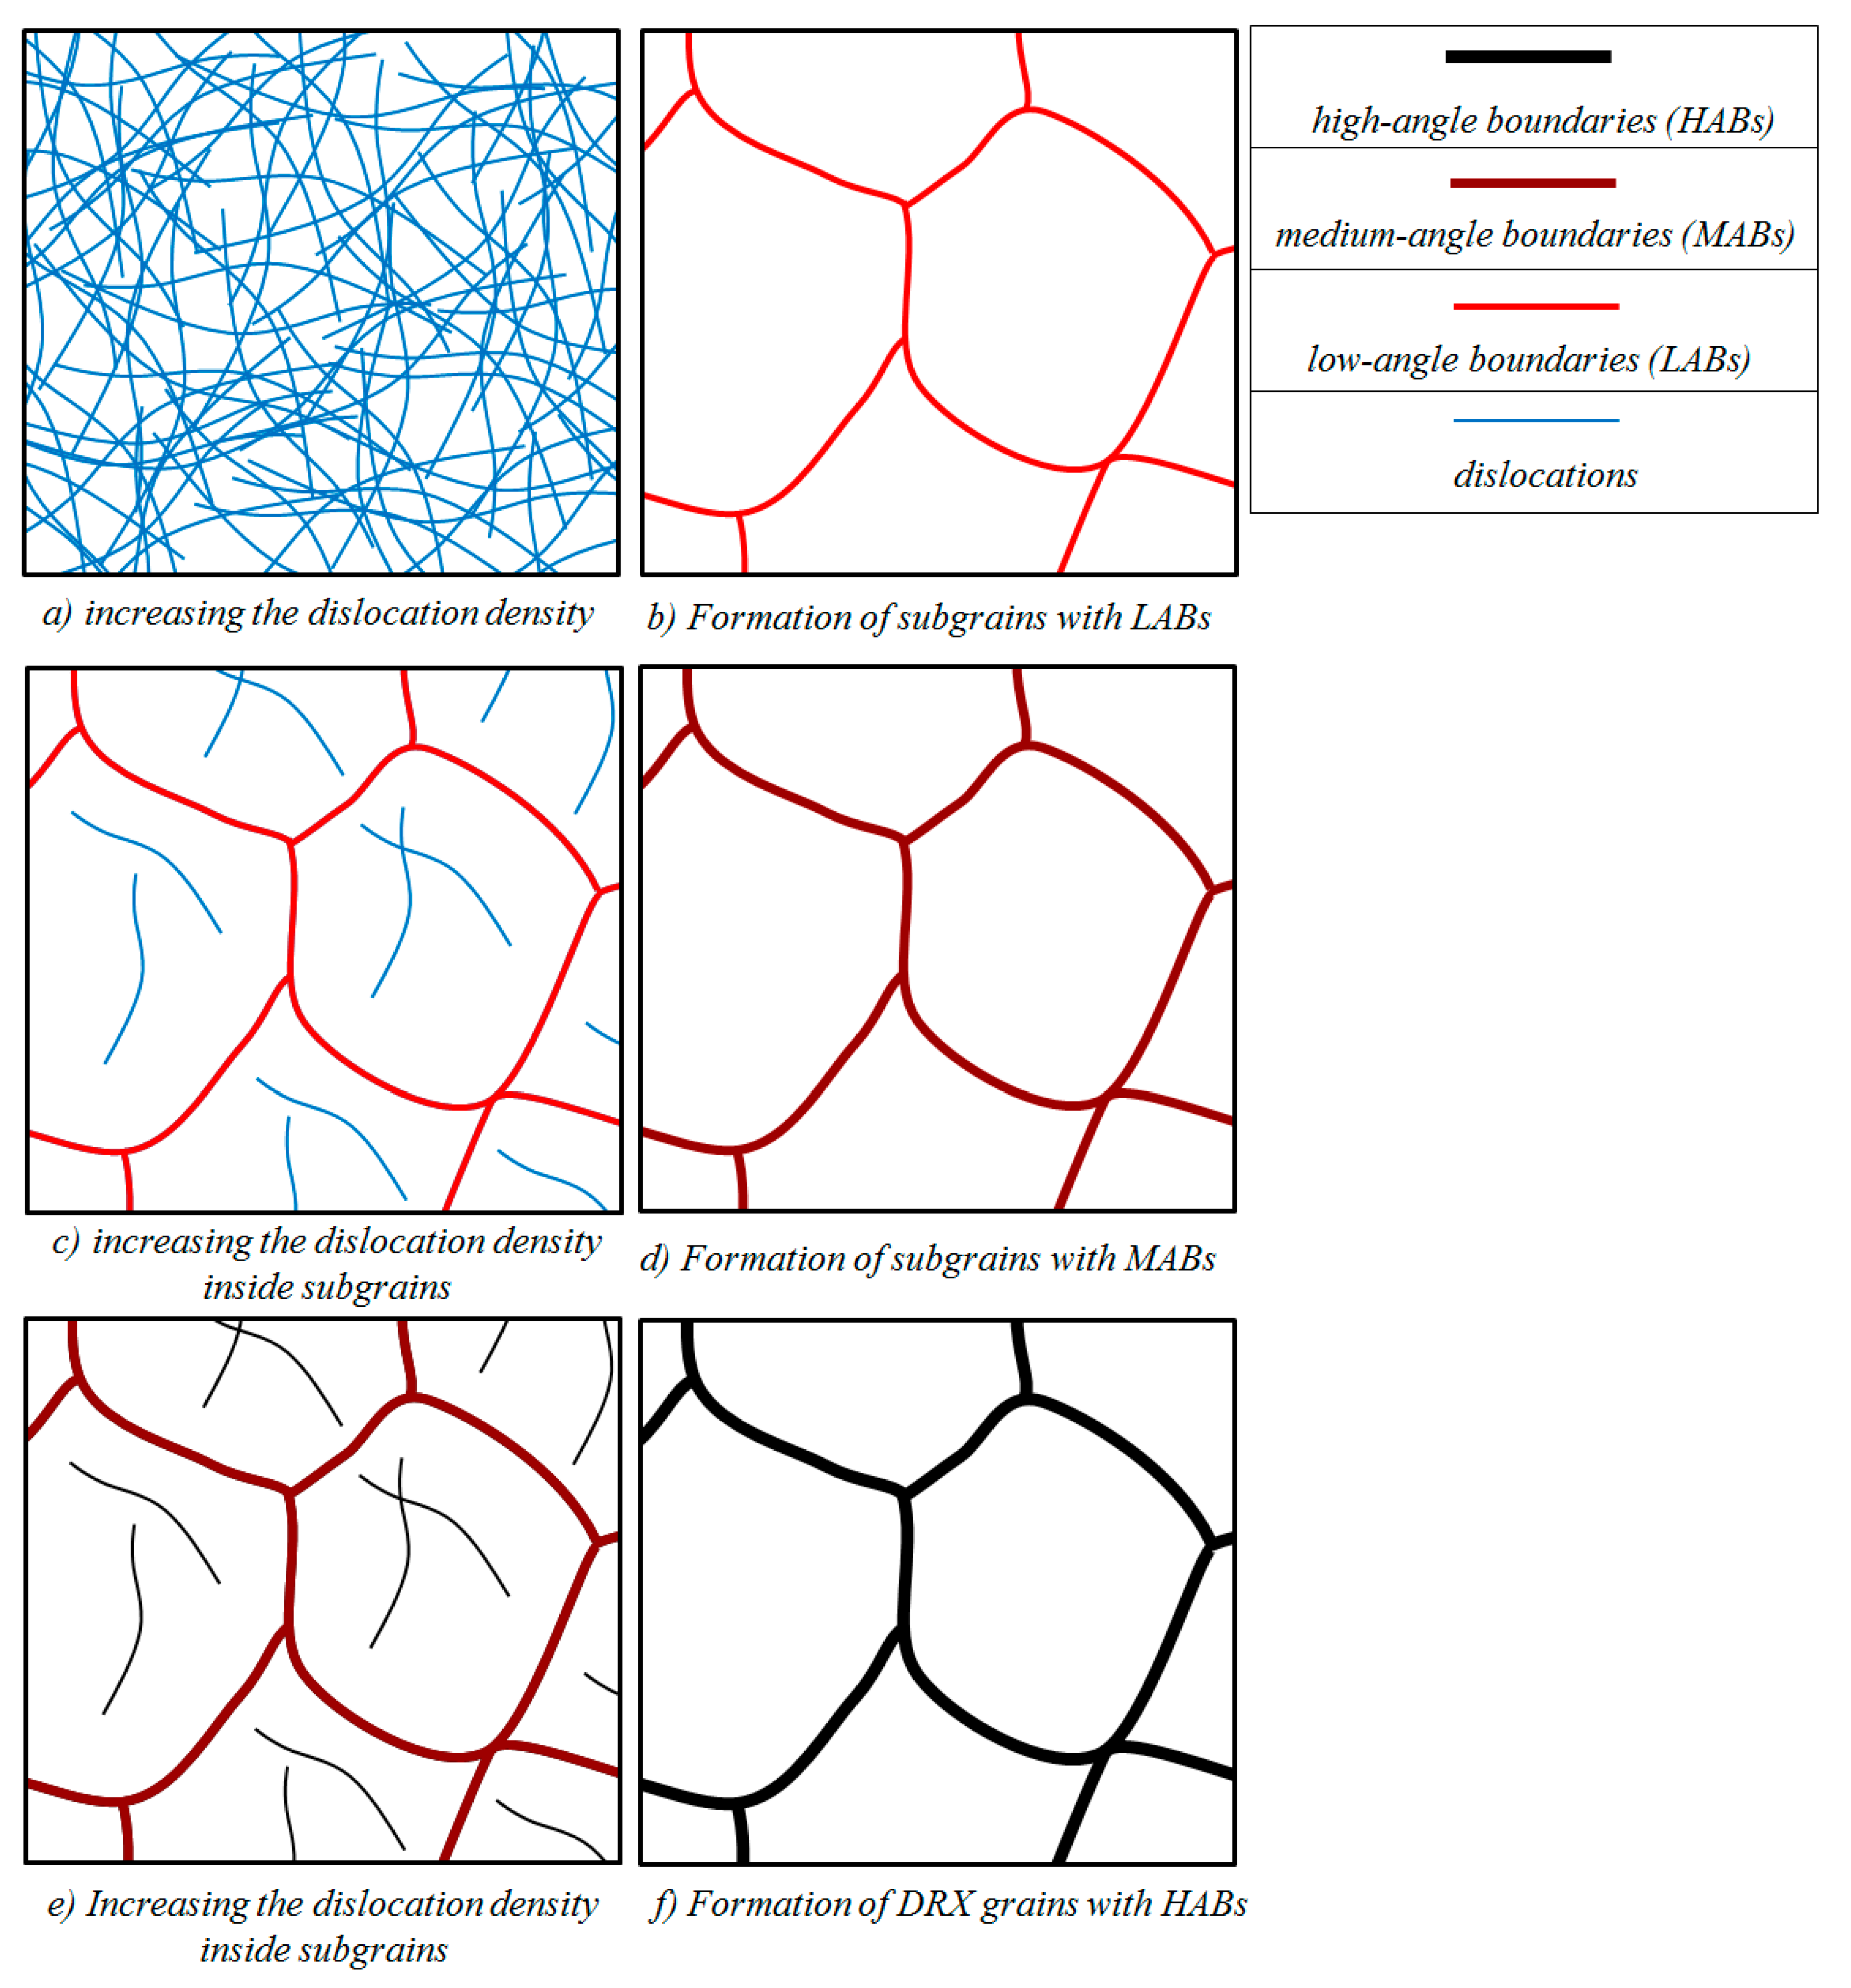
It is now established that two main mechanisms of DRX are DDRX and CDRX [38]. DDRX is assumed as a two-stage process comprising the nucleation and growth of recrystallized grains with high-angle boundaries (HABs). This mechanism is the main restoration process during high-temperature deformation of alloys with low stacking-fault energy [39]. On the other hand, CDRX is known as a one-stage process, without a large-scale migration of HABs [40]. During the CDRX mechanism, the progressive increasing of the misorientations between neighboring subgrains leads to the development of new recrystallized grains with HABs [41,42].
Figure 1 shows the schematics of CDRX stages. At low strains, new dislocations are generated due to the strain hardening, and the dislocation density is increased (Figure 1a). In the subsequent deformation, dislocations are rearranged and self-annihilated, making cell boundaries. The resulting structure consists of the subgrains with low-angle boundaries (LABs) (Figure 1b). Continuing the deformation causes the strain hardening and dislocation density to increase inside the subgrains (Figure 1c). Then, dislocations are rearranged and absorbed into the sub-boundaries. This gradually increases the misorientation between subgrains, thereby converting the boundaries of subgrains from LABs to medium-angle boundaries (MABs) and finally to HABs (Figure 1d,f).
3. The CA Model Concept
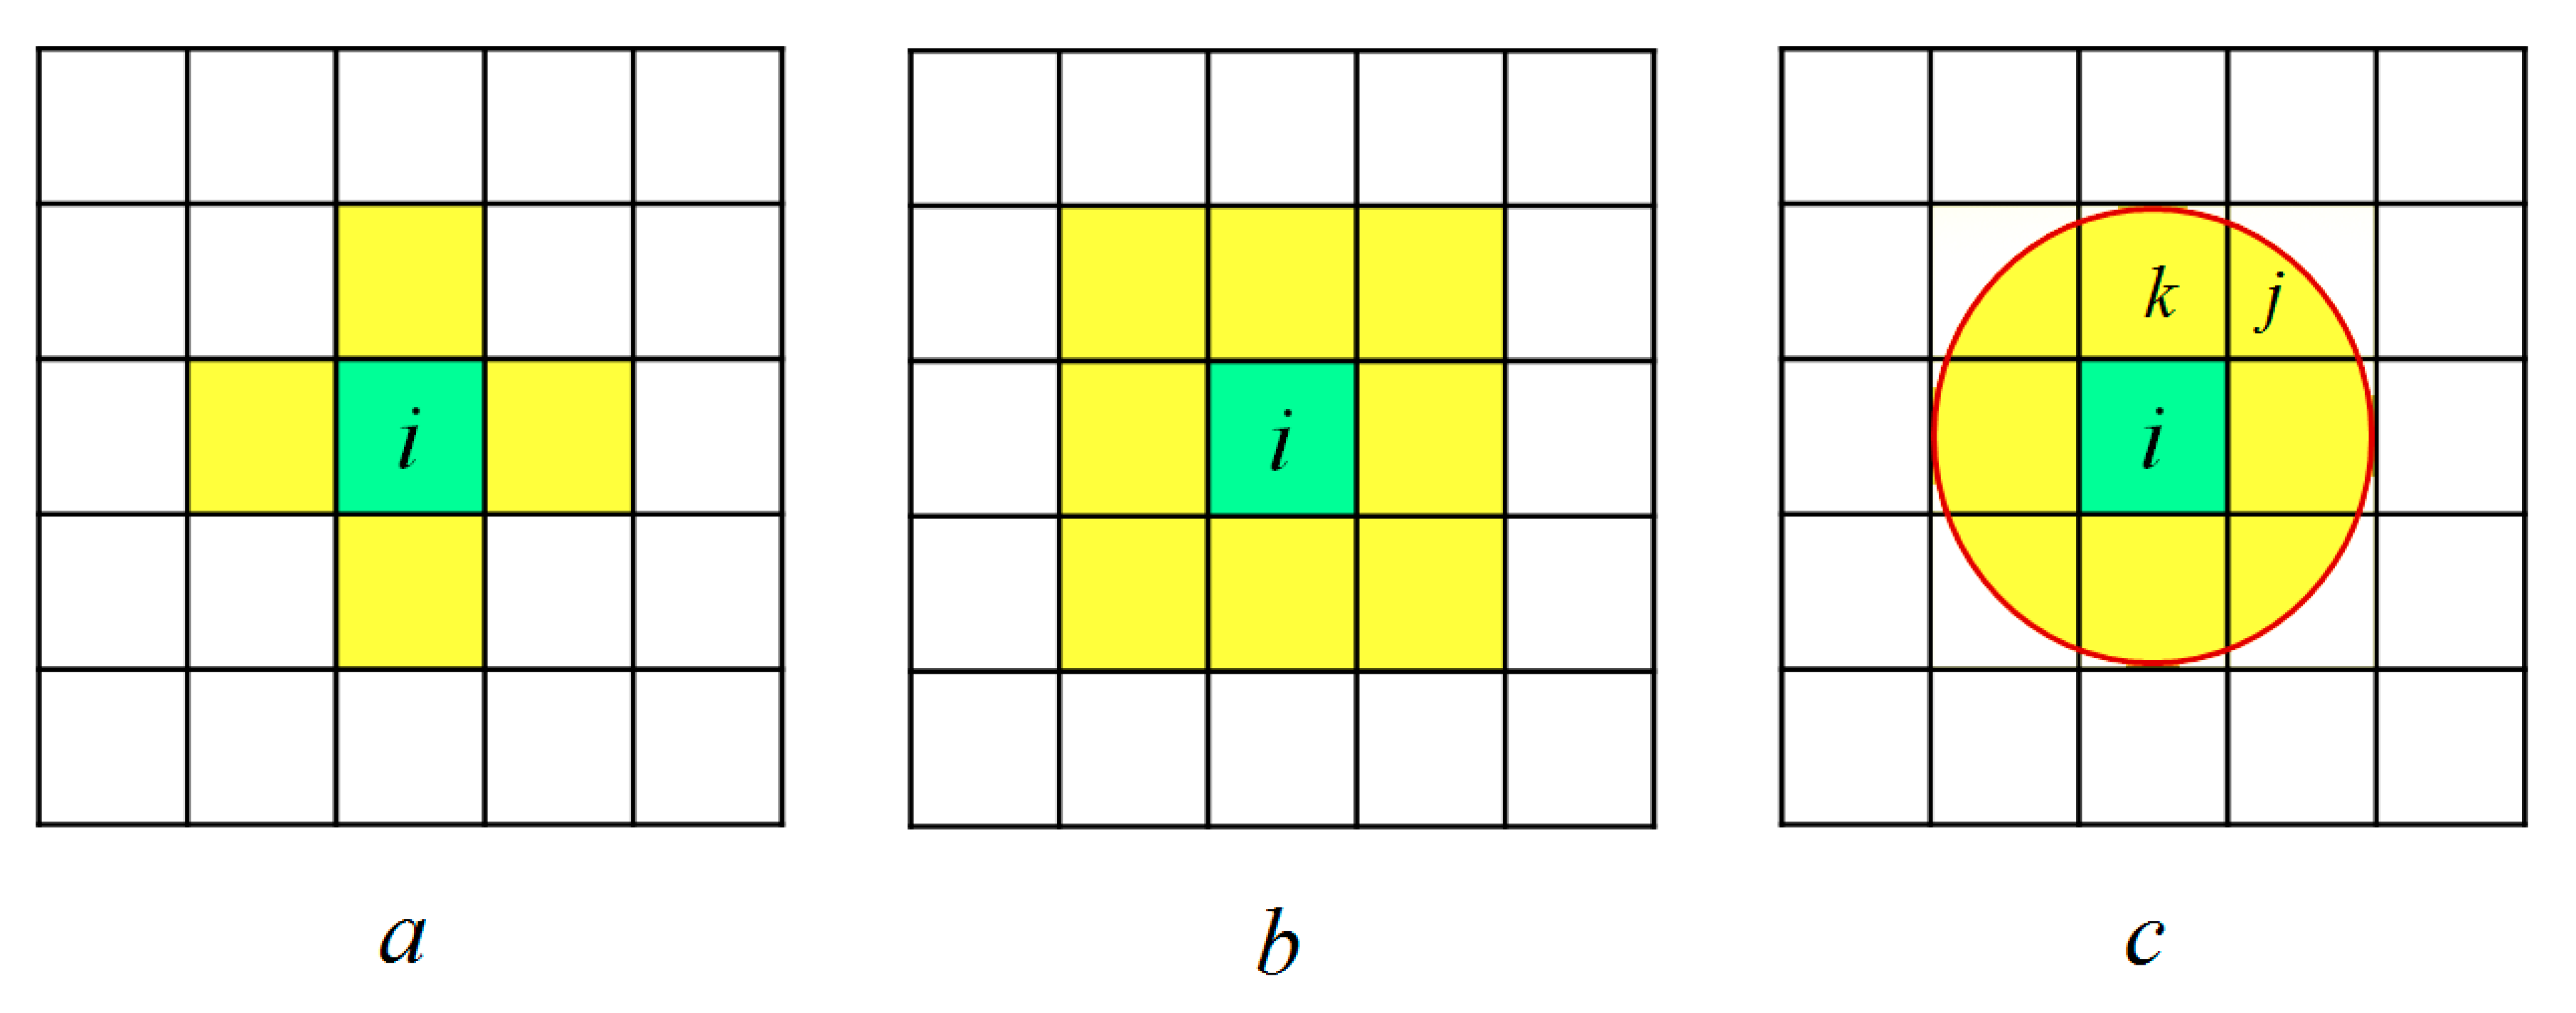
In the present model, the initial structure, the plastic deformation and its effects on the dislocation density as well as changes in the shape of grains were evaluated during the CDRX phenomenon. The CA approach, which can model phenomena in a discrete form of the time and space [20], is an interesting modeling method for scientists due to its calibration ability and reasonable execution time [43]. A CA-based procedure comprises unit cells arrayed in one, two or three dimensions. Typical neighborhoods in the CA modeling are the von Neumann neighborhood and Moore neighborhood. To satisfy a microstructure with equiaxed grains, a neighborhood originated from combining the von Neumann neighborhood and Moore neighborhood was utilized in this work, see Figure 2c. It should be noted that the probability of cell i to grow into cell k is higher than into cell j, Figure 2c. In fact, the probability for selection of a neighboring cell is according to its area being inside the red circle in Figure 2c. These areas for cell j and cell k are 0.54 and 0.97, respectively, by considering the area of cell i equal to 1.
The state of a cell is dynamically updated and determined by considering the state of that cell and its neighbors at the last time step.
3.1. Evolution of Dislocation Density
The density of dislocation in a microstructure is governed by the work hardening, dynamic recovery and DRX, which take place simultaneously during the high-temperature plastic deformation. Kocks and Mecking [44] showed that the flow stress can be estimated by using the average dislocation density, see Equation (1).
where α is a dislocation interaction parameter, which is assumed to be equal to 0.5−1 [33]; μ and b indicate the shear modulus and Burger’s vector, respectively. Also, denotes the average dislocation density determined from Equation (2),
where Ntotal is the total number of the defined cells. Dislocation density increments for each cell can be obtained by using Equation (3), proposed by Kocks and Mecking, which is based on a phenomenological method [44].
where dε is the strain increment; K1 and K2 represent constants indicating the influences of the work hardening and dynamic recovery, respectively; and K1 and K2 are obtained via Equation (4),
where is the rate of work hardening () determined by considering the flow stress curves of alloy, and is the peak stress.
3.2. Generation of Initial Microstructure
The initial microstructure was modeled by utilizing a normal grain growth algorithm with a periodic boundary condition. This work is limited to 2D microstructures but one can extend it to 3D microstructures. To create the initial microstructure, 12 cells were randomly selected and defined as nuclei. Then, each nucleus was grown by considering the neighborhood defined in Figure 2c until the whole space was covered by these grains. The required state variables comprising the grain number, the initial dislocation density (to evaluate the critical condition for the occurrence of DRX), initial orientation (for distinguishing the grains and detecting the grain boundaries), the recrystallization state (to determine the DRX fraction) and so on were defined for each cell. The modeled initial microstructure contained 200 × 200 cells with the dimensions of 60 × 60 µm2.
3.3. Modeling of CDRX
As the stored strain energy arising from dislocation accumulation can overcome the critical dislocation density, new nuclei initiate to recrystallize. The nucleation sites were randomly determined from the cells belonging to the work-hardened grains. Also, the dislocation density of a nucleus was considered as that of an annealed material. This dislocation density increases for each cell as the strain increases according to Equation (3). At any time step, a certain number of DRX nuclei were generated. This number was determined by considering the rate of nucleation per unit area of grain boundaries, which is a function of the compression temperature and the strain rate, see Equation (5) [45],
where indicates the rate of nucleation; Q denotes the activation energy obtained by using the stress–strain curve; and C is a constant. It is clear that the nucleation rate increases as the strain rate and temperature of deformation increase.
A two-dimensional microstructure is, in fact, a cross-sectional view of a corresponding three-dimensional microstructure. In this 2D structure, the average size of DRX grains was determined by considering an equivalent mean radius of grains via Equation (6):
where and denote the area of one cell and the total number of cells belonging to the given grain, respectively.
3.4. The Module of Geometry Changes
The deformation of grains results in grain morphology changes. In this investigation, an updatable CA-based approach [30,46] was utilized in order to apply the effects of the hot deformation on the grain morphology more precisely. The location of any point in a two-dimensional lattice can be indicated by a vector. Accordingly, a new situation of a certain point may be defined by using a new vector. On the other hand, it is possible to represent the deformation via a 2 × 2 deformation matrix in a two-dimensional lattice. Thus, a uniform deformation matrix S transfers the original vector u to a new vector v, as shown in Equation (7). In fact, the general deformation tensor can be decomposed into the stretch tensor S and the rotation tensor R. It is possible to utilize the stretch tensor for the uniaxial compression test, neglecting the rigid rotation of grains, as Chen et al. [31] and other researchers [30,47,48] have done. It is clear that for a complicated deformation which experienced the shearing and localized deformation, the rotation of grains and thereby the antidiagonal components of the deformation tensor should be considered too:
where Ii (i = x, y) indicates the principal deformation at a 2D network. So, εi = ln Ii is the true strain along the principal directions of the plastic deformation. Because it is presumed that the volume is constant throughout the plastic deformation, the determinant of matrix I should be equated to unit (IxIy = 1). To trace reliably influences of the plastic deformation, a module consisting of a cellular coordinate system (CCS) and the material coordinate system (MCS) was utilized. Details on these coordinate systems combination have been provided in [48]. The CCS contains lattice cells with a constant size, while the lattice size of MCS can be changed during the simulation. In each strain step, the elongated shape of grains is mapped from the MCS to CCS. Then, the work hardening (dislocation density increments) and the recrystallization stage (if the dislocation density exceeds the critical value) are applied at the CCS, and resulting changes are mapped to the MCS for tracking the next strain step.
4. Simulation Stages
In this investigation, the CA modeling was executed according to the following sequential steps, which are illustrated in Figure 3. (1) Modeling the initial microstructure; (2) straining and running the geometry module according to the deformation increment for determining the morphological characteristics of grains; (3) calculating the increments of dislocation density; (4) comparing the calculated dislocation density of the microstructure with the critical value; (5) mapping the elongated grains and new DRX grains.
Sachs’s and Taylor’s models are two pioneering models proposed for polycrystal deformation. Sachs’s model [49] considers only strain compatibility, while Taylor’s model [50] presumes just stress equilibrium. Therefore, the complex interactions among crystals within a polycrystal can be simply evaluated by using these models. The model presented here is based on Taylor’s theory [50] in the case of an axisymmetric tension/compression. According to this theorem, it can be assumed that each grain is subjected to a similar displacement field as the aggregate.
In the recrystallization stage, the number of recrystallized grains was determined by using Equation (5). Then, these grains were distributed inside the grains with the dislocation density exceeded from the critical value. In fact, these grains form as a result of the cell boundaries’ development. Against the DDRX mechanism, in the proposed model for CDRX, new recrystallized grains were not placed only along the preexisting grain boundaries. The nucleation site inside a grain (with the critical dislocation density) was randomly selected. However, some characteristics of the CDRX mechanism were not considered in the present model. For example, tracking the generation and movement of dislocations, and the effects of initial orientation and texture development, were not investigated. Nevertheless, the impact of lacking these features was limited by coupling the CA model with a phenomenological model by which the actual subgrain size was implemented in the model.
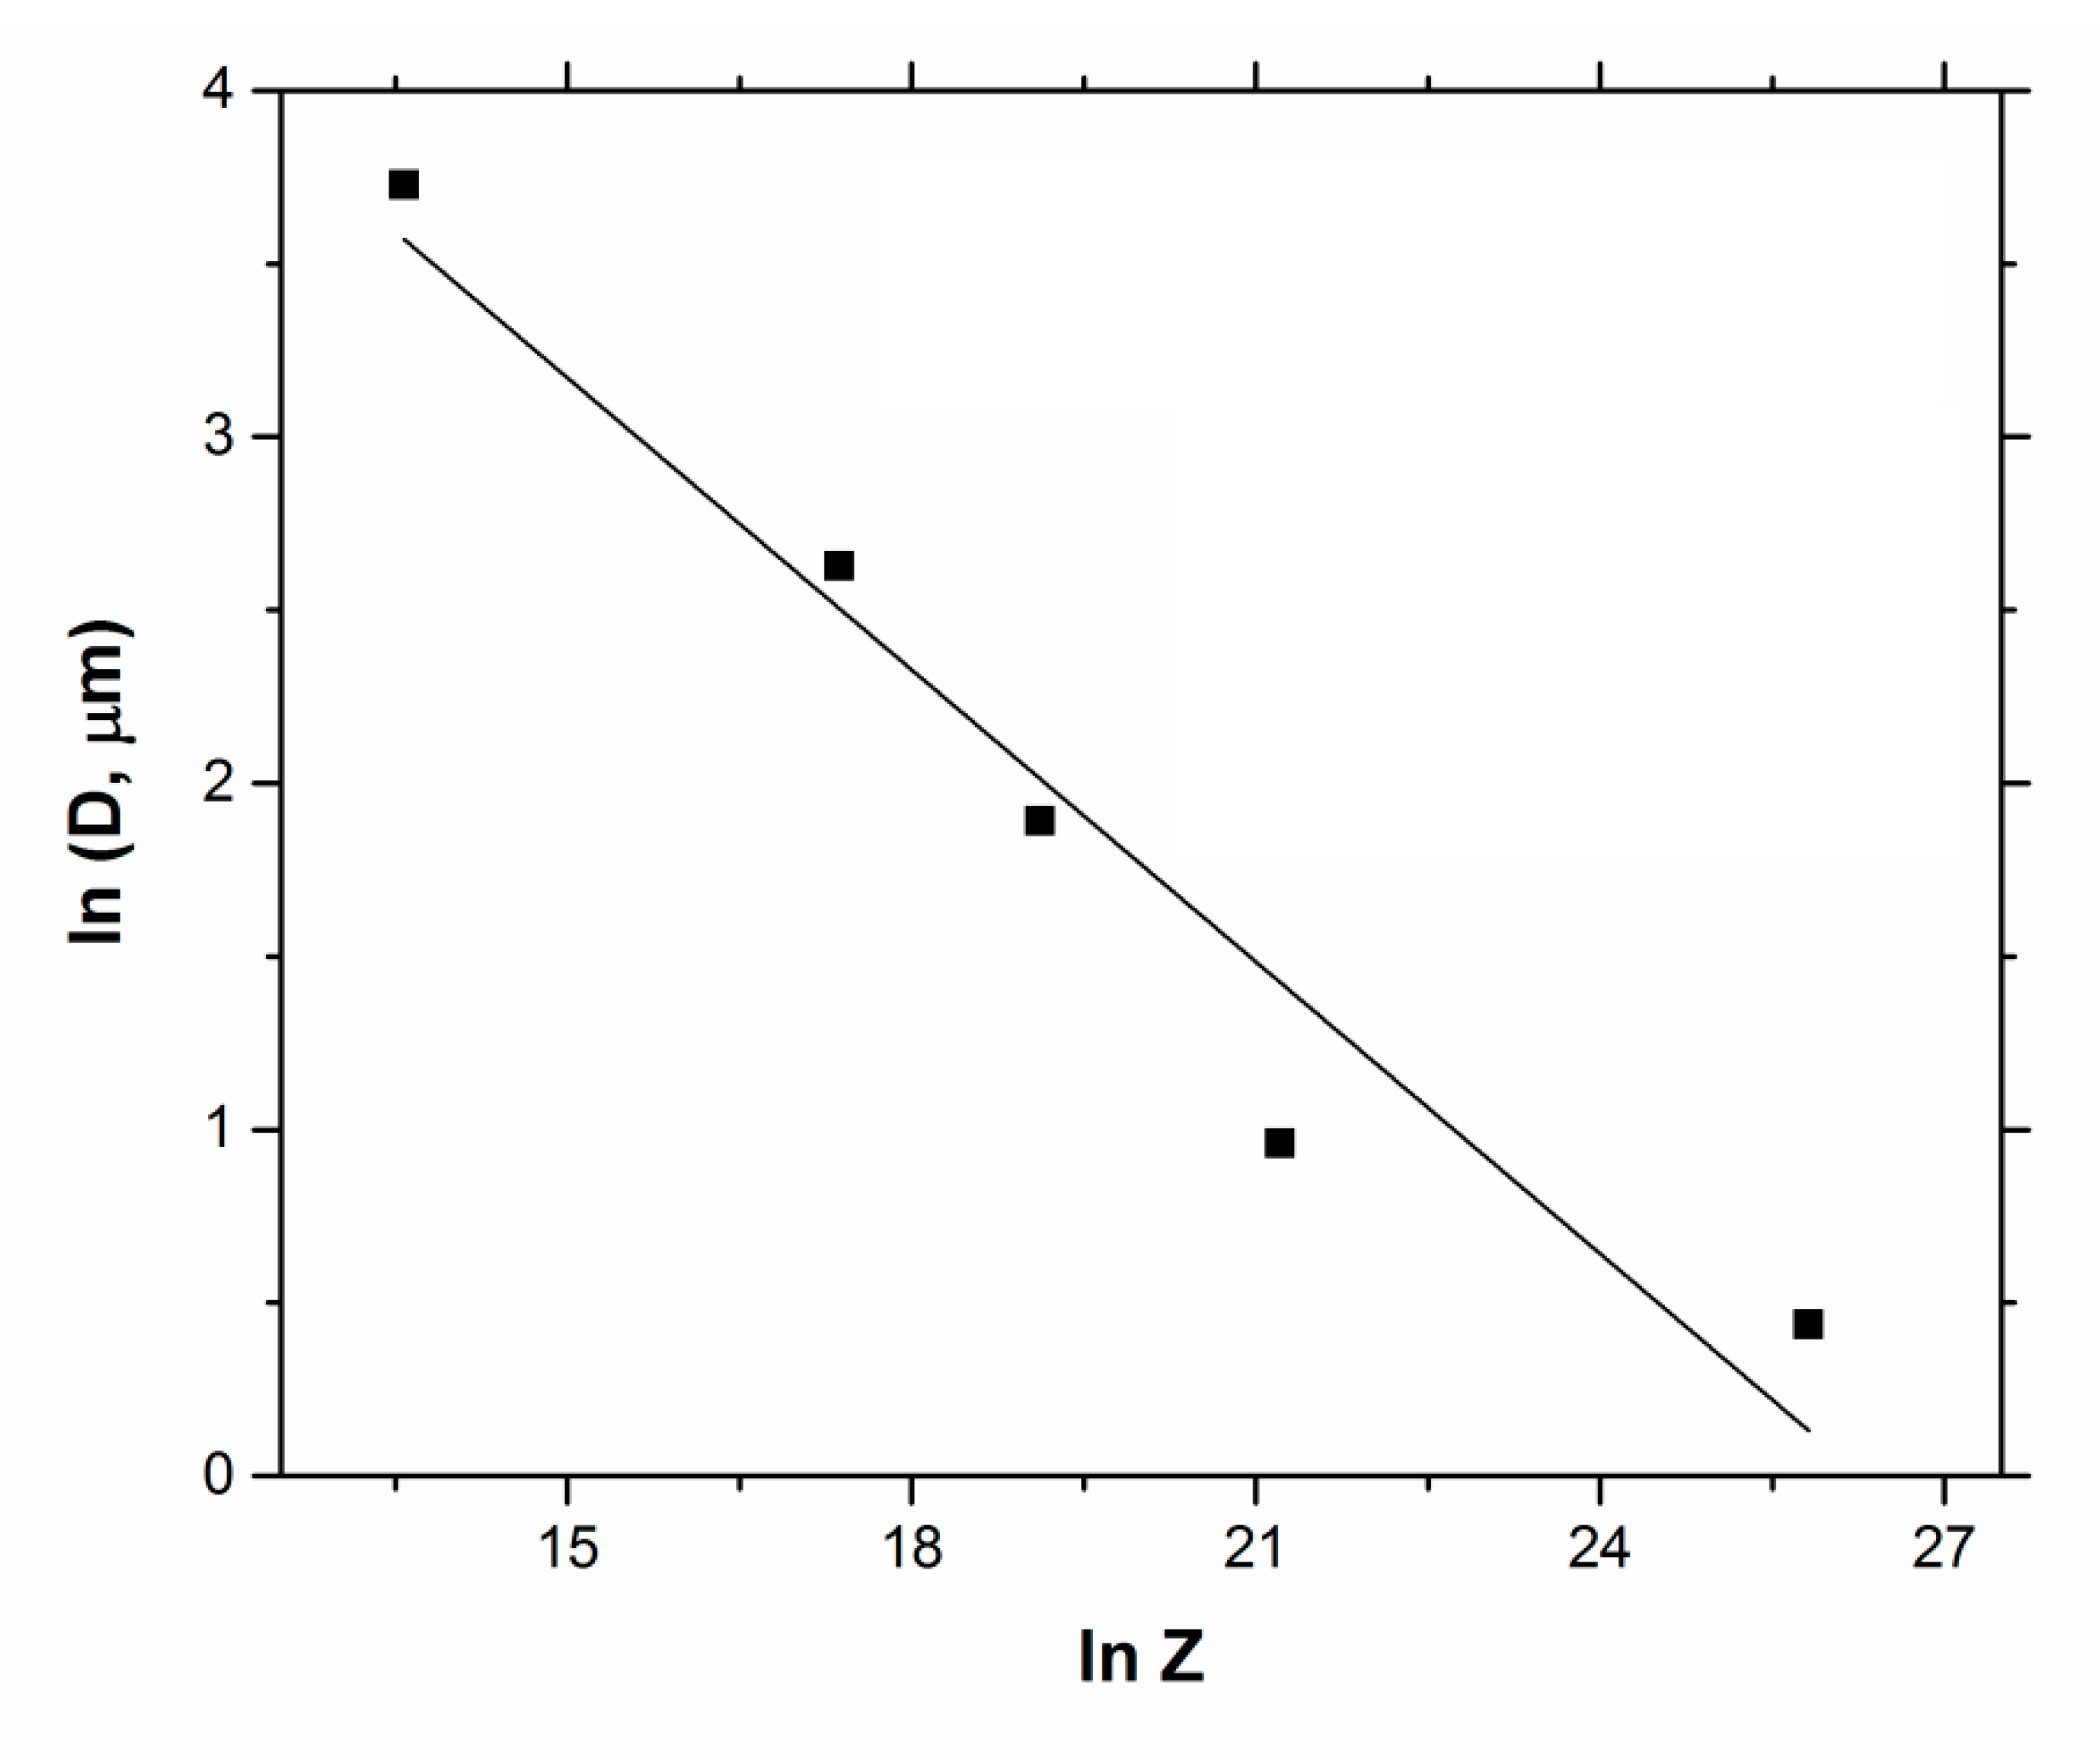
CDRX is a one-step recrystallization process without a large-scale growth. So the size of recrystallized grains formed via the CDRX phenomenon is similar to that of the subgrains. This can be seen in Figure 4 in which the experimental data reported for the TiNiFe alloy by Yin et al. [51,52] are presented. In the present model, a relationship for the size of recrystallized grains (resulting from the subgrains) was proposed by using the phenomenological model. A phenomenological approach provides a mathematical description of a phenomenon based on the experimental data [53]. As can be observed in Figure 5, there is a linear relationship between the subgrain size (Dsub) and Zener–Hollomon parameter (Z). The obtained expression is demonstrated in Equation (8).
In this study, new CDRX grains were defined in one stage with the size of subgrains estimated by utilizing Equation (8), at each condition of the temperature and the strain rate. The nucleation was performed by using the corrected Moore neighborhood (Figure 2c). In the presented model, the recrystallized grains can be considered as nonrecrystallized grains because of the accumulation of dislocations. This means that when the density of dislocation inside a recrystallized grain exceeds the critical value (due to the restrain hardening), this grain is subsequently replaced by the nucleated DRX grains. Therefore, evaluating the increment of dislocation density and comparing it with the critical value should be done for all cells independent of the recrystallization state of them. In this model, the size of subgrains was determined based on the phenomenological procedure, and the number and distribution of grains as well as the topological changes were applied by using the CA approach. In fact, the CA part of the proposed model for simulating the CDRX phenomenon is similar to models provided for DDRX in the literature, but it has transition rules accommodated to CDRX conditions to limit the grain boundary migration and the heterogeneous nucleation along the primary grain boundaries. Although the grain size for a 2D microstructure is less than that for a 3D, it should be noted that the validity of the present model was evaluated with the real 2D microstructure (not with the real 3D microstructure), so modeling the grains’ morphology, the nucleation, recrystallization kinetics and so on for the 2D microstructure is reasonable.
5. Simulation Results and Discussion
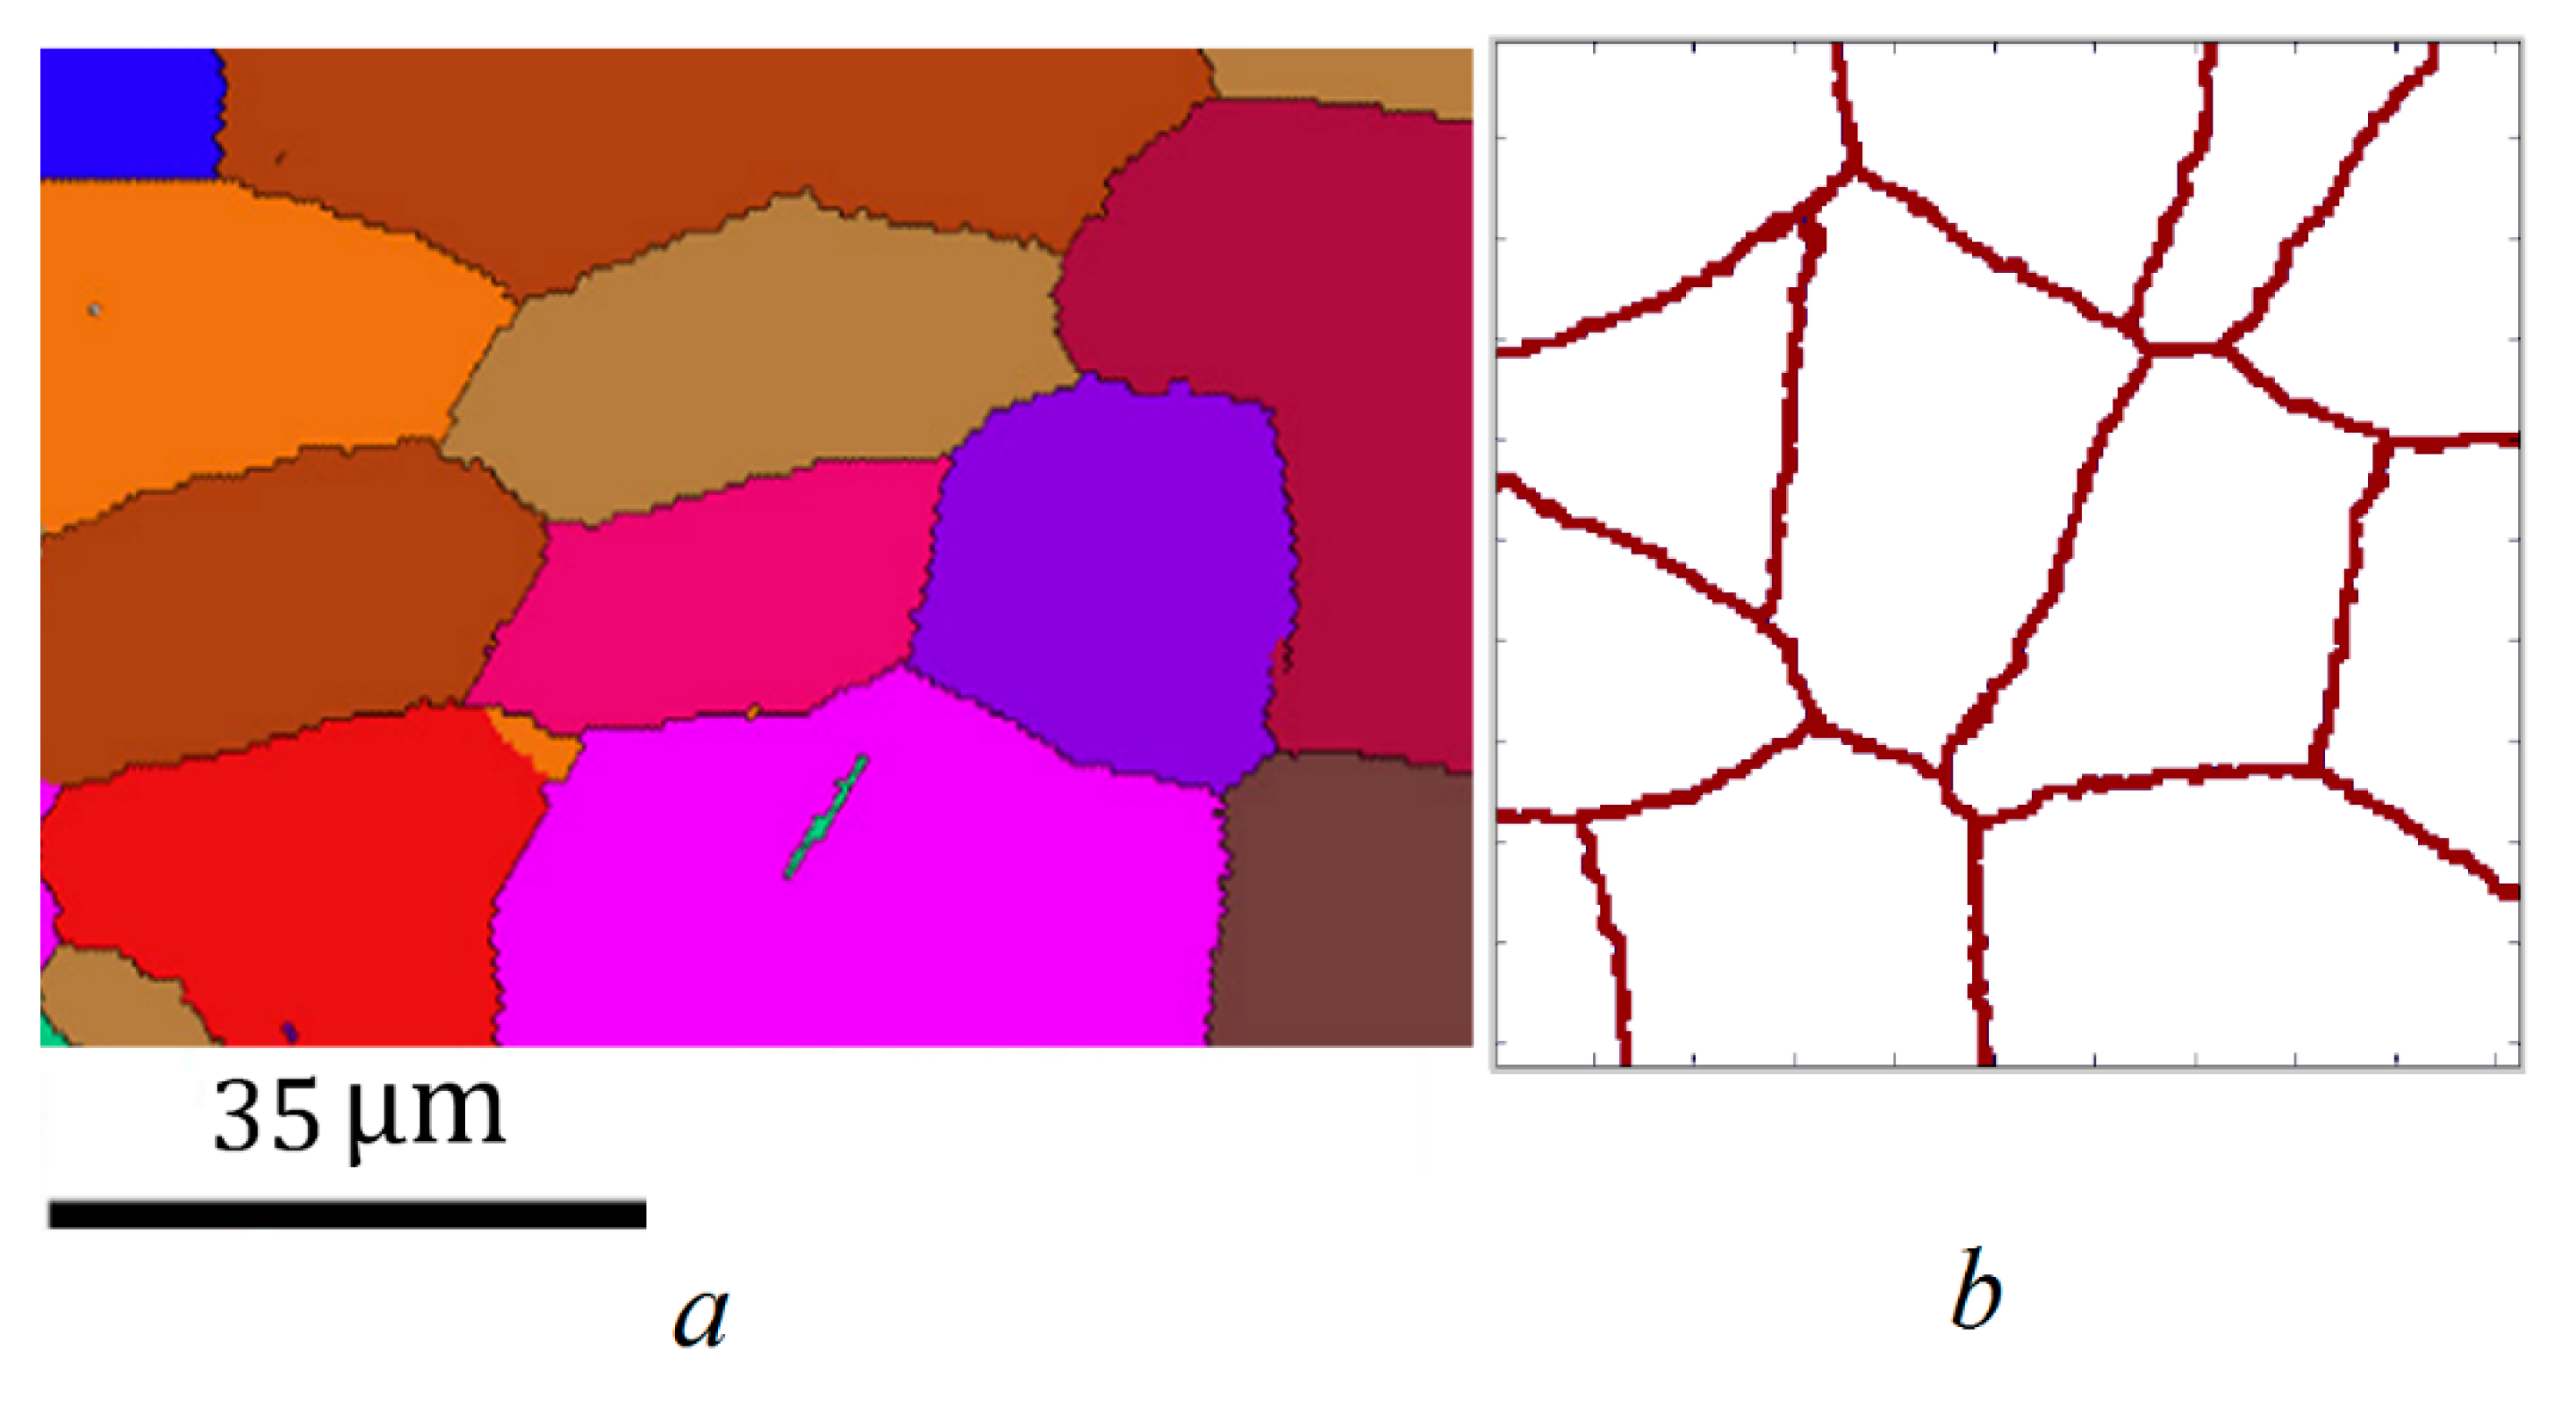
One of the main advantages of this work is its simplicity compared with the similar works based on the crystal plasticity approach, such as the model proposed by Svyetlichnyy et al. [54], who have modeled the grain refinement of a microalloyed steel during the severe plastic deformation process by using a frontal CA modeling. Their model involved two steps: the low-angle grain boundaries’ generation inside the original grains, and the rotation of grains. Figure 6 compares the real and simulated microstructures of the initial samples before the hot-compression test. This figure depicts that the simulated microstructure is well in line with the experimental microstructure. Both of the images have an average grain size of 20 μm.
The nucleation of new grains takes place as the dislocation density of the matrix exceeds the critical dislocation density [55]. An identical initial dislocation density was implemented for the whole initial matrix. The recrystallization started when the density of dislocation overcame the required activation energy. Thereafter, the dislocation density of recrystallized grains decreased to a reference value and rose again with further deformation. In the presented model, the CDRX was assumed as the dominant recrystallization mechanism, which is a logical presumption in the case of the TiNiFe alloy with high stacking-fault energy [51]. This is why newly nucleated DRX grains were distributed inside the initial grains, not only along the grain boundaries.
Table 1 demonstrates the implemented input parameters in the proposed model. Results of modeling can be assessed in Figure 7a–f in which the predicted microstructures of specimens compressed at the temperature of 850 °C and the strain rate of 0.1 s-1 are displayed. In this figure, grains with the blue color are the initial grains, while regions with the red color show DRX grains. It can be observed that original grains are compressed and elongated so as to be perpendicular to the compression axis, while the recrystallized area consists of equiaxed grains. It is clear that DRX grains are not distributed just along the initial grain boundaries, because according to the experimental reports [56,57] it is concluded that CDRX is the dominant softening process of the TiNiFe alloy through the high-temperature deformation. The most important limitation of the proposed model is its inability to take into account the inhomogeneity of deformation. One can apply the deformation heterogeneity by coupling the present model with the crystal plasticity models such as the work proposed by Chuan et al. [58] by using a rate-dependent crystal plasticity model, or Beygelzimer and Spuskanyuk [59] by utilizing a self-consistent model.
The fraction of DRX area was calculated by utilizing the following equation:
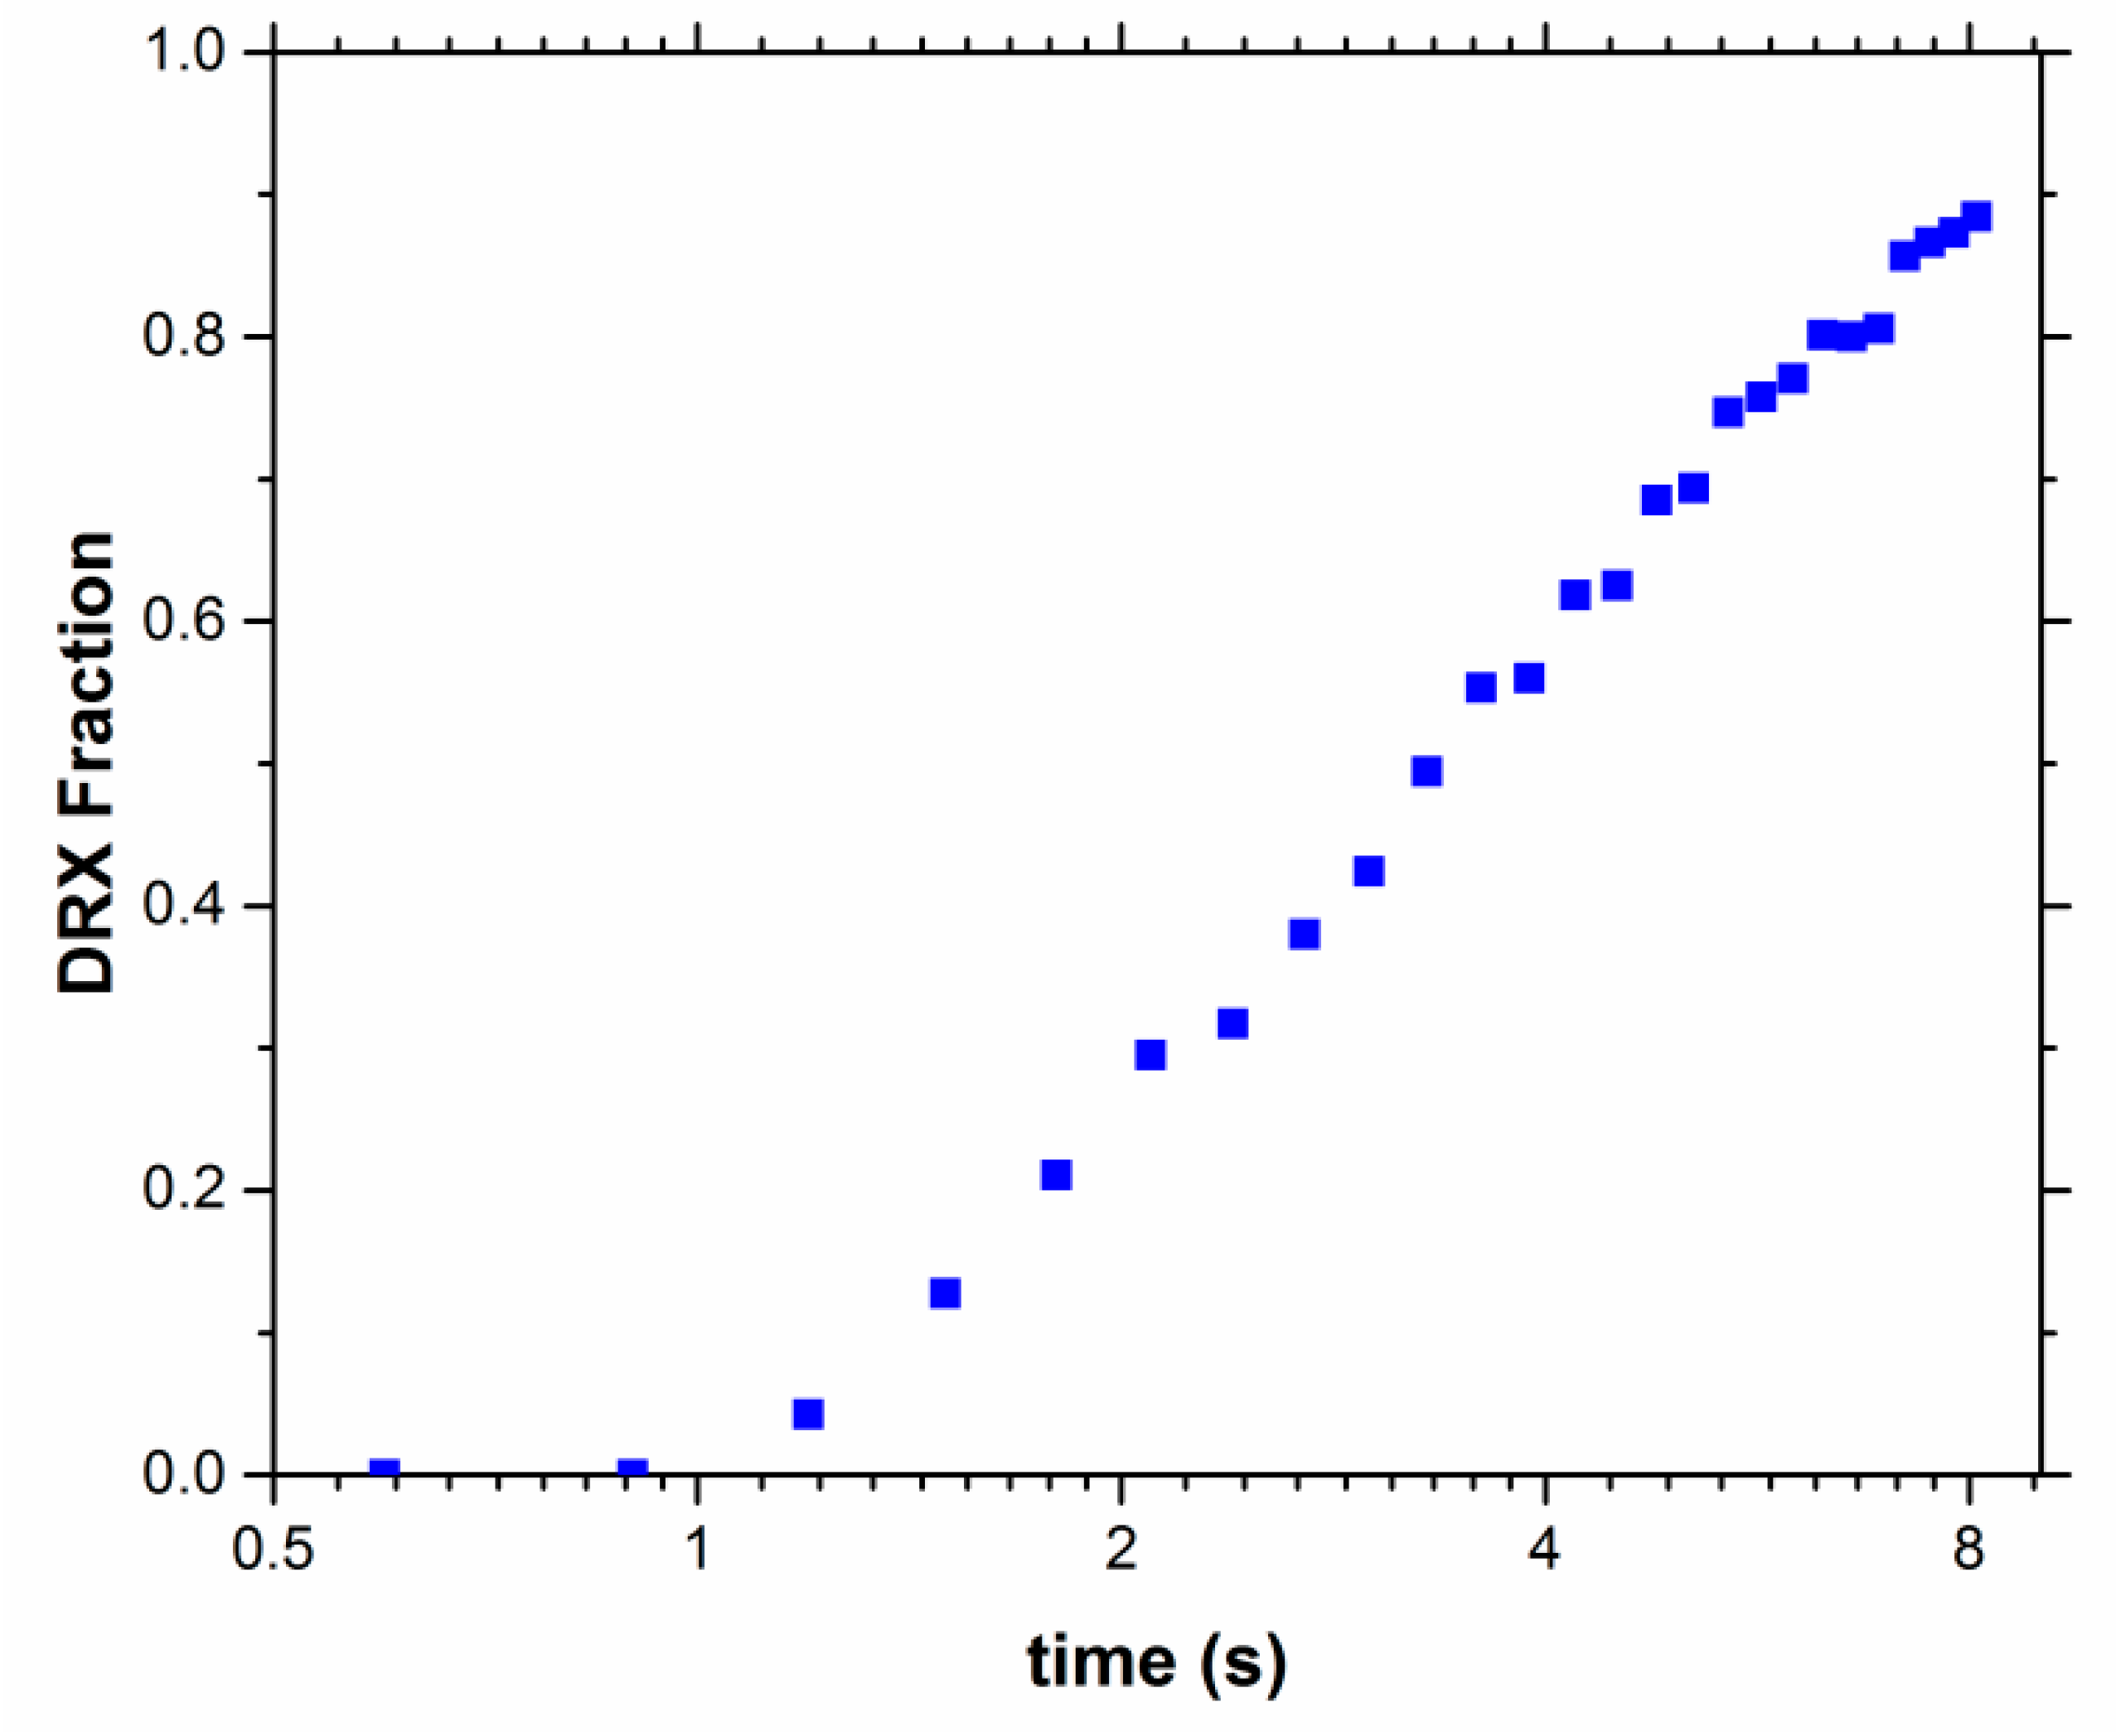
where NDRX and Ntotal denote the number of cells belonging to DRX grains and the number of total cells, respectively. The kinetics of the DRX phenomenon can be evaluated by considering the evolution of recrystallization volume fraction with the deformation time. Figure 8 exhibits the modeling results of the recrystallization kinetics for the sample deformed at the strain rate of 0.1/s. It is obvious that the recrystallization takes place after an incubation time, which is attributed to the critical strain necessary for the initiation of recrystallization. The decreased slope of the curve at the latest stages of recrystallization is because of the interactions and impingement of growing grains, and the lower volume fraction of the deformed matrix available for DRX occurrence.
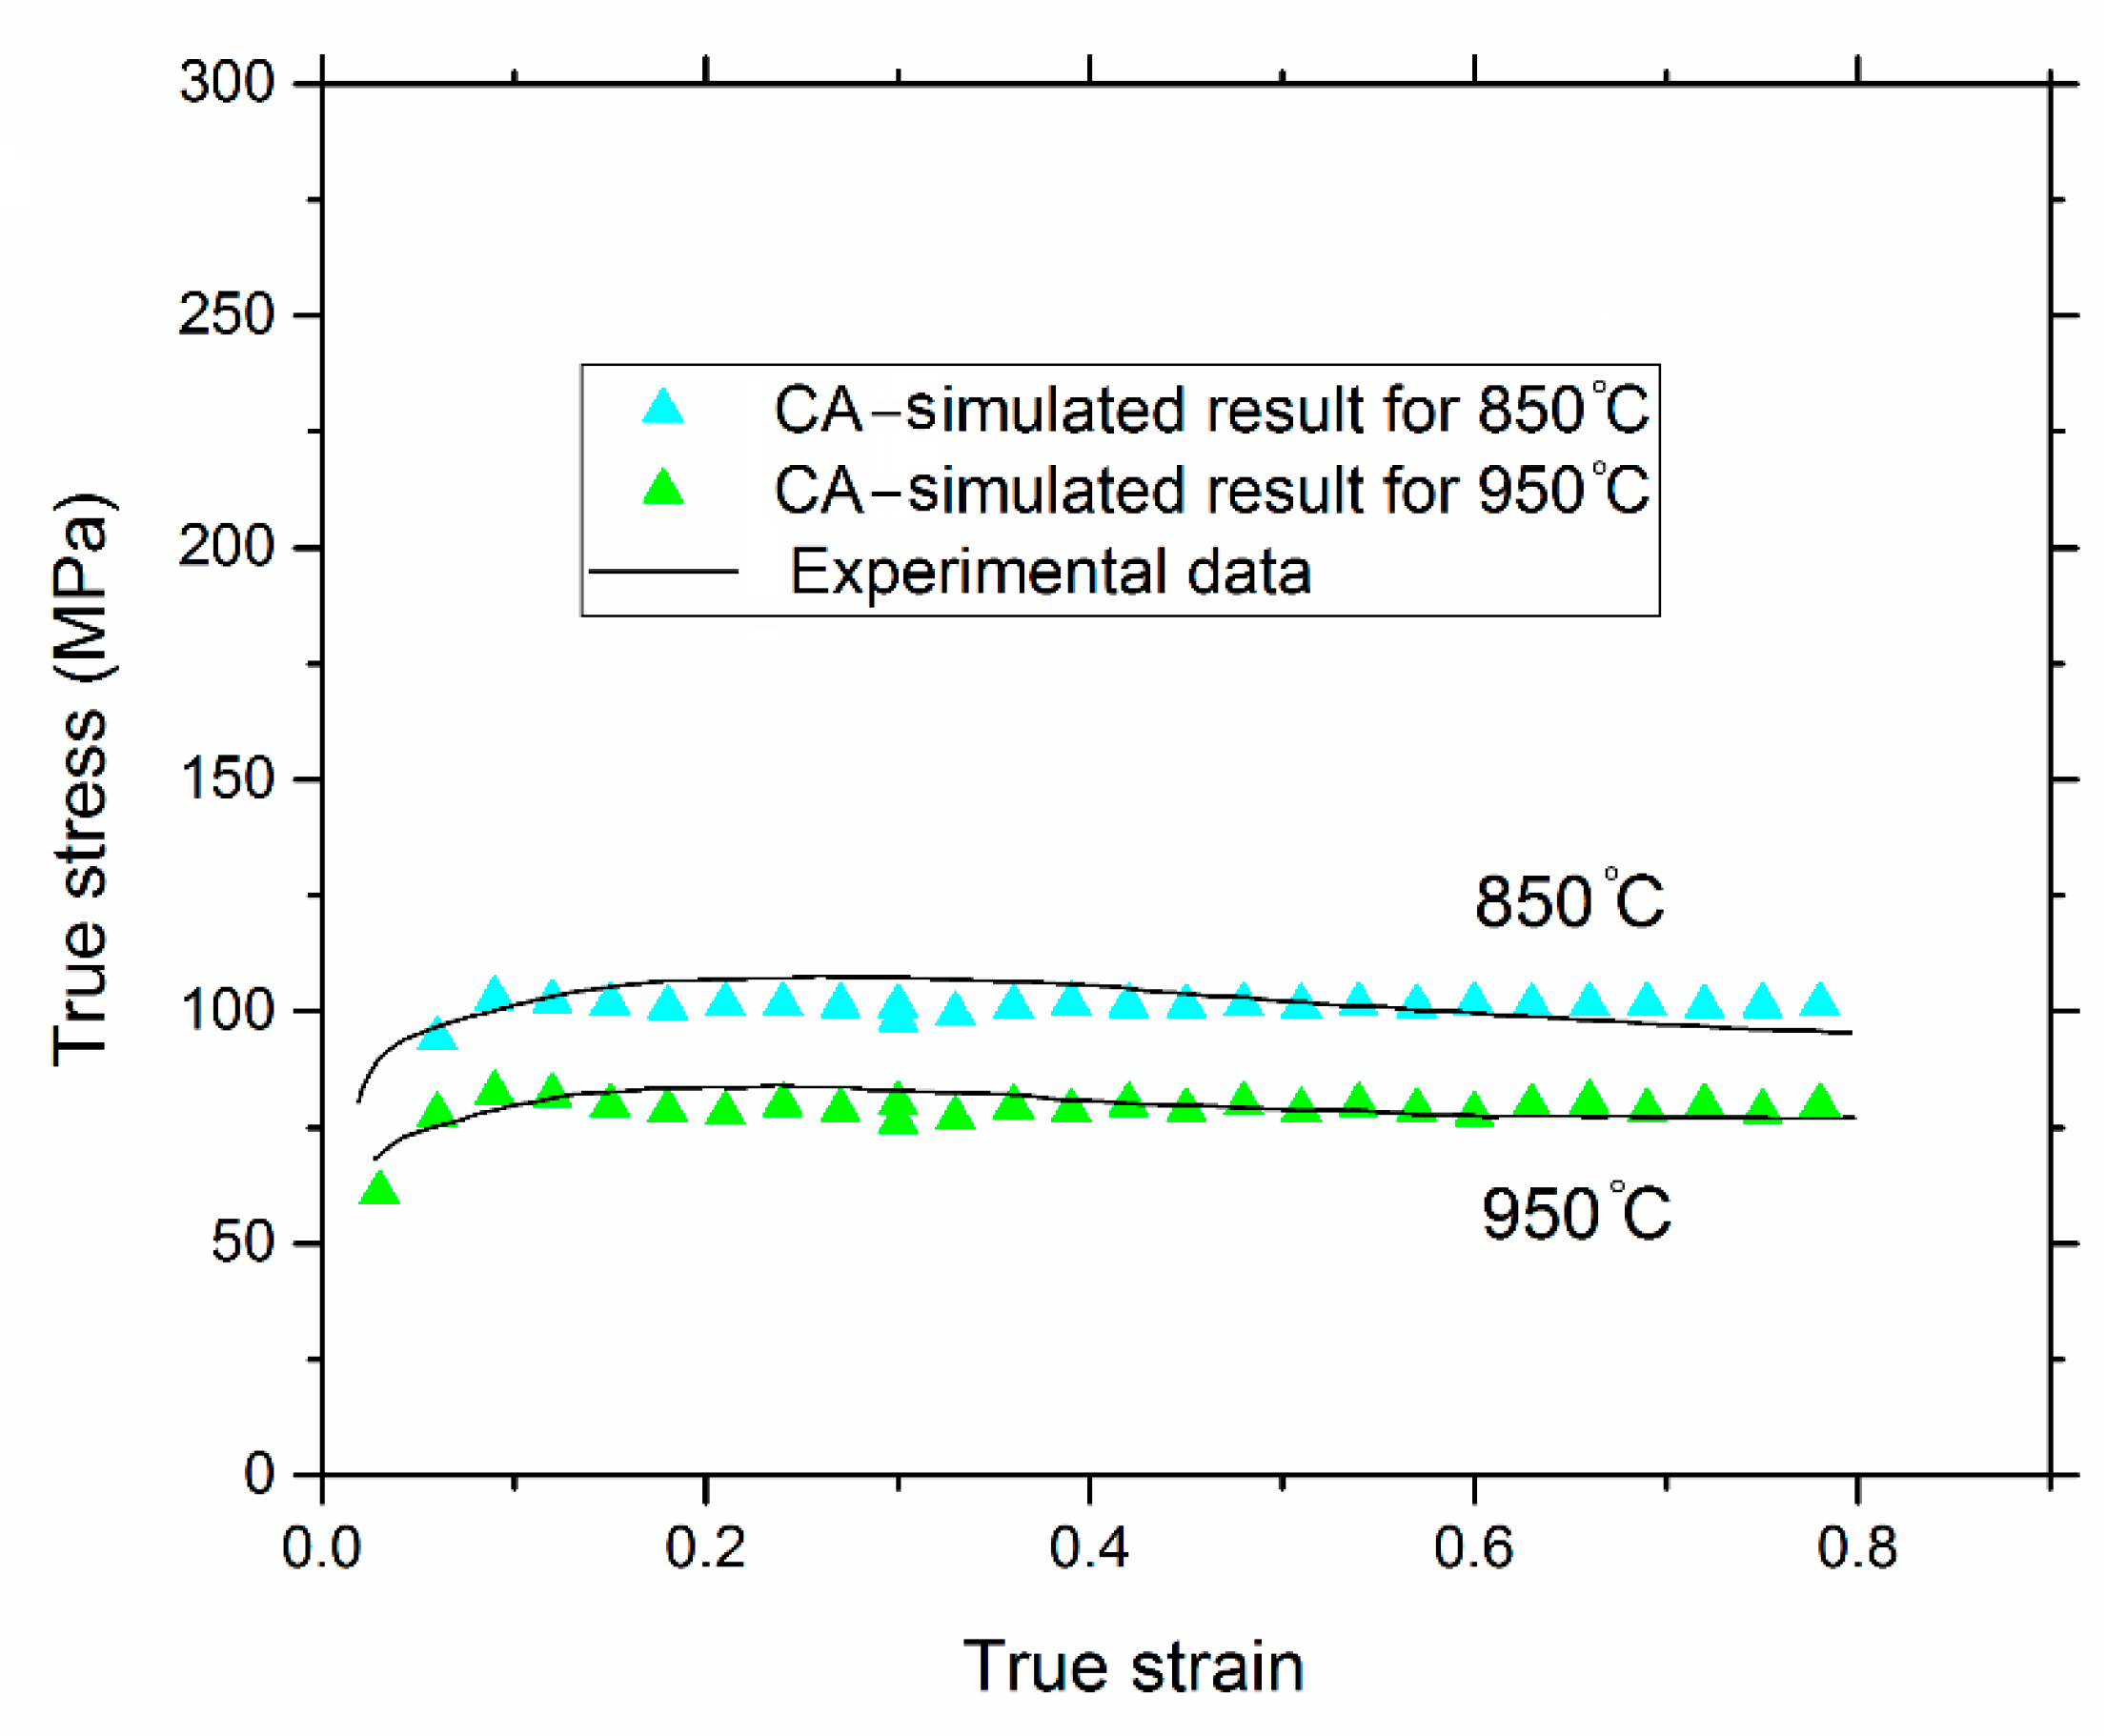
The stress–strain curves of samples hot-deformed at the strain rate of 0.1 s‒1 and different deformation temperatures are shown in Figure 9. The experimental data of this figure were extracted from [52,63]. It is evident that at low strains, the true stress increases along with increasing the strain. Afterwards, the flow stress slowly decreases owing to the concurrent reactions of the work hardening and dynamic restoration processes. This behavior is known as a typical feature of the DRX [38]. It is apparent from Figure 9 that the peak stress increases along with increasing the deformation temperature. The increased mobility of DRX grain boundaries at higher deformation temperatures promoting the recrystallization phenomenon can be ascribed for this behavior [65]. Characteristic stresses, such as the critical stress and the peak stress, were determined by using the work hardening rate curves and were implemented in the model. The ability of a modeling approach to simulate the hot deformation behavior may be assessed through comparing the predicted flow curves with the experimental results [66]. As shown in Figure 9, the presented CA-based model estimates successfully the flow stresses of samples hot-compressed at various temperatures. The average root-mean-square error (RMSE) [67] was determined to be equal to 3.61 MPa, which approves the rationality of the prediction.
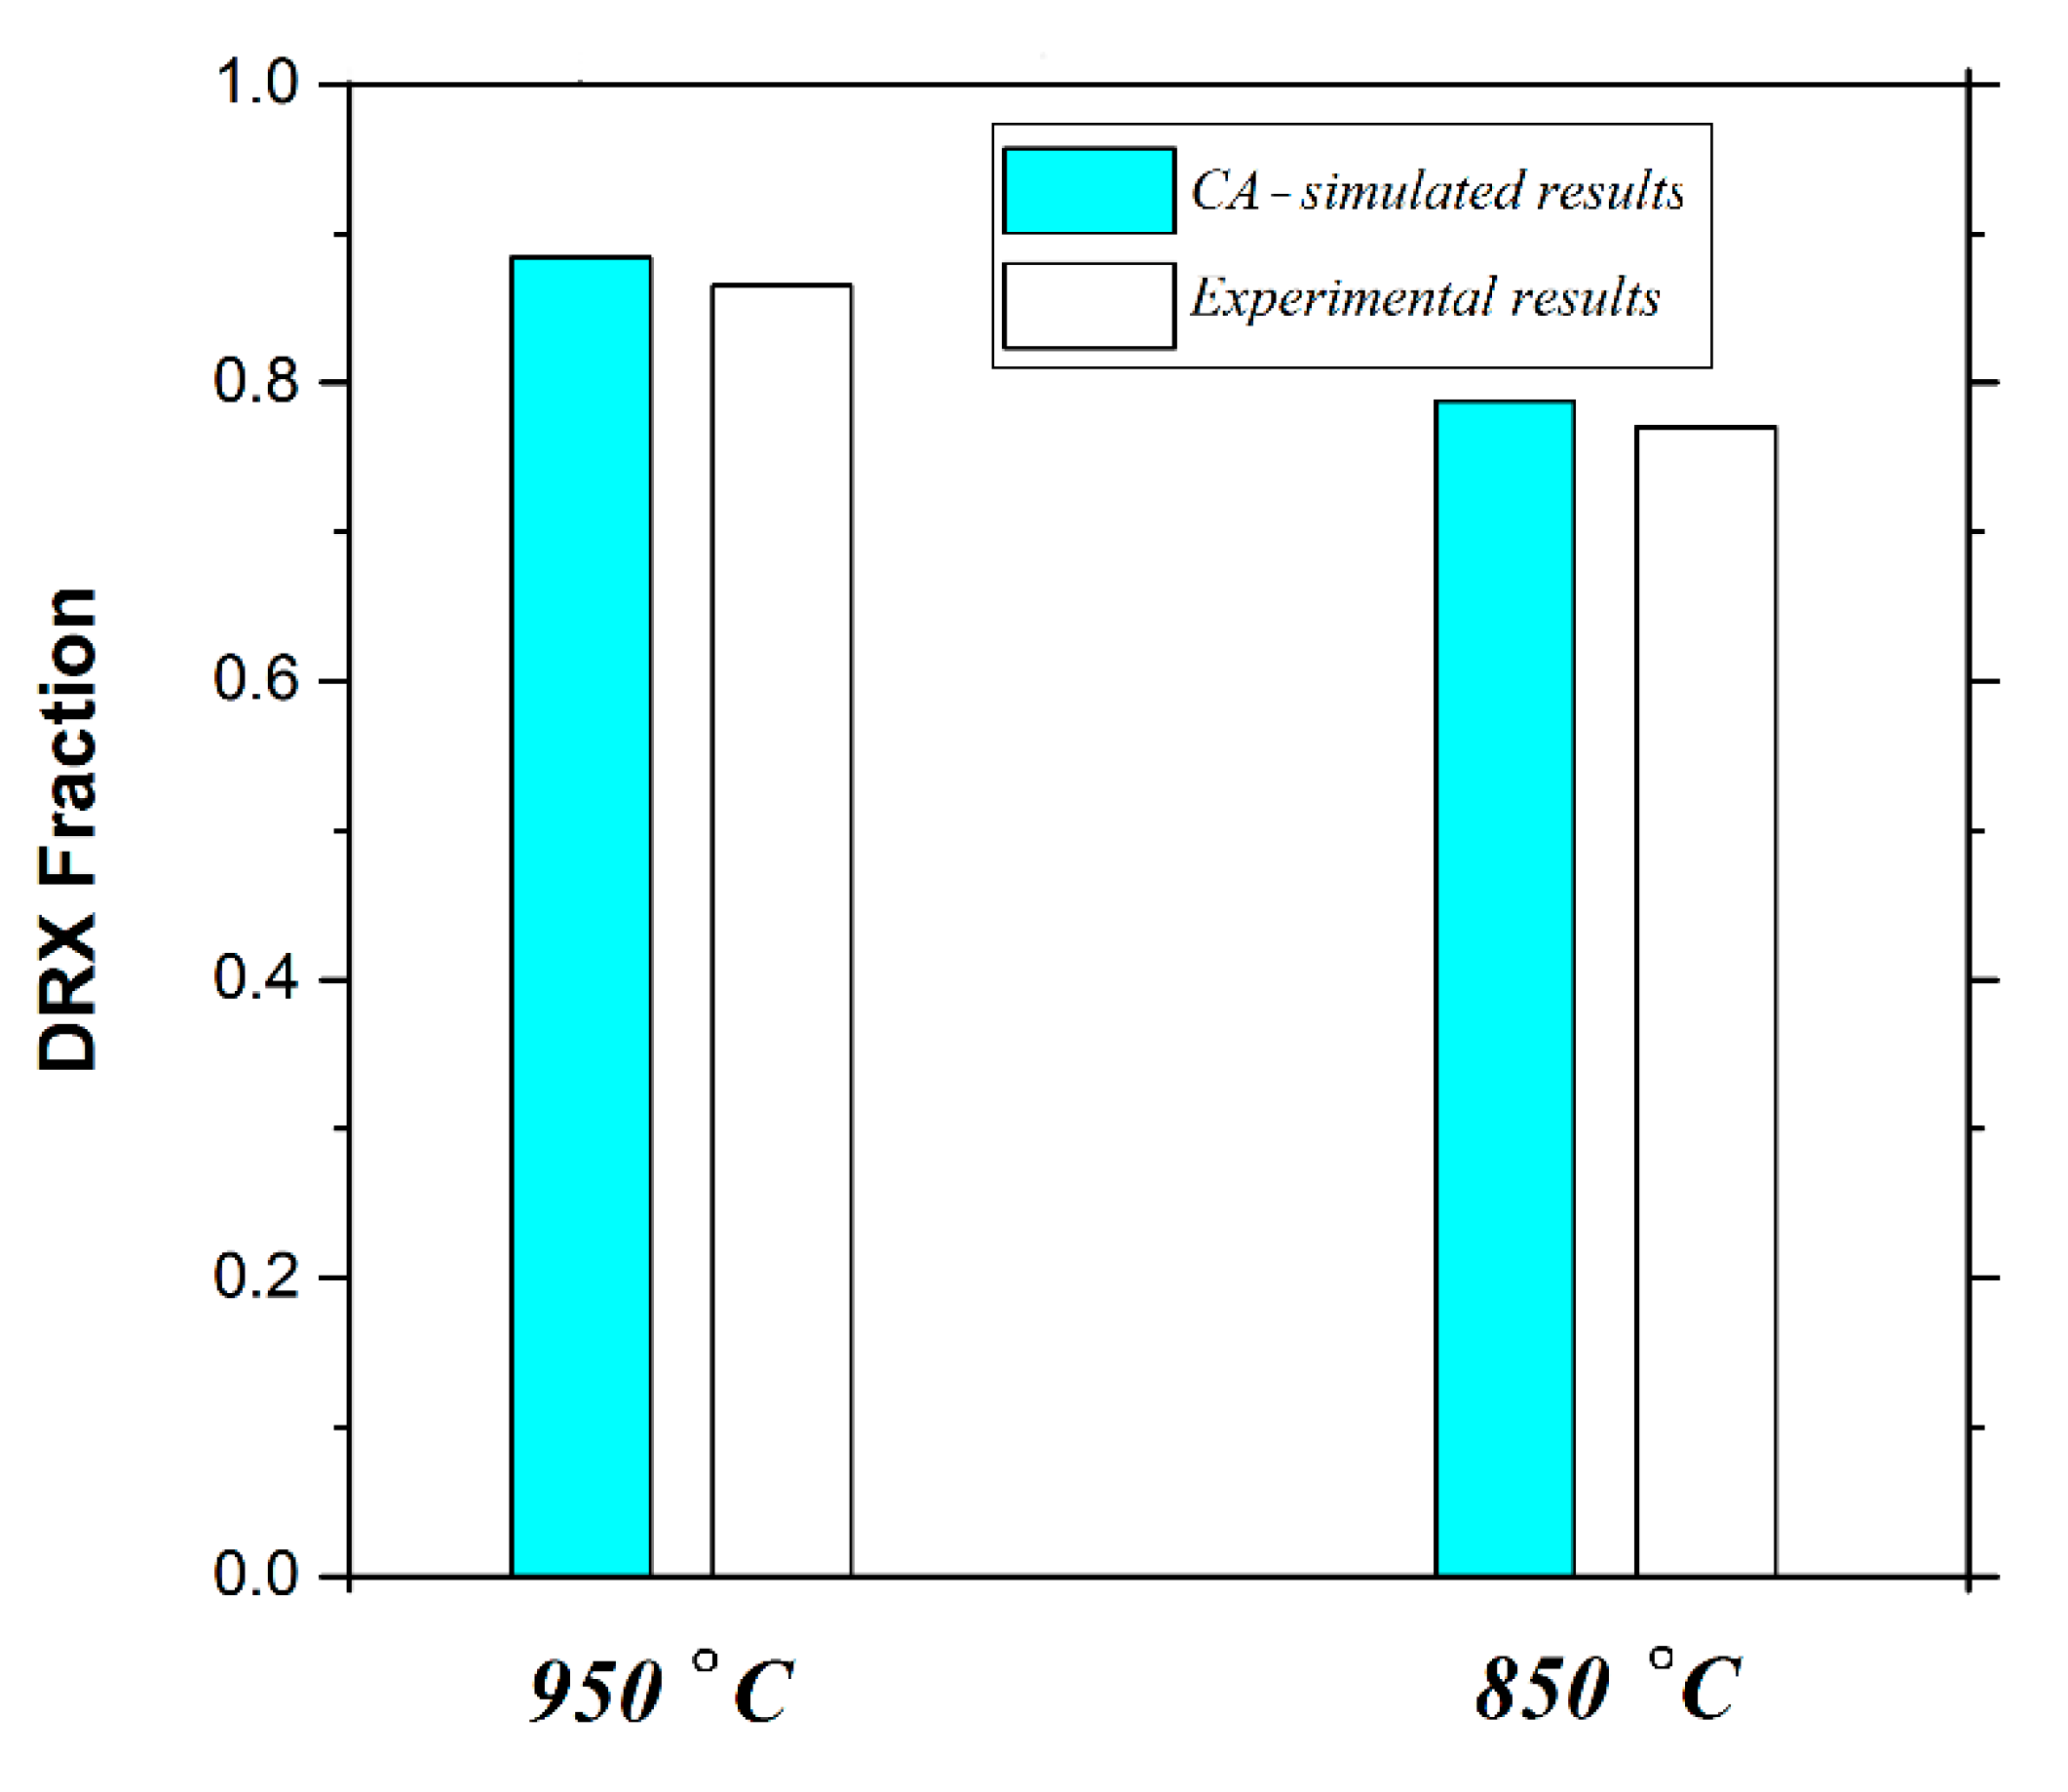
The fraction of recrystallized area (fDRX) extracted from the modeling and experimental results is exhibited in Figure 10. This figure shows the results of samples hot-compressed at the strain rate of 0.1 s‒1 and various deformation temperatures. In the case of simulated results, fDRX was obtained by using Equation (9). The results indicate that the proposed model can satisfactorily estimate the microstructure developments. The fraction of recrystallized parts changed from 77% to 87% along with increasing the temperature from 850 to 950 °C. This behavior is attributed to the rapid grain growth and the decreased critical dislocation density necessary for the recrystallization initiation at higher temperatures [38]. Because dislocations have higher mobility and the rate of the diffusion rises at higher temperatures, recrystallized grains can grow more efficiently at higher deformation temperatures. On the other hand, dislocations can more easily rearrange, so the critical strain for the recrystallization onset is lower at higher compression temperatures [31,68]. Consequently, the observed incubation period will be smaller at higher temperatures.
6. Conclusions
In this study, a model based on the CA method coupled with a phenomenological approach has been presented in order to model the microstructural developments during the hot plastic deformation of the TiNiFe alloys that were experiencing the CDRX phenomenon. The main findings are highlighted as follows:
- -
- The recrystallization was considered as a one-step reaction without any large-scale growth, which is the characteristic of the CDRX phenomenon.
- -
- The size of CDRX grains was determined by using the subgrains’ size, which was formulated based on the phenomenological approach.
- -
- Volume fractions of the recrystallized area were well estimated by utilizing the proposed model.
- -
- Flow stress curves of the TiNiFe alloy were accurately forecasted by the presented CA model.
Author Contributions
Conceptualization, M.A. and S.S.M.; Methodology, M.A., S.S.M. and A.G.; Software, M.A., S.S.M. and A.G.; Validation, M.A. and A.G.; Formal Analysis, M.A., S.S.M. and A.G.; Investigation, M.A., S.S.M., A.G. and A.M.H.; Resources, M.A.; Data Curation, M.A. and A.G.; Writing-Original Draft Preparation, M.A.; Writing-Review & Editing, M.A., S.S.M. and A.M.H.; Visualization, M.A. and A.G.; Supervision, S.S.M., A.G. and A.M.H.; Project Administration, M.A.; Funding Acquisition, A.M.H.
Acknowledgments
The publication of this article was funded by the Qatar National Library. Seyed Sajad Mirjavadi also appreciate the help from Fidar Project Qaem Company (FPQ).
Conflicts of Interest
The authors declare no conflict of interest. The funders had no role in the design of the study; in the collection, analyses, or interpretation of data; in the writing of the manuscript, and in the decision to publish the results.
Data Availability
The raw/processed data required to reproduce these findings cannot be shared at this time due to technical or time limitations.
Nomenclature
| Area of one cell | T | Temperature | |
| B | Burger’s vector | Tm | Melting point |
| C | A constant | Ix, Iy | Nominal deformation at two principal directions |
| Dsub | Subgrain size | The vector in the deformed position | |
| D | Average size of DRX grains | The vector in the undeformed position | |
| dε | Strain increment | Deformation matrix | |
| fDRX | DRX fraction | Dislocation interaction term | |
| K1 | A constant showing the effect of work hardening | 0 | Work hardening rate |
| K2 | A constant showing the effect of softening | Shear modulus | |
| Nucleation rate | Shear modulus at room temperature | ||
| Number of cells belonging to the given grain | Poisson’s ratio | ||
| NDRX | Total number of recrystallized cells | Dislocation density | |
| Ntotal | Total number of cells | Flow stress | |
| Q | Nucleation activation energy | Z | Zener–Hollomon parameter |
| R | Gas constant |
References
- Zhang, H.Y.; Zhang, S.H.; Li, Z.X.; Cheng, M. Hot die forging process optimization of superalloy IN718 turbine disc using processing map and finite element method. J. Eng. Manuf. 2010, 224, 103–110. [Google Scholar] [CrossRef]
- Raabe, D. Mesoscale simulation of recrystallization textures and microstructures. Adv. Eng. Mater. 2001, 3, 745–752. [Google Scholar] [CrossRef]
- Miodownik, M.A. A review of microstructural computer models used to simulate grain growth and recrystallisation in aluminium alloys. J. Light Met. 2002, 2, 125–135. [Google Scholar] [CrossRef]
- Cram, D.G.; Zurob, H.S.; Brechet, Y.J.M.; Hutchinson, C.R. Modelling discontinuous dynamic recrystallization using a physically based model for nucleation. Acta Mater. 2009, 57, 5218–5228. [Google Scholar] [CrossRef]
- Driver, J. The limitations of continuous dynamic recrystallization (CDRX) of aluminium alloys. Mater. Lett. 2018, 222, 135–137. [Google Scholar] [CrossRef]
- Zhang, Z.; Qu, S.; Feng, A.; Hu, X.; Shen, J. The Low Strain Rate Response of As-Cast Ti-6Al-4V Alloy with an Initial Coarse Lamellar Structure. Metals 2018, 8, 270. [Google Scholar] [CrossRef]
- Cram, D.G.; Fang, X.Y.; Zurob, H.S.; Bréchet, Y.J.M.; Hutchinson, C.R. The effect of solute on discontinuous dynamic recrystallization. Acta Mater. 2012, 60, 6390–6404. [Google Scholar] [CrossRef]
- Maire, L.; Fausty, J.; Bernacki, M.; Bozzolo, N.; Micheli, P.D.; Moussa, C. A new topological approach for the mean field modeling of dynamic recrystallization. Mater. Des. 2018, 146, 194–207. [Google Scholar] [CrossRef] [Green Version]
- Belyakov, A.; Tikhonova, M.; Dolzhenko, P.; Sakai, T.; Kaibyshev, R. On kinetics of grain refinement and strengthening by dynamic recrystallization. Adv. Eng. Mater. 2018. [Google Scholar] [CrossRef]
- Vondrous, A.; Bienger, P.; Schreijäg, S.; Selzer, M.; Schneider, D.; Nestler, B.; Helm, D.; Mönig, R. Combined crystal plasticity and phase-field method for recrystallization in a process chain of sheet metal production. Comput. Mech. 2015, 55, 439–452. [Google Scholar] [CrossRef]
- Takaki, T.; Yamanaka, A.; Tomita, Y. Phase-Field Modeling for Dynamic Recrystallization. In From Creep Damage Mechanics to Homogenization Methods; Altenbach, H., Matsuda, T., Okumura, D., Eds.; Springer: Basel, Switzerland, 2015; pp. 441–459. [Google Scholar]
- Hore, S.; Das, S.K.; Banerjee, S.; Mukherjee, S. Computational modelling of static recrystallization and two dimensional microstructure evolution during hot strip rolling of advanced high strength steel. J. Manuf. Process. 2015, 17, 78–87. [Google Scholar] [CrossRef]
- Madej, Ł.; Sitko, M. Parallelization of the Monte Carlo Static Recrystallization Model. In eScience on Distributed Computing Infrastructure; Bubak, M., Kitowski, J., Wiatr, K., Eds.; Springer: Basel, Switzerland, 2014; pp. 445–458. [Google Scholar]
- Fu, J.; Peng, B.; Xie, B.; Ye, Y. A modified monte-carlo potts model for dynamic recrystallization. Adv. Mater. Res. 2015, 1096, 280–287. [Google Scholar] [CrossRef]
- Fan, D.; Chen, L.Q. Computer simulation of grain growth using a continuum field model. Acta Mater. 1997, 45, 611–622. [Google Scholar] [CrossRef]
- Krill Iii, C.E.; Chen, L.Q. Computer simulation of 3-D grain growth using a phase-field model. Acta Mater. 2002, 50, 3059–3075. [Google Scholar] [CrossRef]
- Lusk, M.T. A phase–field paradigm for grain growth and recrystallization. Proc. Royal Soc. A 1999, 455, 677–700. [Google Scholar] [CrossRef]
- Piękoś, K.; Tarasiuk, J.; Wierzbanowski, K.; Bacroix, B. Generalized vertex model of recrystallization–Application to polycrystalline copper. Comput. Mater. Sci. 2008, 42, 584–594. [Google Scholar] [CrossRef]
- Mellbin, Y.; Hallberg, H.; Ristinmaa, M. Modeling of dynamic recrystallization at large deformations using a combined crystal plasticity and vertex model. In Proceedings of the 9th European Solid Mechanics Conference, Madrid, Spain, 6–10 July 2015. [Google Scholar]
- Reyes, L.A.; Páramo, P.; Zamarripa, A.S.; Garza, M.; Mata, M.P.G. Grain size modeling of a Ni-base superalloy using cellular automata algorithm. Mater. Des. 2015, 83, 301–307. [Google Scholar] [CrossRef]
- Zinoviev, A.; Zinovieva, O.; Ploshikhin, V.; Romanova, V.; Balokhonov, R. Evolution of grain structure during laser additive manufacturing. Simulation by a cellular automata method. Mater. Des. 2016, 106, 321–329. [Google Scholar] [CrossRef]
- Wang, L.; Fang, G.; Qian, L. Modeling of dynamic recrystallization of magnesium alloy using cellular automata considering initial topology of grains. Mater. Sci. Eng. 2018, 711, 268–283. [Google Scholar] [CrossRef]
- Timoshenkov, A.; Warczok, P.; Albu, M.; Klarner, J.; Kozeschnik, E.; Bureau, R.; Sommitsch, C. Modelling the dynamic recrystallization in C–Mn micro-alloyed steel during thermo-mechanical treatment using cellular automata. Comput. Mater. Sci. 2014, 94, 85–94. [Google Scholar] [CrossRef]
- Sommitsch, C.; Krumphals, A.; Candic, M.; Tian, B.; Stockinger, M. Modeling of grain growth in one and two phase materials by 2D cellular automata. J. Comput. Theor. Nanosci. 2012, 9, 1515–1524. [Google Scholar] [CrossRef]
- Lin, Y.C.; Liu, Y.X.; Chen, M.S.; Huang, M.H.; Ma, X.; Long, Z.L. Study of static recrystallization behavior in hot deformed Ni-based superalloy using cellular automaton model. Mater. Des. 2016, 99, 107–114. [Google Scholar] [CrossRef]
- Han, F.; Tang, B.; Kou, H.; Li, J.; Feng, Y. Cellular automata modeling of static recrystallization based on the curvature driven subgrain growth mechanism. J. Mater. Sci. 2013, 48, 7142–7152. [Google Scholar] [CrossRef]
- Sieradzki, L.; Madej, L. A perceptive comparison of the cellular automata and Monte Carlo techniques in application to static recrystallization modeling in polycrystalline materials. Comput. Mater. Sci. 2013, 67, 156–173. [Google Scholar] [CrossRef]
- Han, F.; Tang, B.; Kou, H.; Cheng, L.; Li, J.; Feng, Y. Static recrystallization simulations by coupling cellular automata and crystal plasticity finite element method using a physically based model for nucleation. J. Mater. Sci. 2014, 49, 3253–3267. [Google Scholar] [CrossRef]
- Jin, Z.; Cui, Z. Investigation on dynamic recrystallization using a modified cellular automaton. Comput. Mater. Sci. 2012, 63, 249–255. [Google Scholar] [CrossRef]
- Xiao, N.; Zheng, C.; Li, D.; Li, Y. A simulation of dynamic recrystallization by coupling a cellular automaton method with a topology deformation technique. Comput. Mater. Sci. 2008, 41, 366–374. [Google Scholar] [CrossRef]
- Chen, F.; Qi, K.; Cui, Z.; Lai, X. Modeling the dynamic recrystallization in austenitic stainless steel using cellular automaton method. Comput. Mater. Sci. 2014, 83, 331–340. [Google Scholar] [CrossRef]
- Azarbarmas, M.; Aghaie-Khafri, M. Dynamic recrystallization and texture modeling of IN718 superalloy. Model. Simul. Mater. Sci. Eng. 2017, 25, 075001. [Google Scholar] [CrossRef]
- Jin, Z.Y.; Juan, L.; Cui, Z.S.; Wei, D.L. Identification of nucleation parameter for cellular automaton model of dynamic recrystallization. Trans. Nonferrous Met. Soc. 2010, 20, 458–464. [Google Scholar] [CrossRef]
- Ji, H.P.; Zhang, L.G.; Liu, J.; Wang, T.Y. Cellular automaton modeling of dynamic recrystallisation microstructure evolution for 316LN stainless steel. Key Eng. Mater. 2016, 693, 548–553. [Google Scholar] [CrossRef]
- Zhang, T.; Lu, S.; Wu, Y.; Hai, G. Optimization of deformation parameters of dynamic recrystallization for 7055 aluminum alloy by cellular automaton. Trans. Nonferrous Met. Soc. 2017, 27, 1327–1337. [Google Scholar] [CrossRef]
- Li, J.; Xie, Z.; Li, S.; Zang, Y. Modeling on dynamic recrystallization of aluminium alloy 7050 during hot compression based on cellular automaton. J. Cent. South Univ. 2016, 23, 497–507. [Google Scholar] [CrossRef]
- Azarbarmas, M.; Aghaie-Khafri, M. A new cellular automaton method coupled with a rate-dependent (CARD) model for predicting dynamic recrystallization behavior. Metall. Mater. Trans. 2018, 49. [Google Scholar] [CrossRef]
- Azarbarmas, M.; Aghaie-Khafri, M.; Cabrera, J.M.; Calvo, J. Dynamic recrystallization mechanisms and twining evolution during hot deformation of Inconel 718. Mater. Sci. Eng. 2016, 678, 137–152. [Google Scholar] [CrossRef]
- Azarbarmas, M.; Aghaie-Khafri, M.; Cabrera, J.M.; Calvo, J. Microstructural evolution and constitutive equations of Inconel 718 alloy under quasi-static and quasi-dynamic conditions. Mater. Des. 2016, 94, 28–38. [Google Scholar] [CrossRef] [Green Version]
- Vorhauer, A.; Pippan, R. On the onset of a steady state in body-centered cubic iron during severe plastic deformation at low homologous temperatures. Metall. Mater. Trans. 2008, 39, 417–429. [Google Scholar] [CrossRef]
- Kaibyshev, R.; Shipilova, K.; Musin, F.; Motohashi, Y. Continuous dynamic recrystallization in an Al–Li–Mg–Sc alloy during equal-channel angular extrusion. Mater. Sci. Eng. 2005, 396, 341–351. [Google Scholar] [CrossRef]
- Mishnev, R.; Shakhova, I.; Kaibyshev, R. Microstructure evolution in a Cu-Cr-Zr alloy during warm intense plastic straining. In Proceedings of the 6th International Conference on Nanomaterials by Severe Plastic Deformation, Metz, France, 30 June–4 July 2014; pp. 1–7. [Google Scholar]
- Shojaeefard, M.H.; Akbari, M.; Khalkhali, A.; Asadi, P.; Parivar, A.H. Optimization of microstructural and mechanical properties of friction stir welding using the cellular automaton and Taguchi method. Mater. Des. 2014, 64, 660–666. [Google Scholar] [CrossRef]
- Mecking, H.; Kocks, U.F. Kinetics of flow and strain-hardening. Acta Metall. 1981, 29, 1865–1875. [Google Scholar] [CrossRef]
- Liu, X.; Li, L.X.; He, F.Y.; Zhou, J.; Zhu, B.W.; Zhang, L.Q. Simulation on dynamic recrystallization behavior of AZ31 magnesium alloy using cellular automaton method coupling Laasraoui–Jonas model. Trans. Nonferrous Met. Soc. 2013, 23, 2692–2699. [Google Scholar] [CrossRef]
- Chen, F.; Cui, Z.S.; Chen, J. Prediction of microstructural evolution during hot forging. Manuf. Rev. 2014, 1, 1–21. [Google Scholar] [CrossRef]
- Ma, X.; Zheng, C.W.; Zhang, X.G.; Li, D.Z. Microstructural depictions of austenite dynamic recrystallization in a low-carbon steel: A cellular automaton model. Acta Metall. Sin. 2016, 29, 1127–1135. [Google Scholar] [CrossRef]
- Chen, F.; Cui, Z.; Liu, J.; Chen, W.; Chen, S. Mesoscale simulation of the high-temperature austenitizing and dynamic recrystallization by coupling a cellular automaton with a topology deformation technique. Mater. Sci. Eng. 2010, 527, 5539–5549. [Google Scholar] [CrossRef]
- Sachs, G.Z. The plastic deformation mode of polycrystals. Z. Verein Deut. Ing. 1928, 72, 734. [Google Scholar]
- Taylor, G. Plastic strain in metals. J. Inst. Met. 1938, 62, 307–324. [Google Scholar]
- Yin, X.Q.; Park, C.H.; Li, Y.F.; Ye, W.J.; Zuo, Y.T.; Lee, S.W.; Yeom, J.T.; Mi, X.J. Mechanism of continuous dynamic recrystallization in a 50Ti-47Ni-3Fe shape memory alloy during hot compressive deformation. J. Alloys Compd. 2017, 693, 426–431. [Google Scholar] [CrossRef]
- Yin, X.Q.; Wang, S.J.; Li, Y.F.; Gao, B.D.; Kang, X.Y.; Mi, X.J. Hot deformation behavior of TiNiFe shape memory alloy: A study with processing map. Adv. Mater. Res. 2013, 631, 371–376. [Google Scholar] [CrossRef]
- Petrov, P.; Abbod, M. Analysis of rheological behavior of AL-CU-MG-FE-NI alloy at elevated temperatures using phenomenological flow stress model. Int. J. Mater. Form. 2009, 2, 371. [Google Scholar] [CrossRef]
- Svyetlichnyy, D.S.; Muszka, K.; Majta, J. Three-dimensional frontal cellular automata modeling of the grain refinement during severe plastic deformation of microalloyed steel. Comput. Mater. Sci. 2015, 102, 159–166. [Google Scholar] [CrossRef]
- Zhang, Y.; Sun, H.L.; Volinsky, A.A.; Tian, B.H.; Chai, Z.; Liu, P.; Liu, Y. Hot deformation and dynamic recrystallization behavior of the Cu-Cr-Zr-Y alloy. J. Mater. Eng. Perform. 2016, 25, 1150–1156. [Google Scholar] [CrossRef]
- Huang, L.J.; Qi, F.; Hua, P.T.; Yu, L.X.; Liu, F.; Sun, W.R.; Hu, Z.Q. Discontinuous dynamic recrystallization of inconel 718 superalloy during the superplastic deformation. Metall. Mater. Trans. 2015, 46, 4276–4285. [Google Scholar] [CrossRef]
- Wang, Y.; Shao, W.Z.; Zhen, L.; Zhang, X.M. Microstructure evolution during dynamic recrystallization of hot deformed superalloy 718. Mater. Sci. Eng. 2008, 486, 321–332. [Google Scholar] [CrossRef]
- Chuan, W.; He, Y.; Wei, L.H. Modeling of discontinuous dynamic recrystallization of a near-α titanium alloy imi834 during isothermal hot compression by combining a cellular automaton model with a crystal plasticity finite element method. Comput. Mater. Sci. 2013, 79, 944–959. [Google Scholar] [CrossRef]
- Beygelzimer, Y.E.; Spuskanyuk, A.V. The thick yield surface: Idea and approach for investigating its structure. Philos. Mag. 1999, 79, 2437–2459. [Google Scholar] [CrossRef]
- Kotamala, S. Prestressing of Simply Supported Concrete Beam with Nitinol Shape Memory Alloy; University of Toledo: Toledo, OH, USA, 2004. [Google Scholar]
- Jaeger, J.D.; Solas, D.; Fandeur, O.; Schmitt, J.H.; Rey, C. 3D numerical modeling of dynamic recrystallization under hot working: Application to Inconel 718. Mater. Sci. Eng. 2015, 646, 33–44. [Google Scholar] [CrossRef]
- Churakova, A.; Gunderov, D. Increase in the dislocation density and yield stress of the Ti50Ni50 alloy caused by thermal cycling. Mater. Today Proc. 2017, 4, 4732–4736. [Google Scholar] [CrossRef]
- Wang, S.; Mi, X.; Yin, X.; Li, Y. Deformation behavior of TiNiFe alloy in isothermal compression. Rare Met. 2012, 31, 323–327. [Google Scholar] [CrossRef]
- Ding, R.; Guo, Z.X. Microstructural modelling of dynamic recrystallisation using an extended cellular automaton approach. Comput. Mater. Sci. 2002, 23, 209–218. [Google Scholar] [CrossRef]
- Liu, Y.G.; Li, M.Q.; Luo, J. The modelling of dynamic recrystallization in the isothermal compression of 300M steel. Mater. Sci. Eng. 2013, 574, 1–8. [Google Scholar] [CrossRef]
- Chen, D.D.; Lin, Y.C.; Zhou, Y.; Chen, M.S.; Wen, D.X. Dislocation substructures evolution and an adaptive-network-based fuzzy inference system model for constitutive behavior of a Ni-based superalloy during hot deformation. J. Alloys Compd. 2017, 708, 938–946. [Google Scholar] [CrossRef]
- Mirzadeh, H.; Cabrera, J.M.; Najafizadeh, A. Modeling and prediction of hot deformation flow curves. Metall. Mater. Trans. 2012, 43, 108–123. [Google Scholar] [CrossRef]
- Lin, Y.C.; He, D.G.; Chen, M.S.; Chen, X.M.; Zhao, C.Y.; Ma, X.; Long, Z.L. EBSD analysis of evolution of dynamic recrystallization grains and δ phase in a nickel-based superalloy during hot compressive deformation. Mater. Des. 2016, 97, 13–24. [Google Scholar] [CrossRef]
Figure 1.
The schematic presentation of the continuous dynamic recrystallization (CDRX) phenomenon steps.
Figure 1.
The schematic presentation of the continuous dynamic recrystallization (CDRX) phenomenon steps.
Figure 2.
Various definitions of the neighborhood in the Cellular Automaton (CA) modeling: (a) the Von Neumann neighborhood, (b) the Moore neighborhood and (c) the corrected Moore neighborhood which was utilized in the present work.
Figure 2.
Various definitions of the neighborhood in the Cellular Automaton (CA) modeling: (a) the Von Neumann neighborhood, (b) the Moore neighborhood and (c) the corrected Moore neighborhood which was utilized in the present work.
Figure 3.
The algorithm used for CA modeling of the CDRX phenomenon.
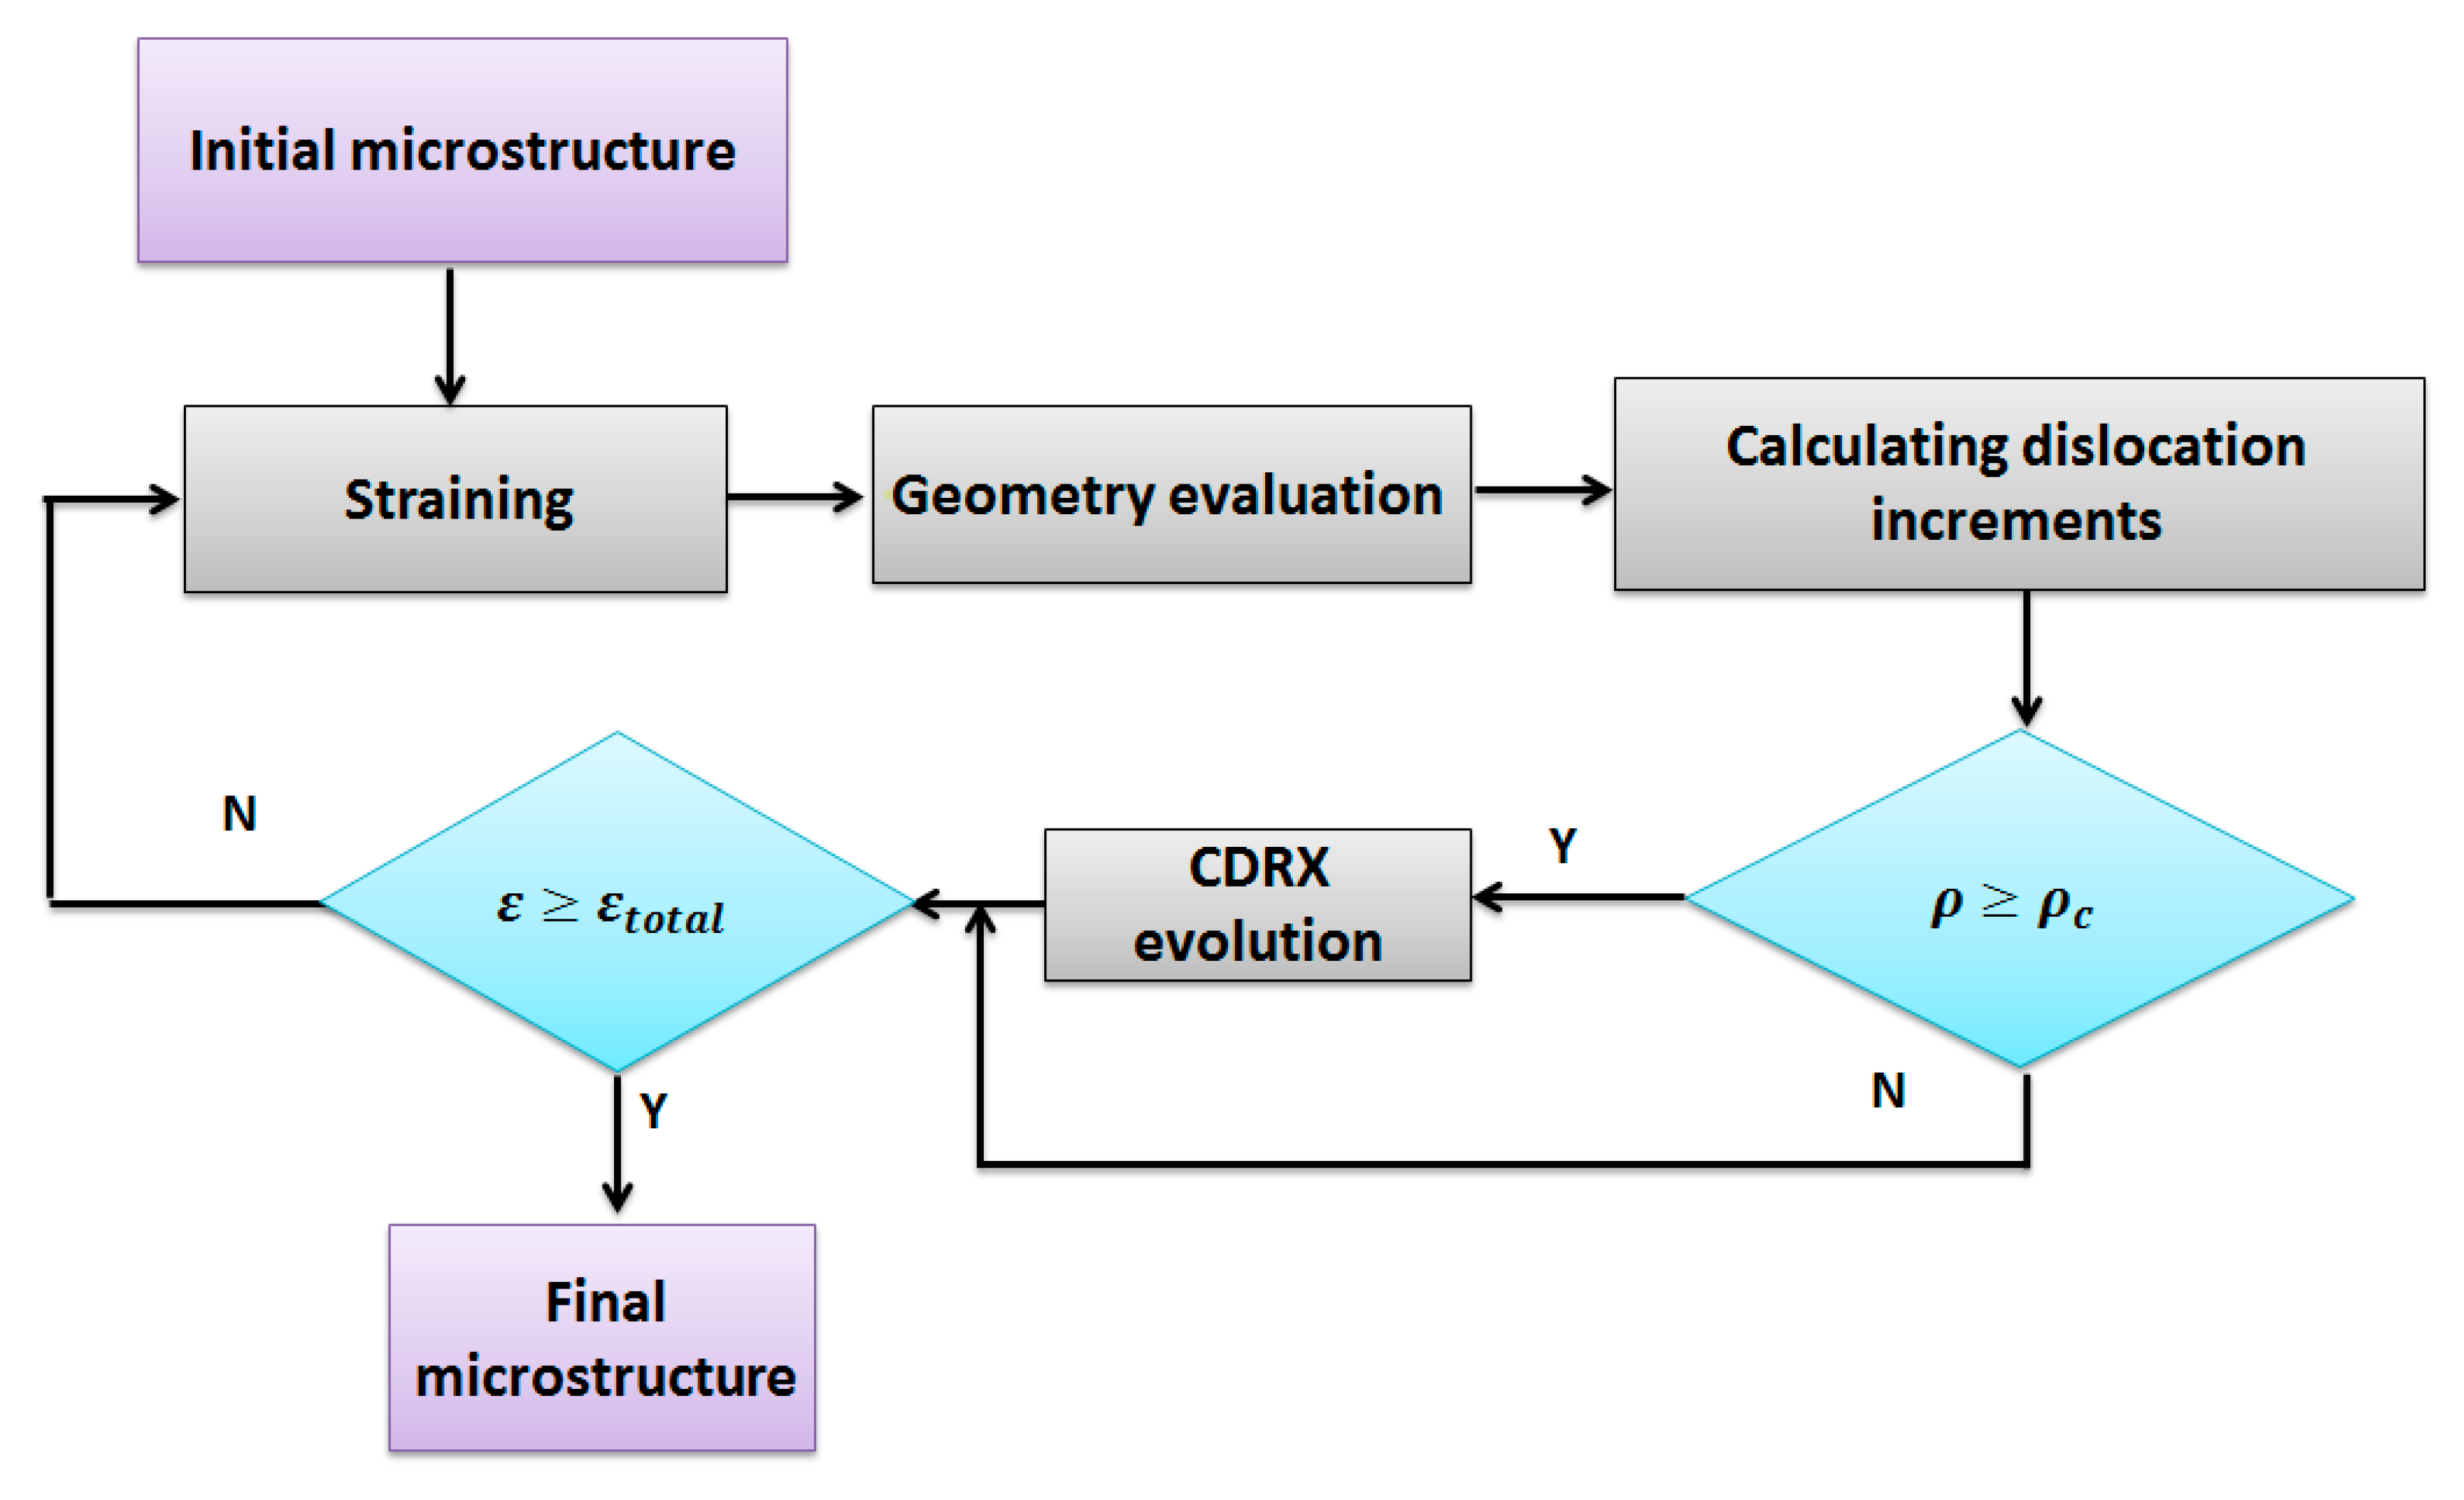
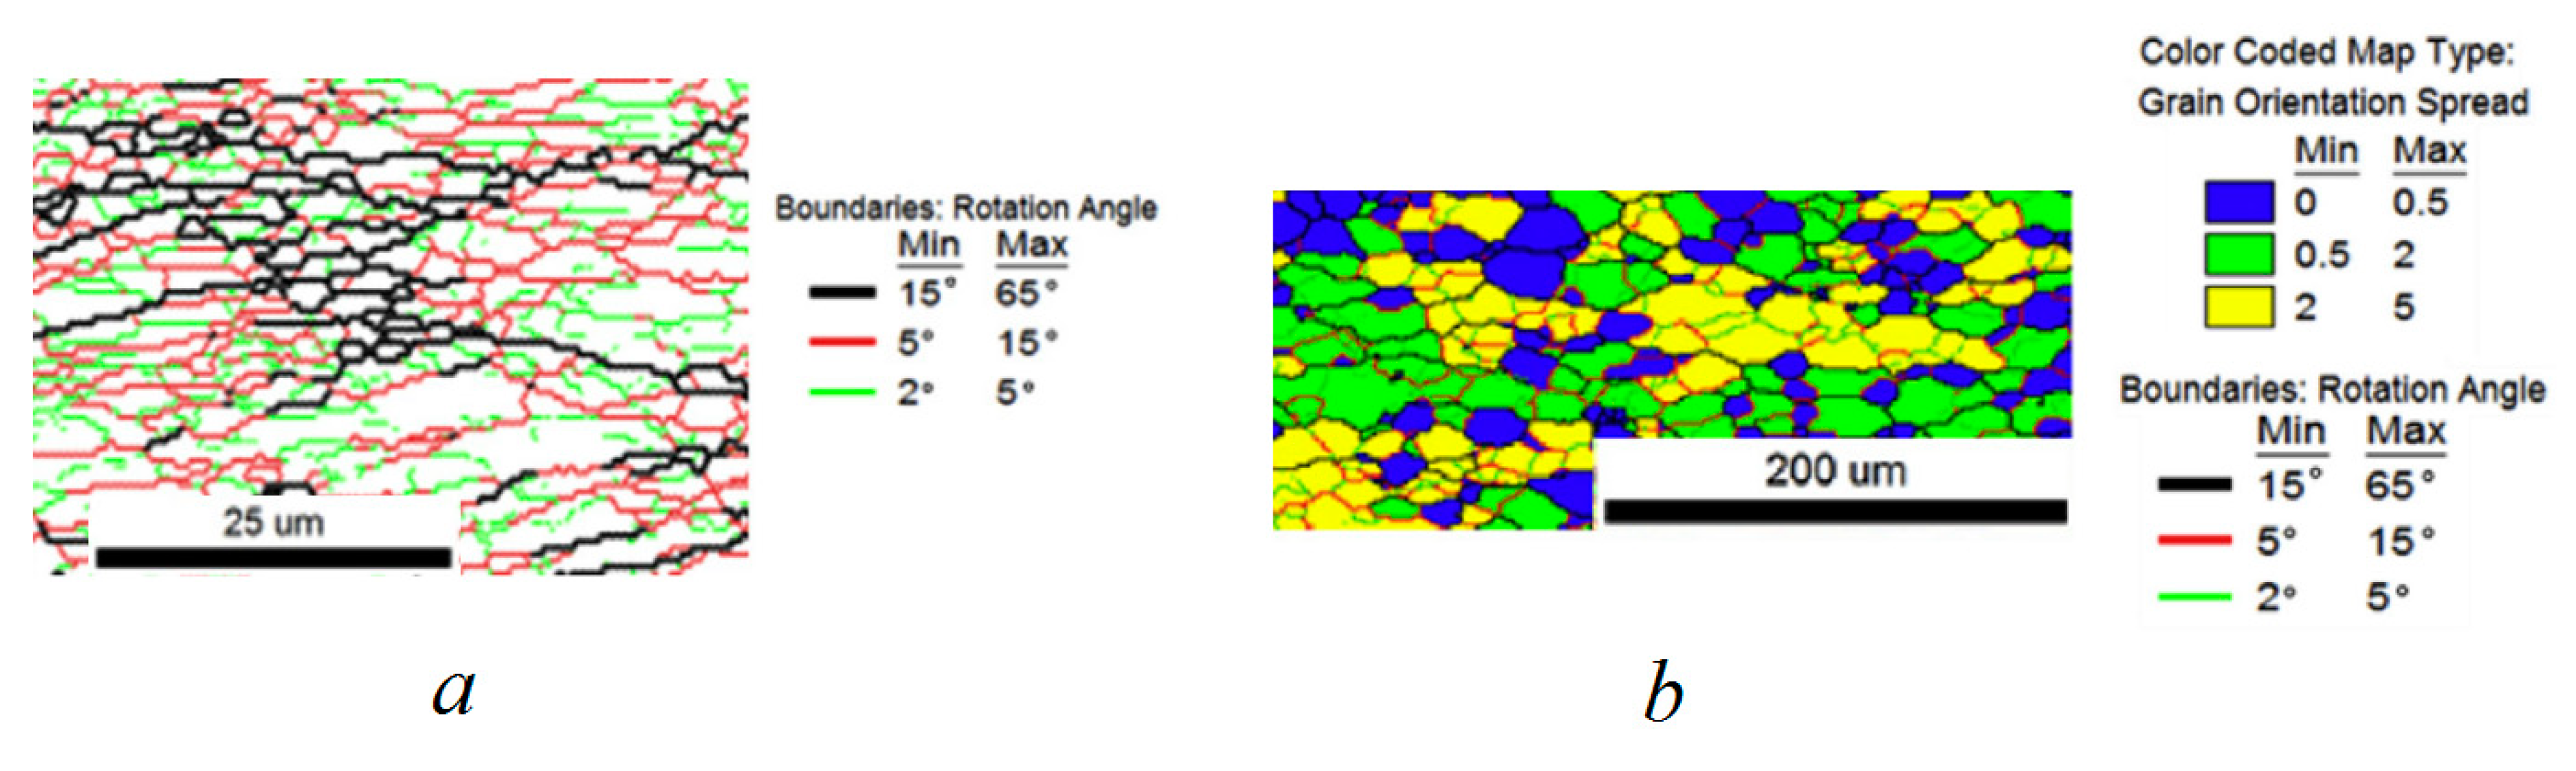
Figure 4.
Orientation Imaging Microscopy (OIM) images of TiNiFe samples hot-compressed at condition of (a) 750 °C–10 s‒1 and (b) 950 °C–0.1 s‒1, adapted from [51], with permission from Elsevier, 2017.
Figure 4.
Orientation Imaging Microscopy (OIM) images of TiNiFe samples hot-compressed at condition of (a) 750 °C–10 s‒1 and (b) 950 °C–0.1 s‒1, adapted from [51], with permission from Elsevier, 2017.
Figure 5.
The plot of CDRX grain size (Dsub) resulting from the subgrains of the TiNiFe alloy as a function of Zener–Hollomon parameter (Z); showing the linear relationship between ln Dsub and ln Z.
Figure 5.
The plot of CDRX grain size (Dsub) resulting from the subgrains of the TiNiFe alloy as a function of Zener–Hollomon parameter (Z); showing the linear relationship between ln Dsub and ln Z.
Figure 6.
Microstructures of the TiNiFe alloy before the hot compression obtained from (a) the EBSD map, adapted from [51], with permission from Elsevier, 2017 and (b) CA modeling.
Figure 6.
Microstructures of the TiNiFe alloy before the hot compression obtained from (a) the EBSD map, adapted from [51], with permission from Elsevier, 2017 and (b) CA modeling.
Figure 7.
The predicted microstructures of samples hot-compressed at 0.1 s‒1–850 °C to strains of (a) 0, (b) 0.2, (c) 0.4, (d) 0.6 and (e) 0.8.
Figure 7.
The predicted microstructures of samples hot-compressed at 0.1 s‒1–850 °C to strains of (a) 0, (b) 0.2, (c) 0.4, (d) 0.6 and (e) 0.8.
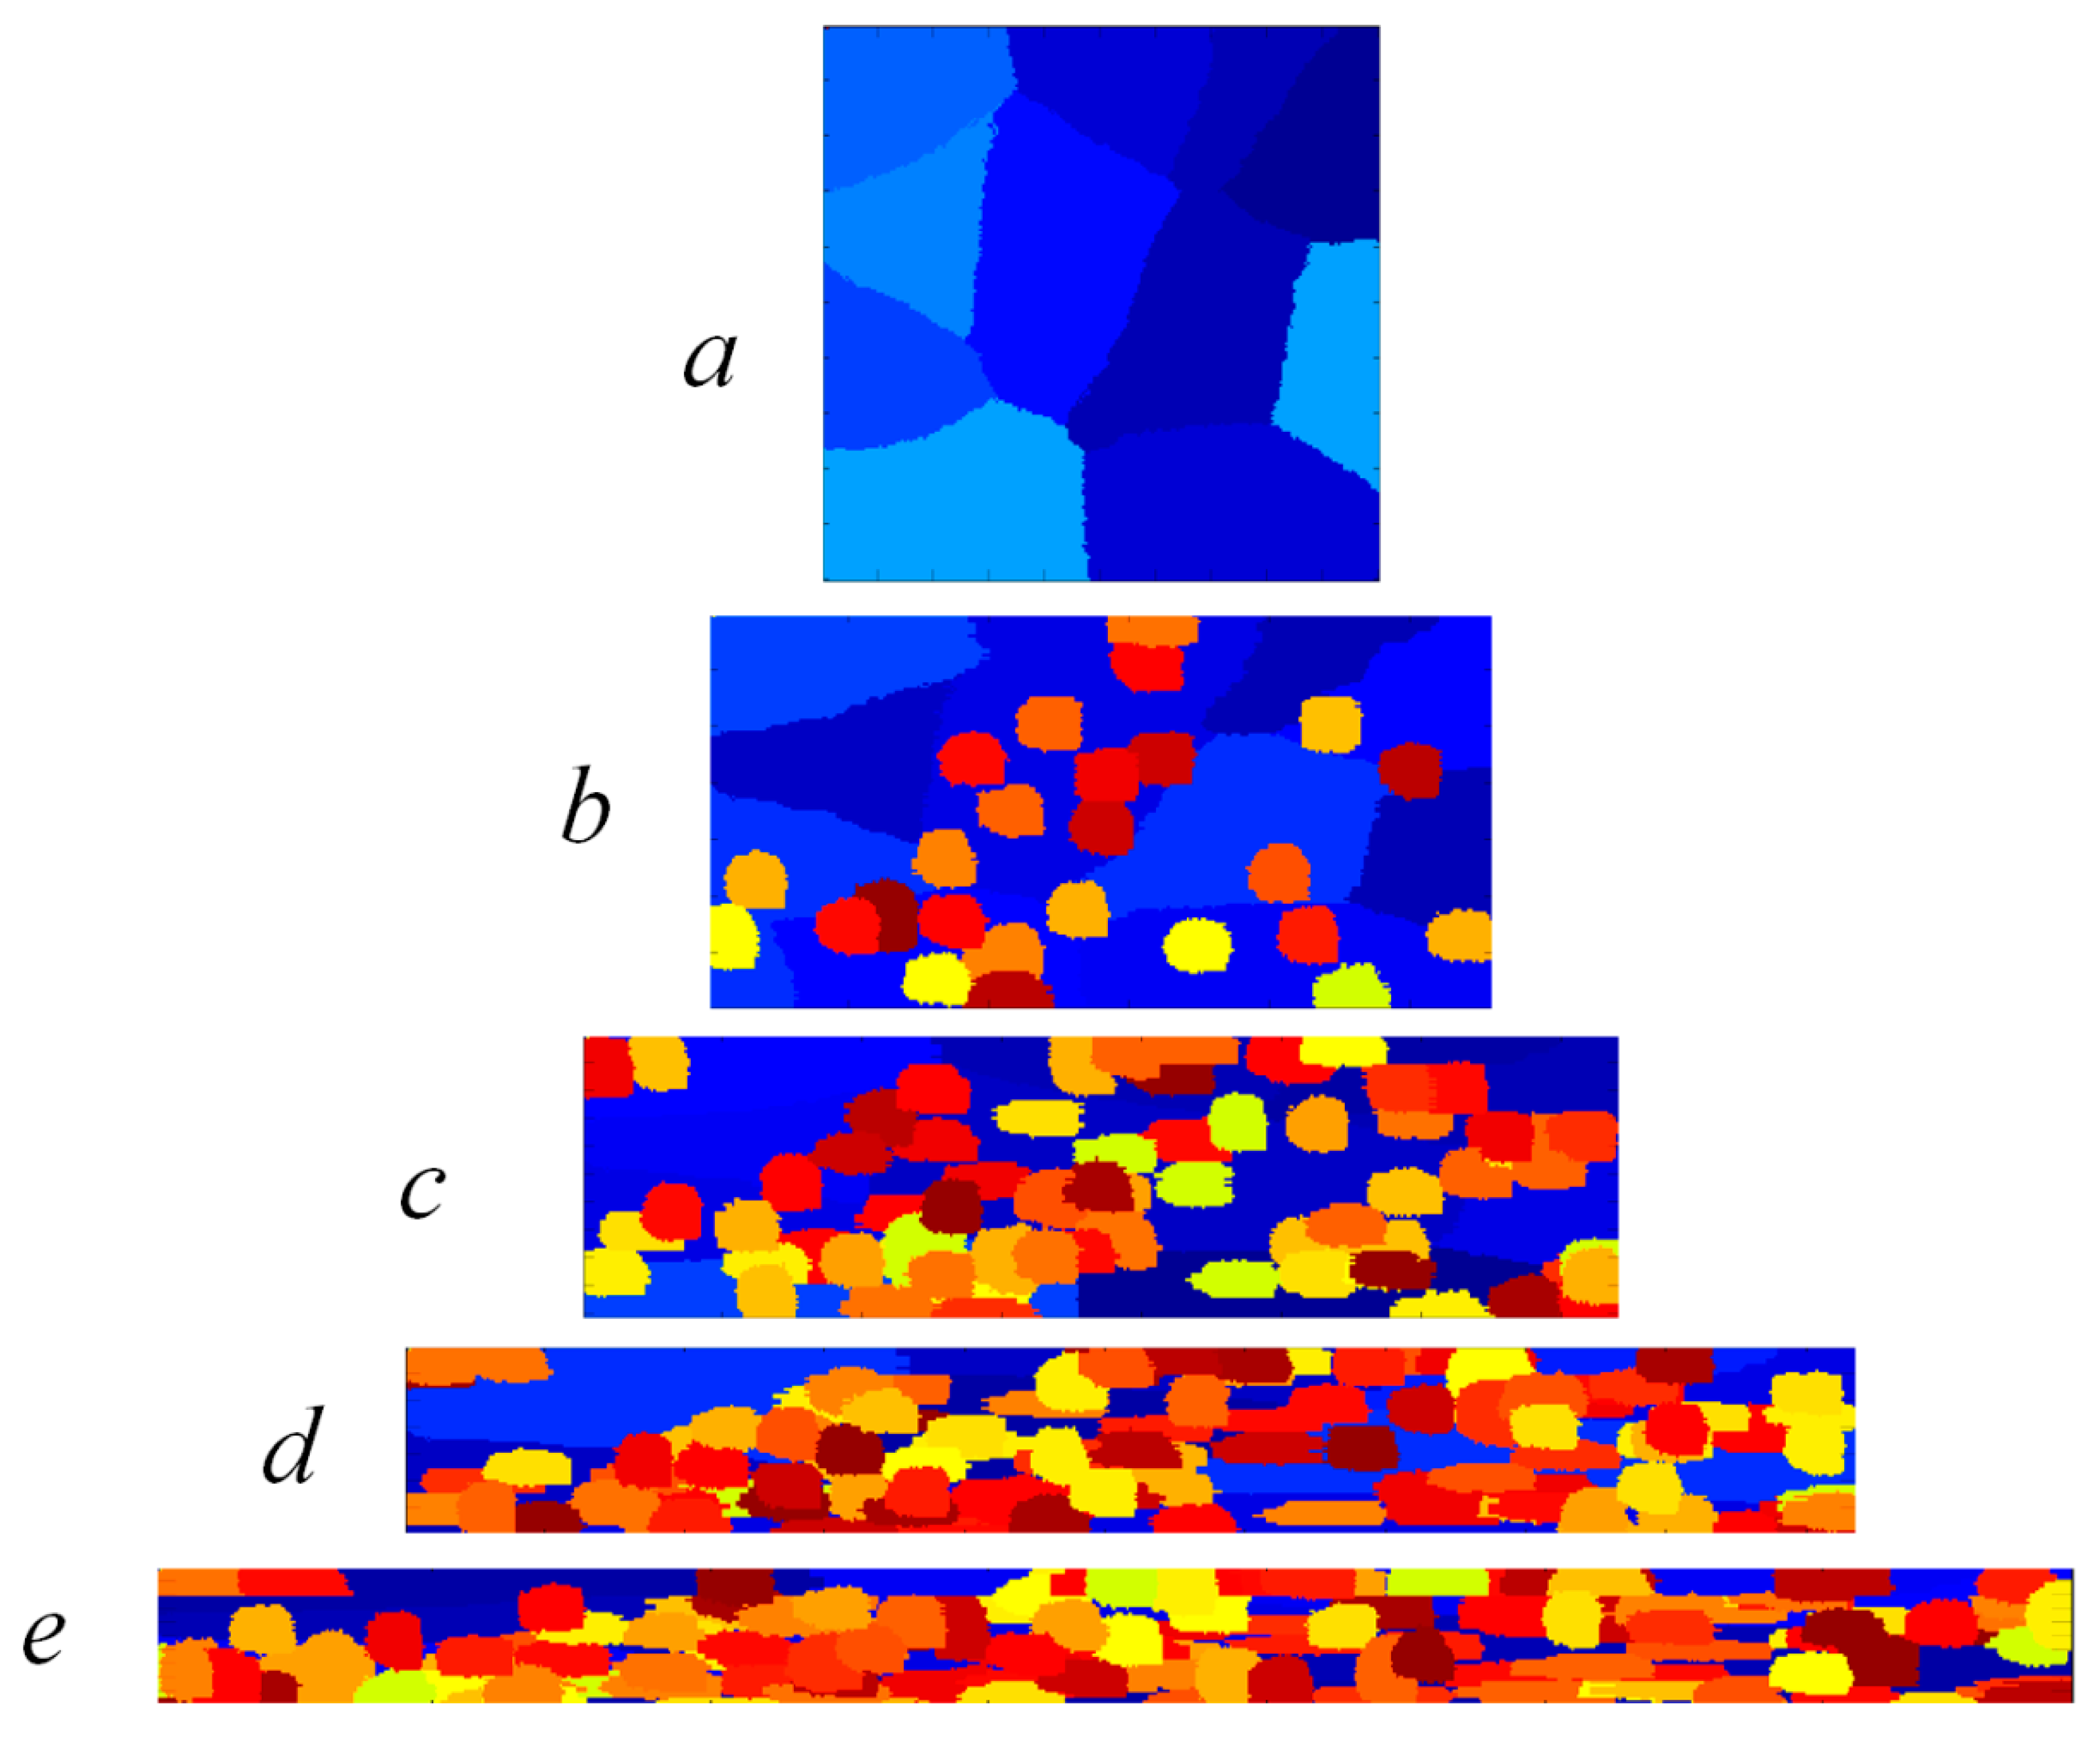
Figure 8.
The fraction of recrystallized area as a function of the deformation time.
Figure 9.
The CA-based modeling results of flow stresses compared with the experimental data of the TiNiFe alloy.
Figure 9.
The CA-based modeling results of flow stresses compared with the experimental data of the TiNiFe alloy.
Figure 10.
Histograms comparing the predicted and experimental fraction of recrystallized area as a function of the deformation temperature.
Figure 10.
Histograms comparing the predicted and experimental fraction of recrystallized area as a function of the deformation temperature.

Table 1.
Input parameters used in the proposed model.
| Parameter | Value |
|---|---|
| Melting point (Tm) | 1275 °C [60] |
| Density of initial dislocations | 1013 m‒2 [61] |
| Room temperature shear modulus (μ0) | 2.15 × 10¹⁰ Pa [62] |
| Activation energy of nucleation (Q) | 429 kJ/mol [63] |
| Poisson’s ratio (ν) | 0.34 [61] |
| Burger’s vector (b) | 2.86 × 10‒10 m [64] |
© 2018 by the authors. Licensee MDPI, Basel, Switzerland. This article is an open access article distributed under the terms and conditions of the Creative Commons Attribution (CC BY) license (http://creativecommons.org/licenses/by/4.0/).
Share and Cite
MDPI and ACS Style
Azarbarmas, M.; Mirjavadi, S.S.; Ghasemi, A.; Hamouda, A.M. A Combined Method to Model Dynamic Recrystallization Based on Cellular Automaton and a Phenomenological (CAP) Approach. Metals 2018, 8, 923. https://doi.org/10.3390/met8110923
AMA Style
Azarbarmas M, Mirjavadi SS, Ghasemi A, Hamouda AM. A Combined Method to Model Dynamic Recrystallization Based on Cellular Automaton and a Phenomenological (CAP) Approach. Metals. 2018; 8(11):923. https://doi.org/10.3390/met8110923
Chicago/Turabian StyleAzarbarmas, Morteza, Seyed Sajad Mirjavadi, Ali Ghasemi, and Abdel Magid Hamouda. 2018. "A Combined Method to Model Dynamic Recrystallization Based on Cellular Automaton and a Phenomenological (CAP) Approach" Metals 8, no. 11: 923. https://doi.org/10.3390/met8110923
Note that from the first issue of 2016, this journal uses article numbers instead of page numbers. See further details here.