Article

Microstructural and Mechanical Characterization of the Transition Zone of 9%Ni Steel Cladded with Ni-Based Superalloy 625 by GTAW-HW

by
Francisco Werley Cipriano Farias
*,
João da Cruz Payão Filho
and
Luiz Maurício Barreto de Azevedo
Department of Metallurgical and Materials Engineering, Universidade Federal do Rio de Janeiro COPPE/UFRJ, Cx. Postal 68505, CEP 21941-972, Rio de Janeiro, RJ, Brazil
*
Author to whom correspondence should be addressed.
Metals 2018, 8(12), 1007; https://doi.org/10.3390/met8121007
Submission received: 7 November 2018 / Revised: 21 November 2018 / Accepted: 27 November 2018 / Published: 1 December 2018

Abstract

:
9%Ni steel was recently used for the first time in the field of injection unit (IU) for the injection of CO2 into oil wells. Because such steels are operated in H2S medium and are susceptible to sulfide stress cracking, their pipes are cladded with Ni-based superalloy 625 by using gas tungsten arc welding with a hot wire to prevent this phenomenon from occurring. The transition zone of substrate/clad can have high hardness and low toughness, and promote failure of the component during service; therefore, it is very important to know its characteristics. In this work, this transition zone was analyzed through optical and scanning electron microscopy with energy dispersive X-ray spectrometry and electron backscatter diffraction, as well as Vickers microhardness, shear and bend tests. Metallographic analysis identified type I and II boundaries with distinct chemical gradients, MC-type carbides, Laves/γ eutectics, peninsulas macrosegregation, crystallographic texture close to <100> in the clads, residual strain, and drop of microhardness across the transition zone. The clads were approved in the shear and bend tests. This work proposes a new type II boundary formation mechanism in dissimilar welds of steels that do not exhibit the allotropic transformation δγ during the welding thermal cycle and do not experience a change in the solidification mode.

1. Introduction

The exploration of oil and gas in the Brazilian pre-salt presents a great technological challenge because of the unique operating conditions. The great sea depths (1000 m to 2000 m) and the distances between the reservoirs and the seabed (4000 m to 6000 m) require the manufacture of risers up to 8000 m in length that can withstand pressures of about 550 bar. The oil produced in floating production storage and offloading (FPSO) contains high amounts of water, CO2, and contaminants (H2S, among other fluids) [1]. CO2 is separated from other fluids and injected into the well to reduce the viscosity of the oil and maintain the well pressure (to gain productivity) [2]. Moreover, the CO2 injection prevents its emission to the atmosphere, thereby contributing to a reduction in the greenhouse effect [3].
9%Ni steel (ASTM A333 Gr. 8) had only been used in the oil and gas industry once before the 2010s [4]. The use of this alloy in the late 1940s in the extraction of oil from the Gulf of Mexico was catastrophic, because it failed after only 6 days of service. The cause of the failure was sulfide stress cracking (SSC), a phenomenon that was not known to the scientific community at that time. Years later, the National Association of Corrosion Engineers would develop and standardize methods to evaluate this type of cracking [5]. The authors do not know another use of the 9%Ni steel in the oil and gas industry prior to the 2010s.
Until the last decade, oil companies worldwide used only high-strength low-alloy (HSLA) steels to inject CO2 into oil and gas wells. Owing to the very high pressure of the pre-salt wells in Brazil, the pipes used in the CO2 injection unit (CO2-IU) must have high mechanical strengths as well as fracture toughness at cryogenic temperatures, since an operational mistake can abruptly depressurize and reduce its temperature to 183 K. Until 2010, 9%Ni steel was used almost exclusively in the transportation and storage of cryogenic gases globally owing to its high mechanical strength and toughness at 90 K [6,7]; this material was recently considered for employment in the oil and gas industry. In the early 2010s, Shell and Petrobras (the Brazilian oil and gas state-owned enterprise) used 9%Ni steel in the CO2-IUs of their FPSOs for the first time on a global scale. As this alloy is susceptible to SSC and operates with CO2 containing a very high amount of H2S from the oil obtained from the pre-salt wells [4,8], the CO2-IUpipes were internally cladded with a corrosion resistant alloy (CRA) to overcome this problem.
The substrate (S) and the filler metal (for instance, a HSLA steel and a nickel alloy, respectively) commonly have quite distinct chemical compositions, crystallographic structures, microstructures, and physical-mechanical properties [9,10,11,12,13], resulting in the formation of a transition zone between the substrate (base metal) and the clad (TZ-S/C). The TZ-S/C is located between the completely mixed zone (CMZ), which is the clad weld itself, and the heat affected zone (HAZ) of the substrate. The main characteristic of the TZ-S/C is its chemical composition gradient [12,13], due to the reduction in the fluid (molten metal) velocity near the fusion line (boundary layer) and convective mixing close to the substrate. Consequently, the TZ-S/C not only has different chemical composition gradients but also different thicknesses and morphologies along the fusion line [11]. Microstructural heterogeneities and differences in physical-mechanical behavior between the substrate and the clad can generate high stress and strain levels in the TZ-S/C [14]. The substrate is a strong heat sink and a site of intense heterogeneous nucleation, which corresponds to the starting of solidification by the planar mode; when the solid/liquid interface subsequently destabilizes, solidification mode changes to cellular, and finally to cellular-dendritic [15]. In addition, competitive grain growth in the clad can produce a crystallographic texture close to the direction of easier growth [16].
The TZ-S/C can form martensite (M) as a result of the increase in hardenability along its thickness due to the high dilution levels, and consequently, it exhibits high hardness [17]. The hardness of the TZ-S/C can also be attributed to the diffusion of carbon from the substrate to the clad, which may result in carbide precipitation (M7C3 and M23C6) [18] and the formation of partially diluted macrosegregates with different morphologies (beach, peninsula, and islands) [19]. These constituents are susceptible to hydrogen embrittlement [20] and can disbond the clad from the substrate during service [21]. In addition, dissimilar welding may form two types of high-angle grain boundaries, type I (BT I) and type II (BT II), which grow perpendicular and parallel to the fusion line [22,23,24,25], respectively. The type II boundaries can act as a favorable path for crack propagation and promote stress corrosion cracking [26]. Wu et al. [27] indicated that the TZ-S/C formed by dissimilar laser beam welding of 9%Ni steel with 304 stainless steel consists mainly of lath martensite and columnar grains boundaries type I.
The innovative use of 9%Ni steel seamless pipes in CO2-IU by Shell and Petrobras required, for the first time ever, their cladding with a CRA. These companies cladded them with Ni-based superalloy 625 (AWS ER NiCrMo-3) by using gas tungsten arc welding with a hot wire (GTAW-HW) process. However, the metallurgical and mechanical characteristics of the TZ-S/C between the 9%Ni steel and the Ni-based superalloy 625 are still unknown. It is possible that the clad disbonds from the substrate, exposing the susceptible microstructure (tempered martensite) to a medium containing H2S, which can promote the CO2-IU failure. In light of these facts, it is extremely important to know the characteristics of TZ-S/C.
This work has two objectives: The main one is to understand how welding (number of thermal cycles) influences the microstructure of the TZ-S/C and to obtain a clad with mechanical and chemical properties suitable for the intended application; the secondary goal being to investigate the microstructure of the TZ-S/C, enabling the prediction of how the cladded pipe will behave during manufacturing, non-destructive inspection, and operation.

2. Materials and Methods

2.1. Materials and Welding

In this article, two seamless pipes of 9%Ni steel (quenched and tempered) were cladded with one and two layers of Ni-based superalloy 625 by using GTAW-HW, and were called clad I and II, respectively. Figure 1a shows schematically the arrangement of these clads within the pipes. Table 1 shows the specified and analyzed chemical compositions of the substrate, filler metal, and clad layers. The chemical compositions were determined through optical emission spectroscopy with a Foundry Master Pro (Oxford Instruments, Oxford, UK). Table 2 shows the characteristics of the seamless pipes and clad layers, as well as the welding conditions. Table 3 presents the welding parameters used in the cladding. The welding heat input was calculated according to Equation (1).
H I = I h w 2 R W F R + η V I w W S
where HI, Ihw, R, WFR, η, V, Iw, and WS represent, heat input, wire current, wire electrical resistance, wire feed rate, thermal efficiency of the process (0.7), electric arc voltage, mean welding current intensity (arithmetic mean of the pulse and base welding currents intensities), and welding speed, respectively. The R was calculated from the electrical resistivity (ρ) of the Ni-based superalloy 625 (1.29 × 10⁻⁶ Ωm), wire length (15 mm; Lhw), and wire cross-sectional area (1.0028 mm2; Ahw), based on Equation (2).
R = ρ L h w A h w
The microstructure of the seamless 9%Ni steel pipes consisted of fine ferrite grains with dispersed carbides (tempered martensite) and about 3% reverse austenite (γrev), as reveled in Figure 1b. The filler metal used was AWS ER NiCrMo-3, with chemical composition similar to the Ni-based superalloy 625, a solid solution hardened alloy with high Cr, Mo, and Nb contents. Figure 1c shows schematically the region studied in this work.

2.2. Microstructural Characterization

The microstructure of the TZ-S/C was analyzed through OM and SEM for a section perpendicular to the welding direction (i.e., parallel to the rolling direction of the pipe). The metallographic samples were grinded with sandpapers, following the sequence 100#, 200#, 400#, 600#, 1200#, and 2200#, and polished with diamond paste (in the sequence 6 μm, 3 μm, 1 μm). The microstructure was revealed after two consecutive etchings, as indicated in Table 4. OM was performed with a Zeiss microscope (model Axios Imager M2m, Carl Zeiss, Oberkochen, Germany), and SEM, with two microscopes, a FEI™ model Quanta 450 (Thermo Fisher Scientific, Waltham, MA, USA) and a Tescan model Vega3 (Tescan, Brno, Czech Republic), in the secondary electron mode. Semiquantitative analysis of the main chemical elements present was carried out by using a Bruker XFlash Detector 5010 (Bruker, Billerica, MA, USA) energy dispersion spectrometer coupled to a SEM.
The preparation of the samples for EBSD analysis was the same as that employed for OM and SEM, except for an additional mechanical polishing step involving colloidal silica (0.04 μm) for 2 h. This step is very important to reduce the previously generated superficial strains, which can greatly influence the quality of the results. Diffraction of the backscattered electrons was maximized by tilting the sample 70° relative to the electron beam. EBSD was performed with a Bruker model e- Flash with 20 kV, step size between 0.6 μm and 1 μm, and a work distance of 17.7 mm. Post-processing of the EBSD data was carried out with the extension MTEX-Free and Open Source Software Toolbox [28] (version 5.0.1, MTEX, Chemnitz, Saxony, Germany) coupled to the MATLAB® software (2018b, MathWorks Inc., Natick, MA, USA). Grains smaller than 5 pixels were excluded. The previous austenite reconstruction was performed with Nyyssönen algorithm [29] by using 1.6 as the inflation operator and a minimum of 3° between martensite laths as a criterion for the grain boundary angle. It is worth mentioning that this algorithm does not require retained austenite to convert martensite back to austenite. Pole figures (PF) with the variants of the martensitic transformation were generated by using the PTCLab software (version 1, Beijing, China) [30].

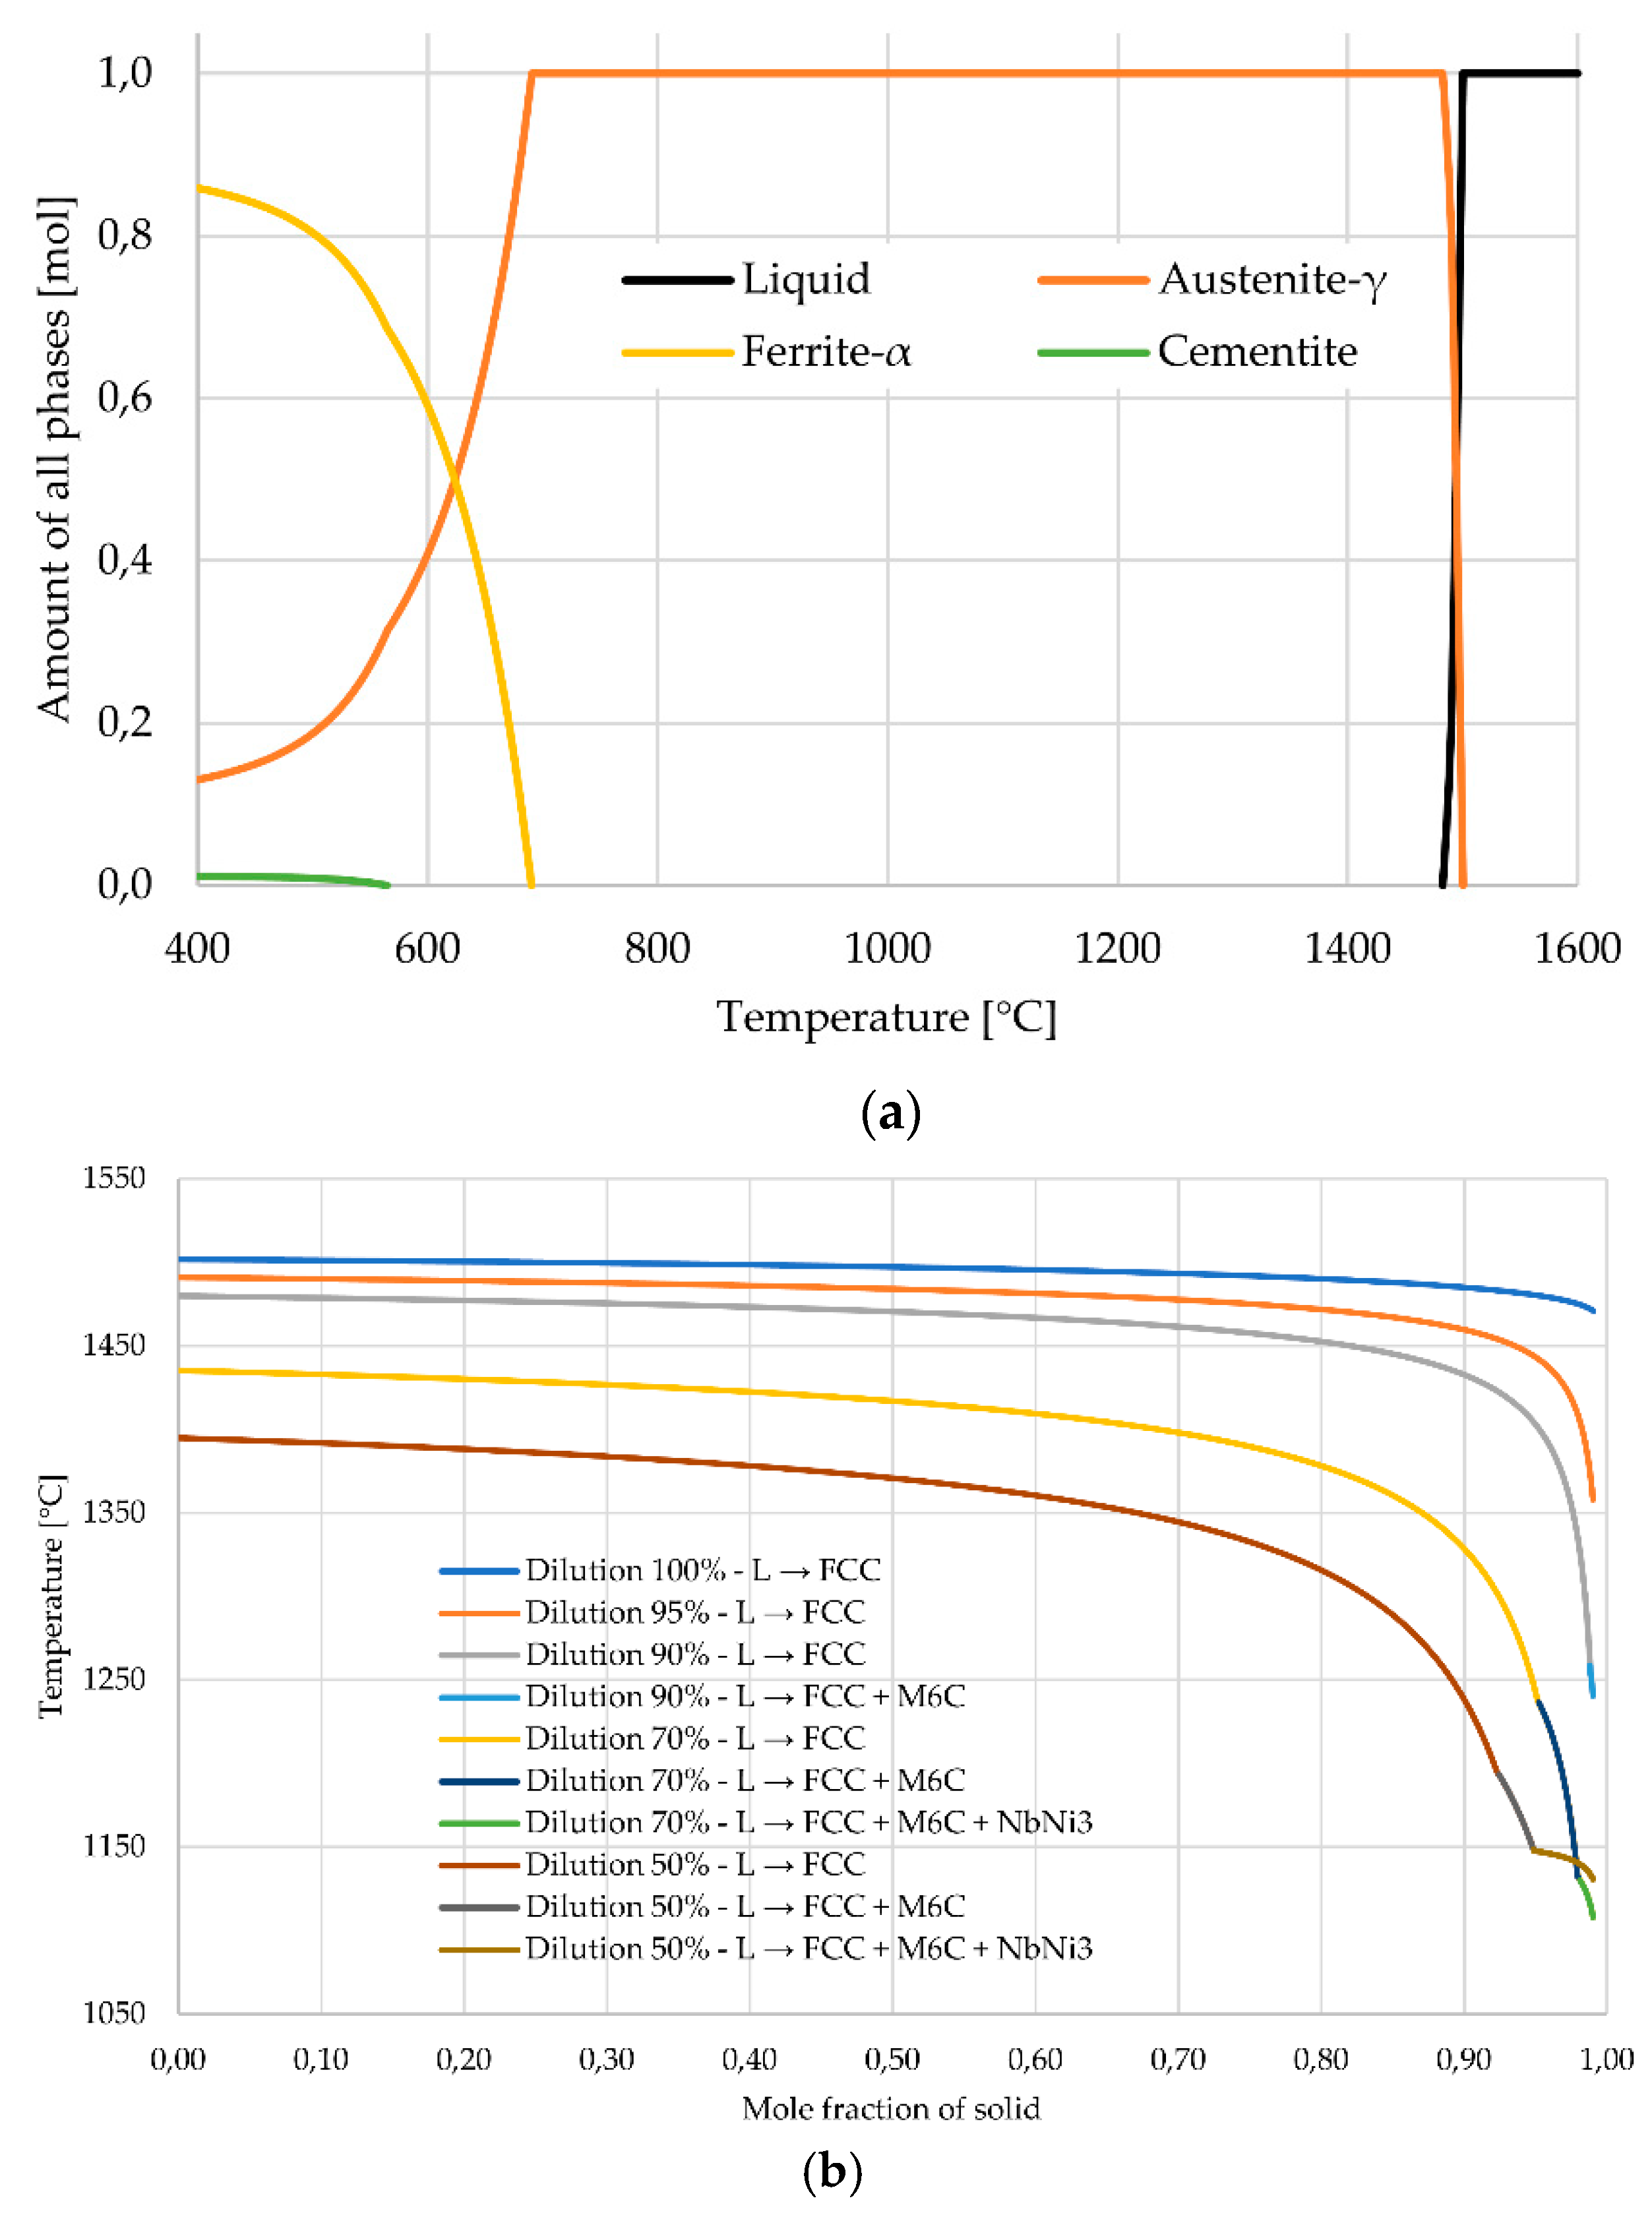
2.3. Thermodynamic Simulation

Thermodynamic simulations were performed with Thermo-Calc® software (Thermo-Calc, version 2018b, Solna, Sweden) by using the TCFE9 database. The Scheil-Gulliver solidification model with rapid interstitial atomic diffusion was adopted. The chemical compositions for the dilutions levels of 95%, 90%, 70%, and 50% were estimated from the 9%Ni steel and Ni-based superalloy 625 composition (Table 1) by applying the direct mixing rule [31] shown in Equation (3).
C c l a d = C w i r e ( 1 D ) + C s u b s t r a t e D
where Cclad, Cwire, and Csubstrate are the chemical compositions of clad, wire, and substrate, respectively, and D is the dilution level near the TZ-S/C.

2.4. Mechanical Characterization

The mechanical properties of the TZ-S/C and its surrounding regions were evaluated through Vickers microhardness, shear, and bend tests. Vickers microhardness maps were obtained in the vicinity of the TZ-S/C using a HV-1000 (400.310) Digimet hardness tester (Digimess, Mooca, São Paulo, Brazil), as shown in Figure 1c. The mean distances between the indentations in the Y and X directions (perpendicular and parallel to the TZ-S/C) were 20 μm and 40 μm, respectively, in an area of 570 μm × 240 μm. The indentations were made by using a load of 0.01 kgf (HV0.01) and dwell time of 20 s. The shear tests, whose configuration is shown in Figure 1d, were performed on two test specimens following the specifications of ASTM A265-12. The bend test was executed following the specifications of the ASME-IX code, with a radius of curvature of 180° in eight specimens, four for each clad that was machined transversally to the welding direction. Furthermore, all the mechanical tests in this work were performed at room temperature (~25 °C).

3. Results

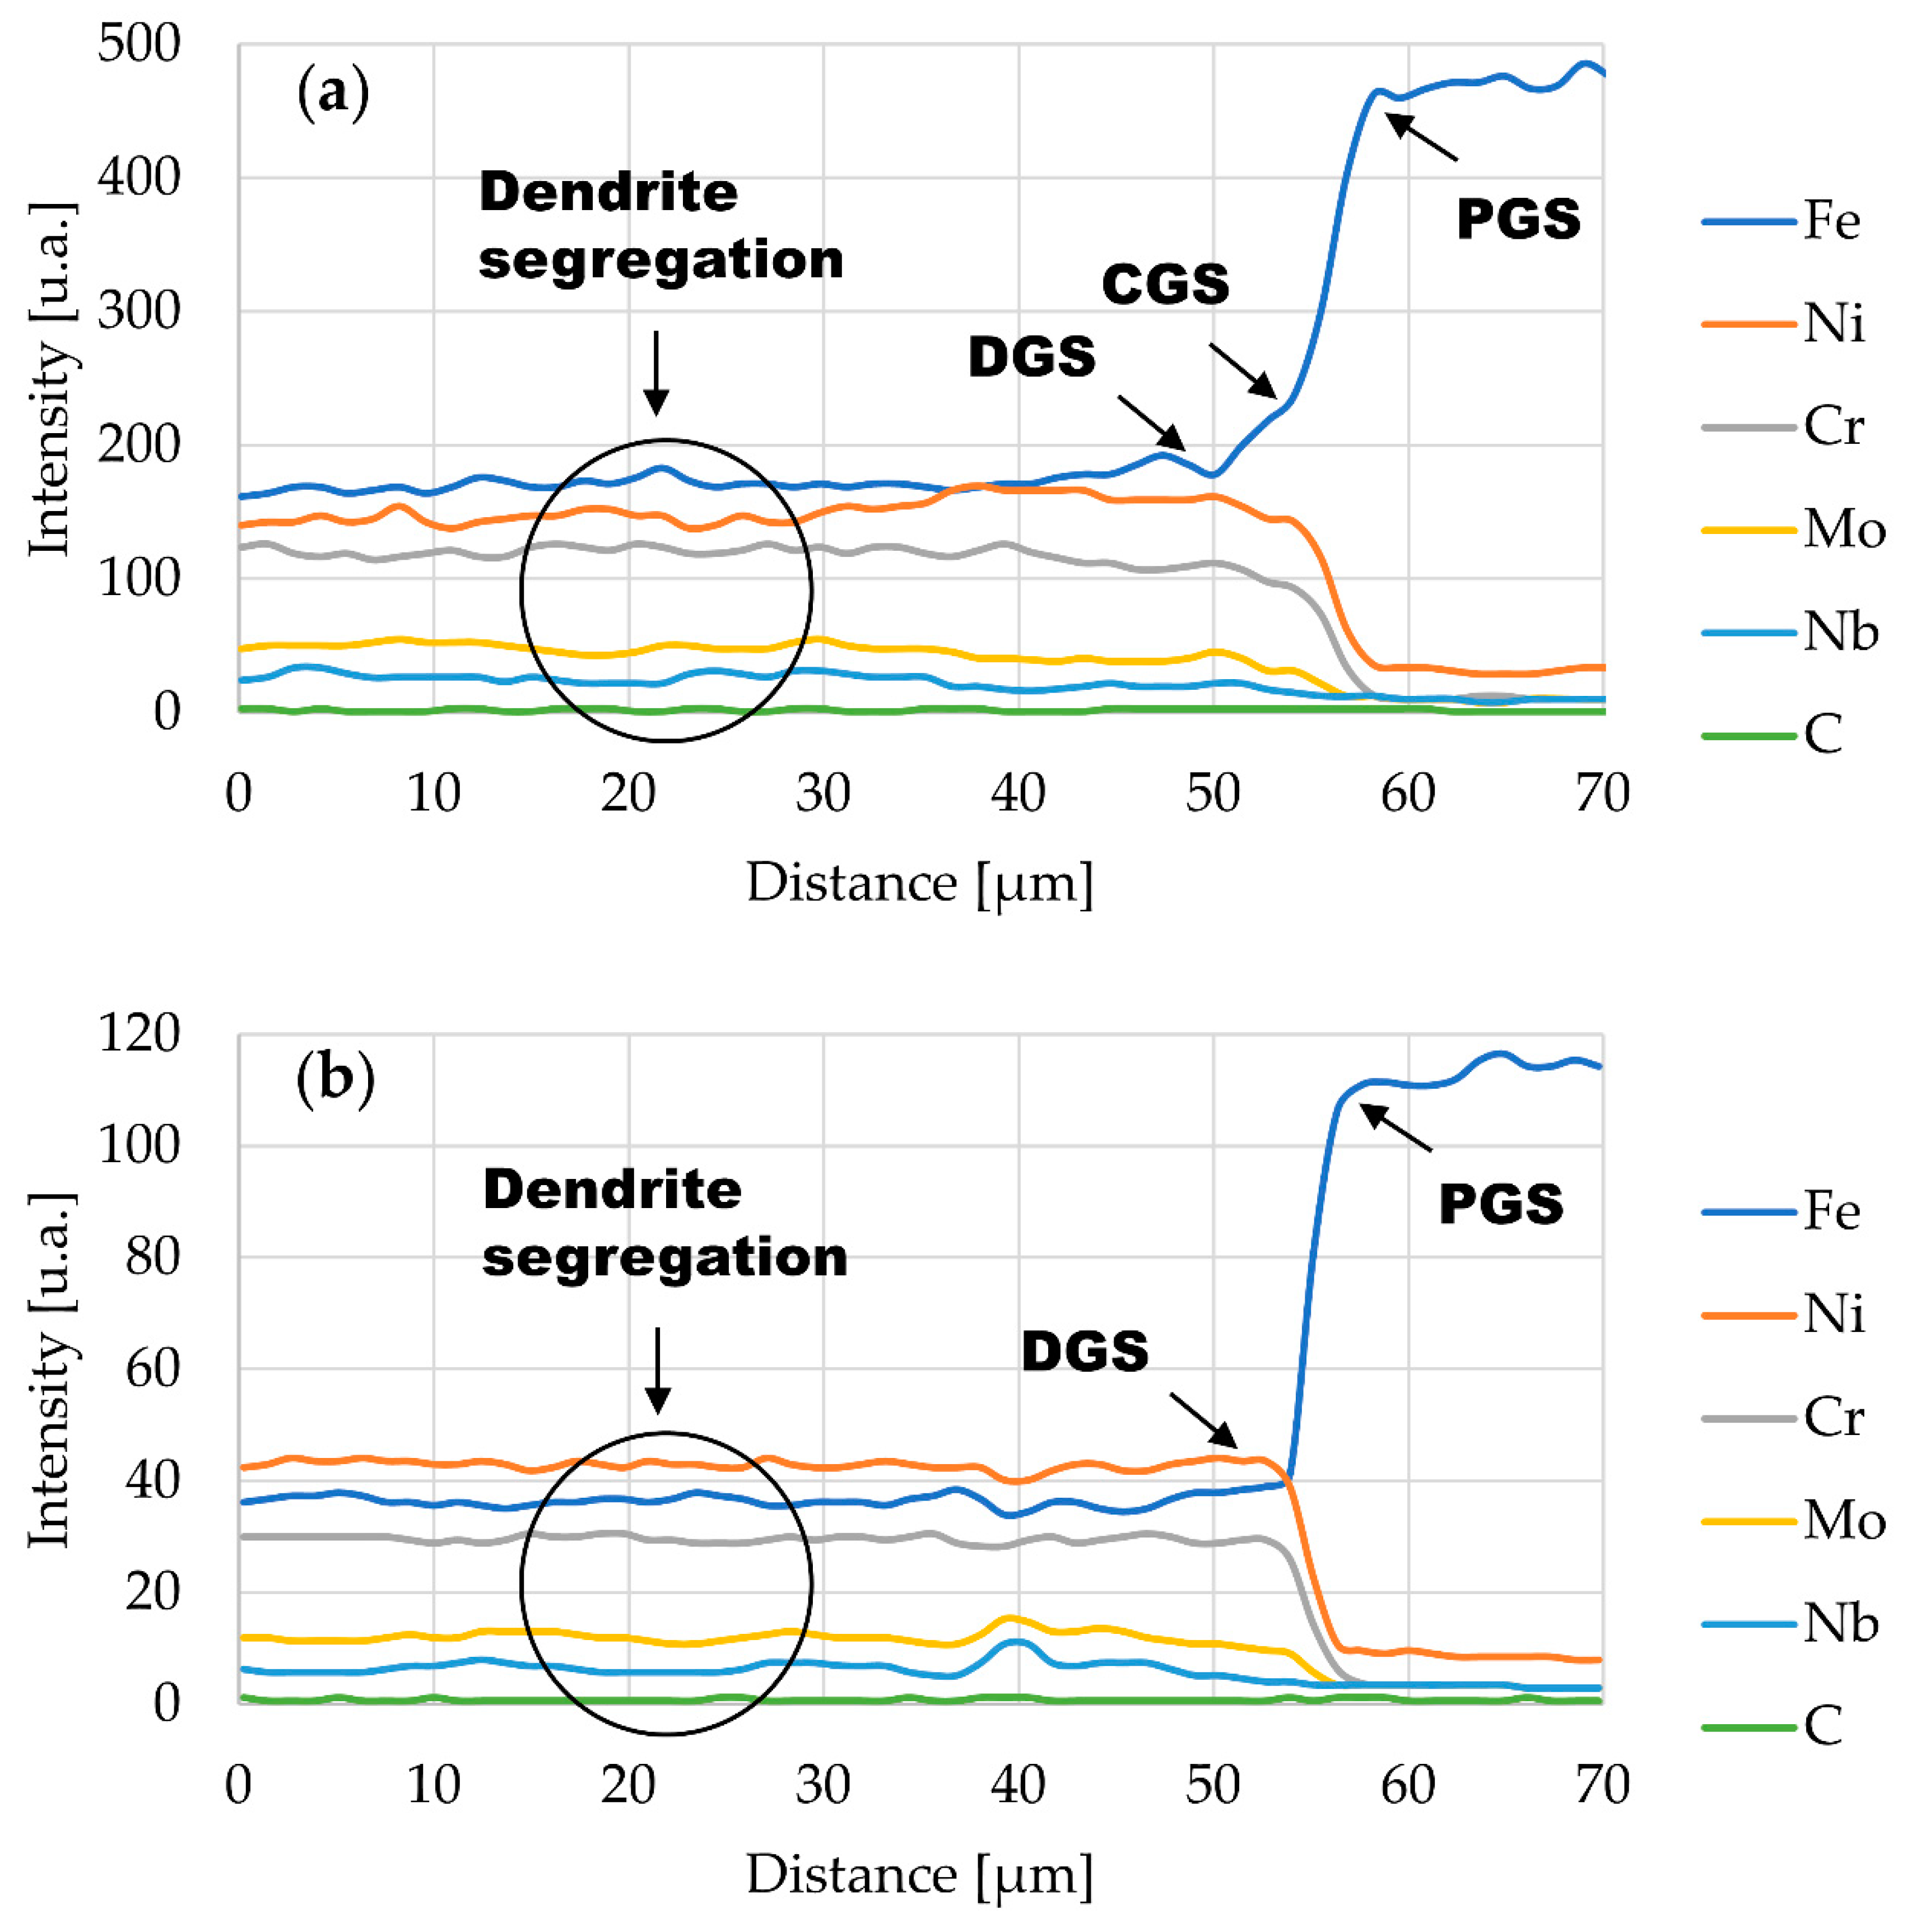
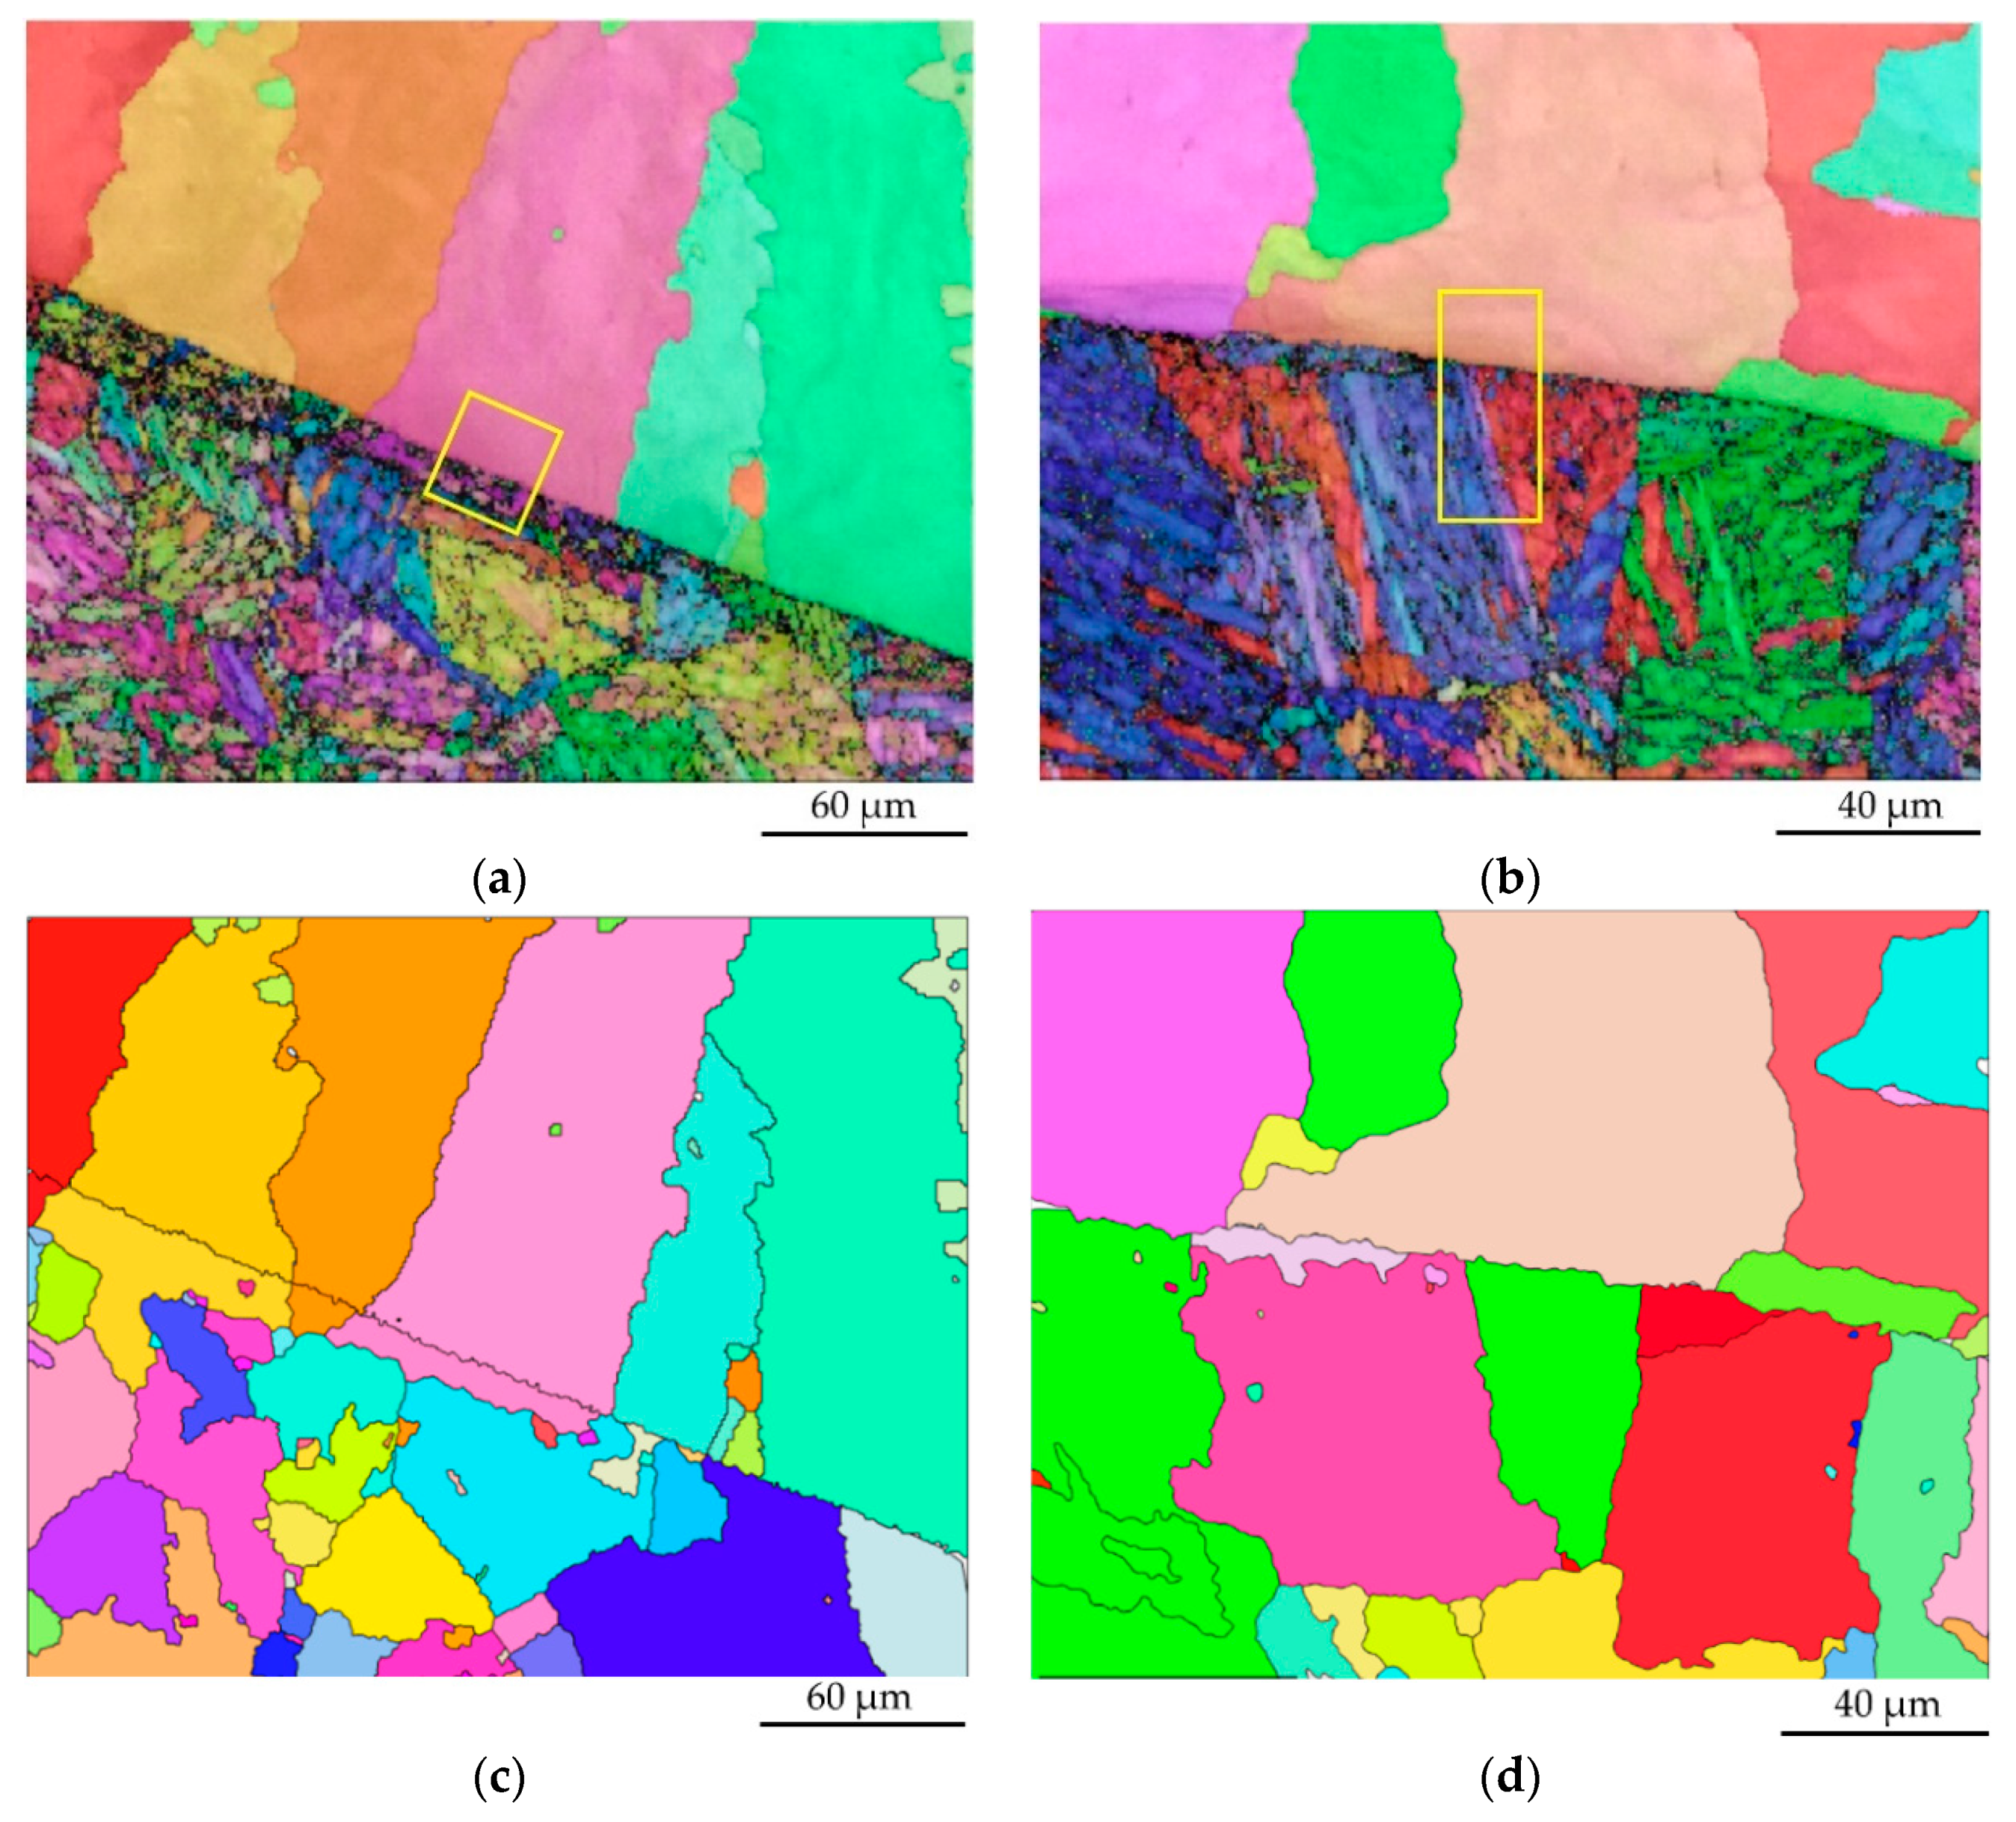
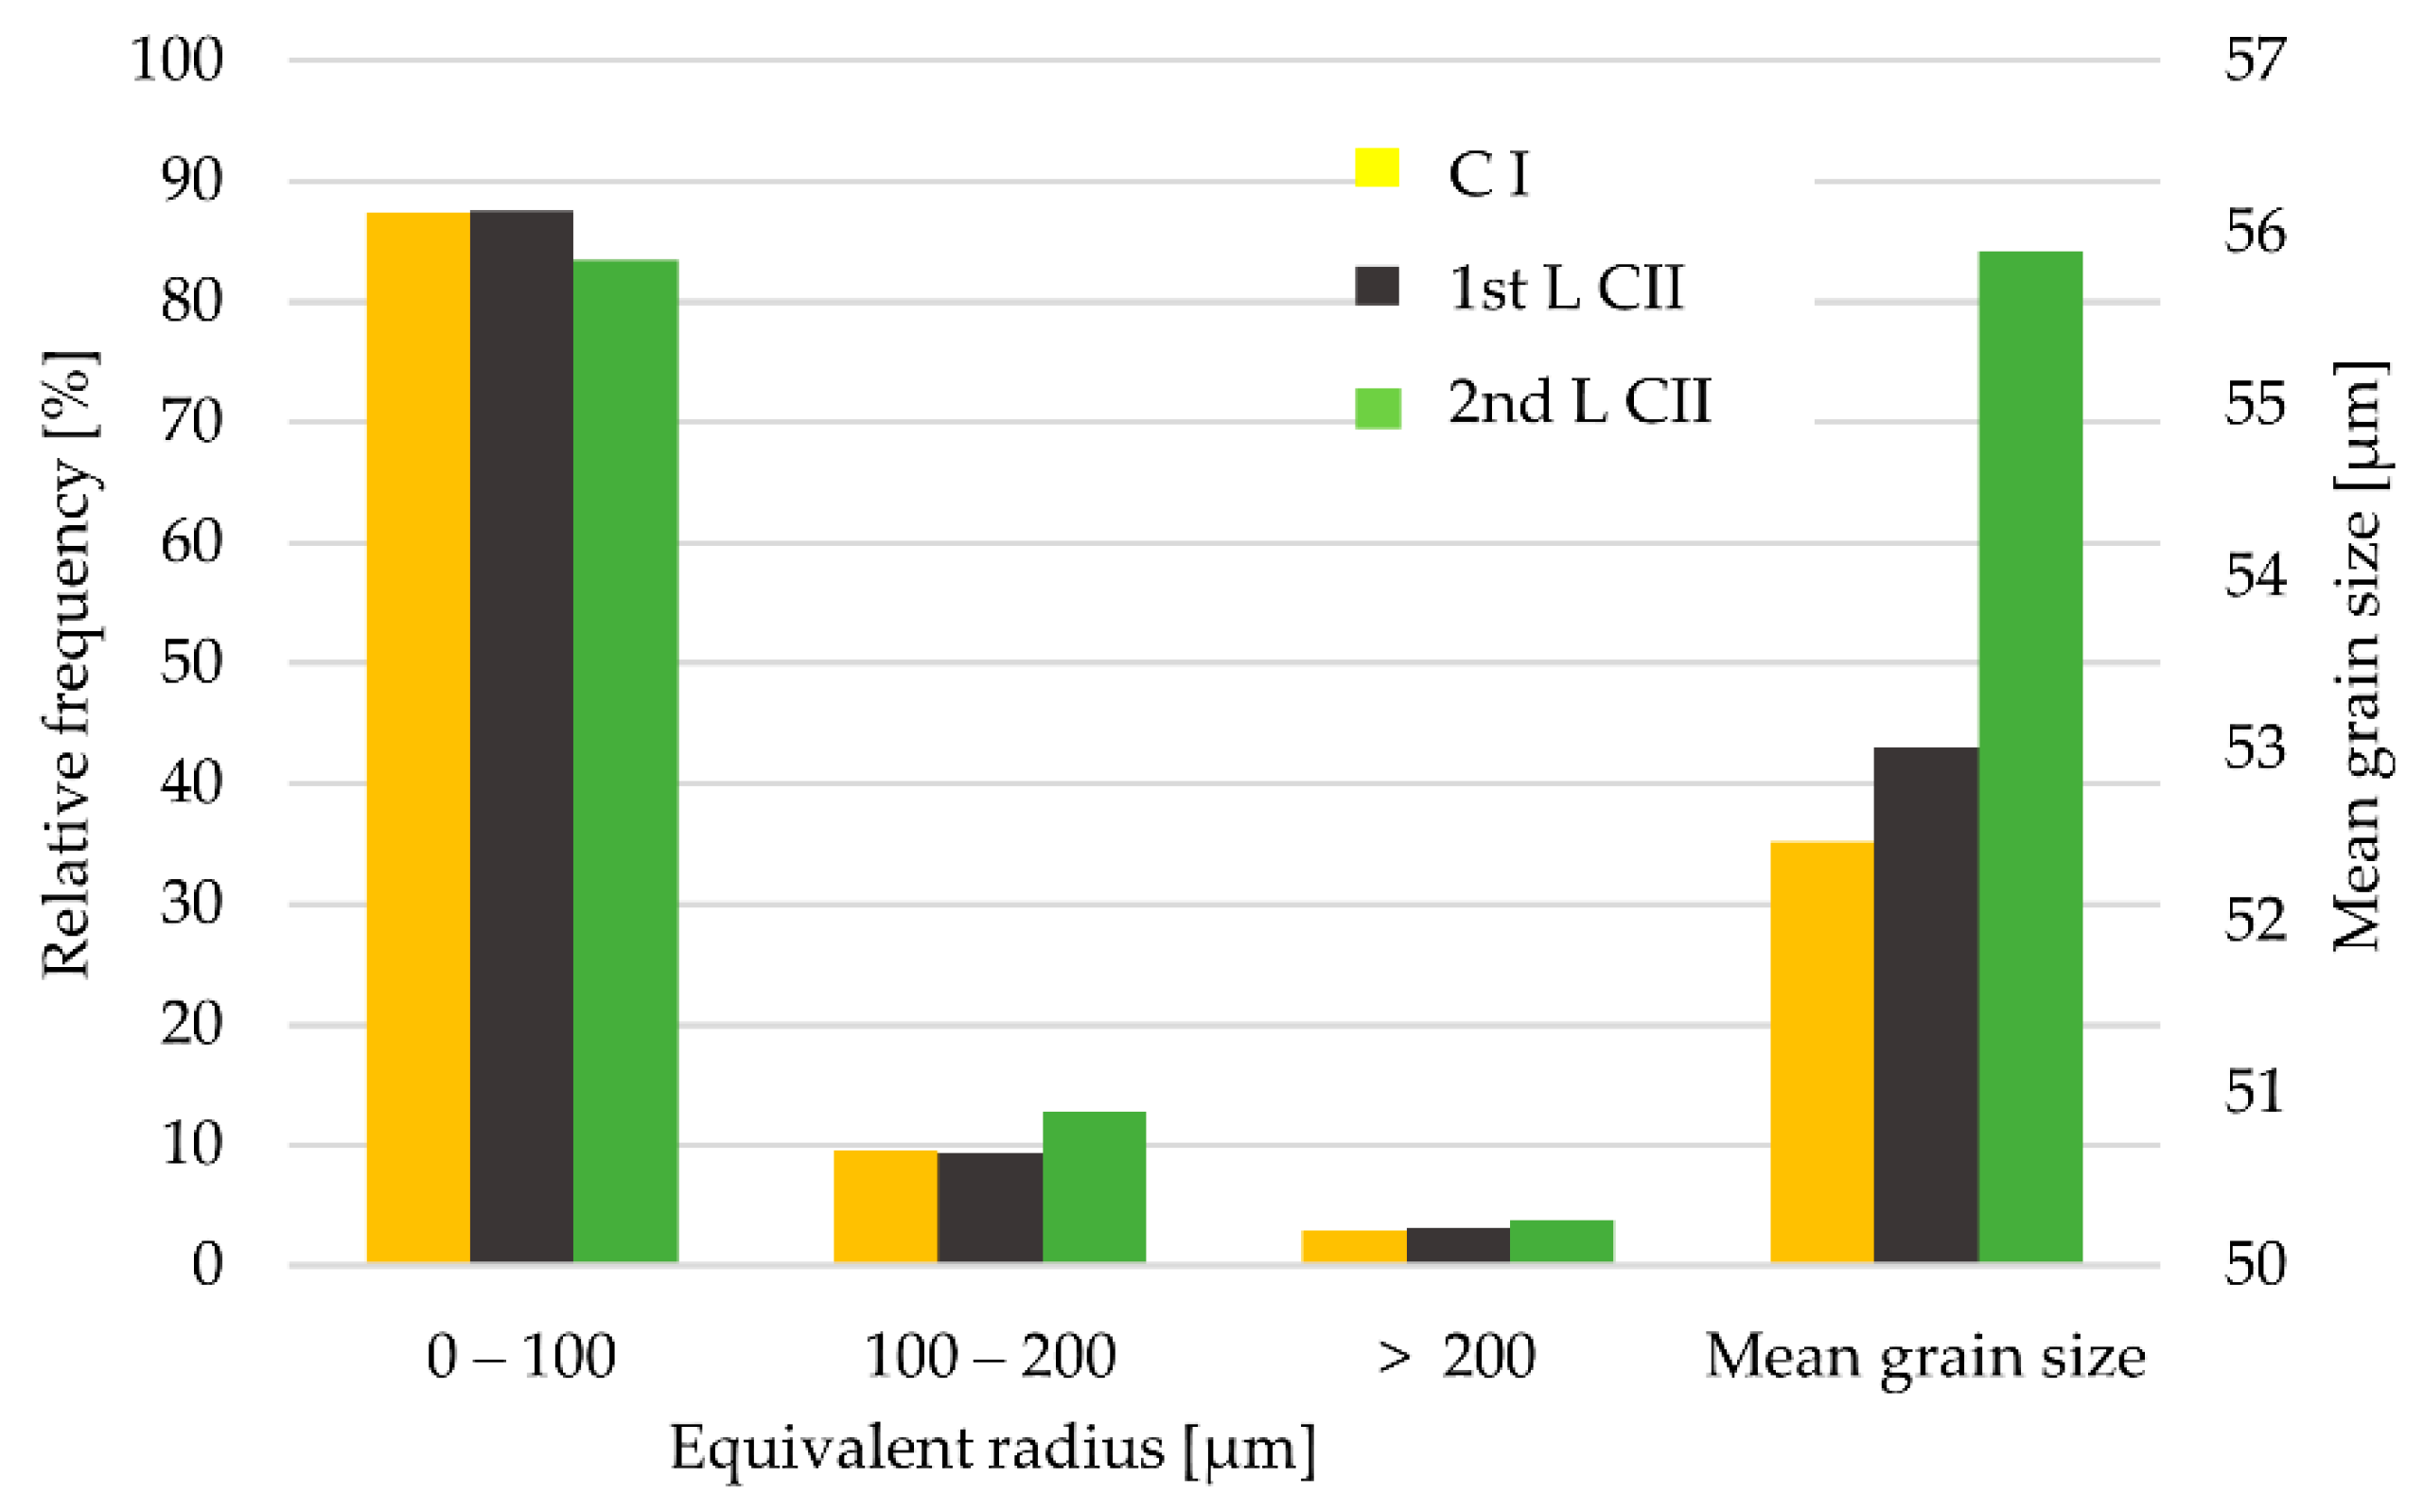
3.1. Microstructural Characterization

OM analyses on the TZ-S/C of clads I and II indicated heterogeneous epitaxial nucleation (Figure 2a), with BT I growing approximately perpendicular to the TZ-S/C interface, as well as a planar growth solidification (PGS) region that develops due to intense heat extraction by the substrate at the beginning of the solidification, which stabilizes the liquid/solid interface. Since the chemical composition of the PGS region varies gradually, as indicated by Silva et al. [12], only a portion of this region was revealed by chemical attack. The substrate immediately adjacent to the TZ-S/C, known as the coarse grain heat affected zone (CGHAZ), presented a microstructure consisting mainly of lath martensite with a small amount of retained austenite. Figure 2b shows the growth of BT II [25] parallel to the TZ-S/C. Dendritic-columnar growth occurred in the cladding, due to the destabilization of the solid/liquid interface as a result of constitutional supercooling and the reduction in the cooling speed, as evidenced by the grains containing BT I. Figure 2c,d shows peninsula-like macrosegregation close to the TZ-S/C and the interface between the layers of clad II, respectively. For macrosegregation to occur between two metals, they must have different melting temperatures, as was the case in this study (the substrate and the clad have melting temperatures of 1501 °C and 1363 °C, respectively, both of which were determined by computer simulation using Thermo-Calc®). The liquid metal at the wire tip, because of the turbulence caused by the electric arc, strikes at a high speed against the molten and partially stagnated substrate, pushing the liquid substrate into the welding pool without any great mixing with it (type I mechanism of macrosegregate generation), as suggested by Yang and Kou [32]. As the displaced liquid substrate was at a higher temperature than the surrounding molten metal, it cooled and solidified abruptly, forming regions of planar and cellular growth that were thicker than those formed in areas where there was no macrosegregation. Epitaxial heterogeneous nucleation also occurred between the two layers of clad II (Figure 2d), where the dendrites of the second layer were thinner than those of the first, since the cooling rate at the end of the solidification of the dendrites of the first layer was much lower than that at the beginning of second layer dendrites solidification. It was also found that macrosegregation could occur between the layers of clad II, since the Fe content (that depends on the dilution, and was about 24.8% for the first layer and 6.48% for the second layer) influences the melting temperatures of the layers [33], allowing the formation of macrosegregate [19,32].
Figure 3a,b shows the epitaxial nucleation and competitive growth of the grains immediately adjacent to the substrate. As the temperature decreases and the liquid clad solidifies, the solubilities of the alloying elements in the formed crystals decrease, enriching the remaining liquid with Mo and Nb, for instance, which precipitate in the interdendritic regions [34]. Figure 3c shows the precipitates formed in BT II, as well as lath martensite in the HAZ. Figure 3d indicates that the peninsula-like macrosegregation originated from the molten substrate, as previously suggested, since it had cellular morphology and a partially mixed zone (PMZ) at its edges, which is a consequence of the fast cooling caused by the surrounding liquid, as indicated by Soysal et al. [19]. No island-like macrosegregation was observed in the TZ-S/C of 9%Ni steel cladded with Ni-based superalloy 625. Figure 3e,f shows a PMZ with lath martensite and composite regions of austenite and martensite, as predicted by the Schaeffler diagram (Figure 4) for the high dilution levels (above 84.6%) found in the PMZ [17]. The progressive increase in the content of filler metal, such as Ni, Cr, and Mo, in the PMZ increased its hardenability, preventing the tempering of martensite during the welding of the second clad layer, or during the post-welding heat treatment [35], as shown in Figure 3f. The residual strain present during welding can destabilize the previous austenite and favor martensitic transformation in this region and its surroundings, as suggested by Chen et al. [36]. Although the second layer welding thermal cycle had little influence on the microstructure of the PMZ, it had a strong influence on the microstructure of the HAZ of the substrate, changing it from 100% martensite to ferrite with finely dispersed carbides and small islands of reverse austenite (Figure 3f), as indicated by Barrick et al. [37] and Payão Filho [38]. As seen in Figure 3f, the concentration of interdendritic precipitates and the average particle size in the first layer of clad II close to the substrate increased during the welding of the second layer.
The SEM and EDS results of the interdendritic precipitates (Figure 5) show, based on the geometry and the energy dispersive spectra, respectively, MC-type carbides with high concentrations of Nb and Mo (Nb carbide with Mo in solid solution). In their vicinity, Laves/γ eutectics [39] with high contents of Nb, Mo, Ni, Cr, and Fe were identified (Figure 5b). The MC-type carbides and the Laves/γ eutectic formed through the solidification sequence described by Solecka et al. [40]. According to this model, γ is first formed (dendrite axis), followed by the MC-type carbide, which is due to the increase in the Nb and Mo contents in the remaining liquid, and then, at the final solidification instant, eutectic Laves/γ in the vicinity of the preexisting carbide. The chemical composition of the grains that grow perpendicularly to the TZ-S/C (BT I) varies gradually (Figure 6b–d), while that of the grains that grow parallel (BT II) vary abruptly (Figure 6f–h), indicating that the nucleation of grains with BT II were independent. In addition, the interdendritic regions show higher Mo and Nb segregations (Figure 6c,d, respectively), while Fe is concentrated in the dendrite axes (Figure 6b). These distinct chemical composition gradients were also verified through EDS line scans for the grains with BT I and BT II (Figure 7), which again reveal abrupt variation in the chemical composition in the TZ-S/C in the grains with BT II. Furthermore, there were three chemical composition inflection points in the TZ-S/C corresponding to the grains with BT I (Figure 7), which are related to the changes in the solidification mode, from planar to cellular and later to cellular-dendritic (PGS, CGS, and dendritic growth solidification, respectively), as indicated by Silva et al. [12]. In the case of BT II, no inflection point with regard to cellular growth was observed, indicating that this boundary type is only found in the planar growth region, as reported by Nelson et al. [23]. The EDS scan line of the cellular-dendritic growth region (Figure 7) shows a wave pattern, a behavior caused by the passage of the electron beam through several dendrite arms with different chemical compositions, which are in turn produced by the continuous segregation occurring during the solidification process. According to Solecka et al. [40], during the solidification of the Ni-based superalloy 625, the Mo, Nb, Al, Si, and C segregate continuously in the interdendritic liquid owing to their partition coefficients (k) being less than one (Figure 7). In the present study, it was possible to observe high concentrations of these elements in the interdendritic region after solidification. The increase in Fe content in the solid solution (dilution) reduced the Mo and Nb partition coefficients, intensifying their segregation in the liquid. The opposite occurred with Fe and Ni, for which k > 1, as they segregated along the dendritic axis. Cr has a k slightly higher than one, therefore, its distribution was approximately homogeneous during solidification. The above facts explain the "phase delay" between the intensities of the chemical elements with k > 1 and those with k < 1, with a peak for the elements with k > 1 and a valley for those with k < 1. Besides, the precipitates in BT II (Figure 3c) are presumed to be MC-type carbides, since their Mo and Nb concentrations are high (Figure 6g,h) and the Fe content close to the PGS is lower than that of BT I; in addition, these precipitates appeared at the beginning of the transition from the planar to the cellular-dendrite solidification mode [34]. Despite the presence of MC-type carbides and the eutectic Laves/γ, which are known to be strong hot-crack promoters [41], no hot crack was observed in the clads, suggesting that the weldability of the 9%Ni steel cladded with the Ni-based superalloy 625 is good.

3.2. Crystallographic Relationship between the Substrate and the Clad

As seen in Figure 3, a good metallurgical bonding of the substrate with the clads can be observed, as well as the grains with type I and type II boundaries in the TZ-C/S. The EBSD mapping performed in this zone and its surrounding regions allowed crystallographic correlation of the substrate grains (CGHAZ) with the type I and II boundary grains. This mapping, however, did not reveal any retained austenite (face centered cubic; FCC) in the CGHAZ, since its size was much smaller than the step size adopted [42]; therefore, it was not possible to directly correlate the CGHAZ martensite grains with those of the clads that nucleated in the TZ-S/C. The microstructure of the substrate immediately adjacent to the clad was 100% martensite, with a body-centered tetragonal structure, which was indexed through EBSD to the body centered cubic (BCC) structure, owing to the small difference in the lattice parameters of these two unit cells for low-carbon steels, such as 9%Ni steel (0.067% C, according to Table 1).
Both bainitic and martensitic transformations are displacive by nature; therefore, the crystallographic relation between the mother and daughter phases is well established. According to the phenomenological theory of martensite crystallography, there is a deformation and a habit plane associated with each of those transformations. Furthermore, such a transformation is governed by the energy associated with the deformation, which prevents independent variation of the crystallographic orientation between the mother and daughter phases [43,44]. Among the possible crystallographic relations between martensite and austenite, the most important are Kurdjumov-Sachs (KS), {110}BCC//{111}FCC, and <100>BCC//<110>FCC, and Nishiyama-Wassermann (NW), {011}BCC//{111}FCC and <111>BCC//<110>FCC. In the case of 9%Ni steel, as indicated by Kinney et al. [45], the KS relation is the one that fits the best.
As the austenite in the CGHAZ substrate and the Ni-based superalloy 625 has a FCC unit cell, it was expected that the clad would maintain the same crystallographic orientation as the substrate at the beginning of solidification, which is characteristic of epitaxial nucleation, which is observed in weld pool solidification during similar and autogenous welding. Consequently, the epitaxial nucleation can be verified when there is a correlation in the crystallographic orientation between the clad grains and a set of lath martensites belonging to the same austenitic grain. With this purpose, the PF in the directions <100> and <110> of both the clad and the martensite adjacent to the TZ-S/C (Figure 8a,b) were obtained. As the analyzed region (yellow rectangles in Figure 9a,b) did not reveal the 24 possible martensitic transformation variants [46], there was no perfect fit between the PFs. However, it can be seen, based on the similarity between them, that the clad at high temperatures (beginning of solidification) used the substrate as the site for epitaxial nucleation, growing with the same crystallographic orientation, which was also verified by Mas et al. [47] by using a similar methodology. As already noted, the clad also displayed grains that grew parallel to the TZ-S/C. Analysis of these grains with type II boundaries through the above described procedure (Figure 8c) shows that there was no correlation between the obtained PFs, unlike what is observed in the case of grain boundary type I.
The prior austenite in the CGHAZ with and without the crystallographic correlations (with the types I and II grain boundaries, respectively) was investigated by reversing the martensitic transformation by using the Nyyssönen method [29]. The obtained results (Figure 9) corroborated the information presented in Figure 8, i.e., there is crystallographic continuity between the grains with boundaries type I in the TZ-S/C and those of the substrate (Figure 9a,c). The type II boundary grains do not reveal such results because the clad grains grew through more than one prior austenite grain of the substrate without any crystallographic continuity (Figure 9b,d).

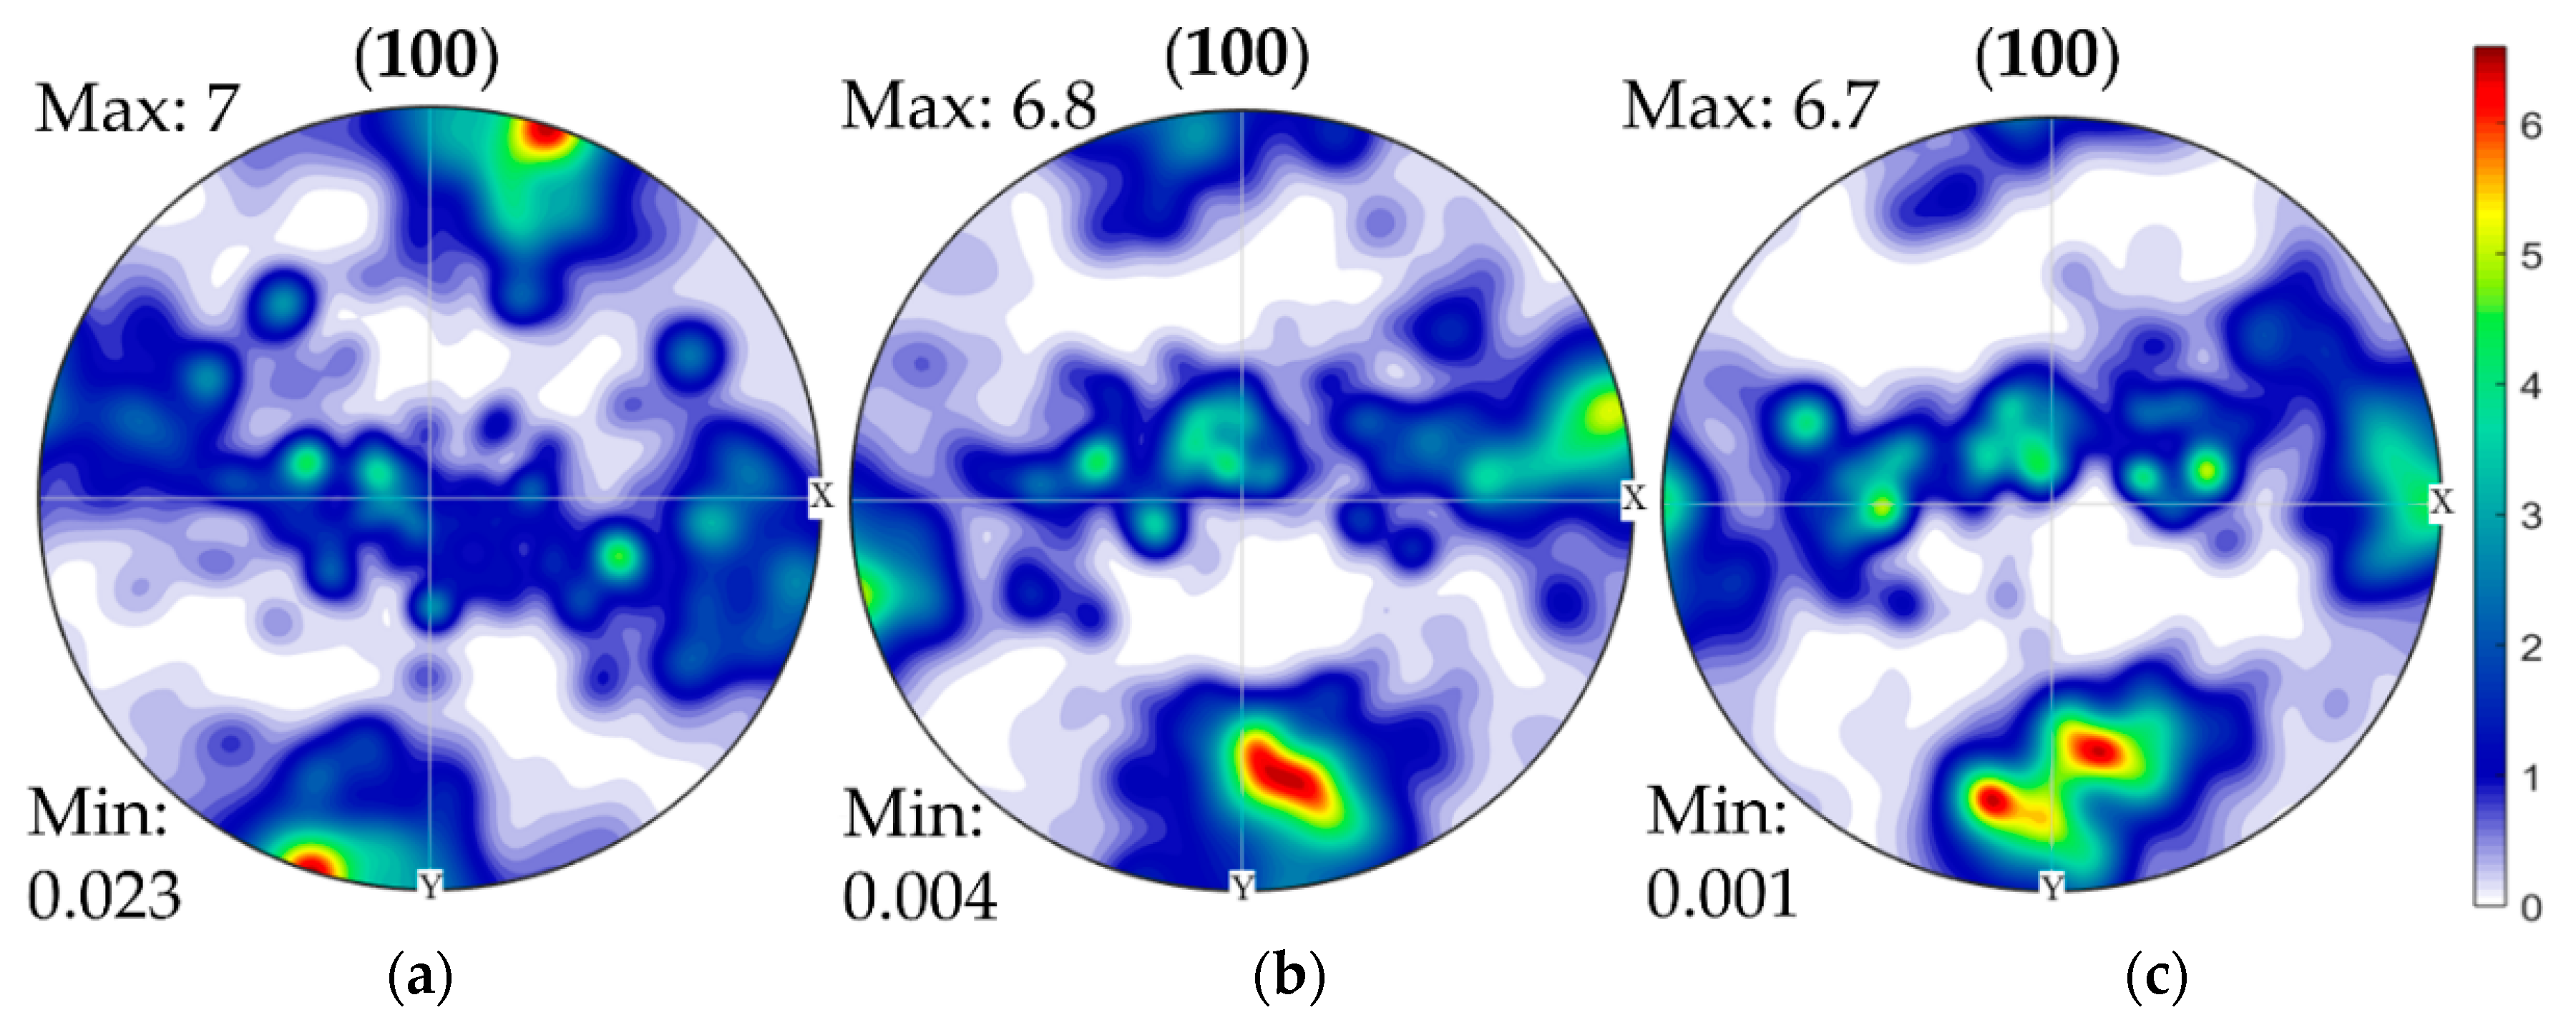
3.3. Crystallographic Texture of the Clad Layers

The clad grains grow in the direction of weld pool movement (i.e., along the welding direction), producing elongated grains that are tilted relative to the fusion line (Figure 10). Besides, the high cooling rate of the substrate results in intense heterogeneous nucleation close to it. According to Kim et al. [48], some grains near the surface (clad face) change their growth directions because of other more efficient heat extraction sources (compared to the substrate), as has been observed in the final moments of the clad solidification. The PFs (Figure 11) show moderate crystallographic texture along the <100> fiber, which is a common feature of the cast components and welded joints in clad I and both clad II layers. The crystallographic texture is related to the easy growth direction for cubic crystalline metals. The deviation observed in the crystallographic texture of the clad in the PFs with respect to the x- and y-axes (perpendicular to the welding direction and radial to the pipe, respectively) was due to the positioning of the sample in the SEM chamber, as has also been reported by Ocelík et al. [16].
During the solidification, the substrate acted as an intense heterogeneous nucleation site, producing an area with smaller grains in the clad adjacent to the substrate and larger grains in more distant regions. In the TZ-S/C, the grains with the lowest angles between the easiest growth direction (<100>) and the maximum thermal gradient in the melt pool grew faster than those with higher angles, a phenomenon that is called competitive grain growth [15]. In view of this observation, the grains in contact with the substrate revealed a random orientation distribution, and the outermost grains developed a sharp crystallographic texture. However, some grains that nucleated in the TZ-S/C along the easier growth direction could grow uninterruptedly from this zone up to the clad surface. Regarding clad II, the 2nd L C II exhibited a larger average grain size than the 1st L C II (Figure 12). While the 1st L C II nucleated in the substrate (9%Ni steel), with a mean grain size of 7.8 μm and random distribution of crystallographic orientation; the 2nd L C II nucleated on top of the first one, with the average grain size being 52.8 μm; grains were partially angled in relation to the maximum thermal gradient. Besides that, the higher growth and lower grain nucleation rates (larger grain size) in the 2nd L C II can be explained by the lower thermal conductivity of solid solution-hardened Ni alloys (in this case, the clad) compared to that of the 9%Ni steel, which also corroborated with previous information. As already indicated, the grain size and the distribution of the crystallographic orientation of grains in the clad were heavily influenced by the grain size, crystallographic orientation, and physical properties of the substrate [16], in addition to its welding parameters. The crystallographic texture results in anisotropic properties of the clad and, depending on the purpose of the cladded component, may compromise the clad performance, especially in applications that require fatigue resistance [49].
As mentioned, the 9%Ni steel cladded with Ni-based superalloy 625 showed BT II. However, according to Wu [22] and Nelson et al. [23,24,25], BT II forms when the primary solidification mode changes abruptly, as in the case of ferrite-δ to γ transformation in certain stainless steels, due to enrichment of the liquids with austenite-forming elements or when the allotropic transformation (ferrite-δγ) occurs during the cooling in the HAZ, generating a mobile FCC/FCC interface. This FCC/FCC interface can extend into the melted region (planar solidification zone), generating a high-angle grain boundary parallel to the melting line, which is presented here as the type-II boundary. Based on these two presented mechanisms, it is impossible to explain the formation of BT II in the TZ-S/C of 9%Ni steel cladded with Ni-based superalloy 625, not only because the Ni-based superalloy 625 always solidifies as γ and does not change its microstructure during the welding thermal cycles [40], but also the 9%Ni steel shows no δγ allotropic transformation (Figure 13a) or solidification mode change for the dilution levels found in the TZ-S/C (Figure 13b). This paper rebuts the mechanism proposed by Wu [22], and tries to expand that proposed by Nelson et al. [23,24,25], indicating that the necessary condition for obtaining type II boundaries in dissimilar welds is the existence of an FCC/FCC mobile interface, and not the ferrite-δγ transformation in HAZ or solidification mode change. Additionally, when BT II was present, the chemical composition varied abruptly from the substrate to the clad (Figure 7), which can facilitate the movement of the FCC/FCC interface and promote BT II formation. The various chemical elements present in the solid solution (Cr, Mo, Nb, and Fe) can greatly distort the crystalline lattice of Ni [50]. The low contests of these elements in the TZ-C/S aid the movement of FCC/FCC interface, producing favorable conditions for an increase in BT II. Together with the chemical composition, the high density of dislocations generated by the weld strain and the mismatch between the lattice parameters of the FCC structures [11], can hinder effective movement of the FCC/FCC interface during the welding thermal cycle. In addition, it is believed that MC-type carbide precipitates (Figure 3), present at the time of the change in the solidification mode from planar to cellular-dendritic, block the mobile interface (Zenner pinning effect), preventing the BT II from advancing into the interior of the weld pool.

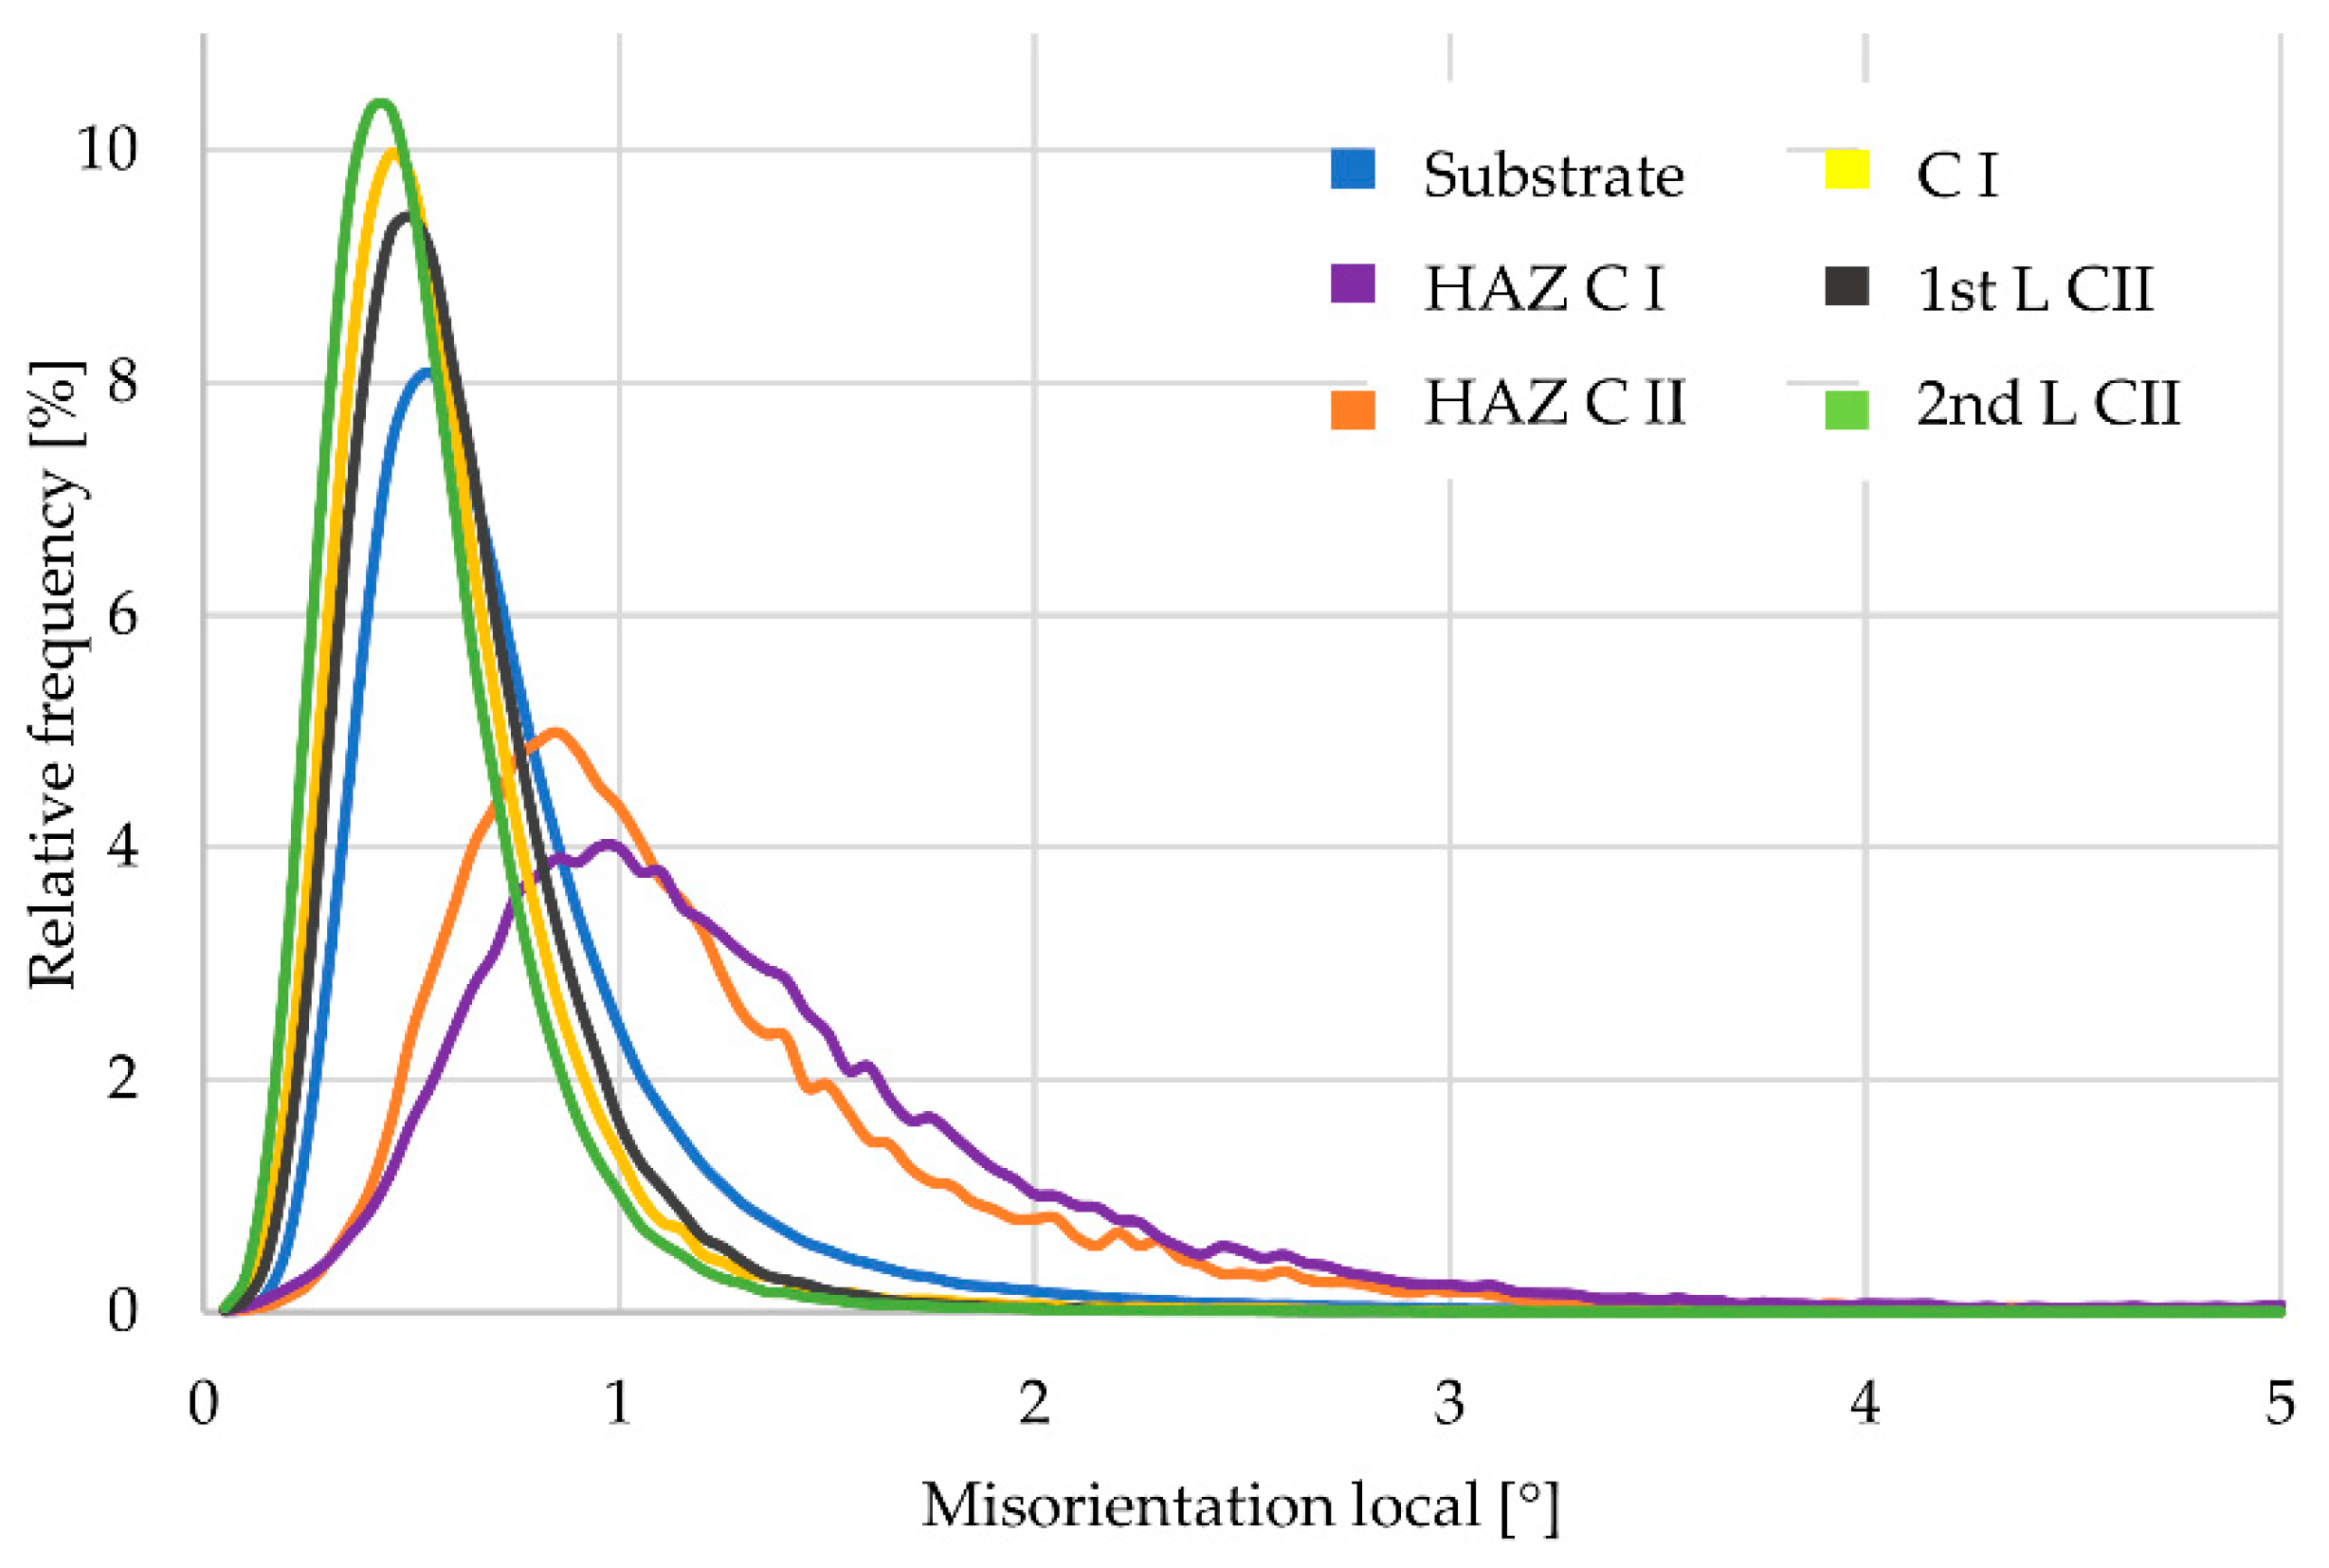
3.4. Kernel Average Neighbor Misorientation (KANM)

The most frequent KANM of the substrate (as received) was approximately 0.6°, while those of the clad I and clad II HAZs were about 0.8° and 0.9°, respectively (Figure 14). The KANM indicates the amount of local strain generated during the welding thermal cycle, and is proportional to the geometrically necessary dislocation density. The KANMs of the HAZs accumulated during the welding, and increased with the increasing number of clad layers, even if microstructural changes (associated with the austenitization and transformation occurring during the cooling) were observed in the HAZ during the welding thermal cycle. The residual strains were attributed to the difference in the physical-mechanical behavior between the substrate and the clad (dissimilar materials) and the high cooling rate observed during the welding thermal cycle. Eghlimi et al. [51] observed the accumulation of residual strains with an increasing number of welding thermal cycles when they cladded API 5L X65M pipes with stainless steel (AWS ER 2594). Besides, Shamanian et al. [52] found that the residual strains in the substrate decreased upon buttering with 309L stainless steel, whose physical-mechanical properties were between those of API 5L X65 and duplex stainless steels (AWS ER 2594), which were also analyzed by Eghlimi et al. [51], although without buttering.
As in the case of the substrate, the KANMs of the clads also accumulated with the increase in the number of welding thermal cycles. Owing to there being only one welding thermal cycle, the 2nd L C II revealed the lowest KANM. In addition, the substrate properties (1st L C II) were close to those of the 2nd L C II, since the 1st L C II and 2nd L C II had similar chemical compositions (Table 1) and microstructures (Figure 3), resulting in low levels of residual strains and, consequently, KANMs with low-angle peaks. Clad I showed KANM that was displaced to higher angles compared to 2nd L C II, because its substrate was 9%Ni steel (which resulted in a big difference in the mechanical-physical behavior), even though it experienced only one welding thermal cycle, similar to the 2nd L C II. The 1st L C II exhibited the greatest residual strains of the two clads analyzed because it experienced two welding thermal cycles and involved the same substrate as clad I.
The 9%Ni steel undergoes allotropic transformations that abruptly change its volume and mechanical behavior [14], a phenomenon that is not observed in Ni-based alloys. This results in a KANM that is broader than that of the clads under the same conditions. Although the seamless 9%Ni steel pipes cladded with Ni-based superalloy 625 display residual strains, their KANMs exhibit low relative frequency to high angles of local misorientation (over 2°), which demonstrates that the density of the geometrically necessary dislocations and the local residual strain and stress levels are low [51,52]. In spite of these observations, the HAZ of 9%Ni steel is more prone to stress corrosion cracking, SSC, and brittle fracture, compared to the substrate (as-received), since its higher levels of residual strains and susceptible microstructure promote this type of failure [53]. Therefore, this cannot be disregarded during the design and use of 9%Ni steel pipes cladded with Ni-based superalloy 625 in the oil and gas industry, because clad defects can expose the HAZ to the medium.

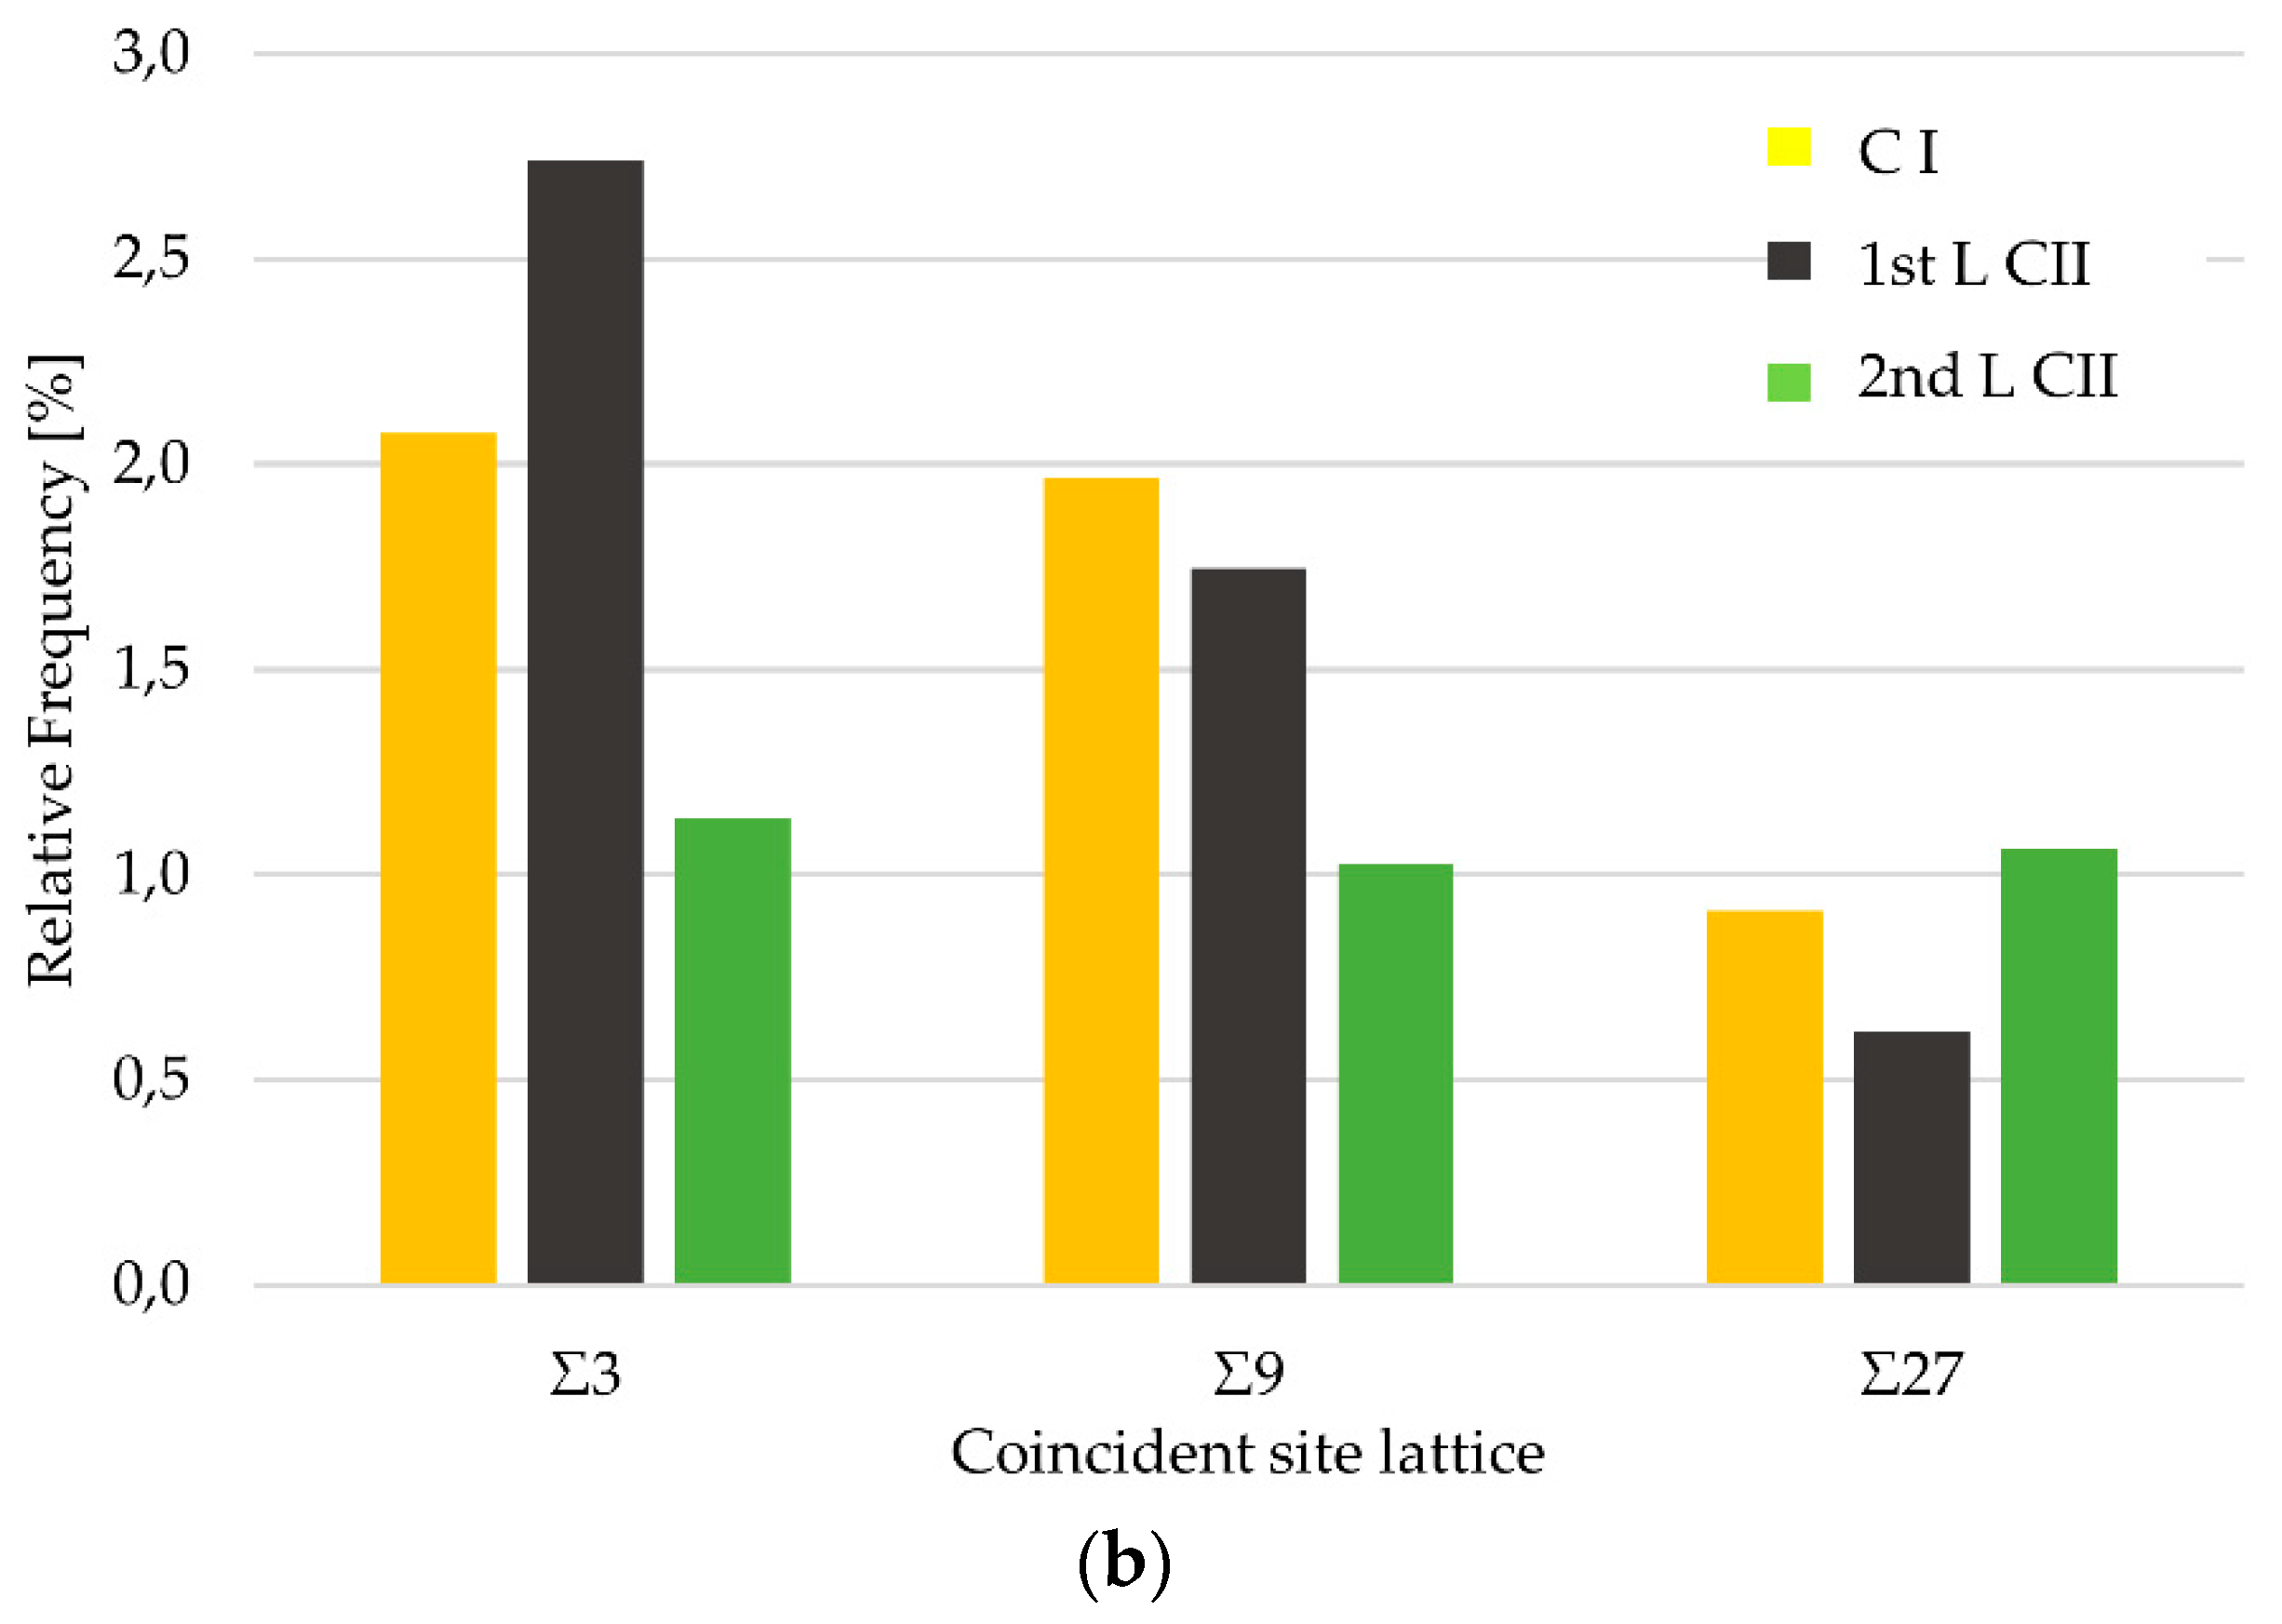
3.5. Grain Boundary Characteristic Distribution (GBCD)

The grain boundaries were divided according to their misorientations (Δθ) as low-angle (LAB; Δθ < 5°), mean-angle (MAB; 5° ≤ Δθ ≤ 15°), and high-angle (HAB; Δθ > 15°). The first welding thermal cycle changed the GBCD of the 9%Ni steel, increasing the number of LAB and MAB, and decreasing the relative frequency of HAB. On the other hand, the second welding thermal cycle reduced the LAB and MAB, but increased the amount of HAB. The high amounts of LAB and MAB (CGHAZ clad I) were due to the formation of pairs of specific variants (V) that result from self-accommodation of the strains during the martensitic transformations, such as V1 and V4, V2 and V5, and V3 and V6, with Δθ of 10.5°, and due to pairs of equivalent variants within the same block [46]. The increase in the number of HAB (CGHAZ of clad II) resulted from the austenitization occurring during the 2nd L C II welding and the reconstructive transformation, which produced a microstructure composed of ferrite and dispersed carbides with retained austenite (Figure 3f). The relations between the variants of the martensitic transformation (CGHAZ of clad I) were partially lost, resulting in the increase in the HAB close to the substrate (with the microstructure of tempered martensite).
The GBCDs of clads I and II showed little variation because no phase transformation was occurring in them. After two welding thermal cycles, the 1st L C II showed a reduction in the relative frequency of LAB and an increase in that of MAB, which is associated with the increase in the residual strains (Figure 14) and the rearrangement of dislocations. It is known that in low stacking fault energy metals (clad layers), dynamic recrystallization is difficult, and the dislocations arrangements can evolve from the LAB to the MAB. Moreover, there was no marked difference between the relative frequencies of the HABs of 1st L C II and clad I. The epitaxial nucleation observed in the 2nd L C II was considered to be responsible for the lower relative frequency of the HAB, which reduced the intense random nucleation that occurred in TZ-S/C (in the 1st L C II with HAB). Furthermore, the 2nd L C II, because of its smaller strain, showed the lowest frequency of LAB. Owing to a higher strain close to the TZ-S/C, the frequencies of the special high-angle and low-energy grain boundaries (coincident site lattice; CSL, Σ3n (n = 1, 2, 3)), which were identified by the Brandon criterion (Δθ ≤ 15Σ−0.5) [54], increased with increasing number of welding thermal cycles (Figure 15b), indicating the possible occurrence of twinning [55] or a strain-induced boundary mobility, which is a necessary condition for their formation [56] in the 1st L C II, a fact that was also suggested by Eghlimi et al. [51]. The CSLs were also observed more frequently close to the TZ-S/C, due to the higher levels of residual strain and stress [14]. A similar behavior was also observed in the other conditions (clad I and 2nd L C II) because they had lower residual strains, and consequently, lower amounts of Σ3n (n = 1, 2, 3). Kobayashi et al. [57] reported that the presence of Σ3n hinders intergranular cracking, therefore, the increase in the relative frequency of the CSLs in the clads improved the crack growth resistance, enhancing the integrity of the cladded component during service. No hot crack was observed in the 1st L C II, which is believed to be related to the presence of CSLs, which contributed to the weldability.

3.6. Mechanical Properties

Measurements of Vickers microhardness (HV0.01) in the TZ-S/C and its surroundings (CGGHAZ and CMZ) of clad I and clad II revealed that the microhardness dropped continuously from the substrate to the clad (Figure 16). The arithmetic means of the microhardness in the three regions (HAZ, TZ-S/C, and CMZ) of clad I were higher than those of clad II (Table 5). There were no microhardness peaks in the TZ-S/C, as is observed for the same region of a low-alloy steel cladded with austenitic stainless steel [10]. The variation in microhardness in the CMZ was attributed to the solidification heterogeneities, such as solidification type (cellular and cellular-dendritic) and grain sizes, interdendritic phase (MC-type carbide and eutectic Laves/γ) types and sizes, and residual stress and strain levels. The microhardness variation observed in the CMZ can also be influenced by the crystallographic orientation of its grains, as indicated by Zhou et al. [58]. The intense nucleation of grains with different crystalline orientations in the TZ-S/C resulted in different mechanical properties of each grain. Therefore, dispersion of the microhardness in the CMZ close to the TZ-S/C can occur due to the differences in the crystallographic orientations of the grains on which the indentation was made. Furthermore, the presence of multiple phases (γ, carbides, and Laves) with distinct mechanical behaviors can contribute to this dispersion, since one of those phases may interfere with the mechanical behavior of its neighborhood, restricting (MC-type carbides and Laves phase) or facilitating (γ) the amount of plastic strain produced by the indentation [40,59]. This microhardness dispersion in the CMZ was also observed by Wu et al. [42] and Chen and Lu [36].
The PGS zone, unlike the CMZ, exhibits no difference in grain types or precipitates; therefore, the hardness variation observed cannot be explained based on the hardness dispersion mechanisms of CMZ. Wang et al. [11] compared the interplanar spacings (dhkl) of 316 stainless steel with those of the Ni-based superalloy 182, and obtained a mismatch of 16% which together with the residual strains (Figure 14) increased the number of dislocations in the PGS zone and, consequently, its hardness. Based on these considerations, it is believed that the PGS zone of 9%Ni steel cladded with Ni-based superalloy 625 displays similar behavior because of the deformation of this zone during the welding (Figure 14) and the difference in dhkl between these materials, which was about 21% [60]. During the welding of the 2nd L C II, the PGS zone was reheated, which could aid its recovery, thereby softening it.
As already mentioned, after the welding of the 1st L C II, the CGHAZ of 9%Ni steel was composed almost entirely of fresh martensite [37,38]. Nippes and Balaguer [5], when studying joint welding of this steel, observed the presence of a small amount of retained austenite in the CGHAZ. Jang et al. [61] also studied this type of joint and indicated the possibility of formation of a high hardness MA (martensite-austenite) constituent in the CGHAZ. In this study, the welding of the 2nd L C II refined the CGHAZ of the 1st L C II and partially decomposed the martensite into ferrite and finely dispersed carbides, which decreased its hardness. In addition, another factor that may have contributed to the decrease in the CGHAZ microhardness was the diffusion of carbon from the substrate to the clad, as reported by Alexandrov et al. [18] and Rao et al. [10], though without carbide precipitation.
According to Cao et al. [62], the residual strain directly influences the microhardness of a region. Although the CGHAZ of clad II reveals a higher residual strain (Figure 14) than that of clad I, the first is softer than the second, which demonstrates that the main hardening mechanism of the CGHAZ of a clad involves its microstructure, and not its residual strain level. Thus, the CGHAZ of a martensitic substrate (CGHAZ of clad I) is harder than a ferrite with dispersed carbides and a CGHAZ with a higher level of residual strain (CGHAZ of clad II) [63]. In the same sense, a dendrite in the CMZ softens during the welding of the 2nd L C II, which increases the residual strains and contributes to the hardening. However, the softening was due to the coalescence of the interdendritic precipitates (MC and Laves, Figure 3f), which reduces the amounts of alloying elements in the solid solution (mainly Nb and Mo) and increases the microhardness dispersion in the CMZ (Figure 16).
Visual inspections performed on the external (convex), internal (concave), and lateral surfaces of the bended test specimens with the help of a magnifying glass did not show any cracks, irregularities, clad disbanding, or any other kind of discontinuities (Table 5). Nambu et al. [64] reported that the mechanical strength and toughness of the substrate/clad interface should be high to inhibit disbonding during metal forming, as is the case during the bend test. Araújo et al. [65] quantified the crack tip opening displacement of the TZ-S/C of an API 5L X52 pipe cladded with Ni-based superalloy 625, indicating that at room temperature, it has a higher fracture toughness than CGHAZ and CMZ.
The results of the shear tests (Table 5) performed according to ASTM A265-12 in clad I and clad II, corroborated with the bend test results, since there was no crack nucleation and propagation in the TZ-S/C. The clads overmatched the minimum shear stress (τ) specified in the standard (140 MPa), as indicated in Table 5. The obtained τ were close to the value (487 MPa) determined by Xie et al. [66] for a HSLA steel cladded with 304 stainless steel by vacuum lamination, and were higher than that (399 MPa) reported by Rao et al. [10] for HSLA steel cladded with 307 stainless steel by shielded metal arc welding.
Although quenched and tempered seamless 9%Ni steel pipes cladded with Ni-based superalloy 625 exhibit very distinct chemical compositions, microstructures, and physical-mechanical properties, the transition zones between the substrate and the clads could be evaluated satisfactorily, complying with the standards required for its application.

4. Discussion

As the 9% Ni steel is susceptible to SSC, it is necessary to clad it with Ni-based superalloy 625 to guarantee its safe operation in environments with high H2S concentration, such as that in CO2-IU. Owing to the cost and quality of the clad, GTAW-HW is the industry standard to clad pipes with CRA for the production of oil, where risk of SSC exists. However, in order to fulfil standard requirements (Petrobras N-133, which specifies that the clad must be at least 3 mm thick with less than 10% Fe) adopted in the Brazilian pre-salt oil and gas exploration, it is necessary to employ pipes with two layers of clad, as these specifications cannot be met with a single clad layer. To understand the formation of the final TZ-S/C microstructure, and consequently its mechanical properties and in-service behavior, this work also addressed the first TZ-S/C prior to the welding of the second clad layer as it is the starting point towards the final TZ-S/C.
The HAZ of the first clad layer is significantly altered during the welding of the second clad layer, transforming from 100% martensitic (hard and brittle) to ferrite with finely dispersed carbides and reverse austenite (tempered martensite, Figure 3) responsible for the high fracture toughness at low temperatures of the 9% Ni steel, a necessary condition for its application in the CO2-IU. This microstructural modification reduced the hardness of the CGHAZ but increased residual strains (Figure 14) and, consequently, residual stresses, a fact which cannot be disregarded in the design of the CO2-IU.
Owing to its high dilution levels, the TZ-S/C presented high Ni, Cr, Mo and Nb contents which increased its hardenability, so that it was little influenced by the welding heat of the second clad layer. However, owing to the small carbon content of the substrate and the filler metal, even the TZ-S/C containing fresh martensite presented low hardness. The TZ-S/C withstood the bend test strains and presented a ductile fracture upon shear testing, indicating high toughness, a necessary property in the face of an abrupt depressurization of the CO2-IU. In addition, its high ductility suggests that the pipes cladded with Ni-based superalloy 625 by GTAW-HW could also be used to manufacture pipe bends.
The CMZ of the first clad layer was little influenced by the welding heat of the second one. However, deformation generated near the TZ-S/C increased the relative frequency of CSL (Σ3n (1,2,3)), hindering intragranular cracking nucleation and propagation in the CGHAZ or TZ-S/C itself, thereby increasing the integrity of the component. The second clad layer had a coarser and more oriented microstructure than the first one, which could reduce the corrosion fatigue life of cladded pipes. No solidification or liquation hot cracks were observed, even under intense segregation of alloying elements, the consequent presence of MC-type carbide and the low melting point Laves/γ eutectic. Thus, it can be concluded that the 9%Ni steel when cladded with Ni-based superalloy 625 by GTAW-HW presents good weldability. The fusion line of the clads was rectilinear enough to allow for ultrasonic inspection without geometrical difficulties. Furthermore, both clads were in accordance with ASTM A265-12 and ASME-IX codes.
The unexpected presence of the BT II in a steel without δα allotropic transformation upon cooling (Figure 2b and Figure 13) increases the importance of a more specific investigation of the clad, since these grain boundaries can act as sites for the nucleation and propagation of intergranular cracks along the TZ-S/C (zone with highest levels of residual strains and stresses) and separate the clad from its substrate. This is a critical fact since the CGHAZ (high residual stresses and strains), the catalyzed action of the medium (formation of a gap between the disbonded clad and the substrate) and the susceptible microstructure (tempered martensite) may lead to catastrophic failure of the cladded pipe. In addition, the peninsula-like macrosegregation with PMZ can act in equal manner.
The displacive transformation of the martensite and the crystallographic relationship of this phase with the austenite (Kurdjumov-Sachs) indicated that the clad can use the substrate as an epitaxial nucleation site, even in dissimilar welding, and, therefore, presents the same crystallographic orientation of the prior austenite (during cooling), as in the formation of BT I. The clad crystallographic texture and grain size are thus strongly influenced by the initial substrate microstructure. Furthermore, the TZ-S/C sites with BT I and BT II have different chemical composition gradients, the one of BT II being abrupt.
Despite the microstructural and operational complexities, the present work verified the synergy of the 9%Ni steel′s mechanical behavior with the corrosion resistance of the Ni-based superalloy 625 clad. This reduces the operational cost of CO2-IUs since it′s entire manufacturing with CRA is impractical, also creating another application for 9% Ni steel, previously almost exclusively restricted to the transportation and storage of cryogenic gases.

5. Conclusions

The study of the transition zones of the substrate/clad (TZ-S/C) of quenched and tempered seamless 9%Ni steel pipes cladded with Ni-based superalloy 625 by gas tungsten arc welding with a hot wire (GTAW-HW) yielded the following conclusions:
  • Although there is martensite in the transition zone of the substrate/clad, this zone does not present a high density of finely dispersed carbides (MC, M7C3, and M23C6 type), this being very beneficial to its ductility and fracture toughness;
  • The unexpected presence of type II boundaries in the dissimilar weld with a base metal that does not have allotropic transformations (δα) during the welding thermal cycle requires further analysis of the stress corrosion cracking behavior of the 9%Ni steel cladded pipe in environments with a high H2S concentration, such as the one the in the CO2 injection unit;
  • Although the clads have residual strain and stress, MC-type carbides, low melting point eutectic γ/Laves, and a partially oriented microstructure in the easy growth direction, the weldability of the 9%Ni steel cladded with the Ni-based superalloy 625 is good as there were no discontinuities and mainly no solidification nor liquation hot cracks;
  • The transition zone of substrate/clad has good metallurgical characteristics and mechanical properties, which allows the oil and gas industry to use the 9%Ni steel pipe cladded with Ni-based superalloy 625 in CO2 injection units.

Author Contributions

Formal Analysis, F.W.C.F., J.d.C.P.F. and L.M.B.A; Funding Acquisition, J.d.C.P.F.; Investigation, F.W.C.F. and L.M.B.A; Methodology, F.W.C.F; Project Administration, J.d.C.P.F.; Supervision, J.d.C.P.F.; Writing—Original Draft, F.W.C.F; Writing—Review & Editing, F.W.C.F., J.d.C.P.F. and L.M.B.A.

Funding

This research was funded by Shell Brasil Ltd.a., grant TO821, and Empresa Brasileira de Pesquisa e Inovação Industrial—Embrapii, grant PCCOP1512.0004.

Acknowledgments

The authors acknowledge the Vallourec Soluções Tubulares do Brasil S. A. (Vallourec) for supplying the pipes; to Instituto Nacional de Tecnologia (INT) for providing SEM and EDS for analyses; Fundação Carlos Chagas Filho de Amparo à Pesquisa do Estado do Rio de Janeiro (FAPERJ) for their financial support; to Cladtek do Brasil Indústria e Comércio de Tubos e Revestimentos Ltd.a. (Cladtek) for cladding the pipes; engineers Elisa Kimus Dias Passos and Rodrigo Stohler Gonzaga for their technical support; and Leandro da Silva Pereira for English language assistance.

Conflicts of Interest

The authors declare no conflict of interest. The funders had no role in the design of the study; in the collection, analyses, or interpretation of data; in the writing of the manuscript, or in the decision to publish the results.

References

  1. Beltrão, R.L.C.; Sombra, C.L.; Lage, C.V.M.; Netto, J.R.F.; Henriques, C.C.D. Challenges and New Technologies for the Development of the Pre-Salt Cluster, Santos Basin, Brazil. In Proceedings of the Offshore Technology Conference, Houston, TX, USA, 4–7 May 2009. [Google Scholar] [CrossRef]
  2. Ding, M.; Yuan, F.; Wang, Y.; Xia, X.; Chen, W.; Liu, D. Oil Recovery from a CO2 Injection in Heterogeneous Reservoirs: The Influence of Permeability Heterogeneity, CO2-Oil Miscibility and Injection Pattern. J. Nat. Gas Sci. Eng. 2017, 44, 140–149. [Google Scholar] [CrossRef]
  3. Bowman, J. The Greenhouse Effect. Land Use Policy 1982, 16, 101–108. [Google Scholar] [CrossRef]
  4. Vollmer, L.W. Hydrogen Sulphide corrosion Cracking of Steel. Corrosion 1952, 8, 326–332. [Google Scholar] [CrossRef]
  5. NACE International Standard TM00177-1996. Laboratory Testing of Metals for Resistance to Sulfide Stress Cracking and Stress Corrosion Cracking in H2S Environments; NACE: Houston, TX, USA, 1996; pp. 1–32. [Google Scholar]
  6. Zhao, X.Q.; Pan, T.; Wang, Q.F.; Su, H.; Yang, C.F.; Yang, Q.X. Effect of Tempering Temperature on Microstructure and Mechanical Properties of Steel Containing Ni of 9%. J. Iron Steel Res. Int. 2011, 18, 47–51. [Google Scholar] [CrossRef]
  7. Nippes, E.; Balaguer, J. A Study of the Weld Heat-Affected Zone Toughness of 9% Nickel Steel. Weld. Res. Suppl. 1986, 57, 237–243. [Google Scholar]
  8. Zeemann, A.; Emygdio, G. 9%Ni Steel Alloy for H2S Service. In Proceedings of the Corrosion, Santo Antonio, TX, USA, 9–13 Mach 2014; NACE: Houston, TX, USA, 2014. [Google Scholar]
  9. Gooch, T.G. Effect of Iron Dilution on Corrosion Resistance of Ni-Cr-Mo Alloy Cladding. Br. Corros. J. 1996, 31, 4–9. [Google Scholar] [CrossRef]
  10. Rao, N.V.; Reddy, M.G.; Nagarjuna, S. Weld Overlay Cladding of High Strength Low Alloy Steel with Austenitic Stainless Steel—Structure and Properties. Mater. Des. 2011, 32, 2496–2506. [Google Scholar] [CrossRef]
  11. Wang, W.; Lu, Y.; Ding, X.; Shoji, T. Materials Characterization Microstructures and Microhardness at Fusion Boundary of 316 Stainless Steel/Inconel 182 Dissimilar Welding. Mater. Charact. 2015, 107, 255–261. [Google Scholar] [CrossRef]
  12. Silva, C.C.; Miranda, H.C.; Farias, J.P.; De Abreu, H.F.G. Chemistry and Crystallographic Evaluation of Ni-based Alloy and Steel Dissimilar Interface. In Proceedings of the 9th International Conference in Welding Research, Chicago, IL, USA, 4–8 June 2013. [Google Scholar]
  13. Beaugrand, V.C.M.; Smith, L.S.; Gittos, M.F. Subsea dissimilar joints: Failure mechanisms and opportunities for mitigation. In Proceedings of the Corrosion, Atlanta, GA, USA, 22–26 March 2009; NACE International: Houston, TX, USA, 2009. [Google Scholar]
  14. Mikami, Y.; Sogabe, K.; Hashimoto, T.; Nishikawa, S.; Mochizuki, M. Evaluation of Residual Stress Distribution in Ni Base Alloy Clad Welds by Numerical Simulation and X-Ray Stress Measurement. Sci. Technol. Weld. Join. 2013, 18, 114–120. [Google Scholar] [CrossRef]
  15. Kou, S. Welding Metallurgy, 2nd ed.; John Wiley & Sons: Hoboken, NJ, USA, 2003; pp. 199–214. ISBN 0-471-43491-4. [Google Scholar]
  16. Ocelík, V.; Furár, I.; De Hosson, J.T.M. Microstructure and Properties of Laser Clad Coatings Studied by Orientation Imaging Microscopy. Acta Mater. 2010, 58, 6763–6772. [Google Scholar] [CrossRef]
  17. Rozmus-Górnikowska, M.; Cieniek, L.; Blicharski, M.; Kusiński, J. Microstructure and Microsegregation of an Inconel 625 Weld Overlay Produced on Steel Pipes by the Cold Metal Transfer Technique. Arch. Metall. Mater. 2014, 59, 1081–1084. [Google Scholar] [CrossRef] [Green Version]
  18. Alexandrov, B.T.; Lippold, J.C.; Sowards, J.W.; Hope, A.T.; Saltzmann, D.R. Fusion Boundary Microstructure Evolution Associated with Embrittlement of Ni-Base Alloy Overlays Applied to Carbon Steel. Weld. World 2013, 57, 39–53. [Google Scholar] [CrossRef]
  19. Soysal, T.; Kou, S.; Tat, D.; Pasang, T. Macrosegregation in Dissimilar-Metal Fusion Welding. Acta Mater. 2016, 110, 149–160. [Google Scholar] [CrossRef]
  20. Rowe, M.D.; Nelson, T.W.; Lippold, J.C. Hydrogen-Induced Cracking along the Fusion Boundary of Dissimilar Metal Welds. Weld. Res. Suppl. 1999, 1, 31–37. [Google Scholar]
  21. Fenske, J.A.; Robertson, I.M.; Ayer, R.; Hukle, M.; Lillig, D.A.N.; Newbury, B. Microstructure and Hydrogen-Induced Failure Mechanisms in Fe and Ni Alloy Weldments. Metall. Mater. Trans. A 2012, 43, 3011–3022. [Google Scholar] [CrossRef]
  22. Wu, Y. Hydrogen Related Disbonding of Weld Overlay of Corrosion Resistant Alloys. Ph.D. Thesis, University of Alberta, Edmonton, AB, Canada, 1993. [Google Scholar] [CrossRef]
  23. Nelson, T.W.; Lippold, J.C.; Mills, M.J. Investigation of Boundaries and Structures in Dissimilar Metal Welds. Sci. Technol. Weld. Join. 1998, 3, 249–255. [Google Scholar] [CrossRef]
  24. Nelson, B.Y.T.W.; Lippold, J.C.; Mills, M.J. Nature and Evolution of the Fusion Boundary in Ferritic-Austenitic Dissimilar Weld Metals, Part 1—Nucleation and Growth. Weld. J. 1999, 2, 237–243. [Google Scholar]
  25. Nelson, B.Y.T.W.; Lippold, J.C.; Mills, M.J. Nature and Evolution of the Fusion Boundary in Ferritic-Austenitic Dissimilar Metal Welds—Part 2: On-Cooling Trans. Weld. J. 2000, 5, 267–277. [Google Scholar]
  26. Dong, L.; Peng, Q.; Xue, H.; Han, E.-H.; Ke, W.; Wang, L. Correlation of microstructure and stress corrosion cracking initiation behaviour of the fusion boundary region in a SA508 Cl. 3-Alloy 52M dissimilar weld joint in primary pressurized water reactor environment. Corros. Sci. 2018, 132, 9–20. [Google Scholar] [CrossRef]
  27. Wu, Y.; Cai, Y.; Sun, D.; Zhu, J.; Wu, Y. Microstructure and Properties of High-Power Laser Welding of SUS304 to SA553 for Cryogenic Applications. J. Mater. Process. Technol. 2015, 225, 56–66. [Google Scholar] [CrossRef]
  28. Hielscher, R.; Schaeben, H. A novel pole figure inversion method: Specification of the MTEX algorithm. J. Appl. Cryst. 2008, 41, 1024–1037. [Google Scholar] [CrossRef]
  29. Nyyssönen, T. Quenching and Partitioning of High-Aluminum Steels. Ph.D. Thesis, Tampere University of Technology, Tampere, Finland, 2017. [Google Scholar]
  30. Gu, X.F.; Furuhara, T.; Zhang, W.Z. PTCLab: Free and Open-Source Software for Calculating Phase Transformation Crystallography. J. Appl. Crystallogr. 2016, 49, 1099–1106. [Google Scholar] [CrossRef]
  31. Banovic, S.W.; Dupont, J.N.; Marder, A.R. Dilution and Microsegregation in Dissimilar Metal Welds between Super Austenitic Stainless Steel and Nickel Base Alloys. Sci. Technol. Weld. Join. 2002, 7, 374–383. [Google Scholar] [CrossRef]
  32. Yang, Y.K.; Kou, S. Macrosegregation Mechanisms in Arc Welds Made with Dissimilar Filler Metals. Sci. Technol. Weld. Join. 2010, 15, 15–31. [Google Scholar] [CrossRef]
  33. Perricone, M.J.; Dupont, J.N. Effect of Composition on the Solidification Behavior of Several Ni-Cr-Mo and Fe-Ni-Cr-Mo Alloys. Metall. Mater. Trans. A 2006, 37, 1267–1280. [Google Scholar] [CrossRef]
  34. Dupont, J.N. Solidification of an Alloy 625 Weld Overlay. Metall. Mater. Trans. A 1996, 27, 3612–3620. [Google Scholar] [CrossRef]
  35. Frei, J.; Alexandrov, B.T.; Rethmeier, M. Low Heat Input Gas Metal Arc Welding for Dissimilar Metal Weld Overlays Part II: The Transition Zone. Weld. World 2018, 62, 317–324. [Google Scholar] [CrossRef]
  36. Chen, Z.R.; Lu, Y.H. TEM Observation of Martensite Layer at the Weld Interface of an A508III to Inconel 82 Dissimilar Metal Weld Joint. Metall. Mater. Trans. A 2015, 46, 5494–5498. [Google Scholar] [CrossRef]
  37. Barrick, E.J.; Jain, D.; Dupont, J.N.; Seidman, D.N. Effects of Heating and Cooling Rates on Phase Transformations in 10 Wt Pct Ni Steel and Their Application to Gas Tungsten Arc Welding. Metall. Mater. Trans. A 2017, 48, 5890–5910. [Google Scholar] [CrossRef]
  38. Filho, J.d.C.P. Improvement of Welding Techniques and Heat Treatments of 9%Ni Steel; Technical Report for Shell Brasil Ltda.: Rio de Janeiro, RJ, Brazil, September 2018. [Google Scholar]
  39. Silva, C.C.; de Albuquerque, V.H.C.; Miná, E.M.; Moura, E.P.; Tavares, J.M.R.S. Mechanical Properties and Microstructural Characterization of Aged Nickel-Based Alloy 625 Weld Metal. Metall. Mater. Trans. A 2018, 49, 1653–1673. [Google Scholar] [CrossRef]
  40. Solecka, M.; Kopia, A.; Radziszewska, A.; Rutkowski, B. Microstructure, Microsegregation and Nanohardness of CMT Clad Layers of Ni-Base Alloy on 16Mo3 Steel. J. Alloys Compd. 2018, 751, 86–95. [Google Scholar] [CrossRef]
  41. Böllinghaus, T.; Herold, H. Hot Cracking Phenomena in Welds, 1st ed.; Springer: Berlin/Heidelberg, Germany, 2004; pp. 141–164. ISBN 3-540-22332-0. [Google Scholar]
  42. Wu, Y.; Cai, Y.; Wang, H.; Shi, S.; Hua, X.; Wu, Y. Investigation on Microstructure and Properties of Dissimilar Joint between SA553 and SUS304 Made by Laser Welding with Filler Wire. Mater. Des. 2015, 87, 567–578. [Google Scholar] [CrossRef]
  43. Crocker, A.G. The Phenomenological Theories of Martensite Crystallography. J. Phys. Colloq. 1982, 43, 209–214. [Google Scholar] [CrossRef]
  44. Wayman, C.M. The Phenomenological Theory of Martensite Crystallography: Interrelationships. Metall. Mater. Trans. A 1994, 25, 1787–1795. [Google Scholar] [CrossRef]
  45. Kinney, C.C.; Pytlewski, K.R.; Khachaturyan, A.G.; Junior, J.W.M. The Microstructure of Lath Martensite in Quenched 9Ni Steel. Acta Mater. 2014, 69, 372–385. [Google Scholar] [CrossRef]
  46. Kitahara, H.; Ueji, R.; Tsuji, N.; Minamino, Y. Crystallographic Features of Lath Martensite in Low-Carbon Steel. Acta Mater. 2006, 54, 1279–1288. [Google Scholar] [CrossRef]
  47. Mas, F.; Tassin, C.; Roch, F.; Yescas, M.; Todeschini, P.; Bréchet, Y. Growth Morphologies and Primary Solidification Modes in a Dissimilar Weld between a Low-Alloy. Metals 2018, 8, 284. [Google Scholar] [CrossRef]
  48. Kim, J.; Lee, H. Effect of Welding Heat Input on Microstructure and Texture of Inconel 625 Weld Overlay Studied Using the Electron Backscatter Diffraction Method. Metall. Mater. Trans. A 2016, 47, 6109–6120. [Google Scholar] [CrossRef]
  49. Moat, R.J.; Pinkerton, A.J.; Li, L.; Withers, P.J.; Preuss, M. Crystallographic Texture and Microstructure of Pulsed Diode Laser-Deposited Waspaloy. Acta Mater. 2009, 57, 1220–1229. [Google Scholar] [CrossRef]
  50. He, Q.; Yang, Y. On Lattice Distortion in High Entropy Alloys. Front. Mater. 2018, 5, 1–8. [Google Scholar] [CrossRef]
  51. Eghlimi, A.; Shamanian, M.; Eskandarian, M.; Zabolian, A.; Nezakat, M.; Szpunar, J.A. Evaluation of Microstructure and Texture across the Welded Interface of Super Duplex Stainless Steel and High Strength Low Alloy Steel. Surf. Coat. Technol. 2015, 264, 150–162. [Google Scholar] [CrossRef]
  52. Shamanian, M.; Eghlimi, A.; Eskandarian, M.; Szpunar, J.A. Interface Microstructure across Cladding of Super Duplex Stainless Steel with Austenitic Stainless Steel Buffer Layer. Surf. Coat. Technol. 2014, 259, 532–542. [Google Scholar] [CrossRef]
  53. Örnek, C.; Engelberg, D.L. Towards understanding the effect of deformation mode on stress corrosion cracking susceptibility of grade 2205 duplex stainless steel. Mater. Sci. Eng. A 2016, 666, 269–279. [Google Scholar] [CrossRef]
  54. Brandon, D.G. The structure of high-angle grain boundaries. Acta Mater. 1966, 14, 1479–1484. [Google Scholar] [CrossRef]
  55. Guo, Y.; Han, E.H.; Wang, J. Effects of Forging and Heat Treatments on the Microstructure and Oxidation Behavior of 316LN Stainless Steel in High Temperature Water. J. Mater. Sci. Technol. 2015, 31, 403–412. [Google Scholar] [CrossRef]
  56. Randle, V. Mechanism of twinning-induced grain boundary engineering in low stacking-fault energy materials. Acta Mater. 1999, 47, 4187–4196. [Google Scholar] [CrossRef]
  57. Kobayashi, S.; Nakamura, M.; Tsurekawa, S.; Watanabe, T. Effect of Grain Boundary Microstructure on Fatigue Crack Propagation in Austenitic Stainless Steel. J. Mater. Sci. 2011, 46, 4254–4260. [Google Scholar] [CrossRef]
  58. Zhou, S.; Ma, G.; Wu, D.; Chai, D.; Lei, M. Ultrasonic Vibration Assisted Laser Welding of Nickel-Based Alloy and Austenite Stainless Steel. J. Manuf. Process. 2018, 31, 759–767. [Google Scholar] [CrossRef]
  59. Durst, K.; Go, M. Finite Element Study for Nanoindentation Measurements on Two-Phase Materials. J. Mater. Res. 2004, 19, 85–93. [Google Scholar] [CrossRef]
  60. Mukherjee, P.; Sarkar, A.; Barat, P.; Jayakumar, T.; Mahadevan, S.; Rai, S.K. Lattice Misfit Measurement in Inconel 625 by X-Ray Diffraction Technique. Int. J. Mod. Phys. B 2008, 22, 3977–3985. [Google Scholar] [CrossRef]
  61. Jang, J.-I.; Ju, J.-B.; Lee, B.-W.; Kwon, D.; Kim, W.-S. Micromechanism of local brittle zone phenomenon in weld heat-affected zones of advanced 9% Ni steel. J. Mater. Sci. Lett. 2001, 20, 2149–2152. [Google Scholar] [CrossRef]
  62. Cao, Y.; Di, H.; Zhang, J.; Zhang, J.; Ma, T.; Misra, R.D.K. An Electron Backscattered Diffraction Study on the Dynamic Recrystallization Behavior of a Nickel—Chromium Alloy (800H) during Hot Deformation. Mater. Sci. Eng. A 2013, 585, 71–85. [Google Scholar] [CrossRef]
  63. Kianezhad, M.; Sajjadi, S.A.; Vafaeenezhad, H. A Numerical Approach to the Prediction of Hardness at Different Points of a Heat-Treated Steel. J. Mater. Eng. Perform. 2015, 24, 1516–1521. [Google Scholar] [CrossRef]
  64. Nambu, S.; Michiuchi, M.; Inoue, J.; Koseki, T. Effect of Interfacial Bonding Strength on Tensile Ductility of Multilayered Steel Composites. Compos. Sci. Technol. 2009, 69, 1936–1941. [Google Scholar] [CrossRef]
  65. De Araújo, A.A.; Bastian, F.L.; Castrodeza, E.M. CTOD-R Curves of the Metal-Clad Interface of API X52 Pipes Cladded with an Inconel 625 Alloy by Welding Overlay. Fatigue Fract. Eng. Mater. Struct. 2016, 39, 1477–1487. [Google Scholar] [CrossRef]
  66. Xie, G.; Luo, Z.; Wang, G.; Li, L.; Wang, G. Interface Characteristic and Properties of Stainless Steel/HSLA Steel Clad Plate by Vacuum Rolling Cladding. Mater. Trans. 2011, 52, 1709–1712. [Google Scholar] [CrossRef] [Green Version]
Figure 1. Schematic representation of 9%Ni steel (ASTM A333 Gr. 8) pipes cladded with one and two layers of Ni-based superalloy 625 (AWS ER NiMoCr-3) (a); microstructure of the pipes observed in the as received state (quenched and tempered) (b); locations of Vickers microhardness (HV0.01) measurements (c); shear test specimen, where a = 3.1 mm (clad I) and 4.7 mm (clad II), t = 25.4 mm, according to ASTM A265-12 (d).
Metals 08 01007 g001aMetals 08 01007 g001b
Figure 2. Optical micrographs of the transition zone of substrate/clad (TZ-S/C): (a) clad (C), grains with boundary type I (BT I), martensite (M) in the heat affected zone (HAZ) of the substrate with coarse grains, and planar growth solidification (PGS); (b) grains with boundary type II (BT II) and dendritic growth solidification (DGS); (c) heat affected zone with martensite (M), peninsula-like macrosegregation (Pe), large and small solidification regions with cellular and planar growth solidification (CGS and PGS, respectively); (d) peninsula-like macrosegregation (Pe) between the first and second layers (1st L and 2nd L, respectively) of clad II.
Metals 08 01007 g002aMetals 08 01007 g002b
Figure 3. Scanning electron microscopy images of the transition zone of substrate/clad (TZ-S/C): (a) overview of the TZ-S/C of clad I, indicating the change from planar growth solidification (PGS) to cellular solidification growth (CSG) and the dendritic-cellular growth separated by white lines; (b) a magnified image of (a) revealing the presence of martensite (M) in the heat affected zone (HAZ) of 9%Ni and precipitates (Pr) in the interdendritic regions; (c) a type II boundary with precipitates (Pr) and the HAZ with lath martensite (M); (d) peninsula-like macrosegregation originating from the molten metal, containing a partially mixed zone (PMZ) at the edges (white ellipse), and the cellular morphology of the grains; (e) the PMZ containing lath martensite in clad I, and the HAZ with martensite (M); (f) the PMZ in clad II with lath martensite (M) and retained austenite (γret), with the HAZ composed of ferrite (α), dispersed carbides (Car), small reverse austenite (γrev) islands, and coarse precipitates (Pr).
Metals 08 01007 g003
Figure 4. Schaeffler diagram shows the formations of martensite and the composite zone (martensite and austenite) in the transition zone of the substrate/clad for high dilutions levels.
Metals 08 01007 g004
Figure 5. Scanning electron micrograph (secondary electron) showing the interdendritic precipitates (MC-type carbides and Laves/γ eutectic) present in the clad (a), energy dispersive spectroscopy (EDS) of point 4 shown in (a,b), and EDS maps of the chemical elements of the precipitates observed in (a,c).
Metals 08 01007 g005aMetals 08 01007 g005b
Figure 6. Scanning electron micrograph (secondary electron) of the transition zone of substrate/clad showing grains with boundary type I (a) and type II (e), variations in the Fe, Mo and Nb contents of these grains with boundary type I (BT I) ((bd), respectively) and grains with boundary type II (BT II) ((fh), respectively). The magnification of 2500×, the voltage in SEM of 20 kV, scale bar, and work distance of 10.9 mm were the same for all images.
Metals 08 01007 g006
Figure 7. Line scan energy dispersive spectroscopy (EDS) of the transition zone of the substrate/clad containing grains with boundary type I (a) and type II (b).
Metals 08 01007 g007
Figure 8. Pole figures of the grains of the heat affected zone of the substrate and the clad near the fusion line: (a) experimentally obtained martensite transformation variants in (100) plane (left), the 24 possible variants obtained based on the Kurdjumov-Sachs relationship (middle), and the clad grain crystallographic orientation (right); (b) same as (a), but in (110) plane; and (c) PF for the grains with boundary type II in (100) plane.
Metals 08 01007 g008
Figure 9. Electron backscatter diffraction maps of the transition zone of the substrate/clad: grains with boundary types I (a) and II (b). Reconstruction of the previous austenite of the coarse grain heat affected zone of the substrate in the region of grains with boundary type I and II, (c) and (d), respectively, by using the Nyyssönen algorithm [29]. Magnification: (a,c) 1000× and (b,d) 1500×. Work distance: (a) 17.7 mm and (b) 17.5 mm.
Metals 08 01007 g009
Figure 10. Inverse pole figures (IPF) of clad I and II—(a,b), respectively—showing columnar grains that are inclined to the transition zone of substrate/clad (TZ-S/C) and extensive heterogeneous nucleation close to the TZ-S/C. IPF coloring is parallel to the axis pipe.
Metals 08 01007 g010
Figure 11. Pole figures for clad layers: (a) clad I, (b) clad II bottom layer, and (c) clad II upper layer.
Metals 08 01007 g011
Figure 12. Distributions of grain size for clad I (C I) and the first and second layers of clad II (1st L C II and 2nd L C II, respectively), as determined by the equivalent radium method.
Metals 08 01007 g012
Figure 13. Thermodynamic simulation of phase fractions present in 9%Ni steel as a function of the temperature (a) and thermodynamic simulation of the solidification, based on the Scheil-Gulliver model, as functions of the dilution levels in the transition zone of substrate/clad (TZ-S/C) (b). The caption of (b) (color fields) indicates the phases present during the solidification of 9%Ni steel and clad for different dilution levels of the partially mixed zone.
Metals 08 01007 g013
Figure 14. Distributions of kernel average neighbor misorientations of the substrate (S) not affected by heat; the heat affected zones (HAZ) of the substrates (S) of clad I and II; clad I; and the first and second layers of clad II (1st L C II and 2nd L C II, respectively).
Metals 08 01007 g014
Figure 15. Relative frequencies of misorientation angles in the substrate, coarse grain heat affected the zones of clad I and clad II (HAZ C I and HAZ C II, respectively), clad I (C I), and the first and second layers of clad II (1st L C II and 2nd L C II, respectively) (a), and relative frequencies of special grain boundaries in the clads, determined by dividing the length fraction of the special grain boundaries by those of the other grain boundaries (b).
Metals 08 01007 g015aMetals 08 01007 g015b
Figure 16. Vickers microhardness maps obtained with 0.01 kgf (HV0.01) in the transition zones of substrate/clad of clads I (a) and II (b): 9%Ni steel pipes cladded with one and two layers of Ni-based superalloy 625 by gas tungsten arc welding with a hot wire, where the values of zero in the axes of the ordinates correspond to the fusion line and the negative values to the substrate.
Metals 08 01007 g016
Table 1. Specified and analyzed chemical compositions of the base and filler metals, and the analyzed chemical compositions of clad I and the second layer of clad II.
Chemical Composition (wt. %)
ElementSubstrateFiller MetalClad *
ASTM A333 Gr. 8AWS ER NiCrMo-3
9%Ni SteelNi-based Superalloy 625
Specified (max.)AnalyzedSpecified (max.)AnalyzedAnalyzed
1st Layer2nd Layer
C0.130.0670.10.0280.0380.031
Mn0.900.6140.50.2340.3260.26
Si0.13–0.320.2710.50.2420.2490.244
P0.0250.0070.020.0010.0020.001
S0.0250.0040.0150.0030.0030.003
Ni8.4–9.69.231>5863.41451.961.6
CuN. A.0.0040.50.0240.0190.023
TiN. A.0.0130.40.2120.1640.198
CrN. A.0.03220–2320.113.516.8
MoN. A.0.0128–109.1117.439.09
FeBalance89.67152.61923.78.56
PbN. A.0.0040.50.0410.0320.038
AlN. A.0.0250.40.0970.0800.092
Nb + TaN. A.0.0043.15–4.143.3752.132.75
Where: N. A. means not applicable. * The chemical composition of clad I is the same as that of the first layer of clad II.
Table 2. Characteristics of a quenched and tempered 9%Ni (ASTM A333 Gr. 8) steel pipe cladded with Ni-based superalloy 625 (AWS ER NiMoCr-3) by using GTAW-HW process.
CharacteristicsSubstrateClad IClad II
External diameter (mm)219.1N. A.N. A.
Thickness (mm)31.71.644.57
Type of pipeSeamless pipeN. A.N. A.
ClassificationASTM A333 Gr. 8AWS ER NiCrMo-3
Commercial name9%Ni steelNi superalloy 625
MicrostructureTempered martensiteColumnar grains
Heat treatmentQuench and temperN. A.N. A.
Dilution (%)N. A.24.26.3
Procedure before weldingISO 8501-1
Post welding inspectionApproved according to ASME code section IX
Where: N. A. means not applicable.
Table 3. Parameters used for overlaying a quenched and tempered 9%Ni steel (ASTM A333 Gr. 8) pipe with Ni-based super alloy 625 (AWS ER NiCrMo-3) by GTAW-HW process.
ParameterClad
III *
Arc welding---
Current type/polarity-CC/directCC/direct
Current intensity (A)background178178
peak260260
Current time (s)background0.30.3
peak0.30.3
Current pulse frequency (Hz)-3.33.3
Voltage (V)-1313
Length (mm)-1.51.5
Hot wire---
Diameter (mm)-1.1131.113
Current type/polarity-CC/directCC/direct
Current intensity (A)-4040
Voltage (V)-12.512.5
Feed speed (m/min)-1.52.5
Stick out (mm)-1.51.5
ElectrodetypeEW-La2EW-La2
diameter (mm)3.23.2
Shielding gastypeargon (99.98%)argon (99.98%)
flow rate (m3/s)3.2 × 10−43.2 × 10−4
Temperature (°C)preheat2525
interlayerN.A.100
Weld passstep (mm)3.53.5
overlap (%)5050
Welding speed (mm/min) **-300300
Heat input (kJ/mm)-0.750.71
Welding position-IGIG
* All the parameters used in clad I were also used in the first layer of the clad II. ** The welding speed was determined by the angular the pipe rotation velocity.
Table 4. The first and second etching methods used to reveal the microstructures of the quenched and tempered 9%Ni steel (ASTM A333 Gr. 8) pipes cladded with Ni-based superalloy 625 (AWS ER NiMoCr-3) as the filler metal by using GTAW-HW.
EtchingMethodSolutionConditionAim
FirstElectrolytic10% by weight of oxalic acid dihydrate (HO2CCO2H·2H2O) with distilled water6 V, 15 s, stainless steel cathode, and substrate painted with enamelTo reveal the clad microstructure
SecondWet chemical2% nitric acid (HNO3) with 98% ethanol (CH3CH2OH)25 sTo reveal the HAZ microstructure
Table 5. Mean Vickers microhardness (HV0.01) of the complete mixed zone (CMZ), transition zone of substrate/clad (TZ-S/C), and coarse grain heat affected zone (CGHAZ) of clad I and II (1st and 2nd layers), as well as the specified (ASTM A265-12) and analyzed shear strengths and the results of bend tests performed on clad I and II (Figure 1).
SamplesVickers Microhardness, HV0.01Shear Strength, τ (MPa)Bend Test
CMZTZ-S/CCGHAZSpecified (min)Analyzed
Clad I257 ± 28291 ± 29326 ± 19140465Approved
Clad II237 ± 38247 ± 14307 ± 25140485Approved

