The Macroscopic Flow direction and Microscopic Distribution of Mg in Sintered Products and Its Influence


School of Metallurgical and Ecological Engineering, University of Science and Technology Beijing, Beijng 100083, China
*
Author to whom correspondence should be addressed.
Metals 2018, 8(12), 1008; https://doi.org/10.3390/met8121008
Submission received: 2 November 2018
/
Revised: 25 November 2018
/
Accepted: 29 November 2018
/
Published: 1 December 2018
(This article belongs to the Special Issue Selected Papers from 8th ICSTI 2018)
Abstract
:Magnesium flux is an indispensable part of sintering materials. Its distribution and reaction behavior have an important influence on the quality of the sinter. Studying the macroscopic flow direction and microscopic distribution of MgO in sintered products is important for guiding the matching of ore for sintering and adjusting sintering technical parameters. The macroscopic flow direction situation of MgO in all sintered products was studied using X-Ray diffractometer and X-Ray fluorescence analyzer. In addition, the microscopic distribution characteristics of Mg element in the main sintered products were studied using scanning electron microscope and energy dispersive spectrometer. The results of this research are as follows. The Mg contents of sintered products are in the following increasing order: sinter ore, sinter internal return ore, and blast furnace return ore. The Mg content of the 1 to 2 mm grain size is the highest in the sinter internal return ore and blast furnace return ore, which is related to the granular distribution of magnesium flux. Moreover, the Mg content of sintered minerals are in the following decreasing order: magnetite; silico-ferrites of calcium and aluminium (SFCA); and silicate and hematite, and the Mg dissolving in the SFCA has a tendency to make the SFCA morphology coarse. The diffusion range of Mg in a large dolomite particle is much narrower, and it mainly stays at the position where the dolomite is located. In the actual sintering process, Mg increases the viscosity of the sintering liquid phase and prevents the oxidation of magnetite, which is not conducive to the improvement of the strength of the sinter.
1. Introduction
Blast furnace ironmaking requires basic slag with excellent metallurgical properties. These properties are necessities for a high-quality, high-yield and low-consumption ironmaking process. Appropriate MgO content in the slag facilitates the improvement of its metallurgical properties [1,2,3,4,5]. In general, the magnesium content in iron ore is too low to meet the demand for blast furnace ironmaking [6]. Therefore, it is necessary to add an extra magnesium source, such as dolomite, to ironmaking materials. Since adding dolomite to the blast furnace will bring a series of adverse effects [7,8,9], magnesium-containing fluxes are usually added during the sintering process. As for the effects of magnesium flux on the sintering process, previous studies have shown that MgO has a negative effect on the strength and reducibility index and a positive effect on the reduction degradation index of the sinter [10,11,12,13,14,15]. It can be seen that the reaction behavior of MgO is closely related to the quality index of sintering production. The distribution of Mg in sintered products can reflect the reaction behavior of Mg in the sintering process, to some extent. Thus, the distribution of Mg in sintered products is worth clarifying. However, there is little to report on the macroscopic flow direction of Mg during the actual sintering process. Moreover, the research on the magnesium microscopic reaction behavior and its influence in the sintering process is mostly limited to high temperature simulation laboratory experiment. Its temperature, atmosphere, and kinetic environment may differ from that of the actual sintering process. As a result, the practical reaction behavior and influence degree of Mg on the actual sintering process are difficult to fully observe. This research aims to clarify the macroscopic flow direction, the microscopic reaction, and distribution characteristics of Mg with actual sintered products. This will lay a foundation for reducing the adverse effect of Mg on the quality index of sintering by regulating the distribution of Mg in sintering. In this research, the macroscopic flow direction of Mg in all sintered products was studied using X-Ray diffractometer (XRD) produced by Rigaku Corporation, Tokyo, Japan and X-Ray fluorescence analyzer (XRF). produced by panalytical B.V., Almelo, The Netherlands, in addition, some microscopic reaction and distribution characteristics of Mg in main sintered products were studied using scanning electron microscope and energy dispersive spectrometer (SEM-EDS) produced by FEI, Hillsboro, OR, United States.
2. Materials and Methods
2.1. Properties of Raw Materials
During the sintering process, the magnesium flux, such as dolomite, is mixed with other sintering materials and granulated. After sintering, the sintered body is crushed and sieved to divide into sinter ore (SI-ore) and sinter internal return ore (return fine, IN-re). The dust formed during crushing is collected using a bag filter to form tail bag ash (TBS). During the process of transporting the sinter ore to the blast furnace, blast furnace return ore (BF-re) will form from its breaking. In addition, some materials will enter the sinter flue gas during sintering and be collected by the first, second, and third sinter electric precipitators to form first, second, and third sinter electrostatic dust (SED1, SED2, and SED3), respectively. The SED1 and TBS are mixed with the sinter mixture again to return them to the sintering process. Meanwhile, SED2 and SED3 were sent to the dump. Therefore, there are seven flow directions of Mg in the sintering process: SI-Ore, IN-re, BF-re, TBS, SED1, SED2, and SED3.
The samples used in the experiment (i.e., SI-Ore, IN-re, BF-re, TBS, SED1, SED2, and SED3) were produced by Meishan Iron & Steel Group in China. The sintering raw materials ratio, chemical composition of mixed mine and dolomite, and the dolomite granular distribution of products from the Meishan Iron & Steel Group are shown in Table 1, Table 2 and Table 3, respectively. The ratio of dolomite in sinter raw materials is 2.76%, which is determined by the difference between the Mg content required for the blast furnace and the Mg content of the ironmaking raw material. The −0.5 mm grain size of dolomite is the greatest, followed by the 1–2 mm grain size.
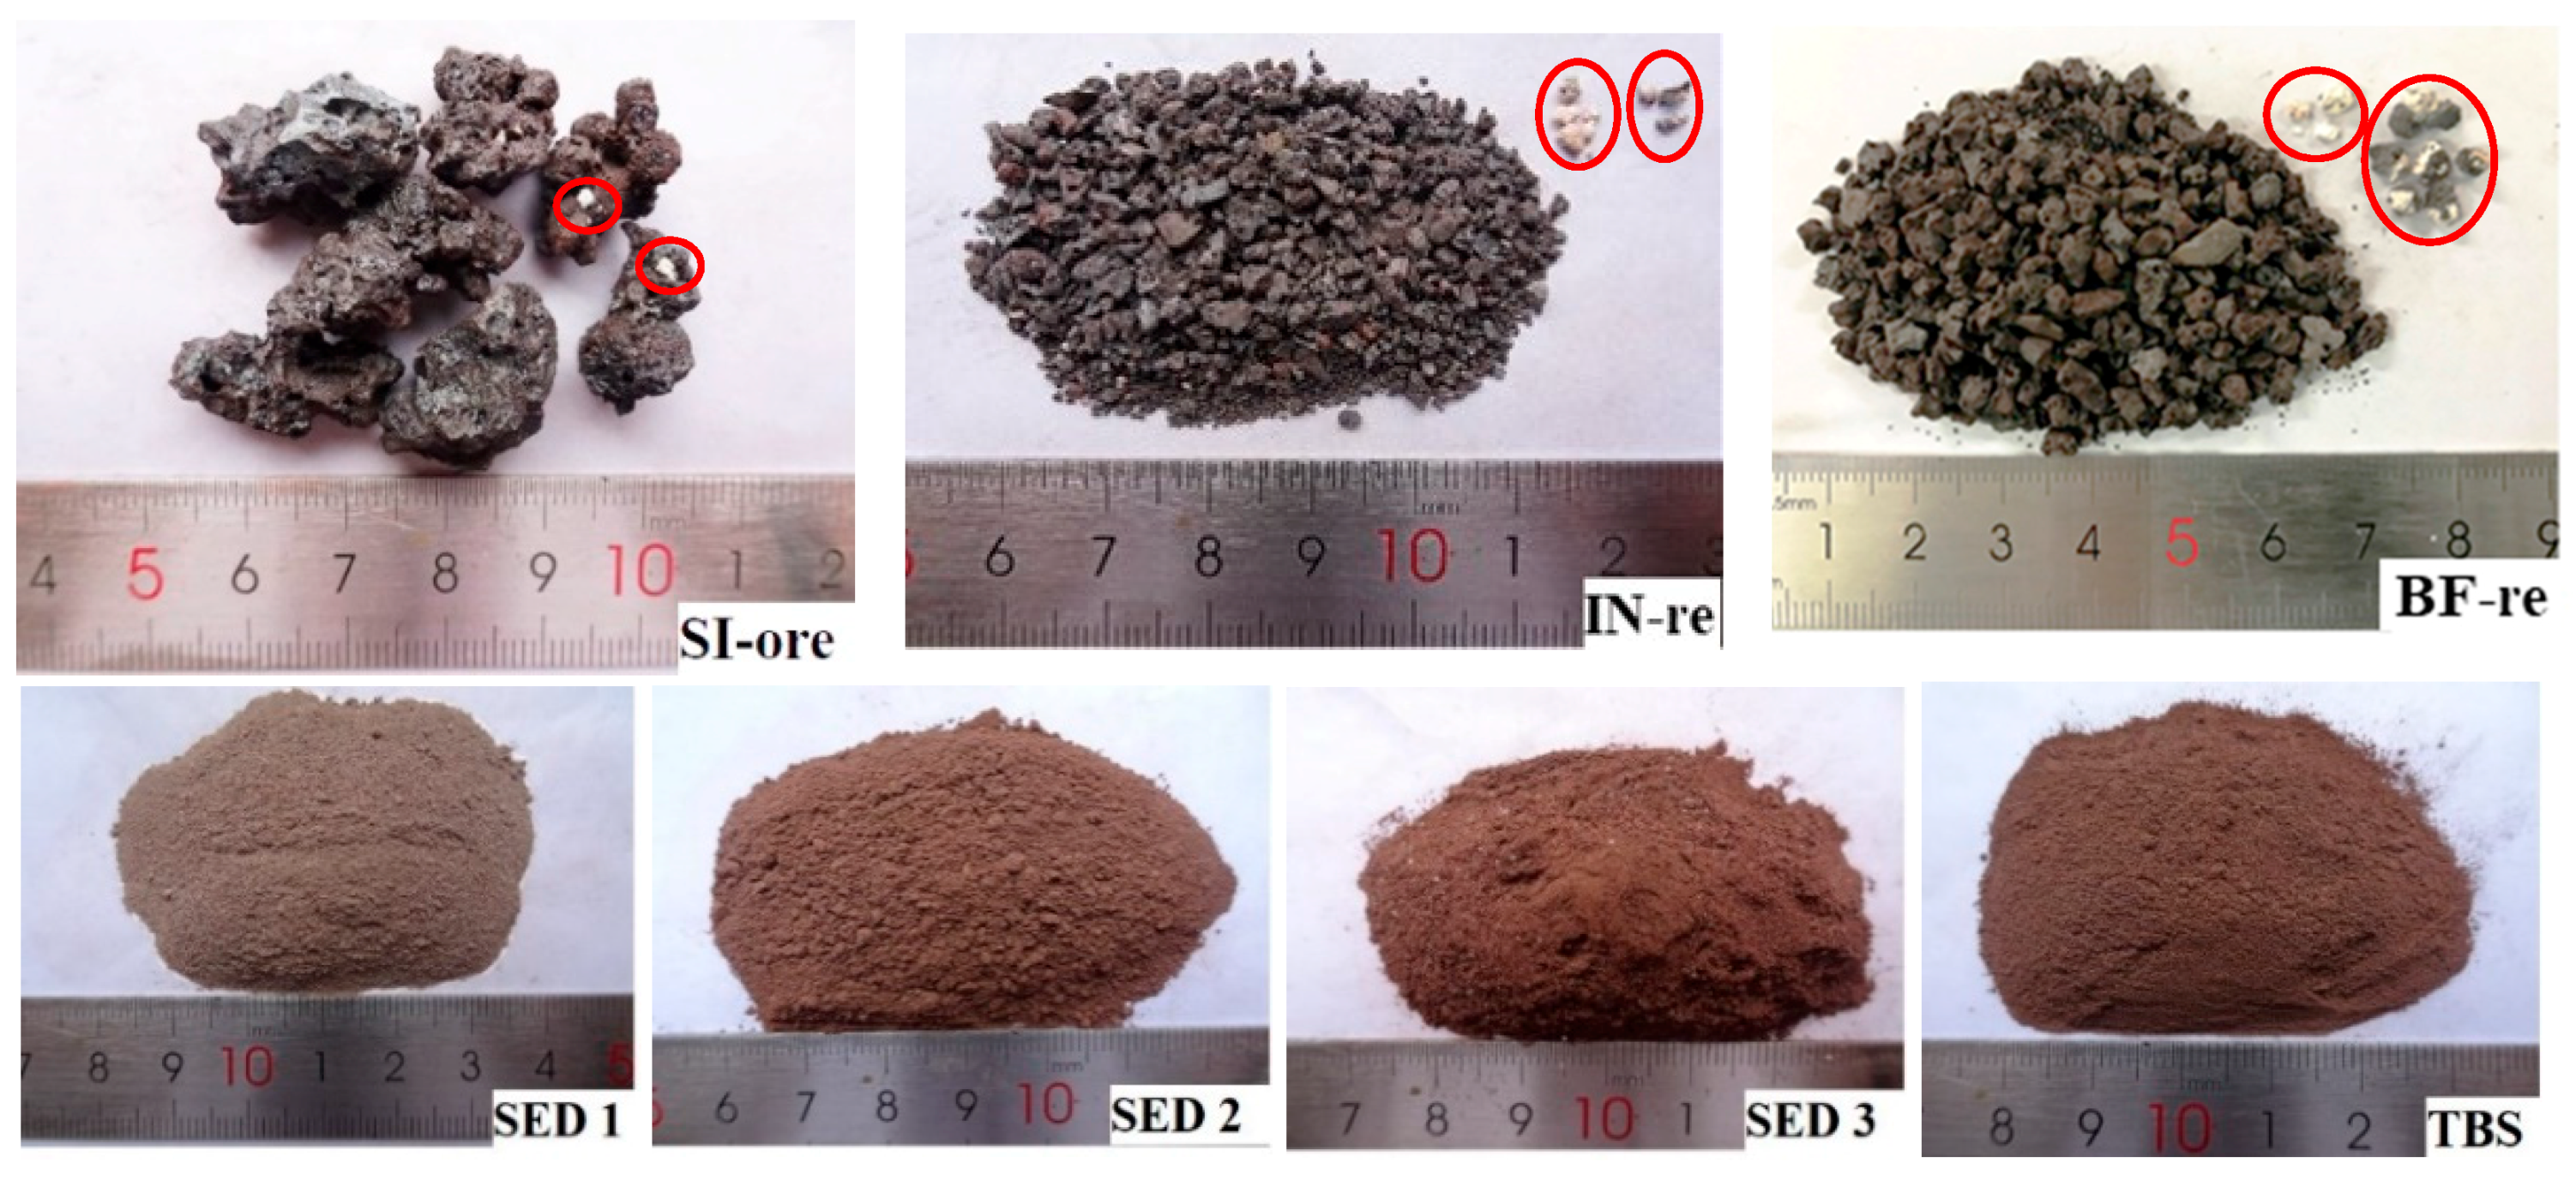
Figure 1 shows the macroscopic morphology of the seven samples. A few white particles were found on surface of some SI-ore samples, as the picture shows. Similarly, a certain number of white particles existed in the IN-re and BF-re samples. While most of the white particles existed in the form of separate particles in IN-re samples, most of the white particles were inlaid on the BF-re samples, as evident in the pictures shown. The mineral phases of white particles in SI-ore, IN-re, and BF-re were detected using XRD. The minerals were mainly calcium oxide and magnesium oxide, which shows that the white particles existing in the main sintered products (i.e., SI-ore, IN-re and BF-re) were dolomite that had undergone an incomplete reaction.
2.2. Experimental Methods
In order to study the macroscopic material flow direction of Mg in all sintered products, the SI-Ore, In-re, and BF-re were sieved into five grain sizes. The SI-Ore was sieved into five grain sizes of 5–10, 10–16, 16–25, 25–40, and +40 mm. The IN-re and BF-re were sieved into five grain sizes of −0.5, 0.5–1, 1–2, 2–3.15, and +3.15 mm. Then, all the grain sizes of SI-ore, In-re, BF-re, and TBS, and three kinds of sinter electrostatic dust were made into a −0.074 mm powder. The mineral phases of each sample was tested using an X-Ray diffractometer, and the MgO content of each sample was tested using an X-Ray fluorescence analyzer. According to the Mg content in each grain size of SI-ore, In-re, and BF-re and the proportion of each grain size, the integral MgO content of SI-ore, In-re and BF-re were calculated. Through comparative analysis, the macroscopic flow direction of Mg in the sintering process was clarified, and attempts were made to analyze the reasons for the flow direction.
In order to study the microscopic reaction and distribution characteristics of Mg in main sintered products, typical SI-ore samples were selected, ground, and polished to make light sheets. The Mg distribution condition in different mineral types of SI-ore were then analyzed using point analysis and surface scanning of EDS. At the same time, we examined the Mg content in silico-ferrites of calcium and aluminium (SFCA) minerals with different crystalline states to recover the relationship between the Mg content and the crystalline state of SFCA. Additionally, surface scanning was performed on the area where the magnesium flux was located to recover the Mg distribution characteristics around dolomite. On the other hand, typical samples of IN-re and BF-re were selected to try to explore, through SEM-EDS, the reasons for the insufficient consolidation strength of IN-re and BF-re from the perspective of Mg distribution characteristics.
3. Results and Discussions
3.1. Mineral Phases of Sintered Products
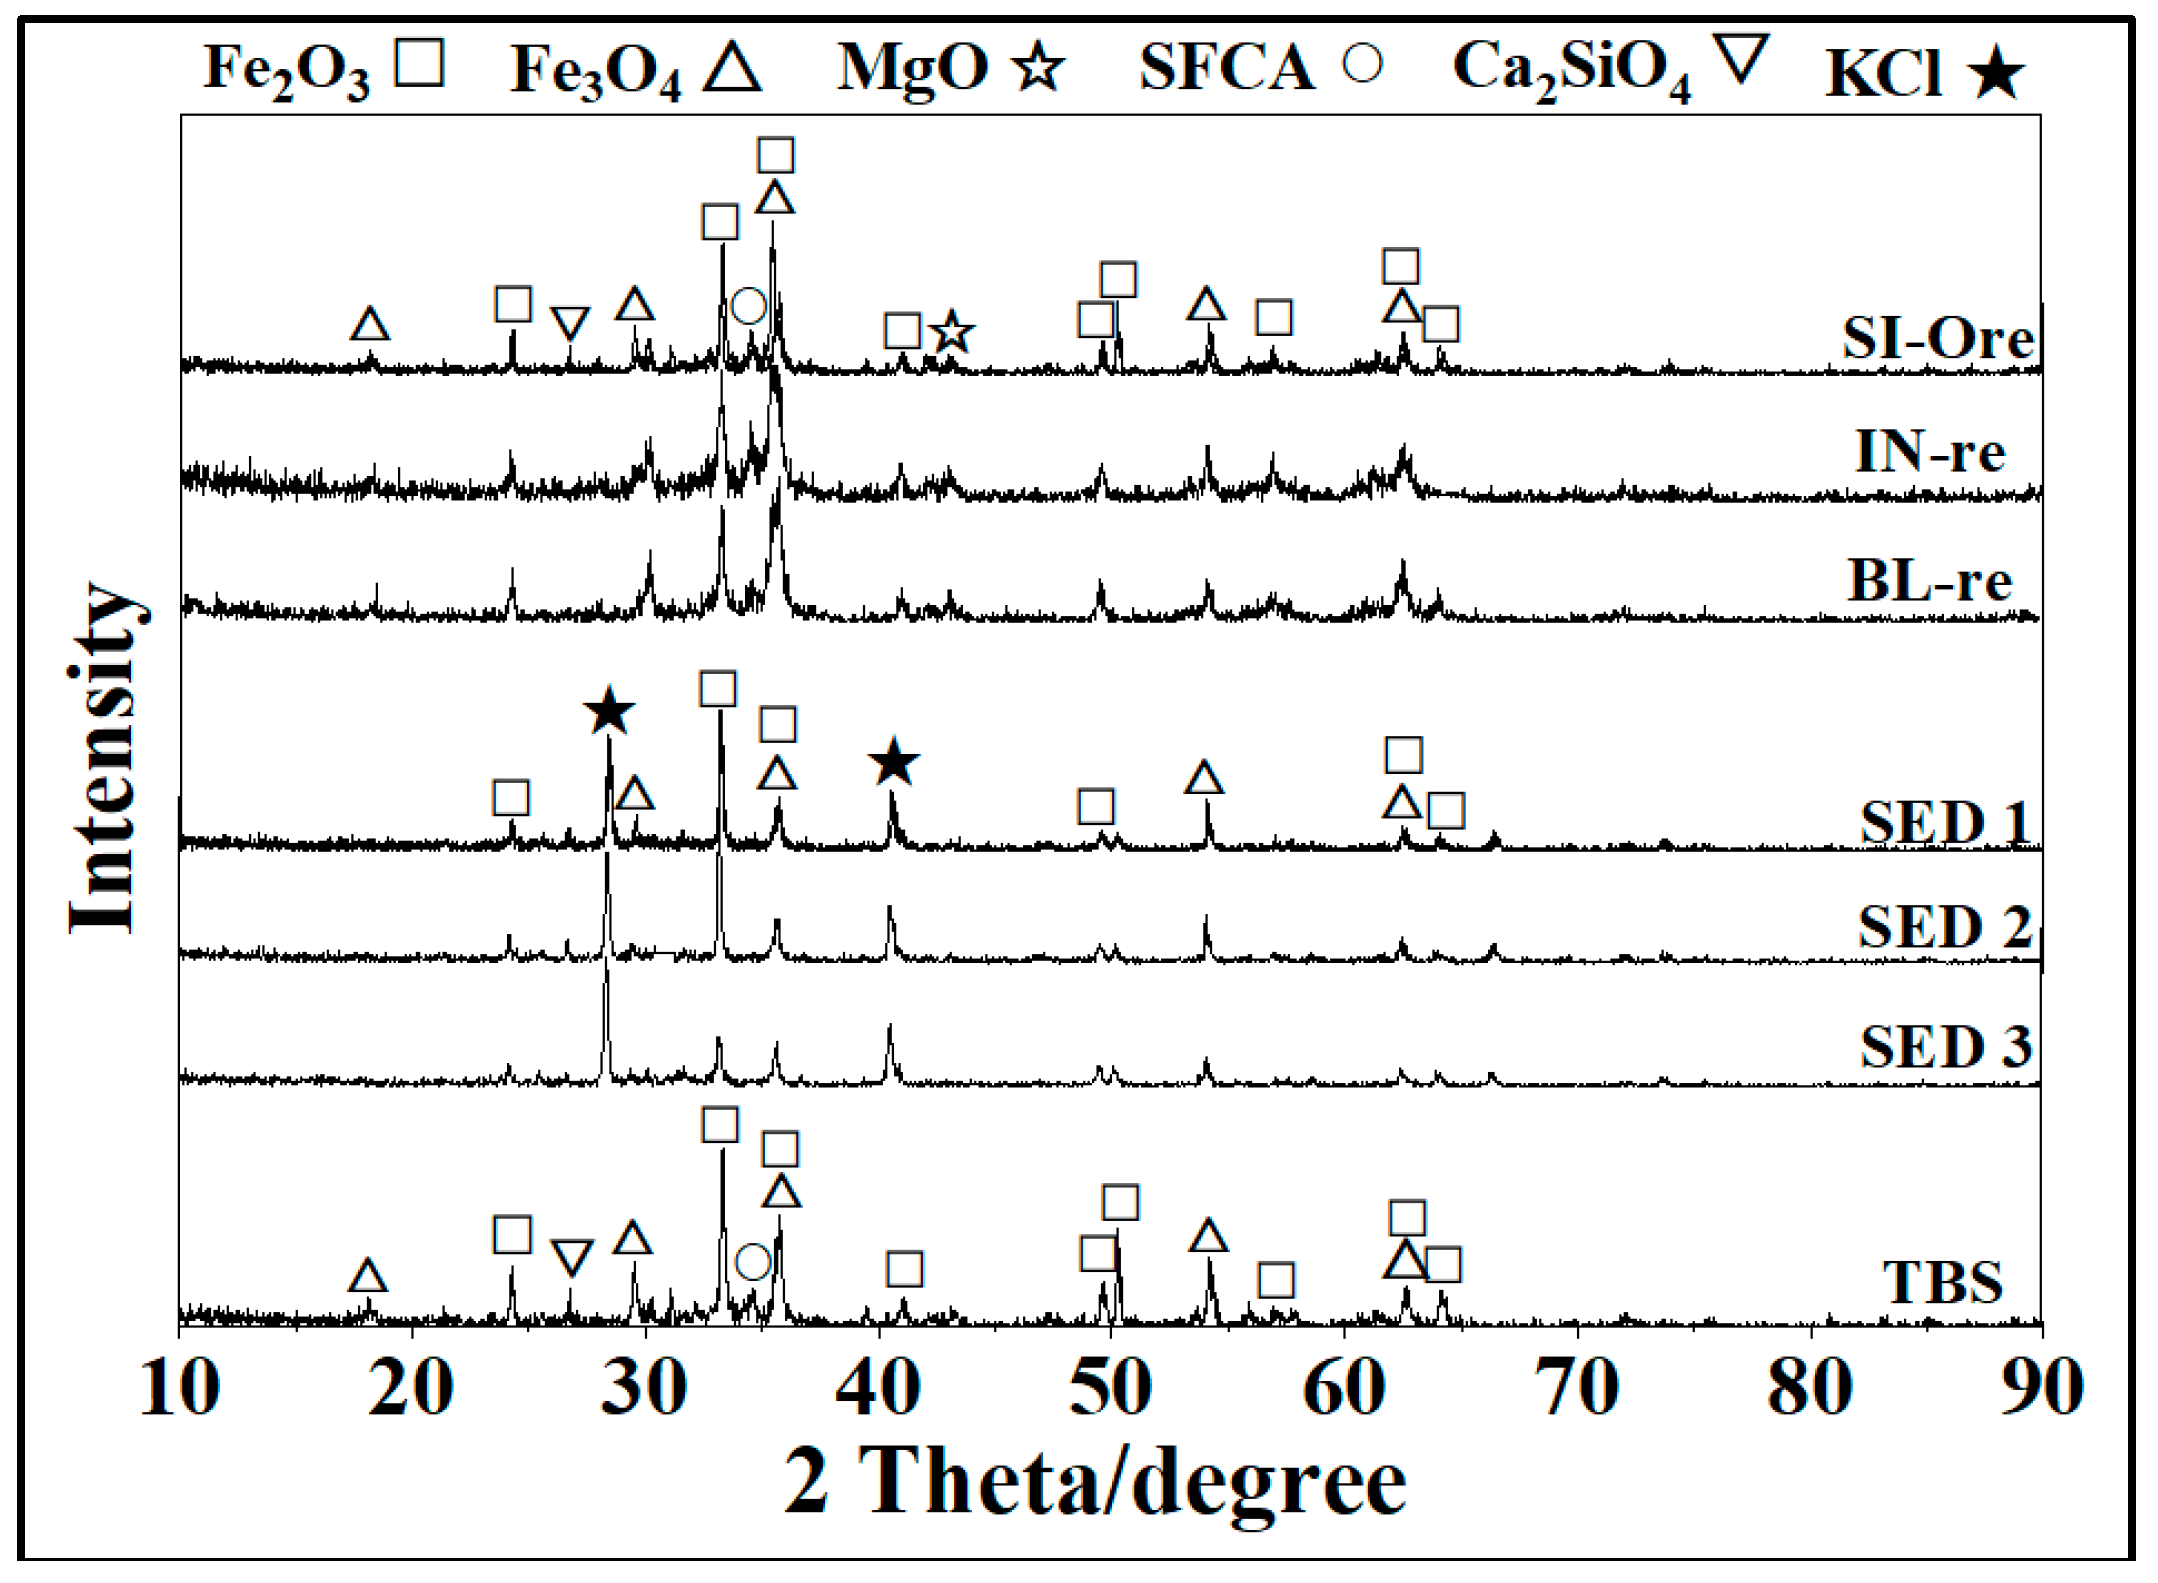
Figure 2 shows the mineral phases of the seven samples tested using XRD. The mineral phases of the SI-ore, IN-re, and BF-re were similar. The main mineral phases were hematite, magnetite, and a certain amount of calcium ferrite. Interestingly, a little of MgO was found, which further supported the existence of unreacted dolomite in the main sintered products. In addition to the hematite and magnetite, the three kinds of sinter electrostatic dust also contained a large amount of potassium chloride. This is because the potassium chloride existing in sintering materials is a low boiling point substance. It will volatilize into sintering flue gas at the sintering temperature and is then captured by the sinter electric precipitators. Therefore, the potassium chloride will mainly exist in sinter electrostatic dust. The potassium chloride content was lowest in SED1, highest in SED3 according to the X-ray diffraction intensity of SED1, SED2, and SED3. Similar to SI-ore, the mineral phases of tail bag ash were mainly hematite and magnetite, and no potassium chloride or MgO was found.
3.2. Macroscopic Flow Direction of Mg
3.2.1. Mg Flow Direction in All Sintered Products
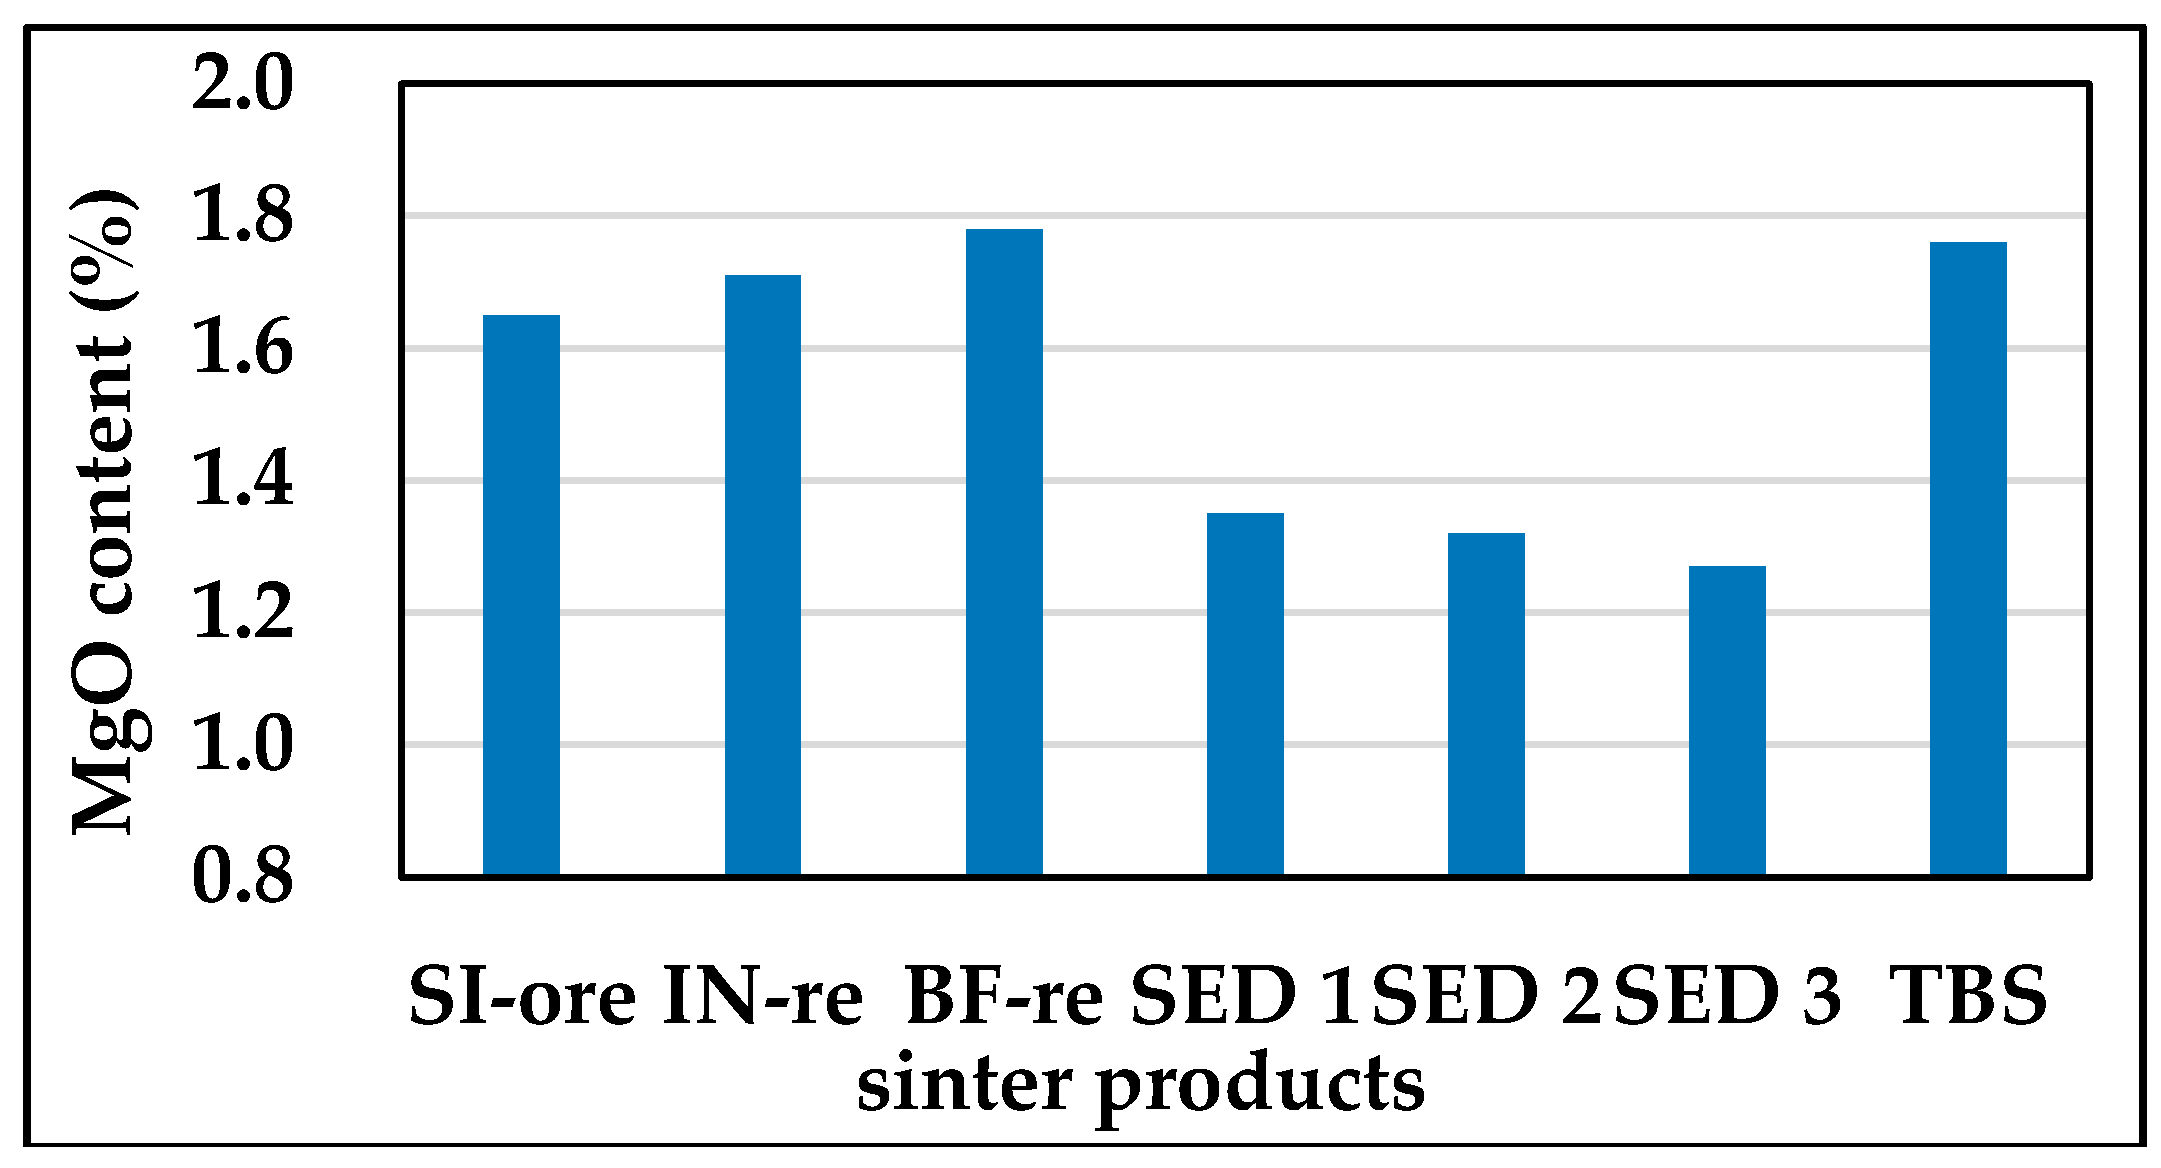
Figure 3 shows the MgO content in different sintered products obtained by XRF. The content of MgO in the SI-ore is slightly lower than that of the IN-re, and BF-re. The content of MgO in SI-ore is 1.65%, and the content of MgO in the IN-re and BF-re is 1.71 and 1.78%. This is 3.64 and 7.88% higher than that of the SI-re, respectively. MgO is detrimental to the consolidation of the sintered body by the liquid phase. On one hand, MgO and its reaction products in the sintering process (e.g., magnesium silicate and magnesia iron peridot) are high-melting point substances which will increase the liquid phase formation temperature to some extent, then reduce liquid phase production [16]. On the other hand, the MgO will increase the viscosity of the liquid phase, which will narrow the bonding range of the sinter liquid phase [17]. Thus, the MgO is not conducive to the effective consolidation of the sintering materials. As a result, the sintered body with high MgO content tends to enter IN-re and BF-re because of its poor consolidation, which leads to a relatively higher MgO content in IN-re and BF-re. The authors tried to analyze the reason why the Mg content of BF-re is higher than that of IN-re. There are two sources of IN-re. One source is the powder produced during the crushing of the sintered body, and the Mg content of IN-re from this source is relatively higher according to the analysis above. Another source is the upper-most layer of the sinter minerals, which enter into the IN-re without selectivity due to the deficiency of heat, and the Mg content of IN-re from this source is at the average MgO level of the sinter minerals. However, the only source of the BF-re is the sintered body with insufficient strength, which means a relatively higher Mg content to some extent. Therefore, the integral MgO content of IN-re composed of two sources is lower than the Mg content of BF-re. At the same time, compared with the existing form of residual dolomite in IN-re and BF-re, the separate dolomite particles existing in IN-re may be derived from the second source, i.e., the uppermost layer of the sinter minerals, in which the dolomite almost does not participate in the sintering reaction due to a deficiency of heat. The SED1, SED2, and SED3 contain much alkali metal [18], such as potassium chloride. Alkali metal selectively entering the sinter electrostatic dust will reduce the percentage of MgO. The content of alkali metal in SED3 is the highest, so the percentage of MgO is the lowest.
3.2.2. Mg Flow Direction in Various Grain Sizes of Main Sintered Products
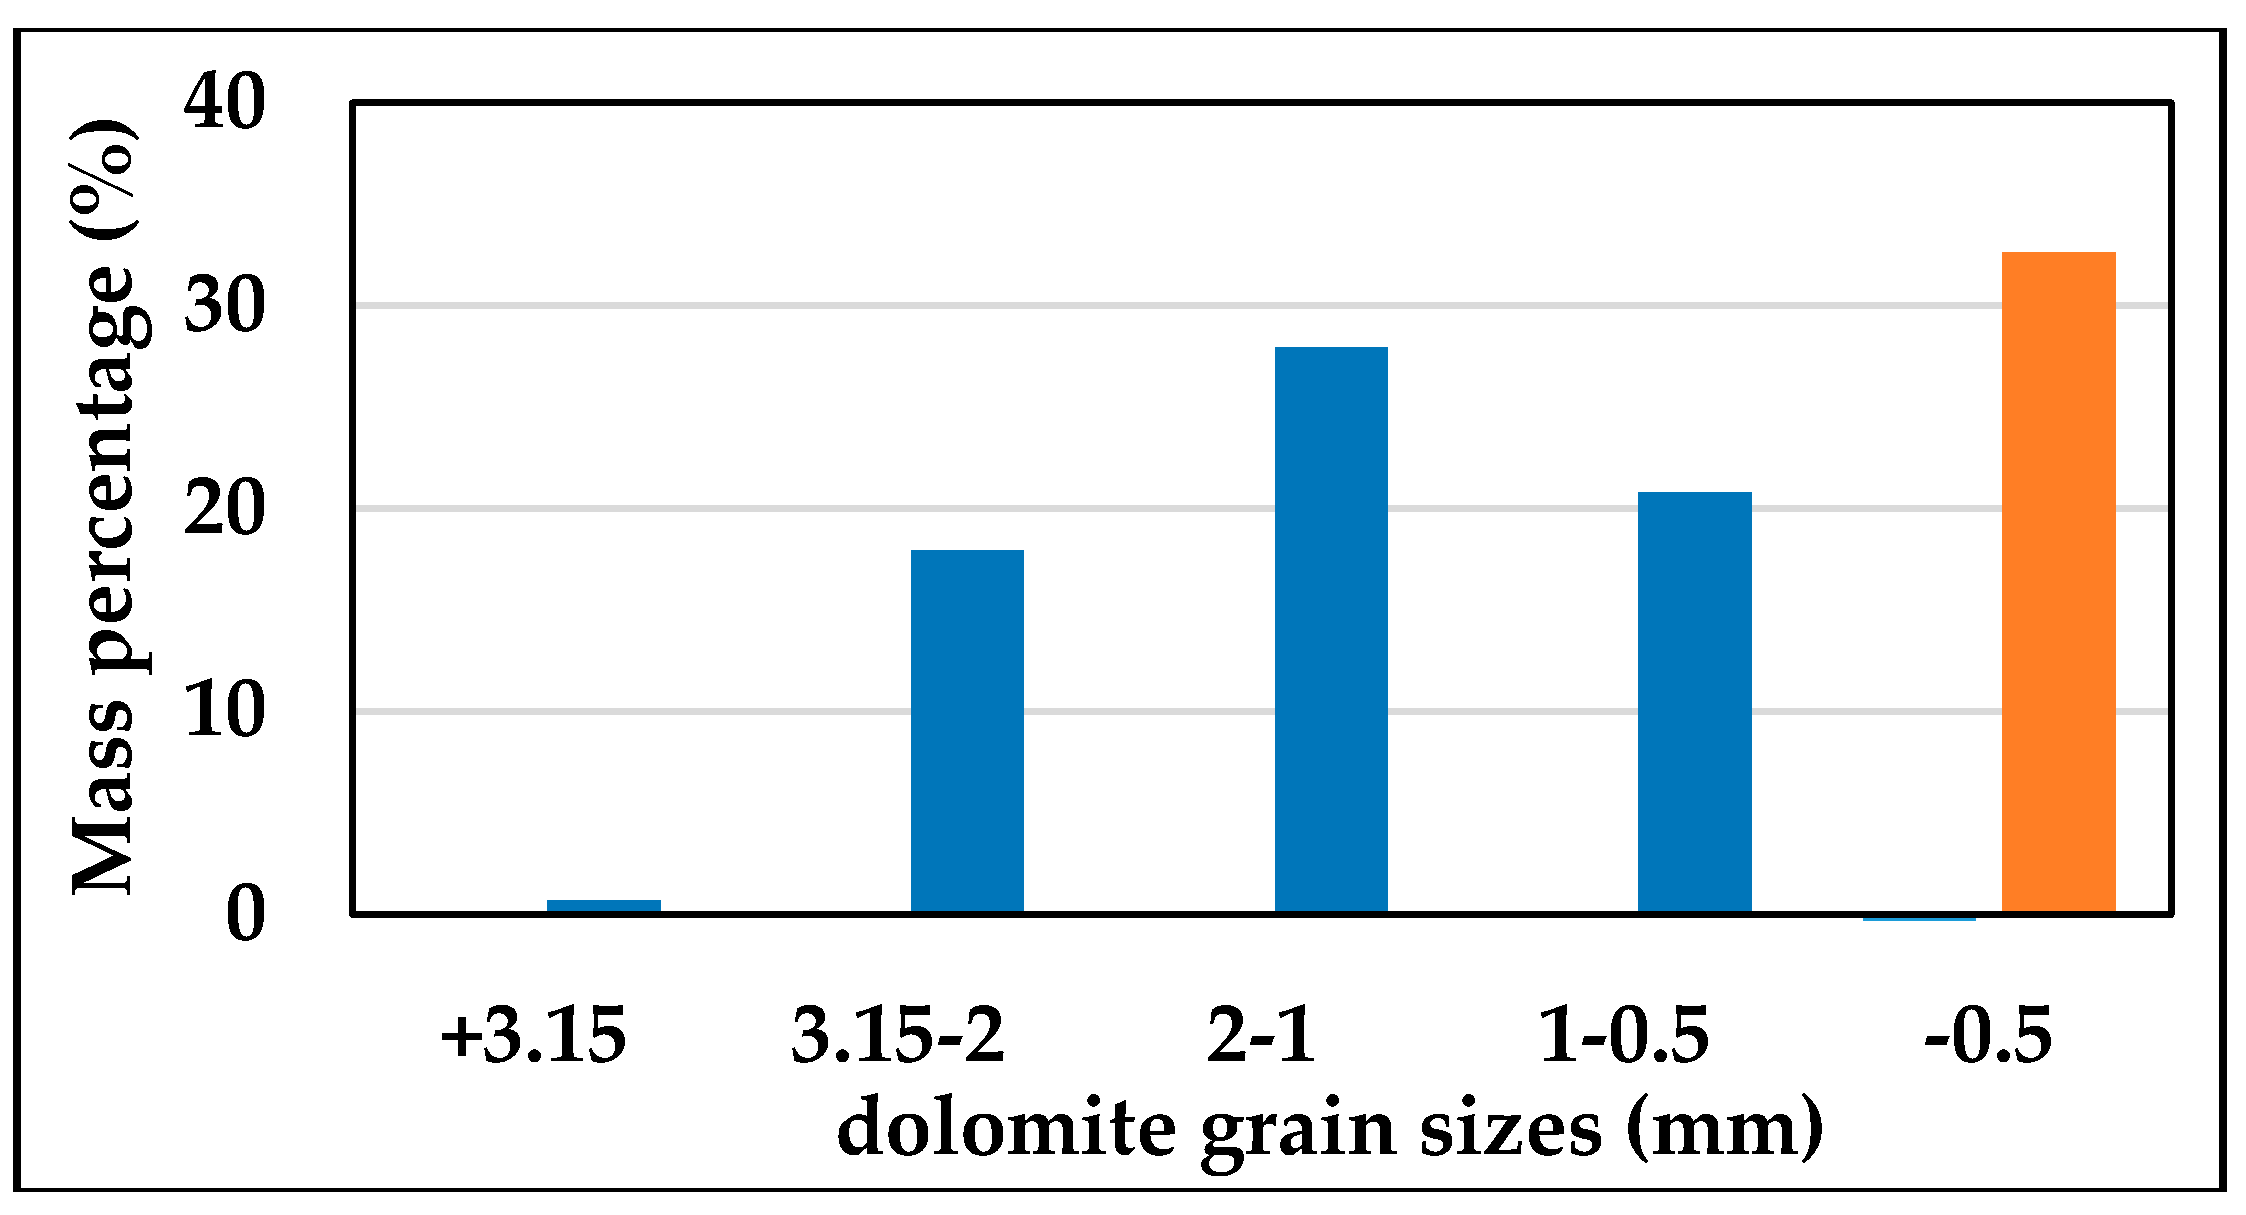
Figure 4 shows the MgO content in different grain sizes of SI-ore, IN-re, and BF-re obtained by XRF. The MgO content in each grain size of SI-ore fluctuates between 1.6 and 1.7%. Interestingly, the Mg content of IN-re and BF-re present the same trend with the granularity. As the grain size increases, the Mg content first rises, then falls and peaks at the grain size of 1 to 2 mm. Coincidentally, the variation of Mg content with IN-re and BF-re granularity is the same as the granular distribution of the dolomite (except for the −0.5 mm grain size). As shown in Figure 5, the granular distribution proportion first rises, then falls with the grain size increasing, and the proportion of 1 to 2 mm grain size is the highest (except for the −0.5 mm grain size). A conjecture is put forward about this coincidence. The mineralization performance of the dolomite is not very ideal, so residual dolomite is inevitable during a relatively short sintering time at high temperature. The more dolomite there is in a certain grain size, the more residual dolomite there is in this grain size in general. Since the residual dolomite cannot be consolidated well, it mostly enters IN-re during crushing or BF-re during transport. As a result, there is a certain correlation between the Mg content in each grain size of IN-re and BF-re and the granular distribution of the dolomite. Under the same reaction conditions, a high proportion of dolomite in the 1 to 2 mm grain size leads to more residual dolomite in this grain size, which results in higher Mg content in the 1 to 2 mm grain size of IN-re and BF-re. Although the dolomite proportion of −0.5 mm grain size is the highest, the residual dolomite in this grain size is relatively less, which is shown by the less MgO content of IN-re and BF-re in this grain size, because of its excellent chemical reaction kinetics conditions. Therefore, the peak value of the Mg content in the IN-re and BF-re and the peak proportion of dolomite granular distribution (except for the −0.5 mm grain size) all coincidentally arise at 1 to 2 mm grain size.
3.3. Microscopic Distribution of Mg
3.3.1. Mg Distribution in Different Minerals
It is well known that the sinter ore is a heterogeneous structure of multiple minerals and, therefore, the Mg distribution may exhibit a segregation in different regions because the content of Mg varies in different minerals. For example, Mg2+ can easily enter the magnetite crystal lattice from gangue or external dolomite at sintering temperature because the ionic radius of Mg2+ and Fe2+ are similar and the valence is the same [19].
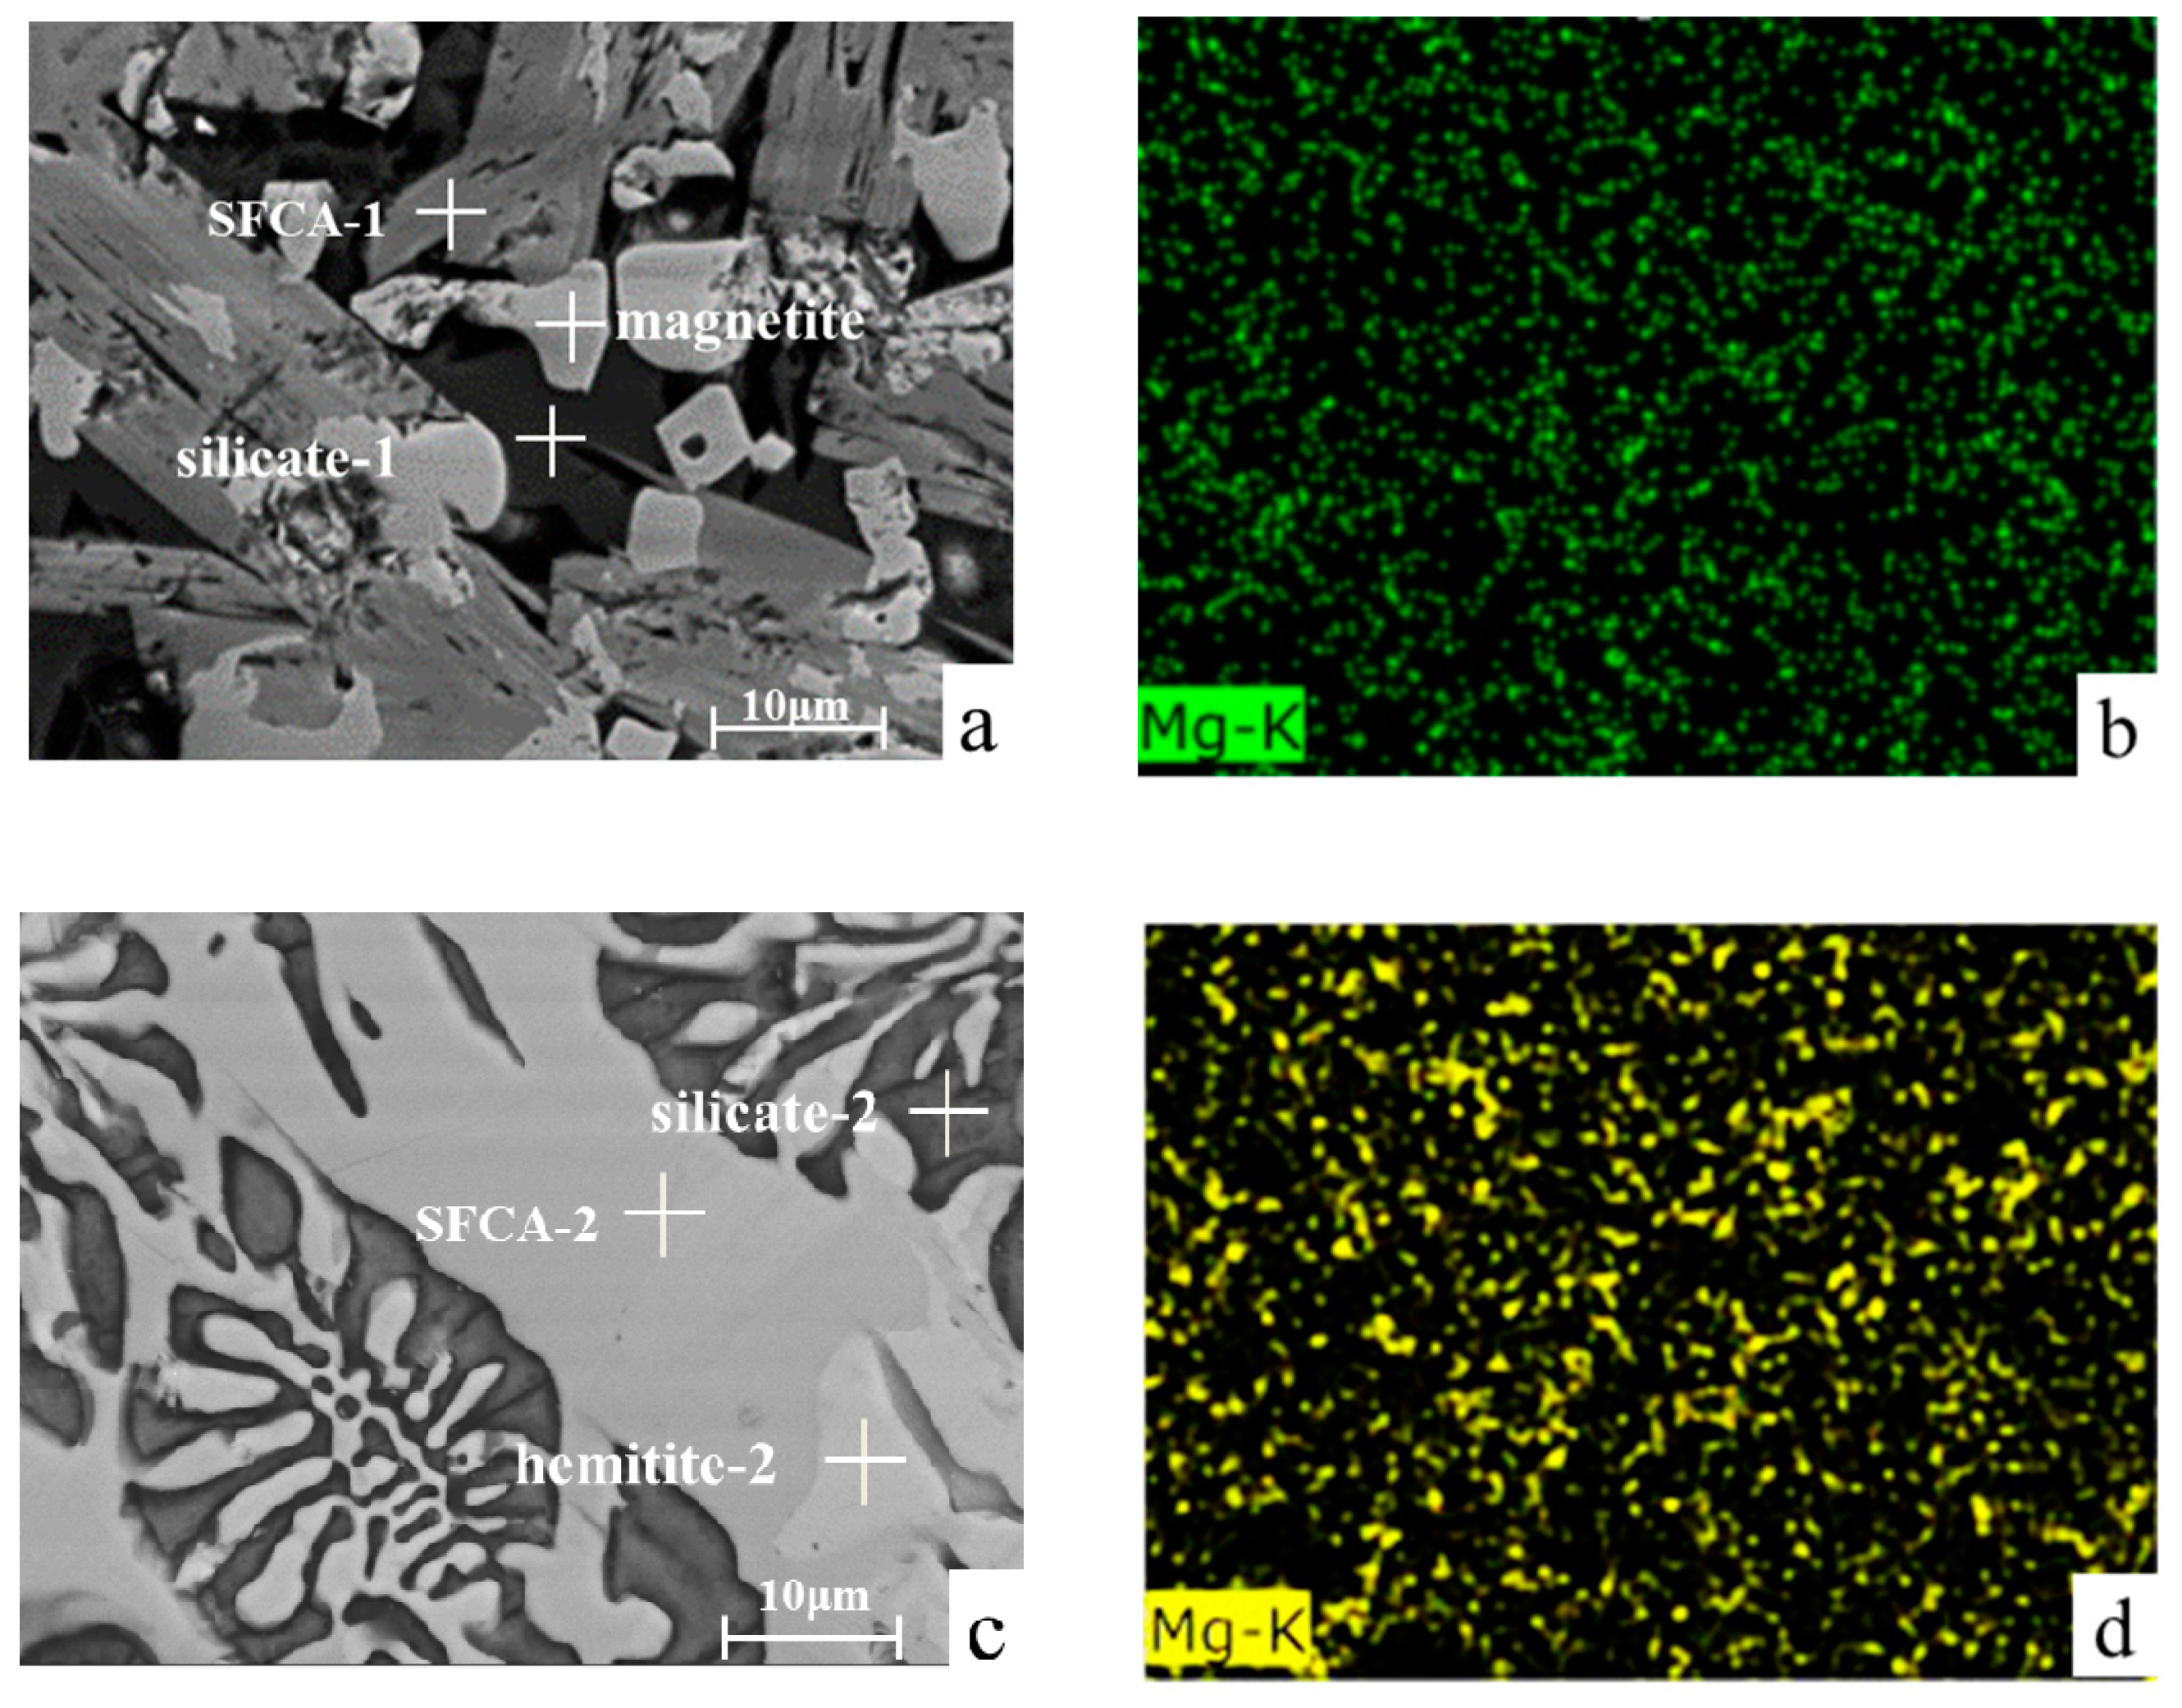
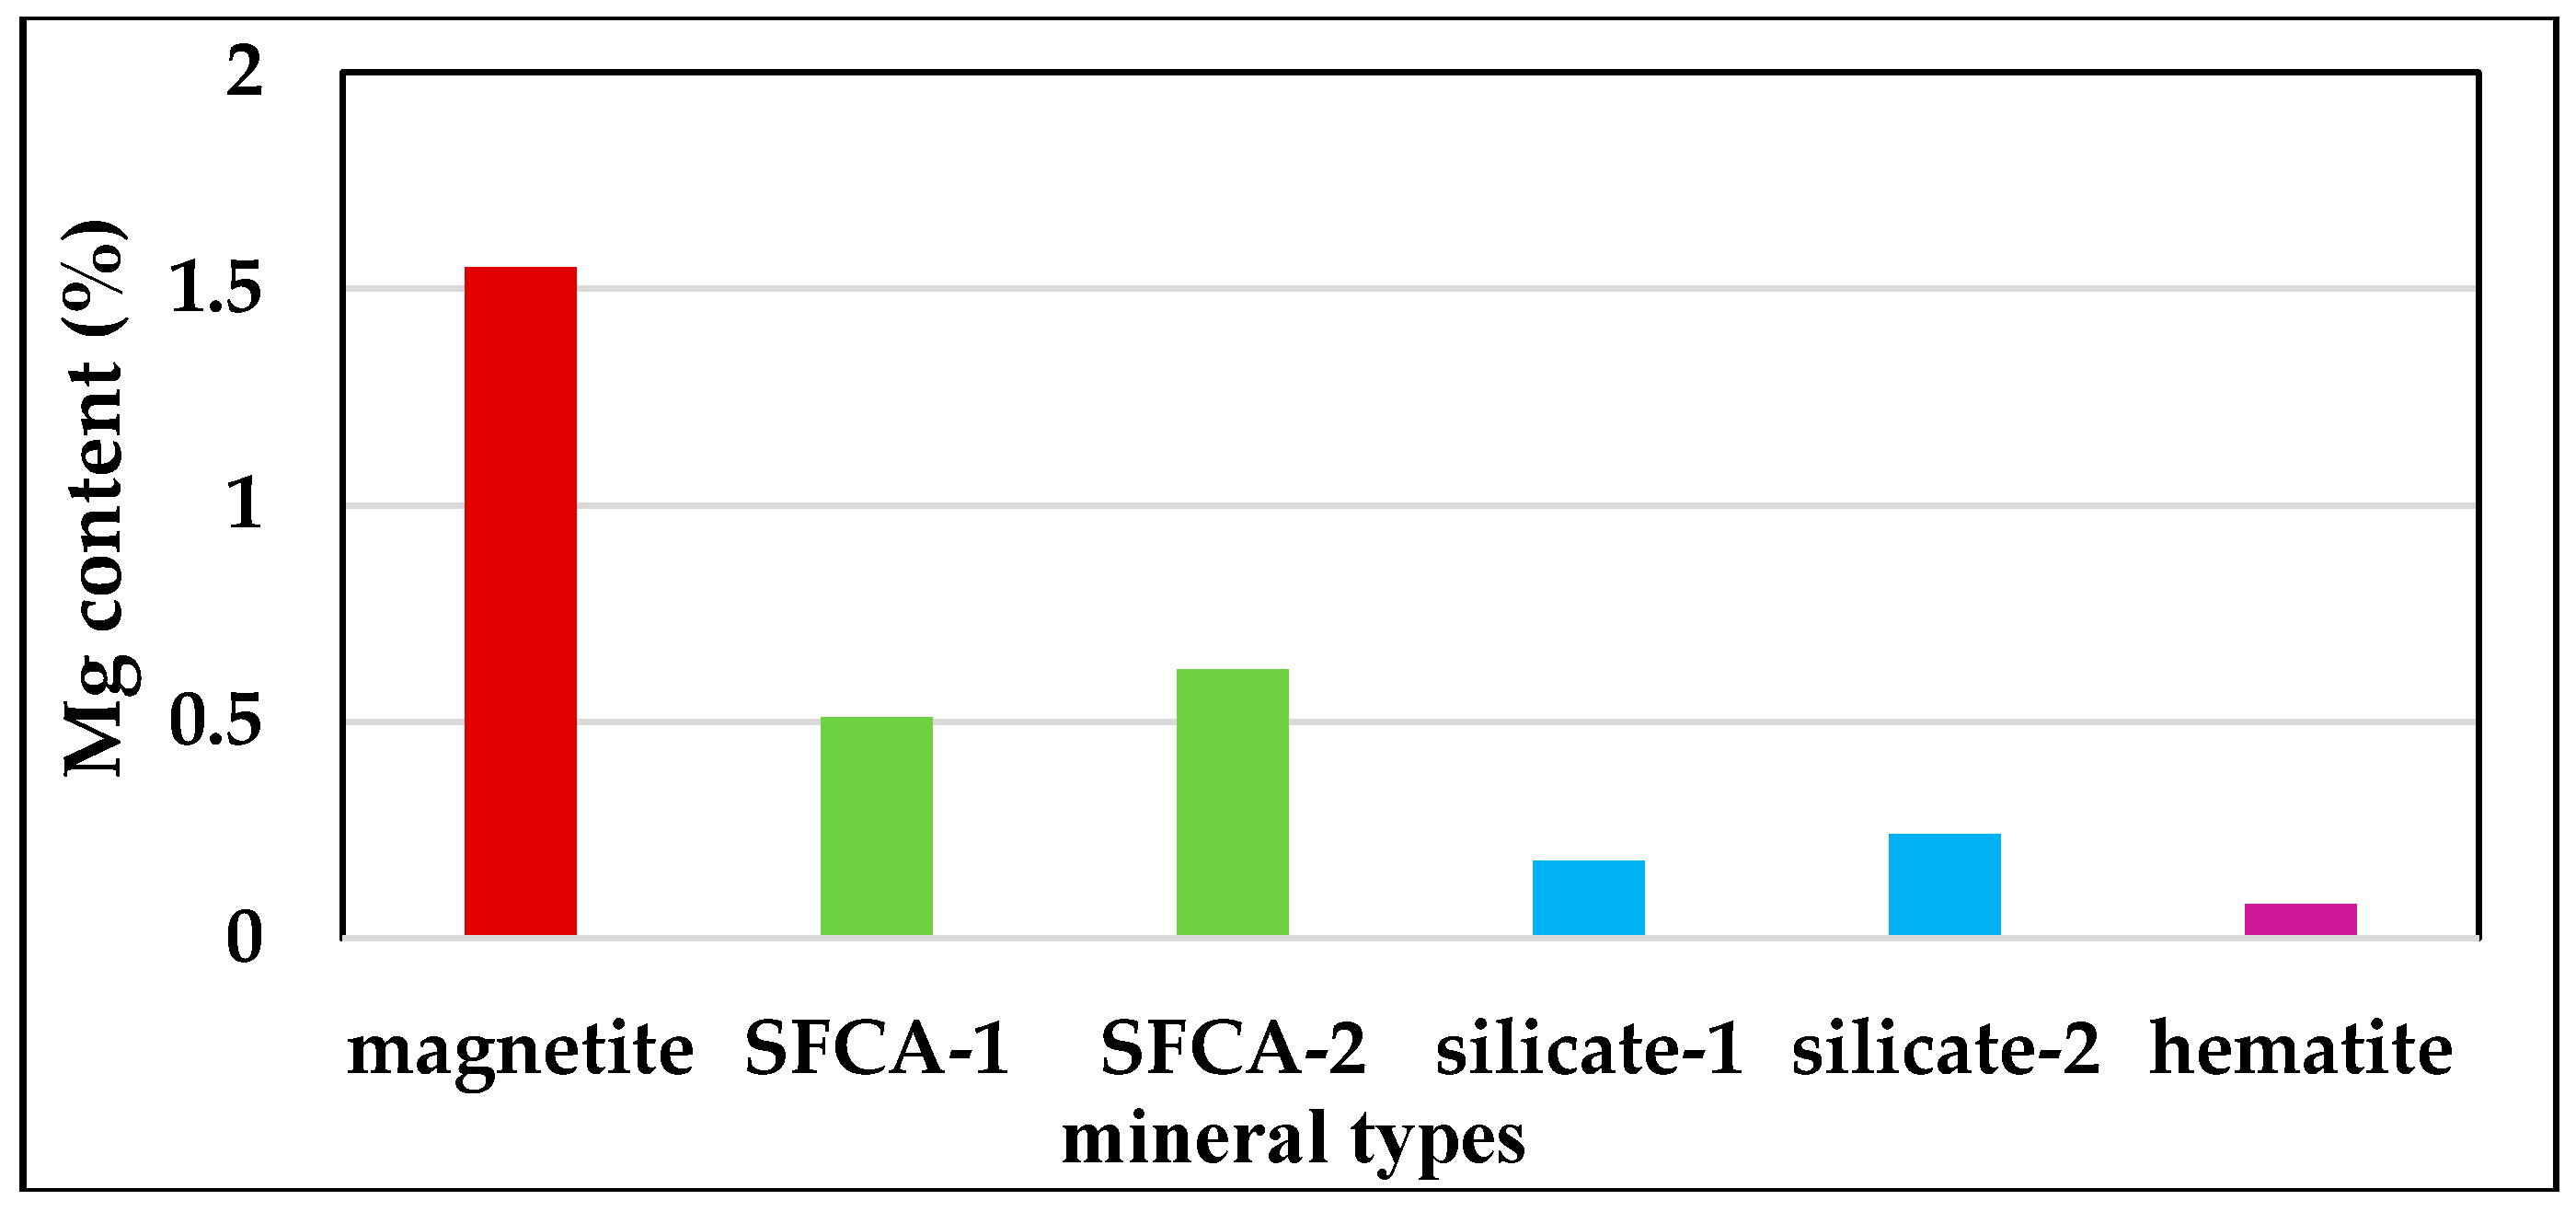
Typical SI-ore samples were selected to study the relationship between Mg content and mineral types through SEM-EDS. Figure 6a,c are the graphs of two different regions of the SI-ore sample obtained using SEM. The two regions are both composed of gray calcium ferrite, black silicate, and white bright iron oxide. According to the dissolution characteristics of Mg ions introduced above, hematite and magnetite can be distinguished by the Mg content in the mineral obtained using EDS. When the Mg content is in a relatively high range, the mineral is magnetite, otherwise it is hematite. Figure 6b,d are the corresponding Mg distribution maps of Figure 6a,c, respectively, obtained by EDS. It can be seen that the distribution of Mg in the sinter ore has an obvious segregation phenomenon that may relate to the different dissolution characteristics of Mg in various minerals. The Mg content of various minerals in Figure 6a,b are shown at Figure 7. Apparently, in the SFCA-iron oxide-silicate structure, the Mg content of sintering minerals are in the following decreasing order: magnetite, SFCA, silicate, and hematite. Meanwhile, in contrasting the Mg content of the same kind of minerals (SFCA or silicate) in two regions, it is evident that the Mg content in Figure 6a is higher than that in Figure 6c whether the mineral is SFCA or silicate. This means that when the Mg content rises in a region, the Mg content of all minerals will show an upward trend. However, the relative order of the Mg content of various minerals in the same region does not change.
3.3.2. Mg Distribution in Different SFCA
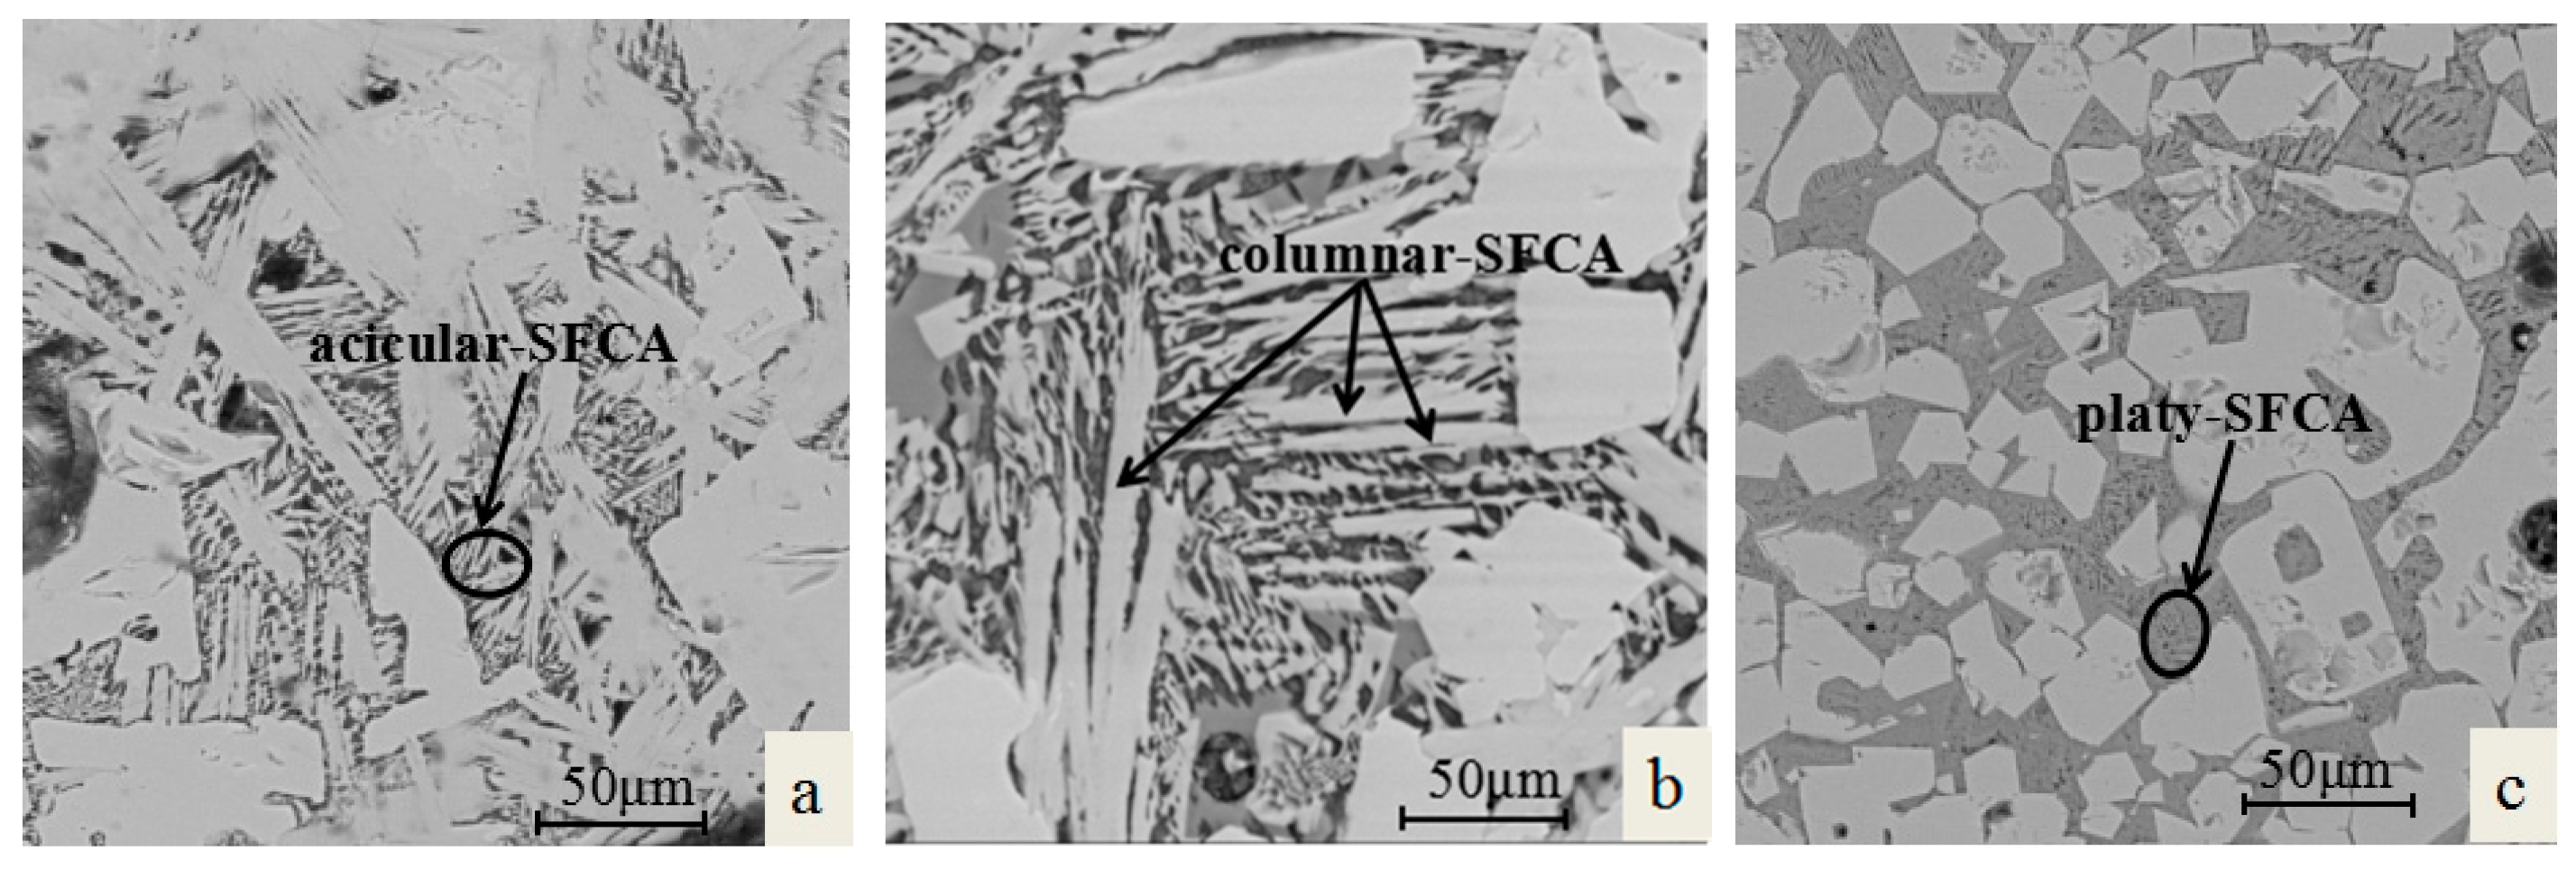
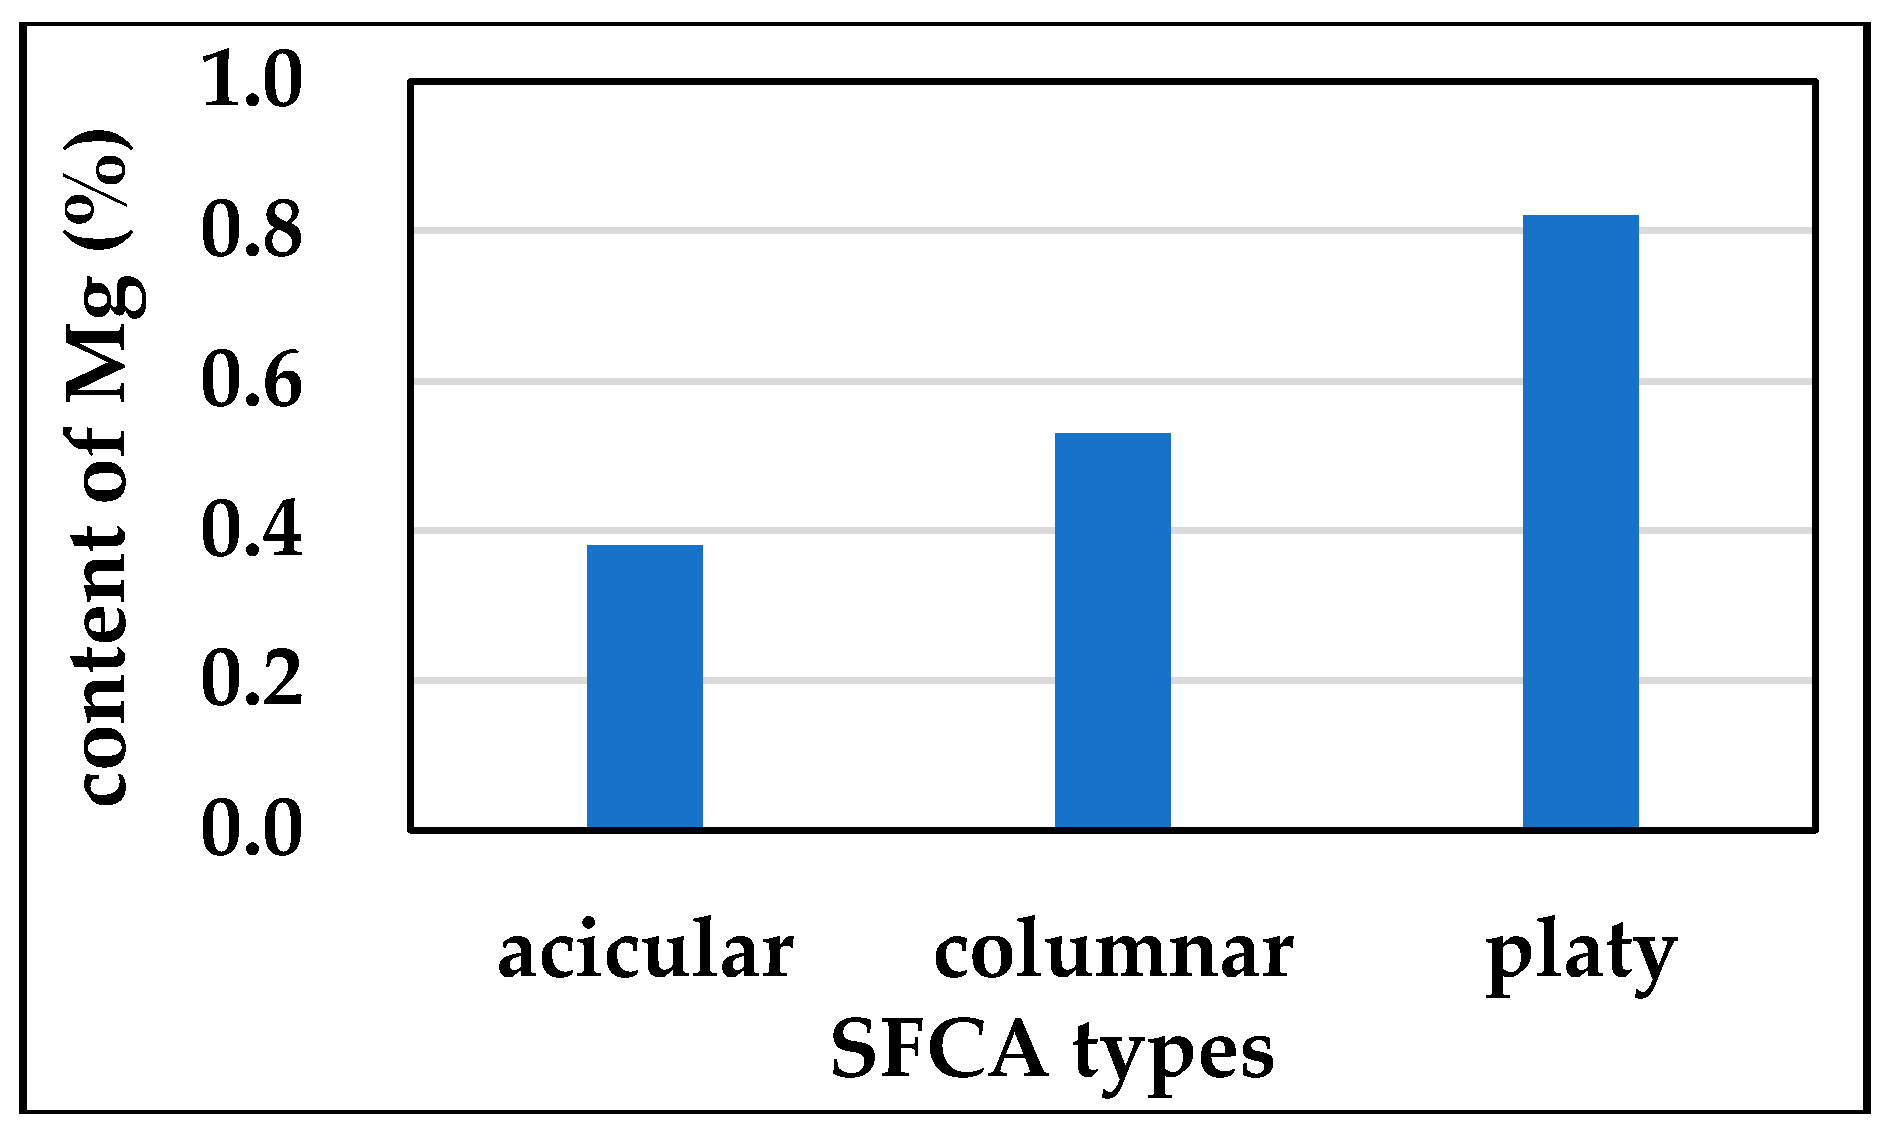
According to the morphology of crystal particles, the SFCA can be divided into acicular-SFCA with fine crystal particles (Figure 8a), columnar-SFCA (Figure 8b), and platy-SFCA with coarse crystal particles (Figure 8c) [20,21,22,23]. In this section, the relationship between the morphology of SFCA and the Mg content was studied. The Mg content of SFCA in different morphologies was obtained using EDS. In order to avoid individual error, the Mg content of each morphology was measured at 10 different points, and the average Mg content of the three kinds of SFCA are shown in Figure 9. It can be seen from Figure 9 that the higher the Mg content, the coarser the crystal particle. Previous studies have shown that the crystal’s crystallization process is divided into two steps: crystal nucleus formation and crystal growth [24,25]. When the amount of liquid phase is constant, a larger number of crystal nuclei are associated with a smaller crystal size. Generally, the large melt viscosity has a negative impact on the formation of crystal nuclei. On one hand, the high viscosity is harmful to the diffusion of liquid particles to the surface of the microcrystals, which is not conducive to the formation of primary nucleus [26]. On the other hand, the reduction of fluidity likely reduces the dendritic fracture, which probably becomes the secondary nucleus after fracturing and reduces the amount of secondary nucleus [25]. MgO, a high melting point substance, will increase the viscosity of the liquid phase to a large extent. Thus, the liquid phase with a higher Mg content is favorable for the formation of coarse SFCA crystal particles.
3.3.3. Mg Distribution around Dolomite
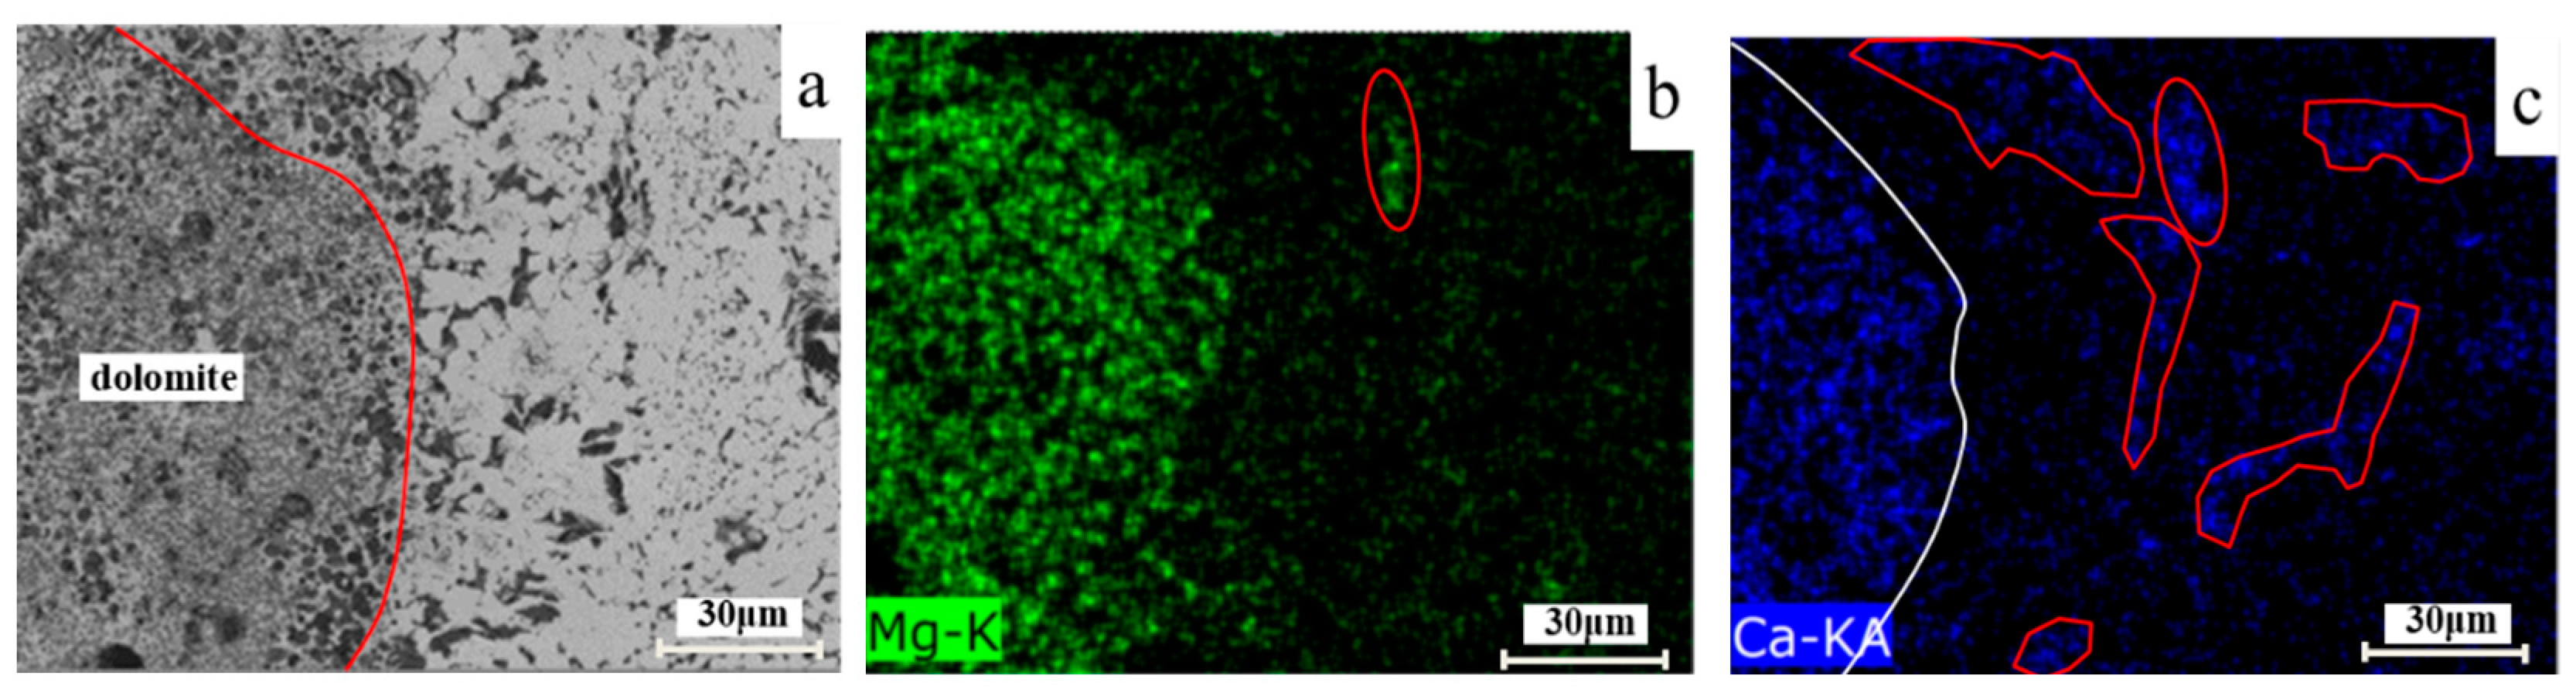
Due to the weak mineralization ability of dolomite, the Mg in a large dolomite particle may not be uniformly dispersed in the sintered products and participate in the sintering reaction. The distribution characteristics of Mg around a large dolomite particle in the actual sintering process is worthy of study. A large dolomite particle was found in the sinter ore, and the graph obtained using SEM is shown in Figure 10a. The distribution map of the Mg and Ca around the dolomite, obtained by surface scanning of EDS, are shown in Figure 10b,c respectively. It can be clearly seen from Figure 10b,c that the Mg element is mostly located where the dolomite particle is located, and the diffusion range of the Mg element is far less than that of Ca element. This may be because the calcium fluxes, e.g., CaO and CaCO3, tend to generate low-melting point substances, e.g., SFCA and calcium olivine, which easily forms a liquid phase at sintering temperature. Then, the migration of Ca mainly takes place through the flow of the liquid phase [14], so the distribution range of Ca is relatively wide. However, as a high-melting point material, MgO cannot yet generate a low-melting point substance that melts at the sintering temperature [27], so the migration of Mg can almost only be achieved through MgO particle thermal motion, which has an extremely limited moving range. As such, the Mg element stays only in the original position of the dolomite.
3.3.4. Mg Distribution characteristics in BF-re
As mentioned above, there was a larger portion of residual dolomite inlaid on the BF-re. In order to study the distribution of Mg in the BF-re and its effects on the sintered body, typical BF-re samples inlaid with residual dolomite were selected, mounted, and polished into a light sheet. Its morphology, seen under the SEM is shown in Figure 11a. Residual dolomite should be shown on the right side of the sample, but it fell off during the mounting process due to its poor bonding. As is shown in Figure 11, the sample is divided into two areas by the white line. The left area is a dense interwoven structure composed of calcium ferrite and iron oxide. Additionally, its local enlarged graph is shown in Figure 11b. It is self-evident that the liquid phase is sufficient and consolidation is better. Meanwhile, the right area is a loose porous structure and its local enlarged graph is shown in Figure 11c. It is apparent that the liquid phase is deficient and the pores are large, which leads the area to become the weak link of the sintered body strength. The element composition of the two structures obtained through region analysis of EDS are shown in Table 4. It is evident that the main chemical composition in the two regions is similar, except for the Mg content. Accordingly, the different Mg content should be responsible for the opposite structures. This is because the MgO will increase the liquid viscosity, resulting in decreased flow range, making the liquid phase deficient in some areas. The deficiency of the liquid phase leads to a porous structure and poor consolidation strength. Therefore, such a mechanism by which the Mg influences the sintered body strength exists in the actual sintering process. In the area in contact with the dolomite, the relatively high Mg content increases the liquid phase viscosity, which leads to a porous structure. Then, this area becomes a limiting link of the strength of the sintered body.
3.3.5. Mg Distribution Characteristics in IN-re
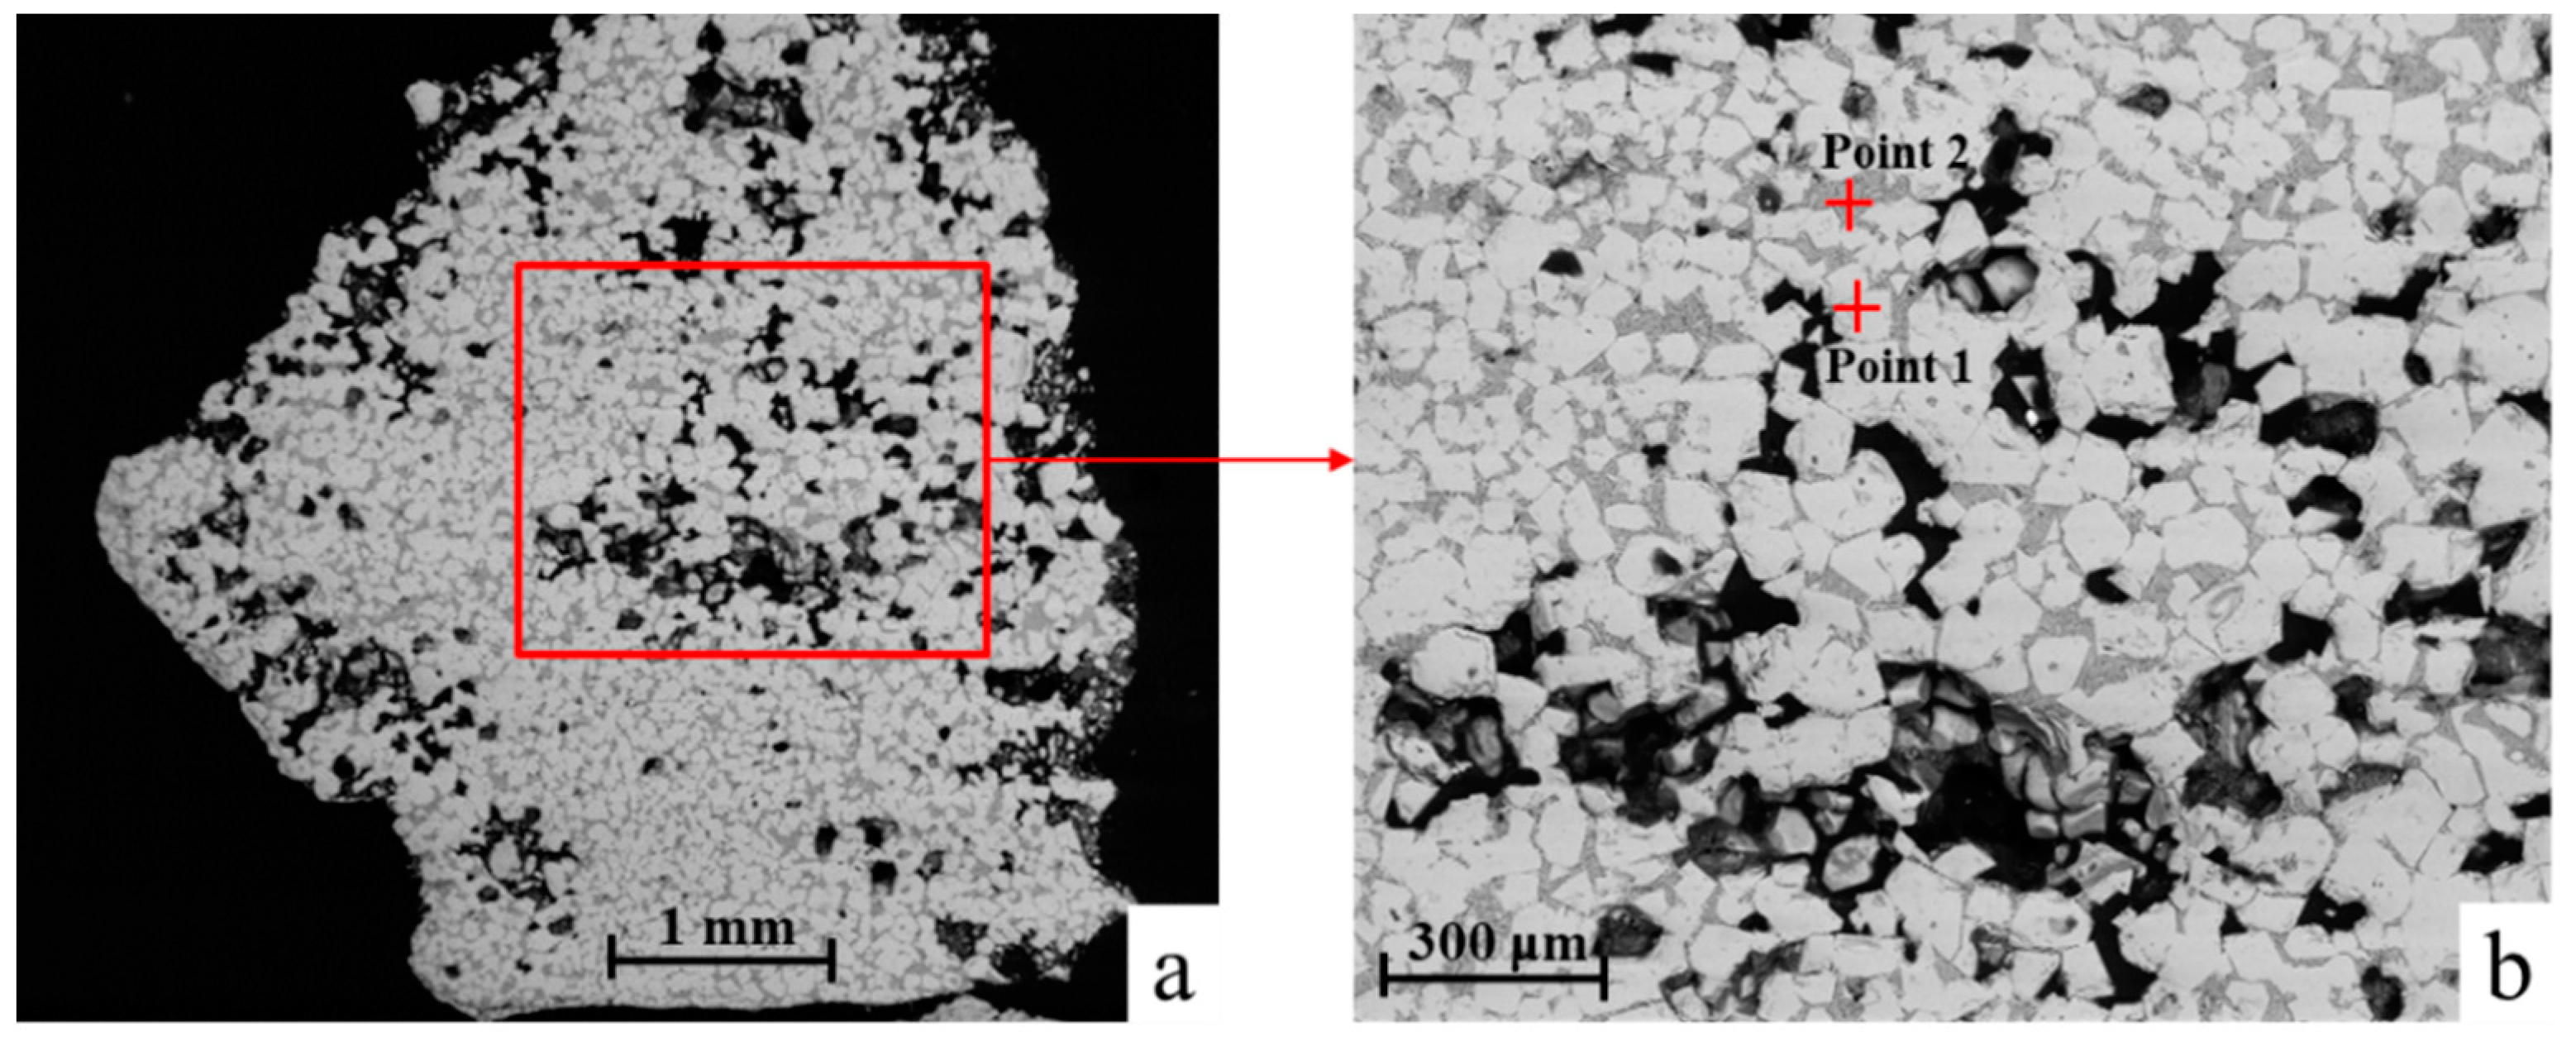
As mentioned above, the Mg content in the IN-re is higher than that of SI-ore. The mechanism of influence of this extra Mg content on the strength of the sintered body is worth studying. Typical IN-re samples were selected, mounted, and polished into a light sheet. Its morphology, as seen under the SEM, is shown in Figure 12a, and the local enlarged graph is shown in Figure 12b. The minerals of this area consist of the gray SFCA and white, bright iron oxide. Additionally, the porosity of this IN-re sample is relatively high and the interconnected irregular pores are dominant, which indicates the insufficiency of the liquid phase. The chemical composition of the SFCA and iron oxides in Figure 12b were obtained by EDS to try to clarify the reason for the insufficiency of the liquid phase. As is shown in Table 5, the Ca content of SFCA and the Mg content in the iron oxide region are as high as 26.06 and 2.08% respectively. Thus, the amount of calcium flux is sufficient and not responsible for the insufficiency of liquid phase. A conceivable reason is that massive MgO dissolving in the magnetite hinders the oxidation of magnetite to hematite [20], then the forming of SFCA was blocked. Therefore, preventing the oxidation of magnetite is another mechanism through which the Mg reduces the formation of the liquid phase, leading to a decline of sintered body strength in the actual sintering process.
4. Conclusions
Through the study of the macroscopic flow direction and microscopic distribution of magnesium in sintered products, the following knowledge was obtained.
In the main sintered products, the Mg contents are in the following increasing order: SI-ore, IN-re, and BF-re. In IN-re and BF-re, the Mg content of the 1 to 2 mm grain size is the highest, which is related to the granular distribution of the magnesia fluxes.
The solid solution characteristics of Mg in various minerals are different and their order from easy to difficult to dissolve is magnetite, SFCA, silicate, and hematite. Mg dissolving in the SFCA has a tendency to make the SFCA morphology coarse. The diffusion range of the Mg in large dolomite particle is much narrower than that of Ca, and the Mg mainly stays at the position where the dolomite is located.
Two mechanisms through which Mg reduces the strength of the sintered body exist simultaneously in the actual sintering process. On one hand, the MgO increases the liquid phase viscosity and reduces the consolidation range of liquid phase. On the other hand, Mg2+ entering the magnetite crystal lattice hinders the oxidation of magnetite, thereby blocking the formation of SFCA.
Author Contributions
Conceptualization, S.W. and W.Z.; Data curation, S.W.; Formal analysis, W.Z.; Funding acquisition, S.W.; Investigation, W.Z.; Methodology, W.Z.; Project administration, S.W.; Resources, S.W.; Software, M.K.; Supervision, S.W.; Validation, W.Z., M.K. and H.Z.; Visualization, W.Z.; Writing—original draft, W.Z.; Writing—review & editing, S.W.
Funding
This work was supported by the National Natural Science Foundation of China (Grant Number 51804027), the China Postdoctoral Science Foundation (Grant Number 2017M610769).
Acknowledgments
The authors would like to thank the financial support of Fundamental Research Funds for the Central Universities (Grant Number FRF-IC-18-010).
Conflicts of Interest
The authors declare no conflict of interest.
References
- Masaru, M.; Masahiko, H.; Takazo, K. Improvement of sinter softening property and reducibility by controlling chemical compositions. ISIJ Int. 2005, 45, 594–602. [Google Scholar] [CrossRef]
- Kohei, S.; Kaoru, N.; Masahiko, H.; Takanobu, I.; Shusaku, K.; Takaiku, Y. Effect of High Al2O3 Slag on the Blast Furnace Operations. ISIJ Int. 2008, 48, 420–429. [Google Scholar] [CrossRef]
- Kenichi, H.; Masaaki, N.; Masanori, N.; Yasushi, T. Optimization of chemical composition and microstructure of iron ore sinter for low-temperature drip of molten iron with high permeability. ISIJ Int. 2004, 44, 2057–2066. [Google Scholar] [CrossRef]
- Wang, X.L. Iron and Steel Metallurgy (Iron Making), 3rd ed.; Metallurgy Industry Press: Beijing, China, 2008; pp. 107–156. ISBN 9787502461300. [Google Scholar]
- He, H.Y.; Wang, Q.X.; Zeng, X.N. Effect of MgO content on BF slag viscosity. J. Iron Steel Res. Int. 2006, 18, 11–13. [Google Scholar] [CrossRef]
- Shen, F.M.; Jiang, X.; Wu, G.S. Proper MgO addition in blast furnace operation. ISIJ Int. 2006, 46, 65–69. [Google Scholar] [CrossRef]
- Guan, X.F. The way of heightening MgO of sinter and the effects of metallurgy in BF. Sint and Pellet. 2001, 26, 32–34. (In Chinese) [Google Scholar] [CrossRef]
- Umadevi, T.; Roy, A.K.; Mahapatra, P.C.; Prabhu, M.; Ranjan, M. Influence of Magnesia on Iron Ore Sinter Properties and Productivity–Use of Dolomite and Dunite. Steel Res. Int. 2009, 80, 800–807. [Google Scholar] [CrossRef]
- Yao, J.H.; Yang, J. Effect of additives on formation of calcium ferrites in magnesia-riched sinters. Iron Steel. 2015, 50, 12–16. (In Chinese) [Google Scholar] [CrossRef]
- Hayashi, M.; Tanaka, H.; Watanabe, T.; Susa, M. Role of MgO in Sinter from Perspective of MgO Distribution between Liquid and Magnetite Phases in FeOx–CaO–SiO2–MgO System. ISIJ Int. 2017, 59, 2124–2130. [Google Scholar] [CrossRef]
- Shigaki, I.; Sawada, M.; Maekawa, M.; Narita, K. Melting property of MgO containing sinter. Tetsu-to-Hagane 1981, 21, 862–869. [Google Scholar] [CrossRef]
- Li, T.L.; Sun, C.Y.; Liu, X.Y. The effects of MgO and Al2O3 behaviours on softening–melting properties of high basicity sinter. Ironmak. Steelmak. 2018, 45, 755–763. [Google Scholar] [CrossRef]
- Yadav, U.S.; Pandey, B.D.; Das, B.K.; Jena, D.N. Influence of magnesia on sintering characteristics of iron ore. Ironmak. Steelmak. 2002, 29, 91–95. [Google Scholar] [CrossRef]
- Eiki, K.; Yorito, S.; Takazo, K.; Takshi, N. Influence of properties of fluxing materials on the flow of melt formed in the sintering process. ISIJ Int. 2000, 40, 857–859. [Google Scholar] [CrossRef]
- Umadevi, T.; Nelson, K.; Mahapatra, P.C.; Prabhu, M.; Ranjan, M. Influence of magnesia on iron ore sinter properties and productivity. Ironmak. Steelmak. 2009, 36, 515–520. [Google Scholar] [CrossRef]
- Wu, S.L.; Han, H.L.; Jiang, W.Z.; Zhu, J.M.; Feng, G.S.; Zhang, Z.C. MgO interaction mechanism in sinter. Chin. J. Eng. 2009, 31, 428–432. (In Chinese) [Google Scholar] [CrossRef]
- Yajima, K.; Matsuura, H.; Tsukihashi, F. Effect of simultaneous addition of Al2O3 and MgO on the liquidus of the CaO–SiO2–FeOx system with various oxygen partial pressures at 1573 K. ISIJ Int. 2010, 50, 191–194. [Google Scholar] [CrossRef]
- Feng, Q.; Yu, S.J.; Hou, H.Y.; Zhang, D.K.; Geng, J.S.; Xu, P.F. Recycling of the electric dust in sintering machine head. Iron Steel. 2015, 50, 67–71. (In Chinese) [Google Scholar] [CrossRef]
- Fan, X.H.; Li, W.Q.; Gan, M.; Chen, X.L.; Yuan, L.S.; Ji, Z.Y.; Yu, Z.Y.; Huang, X.X.; Su, D. Influence and mechanism of MgO on strength of high basicity sinter. J. Cent. South Univ. 2012, 43, 3325–3330. [Google Scholar]
- Jiang, X.; Wu, G.S.; Wei, G.; Li, X.G.; Sheng, F.M. Effect of MgO on Sintering Process and Metallurgical Properties of Sinter. Iron Steel. 2006, 41, 8–11. (In Chinese) [Google Scholar] [CrossRef]
- Gan, M.; Fan, X.H.; Ji, Z.Y.; Chen, X.L.; Yin, L.; Jiang, T.; Li, G.H.; Yu, Z.Y. High Temperature Mineralization Behavior of Mixtures during Iron Ore Sintering and Optimizing Methods. ISIJ Int. 2015, 55, 742–750. [Google Scholar] [CrossRef] [Green Version]
- Yu, B.; Lv, X.W.; Xiang, S.L.; Bai, C.G.; Yin, J.Q. Wetting behavior of calcium ferrite melts on sintered MgO. ISIJ Int. 2015, 55, 1558–1564. [Google Scholar] [CrossRef]
- Long, H.M.; Wu, X.J.; Chun, T.J.; Di, Z.X.; Yu, B. Assimilation behavior of calcium ferrite and calcium differrite with sintered Al2O3 and MgO. Metall. Mater. Trans. B 2016, 47, 2830–2836. [Google Scholar] [CrossRef]
- Sugiyama, K.; Monkawa, A.; Sugiyama, T. Crystal structure of the SFCAM phase Ca2(Ca, Fe, Mg, Al)6(Fe, Al, Si)6O2. ISIJ Int. 2005, 45, 560–568. [Google Scholar] [CrossRef]
- Cui, Z.Q.; Tan, Y.C. Metallurgy and Heat Treatment, 2nd ed.; Mechanical Industry Press: Beijing, China, 2007; pp. 36–54. ISBN 9787111017967. [Google Scholar]
- Zhang, C.J. Research on crystallization behavior of mold flux in magnetic field. Master’s Thesis, Chongqing University, Chongqing, China, May 2015. [Google Scholar]
- Jin, M.F.; Li, G.S.; Chu, M.S.; Shen, F.M. Diffusion between Mg and hematite during sintering. Iron Steel 2008, 43, 10–14. (In Chinese) [Google Scholar] [CrossRef]
Figure 1.
Macroscopic morphology of the sintered products. SI-ore: sinter ore; IN-re: sinter internal return ore; BF-re: blast furnace return ore; SED1, SED2, and SED3: first, second, and third sinter electrostatic dust; TBS: tail bag ash.
Figure 1.
Macroscopic morphology of the sintered products. SI-ore: sinter ore; IN-re: sinter internal return ore; BF-re: blast furnace return ore; SED1, SED2, and SED3: first, second, and third sinter electrostatic dust; TBS: tail bag ash.

Figure 2.
Mineral phases of sintered products.

Figure 3.
Distribution of MgO in different sintered products.

Figure 4.
MgO content in different grain sizes of SI-ore, IN-re, and BF-re.
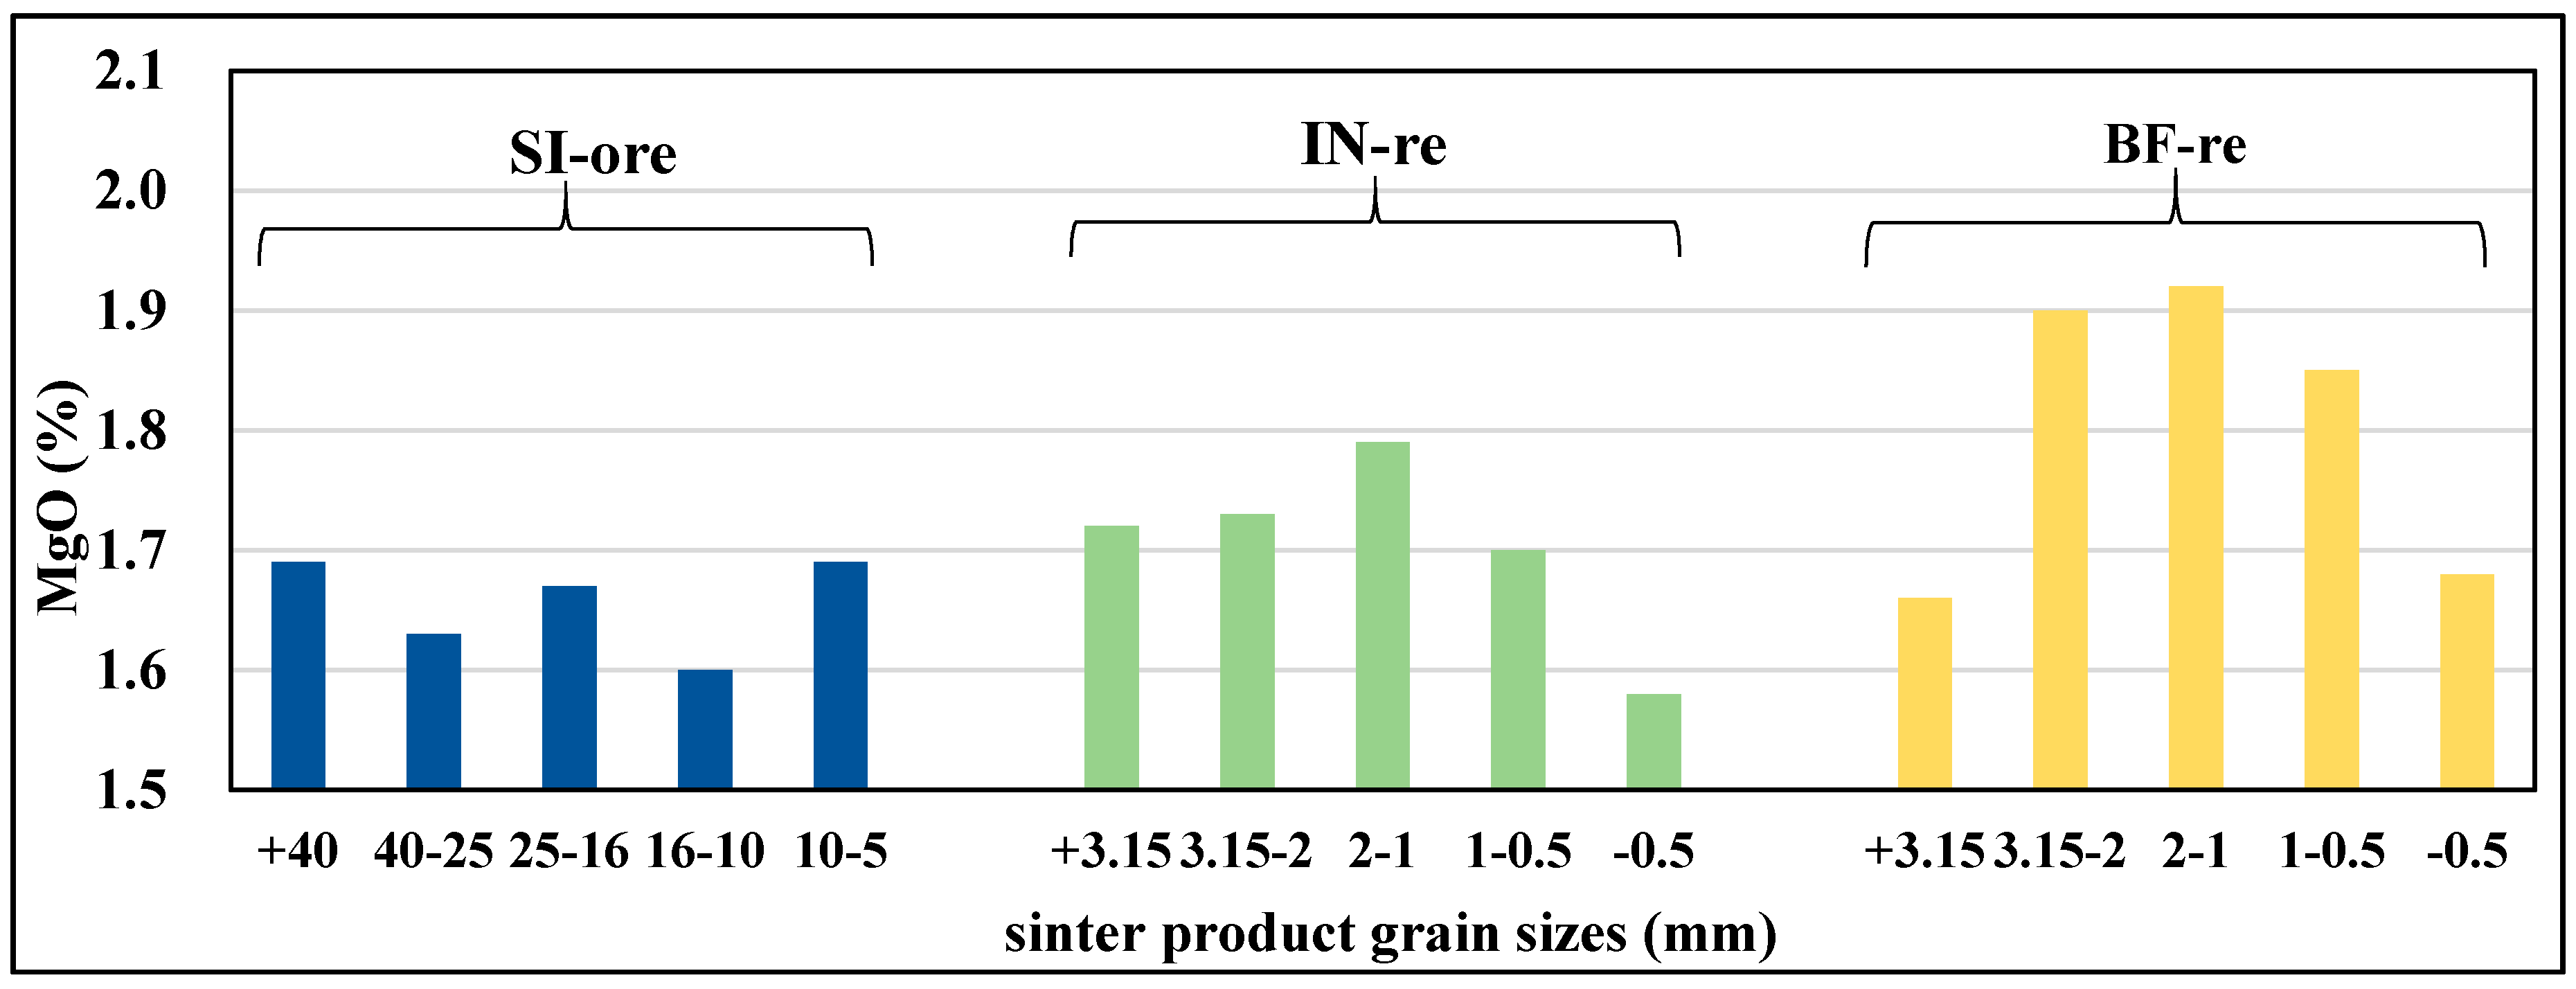
Figure 5.
Granular distribution of dolomite.

Figure 6.
Sinter graphs under SEM and the distribution map of Mg. (a) SEM graph of region 1 (b) Mg distribution map region 1 (c) SEM graph of region 2 (d) Mg distribution map region 2.
Figure 6.
Sinter graphs under SEM and the distribution map of Mg. (a) SEM graph of region 1 (b) Mg distribution map region 1 (c) SEM graph of region 2 (d) Mg distribution map region 2.

Figure 7.
Distribution of Mg in different mineral types.

Figure 8.
Morphology of different silico-ferrites of calcium and aluminium (SFCA). (a) Acicular-SFCA; (b) columnar-SFCA; (c) platy-SFCA.
Figure 8.
Morphology of different silico-ferrites of calcium and aluminium (SFCA). (a) Acicular-SFCA; (b) columnar-SFCA; (c) platy-SFCA.

Figure 9.
Mg Content in different SFCA.

Figure 10.
Distribution map of Mg and Ca around a large dolomite particle. (a) SEM graph of a large dolomite particle; (b) Mg distribution map around dolomite particle; (c) Ca distribution map around dolomite particle.
Figure 10.
Distribution map of Mg and Ca around a large dolomite particle. (a) SEM graph of a large dolomite particle; (b) Mg distribution map around dolomite particle; (c) Ca distribution map around dolomite particle.

Figure 11.
SEM micrographs of a typical BF-re sample. (a) Graph of a typical BF-re sample; (b) local enlarged graph 1; (c) local enlarged graph 2.
Figure 11.
SEM micrographs of a typical BF-re sample. (a) Graph of a typical BF-re sample; (b) local enlarged graph 1; (c) local enlarged graph 2.
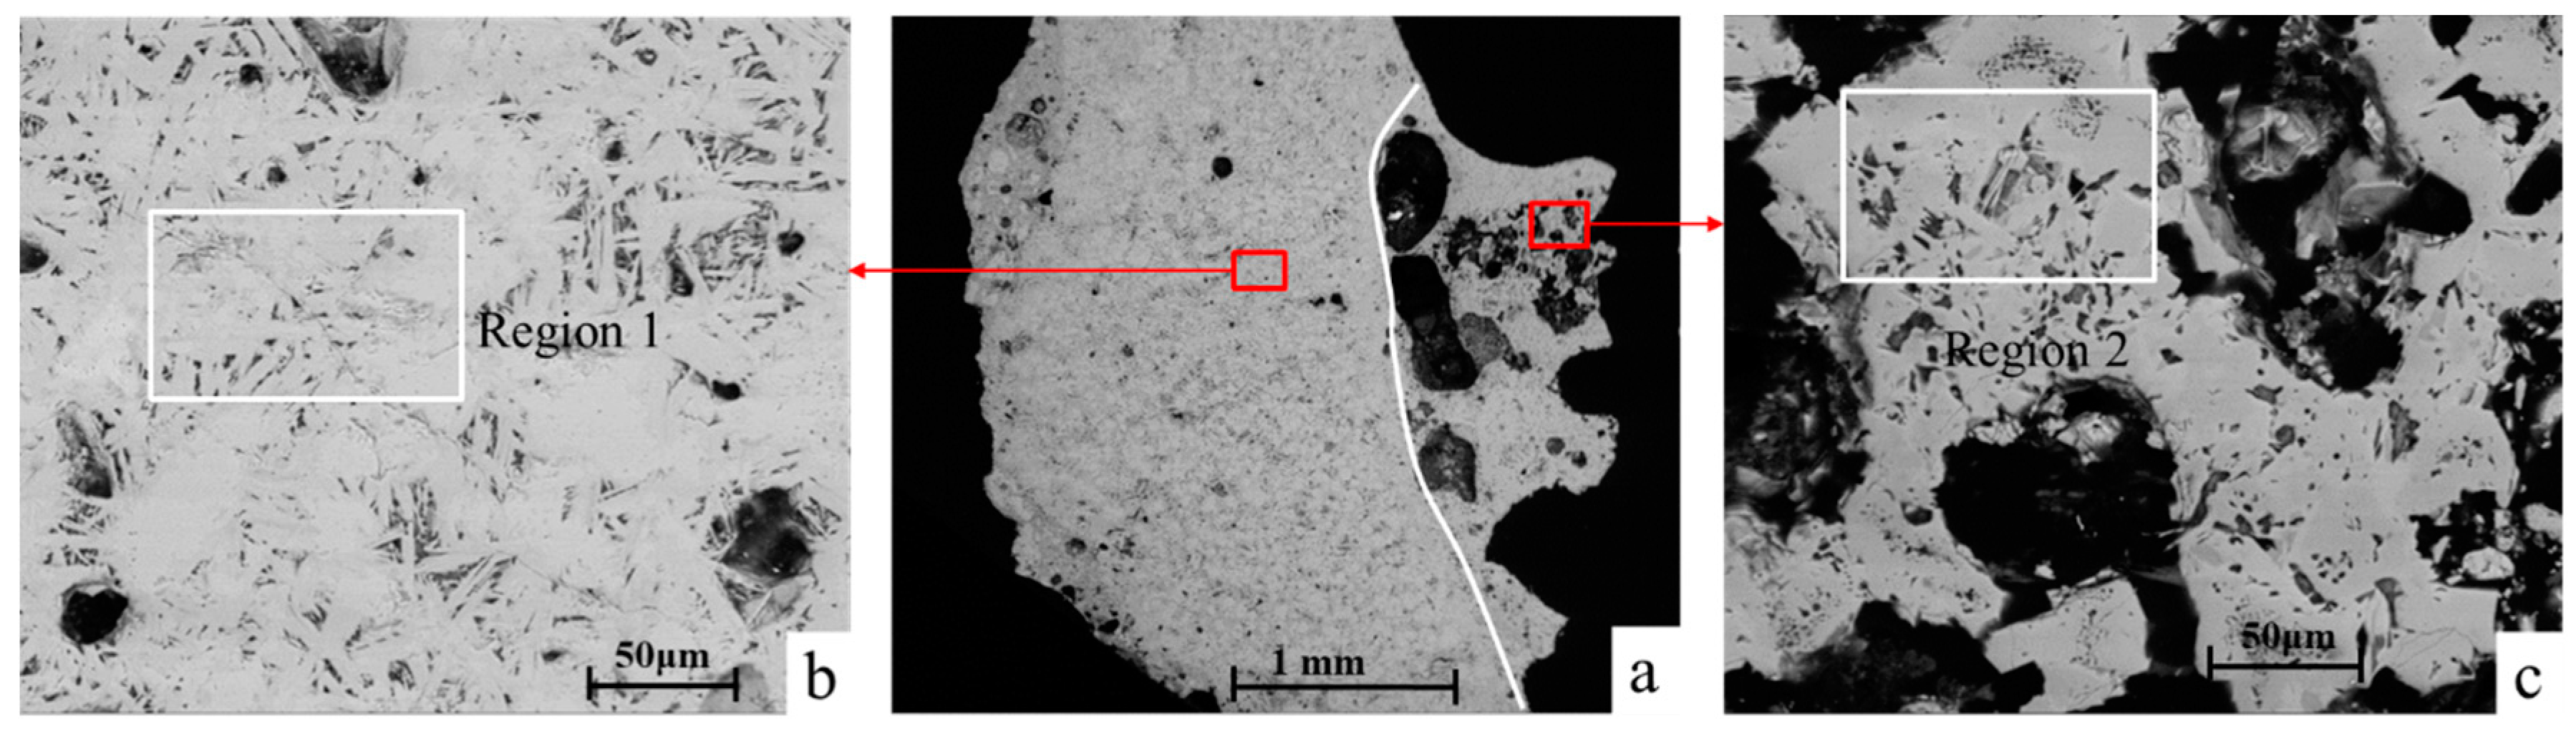
Figure 12.
SEM micrographs of a typical IN-re sample. (a) Graph of a typical BF-re sample; (b) local enlarged graph.
Figure 12.
SEM micrographs of a typical IN-re sample. (a) Graph of a typical BF-re sample; (b) local enlarged graph.


Table 1.
Raw materials ratio of products form the Meishan Iron & Steel Group.
| Materials | Mixed Mine | IN-re | BF-re | Dolomite | Limestone | Quicklime | Fuel |
|---|---|---|---|---|---|---|---|
| ratio (%) | 55.6 | 25.0 | 8.12 | 2.76 | 2.08 | 3.11 | 3.33 |
Table 2.
Chemical composition of mixed mine and dolomite from the Meishan Iron & Steel Group.
| Composition | TFe | FeO | SiO2 | CaO | Al2O3 | MgO | LOI |
|---|---|---|---|---|---|---|---|
| mixed mine (%) | 62.19 | 3.1 | 4.52 | 0.77 | 1.59 | 0.21 | 3.78 |
| dolomite (%) | - | - | 2.46 | 30.95 | 0.26 | 19.85 | 44.97 |
Table 3.
Granular distribution of dolomite from the Meishan Iron & Steel Group.
| Granularity (mm) | −0.5 | 0.5–1 | 1–2 | 2–3.15 | +3.15 |
| Proportion (%) | 32.61 | 20.79 | 27.96 | 17.92 | 0.72 |
Table 4.
Element composition of region 1 and region 2 (wt%).
| Region | Fe | O | Si | Al | Mg | Ca |
|---|---|---|---|---|---|---|
| region 1 | 60.15 | 17.26 | 6.76 | 1.97 | 0.73 | 13.13 |
| region 2 | 55.34 | 15.81 | 6.41 | 1.88 | 4.49 | 16.07 |
Table 5.
Element composition of point 1 and point 2 (wt%).
| Point | Fe | O | Si | Al | Mg | Ca |
|---|---|---|---|---|---|---|
| point 1 | 67.50 | 29.20 | 0.06 | 0.29 | 2.08 | 0.87 |
| point 2 | 48.71 | 17.41 | 5.61 | 1.58 | 0.63 | 26.06 |
© 2018 by the authors. Licensee MDPI, Basel, Switzerland. This article is an open access article distributed under the terms and conditions of the Creative Commons Attribution (CC BY) license (http://creativecommons.org/licenses/by/4.0/).
Share and Cite
MDPI and ACS Style
Wu, S.; Zhang, W.; Kou, M.; Zhou, H. The Macroscopic Flow direction and Microscopic Distribution of Mg in Sintered Products and Its Influence. Metals 2018, 8, 1008. https://doi.org/10.3390/met8121008
AMA Style
Wu S, Zhang W, Kou M, Zhou H. The Macroscopic Flow direction and Microscopic Distribution of Mg in Sintered Products and Its Influence. Metals. 2018; 8(12):1008. https://doi.org/10.3390/met8121008
Chicago/Turabian StyleWu, Shengli, Weili Zhang, Mingyin Kou, and Heng Zhou. 2018. "The Macroscopic Flow direction and Microscopic Distribution of Mg in Sintered Products and Its Influence" Metals 8, no. 12: 1008. https://doi.org/10.3390/met8121008
Note that from the first issue of 2016, this journal uses article numbers instead of page numbers. See further details here.