Prediction and Experiment of Fracture Behavior in Hot Press Forming of a TA32 Titanium Alloy Rolled Sheet

College of Mechanical and Electrical Engineering, Nanjing University of Aeronautics and Astronautics, Nanjing 210016, China
*
Author to whom correspondence should be addressed.
Metals 2018, 8(12), 985; https://doi.org/10.3390/met8120985
Submission received: 29 October 2018
/
Revised: 16 November 2018
/
Accepted: 20 November 2018
/
Published: 23 November 2018
(This article belongs to the Special Issue Modelling and Simulation of Sheet Metal Forming Processes)
Abstract
:In aerospace and automotive industries, hot press forming (HPF) technology is widely used for rapid and precise deformation of the complex sheet metal component, where the fracture behavior has always been a focused problem. In this study, the hot tensile test and the Nakazima test were carried out, in order to establish the Misiolek constitutive equation and determine the forming limit strain points at an elevated temperature, respectively. The microstructure evolution during the tensile test was also investigated by optical microscope. In addition, the Marciniak–Kuczynski (M–K) model, considering the Mises, Hill48, and Logan–Hosford yield criteria, was utilized to calculate the theoretical forming limit curve (FLC). Furthermore, the fracture behavior of the TA32 alloy sheet during the HPF process was accurately predicted by inserting the predicted FLC into finite element simulation, and the qualified complex component was obtained by optimizing the shape of the sheet.
1. Introduction
Nowadays, titanium and titanium alloys are extensively used in the aerospace, marine, automotive, and medical industries. This is due to their superior high temperature performance, high specific strength, low density, corrosion resistance, good creep resistance, and excellent biocompatibility [1]. The TA32 alloy is a new type of near- high temperature titanium alloy with good comprehensive performance. The alloy’s long-term working temperature can reach 550 °C, and it has wide application prospects in the cylinder of the advanced aeroengine afterburner and the structure of the cruise missile [2]. However, there are plenty of difficulties, such as large forming forces, low formability, and the occurrence of springback during the cold forming. As one of the more advanced manufacturing technologies, the hot press forming (HPF) process has been actively developed, which can reduce forming time and improve dimensional precision [3]. Metal additive manufacturing, which can directly produce structural components without a mold or additional machining, has also received much attention in recent years. However, HPF technology is preferred in sheet metal forming, due to its advantages of higher production efficiency and lower manufacturing cost compared with the metal additive manufacturing [4]. Therefore, accurately predicting the fracture behavior of TA32 alloy in HPF has important significance for engineering applications.
The forming limit is an important performance index for the fracture behavior of sheet metal forming, and reflects the maximum amount of deformation that can be reached before the plastic deformation of the material is unstable during the forming process. Keeler and Backofen [5] first proposed the concept of forming limit diagrams (FLD), and they obtained the right-hand side of FLD. Goodwin [6] obtained the left-hand side of FLD, by changing the width and thickness of the sheet, and since then FLD has been broadly used in sheet forming industry. However, it is time-consuming and expensive to experimentally determine FLD, especially at high temperatures; thus, many researchers use numerical models to predict FLDs, of which the Marciniak–Kuczynski (M–K) theory is the most widely applied [7,8,9,10].
In recently years, an increasing number of researchers have used finite element method (FEM) to simulate the process of HPF. Nedoushan [11] simulated the hot forming process of AA5083 aluminum alloy by combining a constitutive model, which considers inter-granular deformation and grain boundary mechanisms, and finite element software, and the simulation datas were consistent with the experimental results. Odenberger et al. [12] analyzed the hot forming process parameters of two Ti-6Al-4V prototype components by using FEM. Zhao et al. [13] applied a three-dimensional FEM model to simulate the forming process of atitanium fan blade, and discussed the influence of key factors like descending velocity and frictional coefficient on the forming force. The above studies indicate that FEM is an effective way to accurately predict the process of HPF.
To better predict the fracture behavior of a TA32 alloy sheet during the HPF process, it is necessary to perform a comprehensive study on the tensile properties, microstructural evolution, and forming limit of the TA32 alloy. In the present work, the hot tensile test and the Nakazima test were conducted to evaluate the alloy’s mechanical properties and its forming limit strain points at an elevated temperature, respectively. The Misiolek constitutive equation was used to characterize the flow stress of TA32 alloy, and the microstructure evolution during the tensile test was also investigated. Then, the M–K model considering three different yield criteria was used to theoretically predict the forming limit curves (FLCs) of TA32 alloy. The initial inhomogeneity factor at different temperatures was adjusted by minimizing the average distances between the necking points of the hot tensile test and the theoretical FLCs under different strain rates of a certain temperature, and the accuracy of the theoretical FLC was evaluated by the Nakazima test results. Finally, ABAQUS software, which was developed by Dassault company in America, combined with the theoretical FLC predicted the fracture behavior of a TA32 alloy sheet during the HPF process, and the reliability of the simulation results were discussed by actual hot forming experiments.
2. Materials and Experimental Procedure
2.1. Materials
In this paper, the thickness of the as-received sheet was 1.5 mm. The nominal chemical composition of the sheet was Ti–5.5Al–3.5Sn–3.0Zr–0.7Mo–0.3Si–0.4Nb–0.4Ta (wt %). The β transformation temperature (at which α+β/β) of the TA32 alloy was 1000 °C [2]. The microstructure of the as-received TA32 alloy is shown in Figure 1. It can be seen that there are a certain amount of intergranular β phase grains in the equiaxed α phase matrix, and there are some fine and highly dispersed rare earth phases in the matrix [2]. The contents of the α and β phases, measured by using Image Pro Plus software (Version 6.0, Media Cybernetics, Inc., Rockville, MD, USA), were about 84% and 8%, respectively, and the rest were the rare earth phase.
2.2. Hot Tensile Test
The tensile specimen size is shown in Figure 2a, and the length direction of the specimen is the rolling direction. The hot tensile tests were carried out on the UTM 5504X electronic universal testing machine which produced by SUNS company in China, and the test process is shown in Figure 2b. The furnace was heated to the test temperature at a heating rate of 10 °C/s, and the temperature was maintained for 30 min so that the temperature of the stretching chuck and the furnace chamber could be sufficiently exchanged. Then we opened the furnace door and quickly placed the sample, held it for 10 min, and performed tensile deformation at a predetermined tensile rate until the sample was broken. The specimen was taken out quickly and water quenched to retain the high temperature microstructure.
Figure 3 shows the specimens before and after the hot tensile test. It can be seen that the elongation and the section shrinkage of the specimens increases significantly with decreasing strain rates and increasing deformation temperature. The maximum elongation of the TA32 alloy at 700 °C, 750 °C, and 800 °C was 92%, 142%, and 204%, respectively.
2.3. Metallography Procedure
After the hot tensile test, the metallographic specimens with size of 6 mm × 8 mm were cut off at a distance of 10 mm from the fracture. After being polished by SiC sandpaper, the surfaces of the specimens were polished by mechanical polishing, until no visible scratches were observed. The polished specimens were etched with Kroll reagent at a volume ratio of 3:5:100 (HF: HNO3: H2O) for 3 seconds, then quickly rinsed with clean water and blown dry. In this paper, the microstructure of TA32 alloy was observed by an MR 5000 optical microscope (Jiangnan Novel Optics CO., Ltd, Nanjing, China).
2.4. Nakazima Test
The FLC of the TA32 alloy sheet was obtained by the Nakazima test method, which is a hemispherical rigid punch bulging test [14]. The schematic diagram of the Nakazima test is shown in Figure 4a. The edge of the sheet was pressed by the blank holder and the concave die, and a certain part of the sheet was locally necked or broken by punch bulging, which reached its forming limit. The test apparatus is an improved thermoforming platform, as shown in Figure 4b.
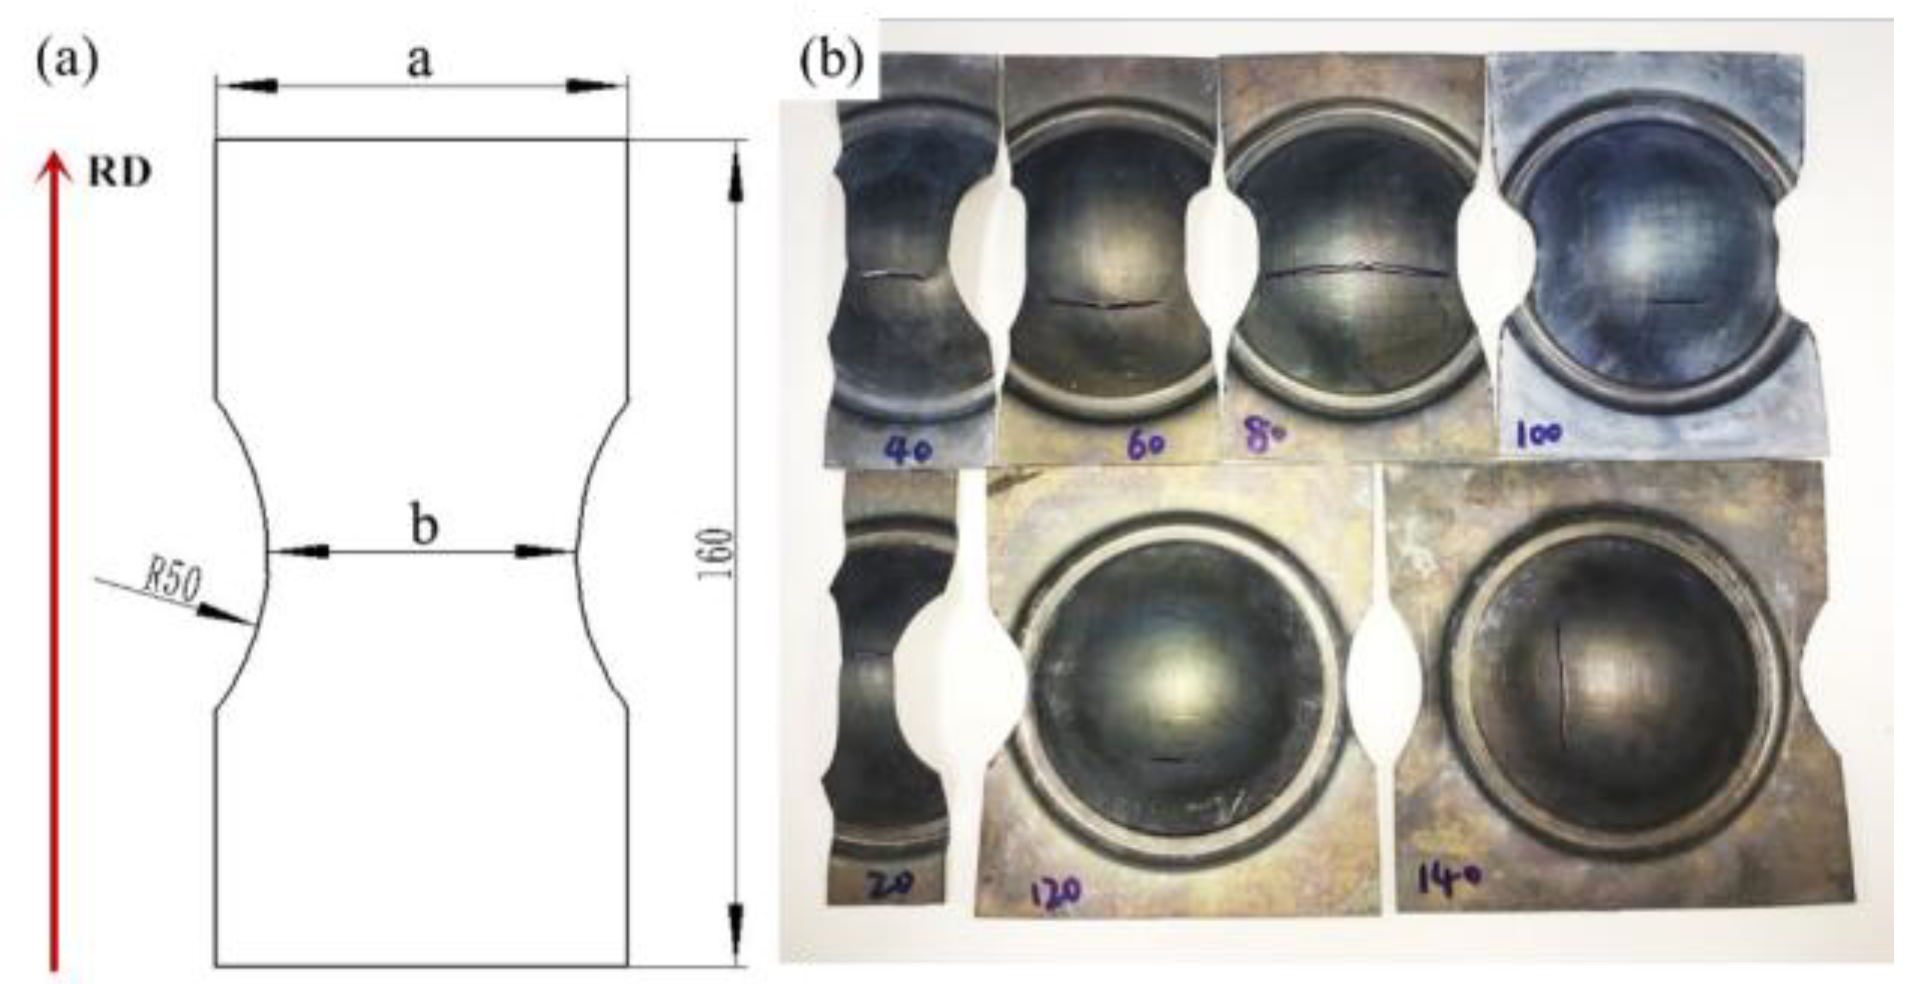
The Nakazima test method requires different specimen geometries to produce all possible strain and stress states. One set of FLC specimens, with the length of 160 mm and different widths of 20 mm, 40 mm, 60 mm, 80 mm, 100 mm, 120 mm, and 140 mm, were obtained by wire cutting, in which each specimen represents one strain path on the FLD. The size of the FLC specimens is shown in Figure 5a. The square grid with the grid size of 5 mm was marked on the surface of specimens for limit strain analysis.
In the experiment, the heating furnace and the FLC experimental device were heated to 750 °C, respectively, and both were kept for 30 min. High temperature lubricant was applied to the both sides of the FLC specimens. After waiting for the temperature in the furnace to be uniform, the specimen with the grid was placed in the heating furnace first, and kept it for 10 min to make the temperature of the sheet uniform. Then the specimen was removed and quickly put into the FLC experimental device for the forming experiment. The speed of the punch pressing was 50 mm/min, and the experiment stopped until the first crack was generated on the specimen. This process should be carried out as quickly as possible, so as to avoid the specimen losing too much heat and affecting the experimental results. The deformed FLC specimens are shown in Figure 5b.
2.5. Hot Press Forming Test
The schematic diagram of the HPF test is shown in Figure 6a. There are twelve independent resistive heating zones placed in the upper and lower workbench of the machine, and the forming temperature is controlled by the Proportion Integration Differentiation (PID) controller which produced by ENVADA company in China. The movement speed of the upper mold can be adjusted by controlling the flow rate of hydraulic oil. All the activity signals of the machine tool were sent and accepted by electronic computer. The appearance of the test platform is shown in Figure 6b.
In the HPF test, the box furnace was heated to 750 °C and held for 30 min to make the temperature inside the furnace uniform. The TA32 sheet with a high temperature lubricant sprayed on both sides was placed in the middle of the upper and lower molds. The temperature was kept for 10 min to make the temperature of the sheet uniform. Then the upper mold was moved downward at a speed of 50 mm/min, by controlling the computer until it contacted with the lower mold, and kept the pressure at 4 MPa for 15 minutes to make the sheet fully deform. After the hot forming, the component was taken out and air cooled to room temperature.
2.6. FEM Simulation Model
ABAQUS (version 6.14) software was used to simulate the HPF process of the TA32 alloy sheet. The assembly diagram of the model is shown in Figure 7. In the simulation, the sheet was modeled using a shell element with four integration points (S4R), and about 40,000 elements were divided in total. The molds, which were obtained by extracting the cavity surfaces of the upper and lower molds, were regarded as the rigid body. The process of HPF was simulated by way of fixing the lower mold and controlling the displacement of the upper mold. The whole simulation was calculated by the dynamic explicit method.
3. Results and Discussion
3.1. Hot Tensile Behavior and Microstructure Evolution
Considering both hardening and softening effects during hot plastic deformation in TA32, the Misiolek constitutive equation [15] was used to describe the stress–strain relationship:
where represent the true stress and true strain, respectively, and and are the hardening index and the softening coefficient, respectively. The parameter is the equation coefficient. Taking the natural logarithm of both sides, the Misiolek equation can be expressed as
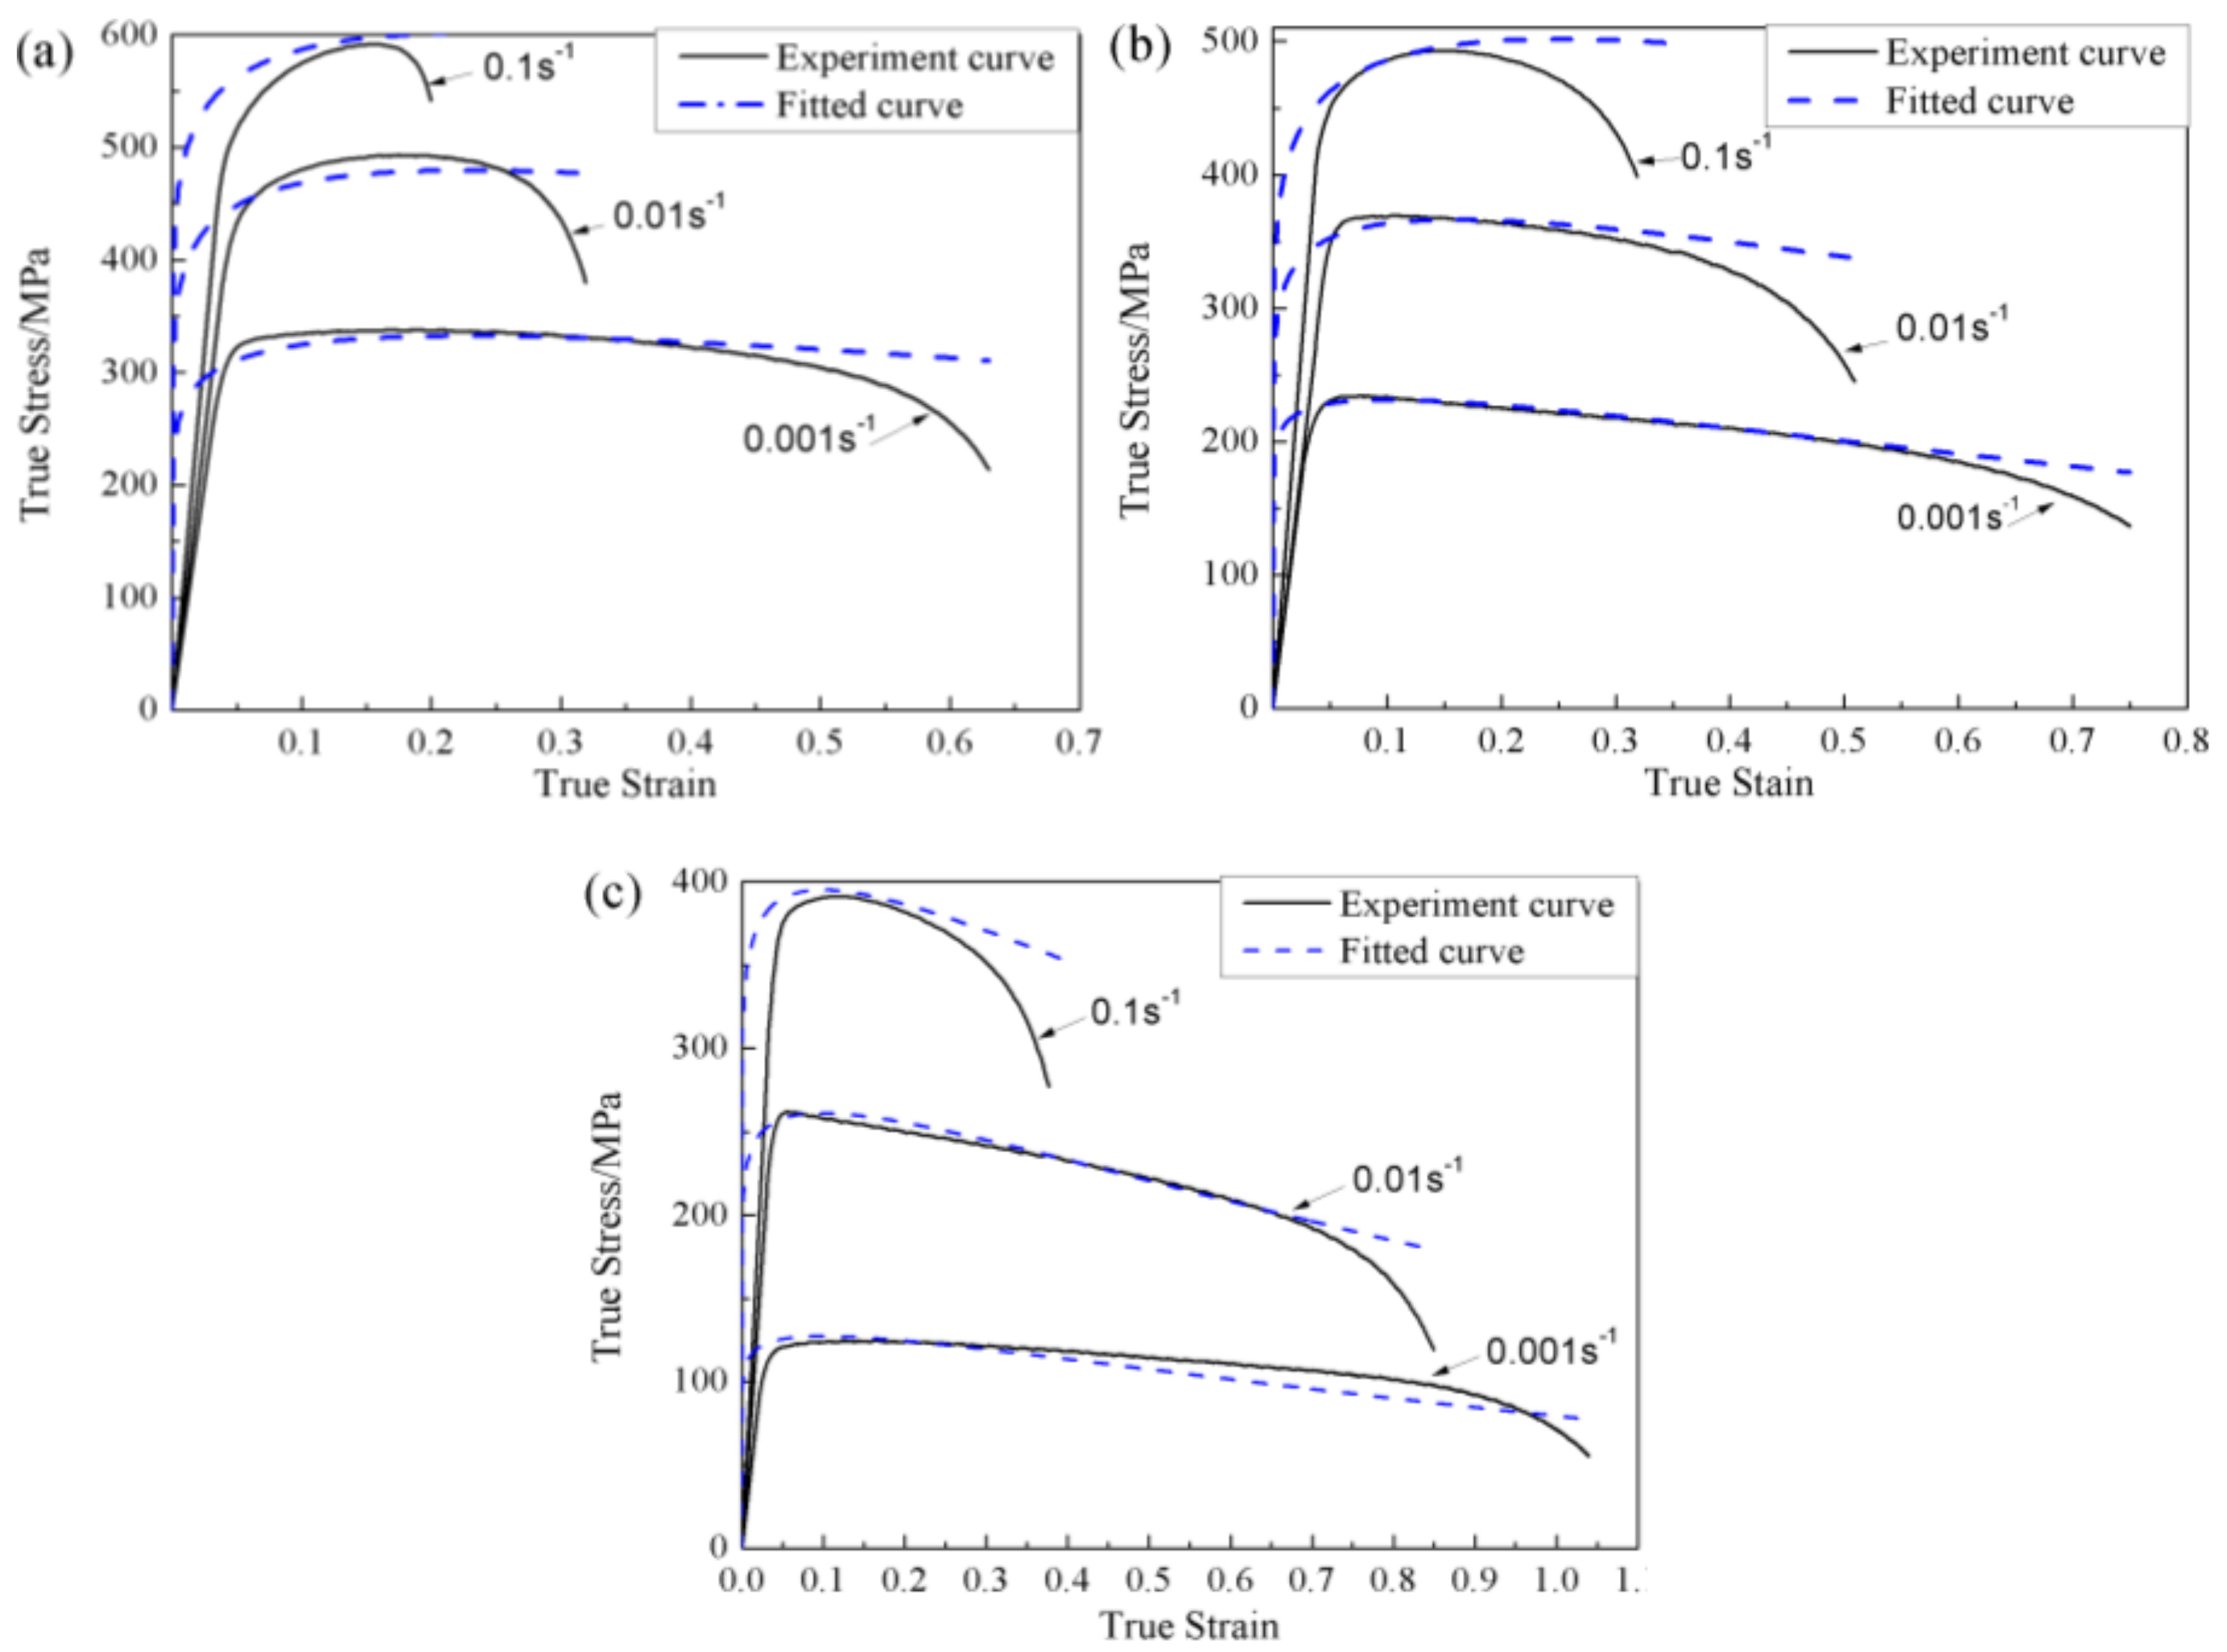
Then . In order to reduce the error, at the strain rates of 0.1, 0.01, and 0.001 s−1, the flow stresses with true strains of 0.04–0.15 were extracted for linear fitting, and the n-values of the different strain rates were averaged. Therefore, the values of obtained at 700, 750, and 800 °C were 0.091, 0.080, and 0.069, respectively. According to Equation (2), using a method similar to the solution of the -value, the values of at 700, 750, and 800 °C were −0.398, −0.553 and −0.697, respectively. As shown in Figure 3, the flow stress curves are influenced by temperature and strain rate, wherein the effect of strain rates are reflected in the -values, which are calculated from Equation (2) based on the above results. Therefore, the flow stress equation of the TA32 alloy at temperature of 700, 750, and 800 °C, with a strain rate of 0.1, 0.01, 0.001 s−1, respectively, can be denoted as
The comparison between the experimental and fitted curve under different strain rates at 700–800 °C is shown in Figure 8. It can be seen that the flow curve could be divided into three stages in the tensile test. At the first stage, the flow stress increases rapidly with the increase of strain. At the second stage, the flow stress tends to be stable during the deformation process. Since the stacking fault energy of titanium alloy is relatively low, the softening behavior in this stage could be attributed to adiabatic deformation heating or the generation of dynamic recrystallization [16]. At the third stage, the flow stress gradually decreases, and the localized necking occurs at the specimens until fracture. The fitting curve accurately reveals this flow behavior. Therefore, the Misiolek equation can represent the flow stress of the TA32 alloy at the temperature range of 700–800 °C with the strain rate of 0.1–0.001 s−1, and could be used for the theoretical computation of forming limits.
The microstructure of the TA32 alloy under different temperatures, with strain rate of 0.001 s−1, is shown in Figure 9. When the strain rate is constant, the content of the primary α phase decreases with the increasing of the deformation temperature, and the volume fraction and grain size of the β phase continue to increase. When the deformation temperature is 700 °C, the grain shape of the α phase is obviously elongated along the tensile direction, and the grain size of the β phase is slightly larger than that of the as-received microstructure. When the temperature is raised to 750 °C, the grains are uniformly distributed, and finely equiaxed recrystallized grains appear near the grain boundaries, indicating that dynamic recrystallization occurs at this temperature [17]. As the temperature is further increased to 800 °C, the fine recrystallized grains grow significantly.
The microstructure of the TA32 alloy under different strain rates at 750 °C is shown in Figure 10. When the deformation temperature is constant, with the change of strain rate, the change of α phase is mainly reflected in the grain shape—the phase content has no obvious change. Moreover, because the α phase grains are in a hexagonal, close-packed structure (HCP), and the β phase grains are in a body-centered cubic structure (BCC), the latter lattice structure has better plasticity, due to it possessing more slip systems. Therefore, the shape of the β grains are elongated more obviously. When the strain rate is 0.1 s−1, the distortion activation energy can meet the energy requirement of recrystallization, but the deformation time is too short to allow the atoms to fully diffuse, so the recrystallization phenomenon is not obvious [17]. When the strain rate is reduced to 0.001 s−1, the dynamic recrystallization process has enough time to further refine the microstructure, so that the plasticity of the material is enhanced and the elongation is continuously increased, which reasonably reflects the macroscopic mechanical properties of the TA32 alloy.
3.2. The Forming Limit Curve at an Elevated Temperature
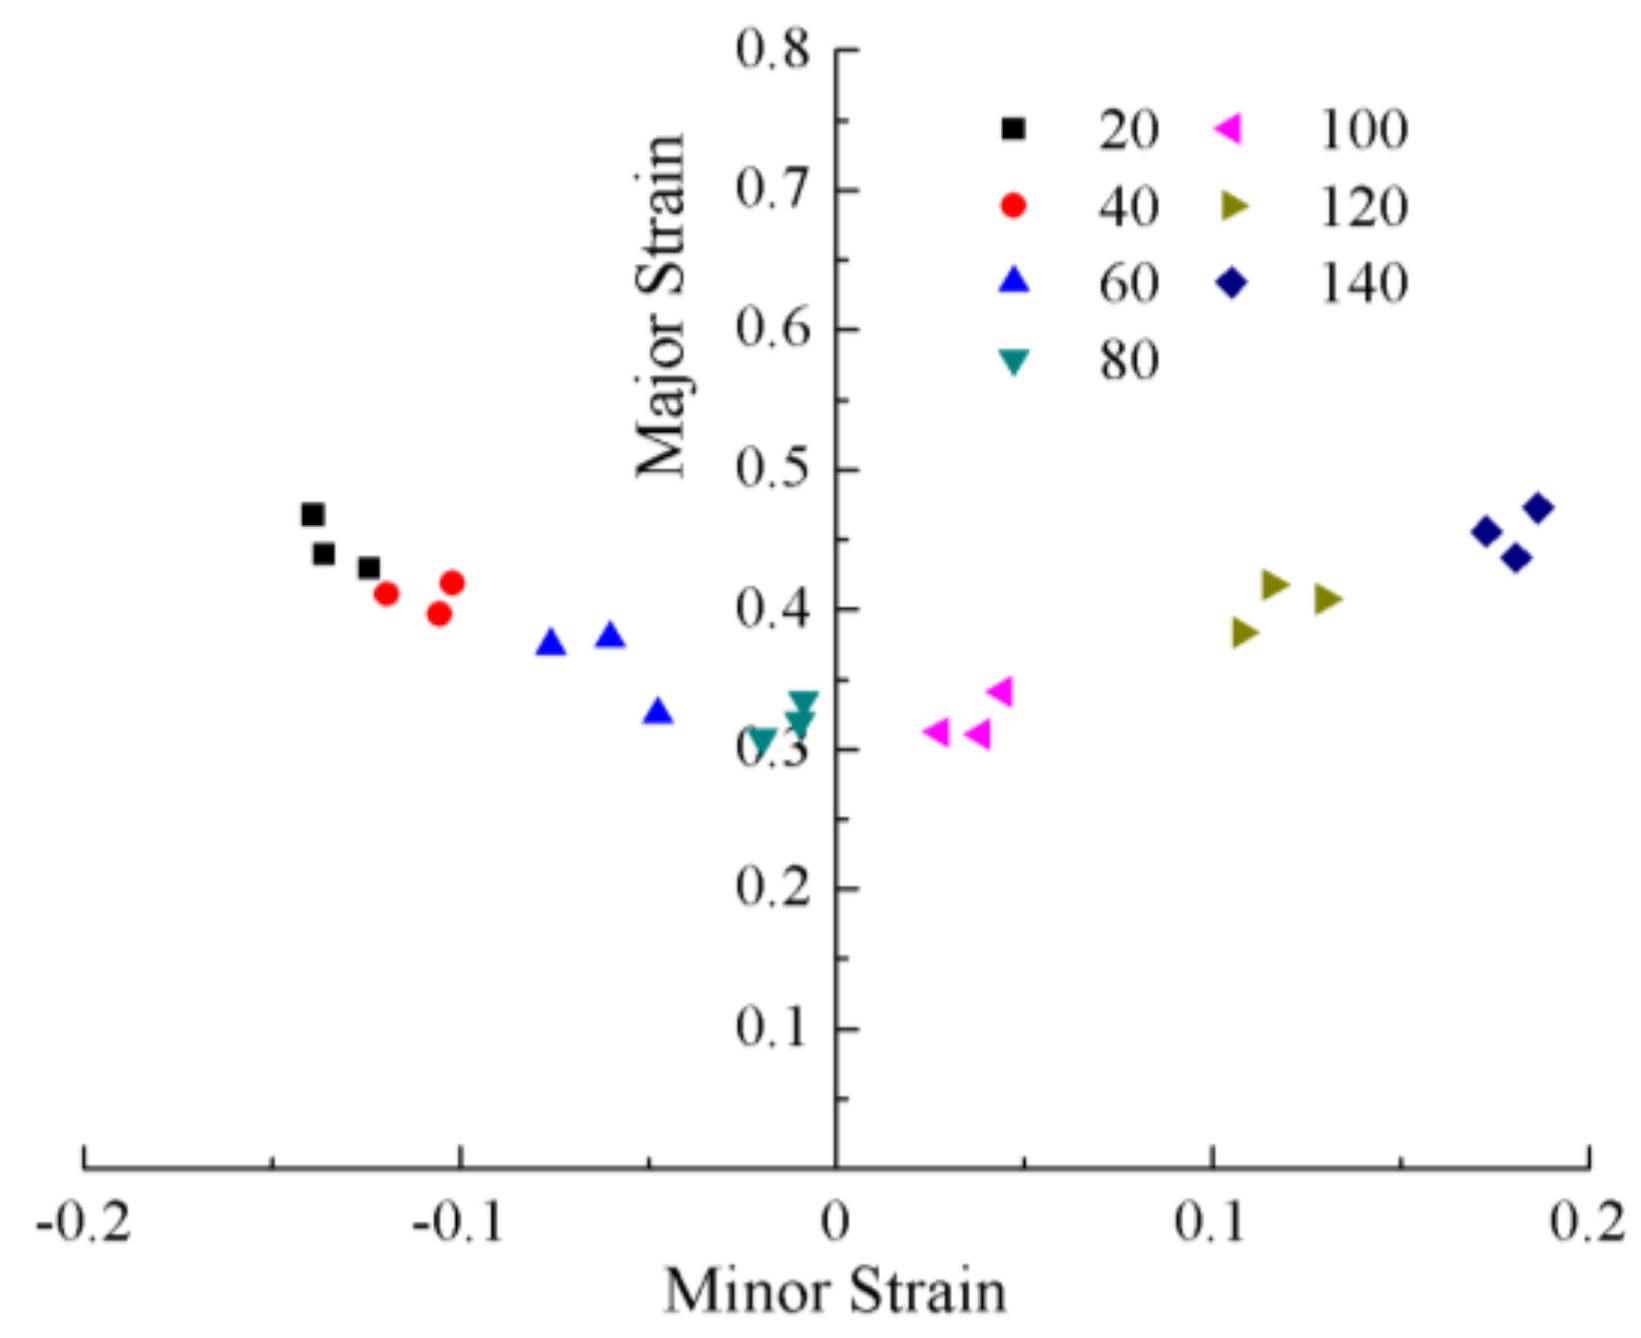
After the Nakazima test, the grids near the fracture region of the deformed specimen were selected to measure the forming limit strain point. In the limit strain evaluation process, the fracture region should be located near the centerline of the deformed specimen. Furthermore, the distance between the measured grid and the crack cannot exceed the size of one grid, and the strain points of the selected grid are measured three times for determining the average value. In this paper, the grid–triangle nodes method proposed by Vogel and Lee [18] were used to calculate the limit strain. Figure 11 shows the measured forming limit strain points from each deformed FLC specimen. It can be seen that as the specimen width increases, the position of the limit strain point in the strain space moves from left to right, and the major limit strain of the TA32 alloy sheet at the plane strain state was about 0.31.
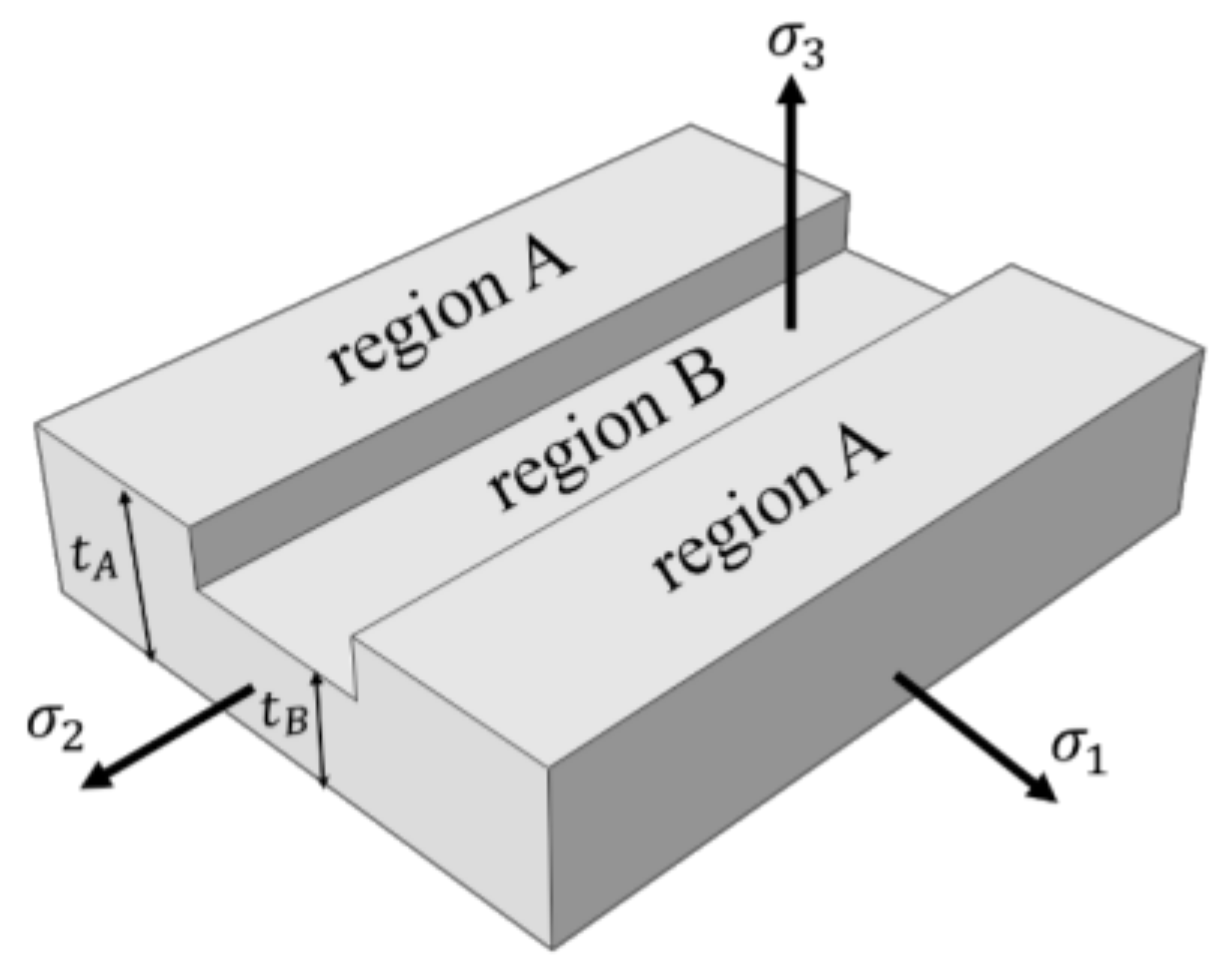
In the M–K model, it is assumed that there is a shallow groove on the sheet surface which causes the localized necking, as shown in Figure 12. The safe region is called “A” and the groove region is named “B”. The safe region is subjected to proportional strains, and it is assumed that strains at the groove direction are equal in the two regions. The initial inhomogeneity factor of the groove is defined as the thickness ratio , where represents the thickness and subscript “0” represents the initial state. This initial inhomogeneity grows continuously with plastic straining to form a localized neck eventually [19]. During the deformation process, the strain ratio outside the groove is constant, but decreases in the groove region.
To start the analysis, a small certain value for (0.001) was applied, with which we could calculate and , and got value of with the volume condition . The equivalent strain would be obtained by . For each strain increment in the safe region, there was a corresponding strain increment in the groove region. Finding the value of involved an iterative procedure. A force equilibrium equation () and compatibility condition () was used to link region A and region B with the following equation:
where , , and are the material coefficients of the Misiolek equation, and can be determined from the associated yield criterion.
After was obtained in each step, it was compared to , and if the necking had begun and and were saved; otherwise, a greater value for was assumed and the process repeated. This procedure was done for different values of strain ratios until the whole diagram was computed. The calculation process was programmed by MATLAB software.
According to Equation (4), the determination of and are dependent on the employed yield criterion, the utilization of different yield criteria results in different critical strains, and correspondingly different FLCs. Three yield criteria that have been used extensively to study forming limit of sheet metals, namely Von Mises, Hill48, and Logan–Hosford, were used to predict the FLCs for the TA32 alloy.
The Von Mises yield criterion [20] states that under certain deformation conditions, when the second invariant of the stress deflection tensor at a point in the stressed object reaches a certain value, the point begins to enter a plastic state. Its yield function is represented by principal stress as
The Hill48 yield criterion [21] considers that the material was supposed to have an anisotropy property with three orthogonal symmetric planes. The yield criterion can be written as a function of principal stresses:
where is an average anisotropic parameter, determined from hot tensile texts at , 45, and 90 to the rolling direction (). The measured values of the TA32 alloy at the temperatures of 700 °C, 750 °C, and 800 °C were 0.836, 0.839, and 0.726, respectively.
Independently of Hill, Hosford proposed a yield criterion in the form [22]
where the exponent parameter is an integer greater than two. Hosford associated to the crystallographic structure of the material and concluded that the best approximation was given by for BCC materials and for FCC materials. However, in this paper, the temperature of the Nakazima test was 750 °C, which is different from the transformation point of TA32 alloy; the lattice structure was mainly the close-packed hexagonal, and the value of was not certain. Therefore, the values of the exponential parameter were considered to be 4, 6, and 8, respectively, in order to calculate the theoretical FLC.
By measured the width strain and the thickness strain at the necking position of the specimens in the hot tensile test, the strain in the tensile direction was obtained according to the volume invariance principle, and the necking points (,) under different temperature and strain rates were obtained. The M–K model based on the Misiolek constitutive equation and Mises yield criterion was selected to predict the FLCs under the corresponding conditions. In addition, the effect of the initial inhomogeneity factor to the prediction of forming limits cannot be ignored. By comparing the distances between the measured necking points and the theoretical FLCs under different strain rates of a certain temperature, the value of is adjusted to minimize the average distance. Using this method, the values of at the temperature of 700, 750, and 800 °C were determined to be 0.98, 0.993, and 0.996, respectively. Comparisons between the necking points of the hot tensile test and theoretical FLCs under different strain rates at 700, 750, and 800 °C is shown in Figure 13. It can be seen that the theoretical FLCs can agree well with every necking point.
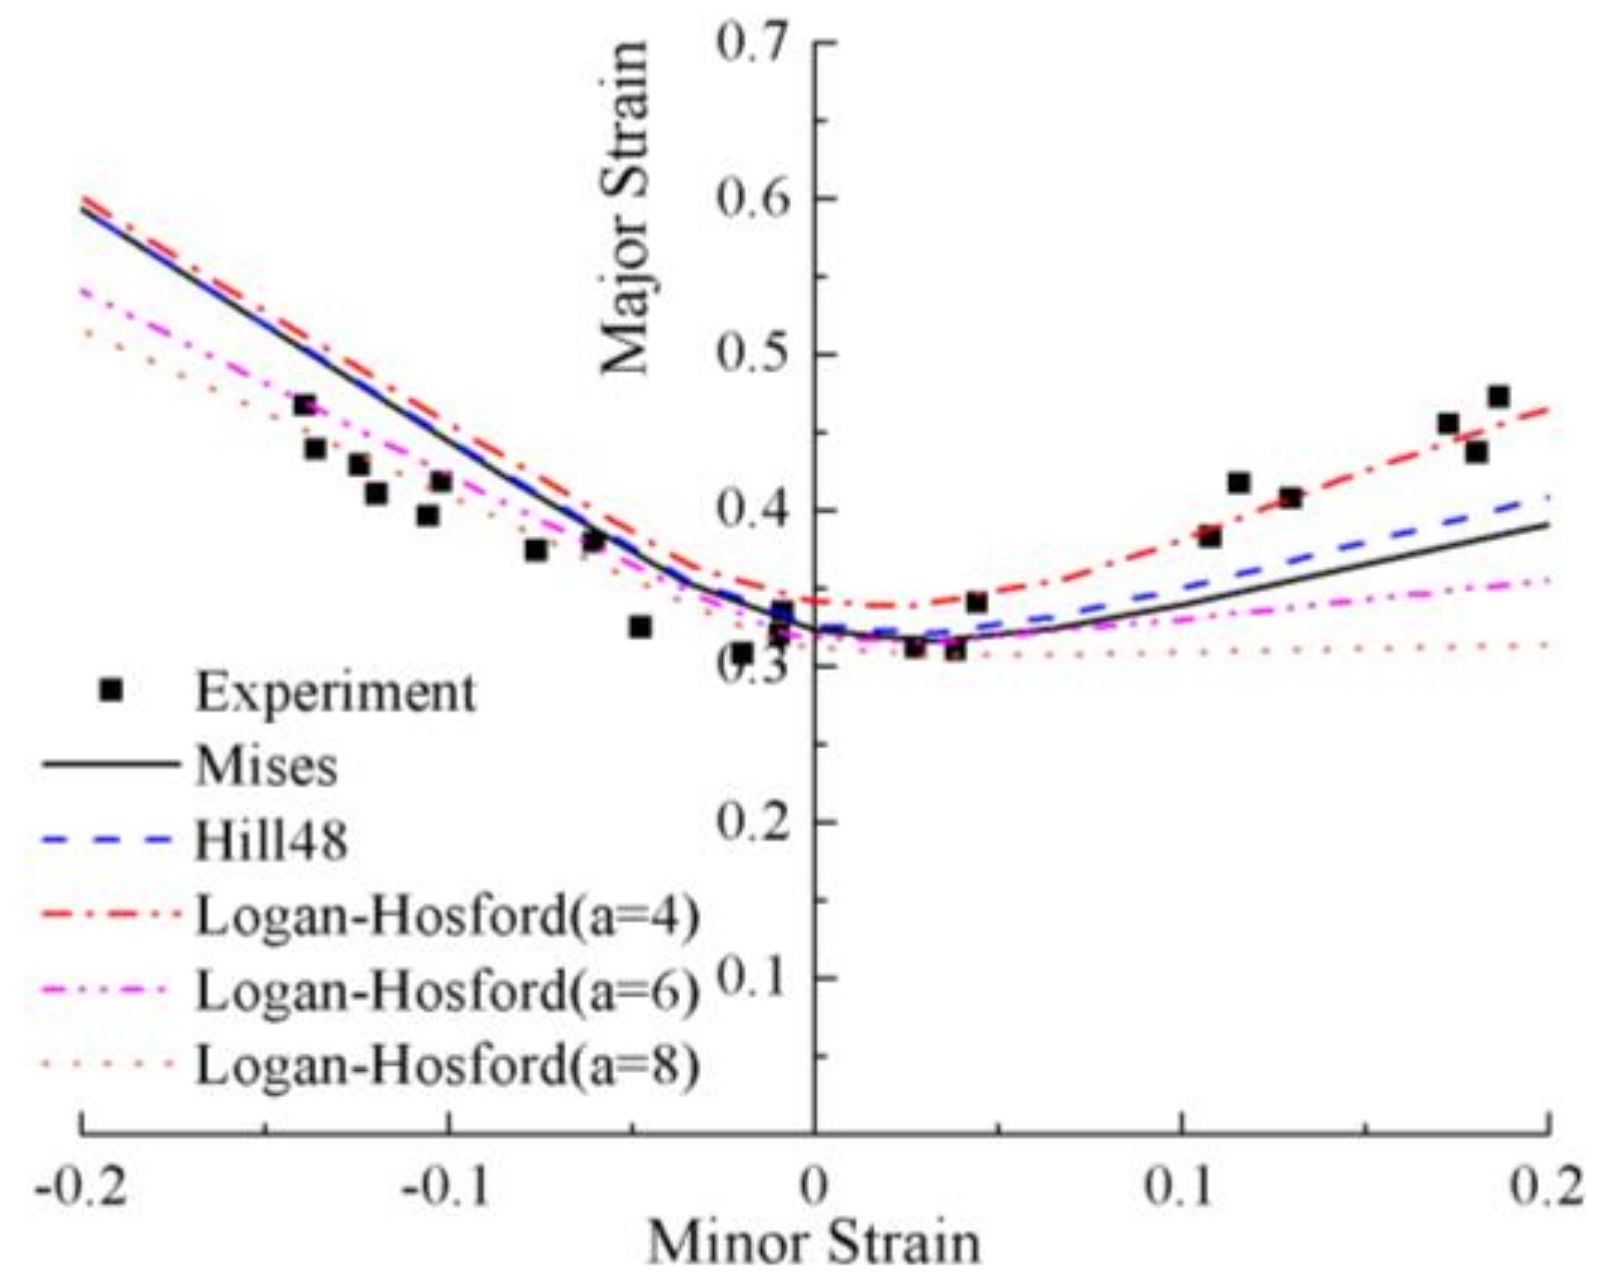
Figure 14 shows the comparison between theoretical FLCs with different yield criteria and experimental forming limit strain points at 750 °C. For theoretical analysis, yield surfaces were described by Mises, Hill48, and Logan–Hosford yield functions, and the hardening model was expressed by the Misiolek equation. In Figure 14, on the left-hand side of the FLD, the application of different yield criteria has little effect on the theoretical calculation results, while the differences are obvious on the right-hand side of the FLD. The results of two predicted FLCs based on the Mises and Hill48 yield criterion are very close. This is because the anisotropic parameter of the sheet is 0.839 at 750 °C, which is close to 1, and the yield function of the two yield criteria is the same when = 1. In addition, it can be seen that when the Logan–Hosford yield criterion is used for theoretical prediction, the change of the exponential parameter has little effect on the prediction result of the hot tensile zone—while in the biaxial tensile zone, the theoretical FLCs increase with a decreasing -value. The theoretical prediction result is the most consistent with the experimental data when .
3.3. Prediction of Fracture Behavior in Hot Press Forming
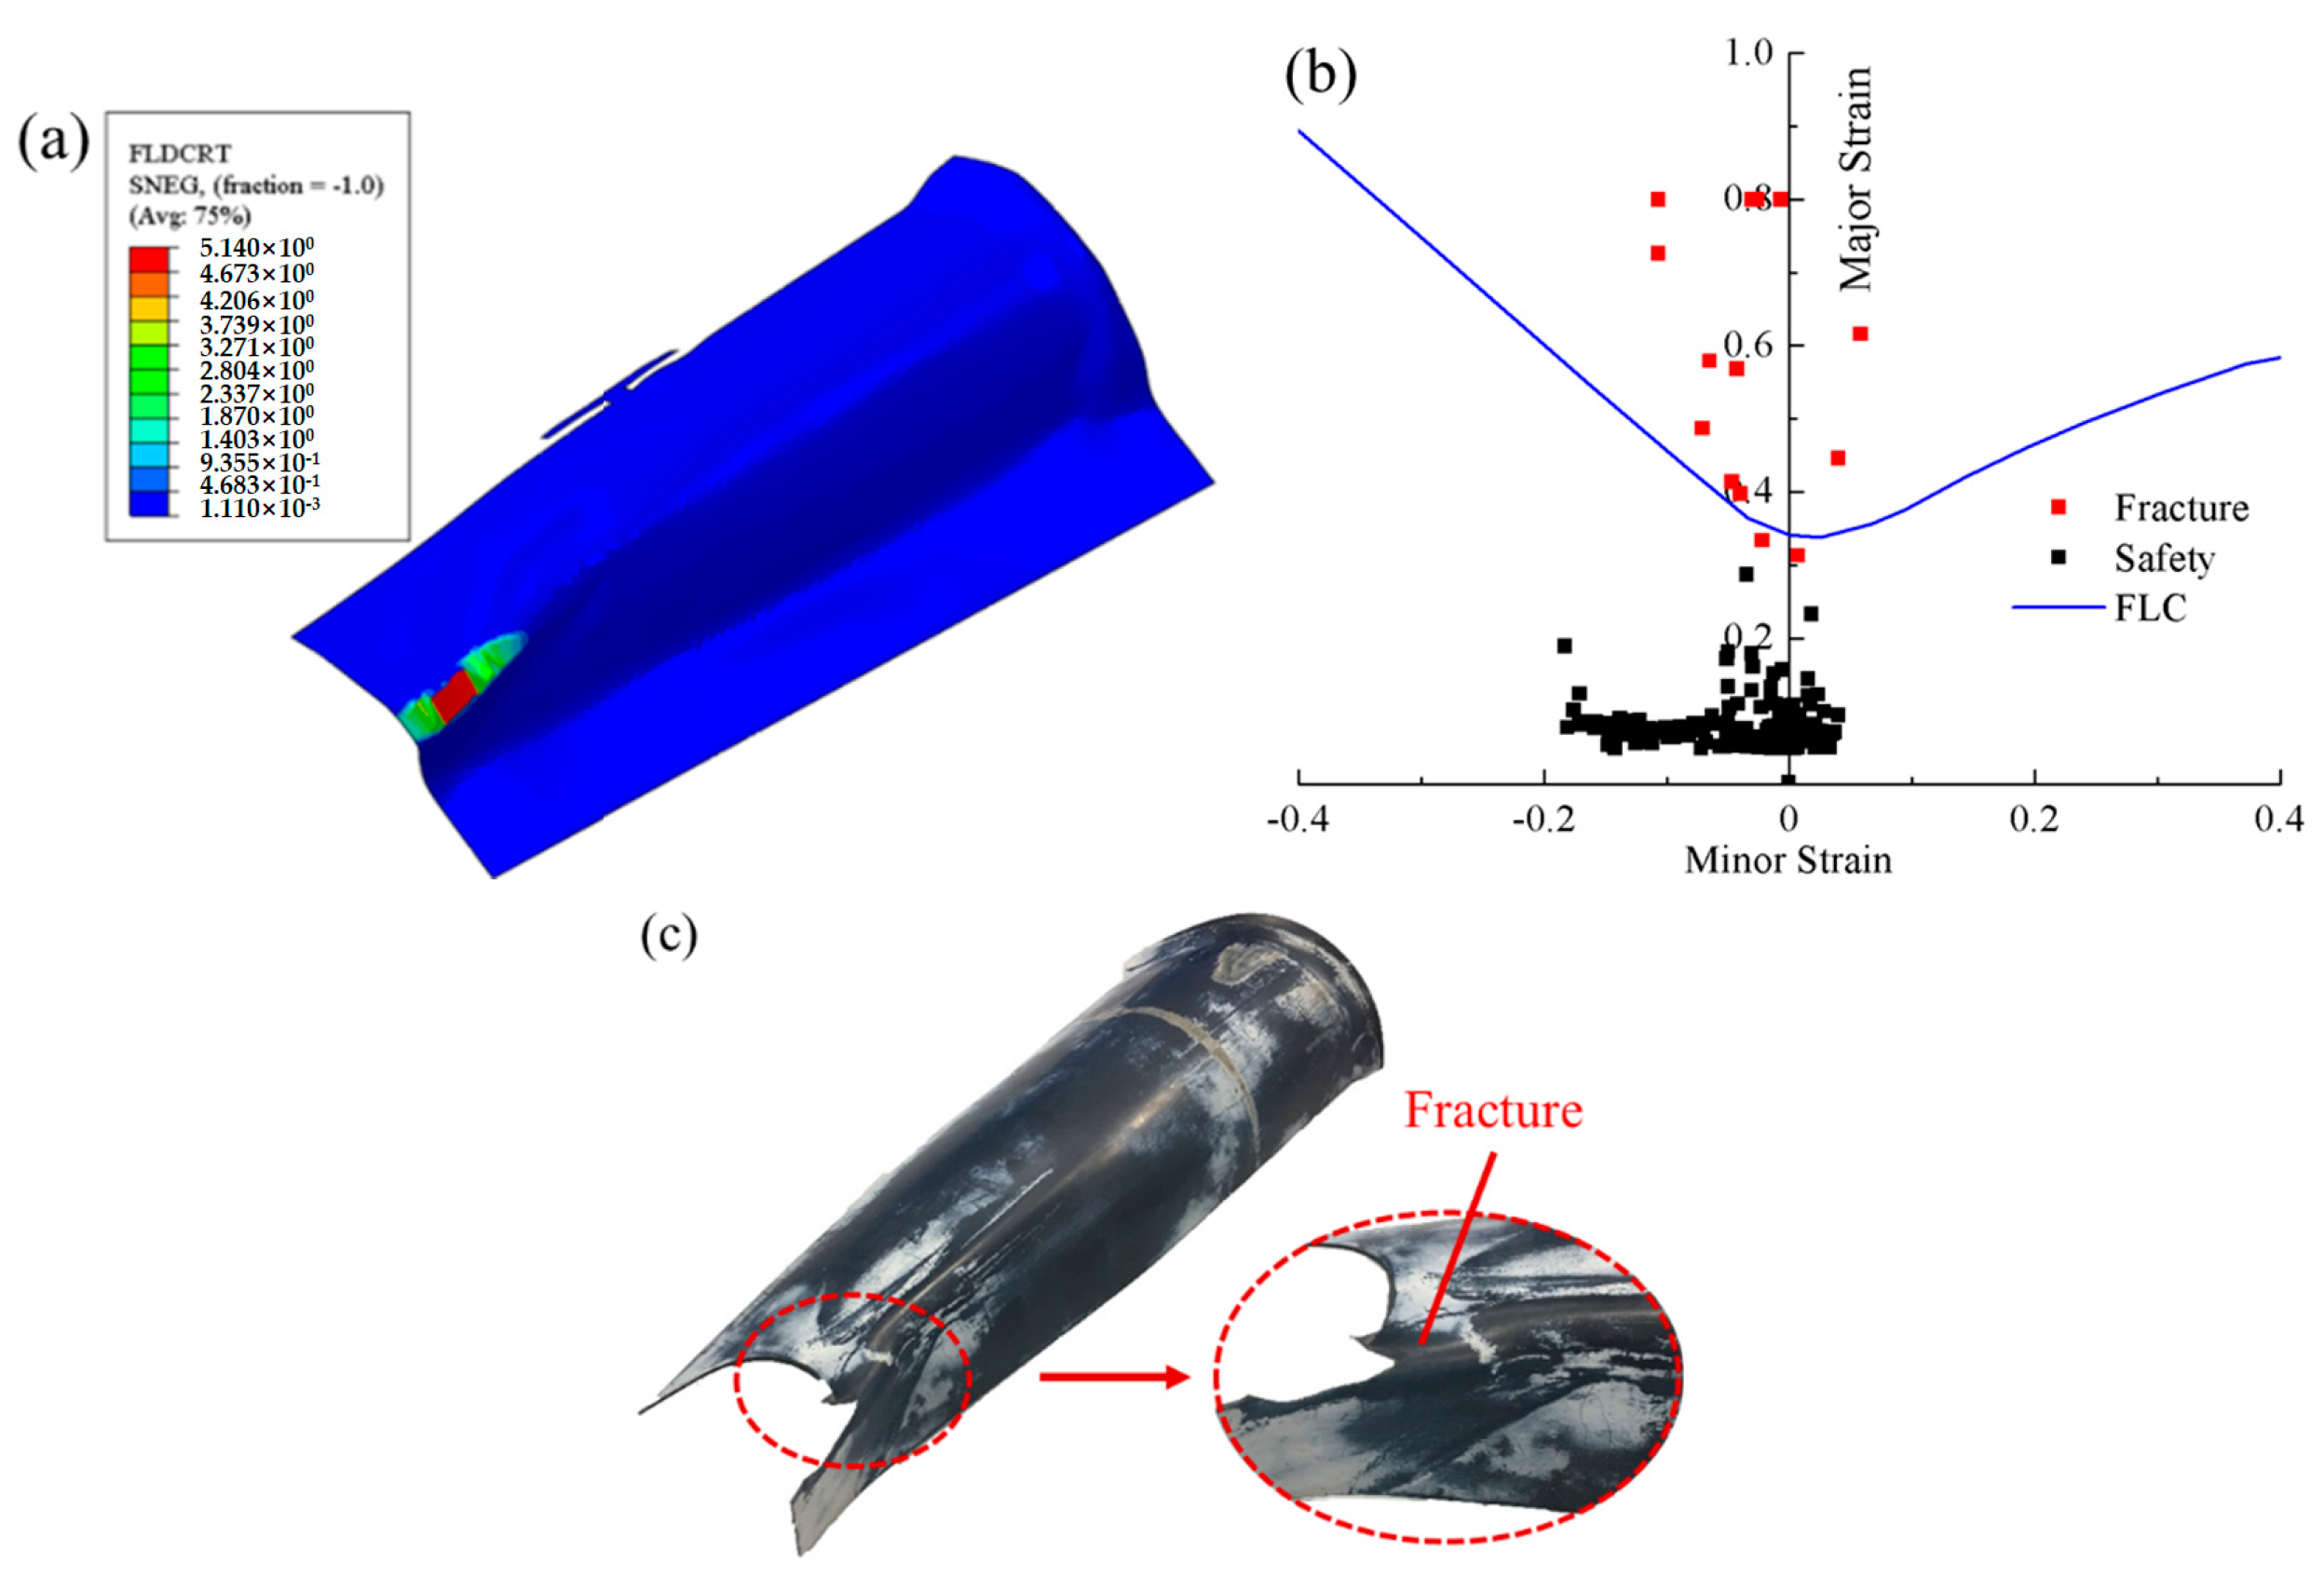
This paper adopted the FEM to predict fracture behavior in HPF. The theoretical FLC, based on the Logan–Hosford yield criterion with , was imported into the FLD Damage module in the ABAQUS software, and the calculated forming limit diagram damage initiation criterion (FLDCRT) chart is shown in Figure 15a. The FLDCRT chart can visually reflect the fracture position of the component. When FLDCRT = 1, it indicates that the strain state just reaches the limit strain, and FLDCRT < 1 indicates that the sheet is safe—otherwise, fracture occurs. Therefore, the fracture zone will be generated at the sharp corner position of the sheet. Figure 15b shows the comparison between the strain states of the grids of the fracture zone in the model and the theoretical FLC. Obviously, there are many fracture points above the FLC. Figure 15c shows the actual deformed component, and it can be found that fracture indeed occurred at the sharp corner of the component, which is consistent with the simulation result.
The reason for this phenomenon was that the material mobility at the sharp corner position of the component was restricted by the molds. After optimizing the shape of the sheet, the FLDCRT chart simulated by ABAQUS software is shown in Figure 16a. It can be seen that the maximum value of FLDCRT at the sharp corner of sheet is 0.86, which is less than 1, indicating that the complex component can be properly formed. Figure 16b shows that the strain state of the grids of the fracture zone in the model are all at the safety point below the predicted FLC. Figure 16c shows the actual deformed component after optimizing the sheet. It can be seen that the sharp corner of sheet was well formed without cracking, which is again consistent with the simulation result.
In this study, the theoretical FLC calculated by the M–K theory was in conjunction with the finite element simulation to accurately predict the fracture behavior of TA32 alloy sheet during the HPF process, which can effectively optimize the shape of the sheet and process parameters. This method is efficient and reliable for the industrial applications of a TA32 titanium alloy rolled sheet.
4. Conclusions
This work focused on the fracture behavior of a TA32 alloy rolled sheet in hot press forming. The hot tensile behavior, microstructure evolution, and forming limit of a TA32 alloy rolled sheet were studied in this paper. Furthermore, FEM was used to accurately predict the fracture behavior of the TA32 alloy sheet during the HPF process, and the qualified complex component was obtained by optimizing the shape of the sheet. Some conclusions were summarized as follows:
- (1)
- The flow stresses of TA32 alloy at the temperature range of 700–800 °C, with the strain rate of 0.1–0.001 s−1, are accurately characterized by the Misiolek constitutive equation, which is expressed as ; this equation was used for the calculation of a theoretical FLC. The microstructure evolution of the TA32 alloy is related to the temperature and the strain rate. The dynamic recrystallization temperature at the strain rate of 0.001 s−1 is 750 °C. When the temperature is constant, the lower strain rate provides sufficient time for the dynamic recrystallization process to further refine the microstructure.
- (2)
- The forming limit of a TA32 alloy at the temperature of 750 °C was measured and predicted by the Nakazima test and the M-K theory, respectively. The predicted FLC calculated by the Logan–Hosford yield criterion with the exponential parameter is the optimal result for predicting the forming limit strain points of the Nakazima test.
- (3)
- The fracture behavior of the TA32 alloy sheet during the HPF process was accurately predicted by combining the predicted FLC and ABAQUS software, and the qualified complex component was obtained by optimizing the shape of the sheet. This method can be used to optimize the initial configuration of a metal sheet in HPF, and provides guidance for the further application of TA32 alloy in engineering practice.
Author Contributions
Conceptualization, R.F., M.C. and Y.W.; Methodology, R.F.; Software, R.F.; Validation, R.F. and Y.W.; Formal Analysis, R.F.; Investigation, R.F.; Resources, M.C. and L.X.; Data Curation, R.F.; Writing-Original Draft Preparation, R.F.; Writing-Review & Editing, R.F., M.C. and Y.W.; Visualization, R.F.; Supervision, M.C. and L.X.; Project Administration, M.C. and Y.W.; Funding Acquisition, Y.W.
Funding
The authors gratefully acknowledge the financial support from the National Natural Science Foundation of China under Grant No.51805256, and appreciate the helpful comments from the reviewers.
Conflicts of Interest
The authors declare no conflicts of interest.
References
- Banerjeea, D. Perspectives on Titanium Science and Technology. Acta Mater. 2013, 61, 844–879. [Google Scholar] [CrossRef]
- Wang, Q.J.; Liu, J.R.; Yang, R. High Temperature Titanium Alloys: Status and Perspective. J. Aeronaut. Mater. 2014, 34, 1–26. [Google Scholar]
- Lee, M.G.; Kim, S.J.; Han, H.N. Finite element investigations for the role of transformation plasticity on springback in hot press forming process. Comp. Mater. Sci. 2010, 47, 556–567. [Google Scholar] [CrossRef]
- Saboori, A.; Gallo, D.; Biamino, S.; Fino, P.; Lombardi, M. An Overview of Additive Manufacturing of Titanium Components by Directed Energy Deposition: Microstructure and Mechanical Properties. Appl. Sci. 2017, 7, 883. [Google Scholar] [CrossRef]
- Keeler, S.P.; Backofen, W. Plastic instability and fracture in sheets stretched over rigid punches. ASM Trans. 1963, 56, 25–48. [Google Scholar]
- Goodwin, G. Application of Strain Analysis to Sheet Metal Forming Problems in the Press Shop; SAE International: Warrendale, PA, USA, 1968. [Google Scholar]
- Marciniak, Z.; Kuczynski, K.; Pokora, T. Influence of the plastic properties of a material on the forming limit diagram for sheet metal in tension. Int. J. Mech. Sci. 1973, 15, 789–800. [Google Scholar] [CrossRef]
- Ahmadi, S.; Eivani, A.R.; Akbarzadeh, A. An experimental and theoretical study on the prediction of forming limit diagrams using new BBC yield criteria and M–K analysis. Comput. Mater. Sci. 2009, 44, 1272–1280. [Google Scholar] [CrossRef]
- Li, H.; Wu, X.; Li, G. Prediction of Forming Limit Diagrams for 22MnB5 in Hot Stamping Process. J. Mater. Eng. Perform. 2013, 22, 2131–2140. [Google Scholar] [CrossRef]
- Kotkunde, N.; Srinivasan, S.; Krishna, G.; Gupta, A.K.; Singh, S.K. Influence of material models on theoretical forming limit diagram prediction for Ti–6Al–4V alloy under warm condition. Trans. Nonferr. Met. Soc. 2016, 26, 736–746. [Google Scholar] [CrossRef]
- Nedoushan, R.J.; Farzin, M.; Banabic, D. Simulation of hot forming processes: Using cost effective micro-structural constitutive models. Int. J. Mech. Sci. 2014, 85, 196–204. [Google Scholar] [CrossRef]
- Odenberger, E.L.; Oldenburg, M.; Thilderkvist, P.; Stoehr, T.; Lechler, J.; Merklein, M. Tool development based on modelling and simulation of hot sheet metal forming of Ti–6Al–4V titanium alloy. J. Mater. Process. Technol. 2011, 211, 1324–1335. [Google Scholar] [CrossRef]
- Zhao, B.; Li, Z.; Hou, H.; Liao, J.; Bai, B. Three dimensional FEM simulation of titanium hollow blade forming process. Rare Met. Mater. Eng. 2010, 39, 963–968. [Google Scholar]
- Nakazima, K.; Kikuma, T.; Hasuka, K. Study on the formability of steel sheets. Yawata Tech. Rep. 1968, 284, 140–141. [Google Scholar]
- Gronostajski, Z. The constitutive equations for FEM analysis. J. Mater. Process. Technol. 2000, 106, 40–44. [Google Scholar] [CrossRef]
- Saboori, A.; Dadkhah, M.; Pavese, M.; Manfredi, D.; Biamino, S. Hot deformation behavior of Zr-1%Nb alloy: Flow curve analysis and microstructure observations. Mater. Sci. Eng. A 2017, 696, 366–373. [Google Scholar] [CrossRef]
- Humphreys, F.J.; Hatherly, M. Recrystallization and Related Annealing Phenomena, 2nd ed.; Elsevier: Amsterdam, The Netherlands, 2004. [Google Scholar]
- Vogel, J.H.; Lee, D. An automated two-view method for determining strain distributions on deformed surfaces. J. Mater. Shap. Technol. 1988, 6, 205–216. [Google Scholar] [CrossRef]
- Assempour, A.; Safikhani, A.R.; Hashemi, R. An improved strain gradient approach for determination of deformation localization and forming limit diagrams. J. Mater. Process. Technol. 2009, 209, 1758–1769. [Google Scholar] [CrossRef]
- Mises, R.V. Mechanik der festen Körper im plastisch-deformablen Zustand. Göttin Nachr. Math.Phys. 1913, 1, 582–592. [Google Scholar]
- Hill, R. A theory of the yielding and plastic flow of anisotropic metals. Proc. Royal. Soc. A 1948, 193, 281–297. [Google Scholar] [CrossRef]
- Logan, R.W.; Hosford, W.F. Upper-bound anisotropic yield locus calculations assuming 〈111〉-pencil glide. Int. J. Mech. Sci. 1980, 22, 419–430. [Google Scholar] [CrossRef]
Figure 1.
Microstructure of as-received TA32 alloy.

Figure 2.
(a) Tensile specimen size and (b) the hot tensile test process.

Figure 3.
The specimens before and after the hot tensile test.

Figure 4.
(a) Schematic diagram of the Nakazima test. (b) The forming limit curve (FLC) experimental platform.
Figure 4.
(a) Schematic diagram of the Nakazima test. (b) The forming limit curve (FLC) experimental platform.

Figure 5.
(a) The sizes of FLC specimens (b = 20406080100120140; a = b + 20. (b) The deformed FLC specimens.
Figure 5.
(a) The sizes of FLC specimens (b = 20406080100120140; a = b + 20. (b) The deformed FLC specimens.

Figure 6.
(a) Schematic diagram of hot forming test. (b) The appearance of the test platform.

Figure 7.
The assembly diagram of the model.

Figure 8.
Comparison between the experimental and fitted curve under different strain rates at (a) 700 °C, (b) 750 °C, and (c) 800 °C.
Figure 8.
Comparison between the experimental and fitted curve under different strain rates at (a) 700 °C, (b) 750 °C, and (c) 800 °C.

Figure 9.
Microstructure of the TA32 alloy under different temperatures, with a strain rate of 0.001 s−1: (a) 700 °C, (b) 750 °C, and (c) 800 °C.
Figure 9.
Microstructure of the TA32 alloy under different temperatures, with a strain rate of 0.001 s−1: (a) 700 °C, (b) 750 °C, and (c) 800 °C.


Figure 10.
Microstructure of the TA32 alloy under different strain rates at 750 °C: (a) = 0.1 s−1, (b) = 0.01 s−1, (c) = 0.001 s−1
Figure 10.
Microstructure of the TA32 alloy under different strain rates at 750 °C: (a) = 0.1 s−1, (b) = 0.01 s−1, (c) = 0.001 s−1

Figure 11.
The measured forming limit strain points from each deformed FLC specimen.

Figure 12.
Schematic of the Marciniak–Kuczynski (M–K) model.

Figure 13.
Comparisons between the necking points of hot tensile test and theoretical FLCs under different strain rates at (a) 700 °C, (b) 750 °C, and (c) 800 °C.
Figure 13.
Comparisons between the necking points of hot tensile test and theoretical FLCs under different strain rates at (a) 700 °C, (b) 750 °C, and (c) 800 °C.

Figure 14.
Comparisons between theoretical FLCs with different yield criteria and experimental forming limit strain points at 750 °C.
Figure 14.
Comparisons between theoretical FLCs with different yield criteria and experimental forming limit strain points at 750 °C.

Figure 15.
(a) FLDCRT chart, (b) forming limit diagram (FLD) result, and (c) the deformed component.
Figure 15.
(a) FLDCRT chart, (b) forming limit diagram (FLD) result, and (c) the deformed component.

Figure 16.
(a) FLDCRT chart of optimized sheet, (b) FLD result, and (c) the deformed component after optimizing the sheet.
Figure 16.
(a) FLDCRT chart of optimized sheet, (b) FLD result, and (c) the deformed component after optimizing the sheet.

© 2018 by the authors. Licensee MDPI, Basel, Switzerland. This article is an open access article distributed under the terms and conditions of the Creative Commons Attribution (CC BY) license (http://creativecommons.org/licenses/by/4.0/).
Share and Cite
MDPI and ACS Style
Fan, R.; Chen, M.; Wu, Y.; Xie, L. Prediction and Experiment of Fracture Behavior in Hot Press Forming of a TA32 Titanium Alloy Rolled Sheet. Metals 2018, 8, 985. https://doi.org/10.3390/met8120985
AMA Style
Fan R, Chen M, Wu Y, Xie L. Prediction and Experiment of Fracture Behavior in Hot Press Forming of a TA32 Titanium Alloy Rolled Sheet. Metals. 2018; 8(12):985. https://doi.org/10.3390/met8120985
Chicago/Turabian StyleFan, Ronglei, Minghe Chen, Yong Wu, and Lansheng Xie. 2018. "Prediction and Experiment of Fracture Behavior in Hot Press Forming of a TA32 Titanium Alloy Rolled Sheet" Metals 8, no. 12: 985. https://doi.org/10.3390/met8120985
Note that from the first issue of 2016, this journal uses article numbers instead of page numbers. See further details here.