Article

Springback Prediction of Aluminum Alloy Sheet under Changing Loading Paths with Consideration of the Influence of Kinematic Hardening and Ductile Damage †

1
School of Mechanical, Electrical and Information Engineering, Shandong University at Weihai, Weihai 264209, China
2
Pinggao Group Weihai High Voltage Apparatus CO., LTD., Weihai 264209, China
3
ICD/LASMIS-CNRS-FRE-2848-University of Technology of Troyes, 12, rue Marie Curie, CS 42060, 10004 Troyes CEDEX, France
*
Author to whom correspondence should be addressed.
This paper is an extend version of our paper published in 17th International Conference on Metal Forming, Metal Forming 2018, Toyohashi, Japan, 16–19 September 2018.
Metals 2018, 8(11), 950; https://doi.org/10.3390/met8110950
Submission received: 20 October 2018 / Revised: 7 November 2018 / Accepted: 13 November 2018 / Published: 14 November 2018
(This article belongs to the Special Issue Modelling and Simulation of Sheet Metal Forming Processes)

Abstract

:
Springback prediction of sheet metal forming is always an important issue in the industry, because it greatly affects the final shape of the product. The accuracy of simulation prediction depends on not only the forming condition but also the chosen material model, which determines the stress and strain redistributions in the formed parts. In this paper, a newly proposed elastoplastic constitutive model is used, in which the initial and induced anisotropies, combined nonlinear isotropic and kinematic hardenings, as well as isotropic ductile damage, are taken into account. The aluminum alloy sheet metal AA7055 was chosen as the studied material. In order to investigate springback under non-proportional strain paths, three-point bending tests were conducted with pre-strained specimens, and five different pre-straining states were considered. The comparisons between numerical and experimental results highlighted the hard effect of both kinematic hardening and ductile damage on the springback prediction, especially for a changed loading path case.

1. Introduction

In recent years, with the rapid development of the need for lightweight materials, more high-strength aluminum alloy sheets have been widely used in the products of automotive, aerospace, and medical health fields. However, some undesirable problems during the forming of high strength sheet metal have been observed. Springback is one of these important issues, and it will affect the final appearance and accuracy of the workpiece. Sheet metal forming usually induces important and complicated plastic strain state, particularly under complex loading paths and large strain. Understanding these behaviors of sheet metal forming becomes more important, which can give great help during the tool adjustments in the metal forming process, especially for the new lightweight and high-strength materials.
The springback can be predicted using many approaches: using Finite Element Analysis (FEA) [1,2] and some analytical methods [3,4]. Large-scale numerical simulations with FEA are more widely used to predict and consequently avoid the effect of springback, especially for the geometrical complex parts. It can give fast and accurate results. The accuracy of the simulation depends on not only the forming conditions [5] but also on the material models [6,7], which are used to describe the forming behavior of the material under different forming conditions.
Li et al. have investigated the influence of element type and size and other physical effects (e.g., friction) [8] and showed the importance of accounting Bauschinger effect on the springback prediction. Oliveira et al. studied the effects of different hardening laws on the final springback prediction [9]. Armstrong and Frederick have ever proposed nonlinear kinematic hardening to improve the accuracy of springback simulation. The modified Chaboche type model with the combined isotropic-kinematic hardenings as well as the non-quadratic anisotropic yield potential Yld2000-2d has been used by Chung et al. to improve the prediction capability [10]. Chun et al. changed the isotropic part of the Chaboche model to do the simulation by explicit/implicit integral algorithm [11]. Besides the Yld2000-2d yield function, the influence of Barlat 89’s yield function on springback of sheet metal forming has also been conducted and investigated [12]. Zang et al. show the hard influence of plastic anisotropy through comparison between experiments and simulations [13].
Nowadays, more works have noticed the hard impact of Young’s modulus evolution during the unloading phase. Stoughton et al. have pointed out the difficulties and challenges of constitutive modelling of metal forming with considering the modulus variation [14]. Lee et al., based on classical Dafilias/Popov and Krieg concepts, developed a two-surface plasticity model combined with Bauschinger effect, transient behavior, and permanent softening according to the Chaboche model [15]. Recently, Govik et al. have investigated the unloading behavior of dual phase steel with micromechanical FE model exhibited non-linear strain recovery due to local plasticity caused by interaction between two phases [16]. Gau and Kinzel [17] investigated the difference of the springback angle with isotropic and kinematic hardenings. The importance of kinematic hardening on springback prediction has also been proved by the work of Wang et al. [18]. Meanwhile considering the large strain during forming, the influence of ductile damage on springback has also attracted a lot of attention [19]. So, through literature studies, it can be found that the constitutive model plays a critical role in the simulation process, including the equations of the yield surface description, hardening flow, anisotropies and texture evolution, even the ductile damage, etc. There are a lot of studies which have concluded that new and more suitable models need to be proposed in order to improve the numerical prediction accuracy [20,21].
In this paper, a newly proposed model considering initial anisotropy and subsequent yield surface distortion, non-linear combined isotropic and kinematic hardenings, and fully coupling with ductile damage [22] is used to predict the springback of aluminum alloy sheet AA7055. The nonlinear elastic unloading-reloading behavior will not be accounted for, so elastic linear unloading and reloading behavior will be considered in this model. Also, this can help better investigate the influence of kinematic hardening and ductile damage on springback. The model has been implemented in ABAQUS Standard and Explicit through the user subroutines VUMAT/UMAT. The springback phase of AA7055 sheets is investigated through three-point bending with different levels of pre-straining states. Through the comparison between numerical and experimental results, the influence of kinematic hardening and ductile damage on final springback results is discussed.

2. Constitutive Equations

The newly proposed elastoplastic constitutive equations coupled with the isotropic ductile damage, and accounting for non-linear combined isotropic and kinematic hardenings, are used to predict the springback [22]. The initial anisotropy and hardening induced subsequent yield surface distortion are also considered in the model. The following couples of state variables: ( ε _ e , σ _ ) , ( α _ , X _ ) , ( r , R ) , ( d , Y ) are included in the model, and they represent respectively the elastoplastic flow, kinematic hardening, isotropic hardening, and isotropic ductile damage, respectively. Detailed description of the fully coupled relationship can be found in the published research works [22,23].
σ _ = 2 μ e [ ( 1 d ) e _ e + + ( 1 h d ) e _ e ] + k e [ ( 1 d ) t r ( ε _ e ) ( 1 h d ) t r ( ε _ e ) ] 1 _
X _ = ( 1 d ) 2 3 C α _
R = ( 1 d γ ) Q r
Y = Y e + Y α + Y r
where e _ e denotes the deviatoric part of the elastic strain, · + and · denote positive and negative parts. μ e and K e are the classical shear and bulk elastic moduli. h is the microcracks closure parameter 0 ≤ h ≤ 1, C and Q are the hardening moduli for kinematic and isotropic hardening, respectively, γ is the parameter of damage effect on isotropic hardening. Ye, Yα, and Yr are the density energy release rates corresponding respectively to elastoplastic flow, kinematic hardening, and isotropic hardening. Details about the state variables and evolution equations are given in Appendix A.
The given model will be implemented in both ABAQUS/Standard and ABAQUS/Explicit finite element codes through the user subroutines UMAT and VUMAT. The implementation of the developed model is based on purely local implicit integration scheme used with the elastic predictor-plastic corrector approach.

3. Experimental Investigations

The AA7055 aluminum alloy sheet with 1.60 mm thickness was used for the experimental study. In order to investigate the influence of kinematic hardening and ductile damage on springback under the loading path changing, a series of tests were conducted. Firstly, the simple uniaxial tensile test, cyclic shear test, and cyclic loading-unloading tensile tests were conducted separately to determine the material parameters. In order to investigate the springback of AA7055 alloy sheet the tensile specimens were subjected to five different pre-strain states, and then bent with 25 mm depth. With the neutral layer as the boundary, the inner sheet material experiences the cyclic tension-compression loading process during tensile-bending tests. During the bending tests, the internal damage appearing in the sheet increases with plastic strains and causes the decrease of the rigidity of the material. The increase of micro-cracks and the micro-voids in the sheet reduces the stress levels in the sheet, which will affect the final formed shape.

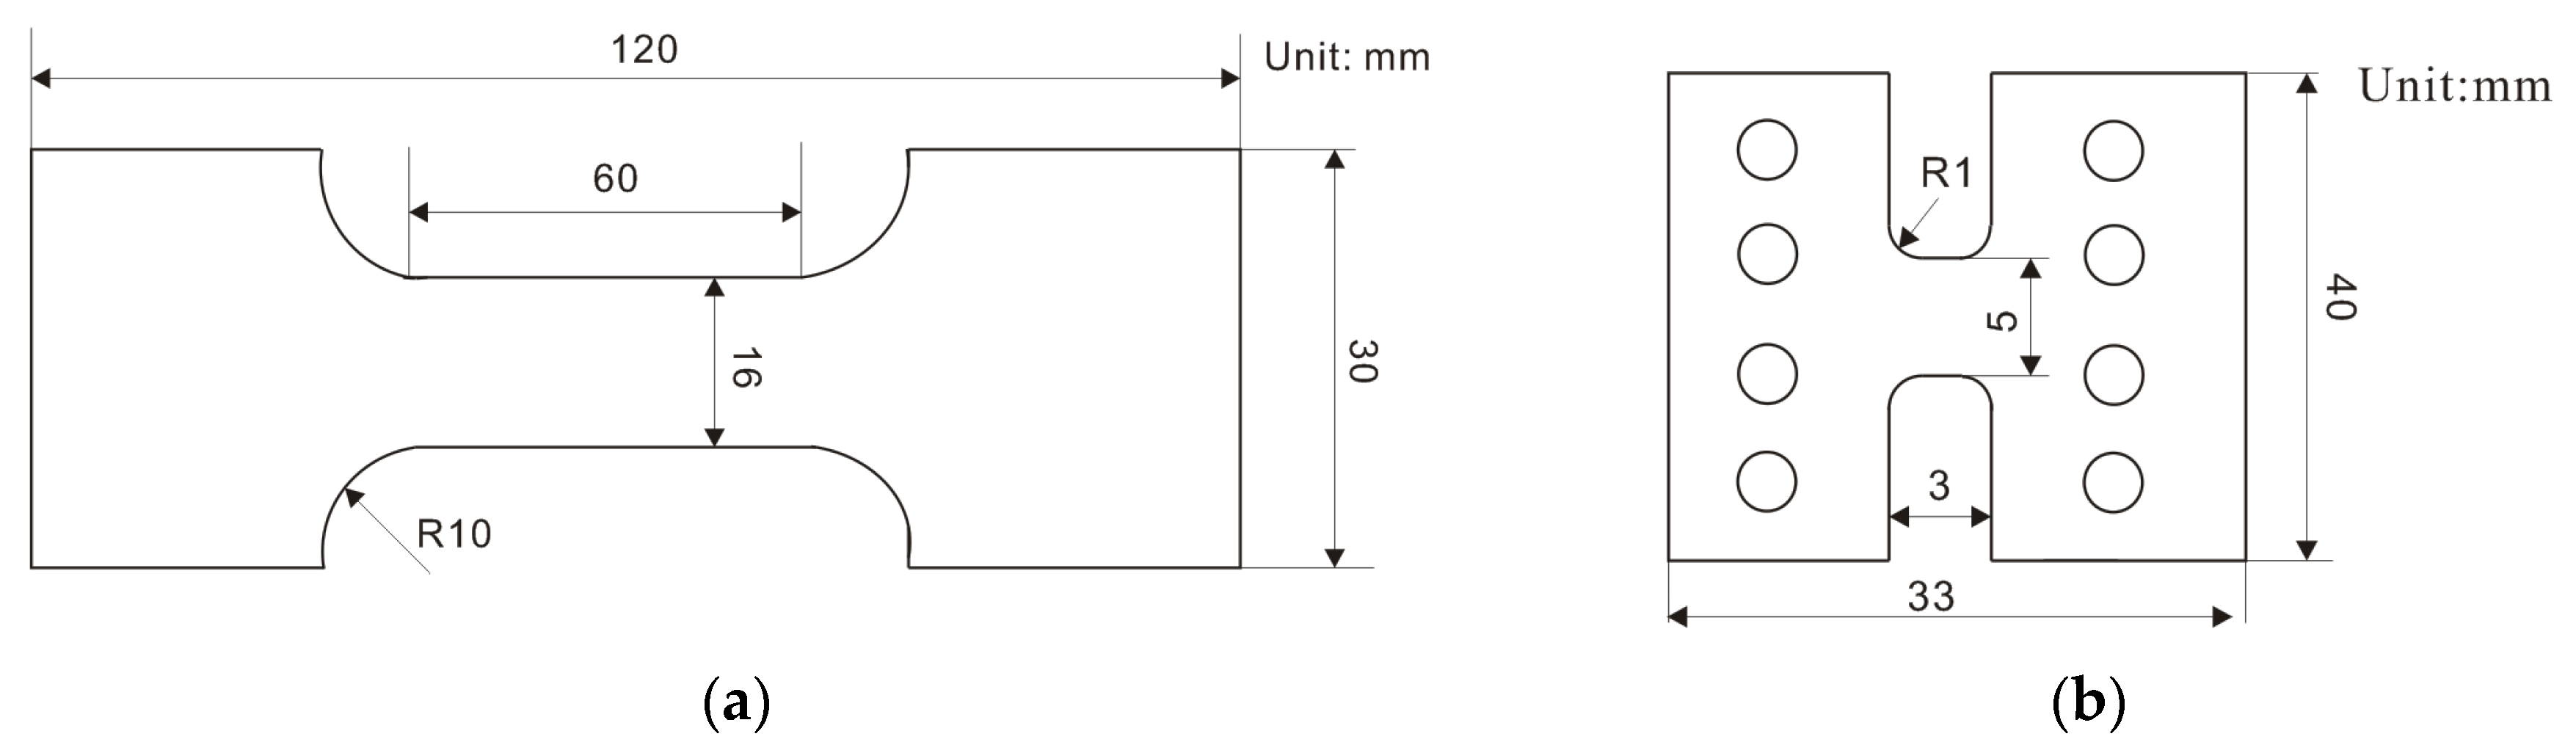
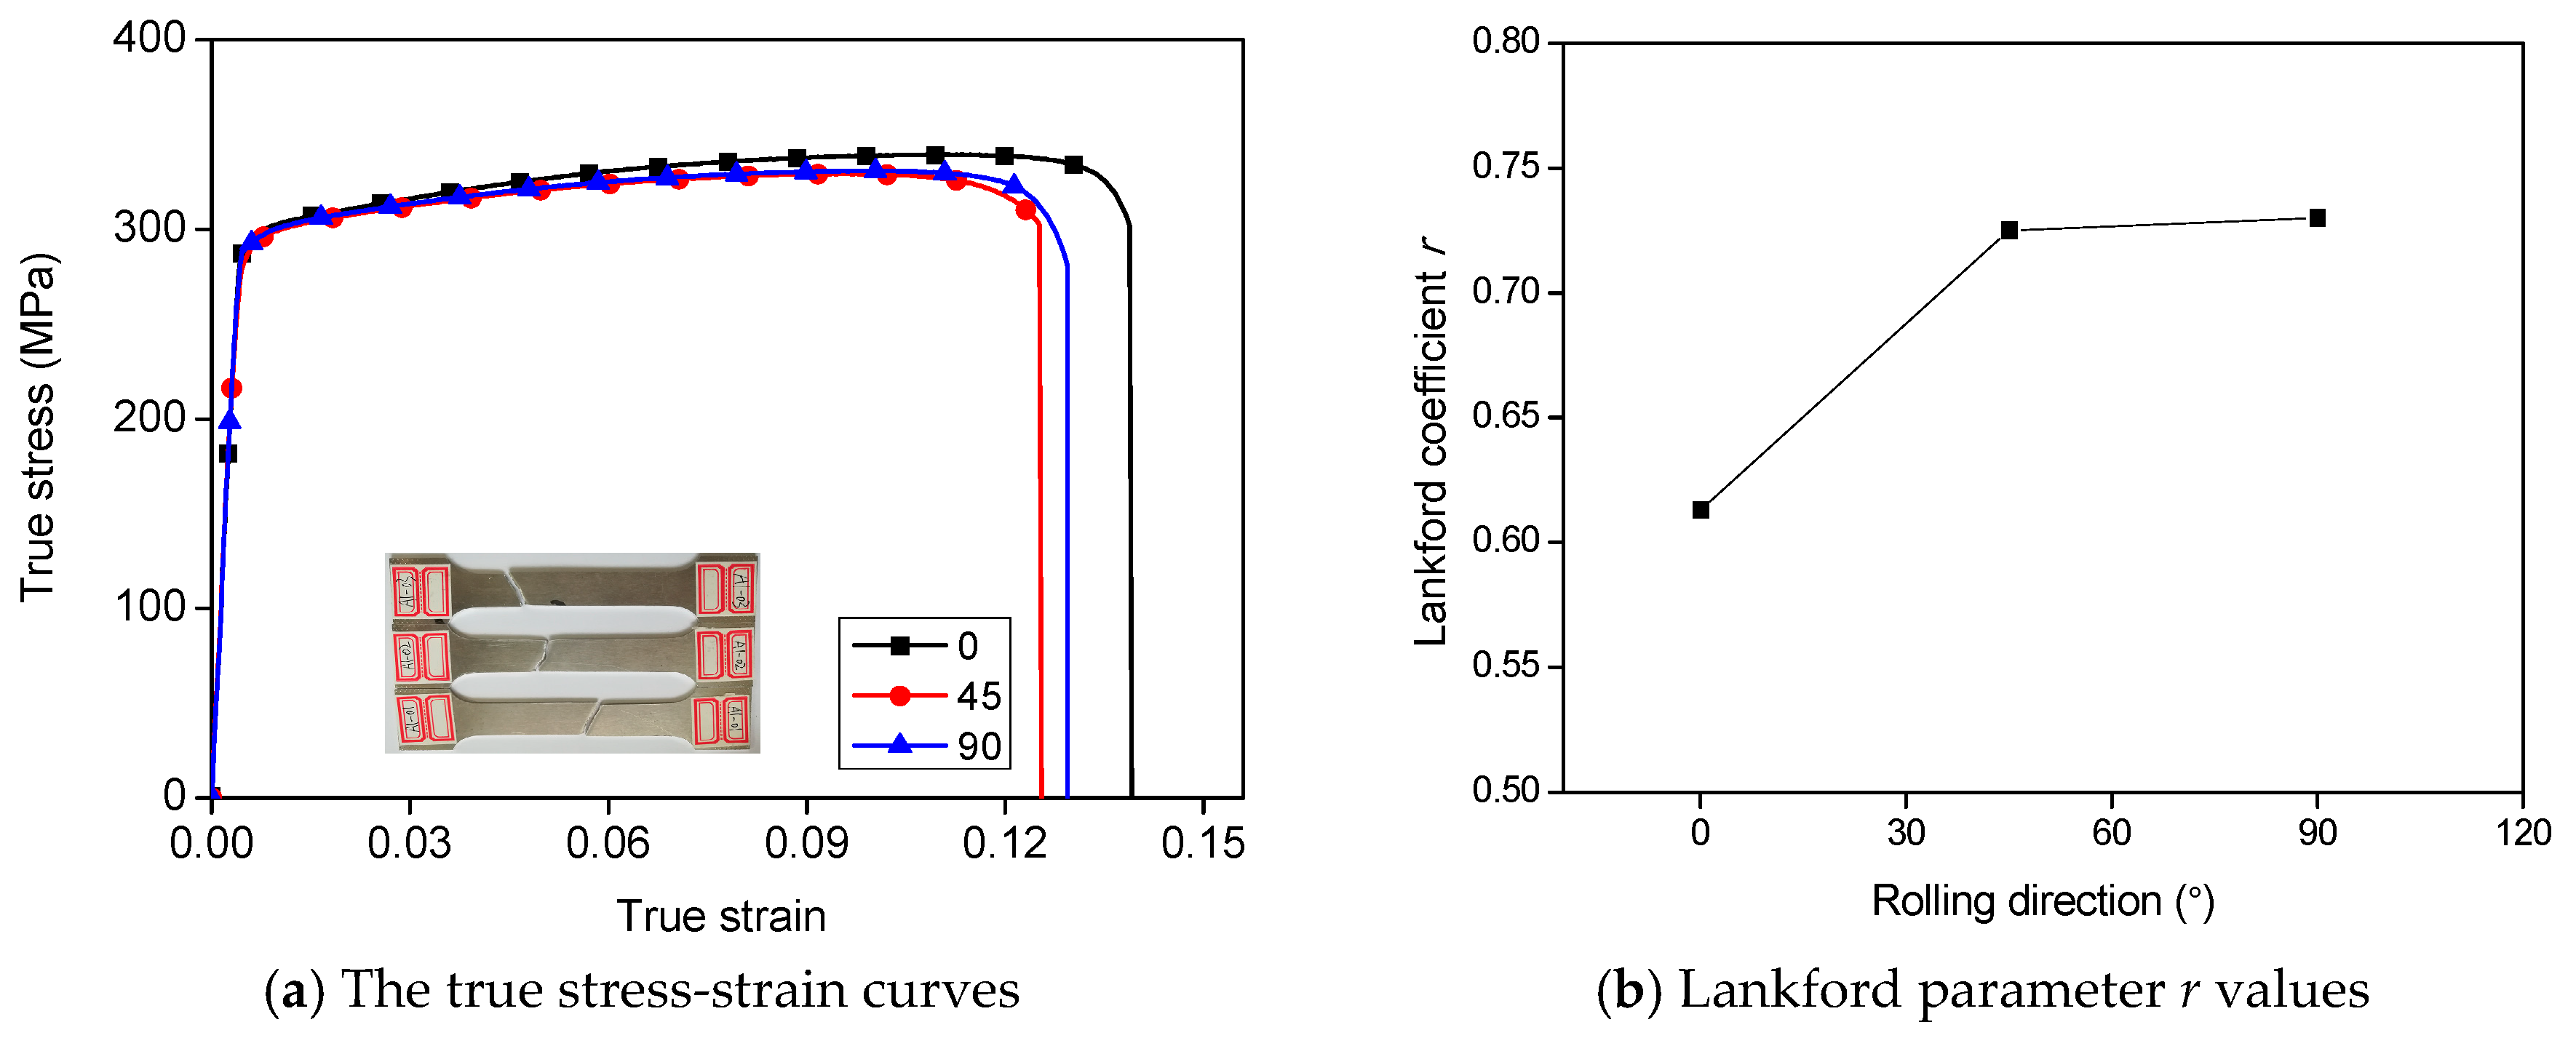
3.1. Uniaxial Tensile Tests

The geometry of the uniaxial tensile test specimen is given in Figure 1. The specimens were cut along the orientations (0°, 45°, 90°) according to the rolling direction. The tensile velocity was fixed to 2.0 mm/min. To ensure the repeatability of the results, each test was conducted at least three times. The uniaxial tensile test is used to identify the material properties, including the yield function, anisotropy, and hardening laws. The obtained plastic flow curves 0°, 45°, and 90° according to the rolling direction are given in Figure 2.

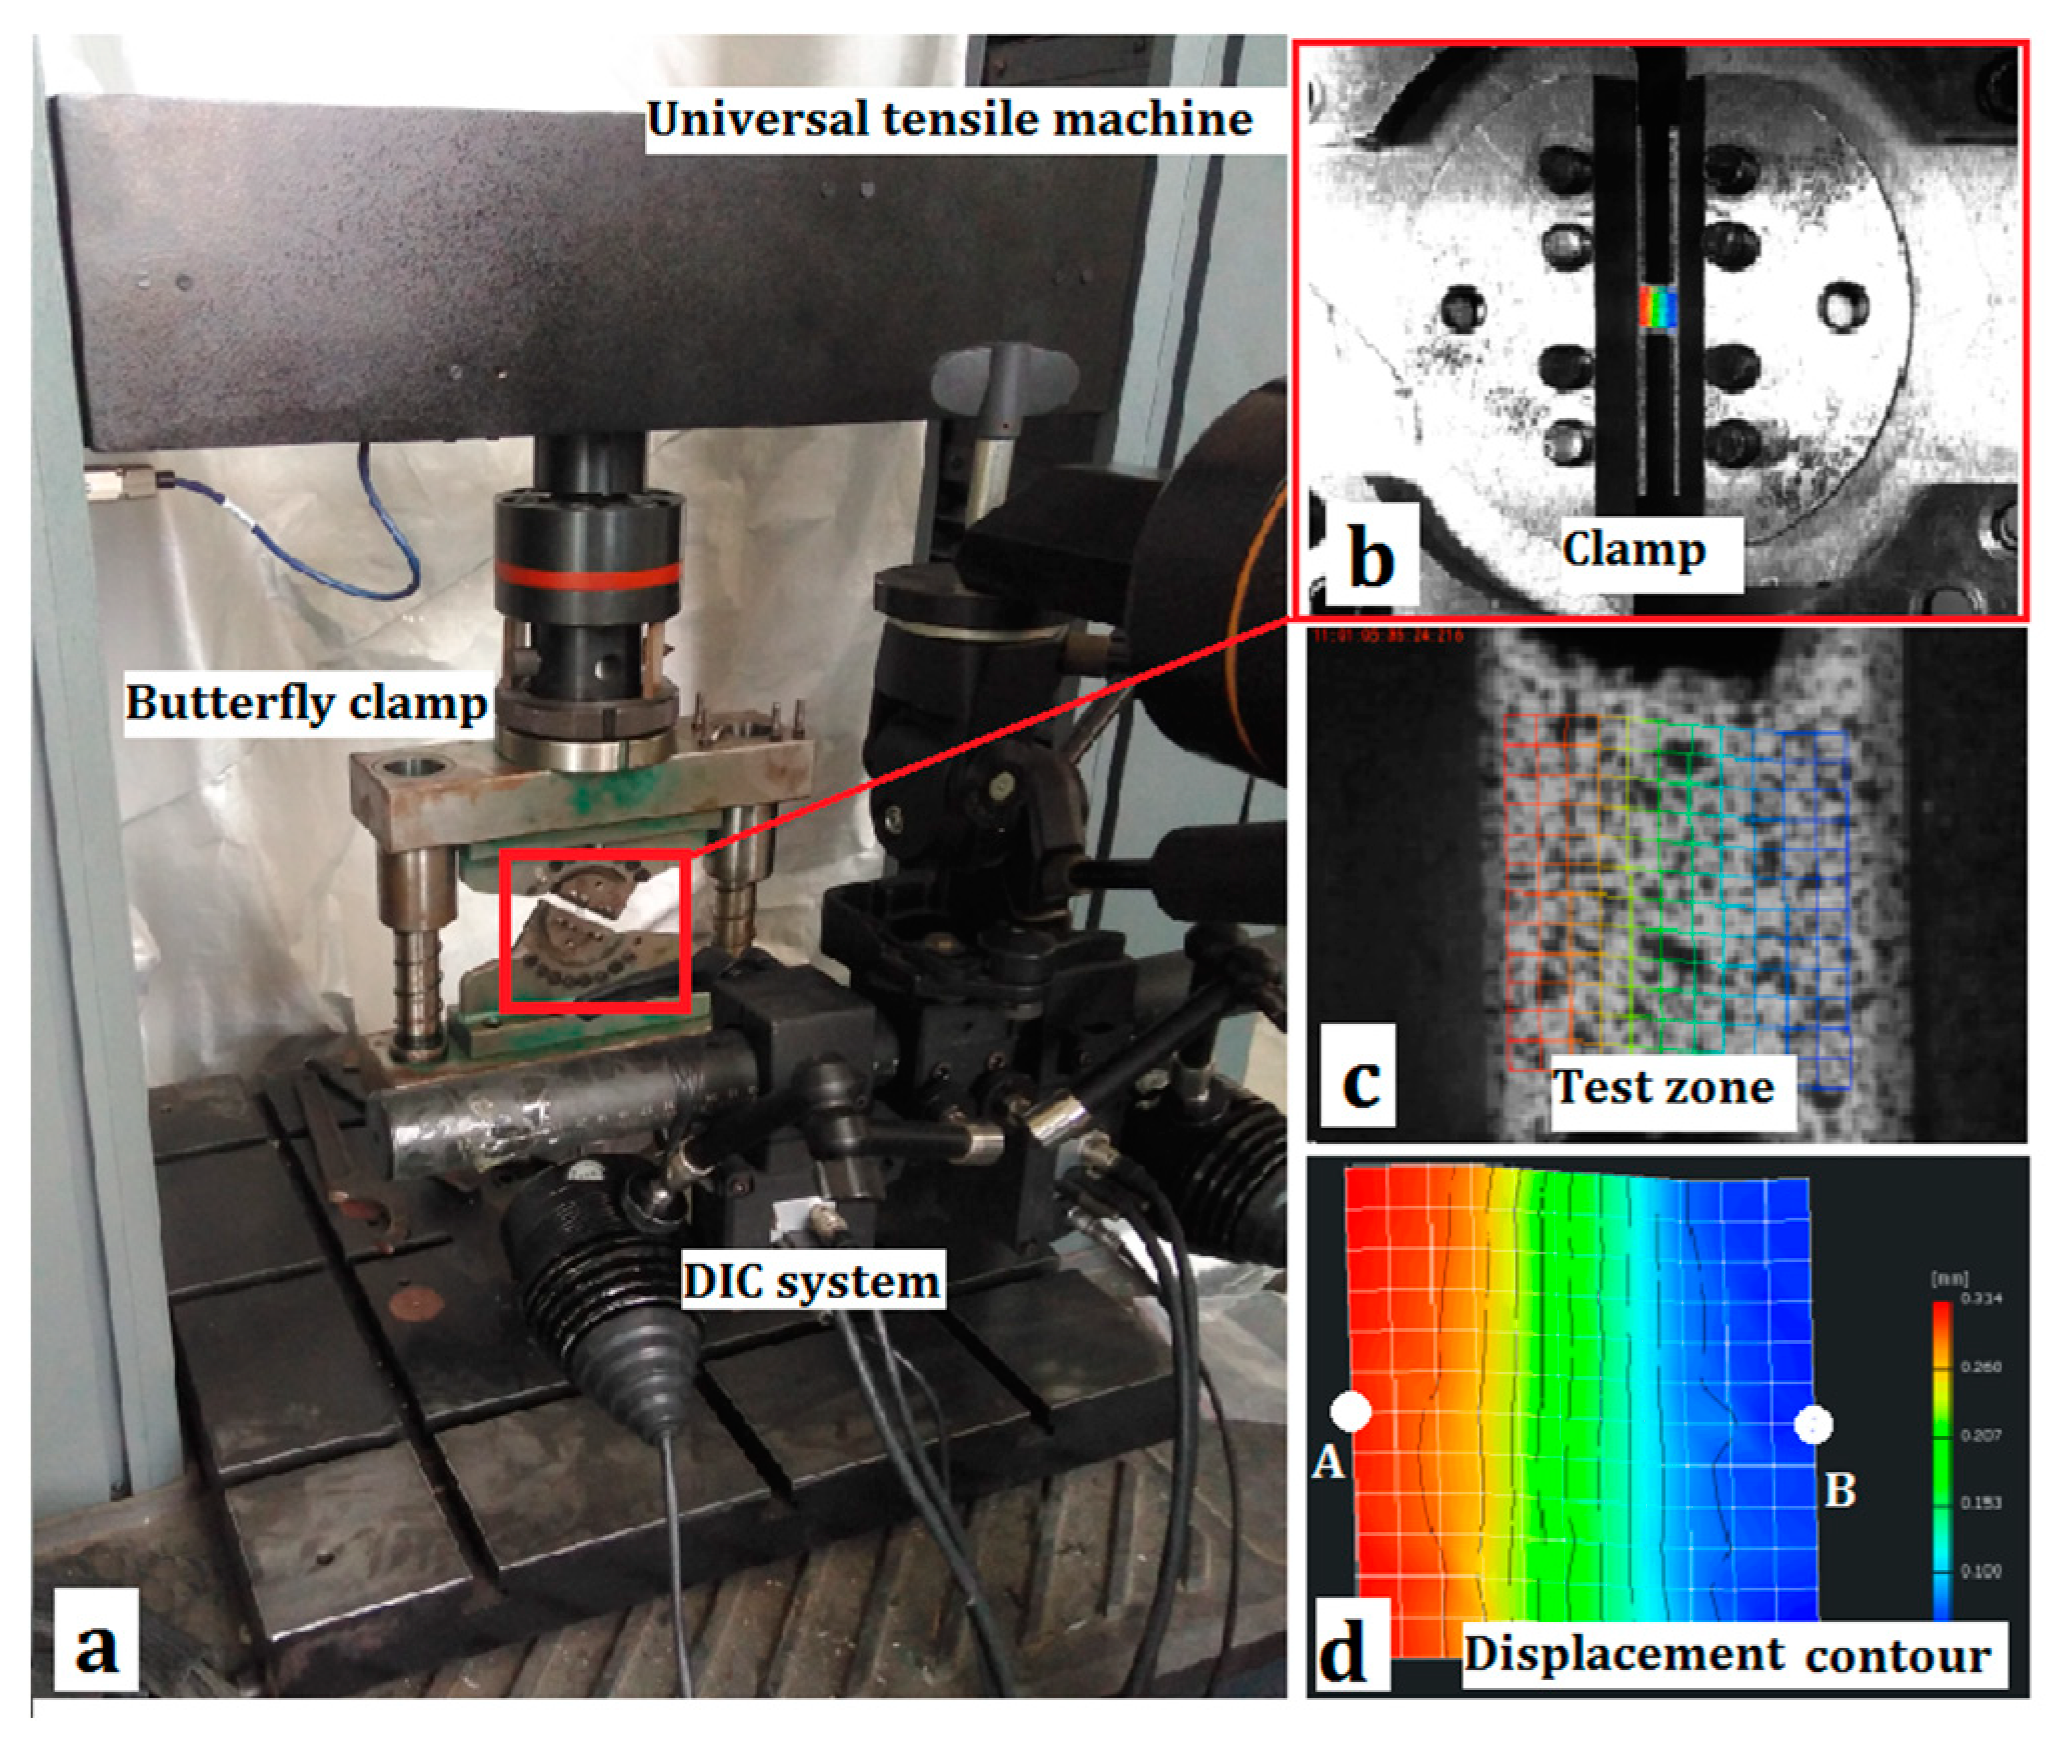
3.2. Cyclic Shear Loading Tests

The geometry of the cyclic shear loading test specimen is given in Figure 1. In the proposed model, the kinematic hardening parameters should be determined through the cyclic loading tests. Through the literature study, the cyclic shear test can be one valid method to investigate the Bauschinger phenomenon of sheet metal [24]. In this study, the cyclic shear loading test was conducted with a butterfly clamp on the universal tensile machine. The Digital image correlation (DIC) system was used to capture the vertical displacement between point A and point B shown in Figure 3. The engineering strain and stress can be calculated by:
γ e = Δ h h 0 , τ e = F t 0 h 0
where Δh denotes the vertical displacement; h0 denotes the initial height of the connect zone; t0 denotes the initial thickness of the sheet; F denotes the loading force during the tests.
With the obtained stress-strain curves in uniaxial and cyclic shear tests, the material parameters suited to aluminum alloy sheet AA7055 can be determined through the use of an appropriate inverse hybrid numerical-experimental methodology [25]. The relevant numerical and experimental result are the displacement-load responses. The inverse method here is to search the minimum error value between simulation and experiment responses. The Trust Region reflective method is used, which suits itself to the nonlinear least squares optimization problem. The optimization process involves the approximate solution of a large linear system based on the method of preconditioned conjugate gradients. The optimization algorithm is coded within MATLAB and Python script in conjunction with the FE commercial software ABAQUS.
Note that the use of only these two tests cannot allow the accurate determination of all model parameters such as the determination of micro-cracks closure parameter h and distortional parameters ( X l 1 c , X l 2 c , X l 1 p ). In this study, the micro-cracks closure parameter is assumed to be h = 0.2. The distortional effect in this study will be ignored by considering X l 1 c = X l 2 c = X l 1 p = . The set of material parameters for the AA7055 is summarized and given in Table 1.
In this study, the decomposition of kinematic hardening and isotropic hardening was determined through cyclic shear tests (Figure 4). But they also can be determined with the help of the springback angle after the bending test with different pre-stretch strain [13]. The initial yield criteria (Hill 48) in the yield function f and potential equation F are assigned the same values (F = F*, G = G*, H = H*, L = L*, M = M*). In the coming studies, this decomposition ratio will be changed in order to study the influence of kinematic hardening on the prediction of the final springback values.

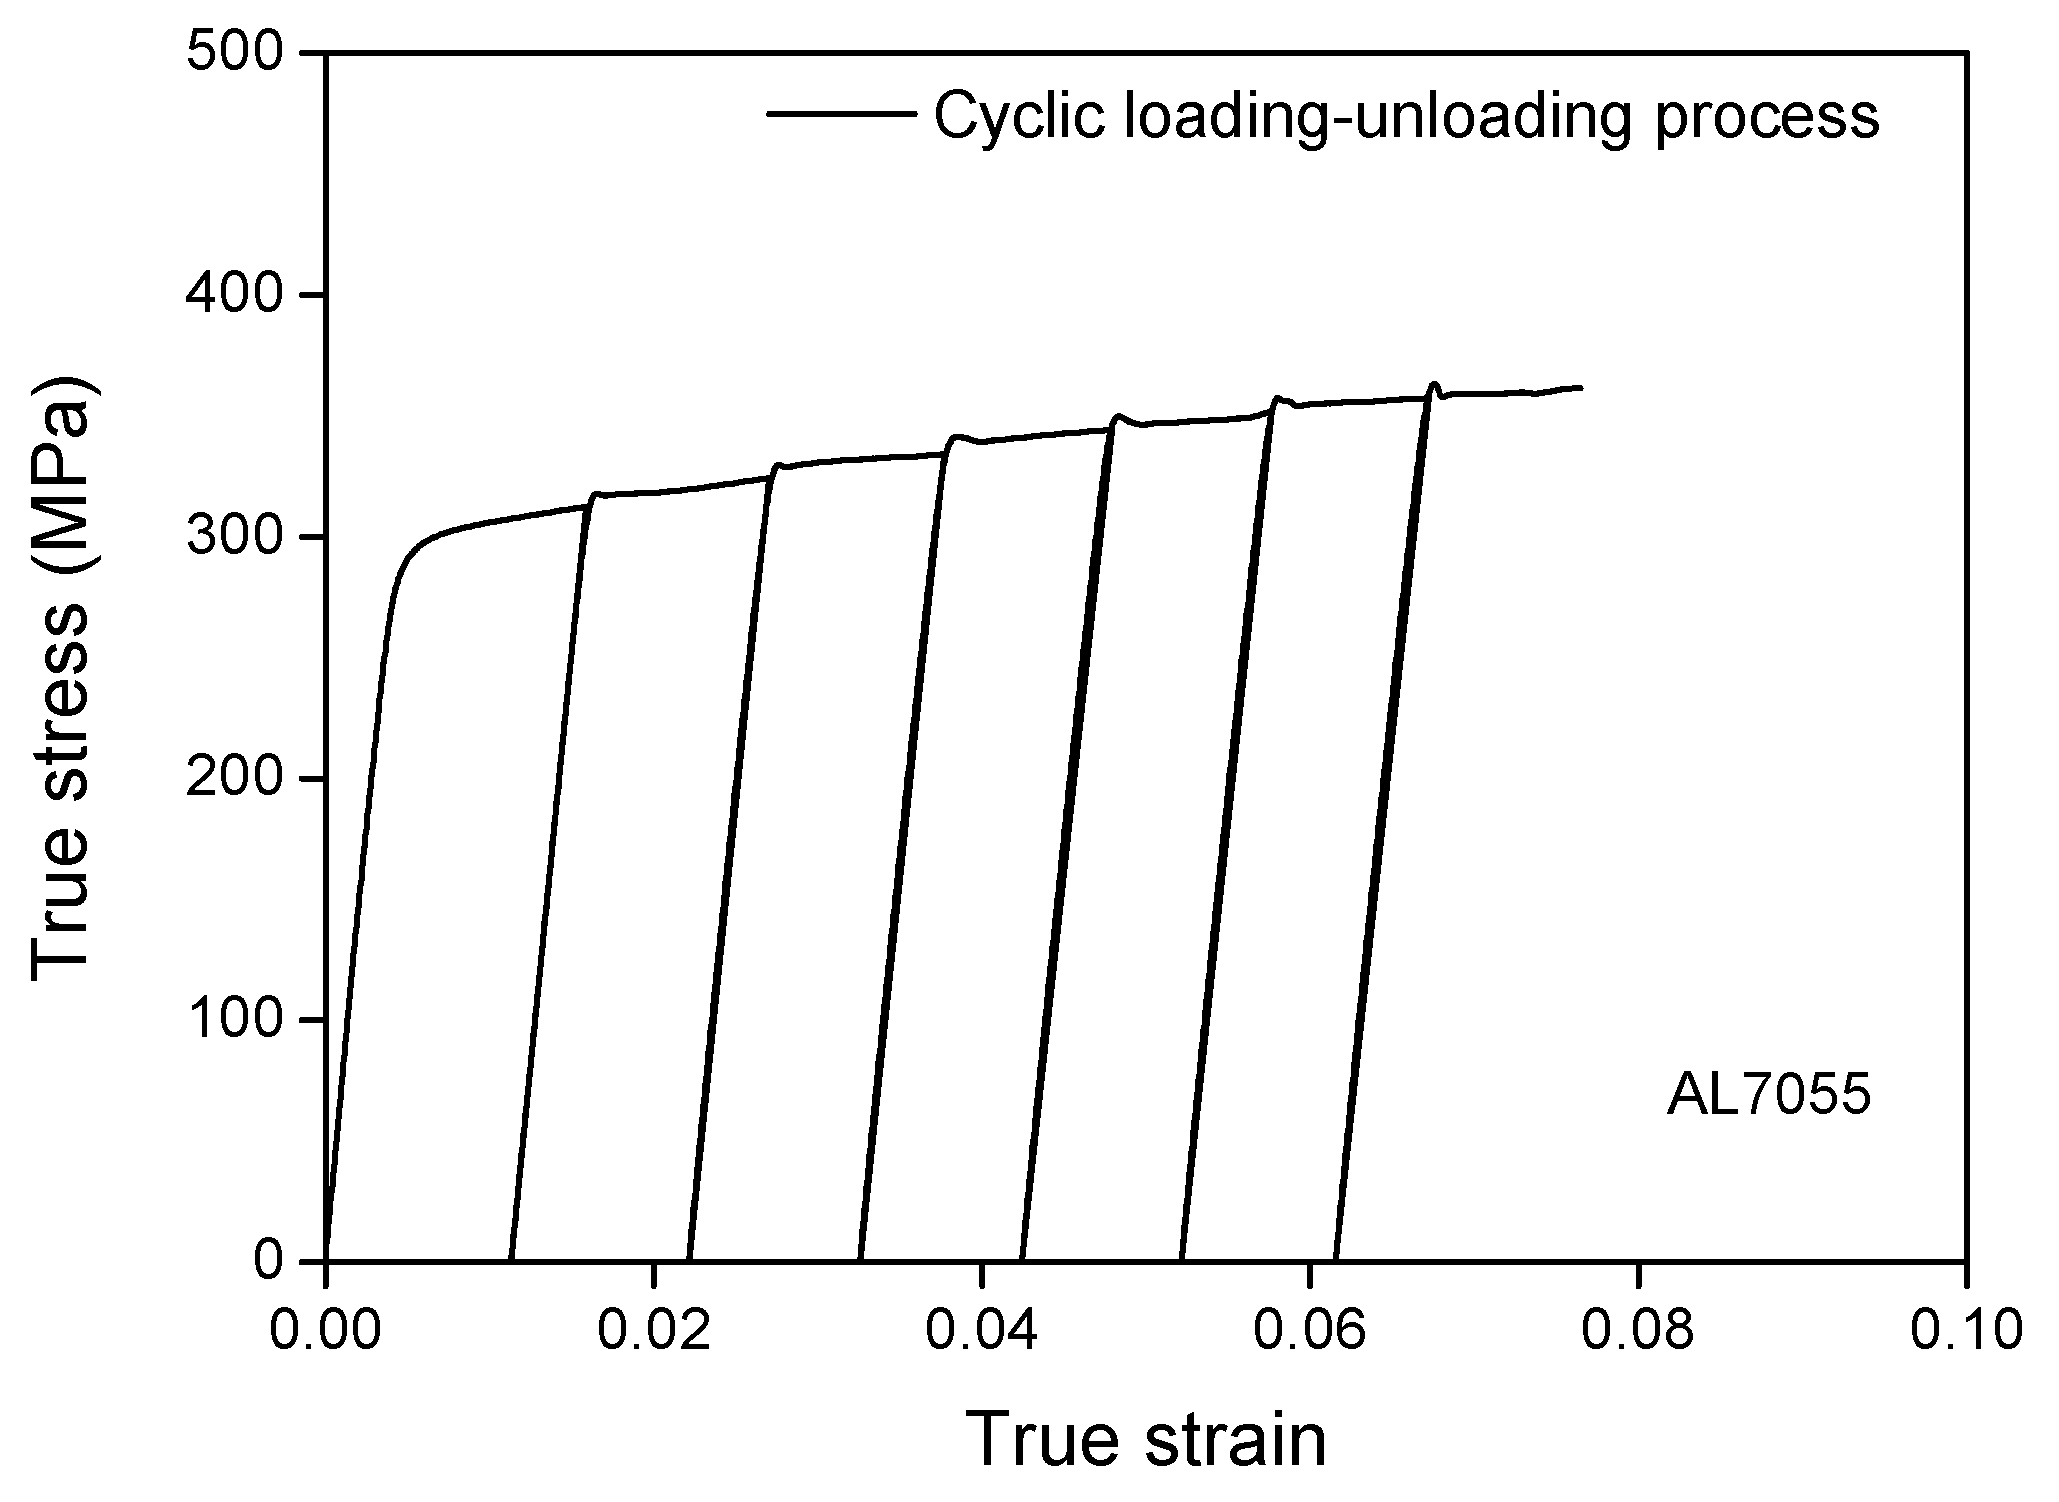
3.3. Cyclic Loading-Unloading Uniaxial Tension Tests

In order to better investigate the damage initiation and growth during the plastic flow, uni-axial tensile test with loading-unloading cycles was conducted, and the evolution of elastic modulus was recorded during the unloading phases (Figure 5). The specimen is prepared following the rolling direction. The strain levels of unloading are chosen (1.6%, 2.7%, 3.7%, 4.7%, 5.7%, 6.7%). The average value of elastic moduli during the unloading process and the decrease ratios (Ei/E0) are given in Figure 6. In this figure, we can observe clearly the decreases of elastic modulus according to the tensile strain which can be related to the damage evolution during the tensile loading. The decrease ratio of E can be regarded as the damage value in a way. During the simulation on the prediction of the springback phenomenon, the E decrease can be taken into account through user subroutine, and this result can compared with ones obtained with ductile damage model (marked as Simu-E in Figure 13).

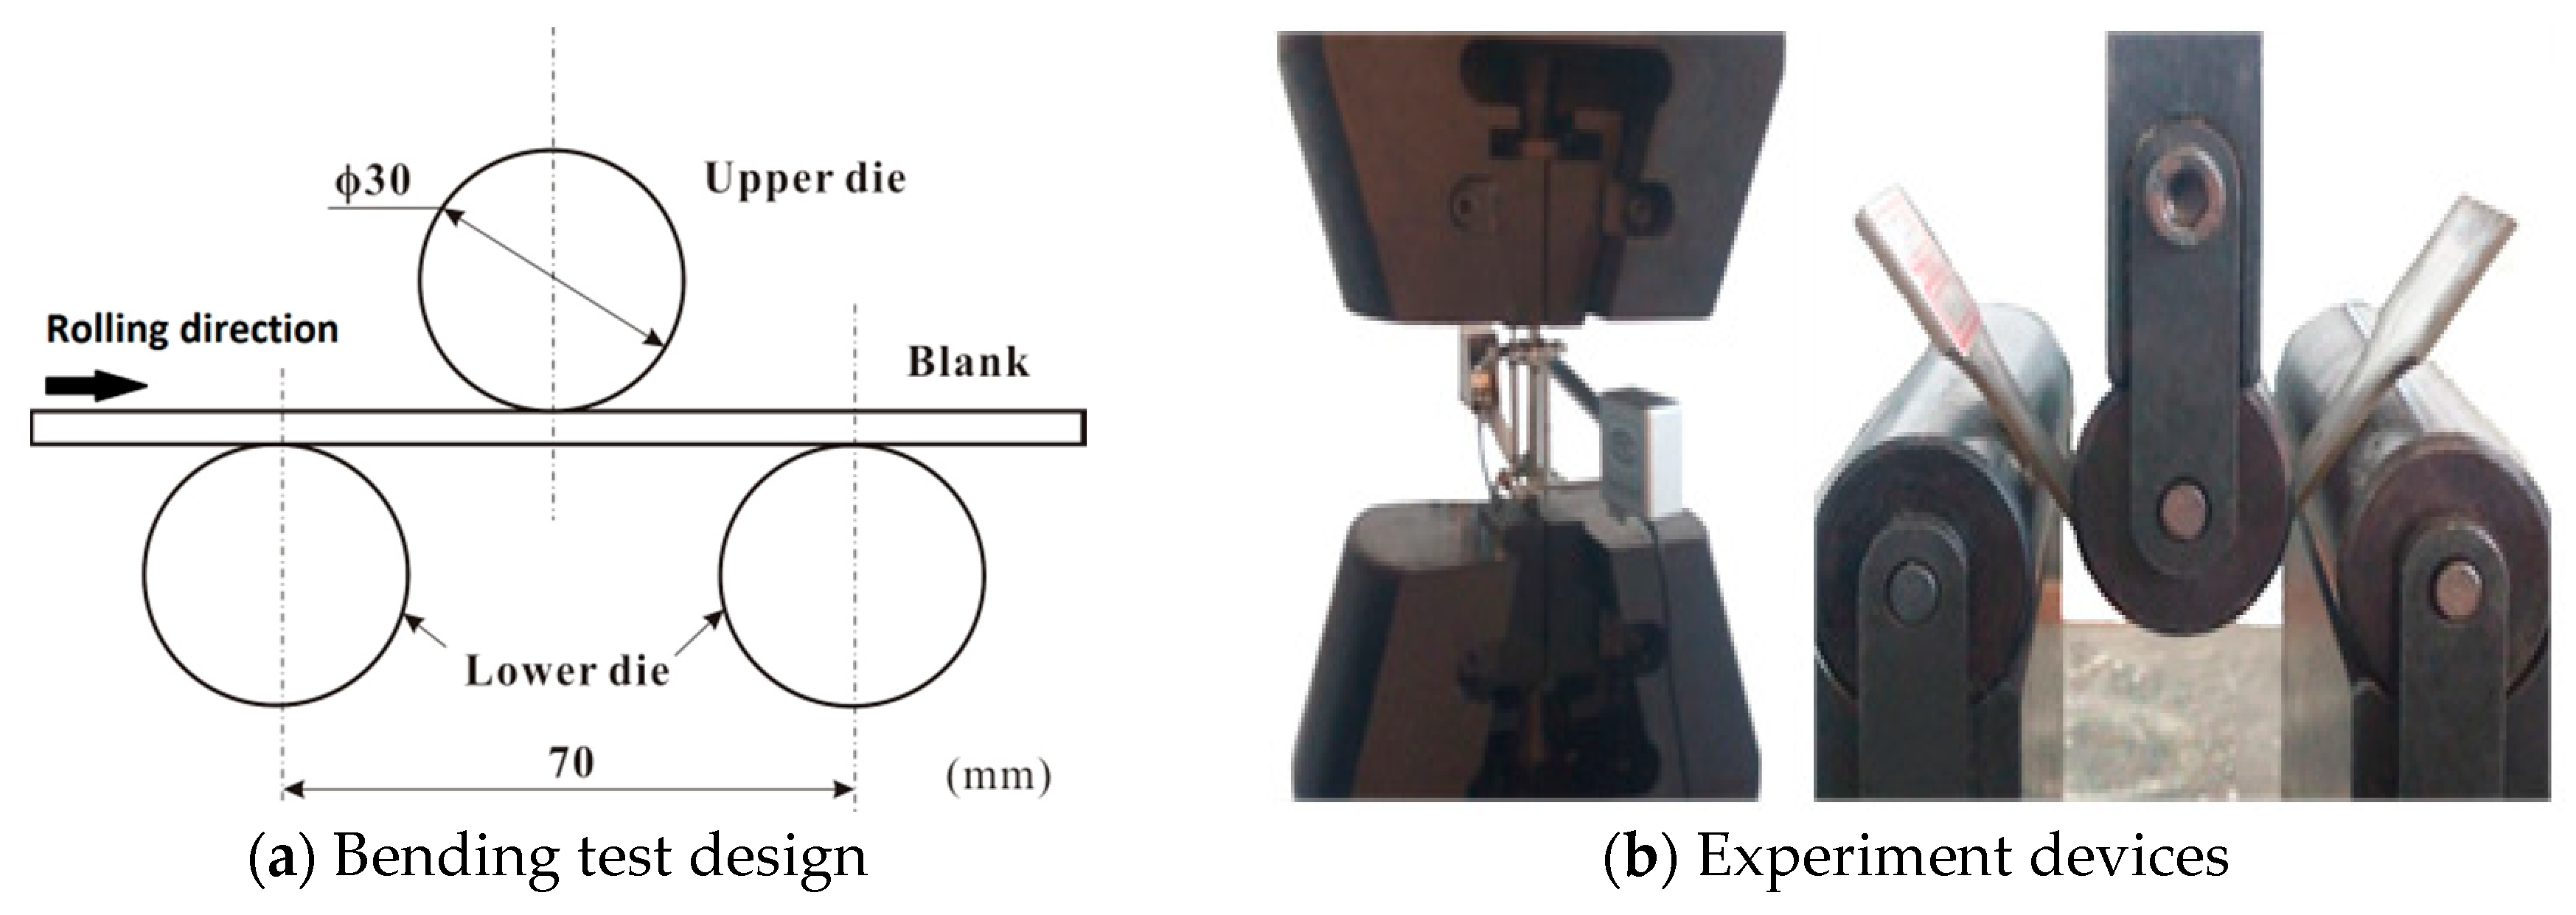
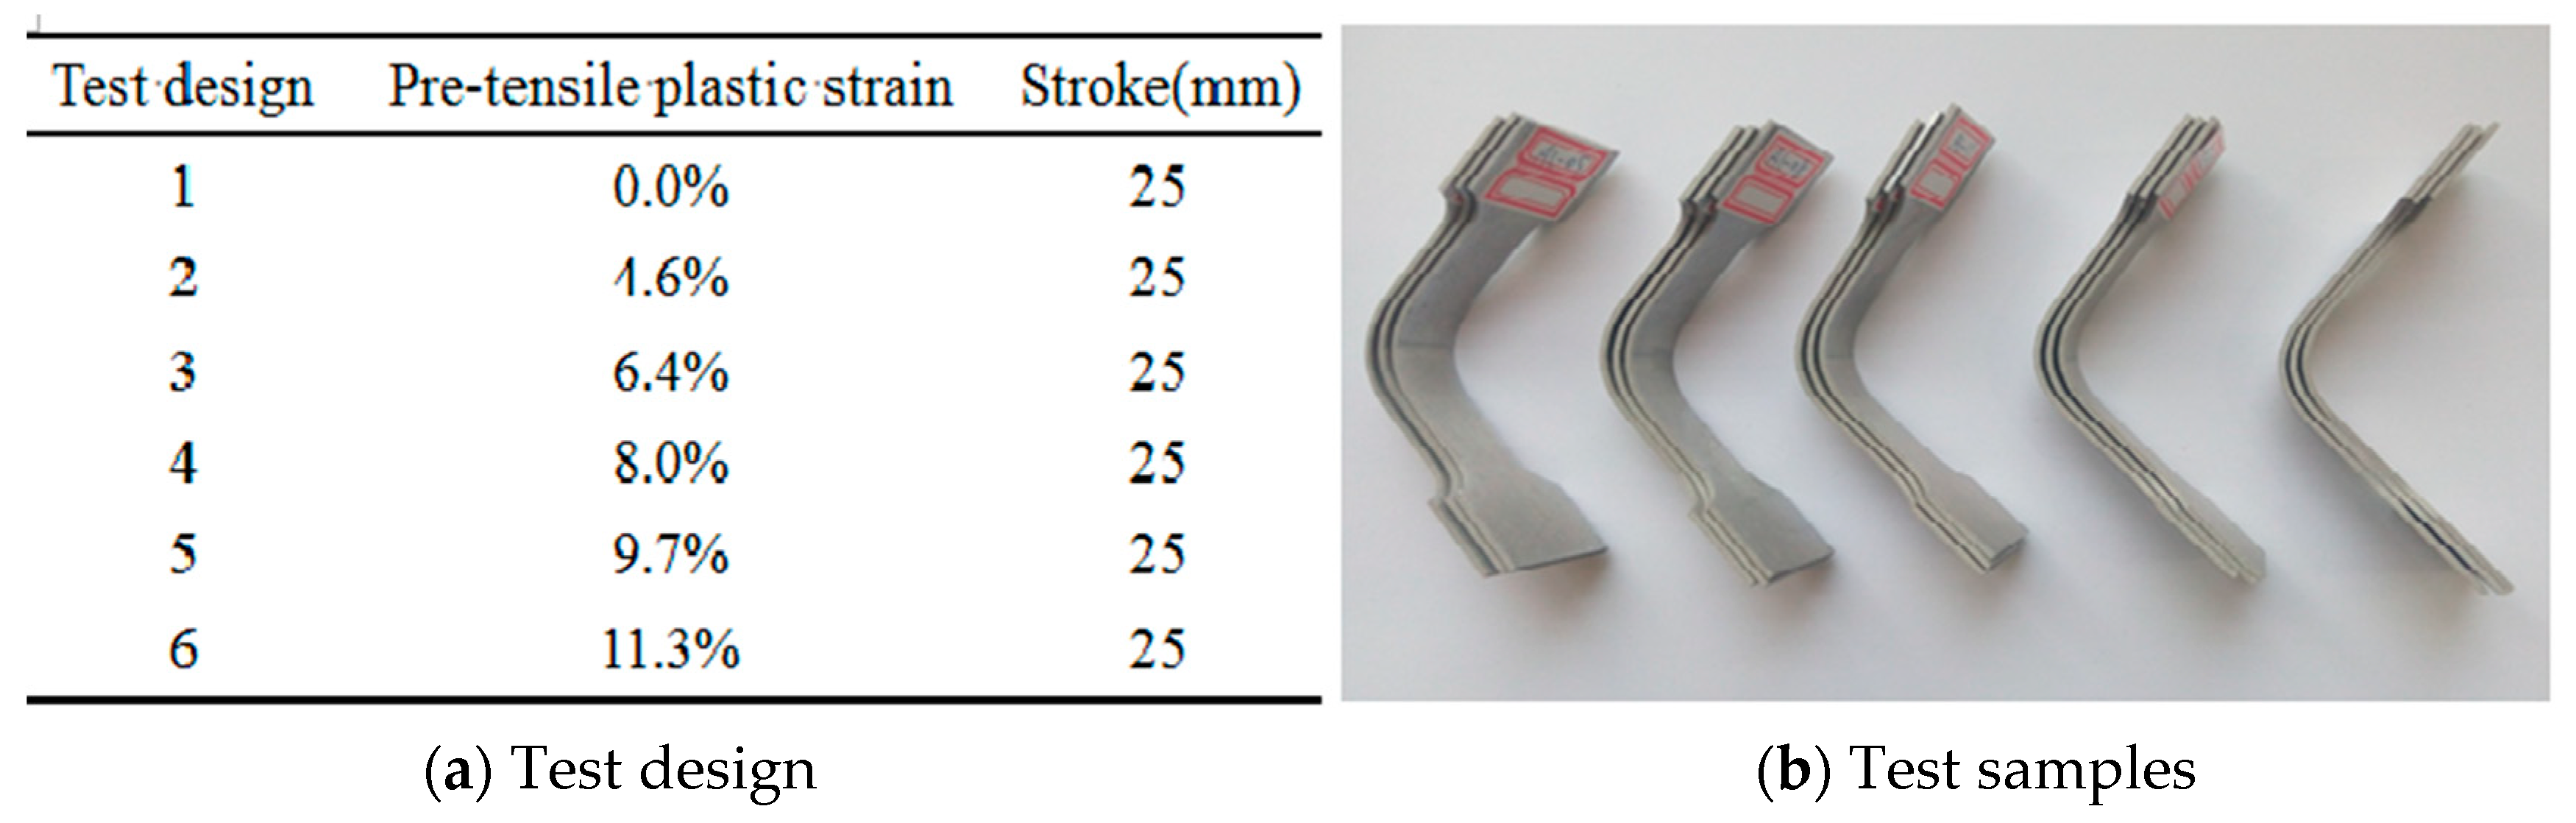
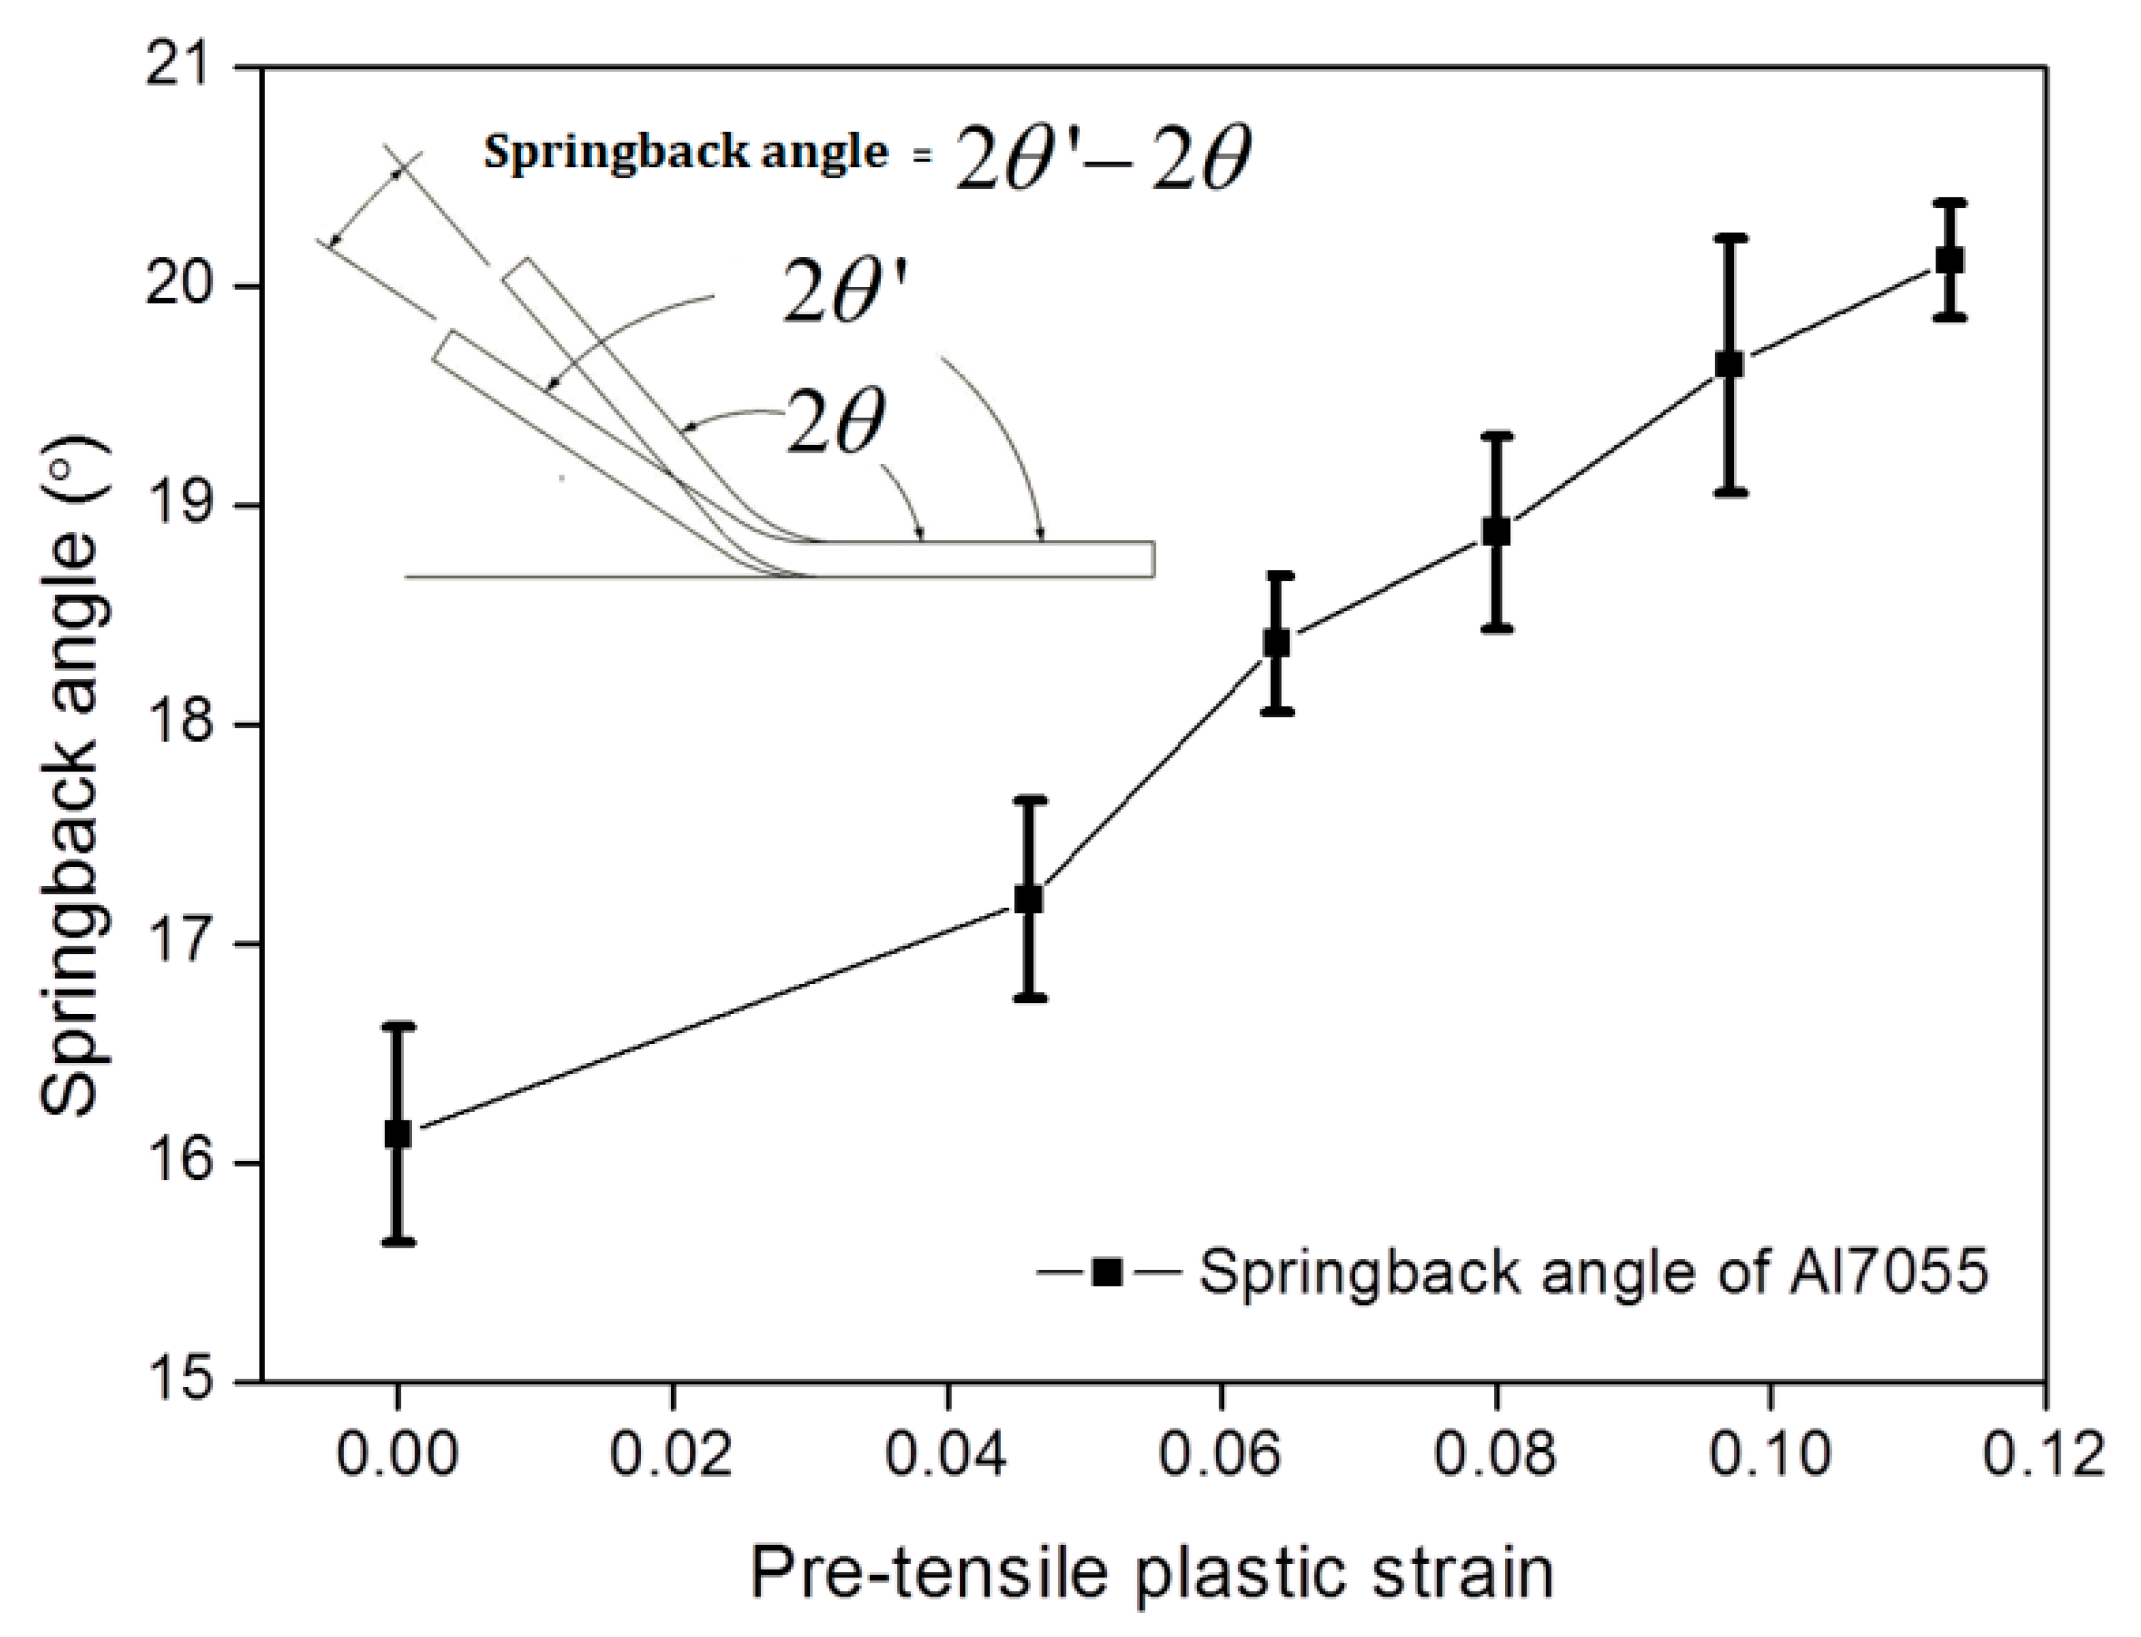
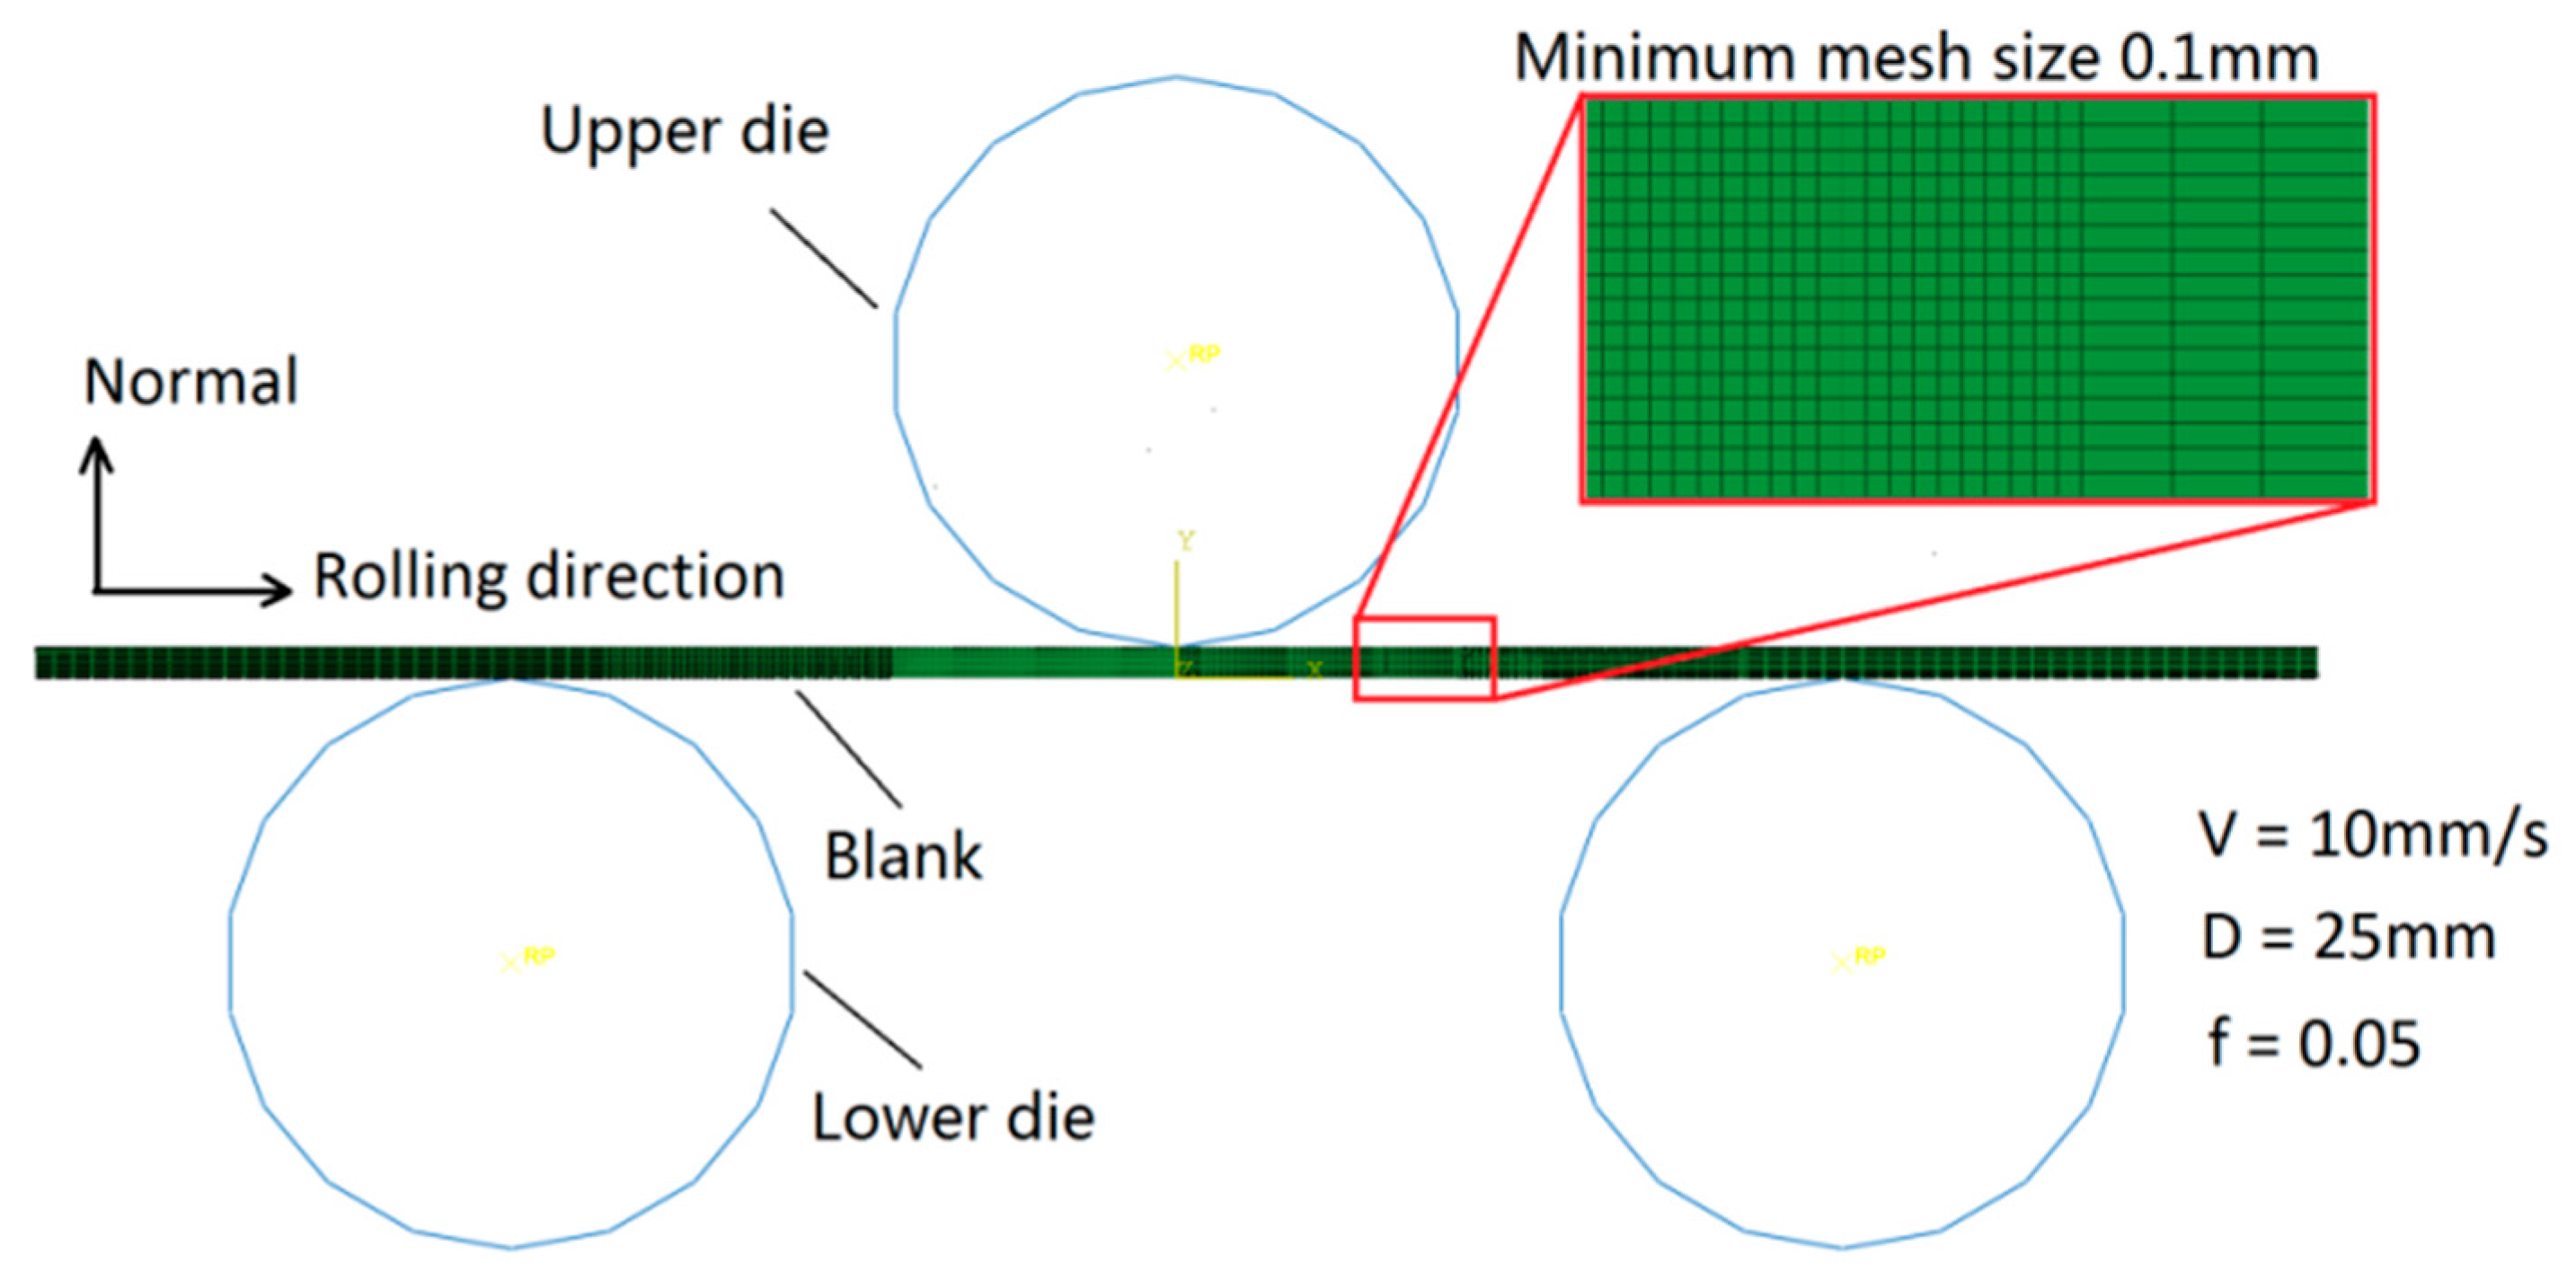
3.4. Bending Test with Pre-Stretch Strain

Three-point bending tests were conducted to investigate the springback phase of AA7055 specimens. The test design and device are given in Figure 7, and also the specimen is prepared following the rolling direction. Considering the maximum strain of 0.12 (where the local necking happens after this point) under uniaxial tensile loading path, five pre-straining states are used of 4.6% (2.4 mm), 6.4% (3.3 mm), 8.0% (4.2 mm), 9.7% (5.1 mm), and 11.3% (6.0 mm) were selected to assign on the bending specimens. The bending depth is about 25 mm, and the fixed velocity of the upper die is about 5.0 mm/min. The geometry sizes of the bending dies are shown in Figure 7. The springback angle is measured for the different specimens including the pre-straining states.
The test design and part of final obtained samples are showed in Figure 8. In Figure 9 the obtained average springback angles after bending tools unloading are shown. From the comparison of the results it can be seen that plastic pre-straining affects greatly the resulting springback angles. We observe that the increase of tensile pre-strain induces an increase of springback angle. On the other hand, when the plastic pre-strain increases, the increases of hardening stress and plastic strain will be obtained on one side accompanying the increase of ductile damage. This damage evolution allows a significant reduction of rigidity of the material so that when the bending tools are unloaded the critical parts are submitted to the high level of stress with the low rigidity which will contribute to maximizing the springback phase.
Note that when the bending depth is the same, under different pre-strain levels, the stress and strain distributions across the critical deformed zone situated under the punch radius shall be quite different. Without considering pre-strains, the normally neutral layer is situated in the central side of the sheet thickness. Tensile pre-strains shall be added to the bending strain state and causes the sliding of the neutral layer in the direction of the punch. The movement of the neutral layer will reduce the volume ratio of the compression stress state in the inner thickness section. This fact will contribute also to spring back increase.

4. Simulation Results

In the simulation process, the influences of the kinematic hardening and the ductile damage on the springback were studied. The loading processes include pre-straining and bending phases that were simulated using ABAQUS/Explicit® with user subroutine (VUMAT), which takes into account the dynamic process and avoid the non-convergence problem. The unloading process was simulated using ABAQUS/Standard® with user subroutine (UMAT) in order to reflect the final static shape after unloading. The decrease of Young’s modulus during the deformation process can be defined using two approaches: the direct assignment according to the decrease ratios of E given in Figure 6. The second one is obtained automatically through the full coupling with ductile damage. In the coming sections, the comparison of these two approaches is analyzed. In order to better investigate the effect of the stress gradient along thickness, the 2D plane strain geometrical model was chosen in the simulation process. Constant mesh size 0.1 mm is used in the critical deformation zone, as shown in Figure 10.

4.1. Effect of Kinematic Hardening Fraction on Springback Prediction

The hardening stresses obtained through the uniaxial tensile test combines isotropic and kinematic hardenings. Without the cyclic loading tests, it is difficult to separate these two hardenings and determine the exact fraction of every part. In this study, the kinematic hardening fraction is considered through a parametric study. The fraction ratio of kinematic hardening with respect to total hardening is defined by:
t = X sat / ( X sat + R sat ) = C / ( C + Q · a / b )
where Xsat is the kinematic hardening saturation value and Rsat is the isotropic hardening saturation value. In the parametric study, the kinematic hardening fraction values chosen are t = (0.0, 0.1, 0.2, 0.3, 0.4, 0.5, 0.6, 0.7, 0.8, 0.9, 1.0). For all these kinematic hardening fractions, the values of hardening modulus Q and C are re-identified in order to obtain the same fit with experimental tensile test curves. In Table 2 are given the obtained sets of hardening parameters corresponding to each considered kinematic hardening fraction.
In order to enhance the stress gradient description through the thickness, element size of 0.1 mm was considered along with the thickness direction. The simulation was consistent with the experimental setup, and five different tensile pre-strains 4.6%, 6.4%, 8.0%, 9.7%, and 11.3% were applied during a step before the bending process.
The friction coefficient between the specimen and the dies was fixed to 0.05. The bending depth of the upper die was about 25.0 mm. The pre-tension and three-point bending processes were simulated through the dynamic explicit methodology, while the unloading process after bending was conducted by the static analysis methodology. The state variables after the bending analysis were imported as the initial state of the unloading process. After the unloading process, the resulting values obtained of springback angles are given in Figure 11 with respect to the pre-strain states.
In Figure 11 are given the springback angles obtained after the bending tests applied for different considered pre-strained specimens without considering ductile damage. When pre-tensile plastic strain is zero, there is still a gap of 3°, which can be caused by the friction and the thickness variation of the sheet, and also the anisotropy following the thickness direction is ignored during the simulation. In this figure, the results of the simulations using the various kinematic hardening fraction cases (t = 0.0~1.0) are compared with the experimental results. The case of t = 0.0 value fraction corresponds to a purely isotropic hardening model; however, the case of t = 1.0 value fraction corresponds to purely kinematic hardening model. As mentioned before, the springback angle increases when the pre-strain increases. In this figure, we observe an important effect of kinematic hardening fraction on the springback predicted angle. It needs to be highlighted that for high kinematic hardening fraction (t > 0.8) the increase of pre-strain state induces a decrease of springback angle. For these cases, the difference among numerical results is important. The stress contours before springback are given in Figure 12, which clearly present the big effect of kinematic hardening fraction on the final obtained stress contour on the thickness section during the bending process.
Through comparing the experimental and numerical obtained springback angles, it is recommended that the kinematic hardening fraction shall be defined between t = 0.1 and t = 0.5 for Al7050. In the coming section about the ductile damage, the ratio of kinematic hardening in total hardening was assigned to be 0.5.

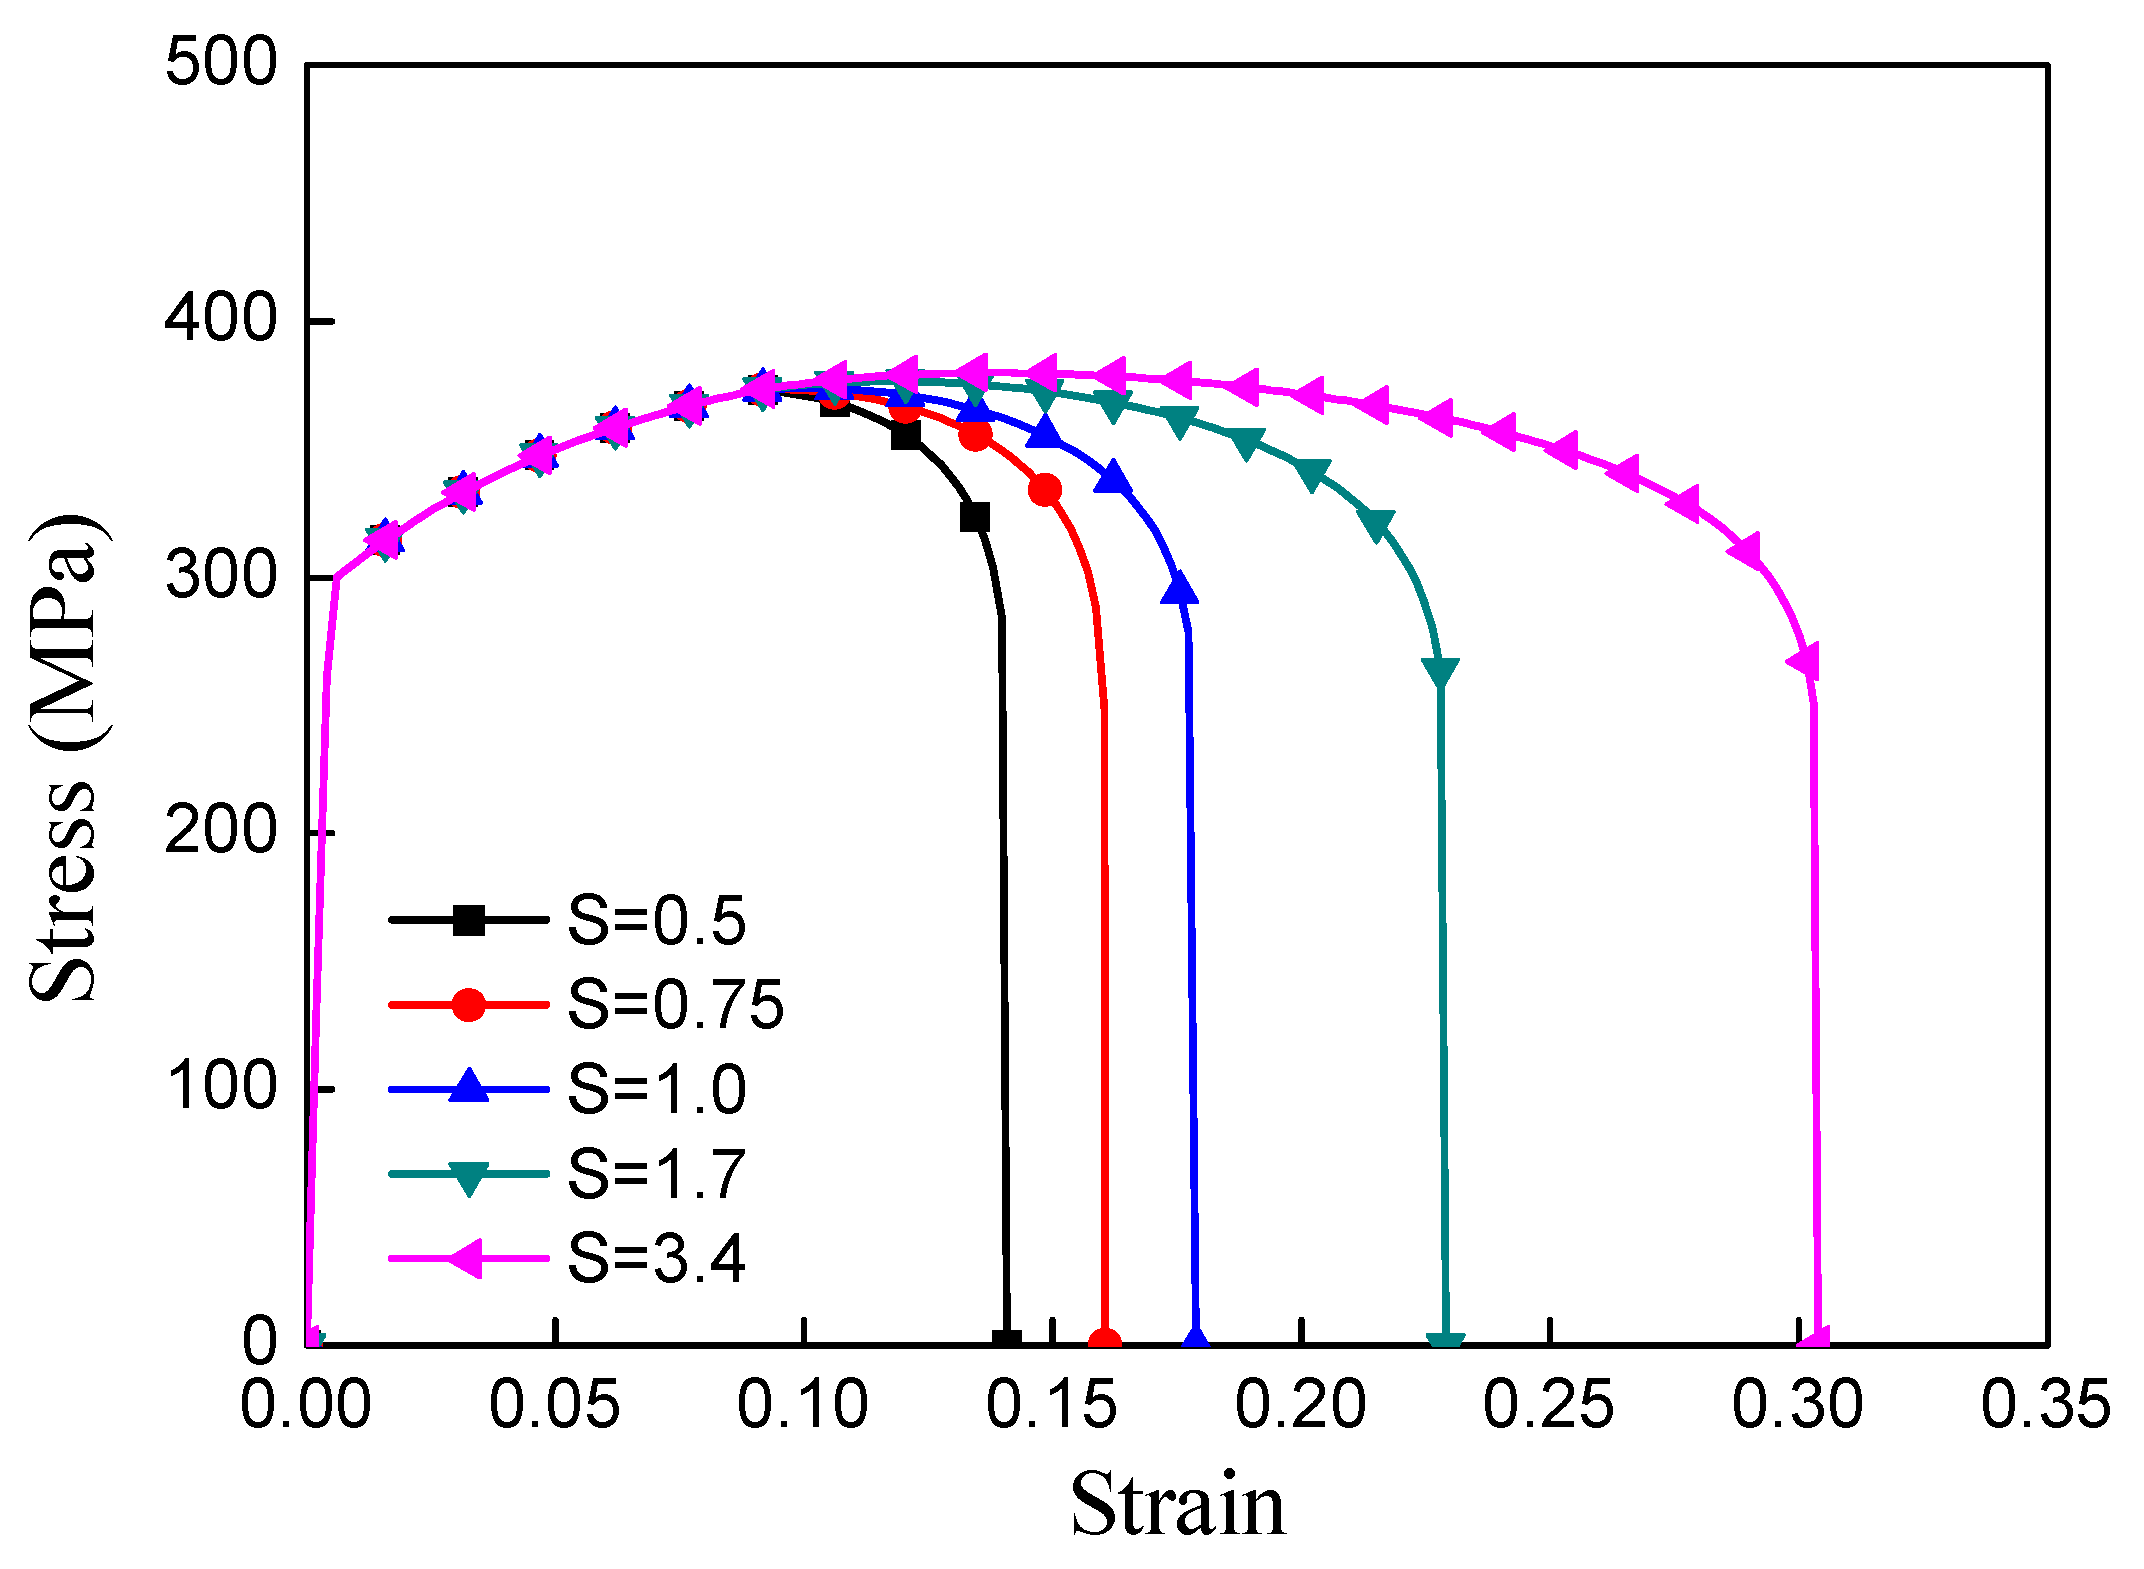
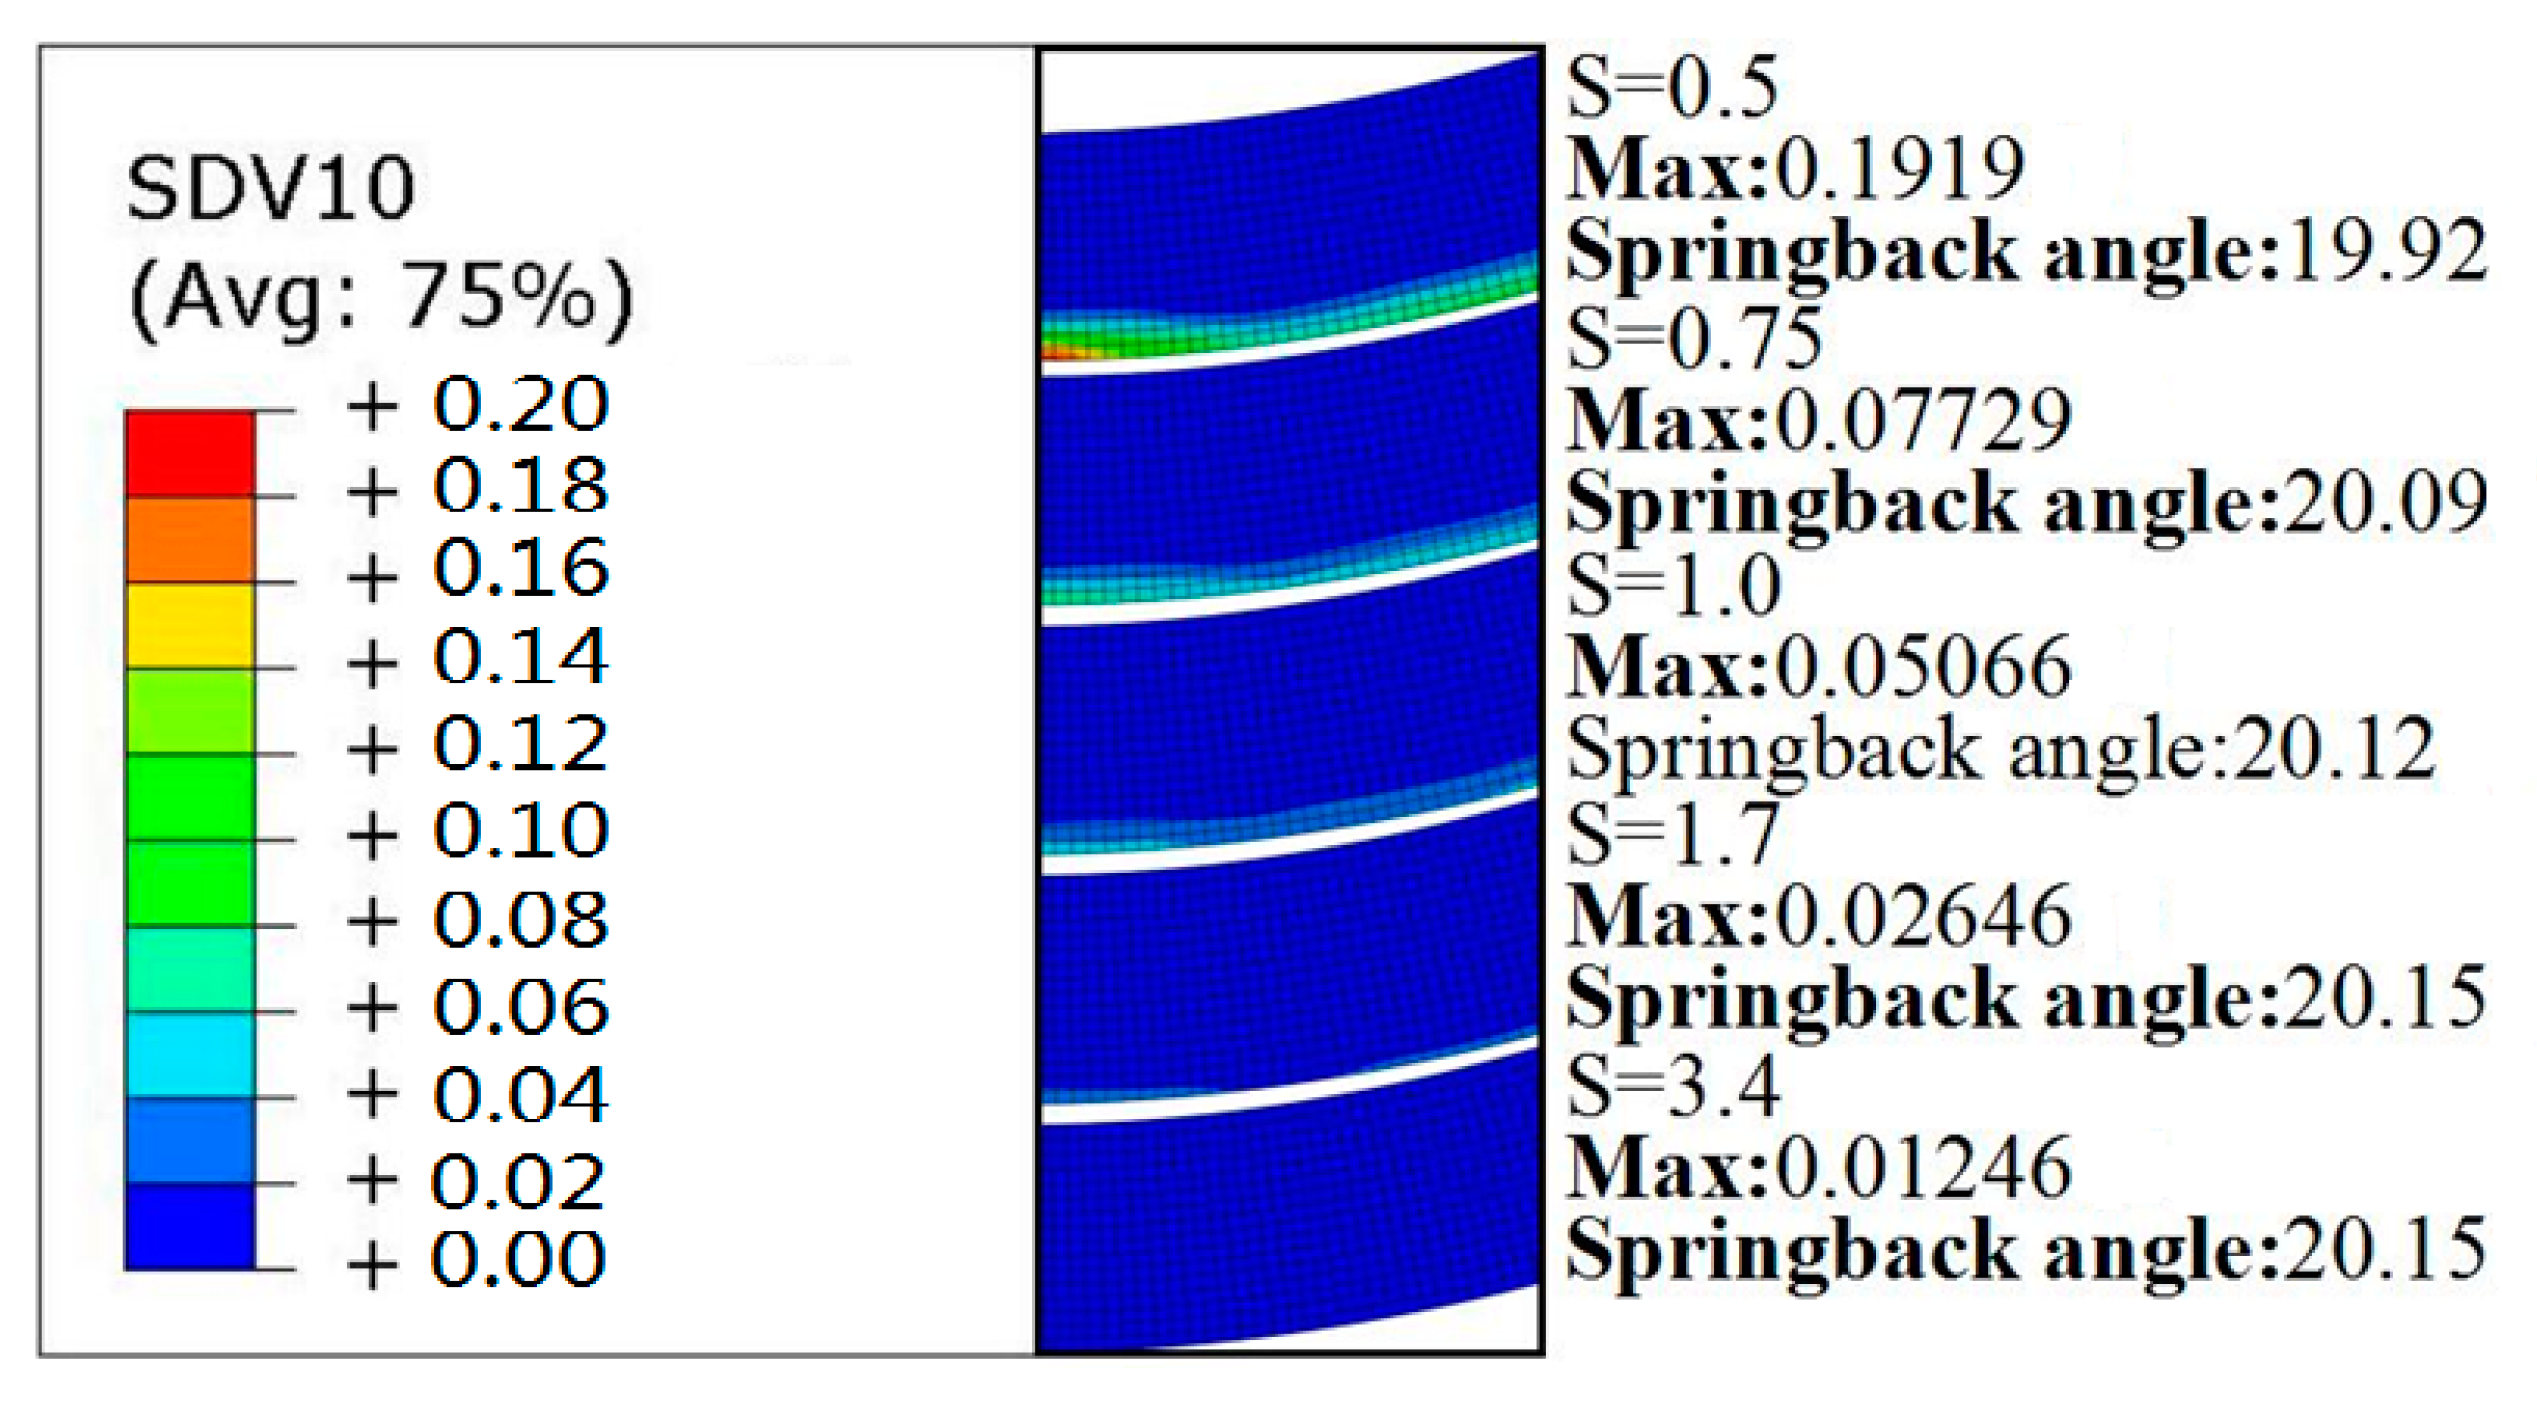
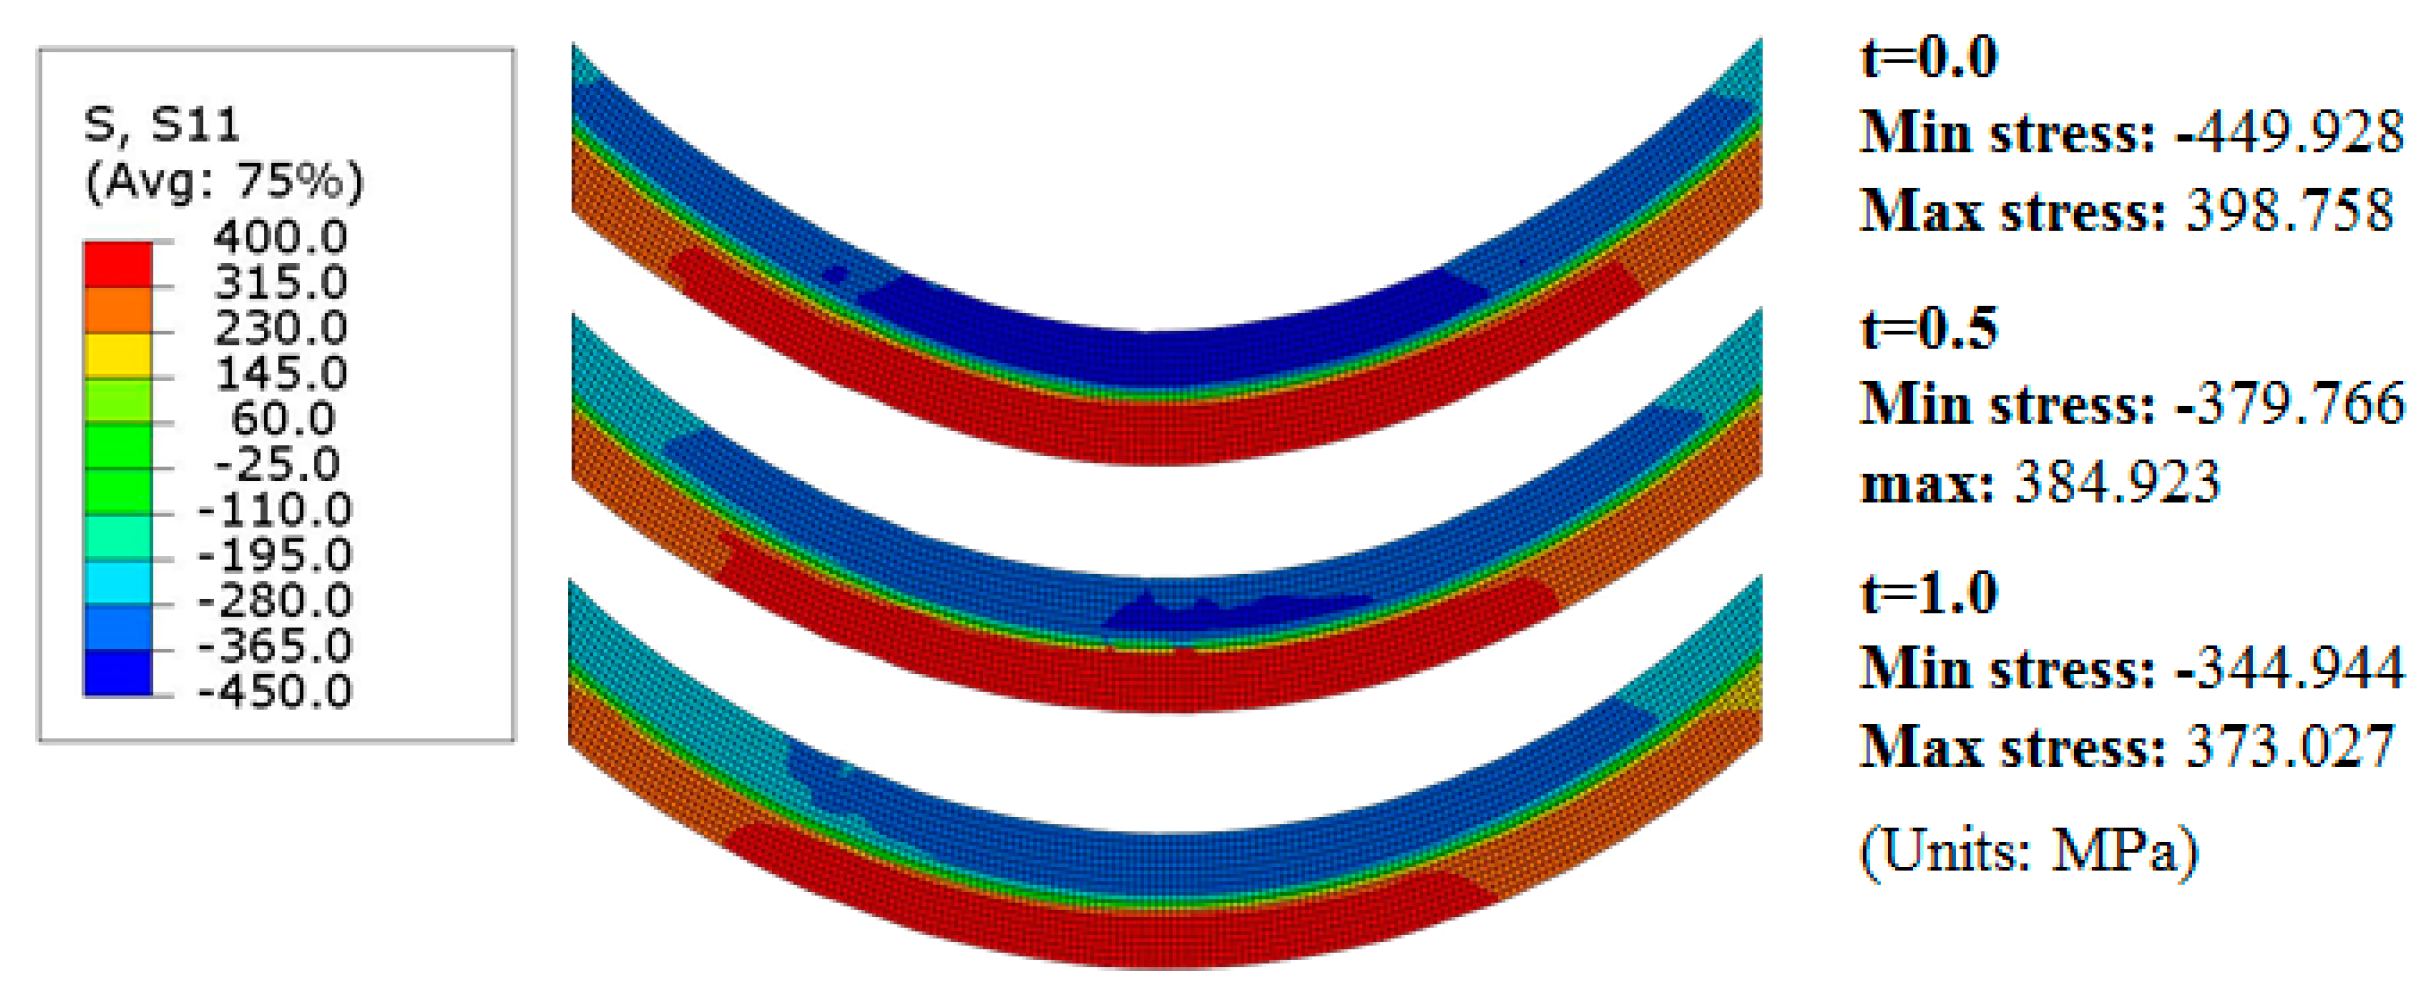
4.2. Effect of Damage Coupling on Springback Prediction

The Young’s modulus plays an important role in the springback prediction. In this section, the decrease of Young’s modulus during the deformation process is considered through the two approaches of including Young’s moduli variation according to loading strain as discusses in the last section. The direct evolution of Young’s moduli with respect to accumulating plastic strain is defined with tabular form according to Figure 6. Linear interpolation is considered between given points. For the ductile damage model, the material parameters were defined according to Table 2. The corresponding obtained numerically predicted springback angles are shown in Figure 13. These two methods can both well predict the tendency of the influence of pre-stretch on the final springback angles. Together with the increase of the pre-stretch displacement, the springback angles almost increase linearly with the same slope. Also, it can be found that the obtained springback angle with the ductile damage model can be closer to the experimental results.
The damage parameters S will be assigned different values of (0.5, 0.75, 1.0, 1.7, 3.4). In Figure 14, the effect of the damage parameters S on the strain-stress curves is compared. It is found that with the decrease of the damage parameters S, the ductility of the material highly increased. In Figure 15, the ductile damage contour across the thickness zone after the bending process with pre-strains of 4 mm was plotted and compared. When S is smaller, more ductile damage appears on the section, and the springback angle is smaller due to the smaller stress caused by damage. The comparisons with experimental and other numerical obtained results are also given in Figure 15.

5. Conclusions

In this study, the springback phenomena of AA7055 alloy sheet metal under three points bending test after pre-stretch were investigated. Under the same bending depth, five different pre-stretch displacements were conducted on the samples, and the obtained springback angles were discussed by comparing the experimental and numerical obtained results. Meanwhile, in the numerical aspect, the influence of the kinematic hardening and ductile damage on the springback was compared and discussed. The conclusions in this study are given as follows:
  • Through the experimental observation, it was found that under the same bending depth the springback angle increases with the increase of the pre-stretch displacement. The pre-deformation plays an important role in the final sample shapes.
  • The influence of the kinematic hardening on the springback prediction of sheet metal is relatively large. The numerically obtained springback angle decreases with the increase of the ratio of kinematic hardening in total hardening. With the increase of pre-stretch displacement, the influence of kinematic hardening will be enlarged. Meanwhile, though this methodology, the ratio of kinematic hardening in total hardening can be coarsely determined.
  • The ductile damage has a great influence on the springback prediction of sheet metal. It not only affects the Young’s modulus but the mechanical state of the formed samples. The numerical simulation with consideration of the ductile damage gives more accurately predicted springback angles.

Author Contributions

Z.Y. and X.Z. conceived and prepared the manuscript; J.Q. performed the experiments; H.B. focused on the constitutive model building; J.G. and X.C. are responsible for simulation and analysis.

Funding

This research was funded by National Natural Science Foundation of China (NO.51605257), the European Funds (FEDER) and the Alsace-Champagne-Ardenne-Loraine region (ESSAIMAGE D201600778).

Conflicts of Interest

The authors declare no conflict of interest.

Appendix A

In the framework of non-associative plasticity, the yield criterion f and plastic potential F are separately defined in Equation (A5). The evolution relations of plastic strain, isotropic and kinematic hardenings, and ductile damage are given by Equations (A1) to (A4), respectively, by the normality rule with respect to plastic potential F.
D _ p = λ ˙ F σ _ = λ ˙ H = p : ( S _ d p X _ ) 1 d S _ d p X _ H : [ I = D + X _ S _ 0 X l 1 p ( 1 d ) ( R / 1 d γ + σ y ) ] = λ ˙ n _ p
α _ ˙ = λ ˙ F X _ = λ ˙ 1 d ( n _ x a α _ )
r ˙ = λ ˙ F R = λ ˙ ( n i 1 d γ b r )
d ˙ = λ ˙ F Y = λ ˙ ( 1 d ) β ( Y Y 0 S ( θ ) ) s
{ f = S _ d c X _ H 1 d R 1 d γ σ y = 0 F = S _ d p X _ H 1 d R 1 d γ σ y + 3 a 4 C X _ : X _ 1 d + b 2 Q R 1 d 2 + S s + 1 Y Y 0 S ( θ ) s + 1 1 ( 1 d ) β
where σy is the initial yield stress, and the parameters a and b represent the non-linearity of the kinematic and isotropic hardening respectively. D _ p denotes the plastic strain tensor. S ( θ ) is function of lode angle θ [26]. S, s, β, and Y0 are the parameters governing the ductile damage evolution. The plastic multiplier λ ˙ is defined by condition of consistency with respect to the yield surface f = f ˙ = 0 . The equivalent stresses S _ d i X _ H = ( S _ d i X _ ) : H = i : ( S _ d i X _ ) , i = { c , p } given in yield criterion (i = c) and plastic potential (i = p) of Hill 48 type. The deviatoric distortional stress tensor S _ d i ( i = { c , p } ) of François type [27]:
S _ d p = S _ + S _ 0 : S _ 0 2 ( 1 d ) X l 1 p ( R / 1 d γ + σ y ) X _
S _ d c = S _ + S _ 0 : S _ 0 2 ( 1 d ) X l 1 c ( R / 1 d γ + σ y ) X _ X _ : X _ 2 ( 1 d ) X l 2 c ( R / 1 d γ + σ y ) S _ 0
with S _ 0 = S _ S _ : X _ X _ : X _ · X _ . These distortion stresses reduce to classical deviatoric stress S _ for the case of parameters X l 1 c = X l 2 c = X l 1 p = which corresponding to the annealing distortion effect giving the classical Hill 48 yield surface. The outward normal tensors to plastic potential are defined as follows:
n _ p = 1 1 d S _ d p X _ H [ I = D + X _ S _ 0 X l 1 p ( 1 d ) ( R / 1 d γ + σ y ) ] : H = p : ( S _ d p X _ )
n _ x = 1 1 d [ H = p : ( S _ d p X _ ) S _ d p X _ H S _ 0 : S _ 0 2 ( 1 d ) X l 1 p ( R / 1 d γ + σ y ) H = p : ( S _ d p X _ ) S _ d p X _ H + ( S _ : X _ ) ( X _ : H = p : ( S _ d p X _ ) S _ d p X _ H ) ( 1 d ) X 1 p ( X _ : X _ ) ( R / 1 d γ + σ y ) S _ 0 ]
n r = 1 1 d γ [ ( S _ 0 : S _ 0 ) ( X _ : H = p : ( S _ d p X _ ) S _ d p X _ H ) 2 ( 1 d ) 3 / 2 X l 1 p ( R / 1 d γ + σ y ) 2 + 1 ]
The consistent tangent operator K = is given by:
σ _ ˙ = K = : D _ = { σ _ ε _ e 1 H P [ ( σ _ ε _ e : n _ p ) ( σ _ ε _ e : n _ c ) Y ¯ σ _ d ( σ _ ε _ e : n _ c ) ] } : D _
K = = σ _ ε _ e 1 H P [ ( σ _ ε _ e : n _ p ) ( σ _ ε _ e : n _ c ) Y ¯ σ _ d ( σ _ ε _ e : n _ c ) ]
H P = ( 1 d ) n _ p : A = : n _ c + n _ p : ( A = : ε _ e ) Y ¯ + n _ x 1 d : ( Y ¯ ( 2 3 C α ) 2 3 C ( 1 d ) ( a α n _ x 1 d ) ) +    n i 1 d γ Q ( Y ¯ ( r γ d γ 1 ) ( 1 d ) ( b r n i 1 d γ ) ) 1 2 [ ( 1 d ) 3 2 S _ d c X _ + γ d γ 1 ( 1 d γ ) 3 2 R ] Y ¯
Y ¯ = 1 ( 1 d ) β + 1 2 Y Y 0 S ( θ ) s
where A = is the elastic operator defined as A i j k l = 2 μ e ( δ i k δ j l 1 3 δ i j δ k l ) + K e δ i j δ k l .

References

  1. Sumikawa, S.; Ishiwatari, A.; Hiramoto, J. Improvement of springback prediction accuracy by considering nonlinear elastoplastic behavior after stress reversal. J. Mater. Process. Technol. 2017, 241, 46–53. [Google Scholar] [CrossRef]
  2. Hassan, H.U.; Traphöner, H.; Güner, A.; Tekkaya, A.E. Accurate springback prediction in deep drawing using pre-strain based multiple cyclic stress–strain curves in finite element simulation. Int. J. Mech. Sci. 2016, 110, 229–241. [Google Scholar] [CrossRef]
  3. Chan, K.C.; Wang, S.H. Theoretical analysis of springback in bending of integrated circuit leadframes. J. Mater. Process. Technol. 1999, 91, 111–115. [Google Scholar] [CrossRef]
  4. Yuen, W.Y.D. A generalised solution for the prediction of springback in laminated strip. J. Mater. Process. Technol. 1996, 61, 254–264. [Google Scholar] [CrossRef]
  5. Neto, D.M.; Oliveira, M.C.; Santos, A.D.; Alves, J.L.; Menezes, L.F. Influence of boundary conditions on the prediction of springback and wrinkling in sheet metal forming. Int. J. Mech. Sci. 2017, 122, 244–254. [Google Scholar] [CrossRef]
  6. Liao, J.; Xue, X.; Lee, M.G.; Barlat, F.; Vincze, G.; Pereira, A.B. Constitutive modeling for path-dependent behavior and its influence on twist springback. Int. J. Plast. 2017, 93, 64–88. [Google Scholar] [CrossRef]
  7. Prates, P.A.; Pereira, A.F.G.; Sakharova, N.A.; Oliveira, M.C.; Fernandes, J.V. Inverse strategies for identifying the parameters of constitutive laws of metal sheets. Adv. Mater. Sci. Eng. 2016, 2016, 1–18. [Google Scholar] [CrossRef]
  8. Li, K.; Carden, W.; Wagoner, R. Simulation of springback. Int. J. Mech. Sci. 2002, 44, 103–122. [Google Scholar] [CrossRef]
  9. Oliveira, M.C.; Alves, J.L.; Chaparro, B.M.; Menezes, L.F. Study on the influence of work-hardening modeling in springback prediction. Int. J. Plast. 2007, 23, 516–543. [Google Scholar] [CrossRef] [Green Version]
  10. Chung, K.; Lee, M.G.; Kim, D.; Kim, C.; Wenner, M.L.; Barlat, F. Spring-back evaluation of automotive sheets based on isotropic-kinematic hardening laws and non-quadratic anisotropic yield functions: Part I: Theory and formulation. Int. J. Plast. 2005, 21, 861–882. [Google Scholar] [CrossRef]
  11. Chun, B.; Jinn, J.; Lee, J. Modeling the Bauschinger effect for sheet metals, part I: Theory. Int. J. Plast. 2002, 18, 571–595. [Google Scholar] [CrossRef]
  12. Dongjuan, Z.; Zhenshan, C.; Xueyu, R.; Yuqiang, L. Sheet springback prediction based on non-linear combined hardening rule and Barlat89’s yielding function. Comput. Mater. Sci. 2006, 38, 256–262. [Google Scholar] [CrossRef]
  13. Zang, S.; Lee, M.G.; Sun, L.; Kim, J.H. Measurement of the Bauschinger behavior of sheet metals by three-point bending springback test with pre-strained strips. Int. J. Plast. 2014, 59, 84–107. [Google Scholar] [CrossRef]
  14. Stoughton, T.; Xia, C.; Du, C.; Shi, M. Challenges for Constitutive Models for Forming of Advanced Steels. In Proceedings of the National Science Foundation Workshop, Arlington, VA, USA, 29–30 March 2006. [Google Scholar]
  15. Lee, M.G.; Kim, D.; Kim, C.; Wenner, M.L.; Wagoner, R.H.; Chung, K. A practical two-surface plasticity model and its application to spring-back prediction. Int. J. Plast. 2007, 23, 1189–1212. [Google Scholar] [CrossRef]
  16. Govik, A.; Rentmeester, R.; Nilsson, L. A study of the unloading behaviour of dual phase steel. Mater. Sci. Eng. A 2014, 602, 119–126. [Google Scholar] [CrossRef]
  17. Gau, J.-T.; Kinzel, G.L. A new model for springback prediction in which the Bauschinger effect is considered. Int. J. Mech. Sci. 2001, 43, 1813–1832. [Google Scholar] [CrossRef]
  18. Wang, Z.; Hu, Q.; Yan, J.; Chen, J. Springback prediction and compensation for the third generation of UHSS stamping based on a new kinematic hardening model and inertia relief approach. Int. J. Adv. Manuf. Technol. 2017, 90, 875–885. [Google Scholar] [CrossRef]
  19. Nayebi, A.; Shahabi, M. Effect of continuum damage mechanics on springback prediction in metal forming processes. J. Mech. Sci. Technol. 2017, 31, 2229–2234. [Google Scholar] [CrossRef]
  20. Zajkani, A.; Hajbarati, H. An analytical modeling for springback prediction during U-bending process of advanced high-strength steels based on anisotropic nonlinear kinematic hardening model. Int. J. Adv. Manuf. Technol. 2017, 90, 349–359. [Google Scholar] [CrossRef]
  21. Jamli, M. Finite element analysis of springback process in sheet metal forming. Int. J. Adv. Manuf. Technol. 2017, 11, 75–84. [Google Scholar]
  22. Badreddine, H.; Yue, Z.; Saanouni, K. Modeling of the induced plastic anisotropy fully coupled with ductile damage under finite strains. Int. J. Solids Struct. 2017, 108, 49–62. [Google Scholar] [CrossRef]
  23. Saanouni, K. Damage Mechanics in Metal Forming: Advanced Modeling and Numerical Simulation; John Wiley & Sons: Hoboken, NJ, USA, 2012. [Google Scholar]
  24. Souto, N.; Andrade-Campos, A.; Thuillier, S. Material parameter identification within an integrated methodology considering anisotropy, hardening and rupture. J. Mater. Process. Technol. 2015, 220, 157–172. [Google Scholar] [CrossRef]
  25. Yue, Z.; Soyarslan, C.; Badreddine, H.; Saanouni, K.; Tekkaya, A.E. Identification of fully coupled anisotropic plasticity and damage constitutive equations using a hybrid experimental–numerical methodology with various triaxialities. Int. J. Damage Mech. 2015, 24, 683–710. [Google Scholar] [CrossRef]
  26. Yue, Z. Ductile Damage Prediction in Sheet Metal Forming Processes. Ph.D. Thesis, University of Technology of Troyes, Troyes, France, 8 September 2014. [Google Scholar]
  27. François, M. A plasticity model with yield surface distortion for non proportional loading. Int. J. Plast. 2001, 17, 703–717. [Google Scholar] [CrossRef] [Green Version]
Figure 1. Specimen geometry for the tensile test (a) (1.6 mm thickness) and cyclic shear tests (b).
Metals 08 00950 g001
Figure 2. Tensile tests of AA7055 aluminum alloy sheet.
Metals 08 00950 g002
Figure 3. Experimental setup for the cyclic shear test.
Metals 08 00950 g003
Figure 4. Experimental and numerical cyclic loading stress-strain curve.
Metals 08 00950 g004
Figure 5. Stress-strain curve during the cyclic loading-unloading process.
Metals 08 00950 g005
Figure 6. Variations of elastic moduli during the cyclic loading-unloading process.
Metals 08 00950 g006
Figure 7. Three-point bending test device.
Metals 08 00950 g007
Figure 8. Comparison of three-point bending specimens with different pre-strains.
Metals 08 00950 g008
Figure 9. Springback angles after bending tools unloading versus pre-straining states.
Metals 08 00950 g009
Figure 10. Finite element model for bending tests.
Metals 08 00950 g010
Figure 11. Springback angle obtained after three-point bending test with different considered kinematic hardening fractions and tensile pre-strains (no damage).
Metals 08 00950 g011
Figure 12. Numerical obtained stress contour with different kinematic hardening fraction.
Metals 08 00950 g012
Figure 13. Comparison between the numerical and experimental obtained springback.
Metals 08 00950 g013
Figure 14. The effect of damage parameter S on the stress-strain curve.
Metals 08 00950 g014
Figure 15. Ductile damage contour across the thickness section.
Metals 08 00950 g015
Table 1. The material parameters of the AA7055 aluminum alloy.
Materialt (mm)ρ (g/cm3)E (MPa)νσy (MPa)σs (MPa)F = F*G = G*H = H*L = L*M = M*
AA70551.602.86684390.3290.98369.190.520.620.381.51.5
N = N*Q (MPa)bC (MPa)aSsβY0γhdc
1.472014.572014.50.751.04130.20.99
Table 2. Hardening parameters corresponding to the different kinematic hardening fraction.
Kinematic Hardening FractionIsotropic HardeningKinematic Hardening
Q (MPa)bC (MPa)a
0.0144114.53014.53
0.11297144.1
0.21153288.3
0.31009432.4
0.4864.9576.6
0.5720.8720.8
0.6576.6864.9
0.7432.41009
0.8288.31153
0.9144.11297
1.001441

