Article

Study of Relation between Shot Peening Parameters and Fatigue Fracture Surface Character of an AW 7075 Aluminium Alloy

1
Research Centre of the University of Žilina, University of Žilina, Univerzitná 8215/1, 010 26 Žilina, Slovakia
2
Institute of Physics of Materials, Academy of Sciences of the Czech Republic, Žižkova 22, 616 62 Brno, Czech Republic
3
Department of Materials Engineering, Faculty of Mechanical Engineering, University of Žilina, Univerzitná 8215/1, 010 26 Žilina, Slovakia
*
Author to whom correspondence should be addressed.
Metals 2018, 8(2), 111; https://doi.org/10.3390/met8020111
Submission received: 11 January 2018 / Revised: 24 January 2018 / Accepted: 26 January 2018 / Published: 6 February 2018
(This article belongs to the Special Issue Kinetic Surface Treatments)

Abstract

:
Shot peening is a well-known surface treatment method used for fatigue life improvement of cyclically loaded structural components. Since three main variables are considered in the peening process (peening intensity, coverage and peening media type), there is no direct way to choose the best combination of treatment parameters for the best performance, thus it has to be based on experience and laboratory tests. When shot peening is performed with inadequate parameters, or the peening process is not stable in time (decrease of the peening pressure, deterioration of the peening media and so on), it can result in significant degradation of the treated component fatigue properties, what is commonly called as the “overpeening” effect. When a premature fatigue fracture occurs in operation, the fracture surface analysis is usually the most important method of revealing the damage mechanism. This work is aimed at the study of the relation between the shot peening parameters and the fatigue fracture surface character on an AW 7075 aluminium alloy with an objective of identifying marks of overpeening and investigating the fatigue crack initiation mechanism. After performing the tests, it was observed that shot peening with optimized parameters creates a surface layer that is able to change the mechanism of the fatigue crack propagation and improve fatigue strength. On the other hand, using extensive peening parameters decrease the fatigue strength due to the creation of surface cracks and surface layer delamination.

1. Introduction

Shot peening is currently well recognized and the most widely applied surface strengthening technique for fatigue life improvement [1]. In many studies, the positive effect on fatigue life of all sorts of engineering materials, such as steels [2,3,4], aluminium [5,6], magnesium [7,8], titanium [9] and nickel [10] alloys, was proven. The fatigue life improvement is a result of a complex modification of the surface layer’s structural state by increasing the dislocation density (deformation strengthening), grain refinement, and by accumulation of the compressive residual stresses, which slow down the fatigue crack initiation process and increase the resistance to fatigue crack propagation in the early stages of fatigue damage [11,12].
Since it was found out that a significant part of the residual stresses relax during the cyclic loading [13] and the residual stress loss does not correspond to fatigue life improvement, another mechanism of surface modification had to be considered to explain this uncertainty and it has been proven in many studies that this mechanism is grain refinement [2,5,13,14]. The new generation of shot peening was developed putting emphasis on the grain refinement process and that treatment is commonly called severe shot peening (SSP). It is characterized by the use of unconventionally severe parameters which are able to introduce significant grain refinement and create a nanostructural surface layer with superior mechanical properties when compared to the coarse grained equivalent [2,5,14,15,16,17]. This treatment is often able to provide superior fatigue life improvement than conventional shot peening [5,18].
The fatigue life improvement results by conventional shot peening and the severe shot peening treatment are very sensitive to the process parameters used, usually quantified by Almen intensity and coverage. However, using inappropriately severe parameters can lead to an effect called “overpeening”, which causes significant degradation of the surface layer and consequently of fatigue properties [5,19,20]. Even when there is a basic knowledge of the surface defects after extensive shot peening, described as burrs, folds and micro cracks [21], only limited information is available on degradation mechanisms that cause the decrease in fatigue life. One of the possibilities for studying them is to analyze the fracture surfaces after the fatigue test, looking for various marks and characteristics of fatigue crack initiation. Knowledge about the relation between the shot peening parameters and the fracture surface character, mainly in the stage of fatigue crack initiation, provides essential information for quality control and failure analysis when it is necessary to evaluate a posteriori the quality of the shot-peening technological process.
The aim of this research was to analyze the dependence of the fatigue life of AW 7075 aluminium alloy on the shot peening parameters and, consequently, on the fracture surface character. The main focus was given to the surface-layer integrity and fatigue crack initiation and propagation in the shot peened surface layer.

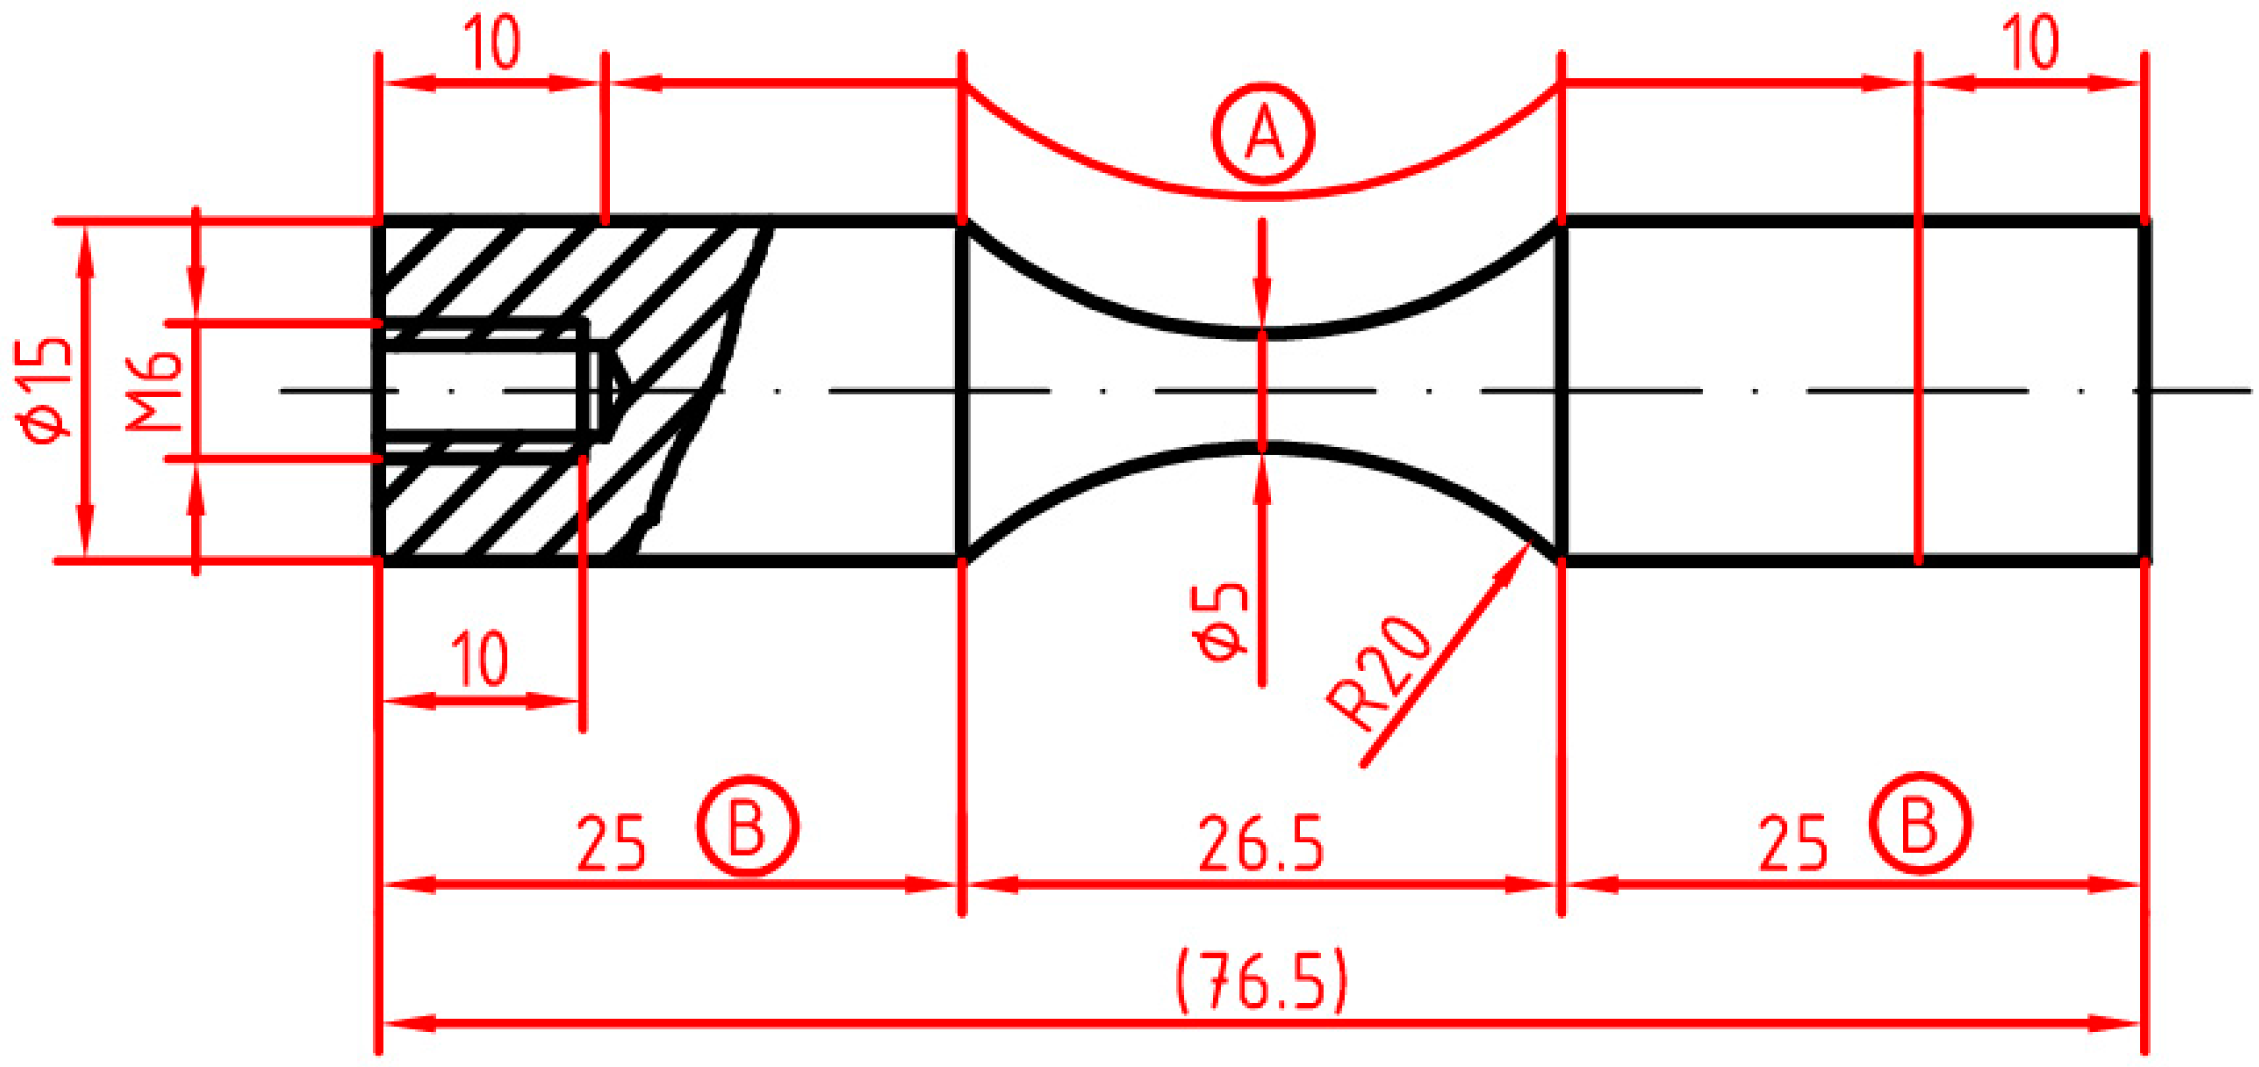
2. Materials and Methods

As experimental material, the AW 7075 T6511 aluminium alloy was used, in the form of extruded bars 15 mm in diameter. The T6 heat treatment for this alloy, according to [22], consists of solution heat treatment at 482 °C for 2 h, quenching in water, and aging at 130 °C for 24 h (T6 temper). The Tx511 refers specifically to plates, rolled or cold-finished rods and bars, to die or ring forgings and to rolled-ring products that are stretched to relieve residual stresses and that may receive minor straightening after stretching to comply with standard tolerances [23]. Mechanical properties (Table 1 [5]) fulfilled the required conditions according to the materials datasheet.
The microstructure of extruded bars (Figure 1) was revealed by etching with Fuss solution (7.5 mL HF + 25 mL HCl + 8 mL HNO3 + 1000 mL H2O) and has a strong deformation (laminar-kind) texture caused by the extrusion process. It is formed by solid solution of zinc in aluminium and a great number of large or very fine intermetallic phases. Typically, AW 7075 has a chemical composition including up-to 10 alloying elements. These elements include primarily Zn, Mg and Cu; however, appreciable and specific amounts of Fe, Si, Cr, Ti, Zr and Mn are often present (both as deliberate additions and as impurities). Over the past three decades, the microstructure of AW 7075 has been well characterized, along with the corresponding physical metallurgy. The literature gives evidence supporting the presence of the following intermetallic phases in 7xxx series alloys (not all are simultaneously present, and temper and precise composition will regulate their types and shape): MgZn2, Mg2Si, Al20Cu2Mn3, Al12Mn3Si, Al7Cu2Fe, Al2Cu, Al2CuMg, Al3Fe, Al12Mg2Cr, Al20Cu2Mn3, Al6Mn, Al3Ti, Al6Zr, Mg2Al3, Al32Zn49, and Mg(AlCu) [22,24,25]. Due to deformation texture created during the extrusion process, the particles of intermetallic phases are mainly aligned in lines, when referred to the longitudinal cut (Figure 1a). On the cross cut, the cut lines of intermetallic phases appear as clusters distributed in the volume of material (Figure 1b).
One of the basic conditions for assuring the repeatability of the shot peening process is to evaluate the velocity of the shot stream (peening intensity) and the ratio between the surface of the material covered by dimples after the hitting of the peening media and the original surface (peening coverage). Shot peening intensity is measured by the standardized Almen test, which is referred to intensity at saturation, measured as the height of the arc created on a shot peened metal strip. Shot peening coverage is analyzed by optical methods. Coverage of 98% is a degree of coverage that can still be assessed visually. The corresponding duration of the shot peening process after which the 98% coverage degree is obtained is frequently called the shot peening time t98%. The required duration of the treatment is the product of the shot peening time t98% and a security factor S, usually 2 times t98%, which ensures that the surface of the component has a coverage of at least 100%. This means that every point of the surface is covered by a shot peening impact dimple. Higher coverage degrees are created analogically by multiplication of the time for 100% coverage. For more information about the shot peening intensity and coverage measurement refer to [1].
To provide a systematic analysis of the shot peening influence on the fatigue life of the AW 7075 aluminium alloy, air blast shot peening with five increasing peening intensities and coverages was performed (Table 2). Full fatigue life results were published in [5], while this work is focused only on the fatigue fracture surface character of the peened material. Treatment with each intensity was done on two ultrasonic fatigue test specimens used for fatigue tests at 20 kHz frequency (Lasur, Asnières, France) [26] (Figure 2). Dimension marked “A” defines the length of the shot peened surface area and dimension marked “B” was adjusted to harmonize the resonance frequency of the specimen with the resonance frequency of the ultrasonic horn used [2,26]. Fatigue tests were carried out at two loading stress levels: σa = 185 MPa and σa = 176 MPa. The parameters of the shot peening treatments are given in Table 2 together with the resulting surface roughness (also the roughness of the not-peened (NP) specimen is included). The gauge length surfaces of the not-peened specimens were ground with the SiC paper and polished with diamond metallography emulsion with diamond particle size of 0.7 µm.

3. Results

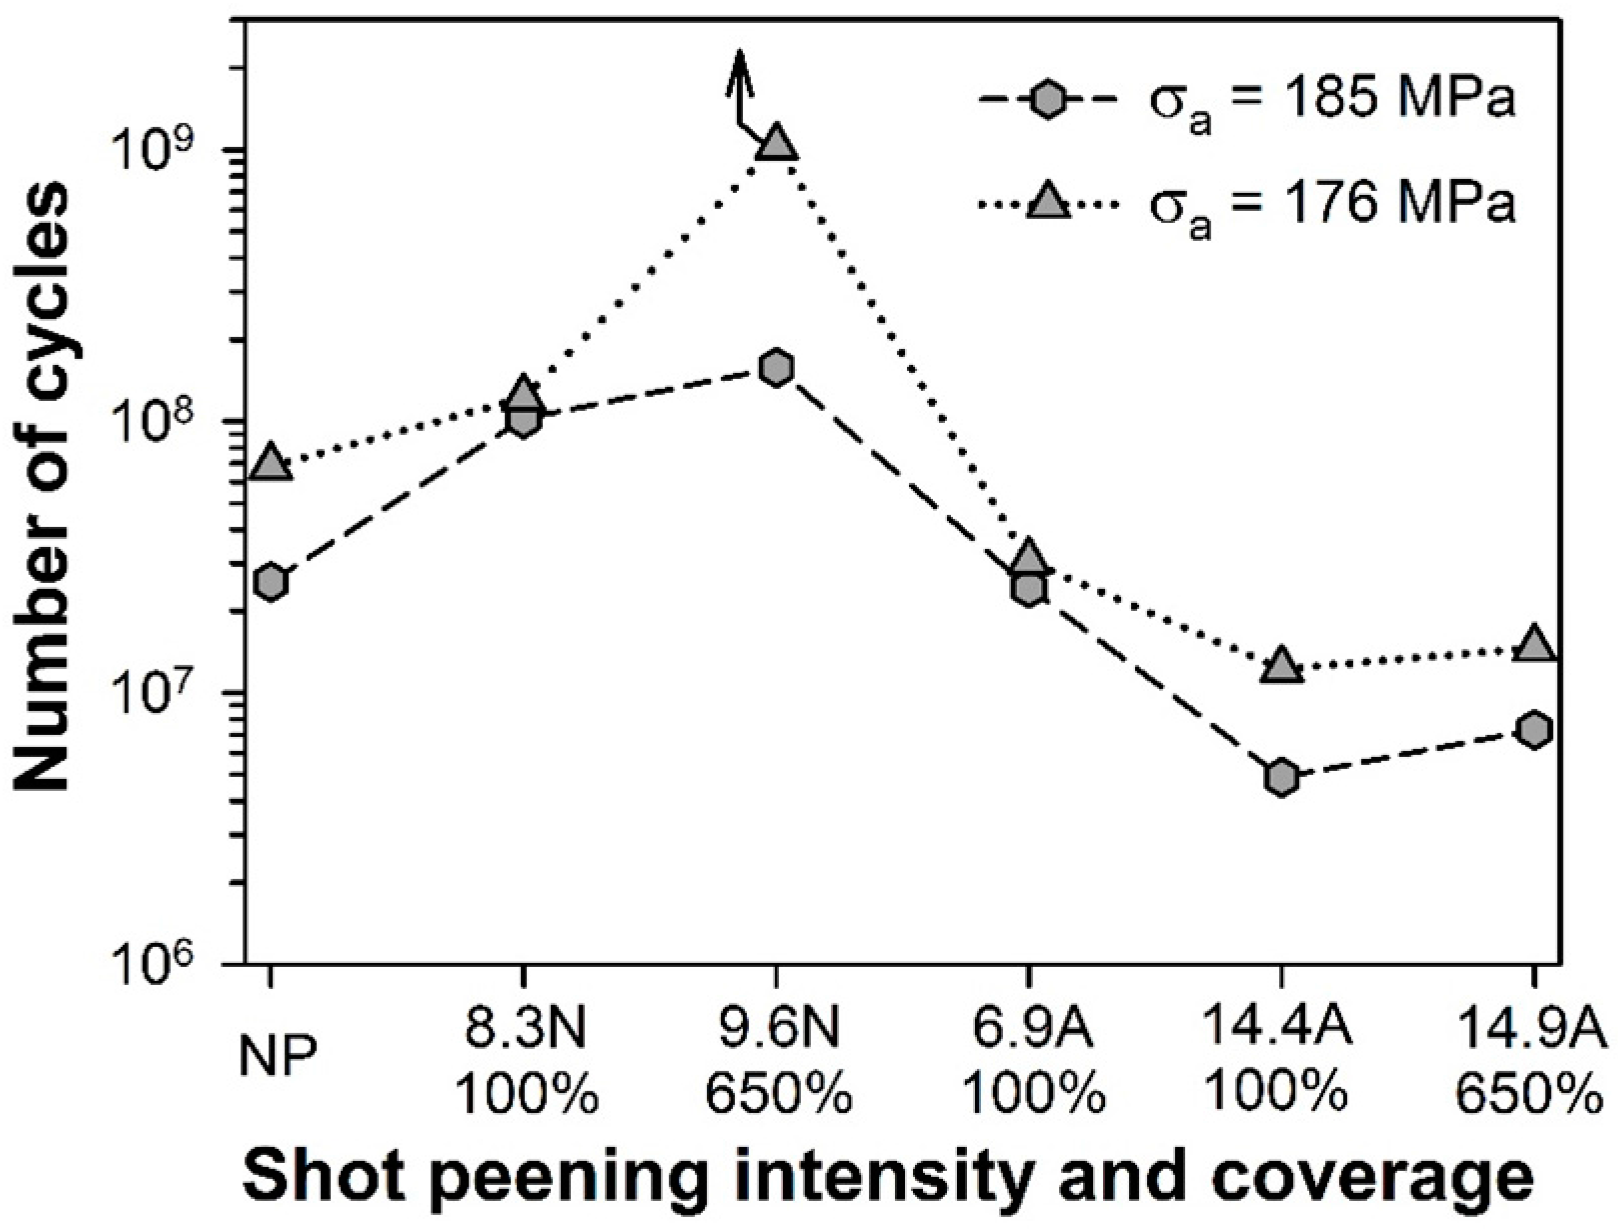
3.1. Fatigue Life Analysis

According to the results of the fatigue tests (Figure 3) the lightest peening intensity (8.3 N/100%) increased the fatigue life of AW 7075 aluminium alloy with respect to the mechanically polished specimens. Based on the promising increase of the fatigue life of the previous treatment, the parameters for severe shot peening were chosen by a slight increase of the intensity to 9.6 N and significant increase of the coverage to 650%. This treatment provided even higher fatigue life increase, as can be seen in Figure 3. The higher peening intensity, 6.9 A/100%, had an opposite effect and caused a decrease of the fatigue life slightly under the level of the NP specimens. The higher peening intensity, 14.4 A/100%, again decreased the fatigue life and caused specimens to fracture after a number of cycles much lower than after treatment with 8.3 N/100% and even below the polished specimens. To answer the question whether shot peening with even higher parameters than 14.4 A/100% will not create a much deeper residual stress field that could again increase the fatigue life, the severe shot peening parameters of 14.9 A/650% were chosen. However, from the results in Figure 3, it is obvious that it had about the same degradation effect as the previous treatment (14.4 A/100%) and the degradation effect was saturated [2].
It is necessary to note that to provide full information about the influence of the shot peening treatment with particular parameters on the fatigue life using only two specimens is not sufficient. However, in an extruded material with no significant surface defects (as was observed in Figure 1) acting as nuclei for the fatigue crack initiation, it was enough for basic evaluation about the process parameters influence and later on these results were confirmed by the surface characteristics and the fracture surface analysis. This was confirmed by [27] where fatigue tests in the low-cycle, high-cycle and ultra-high cycle regions were carried out and the whole S-N curve is characteristic with low-scatter data. Also, results of the fatigue tests of the NP material in the high- and ultra-high cycle regions, provided in [5], confirmed the low scatter of the fatigue tests results in conditions of ultrasonic fatigue testing.

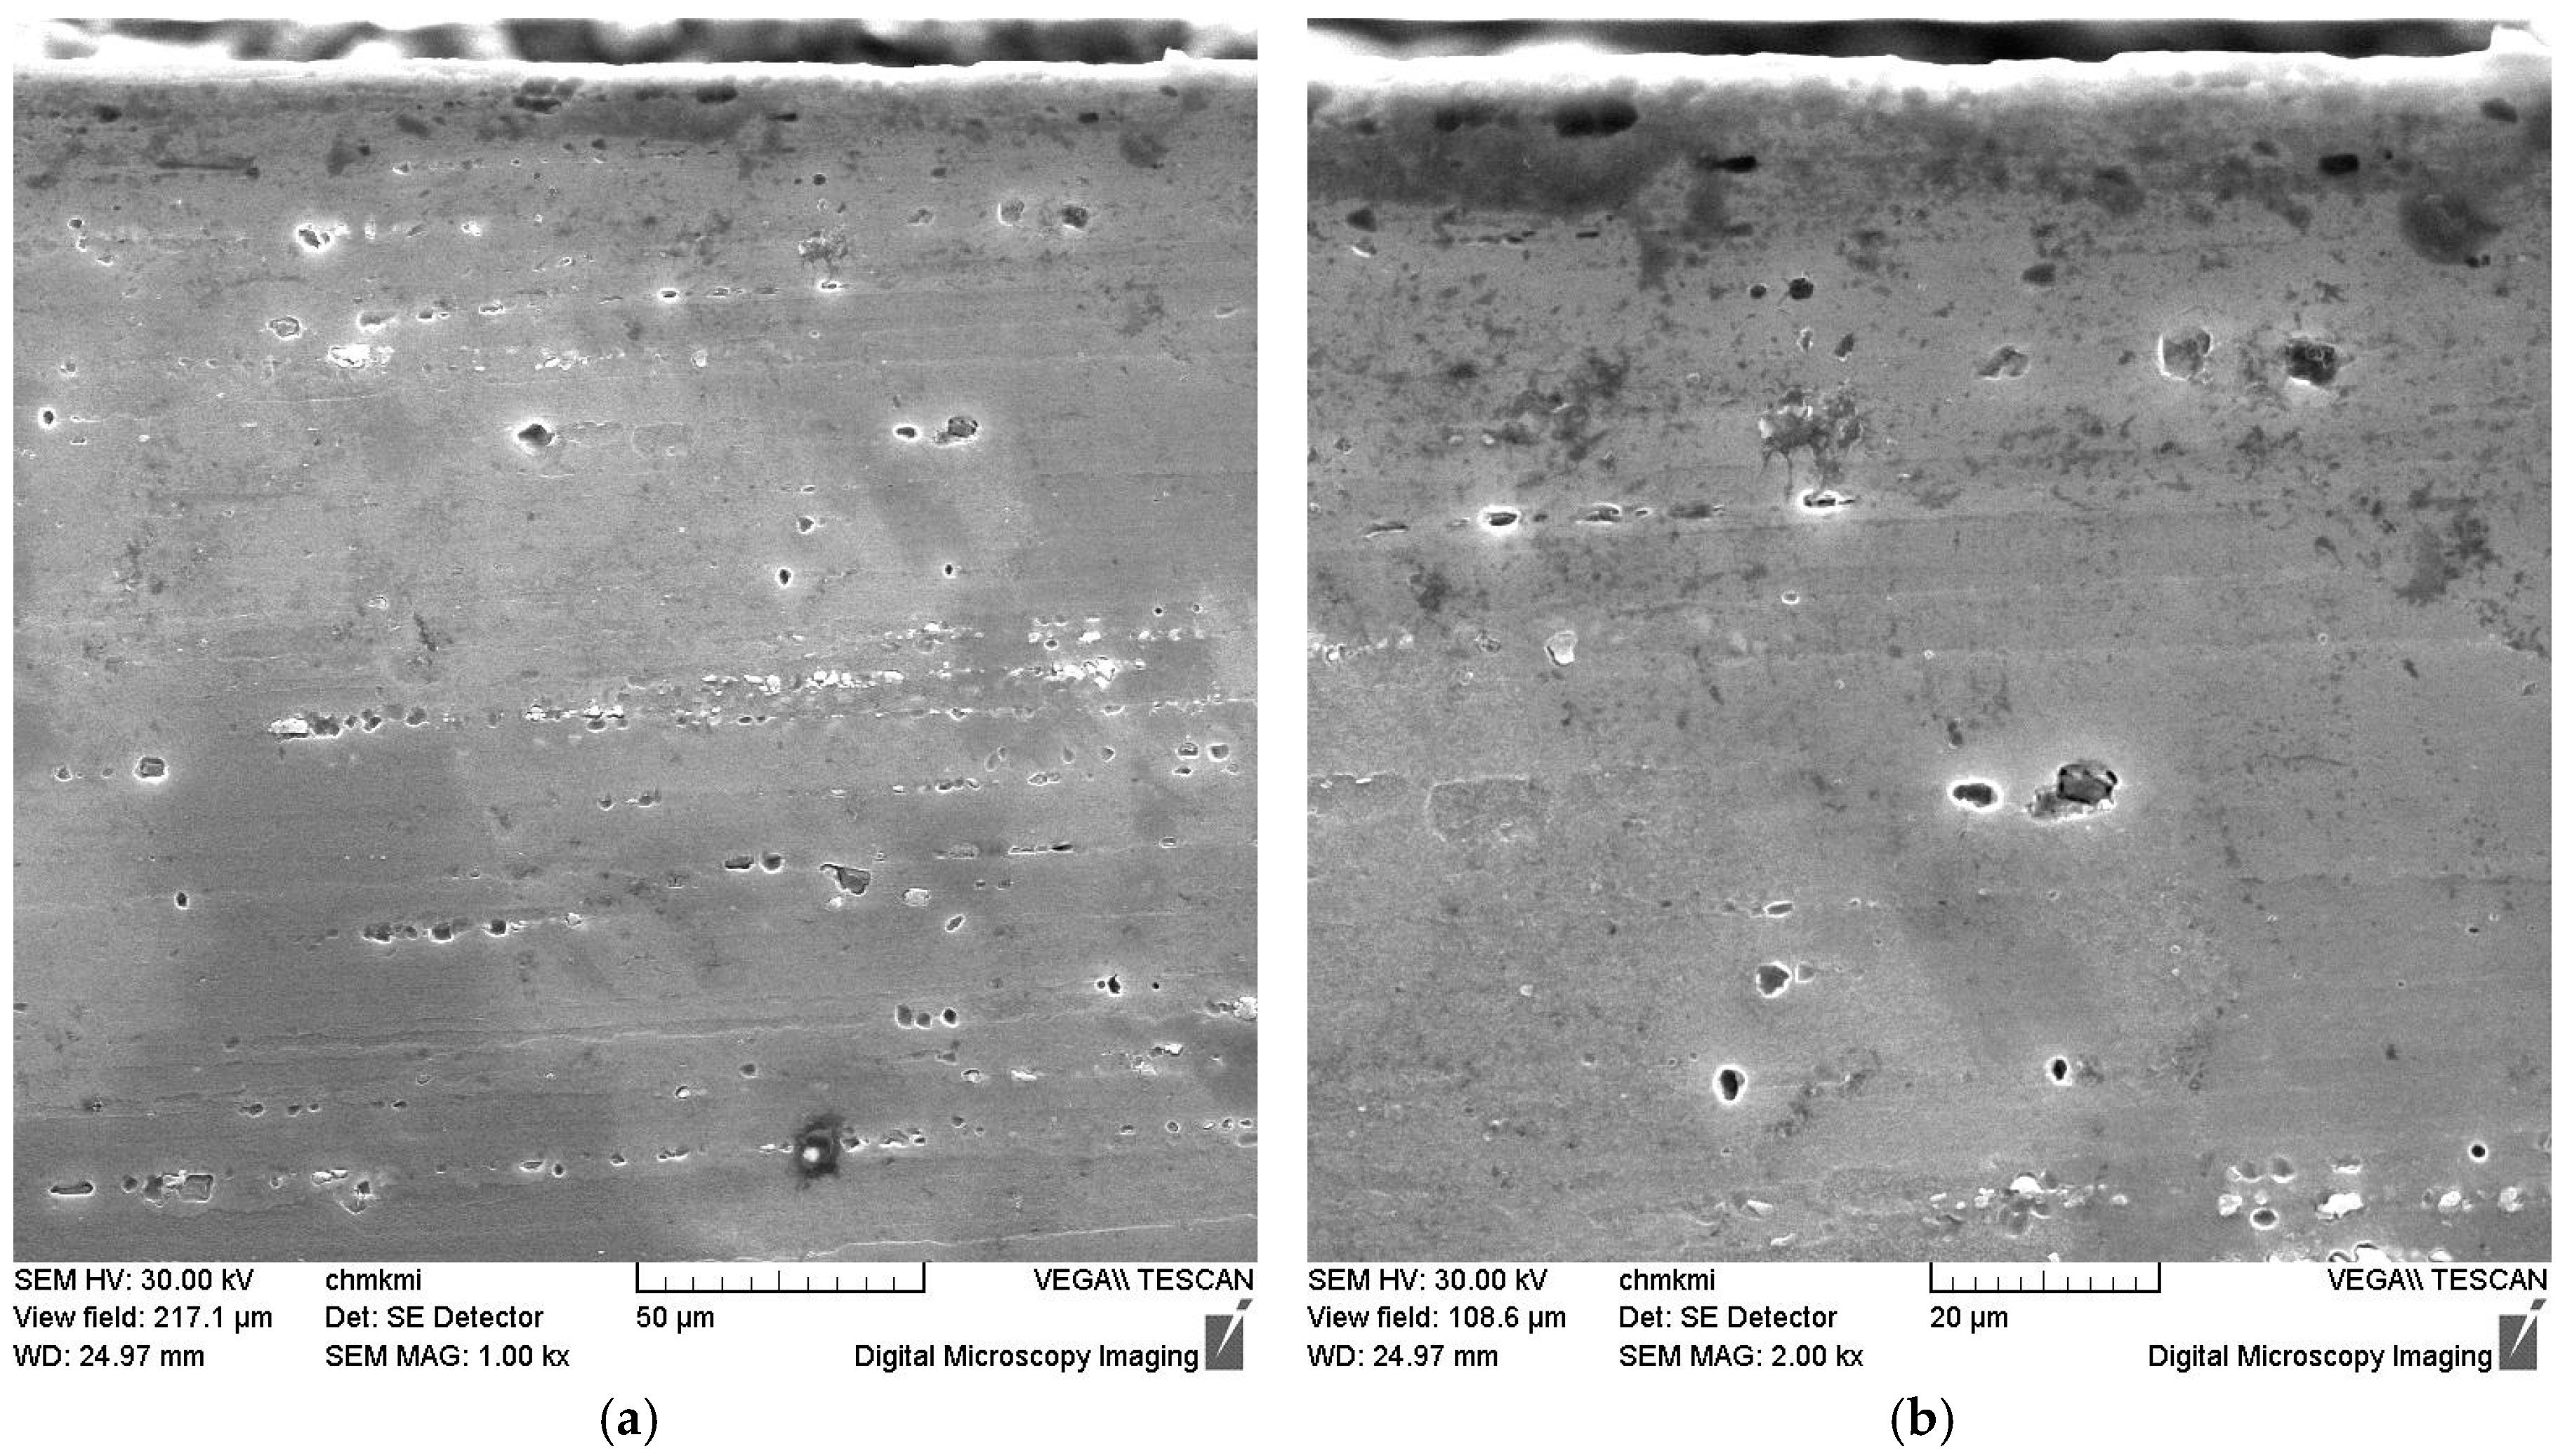
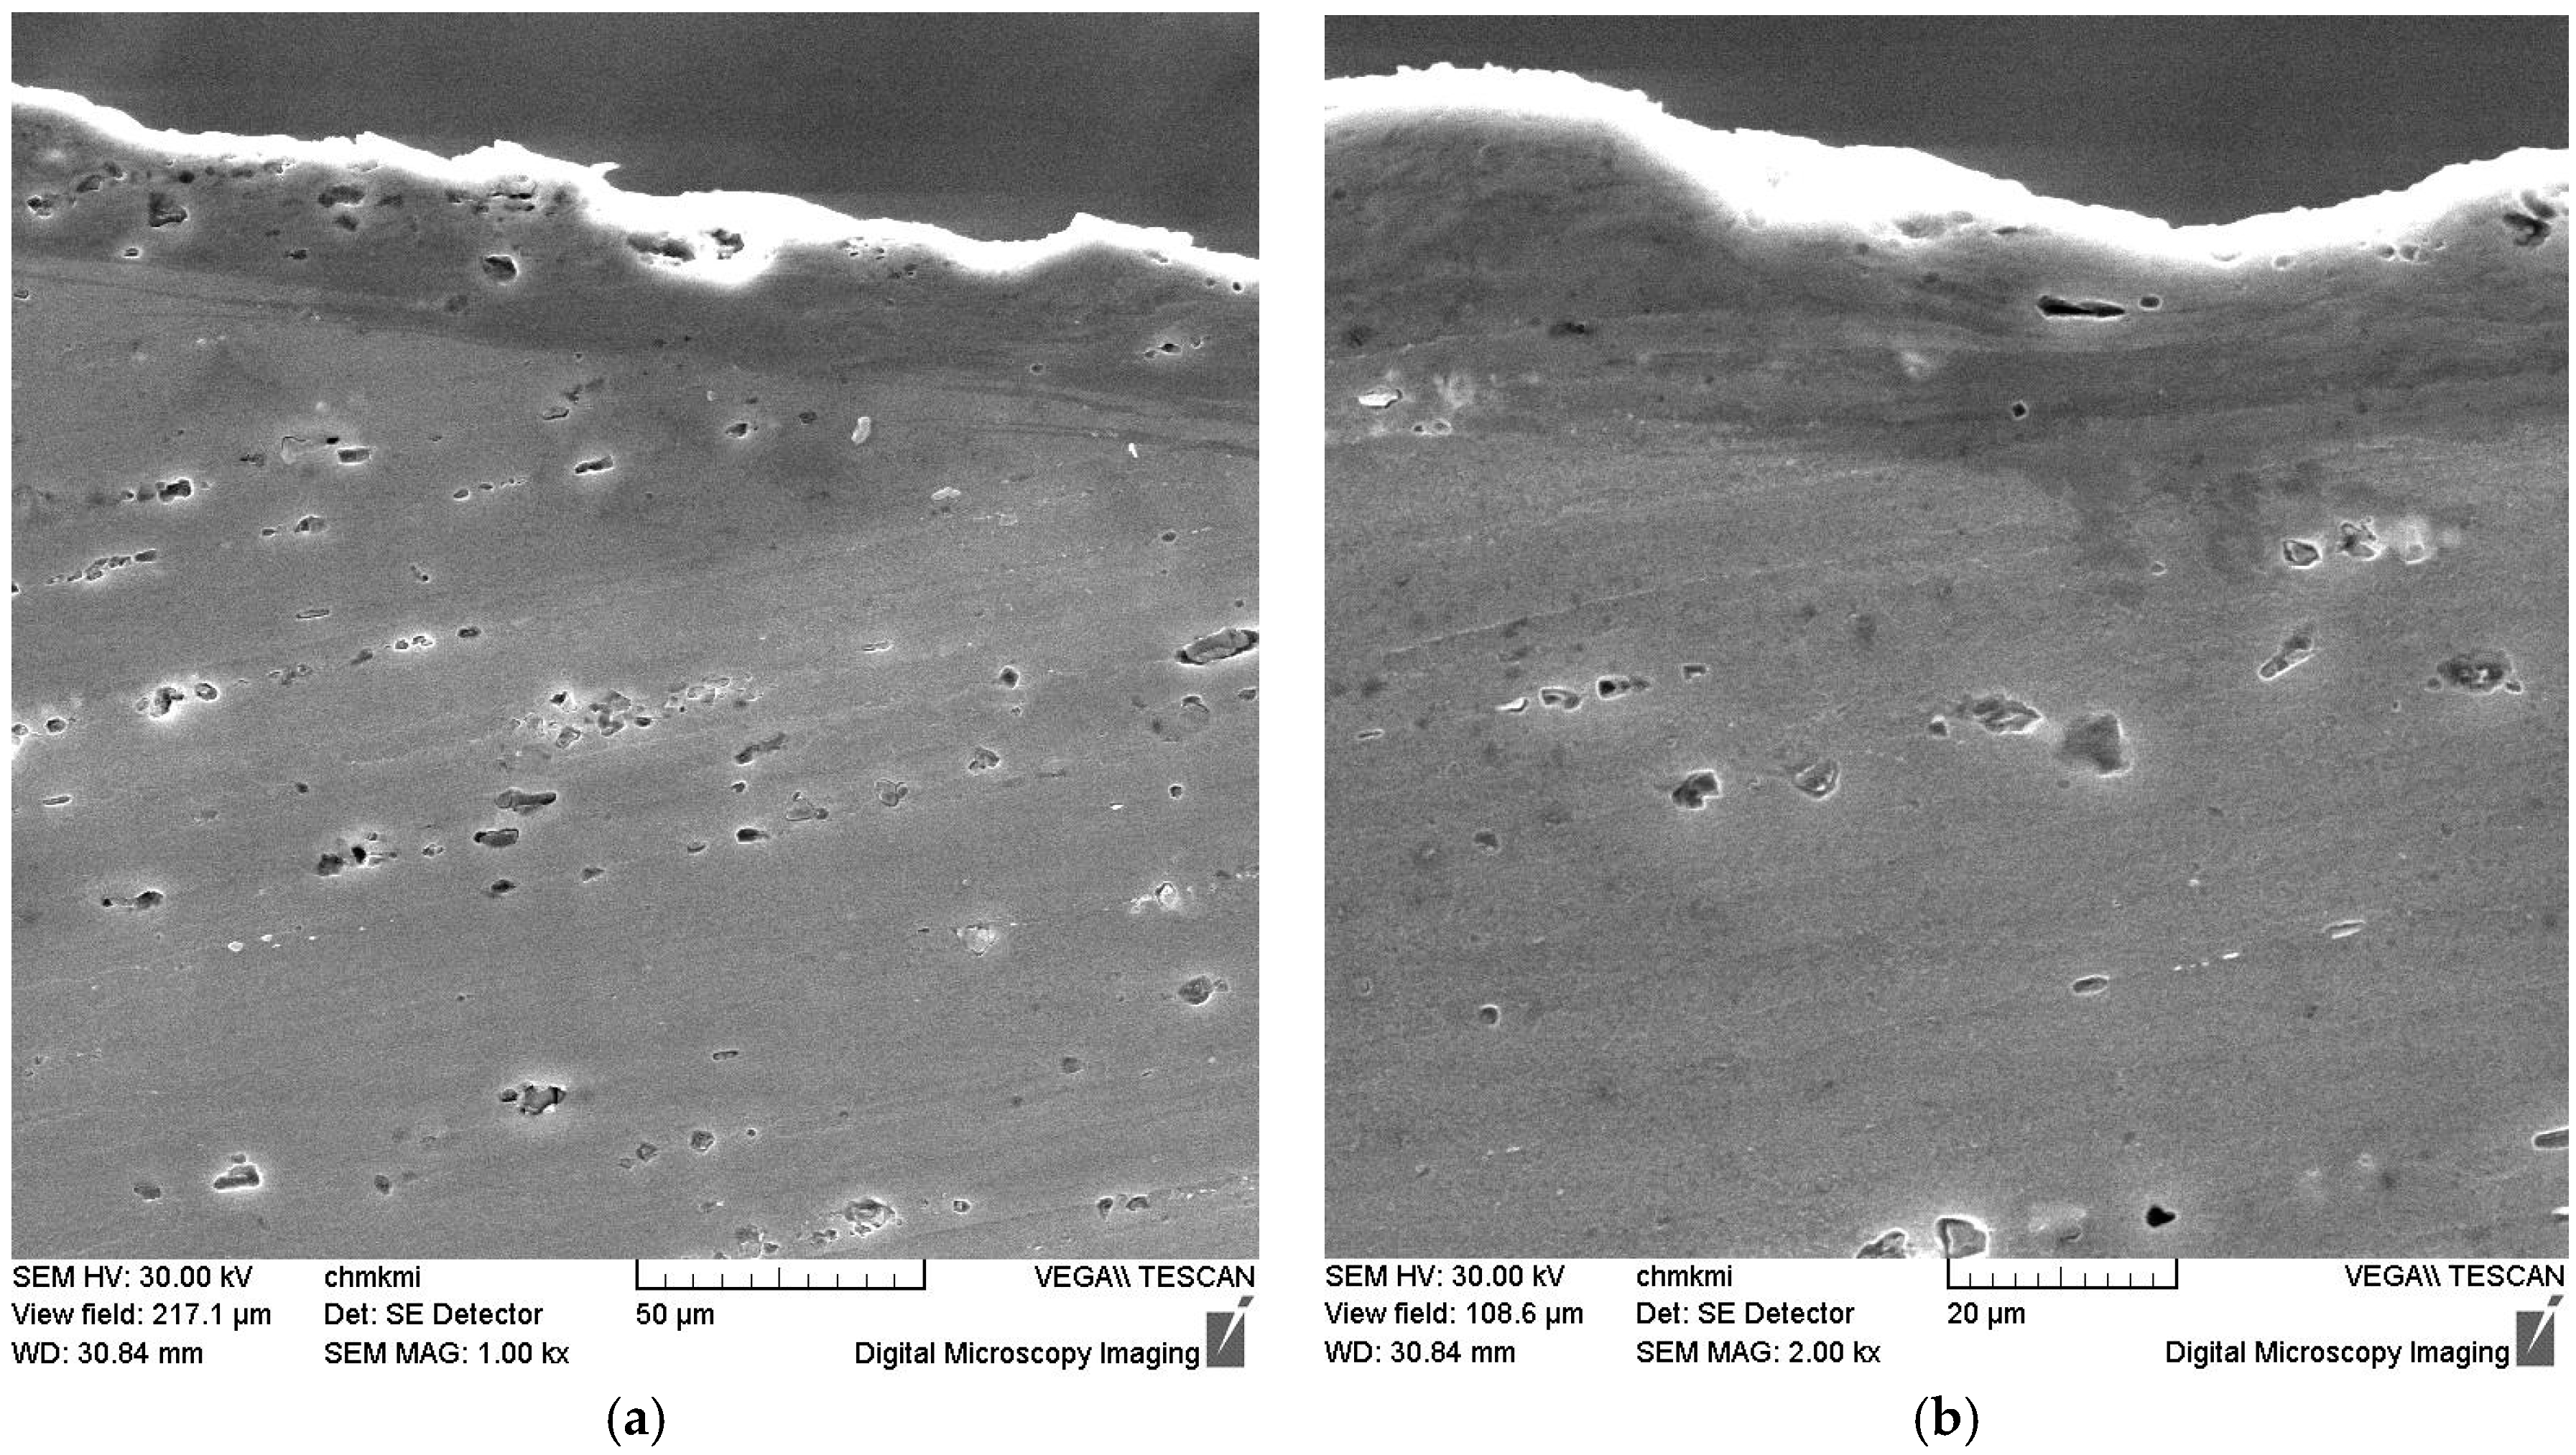
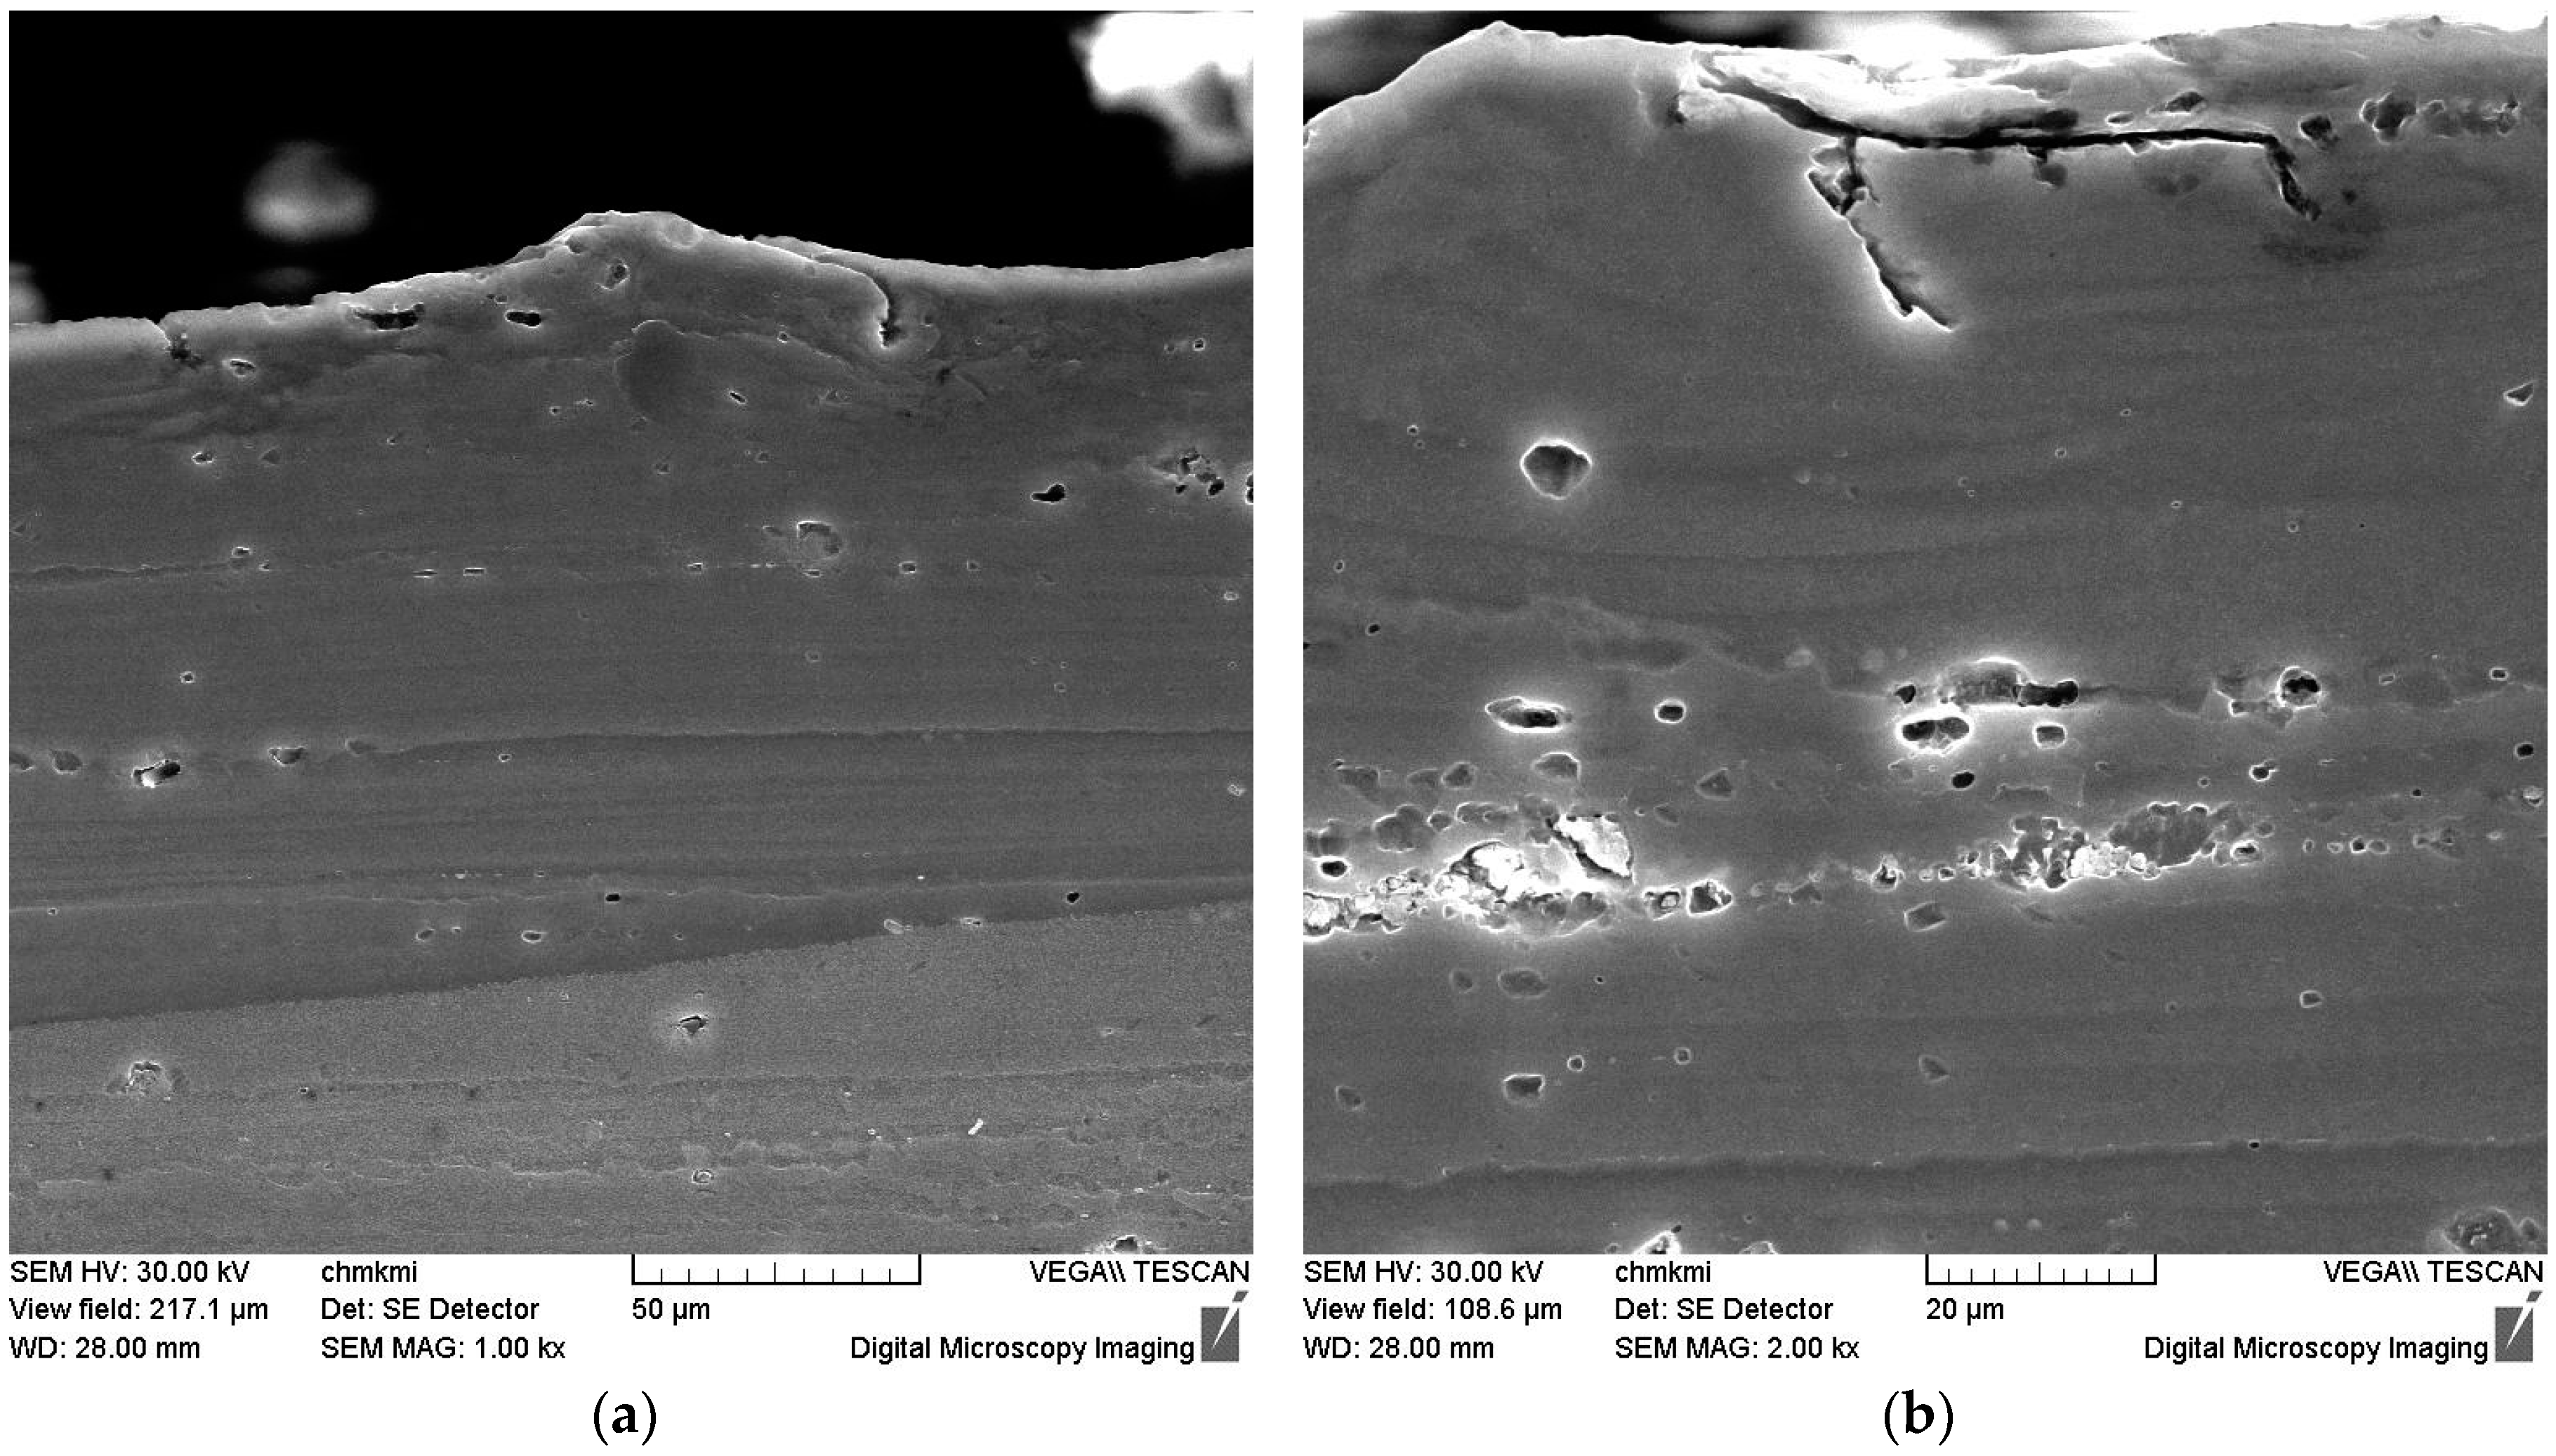
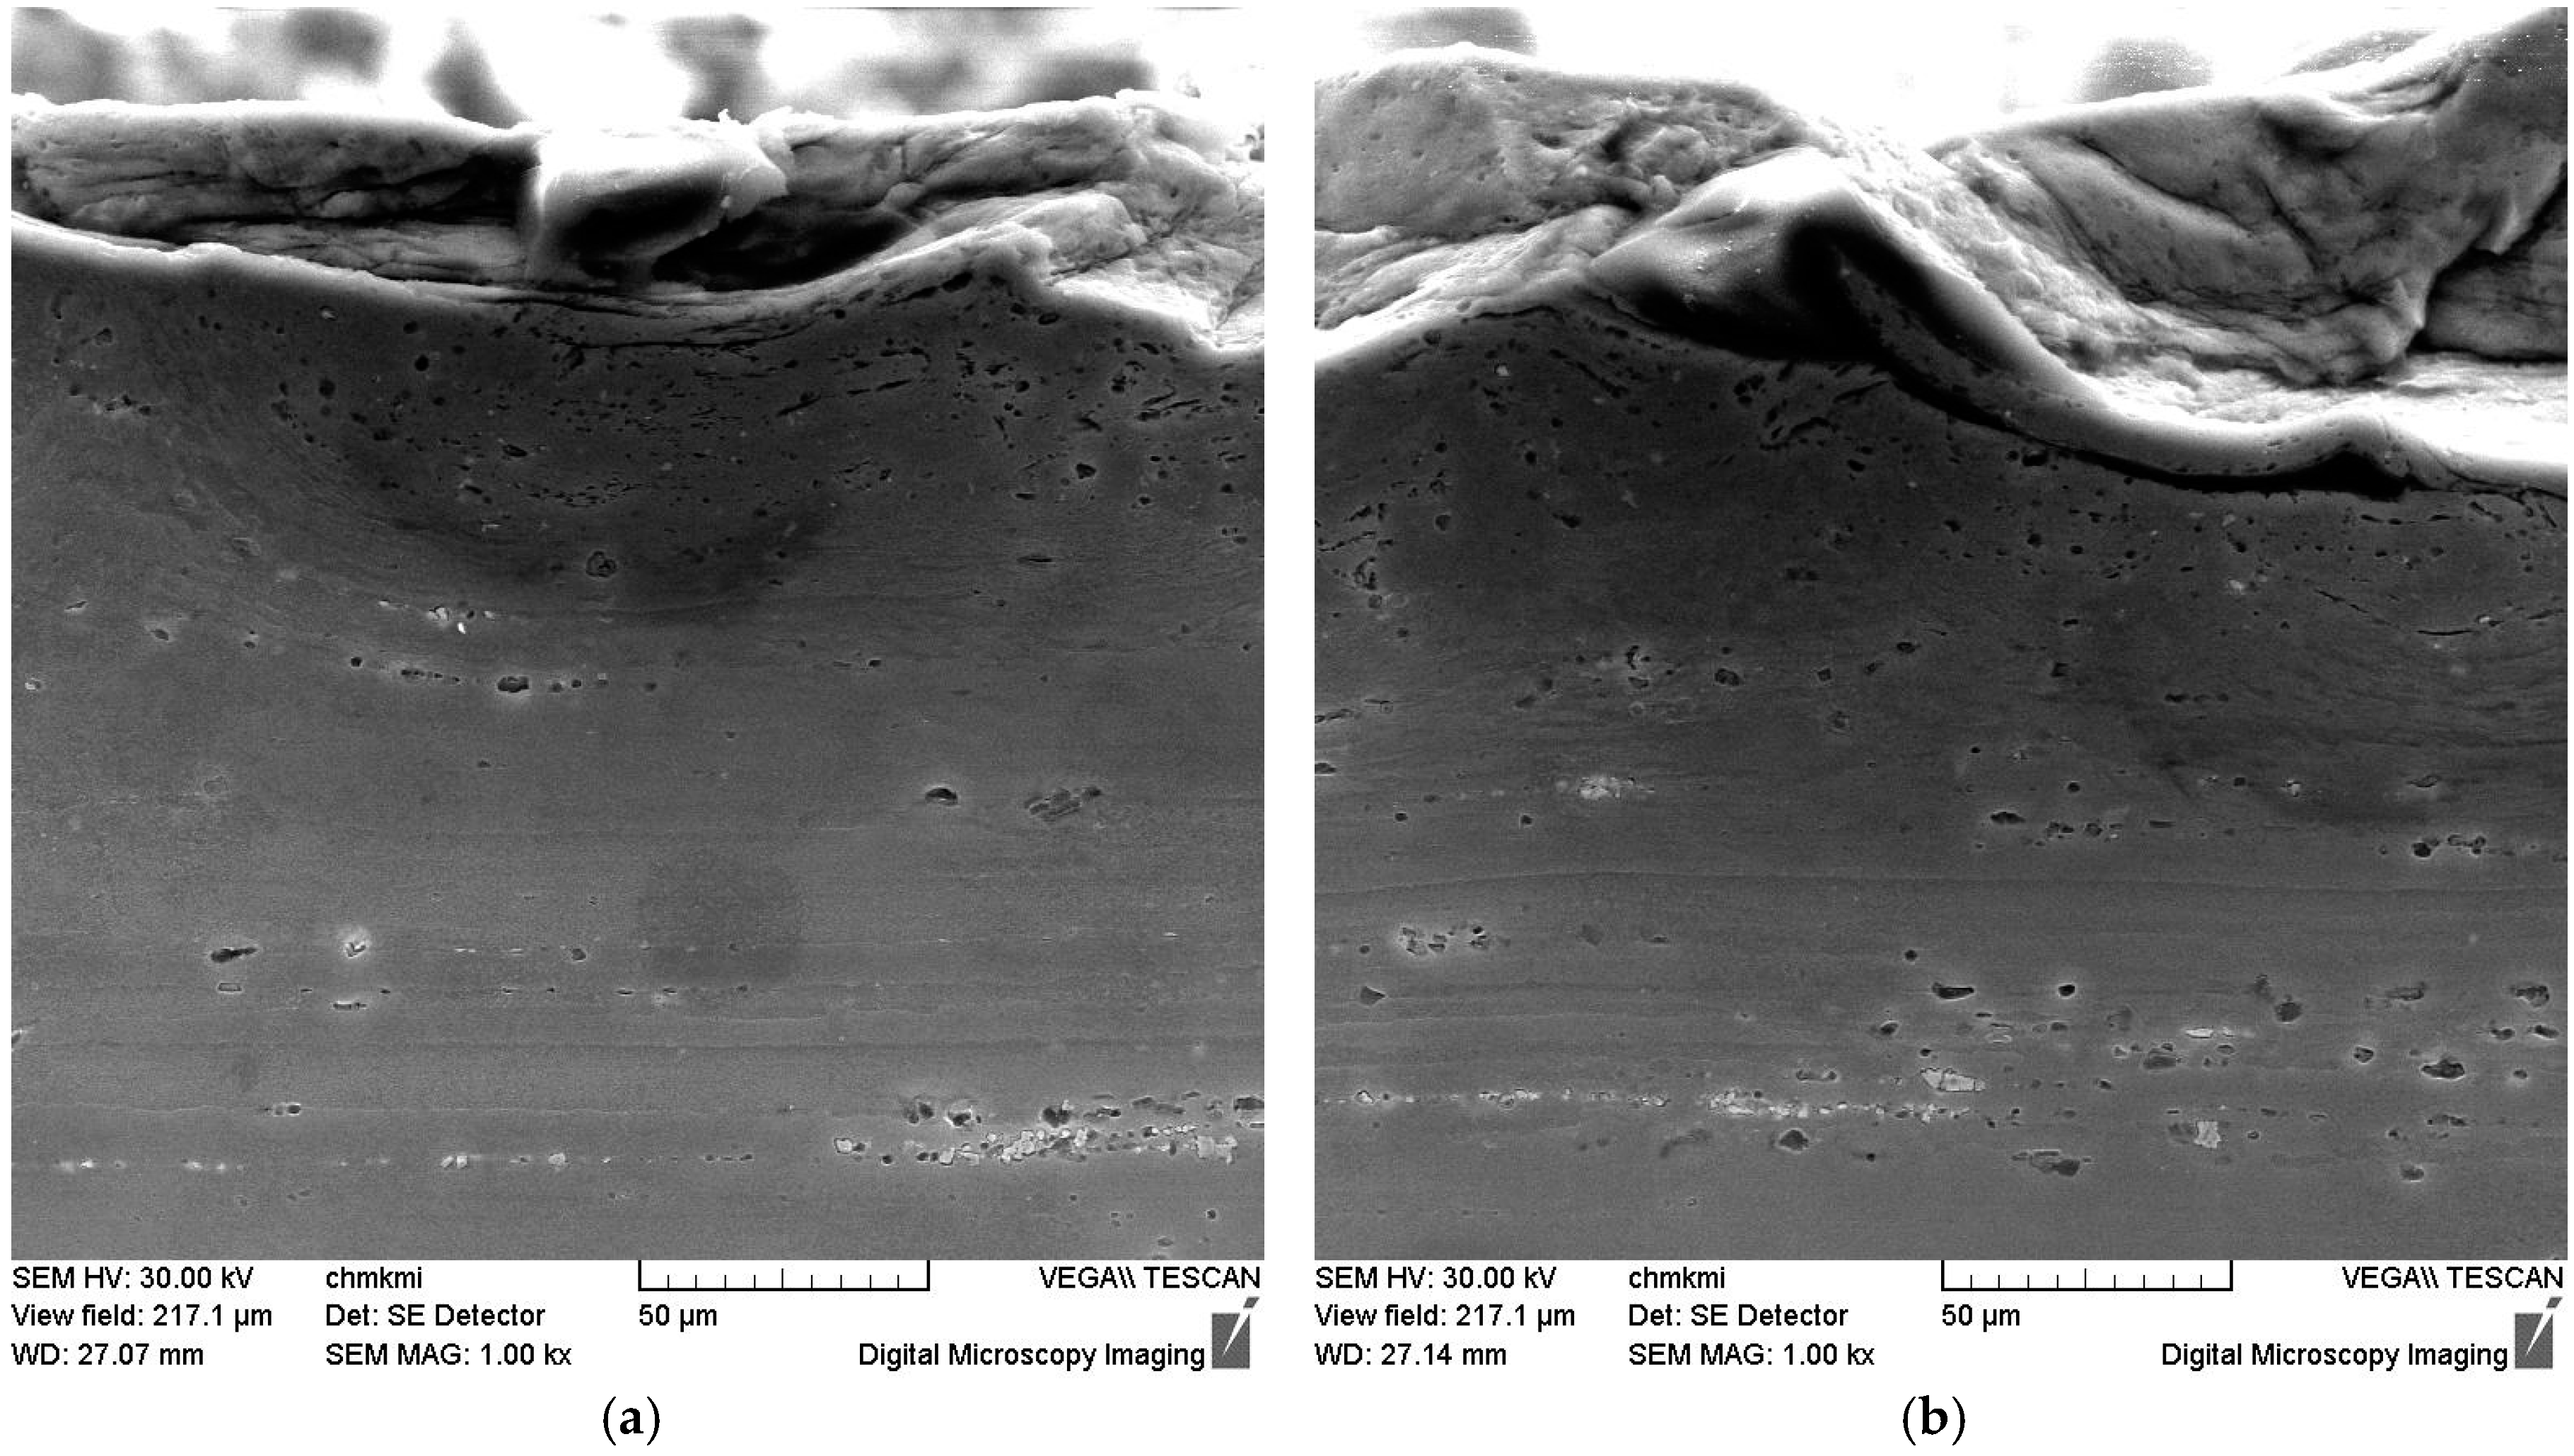
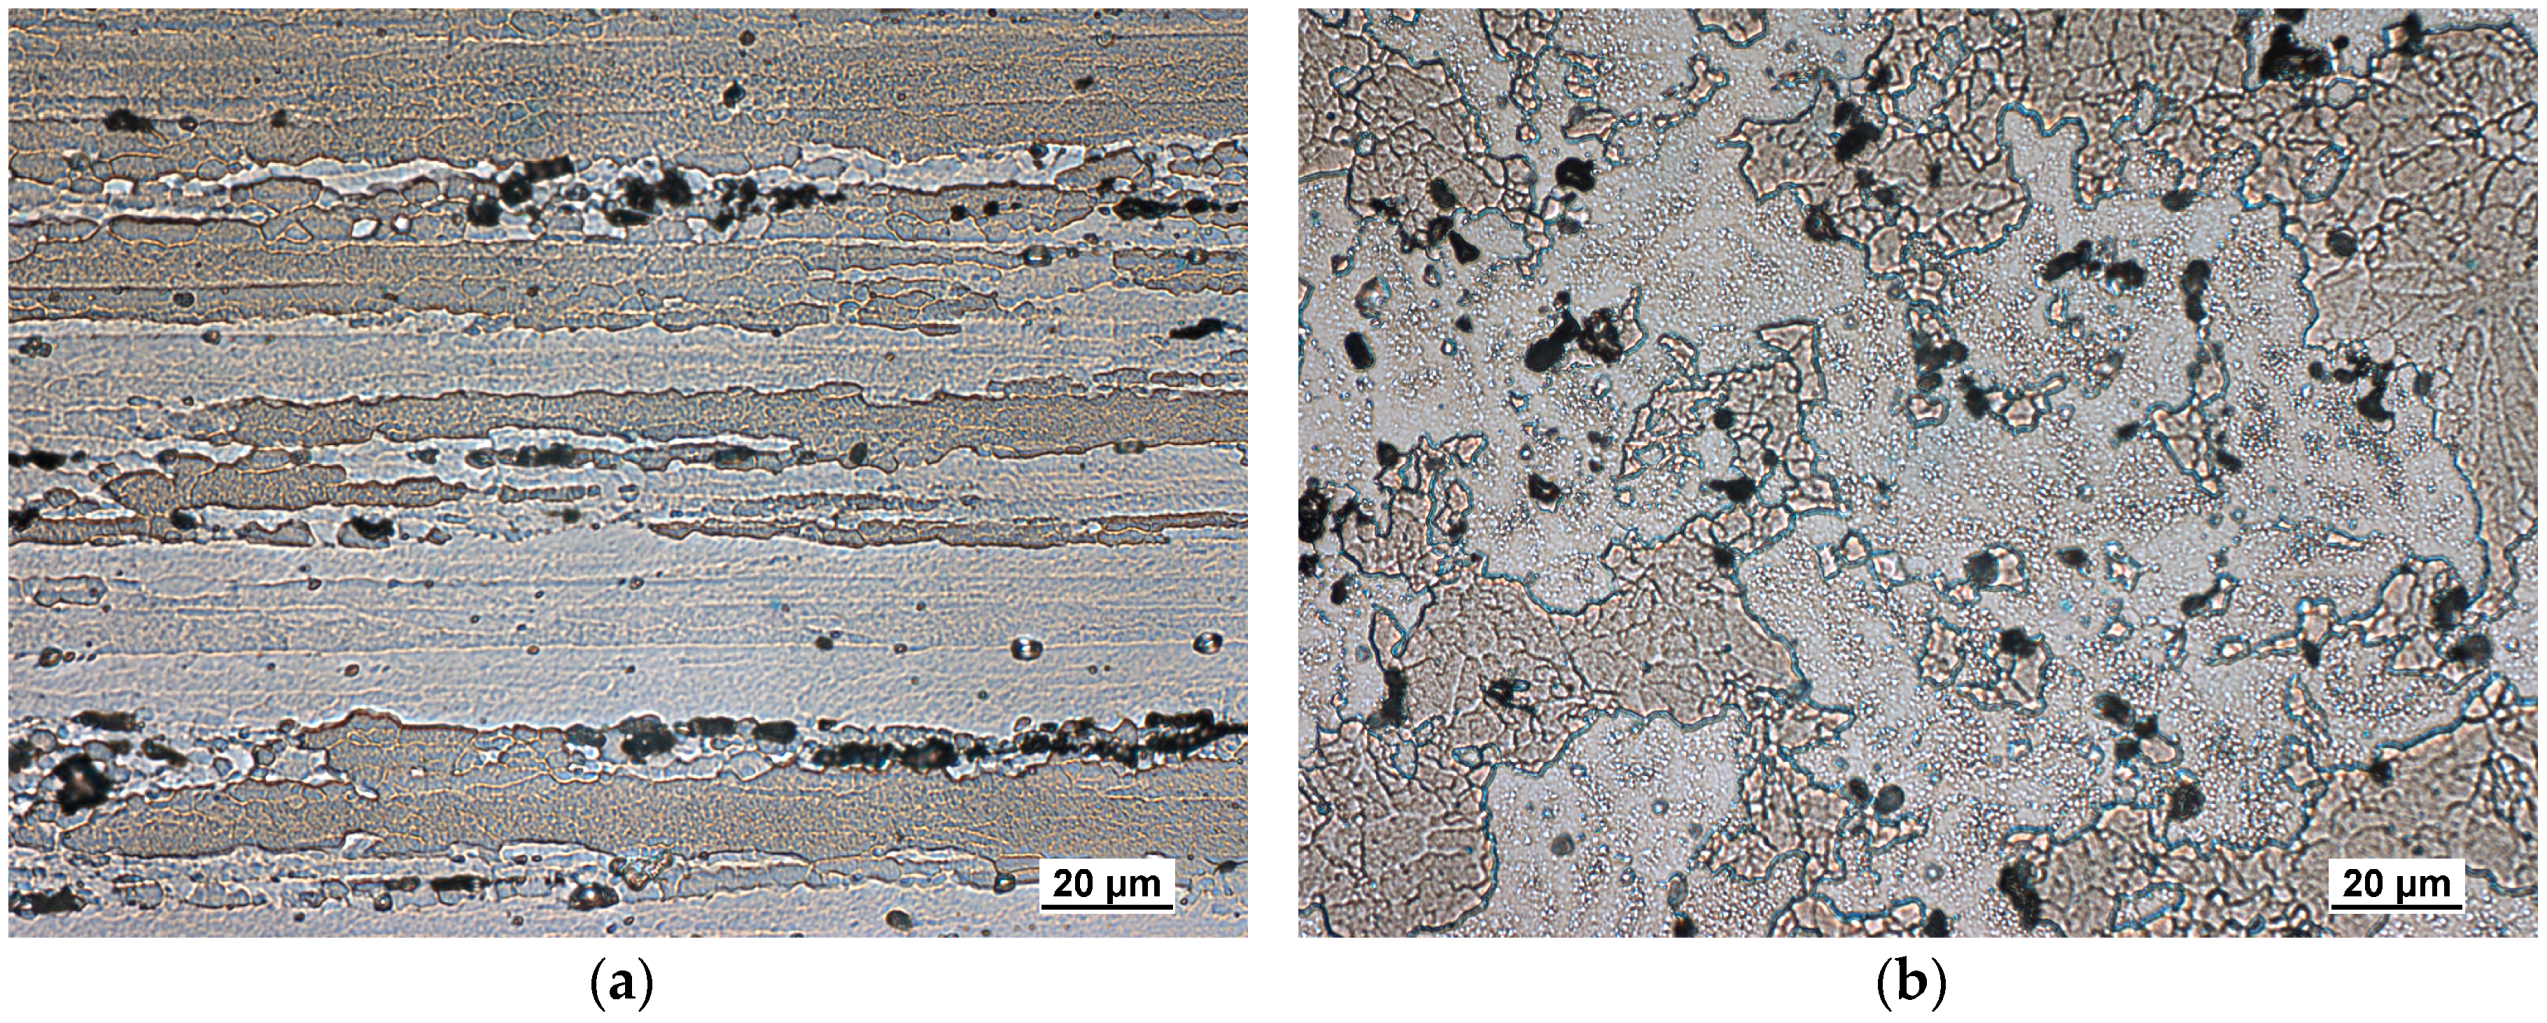
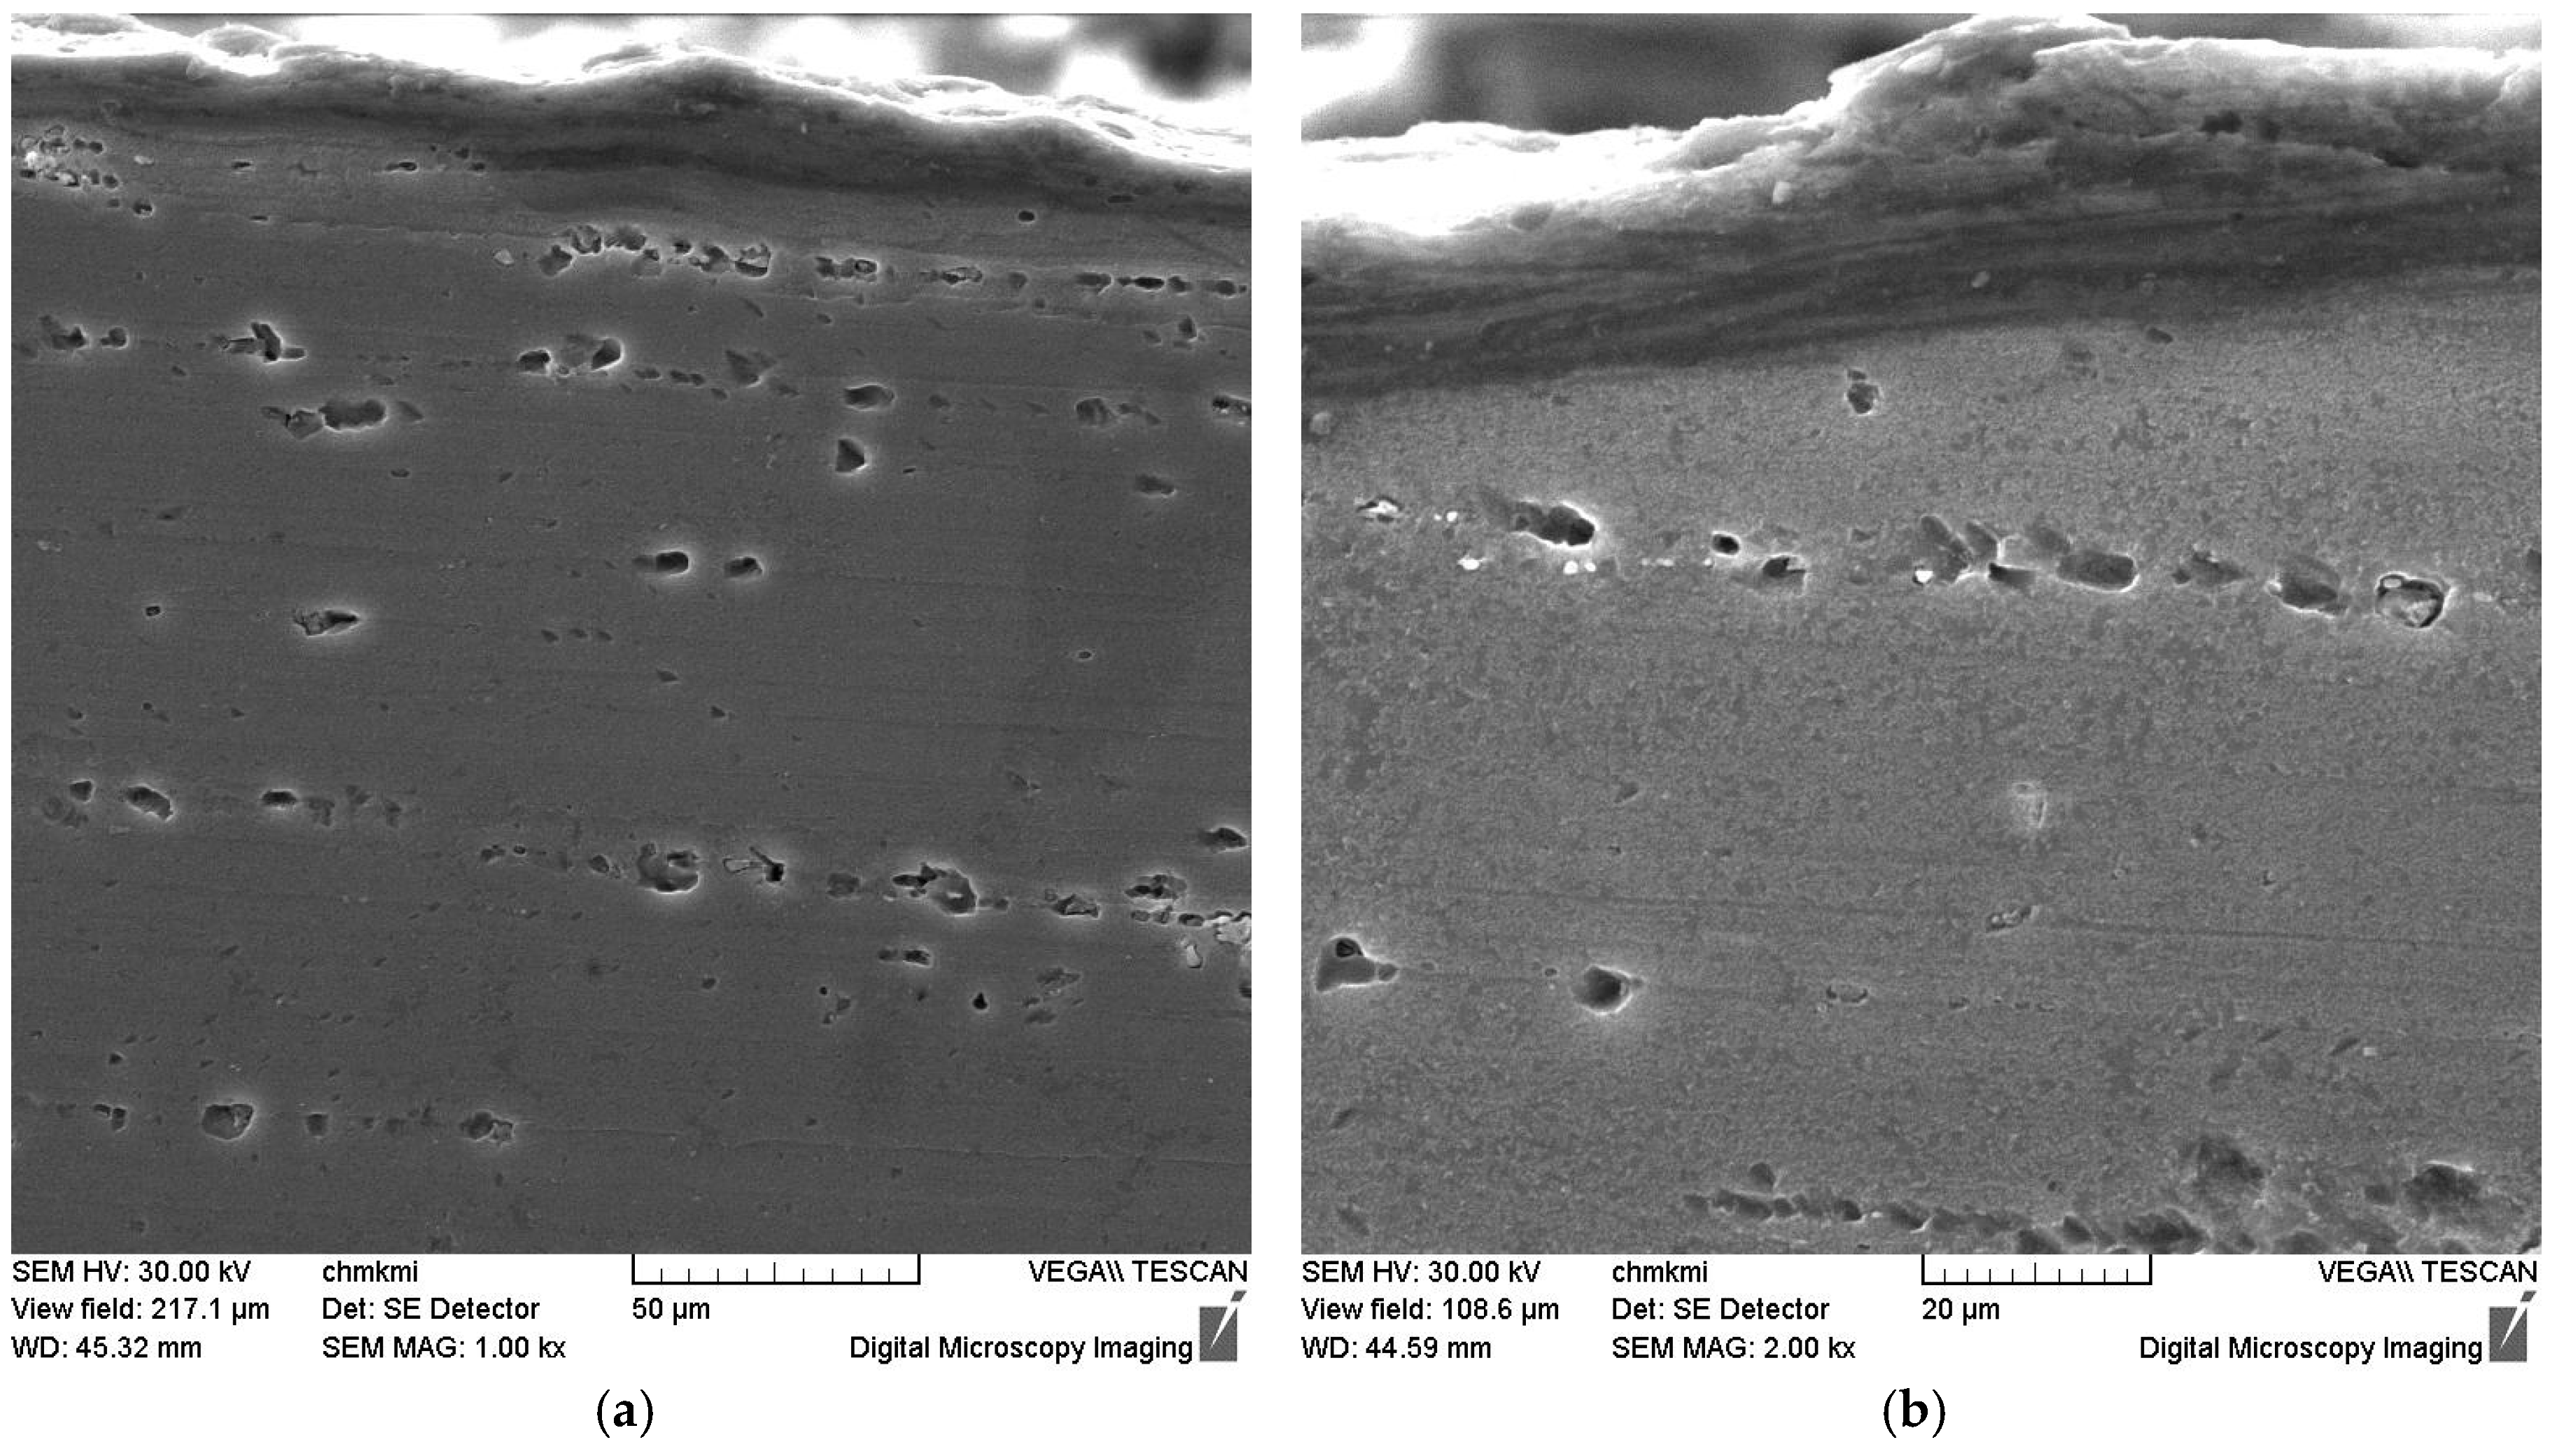
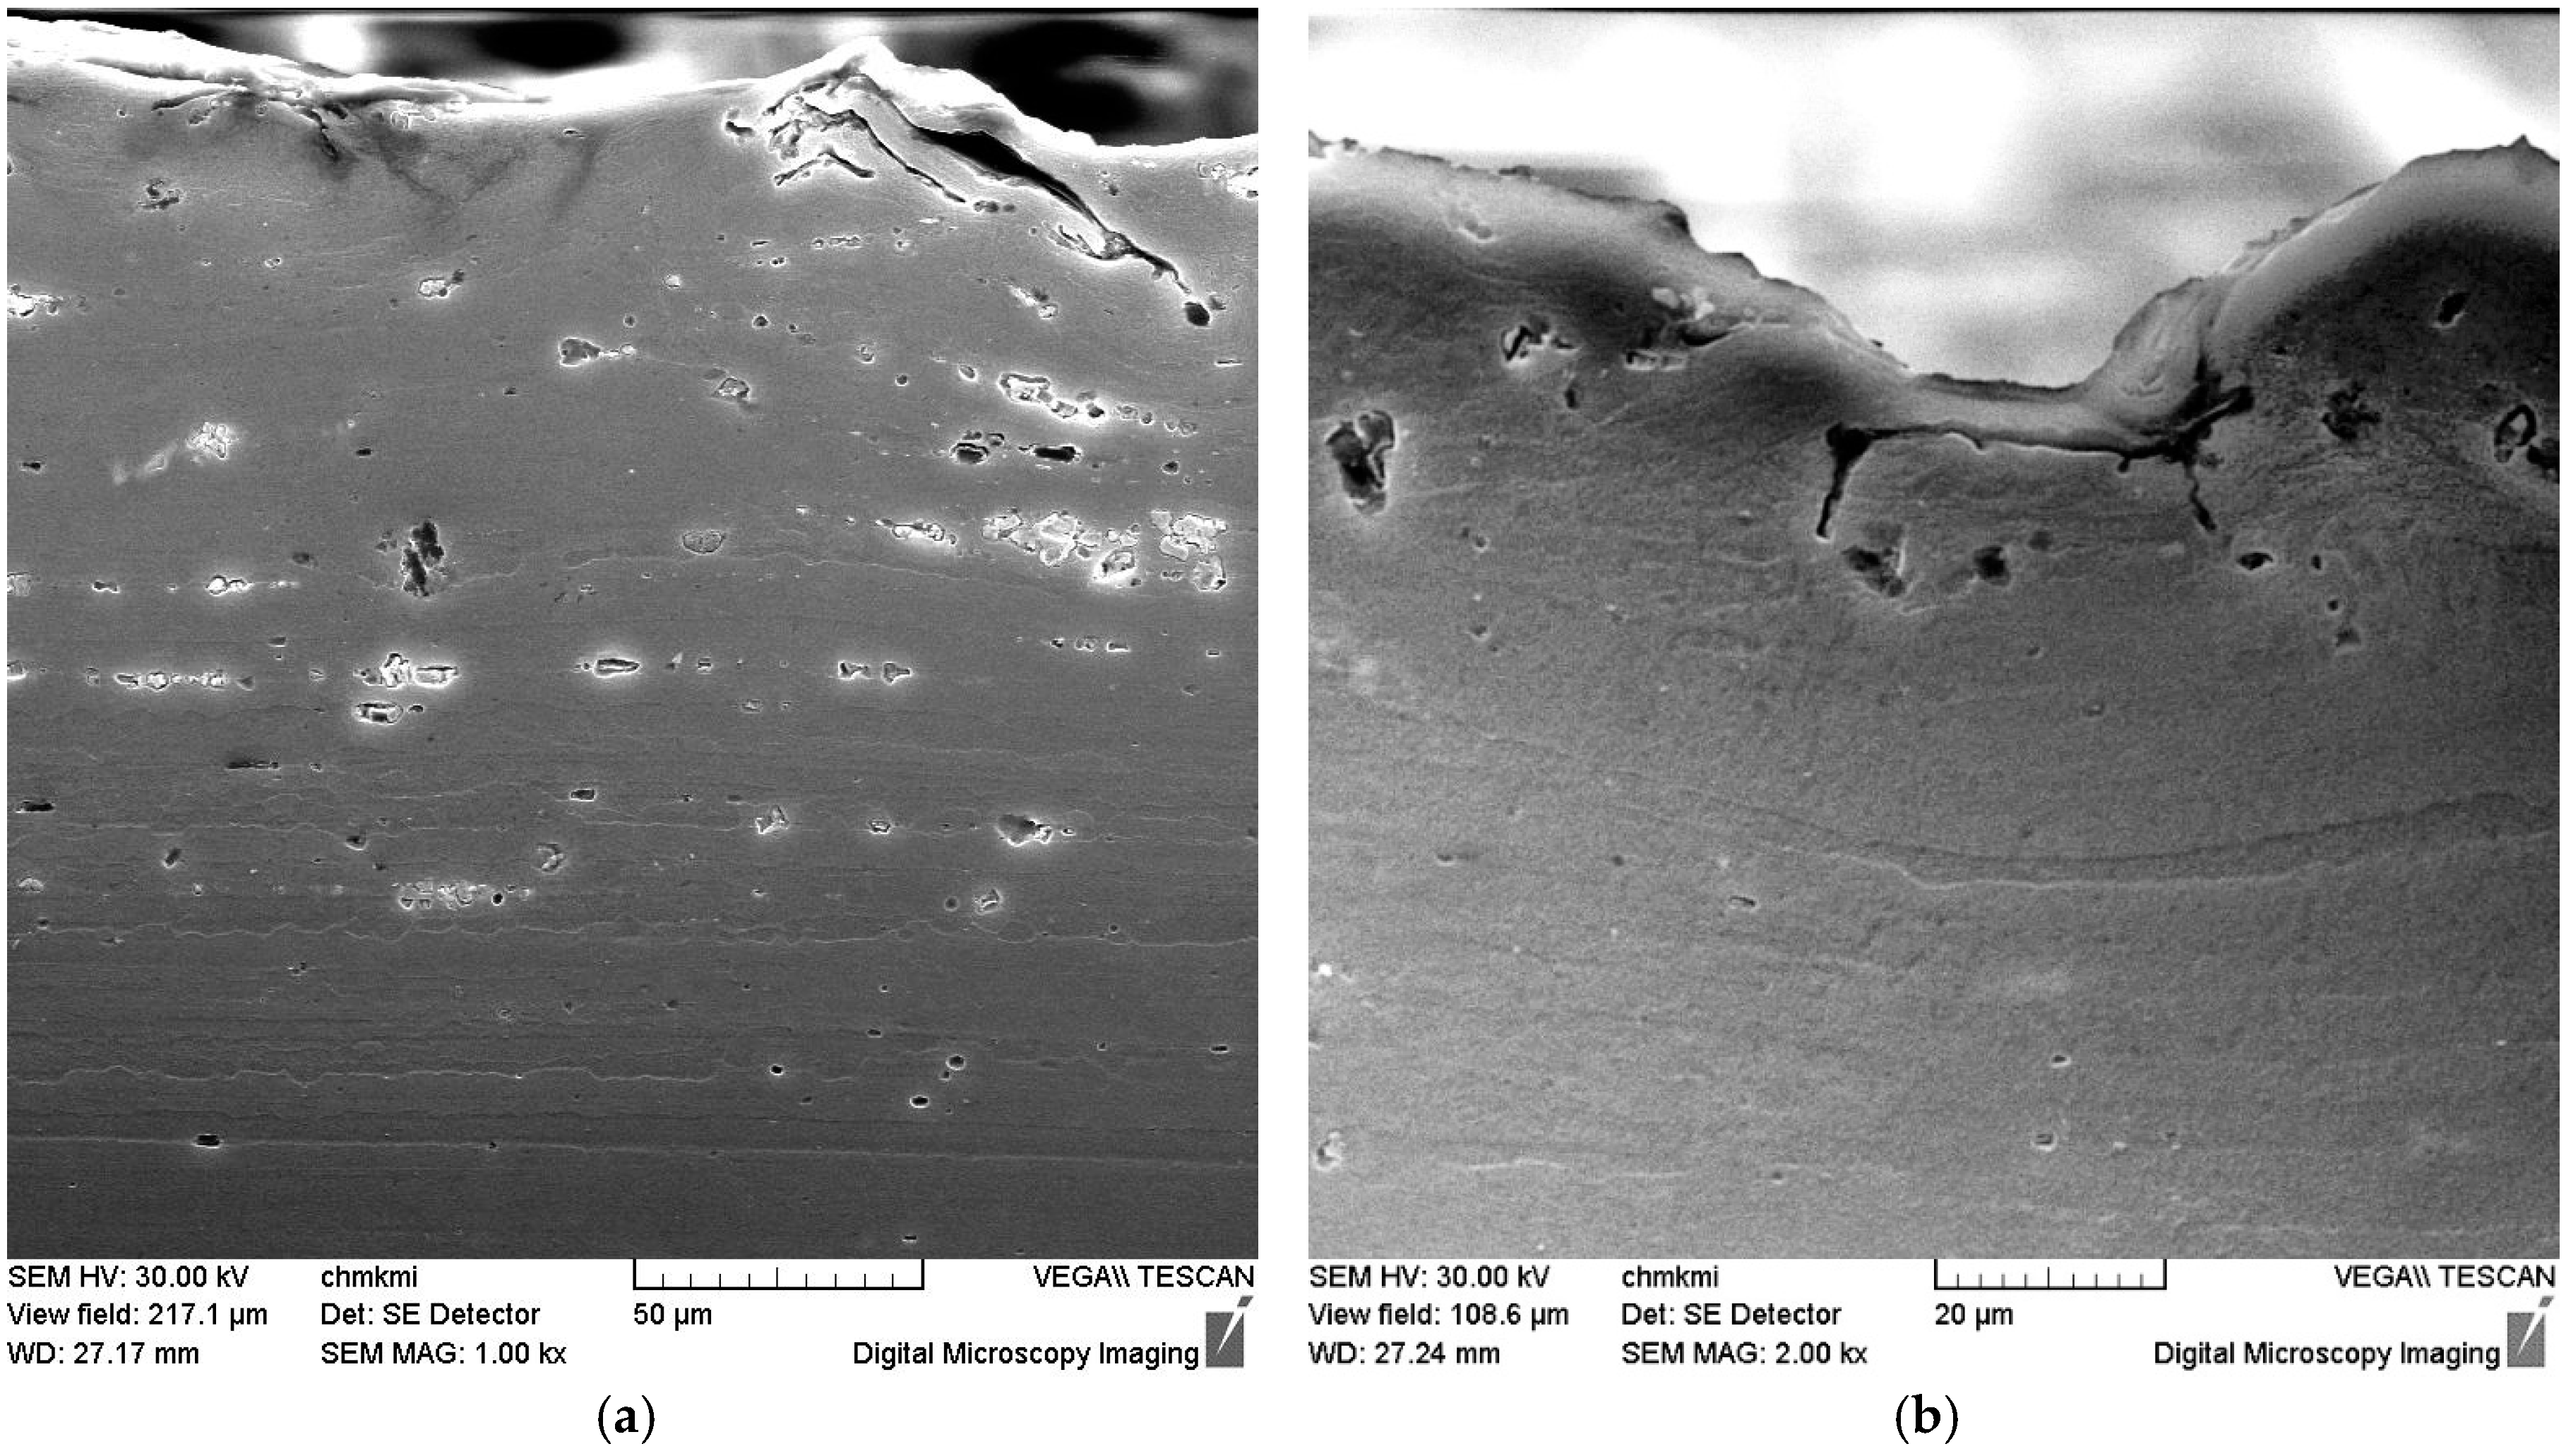
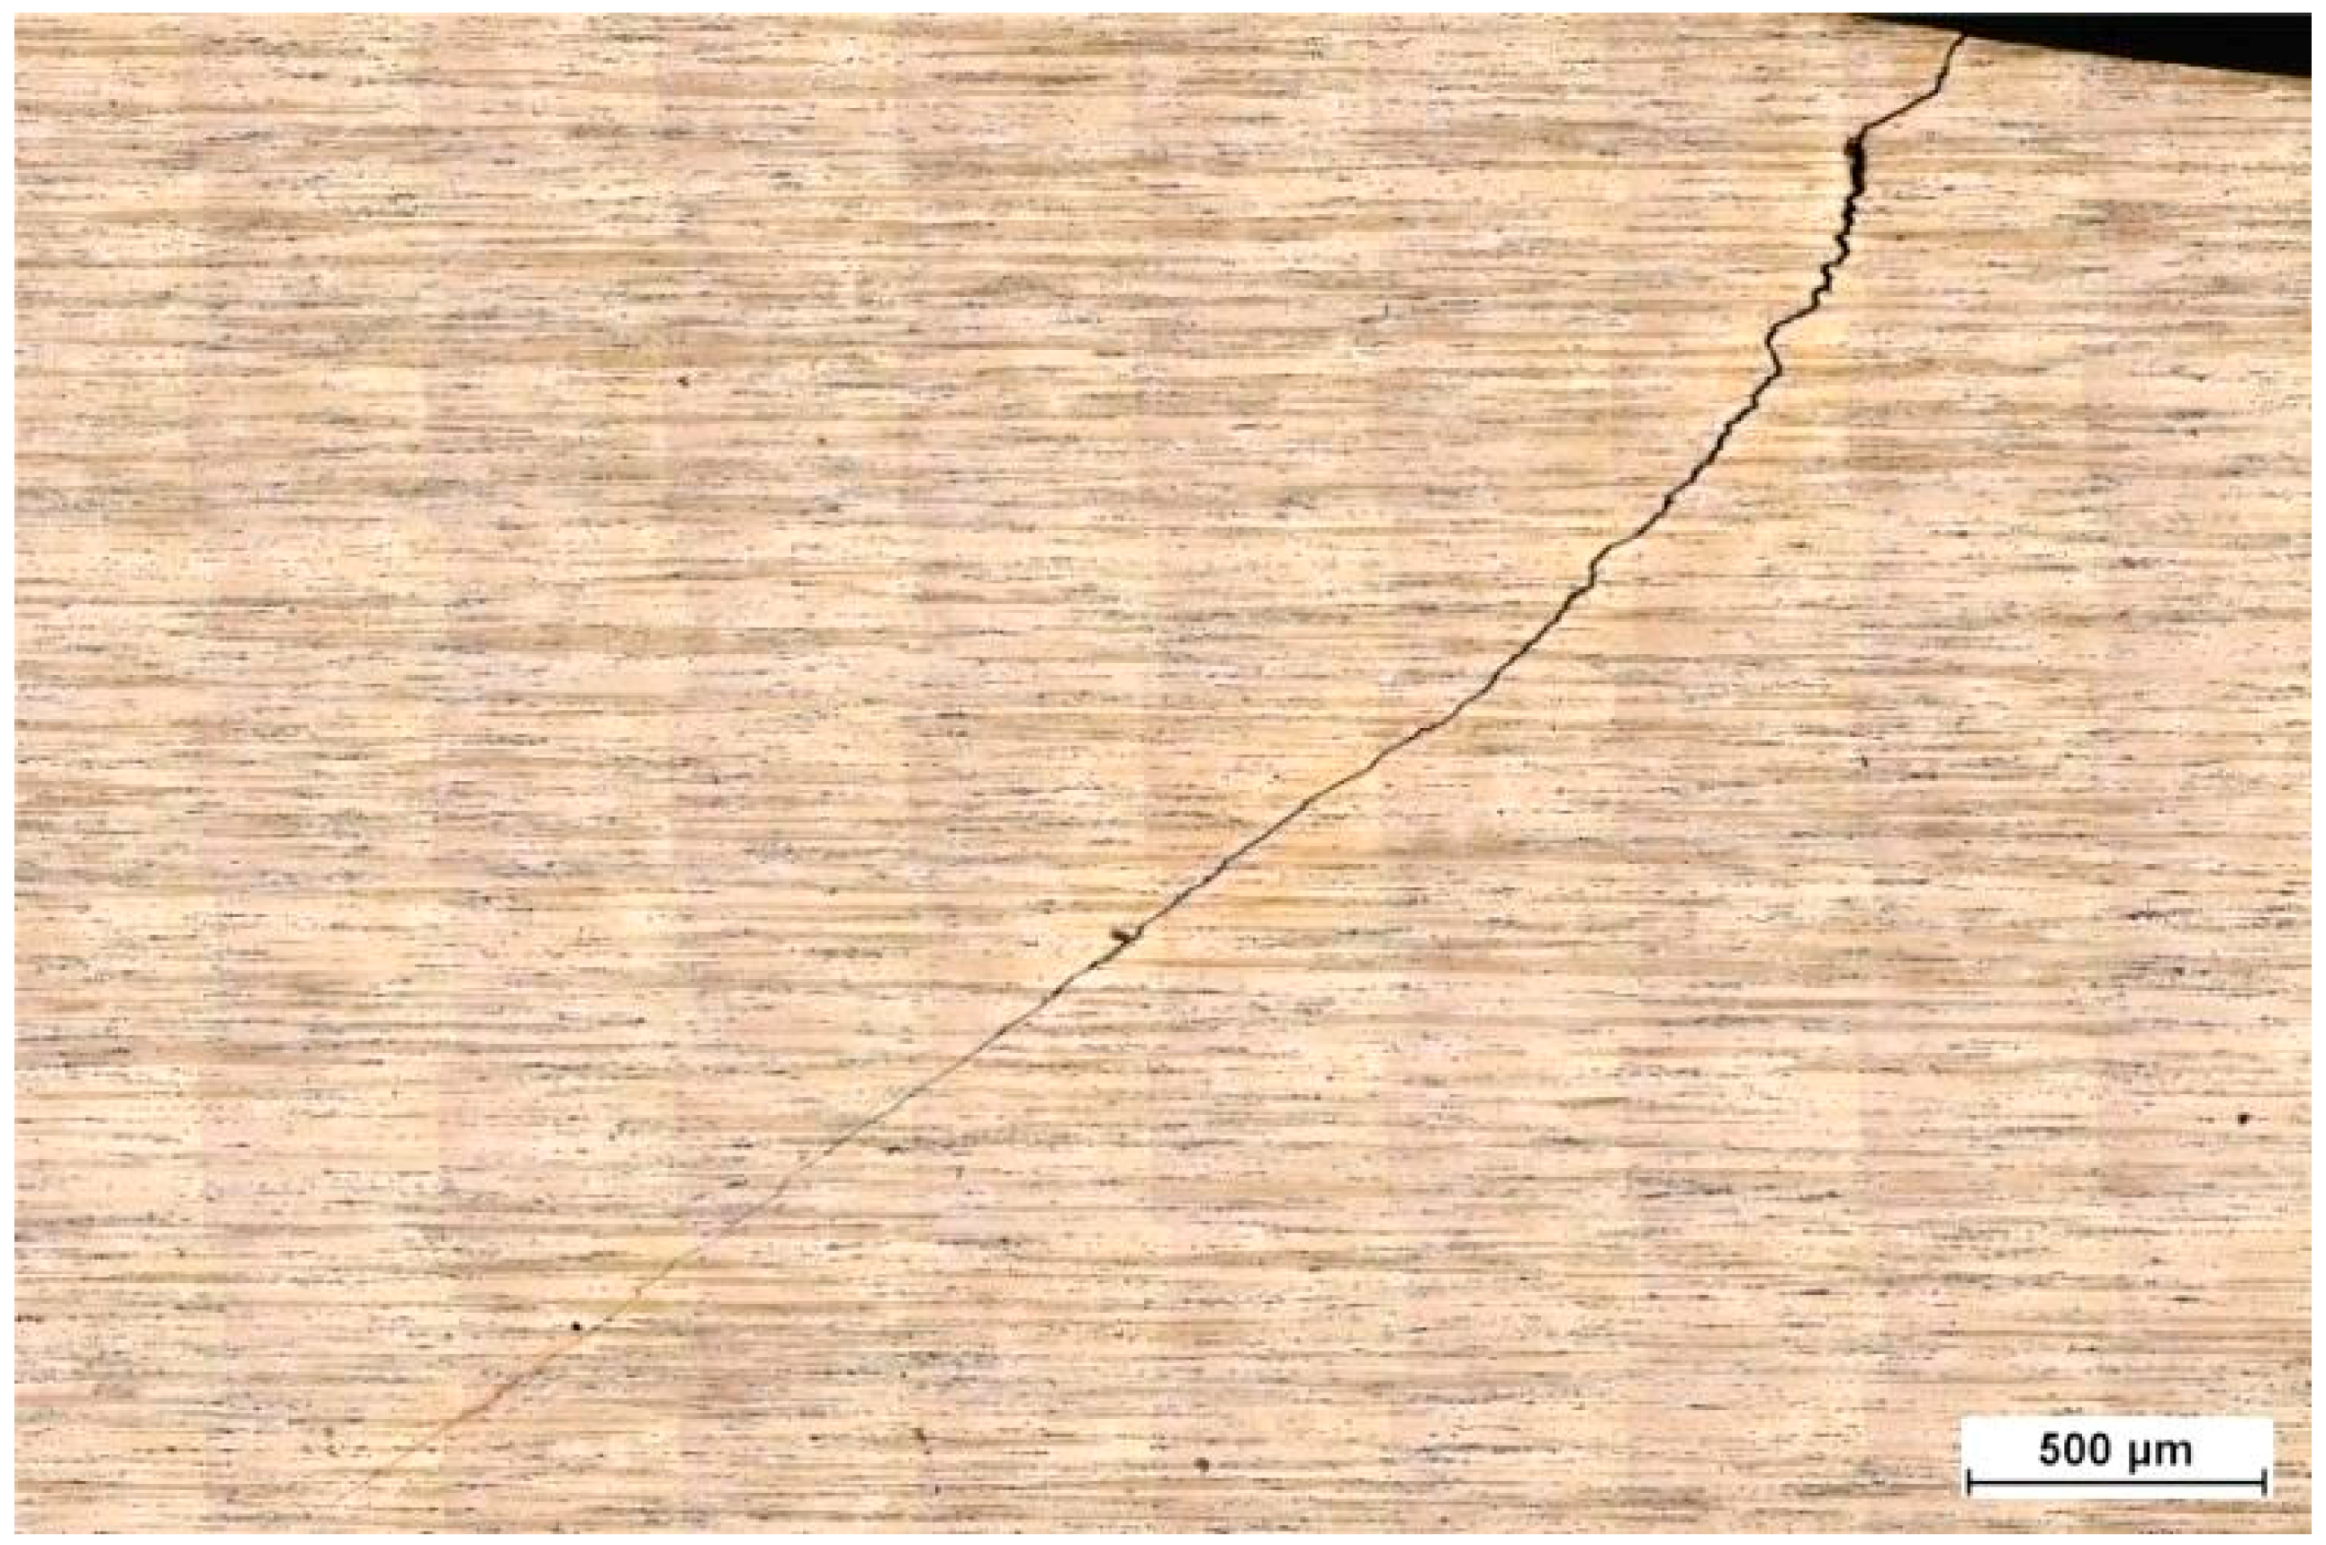
3.2. Surface Layer Characterization

To analyze the character of the surface layer and see the level of the plastic deformation, a longitudinal cut was made of one fractured specimen for each surface treatment (including polished specimen—NP), etched with the Fuss solution and analyzed by means of a scanning electron microscope (SEM). Note that the voids visible in the microstructure of Figure 4, Figure 5, Figure 6, Figure 7, Figure 8 and Figure 9 are etched intermetallic particles. The surface layer of the NP specimen (Figure 4) shows a very shallow deformed surface layer, which is a result of plastic deformation introduced during the machining of the specimen’s gauge length. Shot peening by 8.3 N intensity, with coverage of 100%, created a shallow but continuous and uniformly deformed surface layer with a thickness of approximately 30 µm (Figure 5). The surface layer after treatment with the 9.6 N intensity with coverage of 650% (Figure 6) again created a shallow and uniformly deformed surface layer which was very similar to the surface layer obtained after the previous shot peening treatment (Figure 5). Again, the visible depth of the affected surface layer was approximately 30 µm. The surface after the first two treatments was without the presence of any defects; however, an increased surface roughness was notable compared to the ground and polished specimen. Increasing the peening intensity to 6.9 A with coverage of 100% (Figure 7) and 14.4 A with coverage of 100% (Figure 8) respectively, increased the affected surface layer depth to approximately 100 µm; however, the severe plastic deformation caused creation of folds and micro cracks. Treatment with the 14.9 A intensity and coverage of 650% (Figure 9) caused a creation of a deformed surface layer almost twice as thick as the previous treatment and reaches almost 200 µm. It also caused a total devastation of the surface and layers of the material started to separate. Summarization of the depth of the affected surface layers by all types of surface finishing is provided in Table 3.

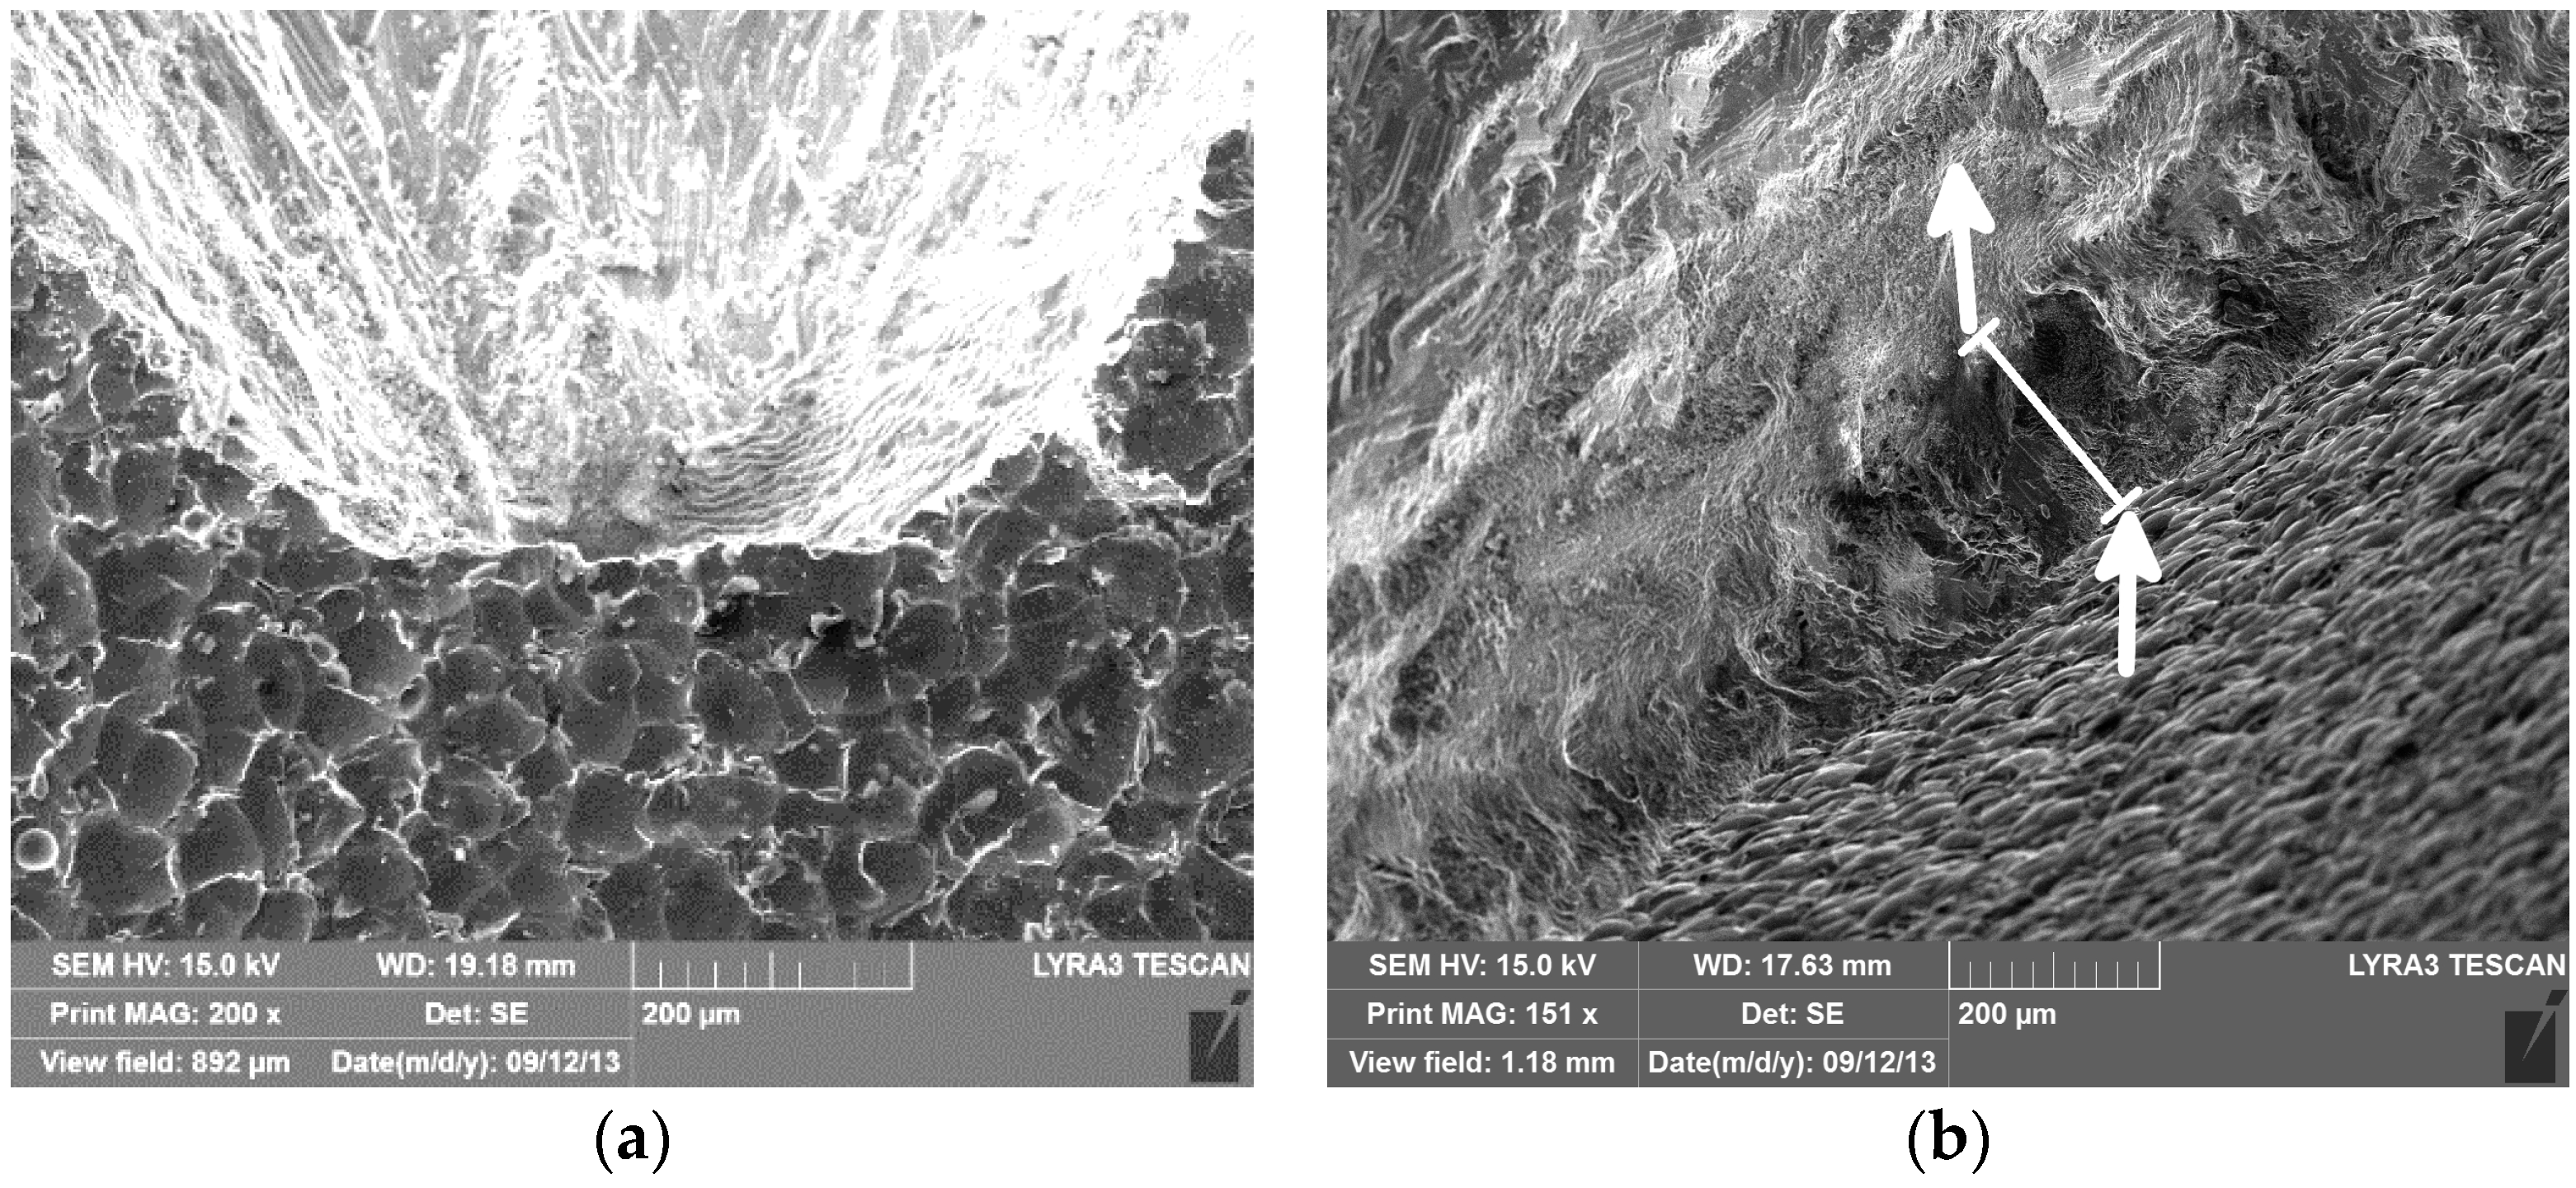
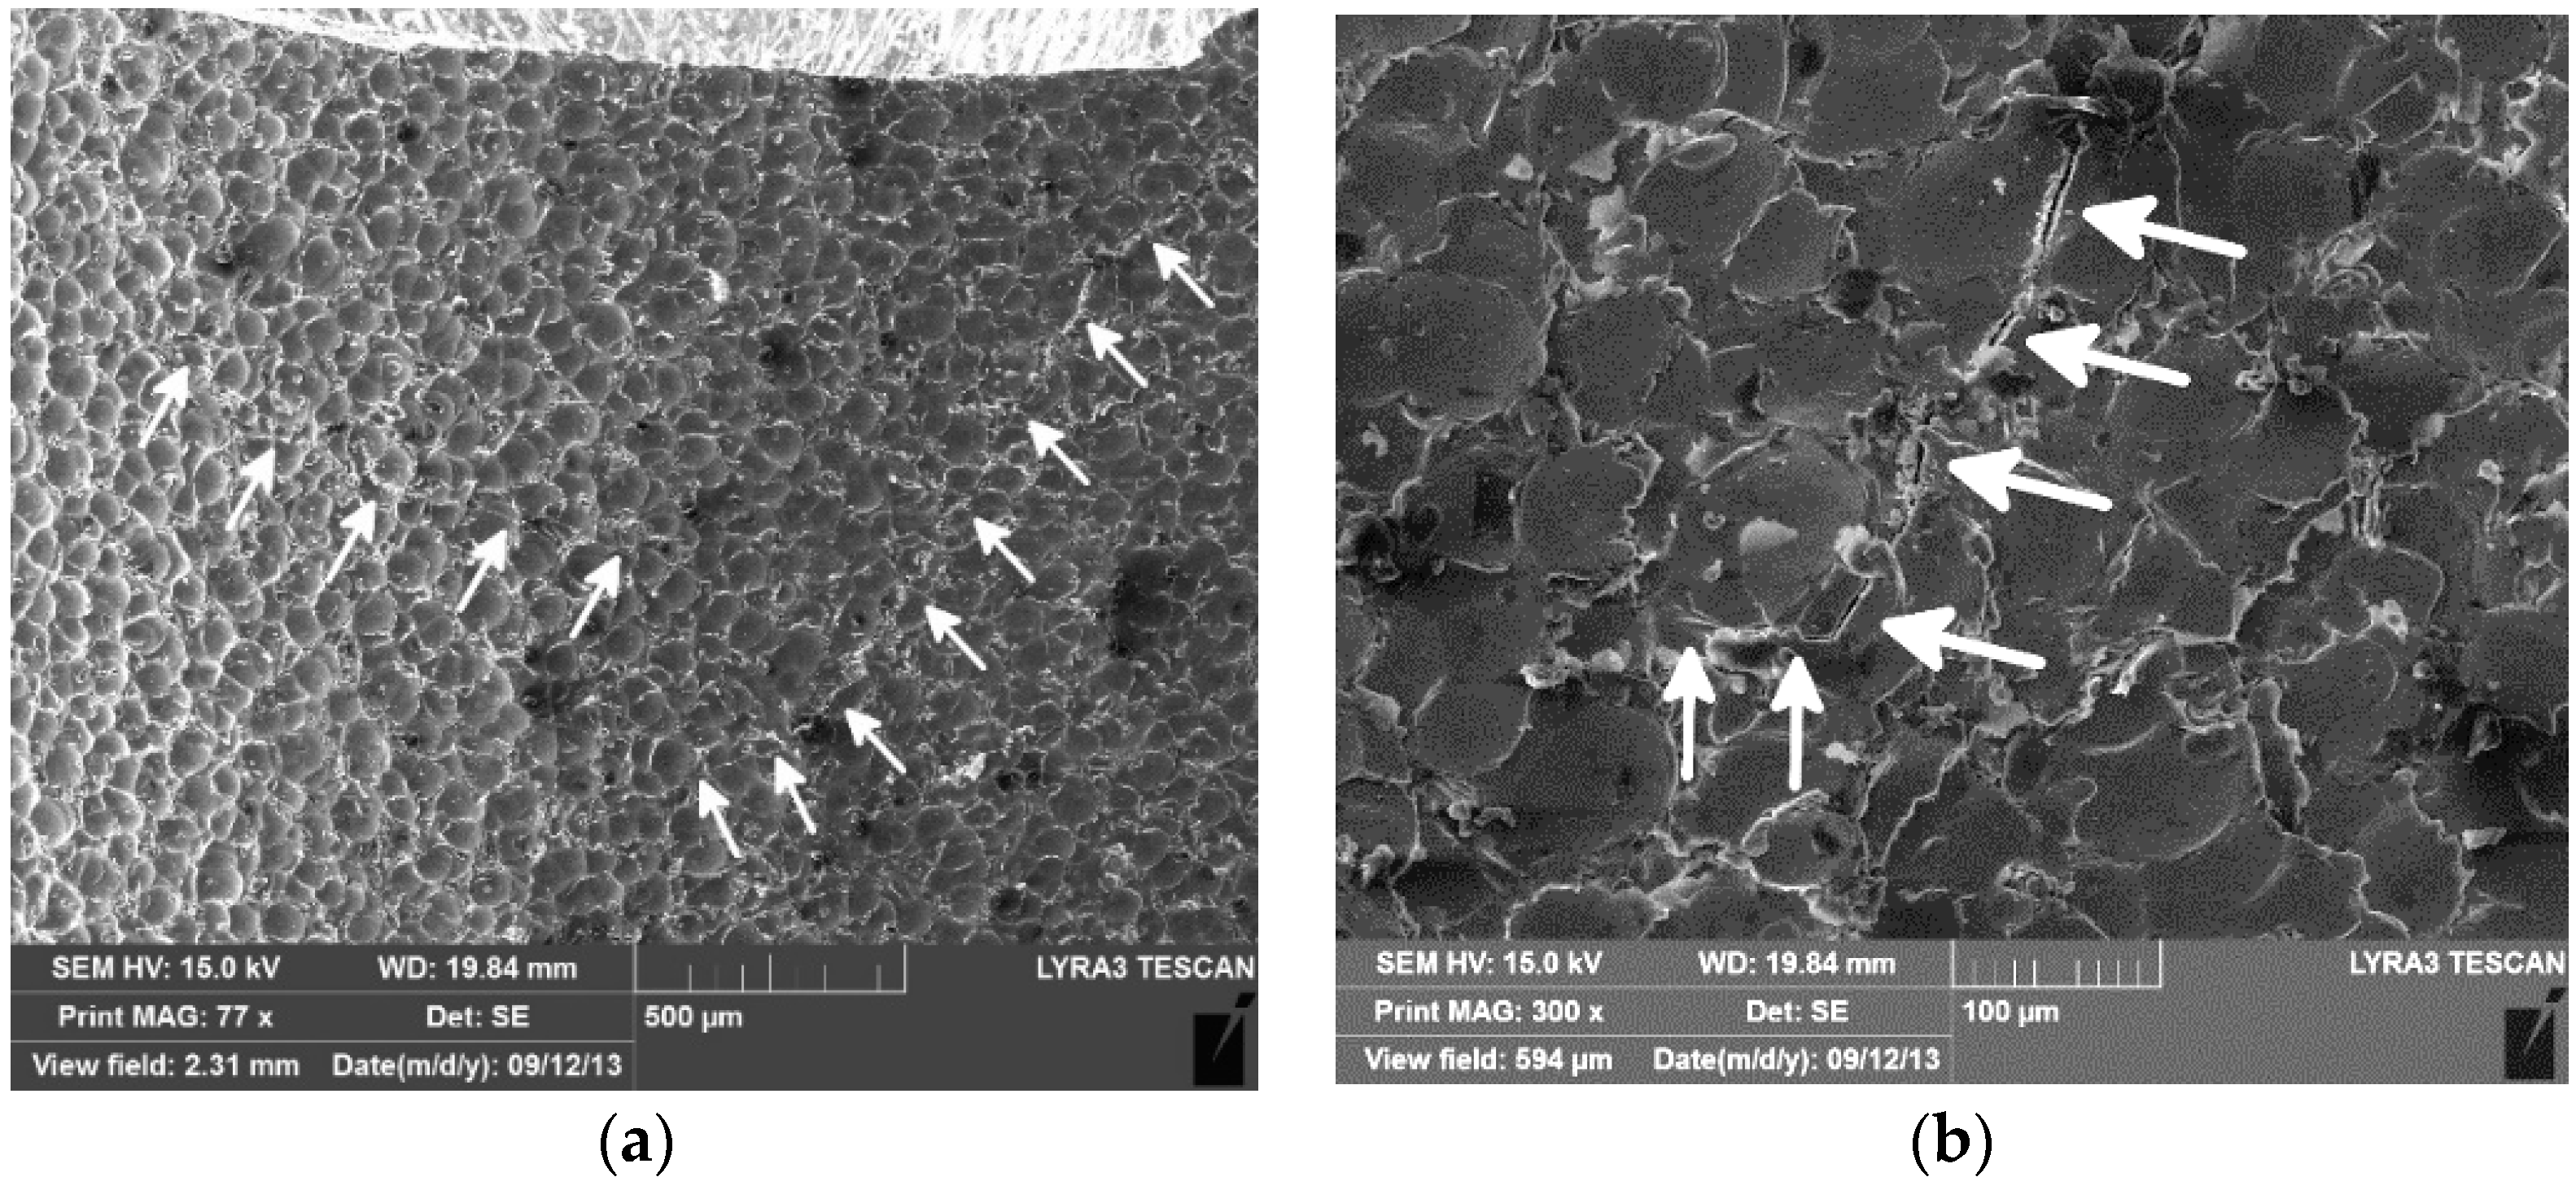
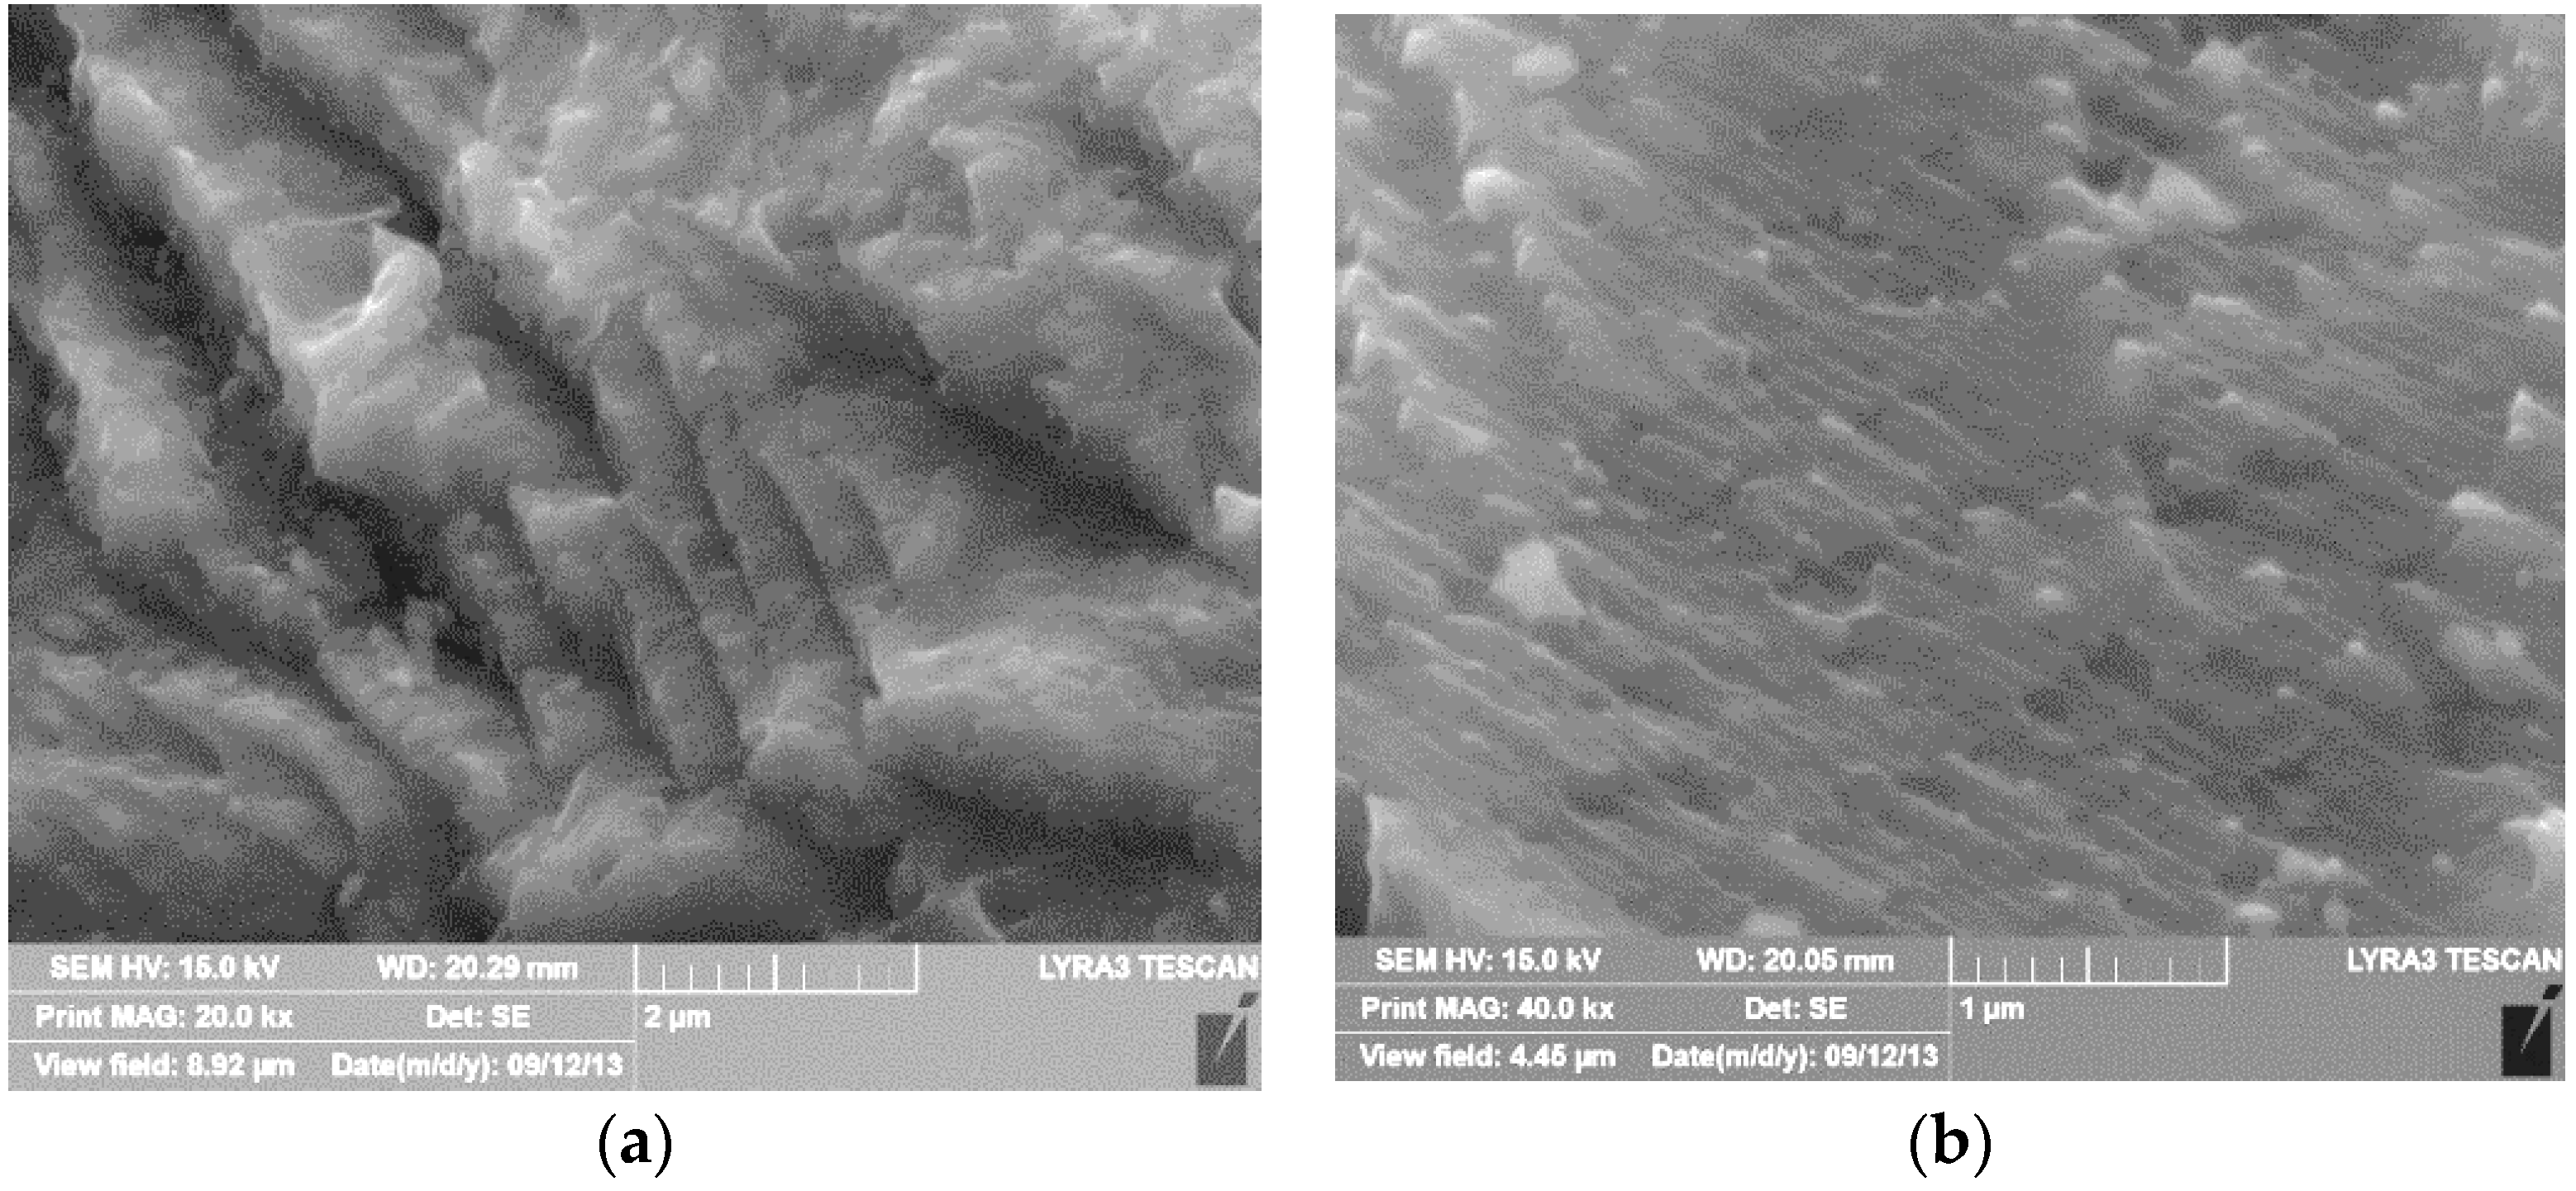
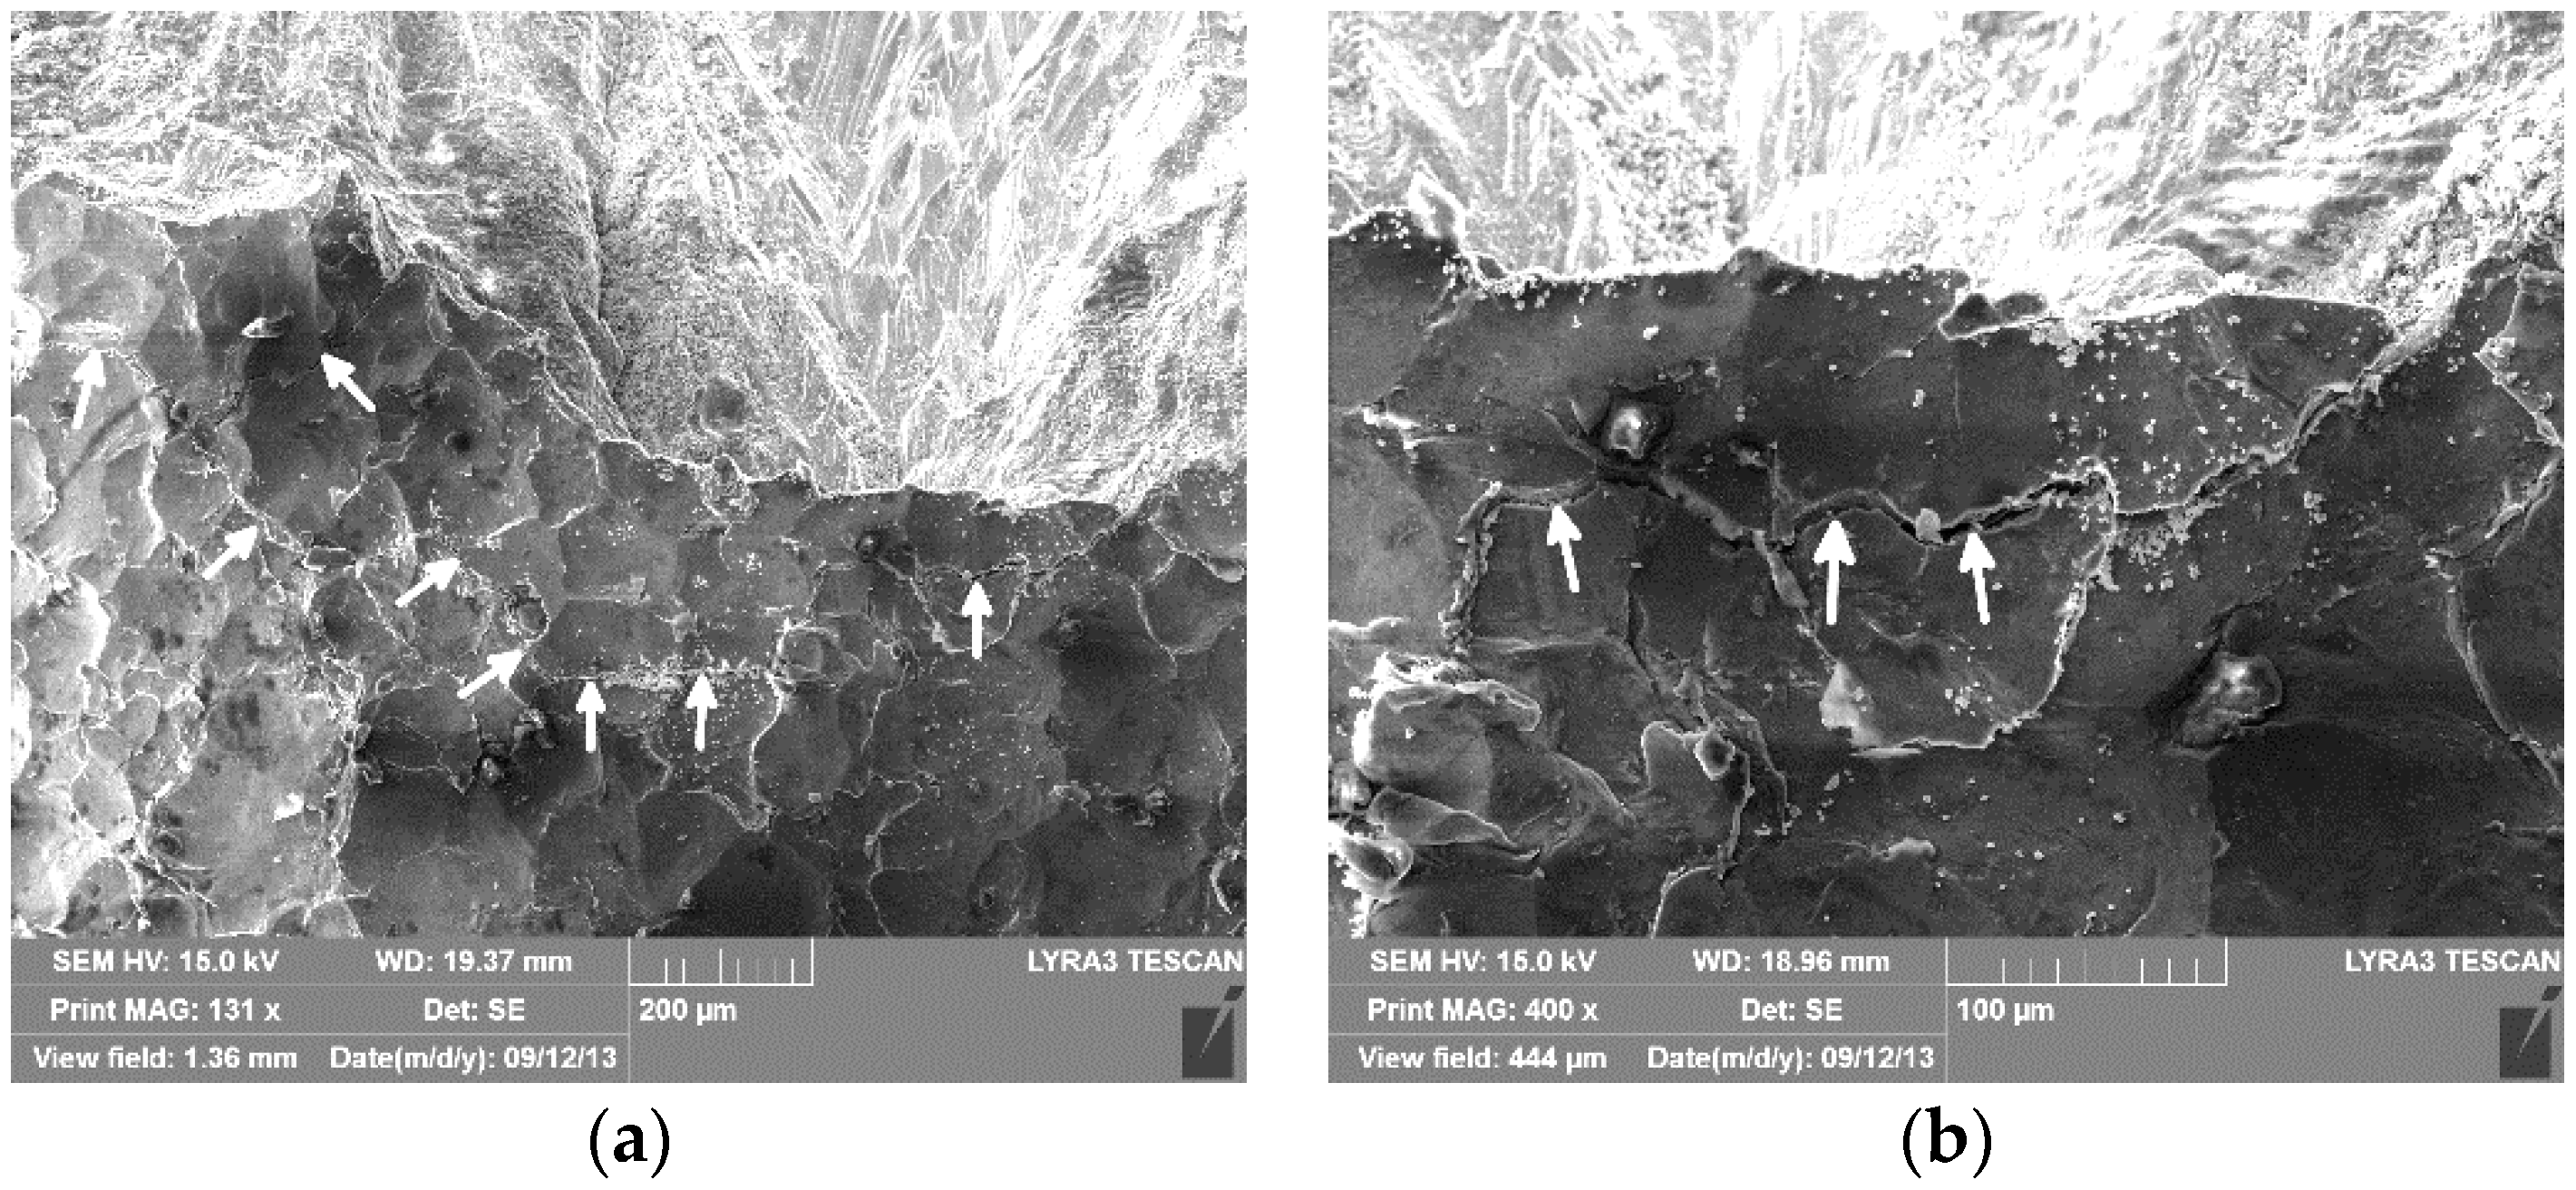
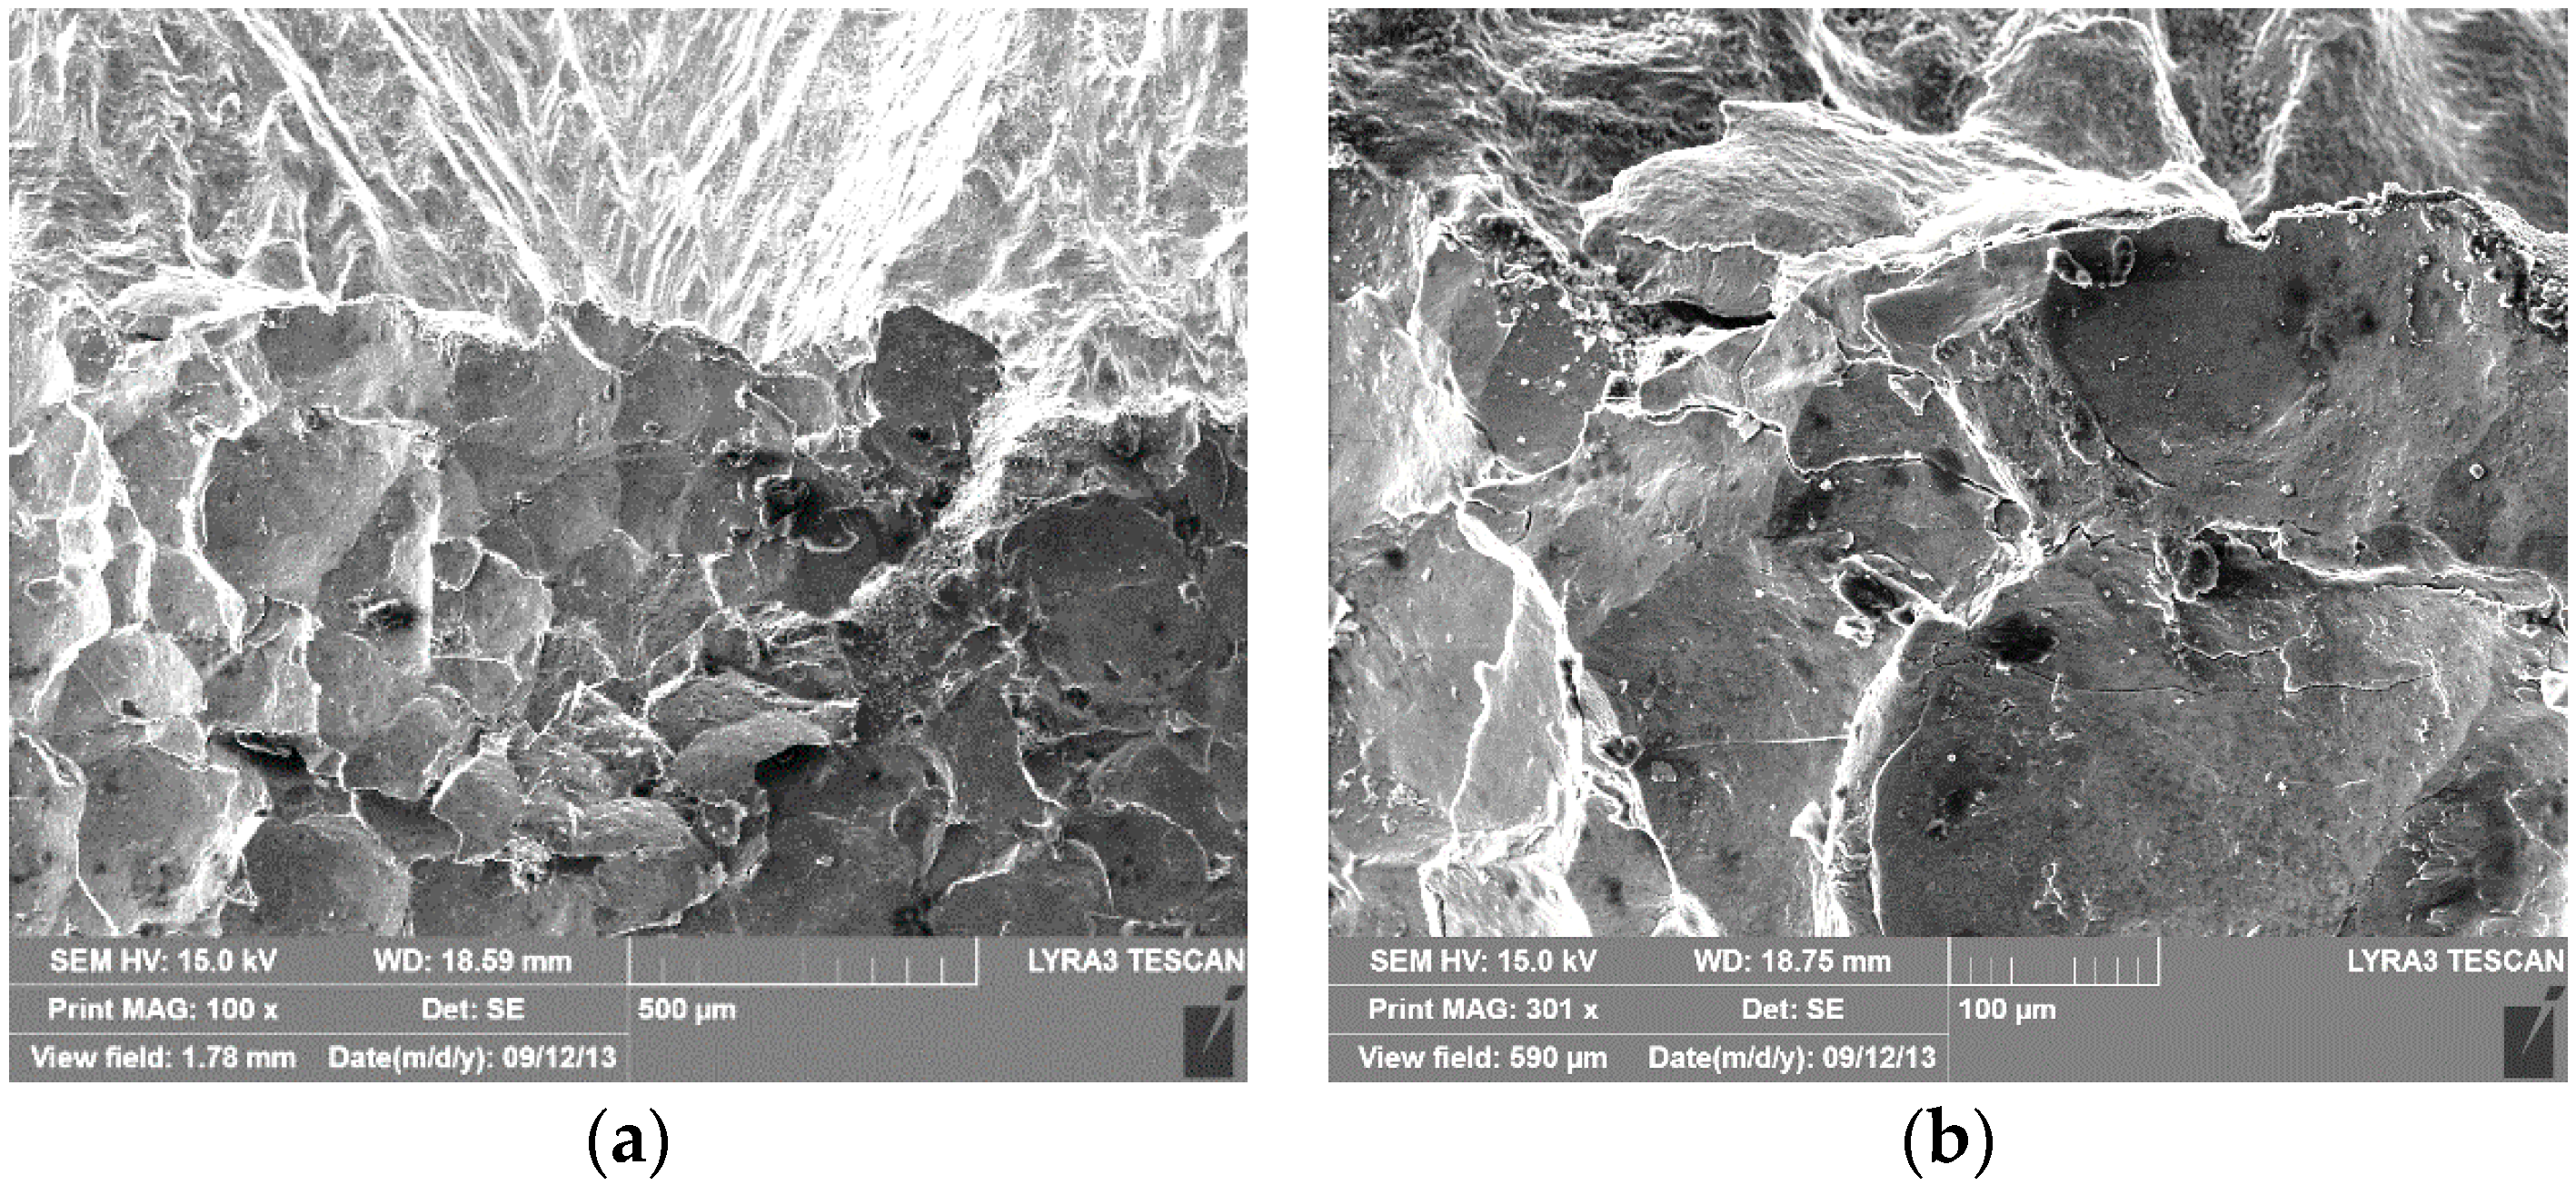
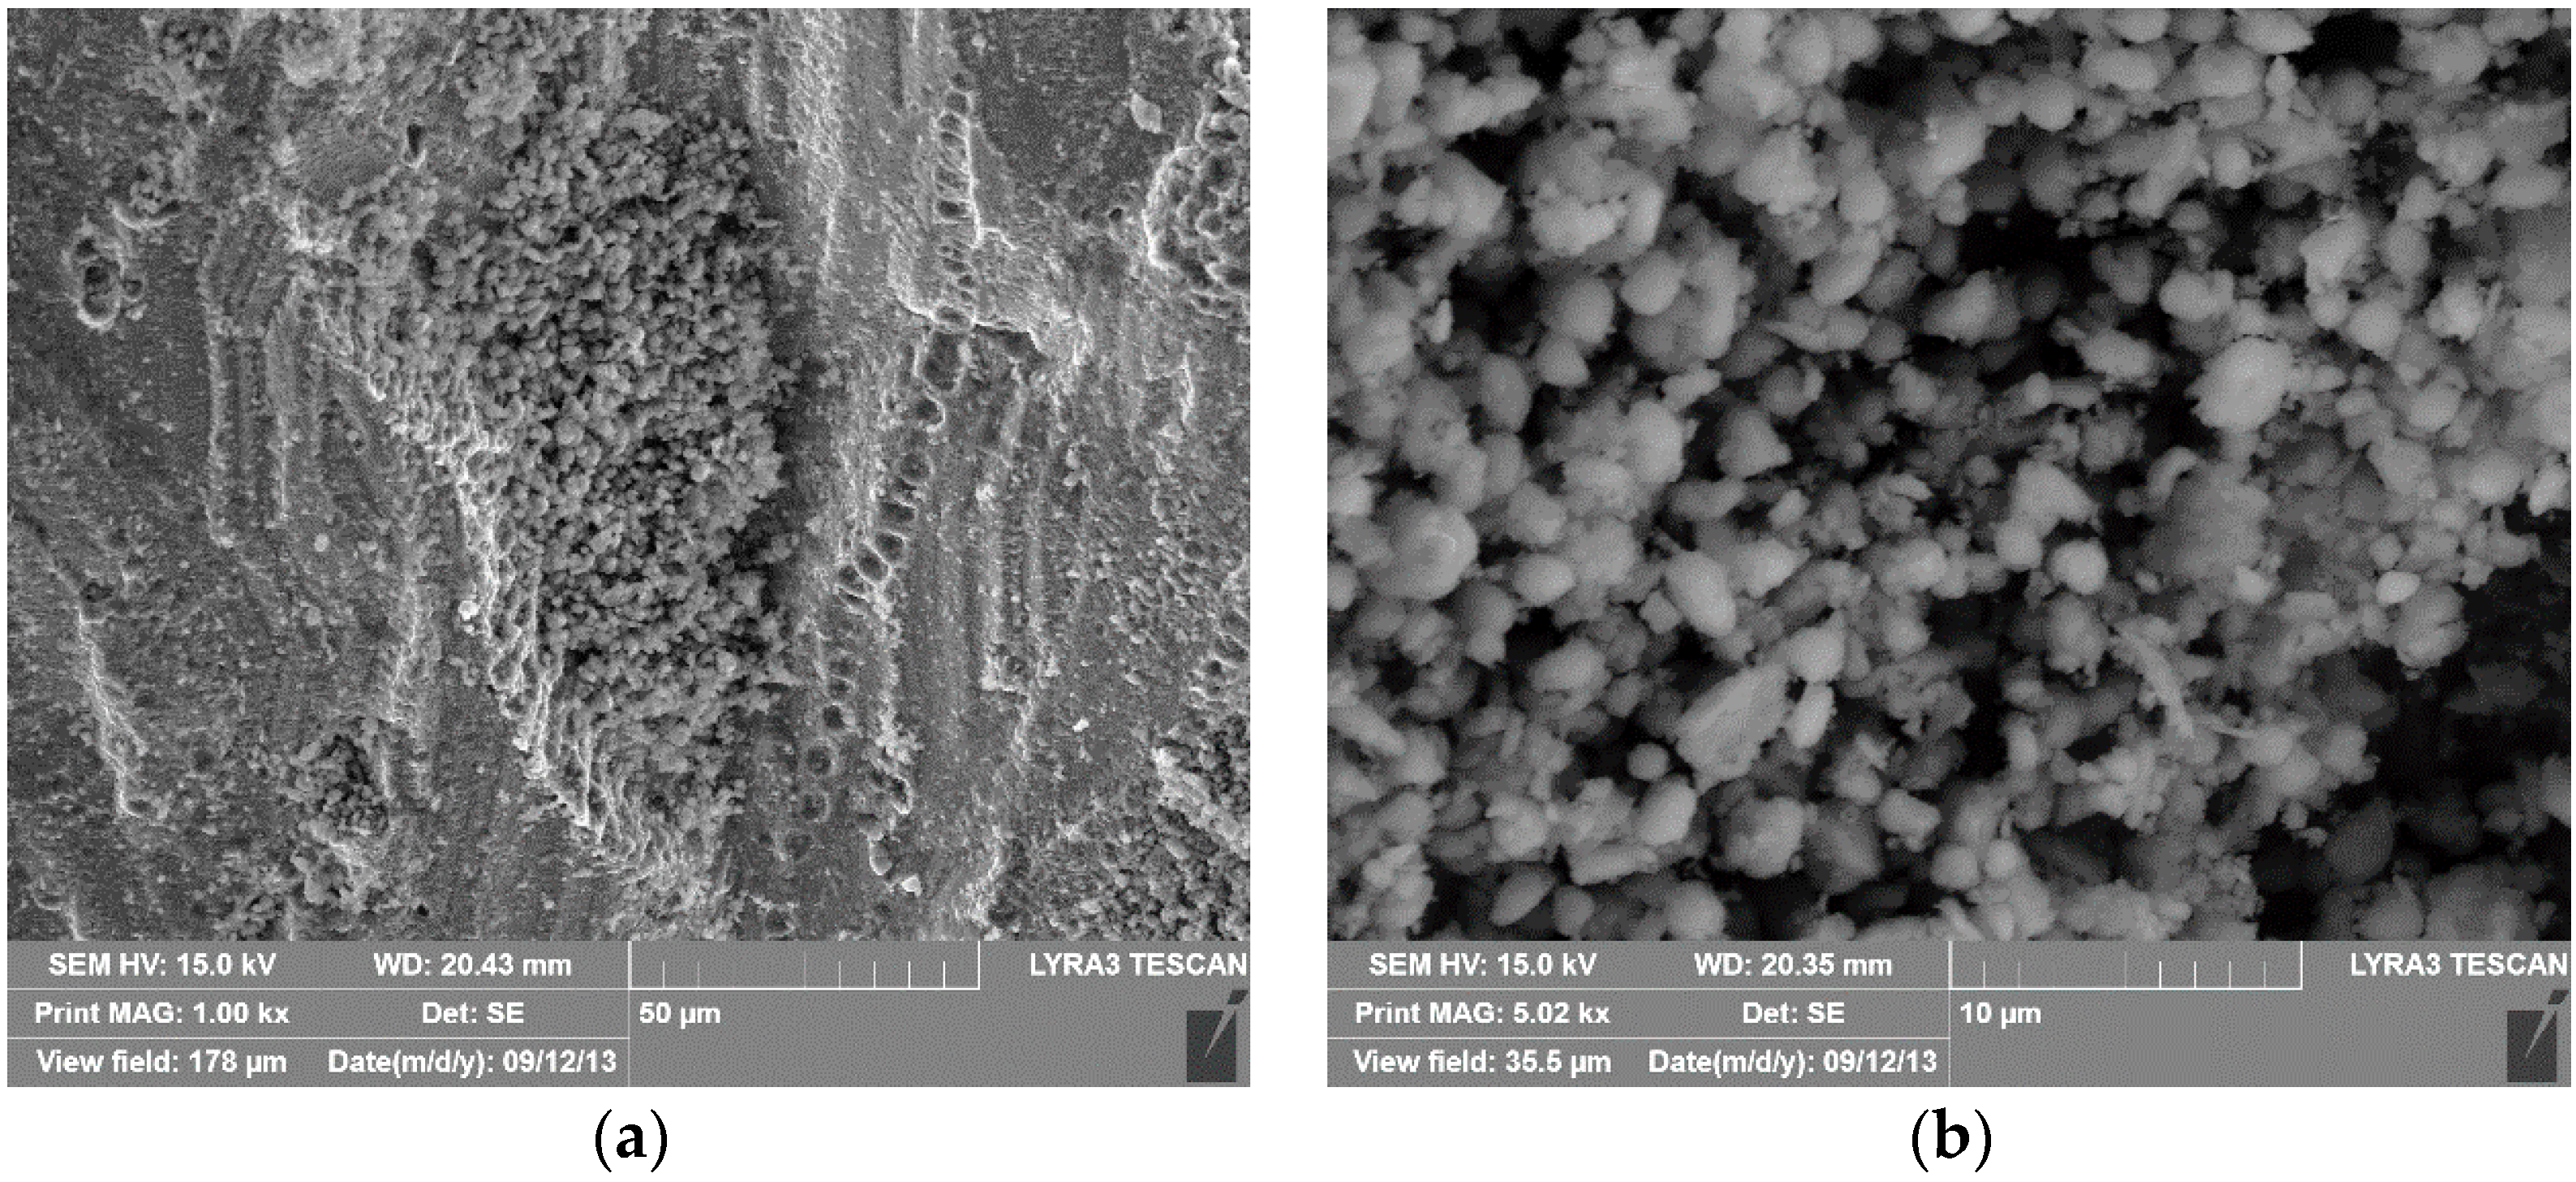
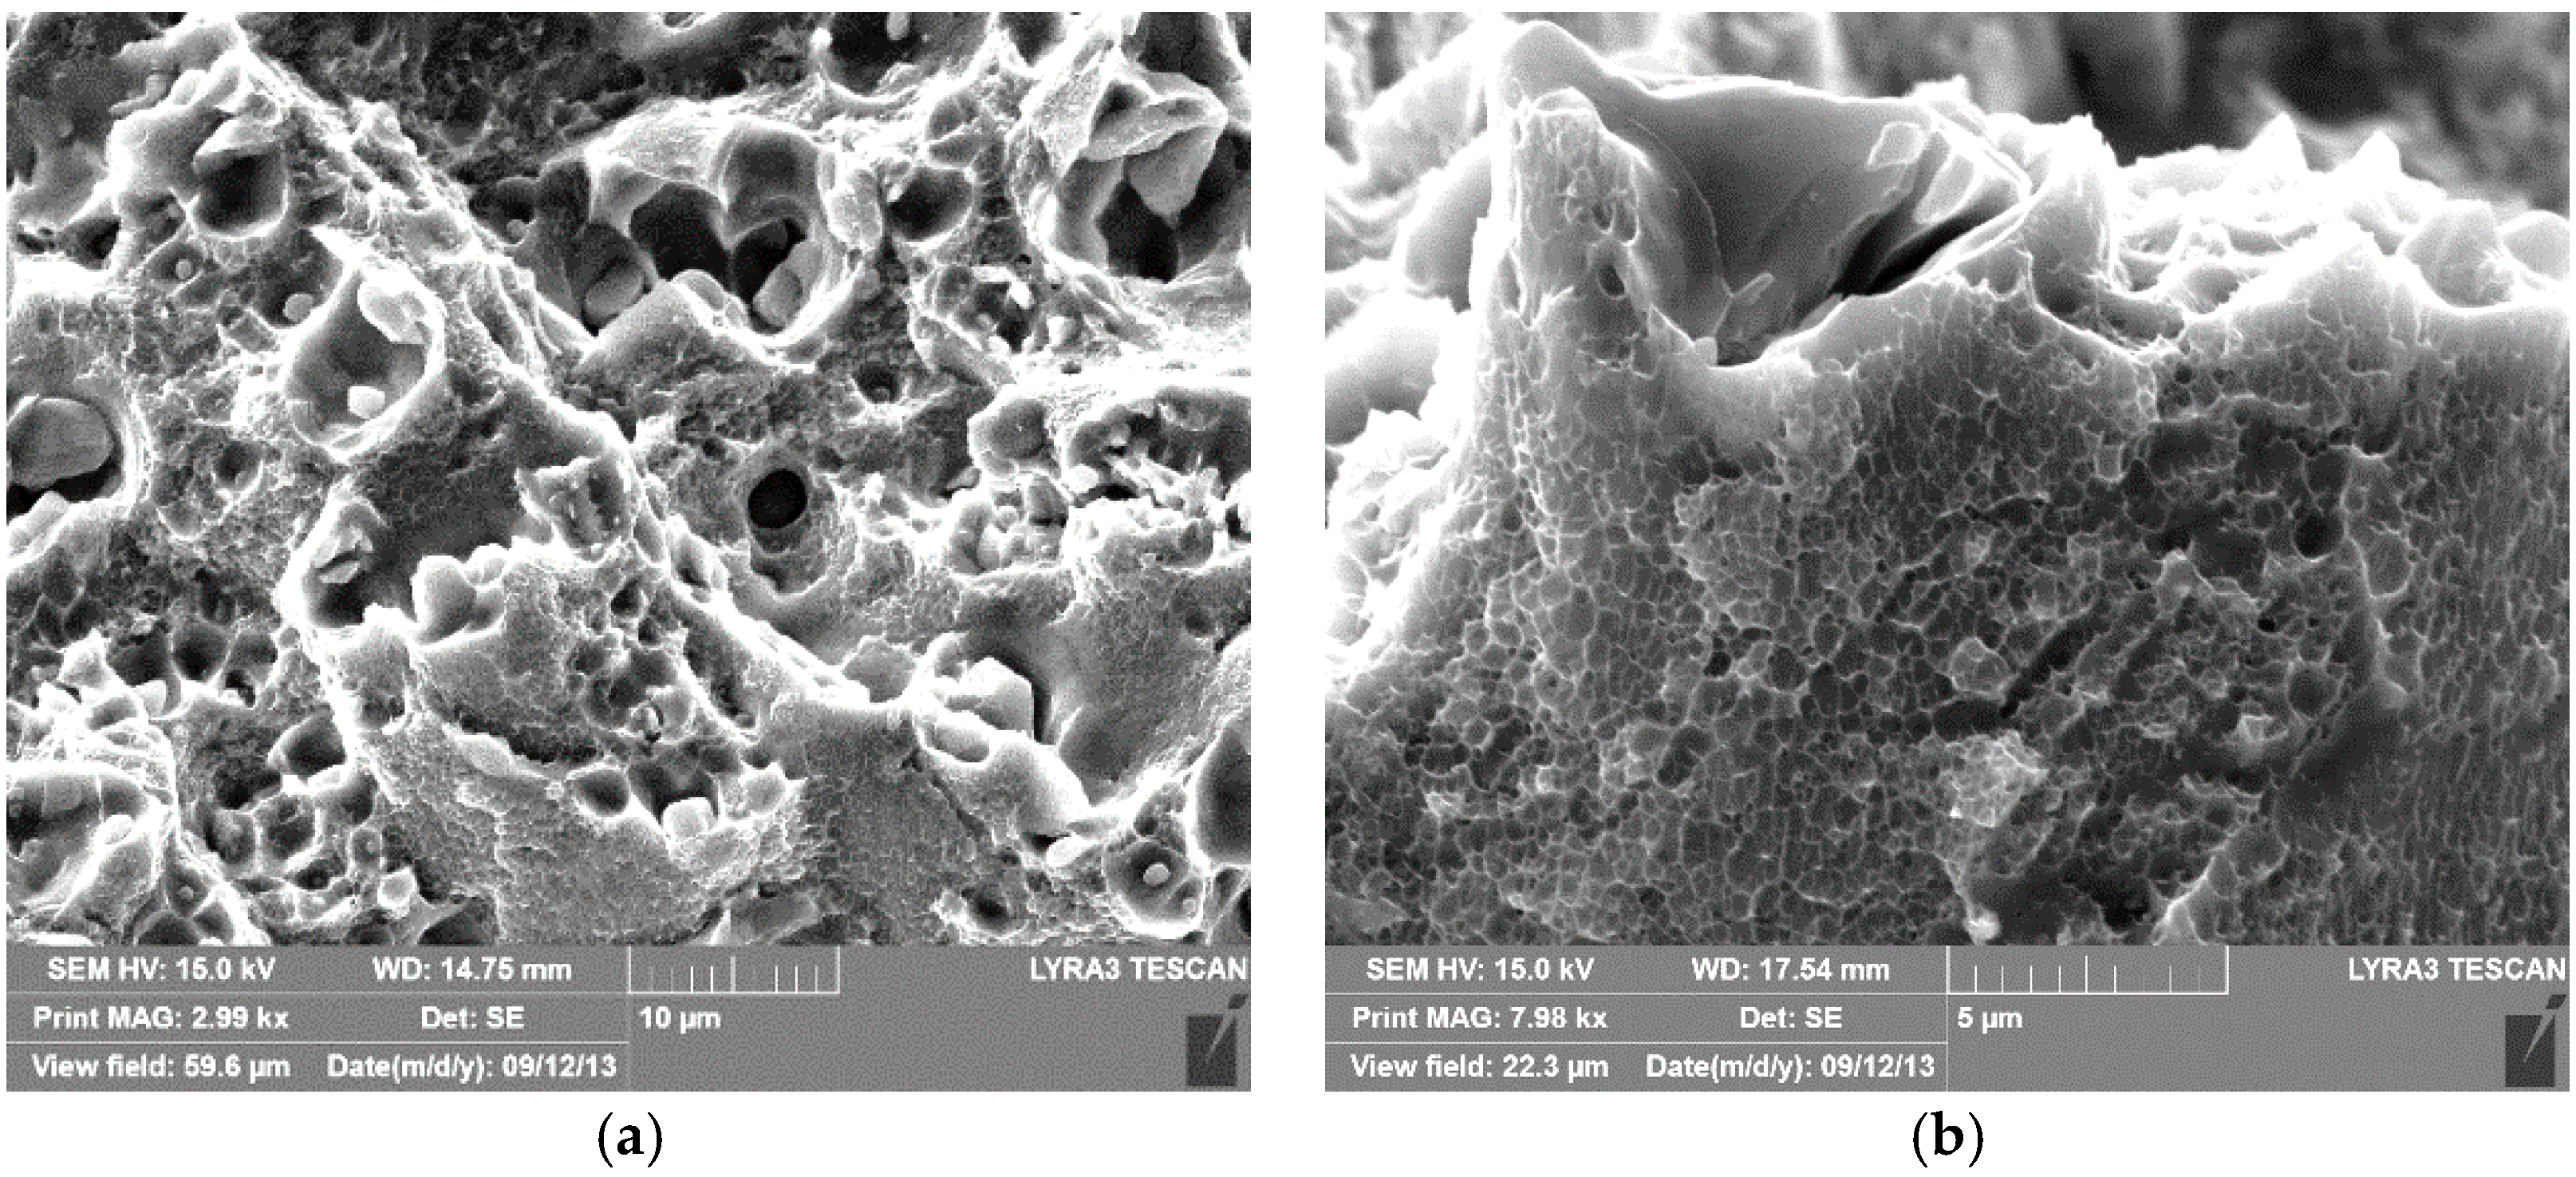
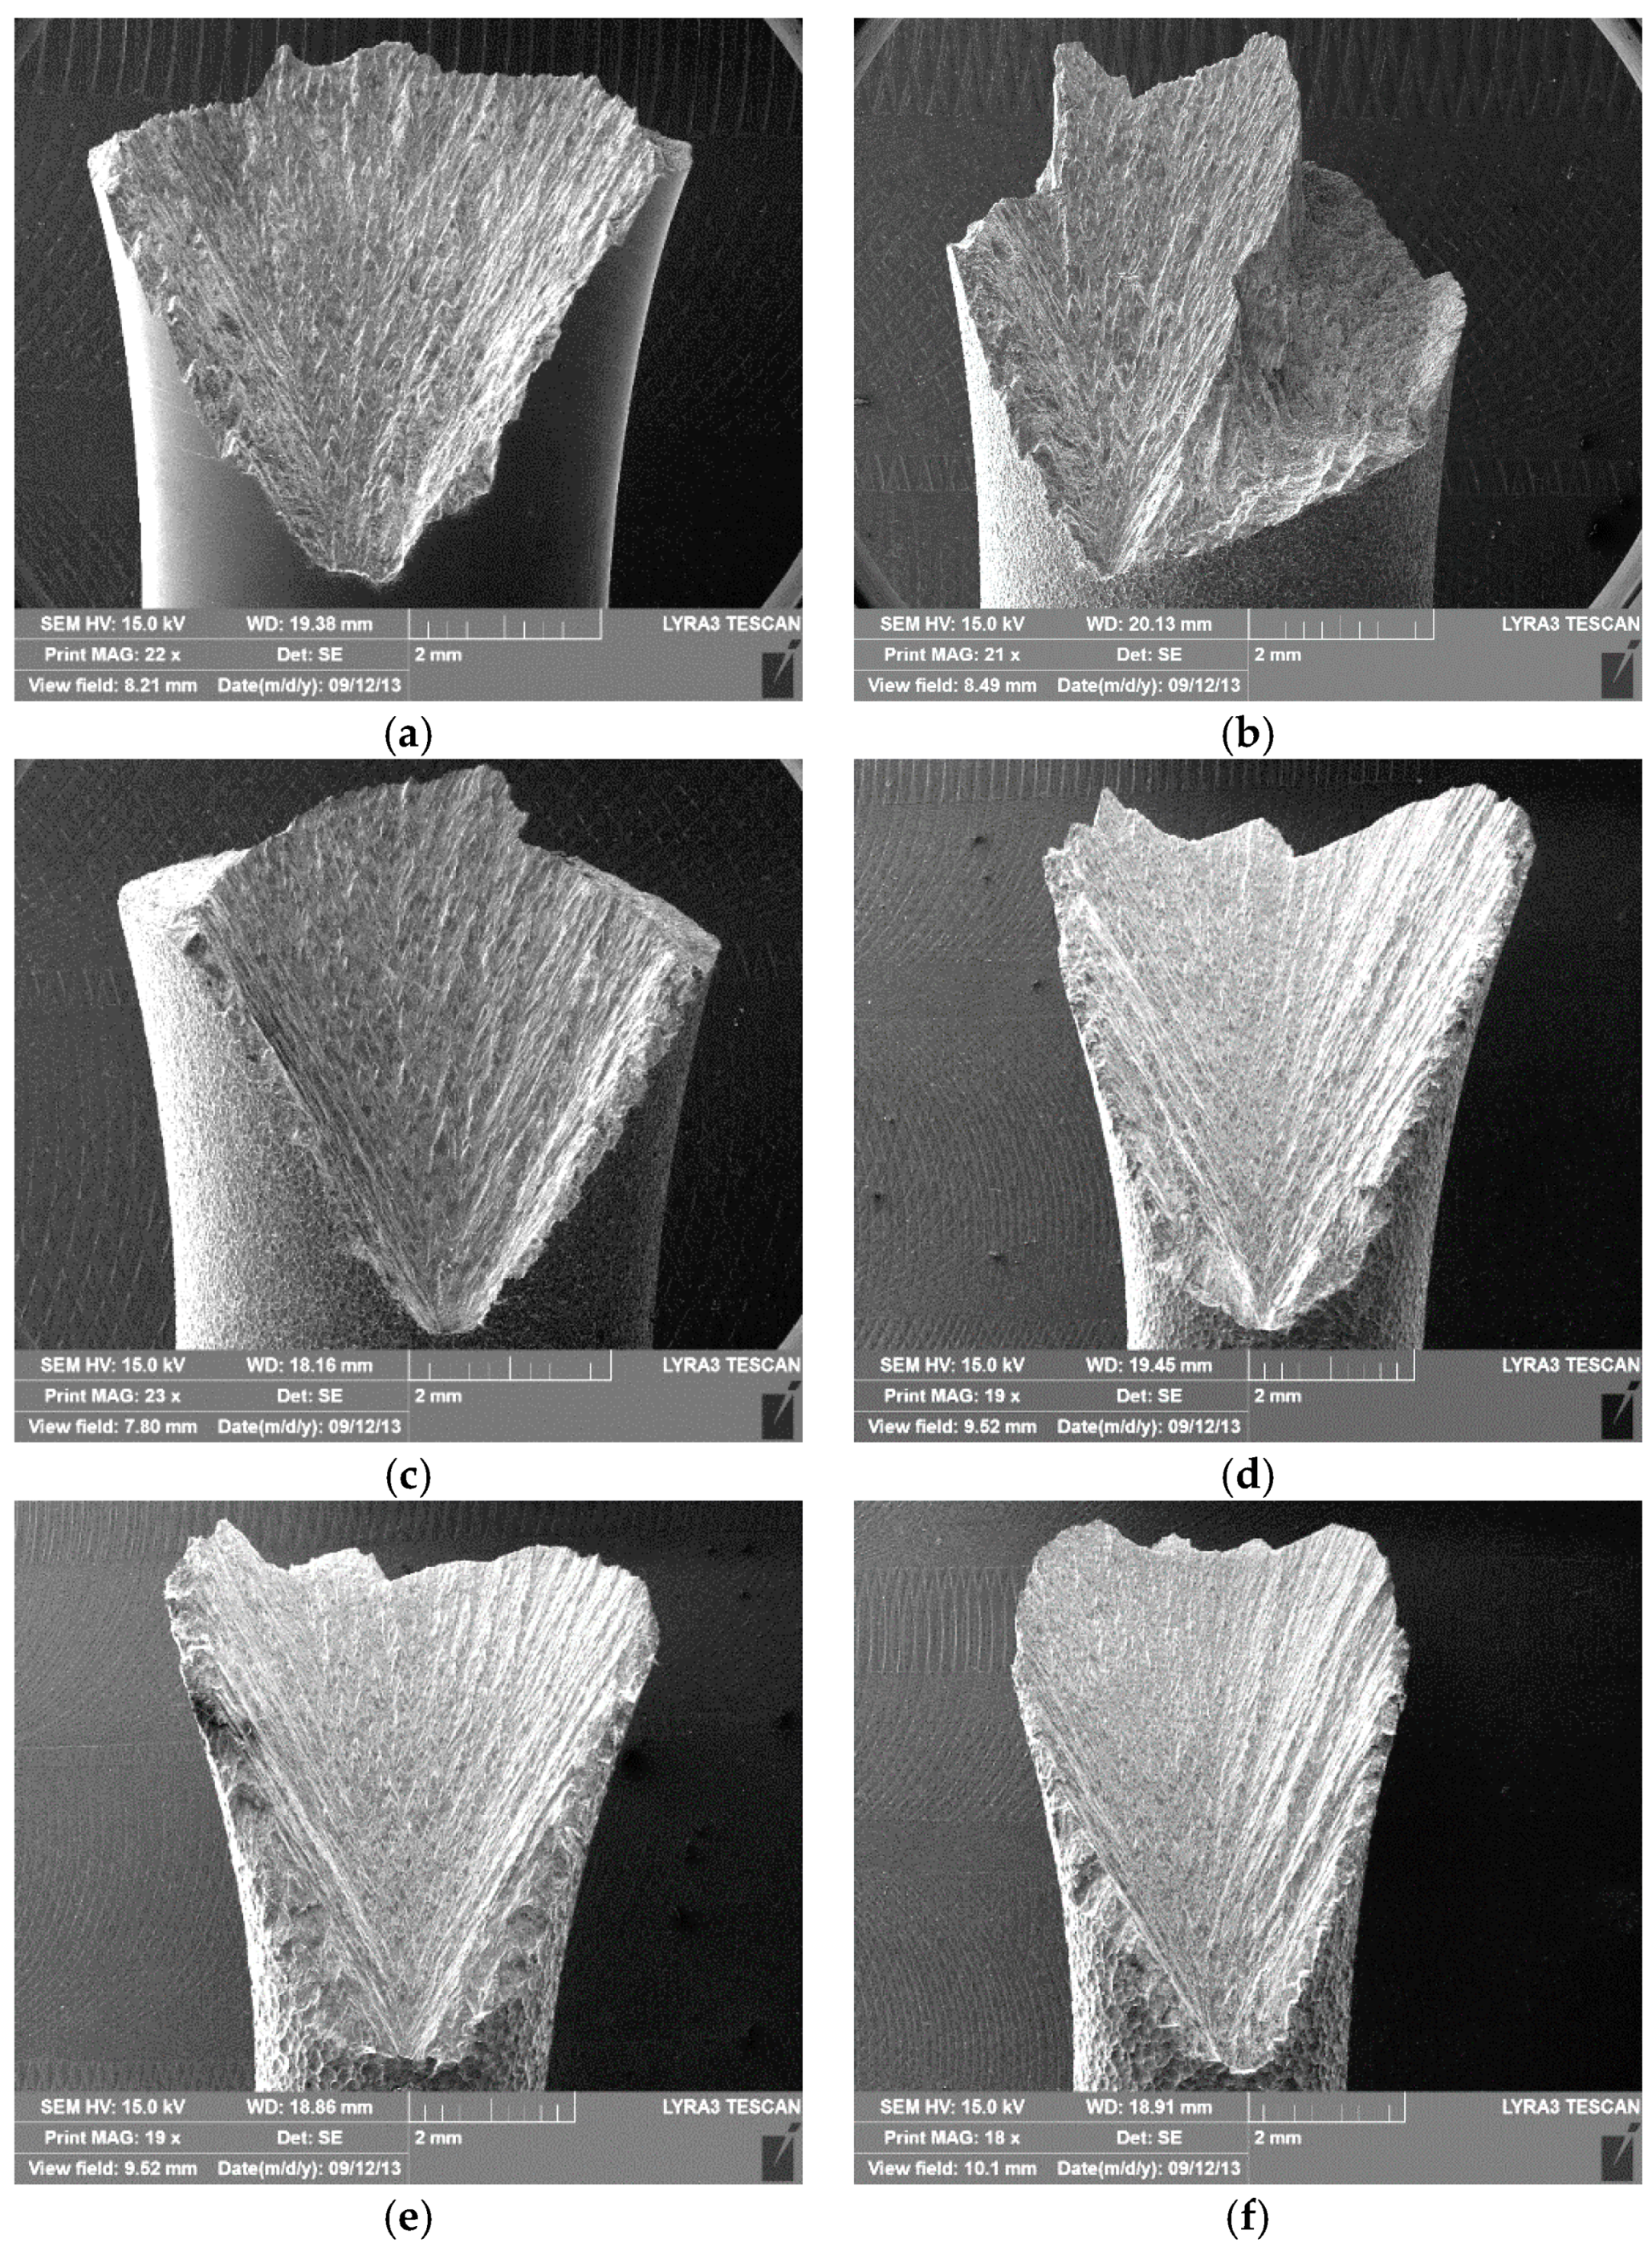
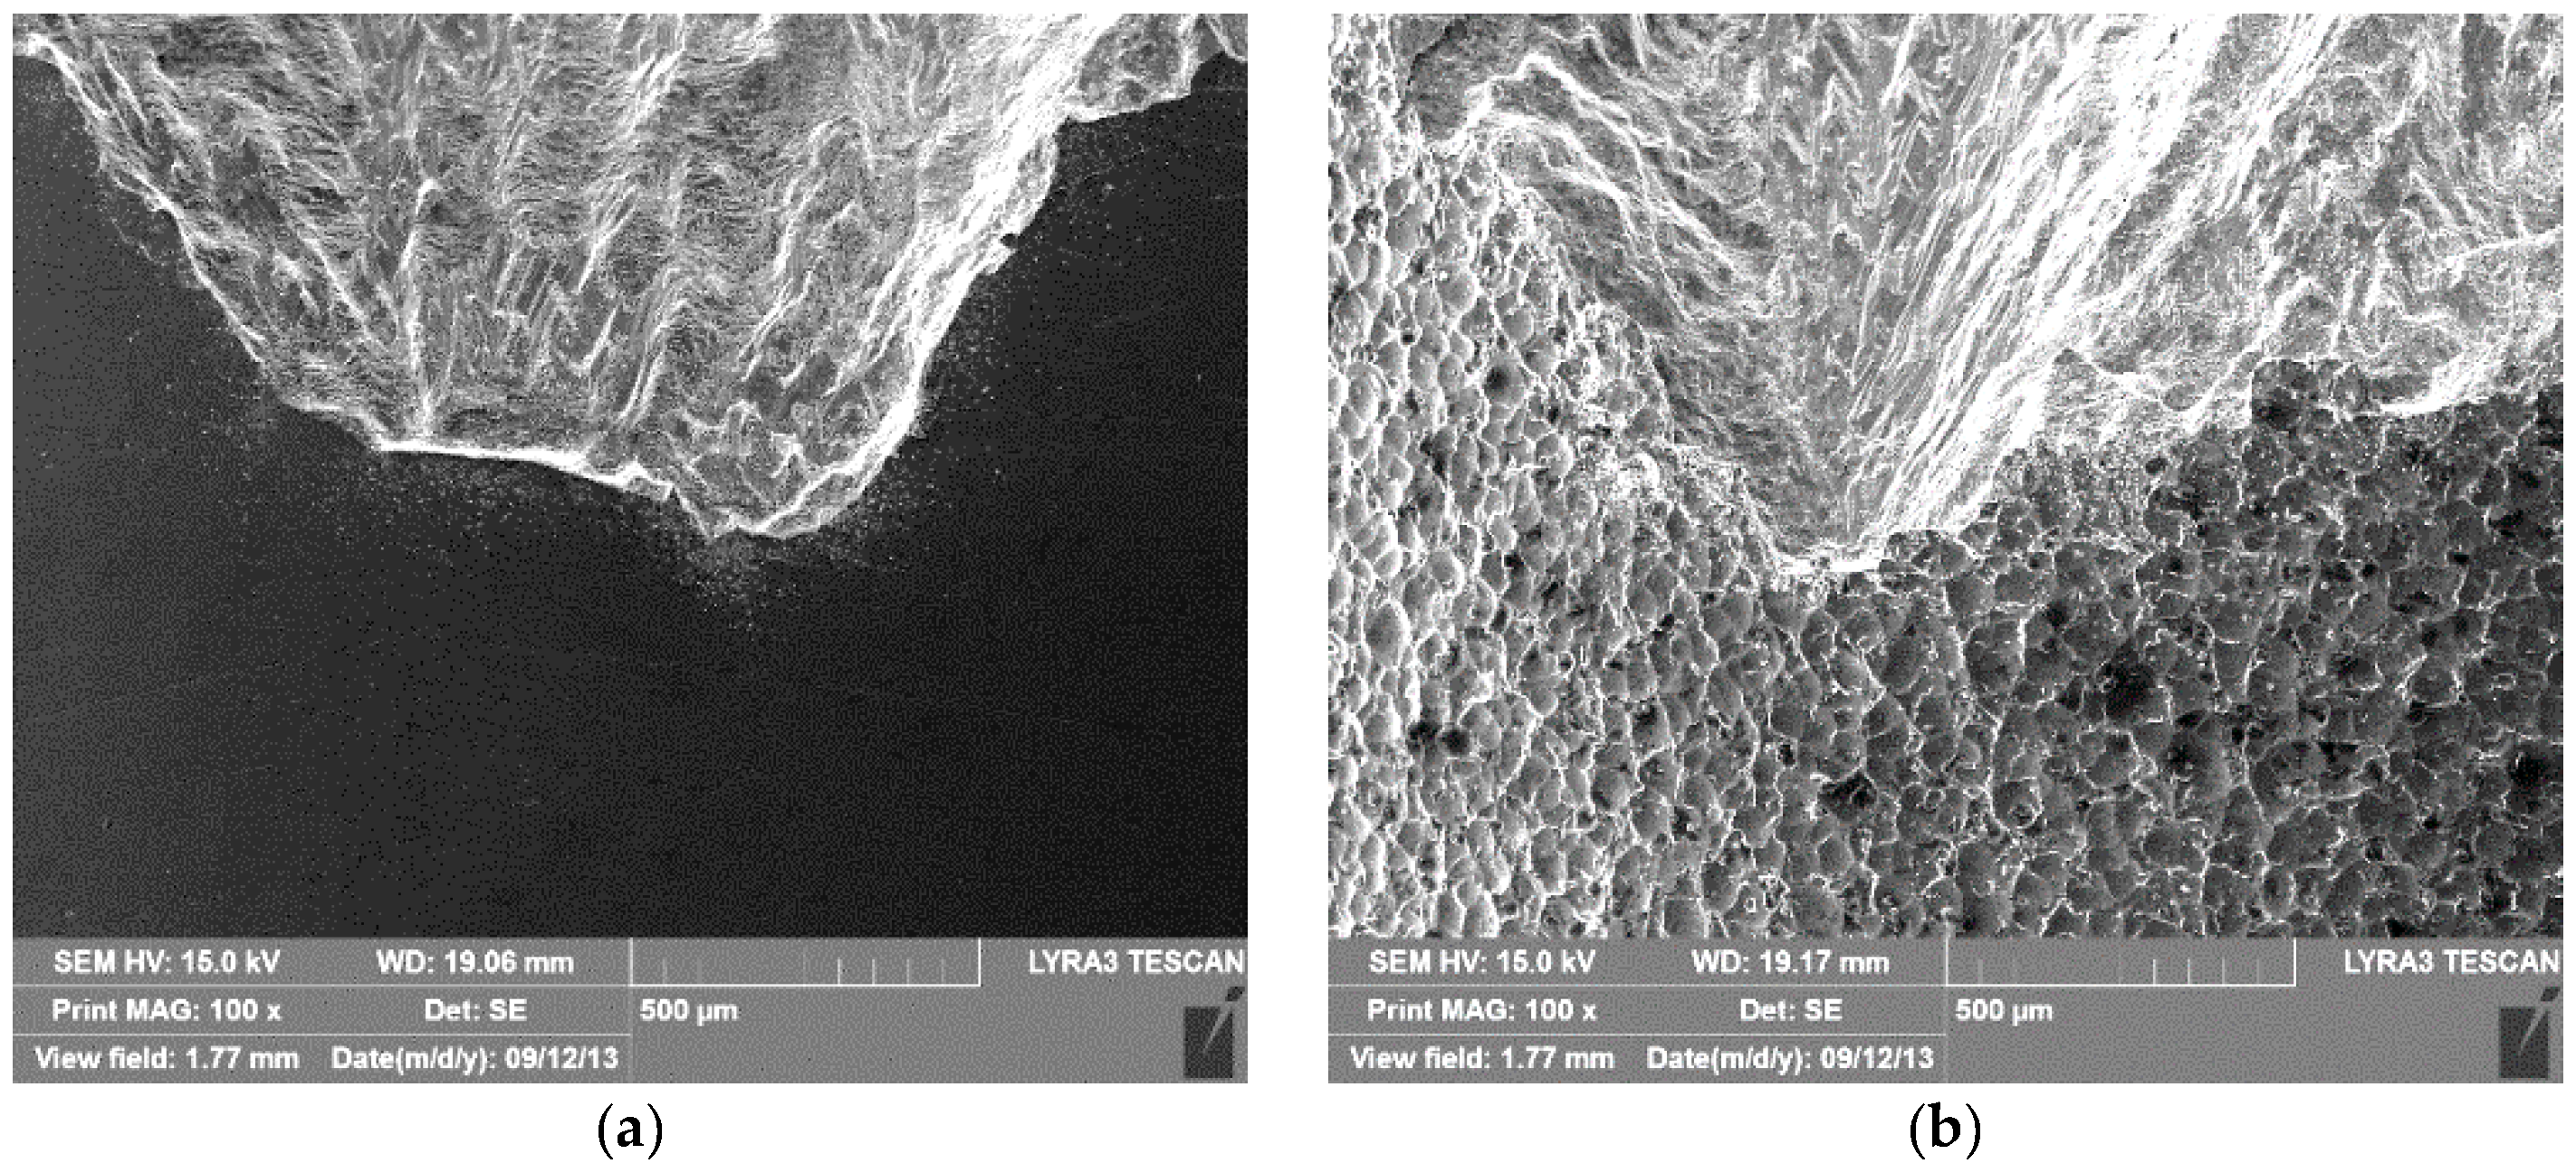
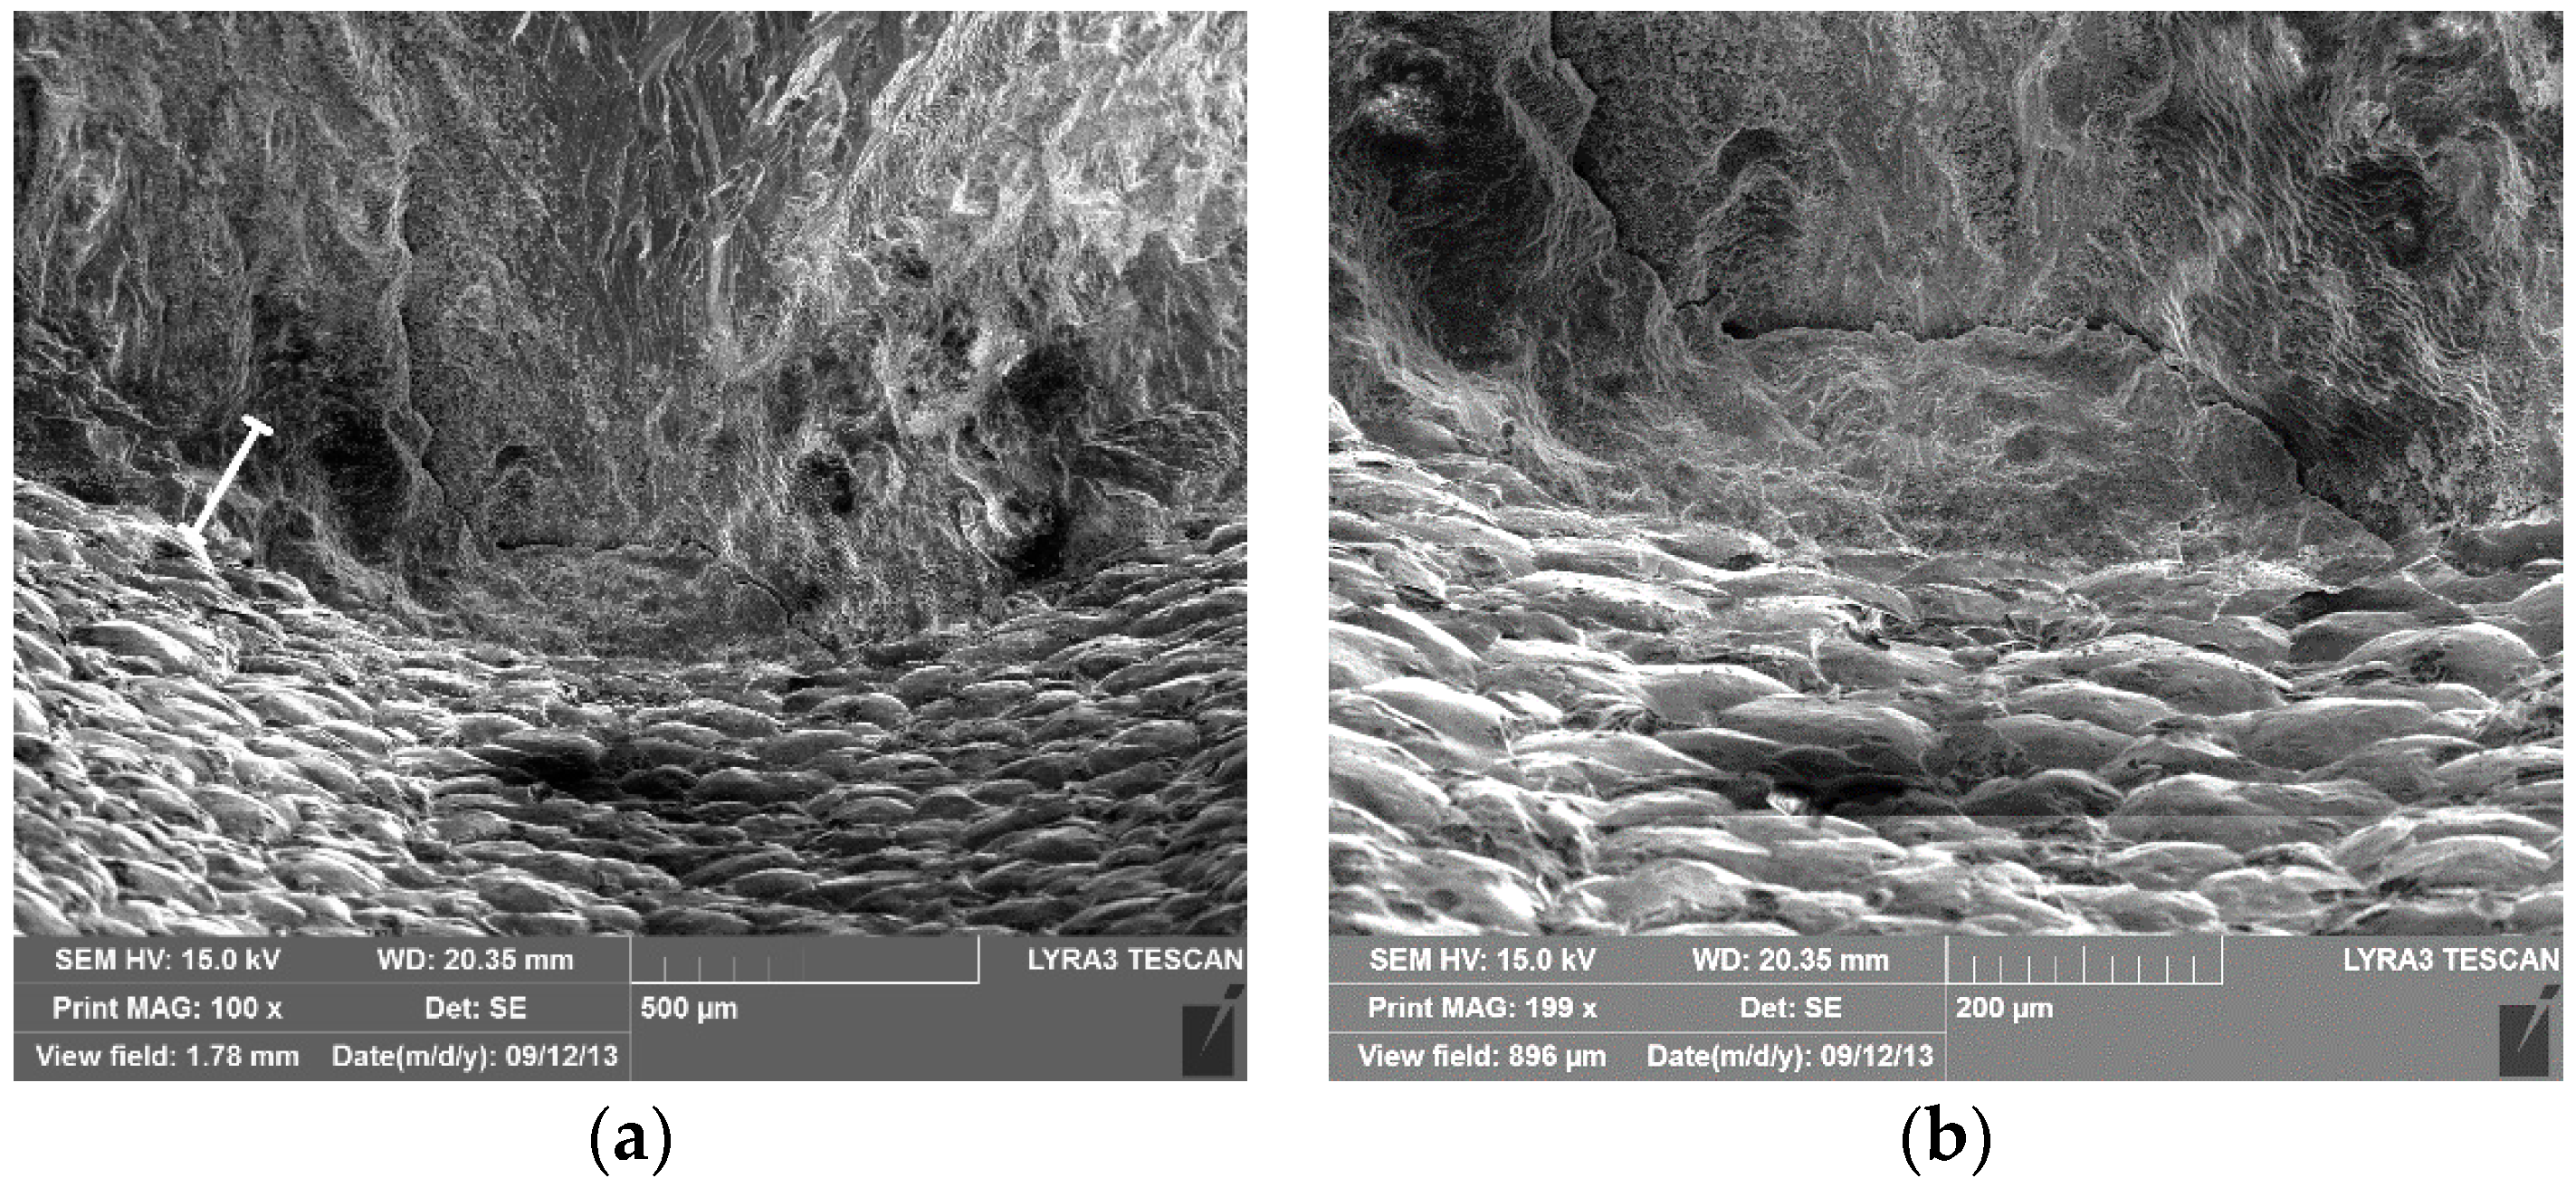
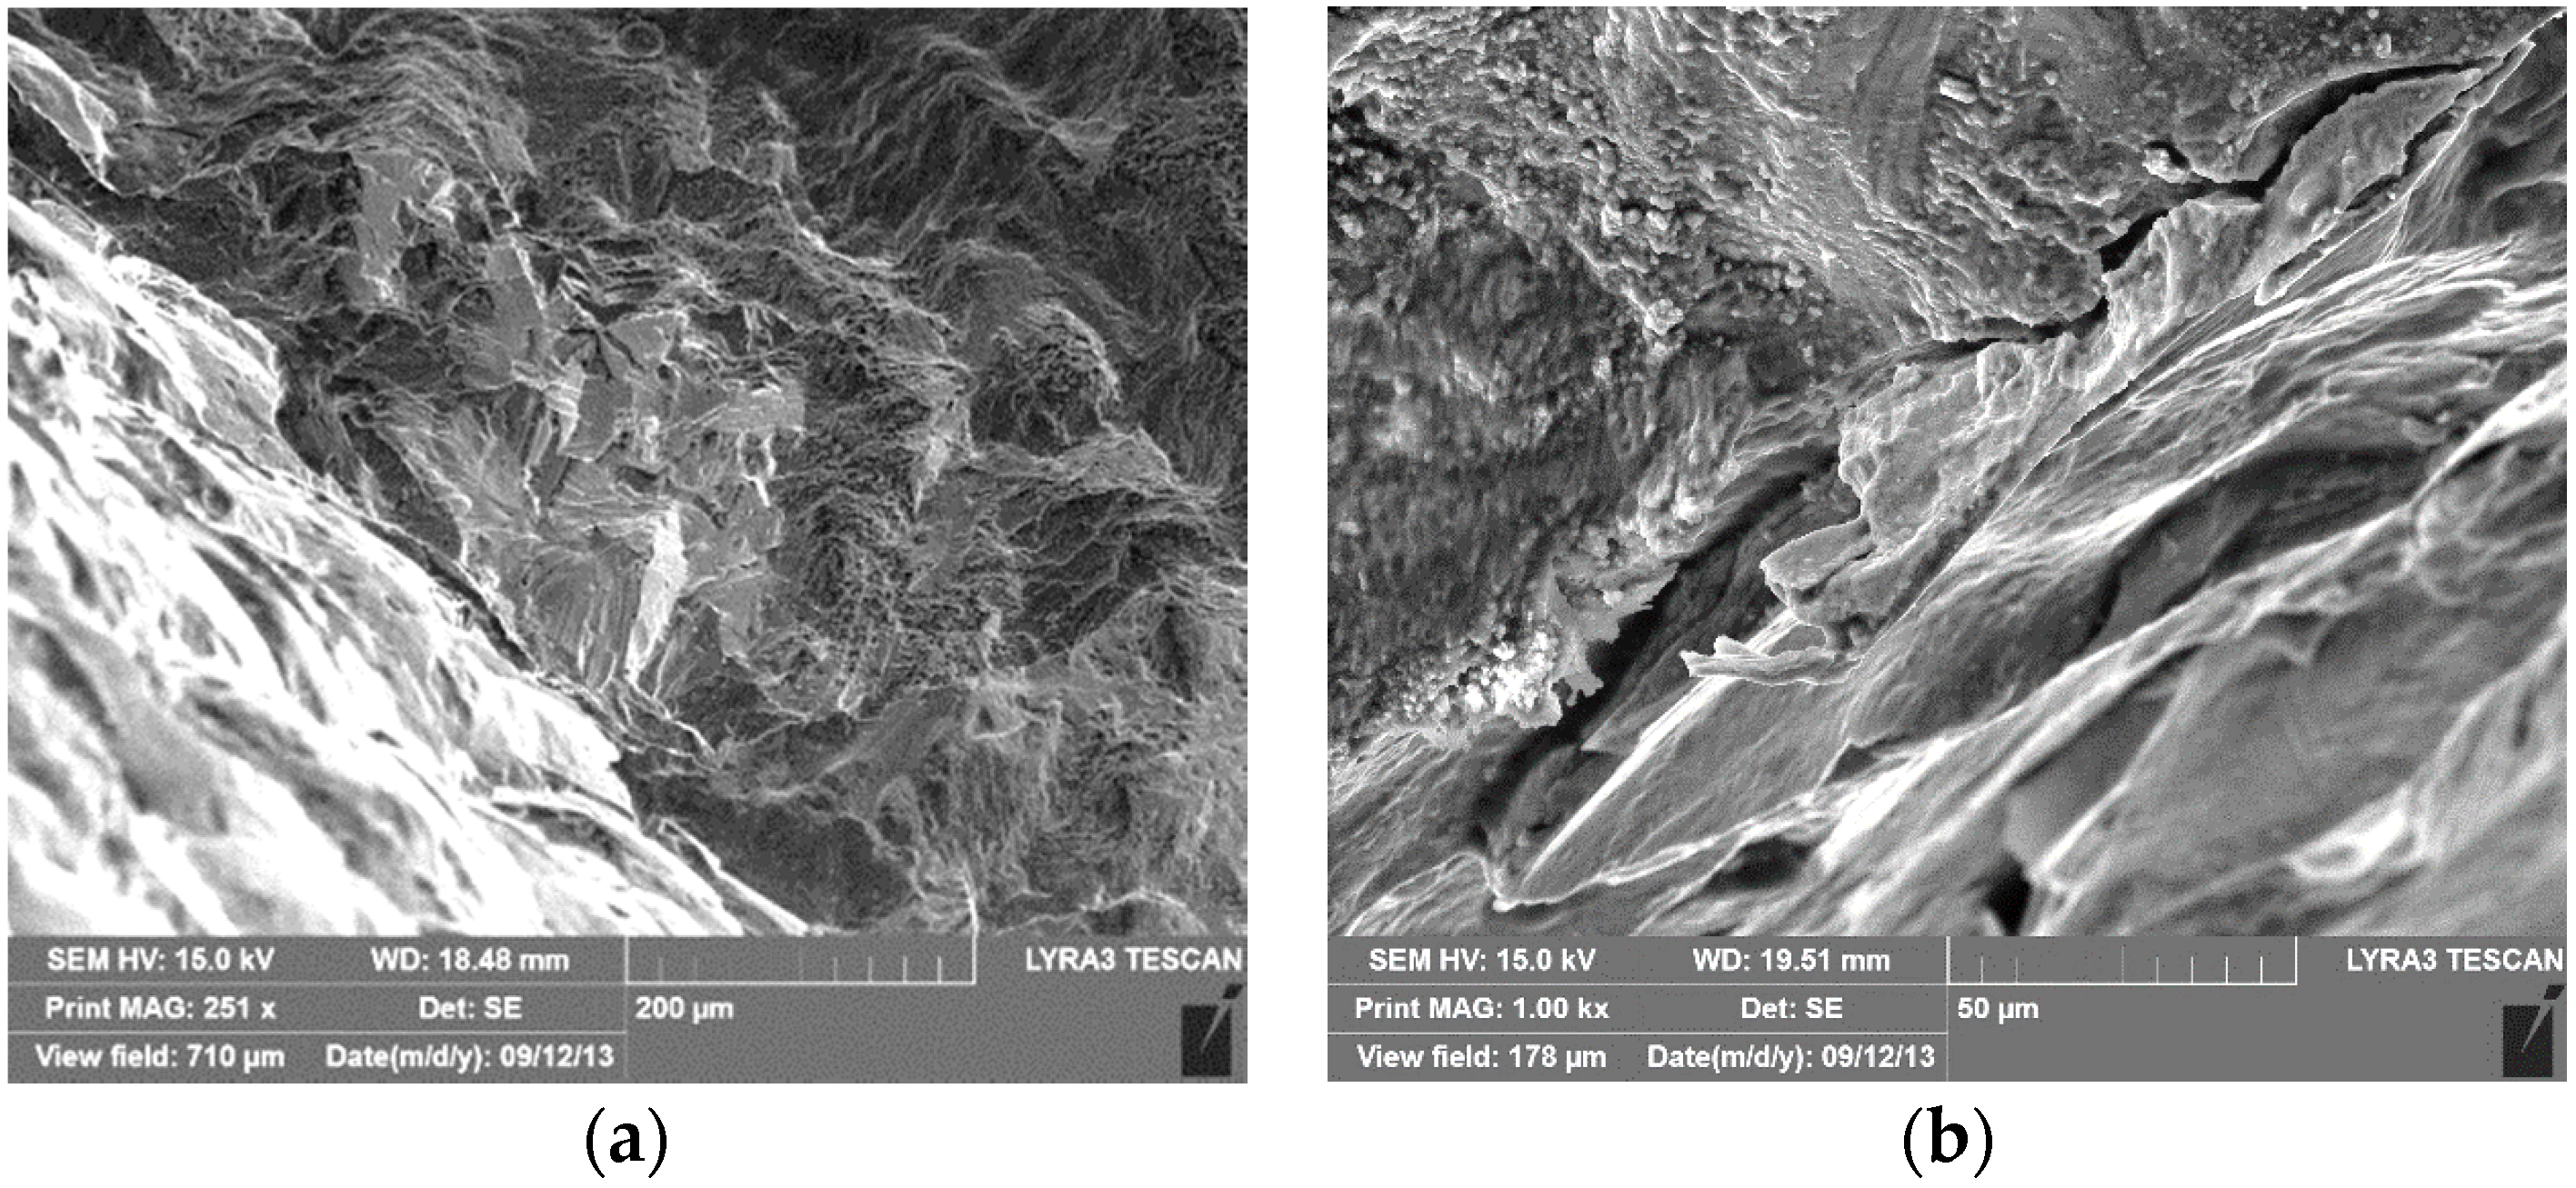
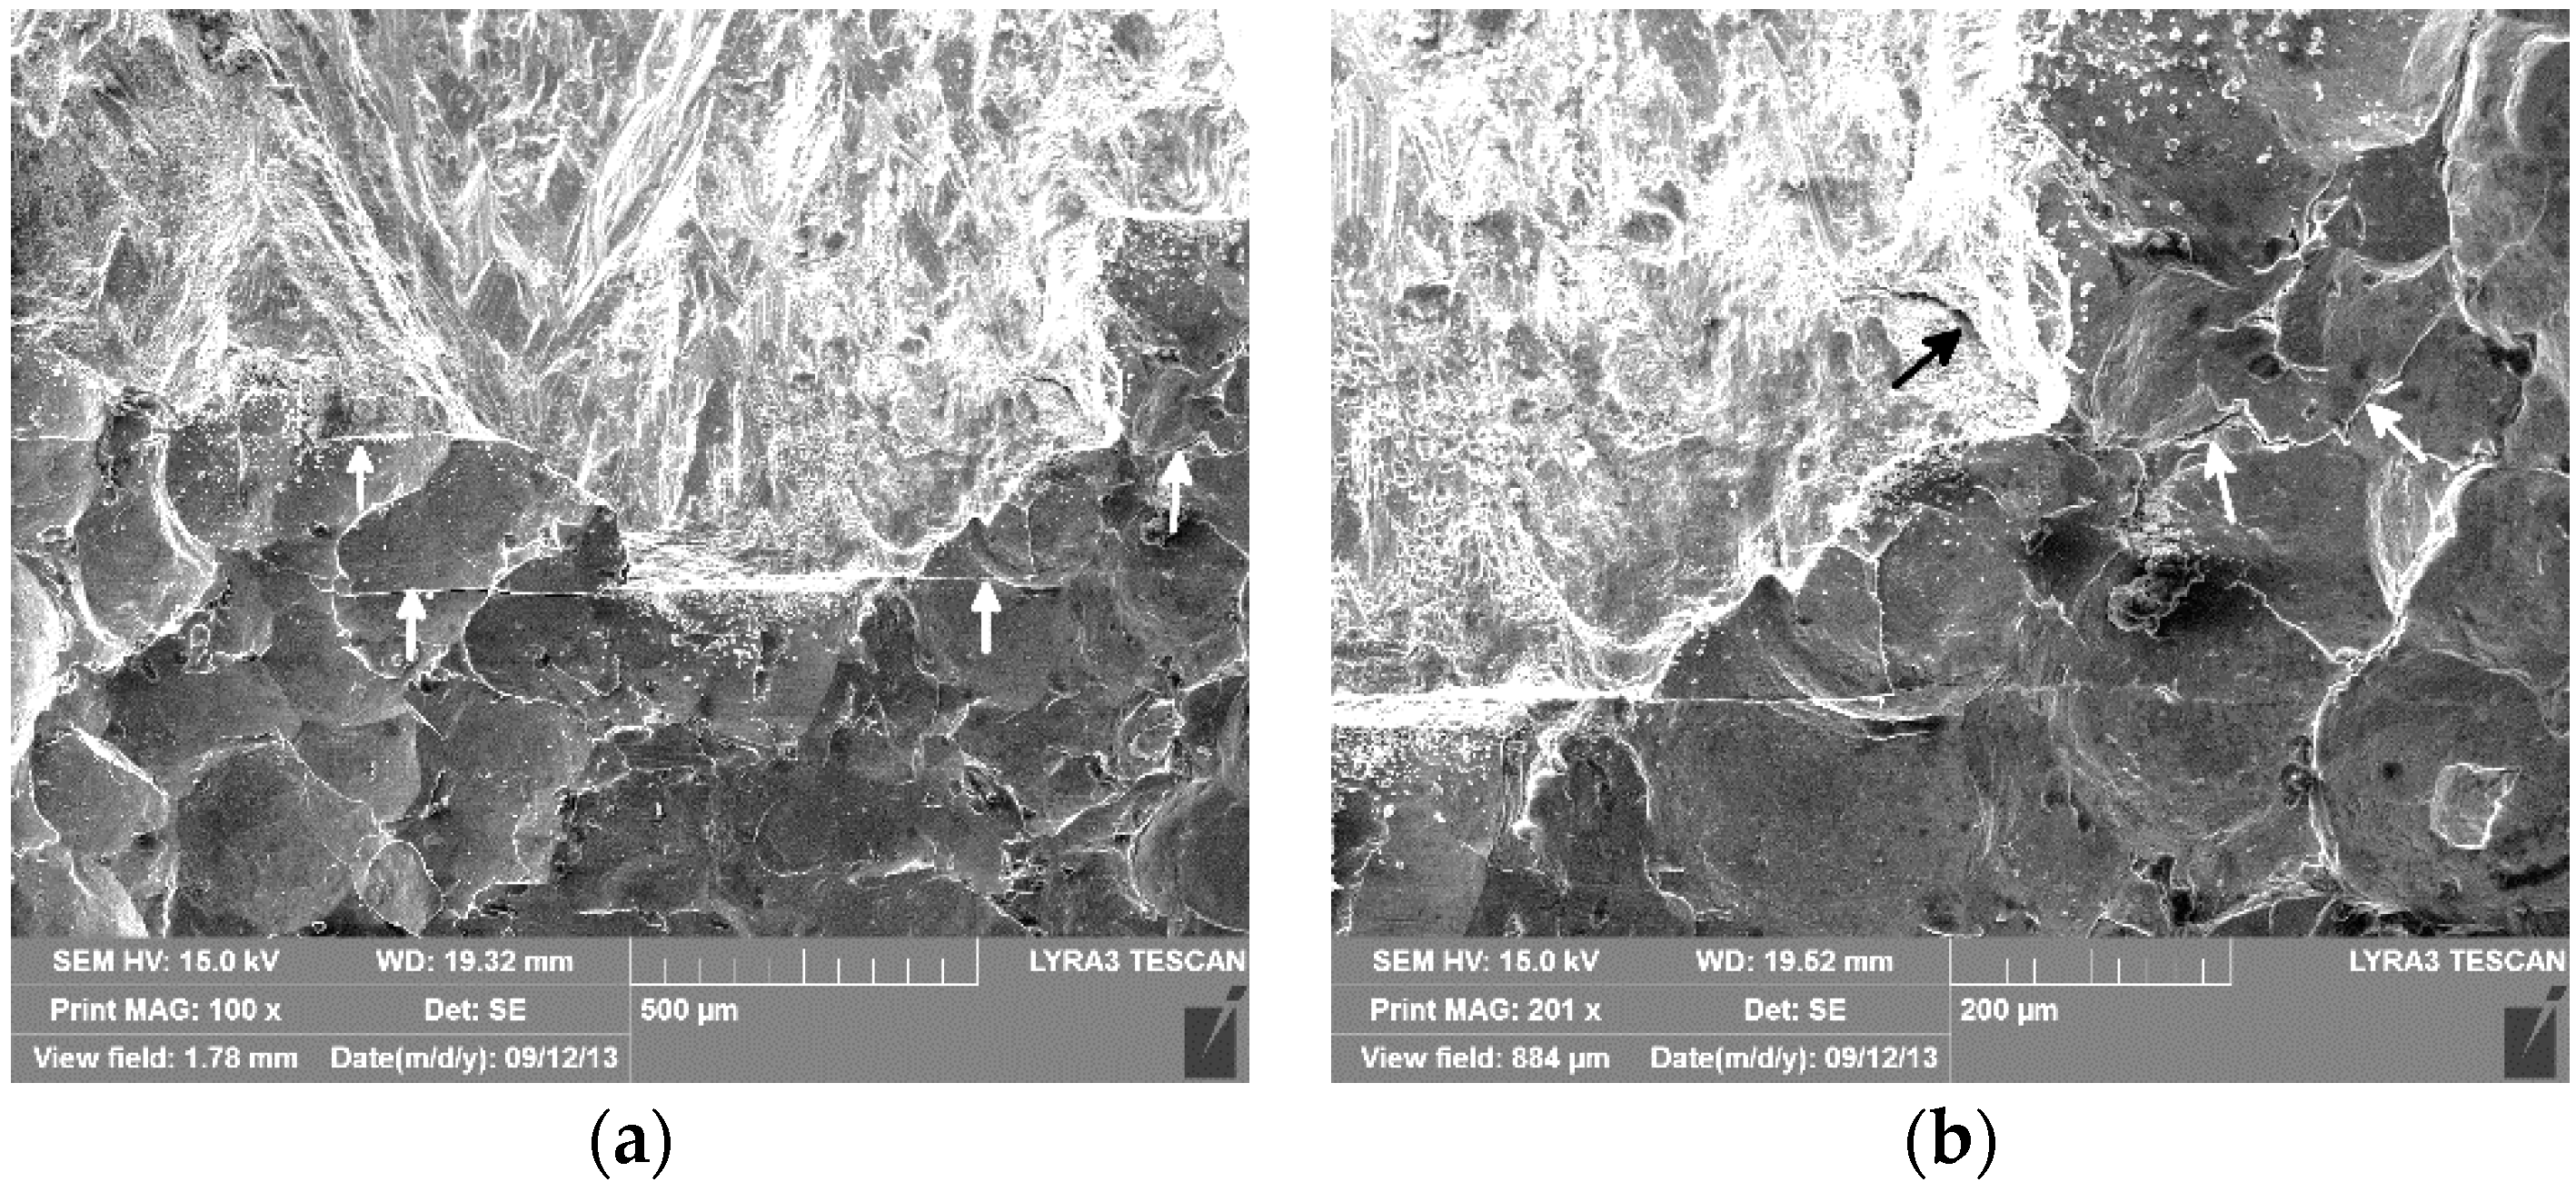
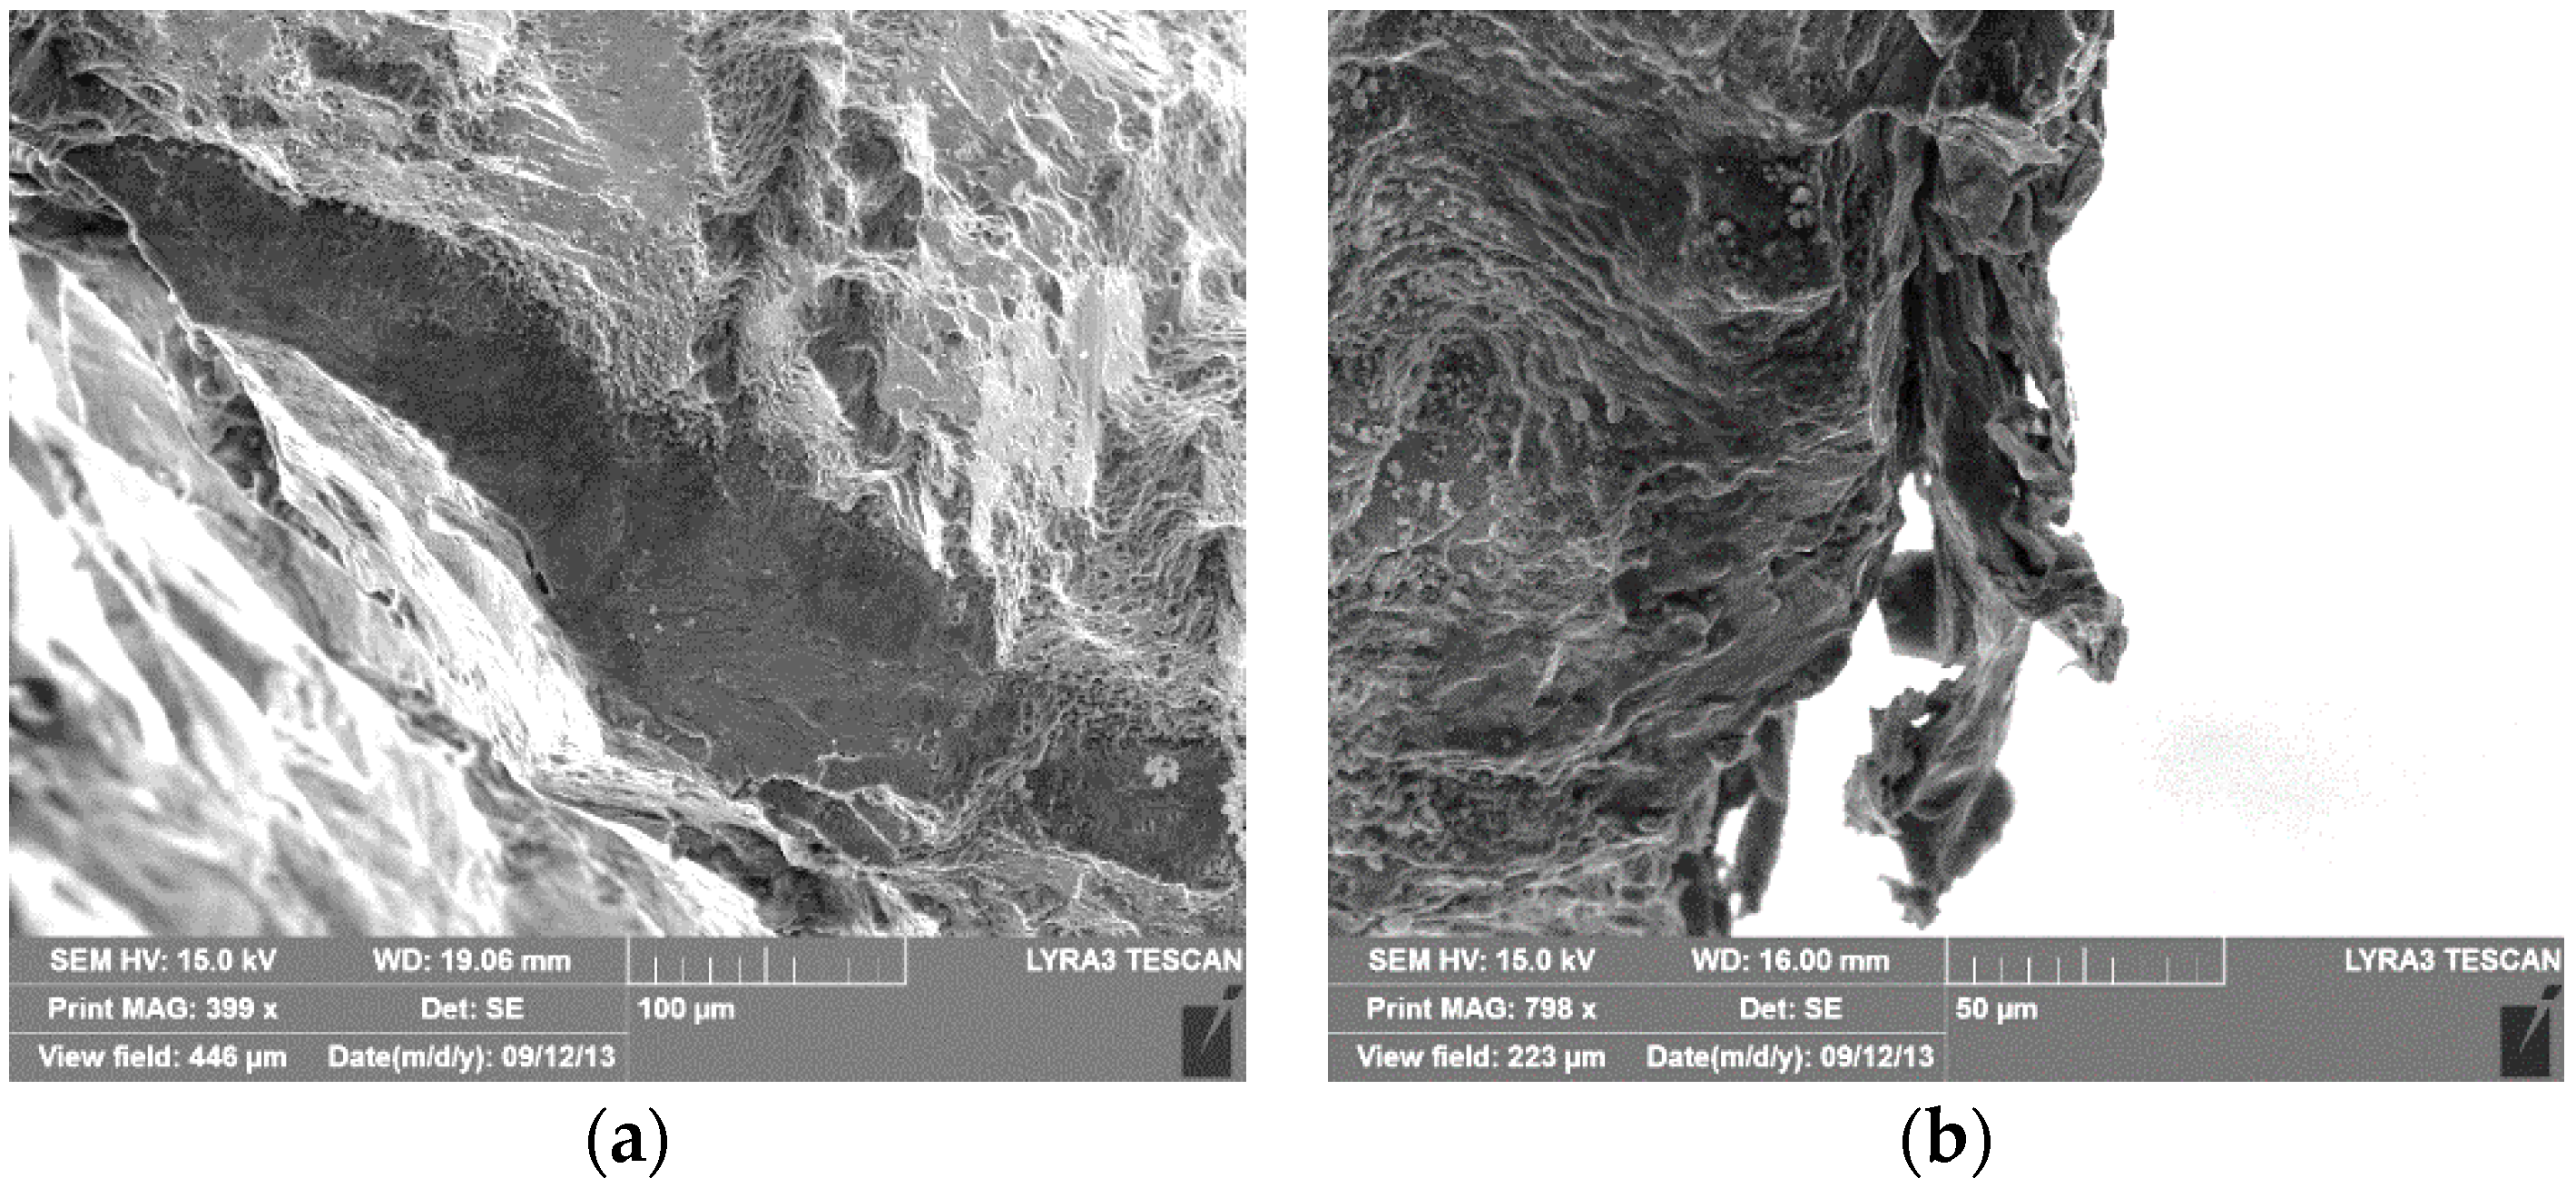
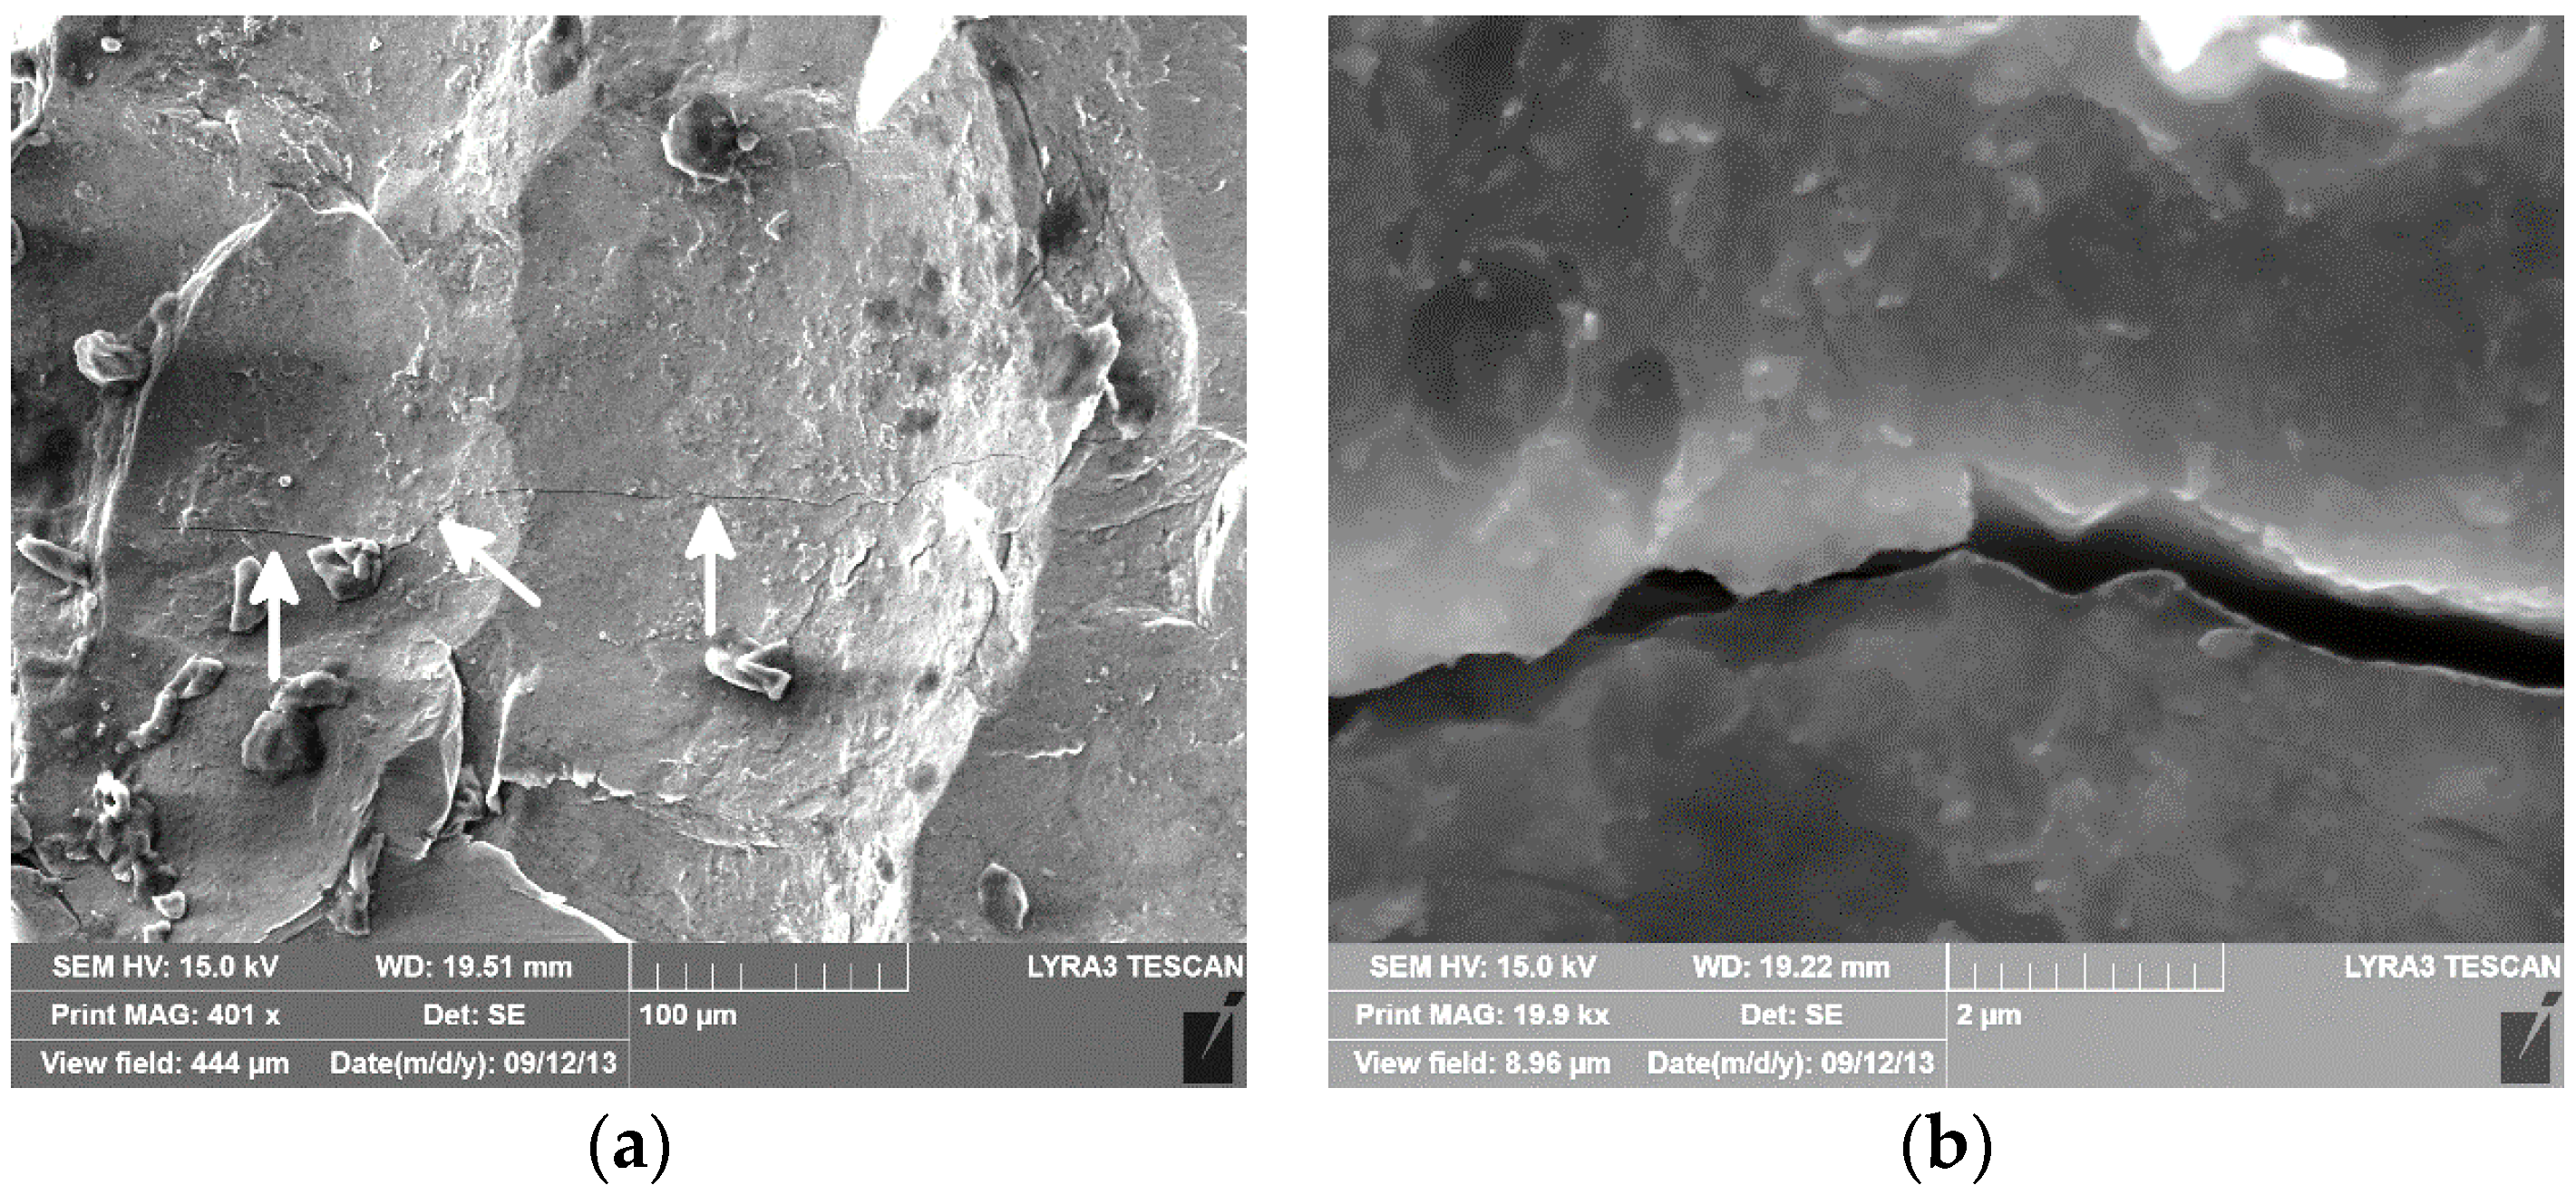
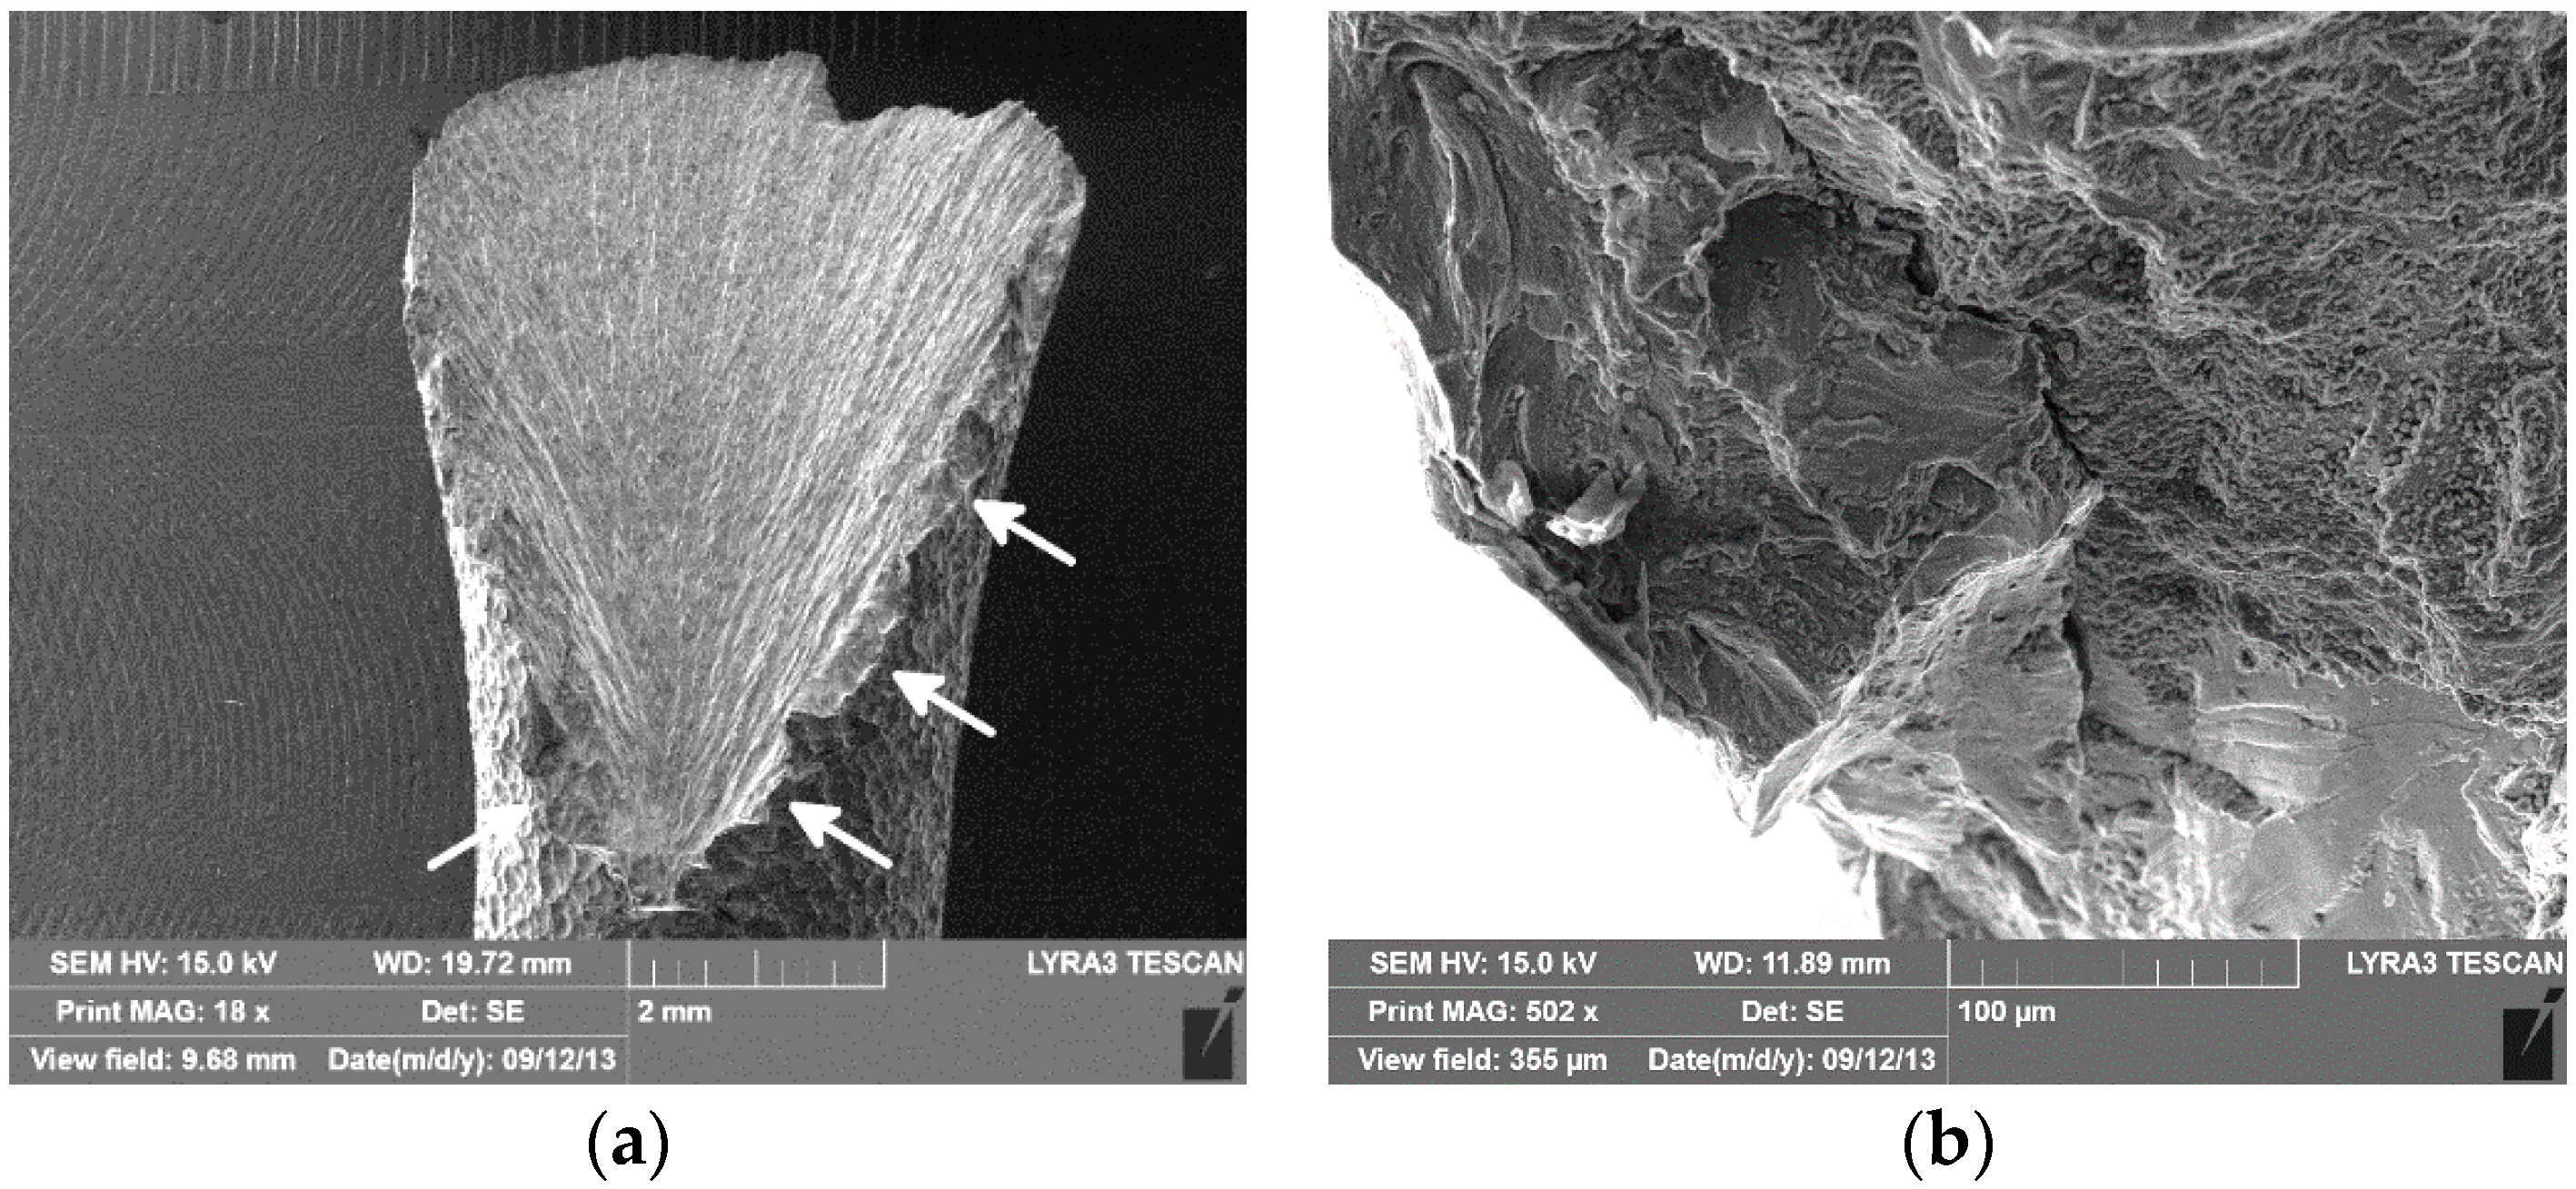
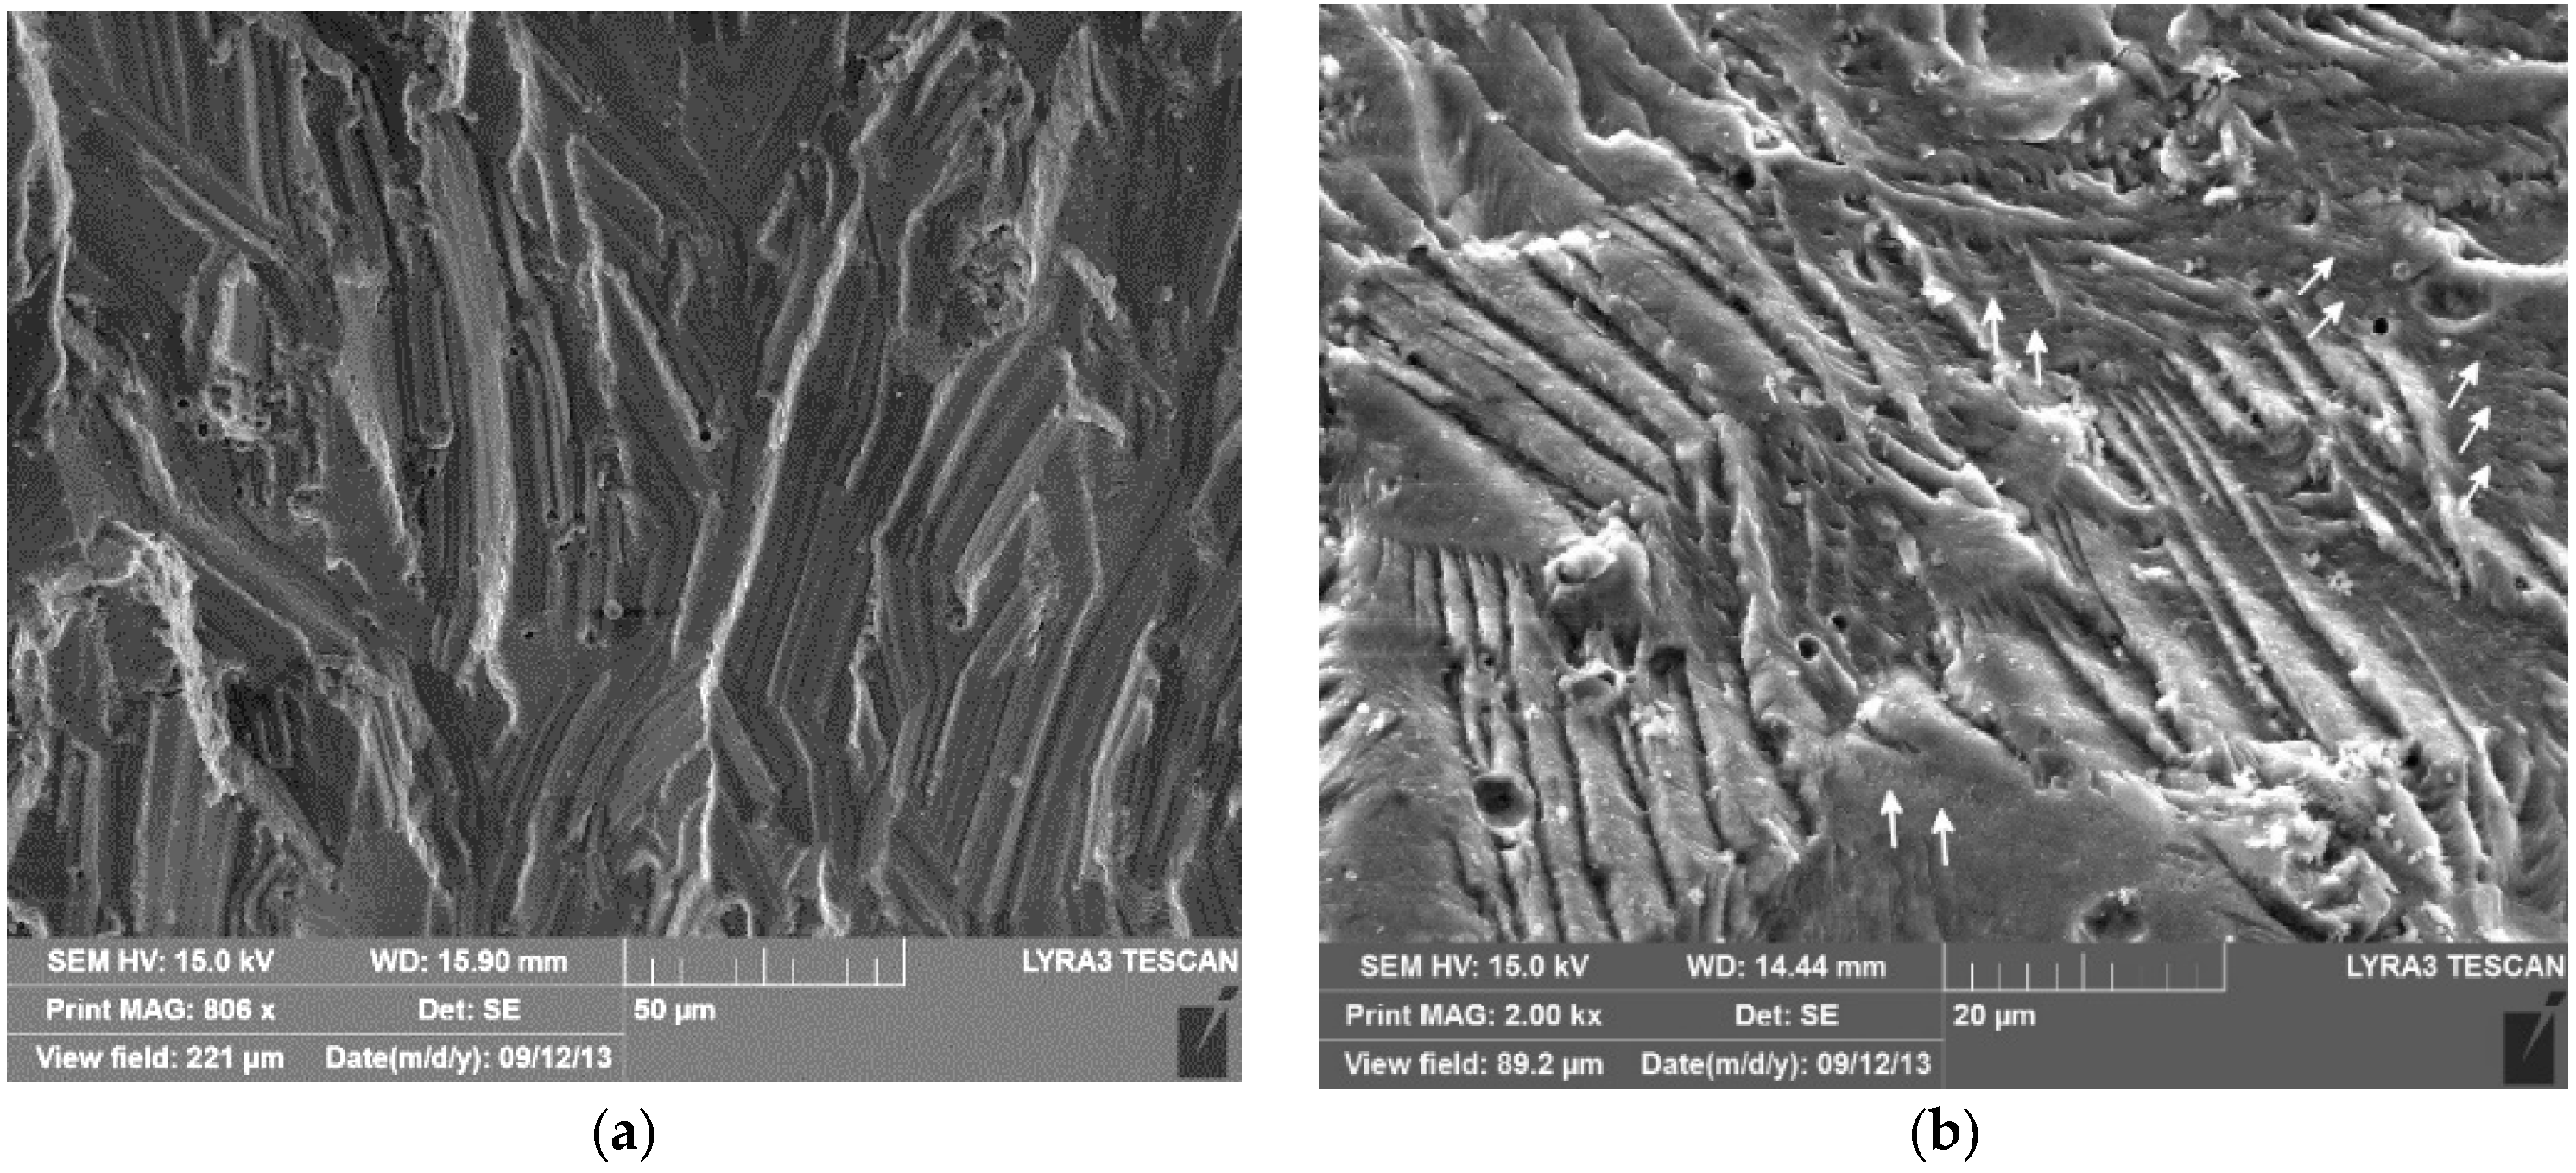
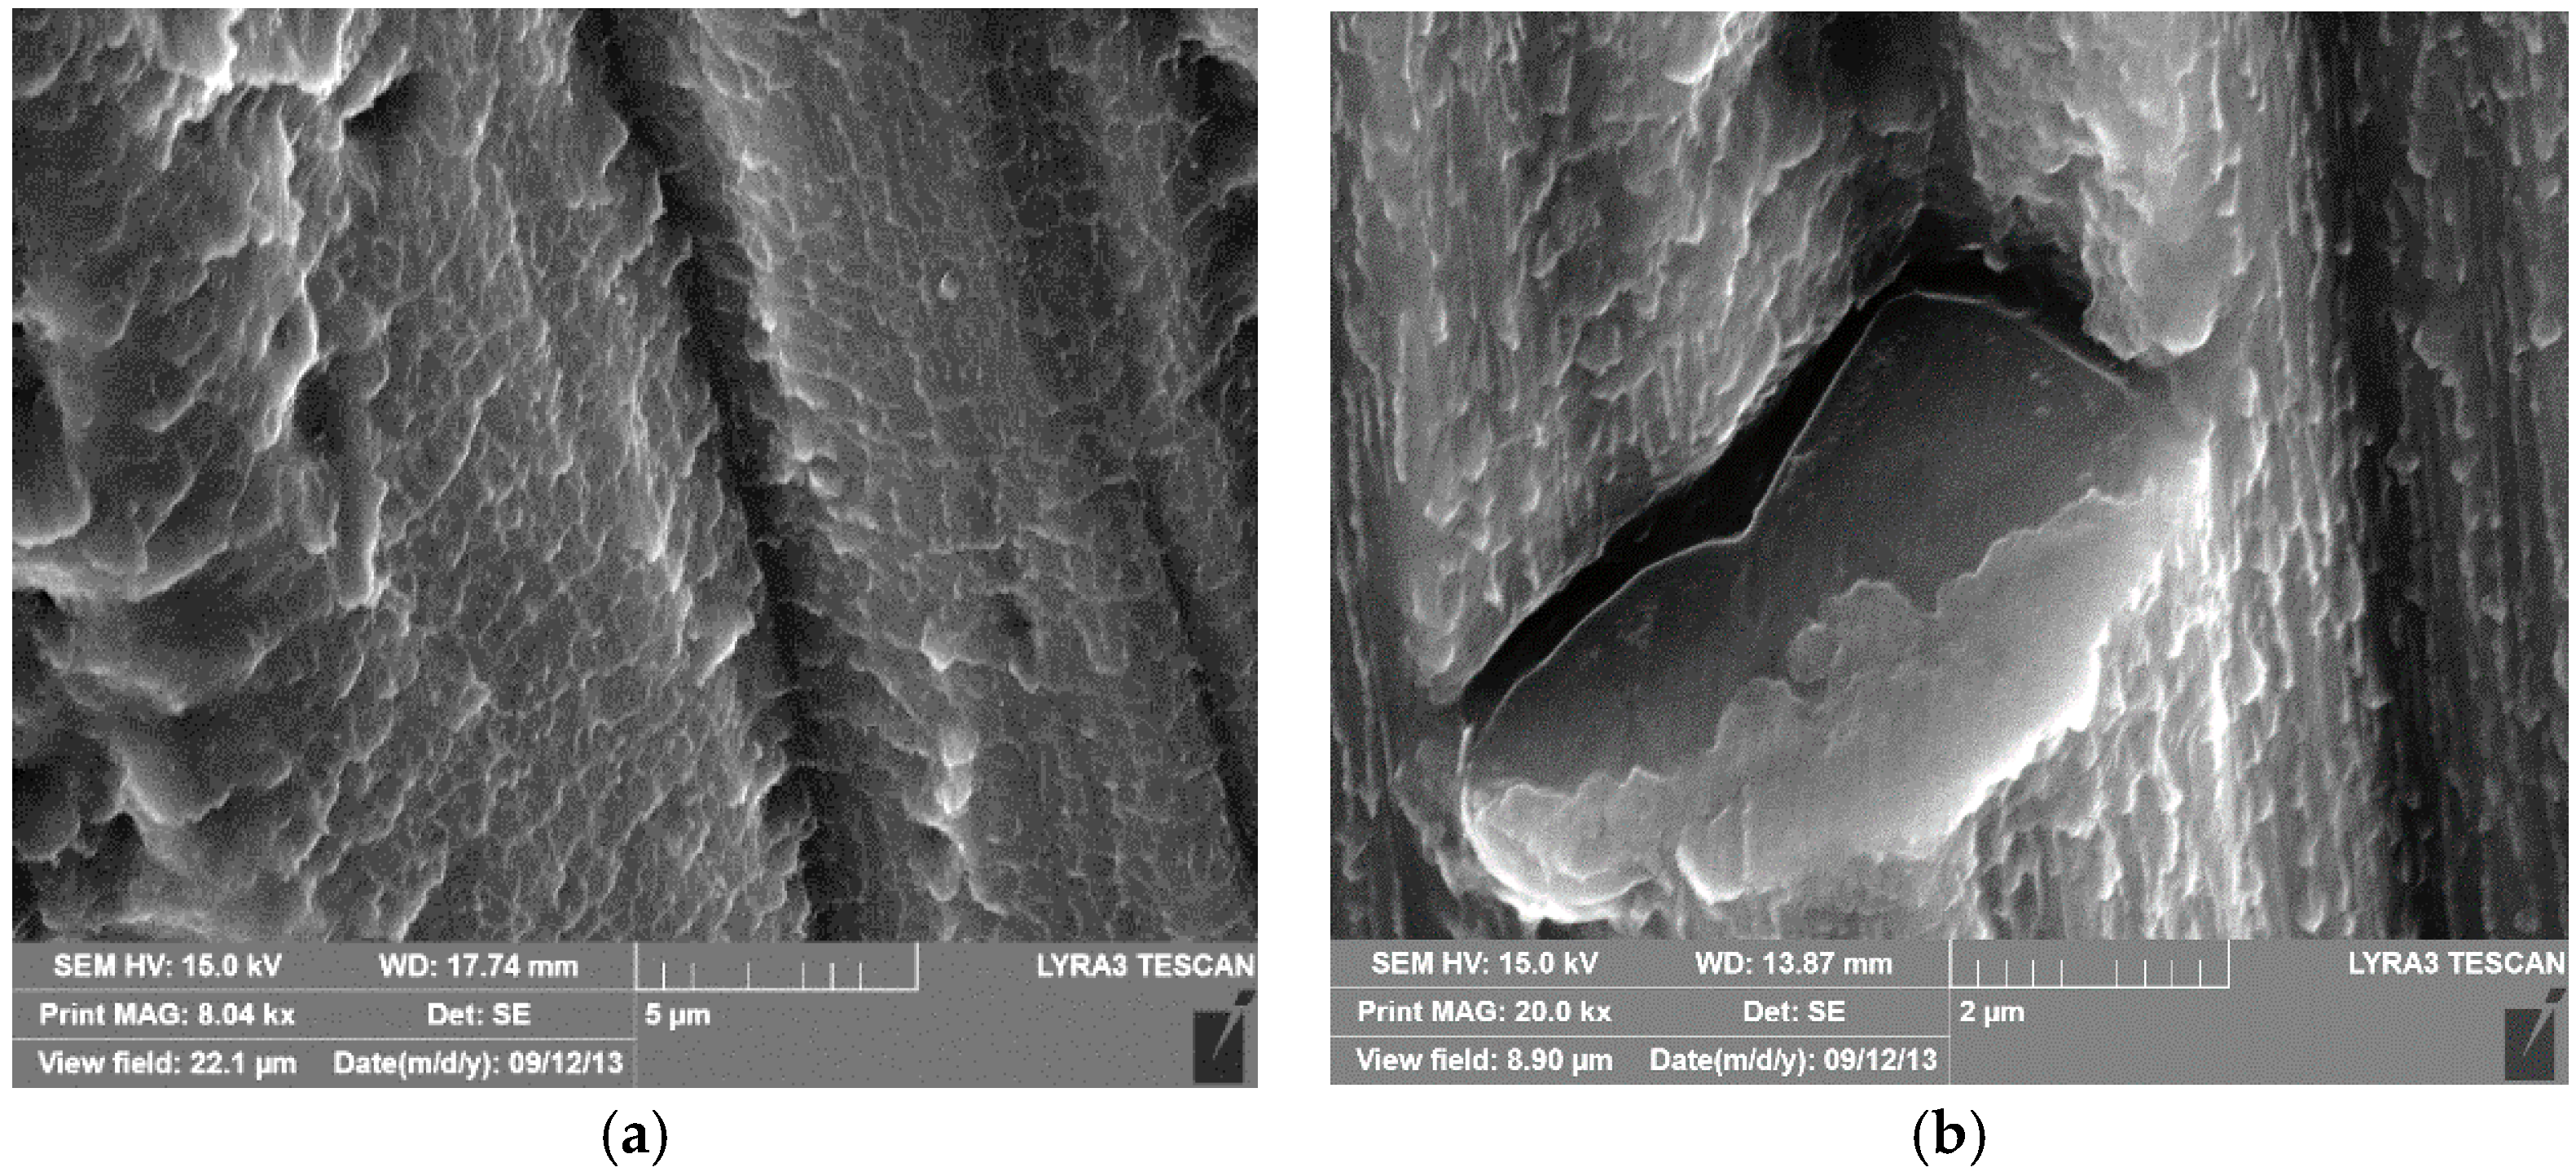
3.3. Fracture Surface Analysis

In all the AW 7075 aluminium alloy specimens, fatigue cracks were initiated on the free surface and, initially, the crack propagated almost perpendicular to the direction of the loading force. After reaching several tenths of micrometers, the orientation of the crack propagation started to change to an angle of 45° up to 60° with respect to the vector of the loading force. This behavior was the best documented on a longitudinal cut of the NP fatigue specimen with an initiated fatigue crack, propagated to approximately half of the cross section (Figure 10).
After the comparison of the close-up views of all types of the fatigue specimens, which were all tested at the stress amplitude level of σa = 185 MPa (Figure 11), it is obvious that the fatigue crack propagation character is common to all of those specimens and the angle of propagation is approximately the same. The difference in the ratio between the surface fractured by the fatigue damage and the final rupture is caused by different times after which the length of the crack shifted the ultrasonic system out of resonance frequency.
When comparing the crack initiation sites on the NP and 8.3 N/100% shot peened specimens, despite the change of the surface character these have the same appearance and no difference in crack propagation in the strengthened surface layer can be observed as well (Figure 12).
On the fracture surface of a specimen treated with 9.6 N intensity and coverage of 650%, the fracture of the surface layer had a different appearance than the rest of the fracture surface. In addition, the orientation of the crack propagation in that surface layer was different, and it seems to be perpendicular to the original surface of the specimen (Figure 13).
After careful observation of the area close to the fatigue crack initiation site, two more, very narrow fatigue cracks initiated below the dominant one were found. Those cracks copy exactly the shape of the dominant crack, which means that the horizontally initiated crack is perpendicular to a vector of the applied force and then the crack propagation deviates towards the specimens’ longitudinal axis (Figure 14a, marked with white arrows). After taking a closer look at the detail of the initiated crack (Figure 14b), it can be seen that the crack has no preferential orientation in relation to the surface dimples (shot peened surface morphology) and the crack propagates through the bottom of the dimples and also through the raised edges of the dimples.
Fatigue fracture of a specimen treated with the 6.9 A intensity with the coverage of 100% reveals more details of the fatigue crack initiation (Figure 15). In Figure 15a, the fatigue fracture character of the area close to the fatigue crack initiation can be seen; the strong influence of the deformation texture on the short cracks’ propagation is obvious. Short fatigue cracks during their propagation had extremely small increments (approximately 0.1 µm), which is best documented in Figure 15b. Around the fatigue crack initiation site of this specimen, a net of secondary cracks surrounding the area of the main crack initiation site can be observed (Figure 16). Those cracks were present only under the initiation site and, according to Figure 17, all of them were created by forking of the main crack. The fracture appearance of the treated surface layer was also slightly different than the inner part of the fatigue fracture surface, as can be seen in Figure 17.
Observation of the fracture surface of the specimen peened with the 14.4 A intensity with coverage of 100% reveals that the net of the secondary cracks under the initiation site is even more prominent (Figure 18). The fracture of the surface layer has also a different character and it is much deeper than in previous treatments (Figure 19a). In addition, in a small number of places it was observed that whole material layers on the surface started to peel off from the specimen due to the applied cyclic loading (Figure 19b).
The fracture surface of a specimen after the most severe shot peening treatment with the intensity of 14.9 A and coverage of 650% also shows a net of secondary cracks under the area of initiation (Figure 20). Again, a deep surface layer had a different fracture character than the rest of the fracture surface (Figure 21a), but the thickness of this layer, of a different appearance, seems not to be as uniform as in previous cases. Whole layers of material peeled off from the surface of the specimen, as can be seen in Figure 21b.
The secondary initiated fatigue crack (Figure 22a) was extremely narrow and had a width of barely 1 μm (Figure 22b). Again, the net of secondary cracks, copying the boundary between the affected surface layer and the core of the material, evolved and resulted in the separation of the treated surface layer from the specimen due to the cyclic loading (Figure 23).
Surface treatment by shot peening affects only the surface layers of material, so fatigue crack propagation in the core of the specimen had completely the same character in all the studied specimens, and the most characteristic figures from all of them were chosen for the best description of the fatigue crack propagation mechanism. During the fatigue crack propagation, the friction between the two fracture surfaces at high frequencies caused the creation of fretting damage on the surfaces (Figure 24a). Those damaged parts of the surface oxidized very quickly (Figure 24b) which resulted in a strong degradation of the fracture surface. Due to this oxidation, it was possible to study the fatigue propagation mechanism mainly on the boundary with the final rupture, where the material was not exposed to such a high number of cycles to create fretting damage. Fatigue cracks propagated by the transcrystalline fracture mechanism of a “band” character, which is caused by the laminar character of the microstructure after extrusion (Figure 25a). Striations, perpendicular to the direction of the fatigue crack growth direction, were present very rarely and their clear observation was possible only on one of the specimens in the crack initiation area (Figure 25b). After a closer investigation of the stable fatigue crack propagation area, it was noticed that the surface was covered with very fine “wrinkles” created by the fracture along precipitates (Figure 26a), and many intermetallic phases present in the material were separated from the matrix (Figure 26b). The surface of the final rupture was characterized by the transcrystalline ductile fracture with coarse and fine dimple morphology. The coarse dimples (Figure 27a) were created by fractures around intermetallic phases and fine dimples around precipitates (Figure 27b).

4. Discussion

Surface treatment by shot peening can significantly improve the fatigue properties of structural materials by the creation of a plastically deformed and grain-refined surface layer. The process of the creation of this layer with superior mechanical properties is characterized by three main mechanisms: work-hardening (increase in the dislocation density); introduction of compressive residual stresses; and grain refinement [1,2,4,5,8,14,15,16,17,18,28].
Fatigue test results of AW 7075 aluminium alloy justify a deeper analysis of the influence of the shot peening intensity and coverage on the fatigue lifetime and fracture surface character. Figure 3 shows the trend of the fatigue life of AW 7075 with respect to the peening parameters. The highest increase of the fatigue strength was achieved with 9.6 N/650% parameters, and further increase of the peening intensity and coverage caused a rapid drop of the fatigue strength even below that of the not-peened material.
The fatigue fracture surface analysis of specimens from AW 7075 aluminium alloy showed that in the process of fatigue crack initiation, the short crack propagation and the direction of the crack propagation are strongly affected by the material’s microstructure. The multiple changes of the crack orientation at the beginning of the fatigue damage process were caused by the deformation texture created during the extrusion process. When a crack hits a deformed row with different crystallographic orientation and slightly different mechanical properties, the crack path changes to the direction with the less resistance to crack propagation. The deviation of the fatigue crack orientation of about 45° up to 60° with respect to the vector of the loading force is probably also related to the deformation texture and the vector of maximal shear stress in the cross section. This behavior was also observed in other work dealing with the fatigue of wrought aluminium alloys, but the reason is still not fully understood [29,30,31,32].
The shot peening treatment of the AW 7075 aluminium alloy with intensity of 8.3 N and coverage of 100% did not result in significant changes in the fatigue crack initiation and propagation processes. The fatigue crack propagation in the surface layer (Figure 12b) had similar character as the NP specimen (Figure 12a) so the increase of the fatigue life was mainly related to the compressive residual stress introduced during the treatment which delayed the fatigue crack initiation. Increasing the peening intensity to 9.6 N and the coverage to 650% created a work hardened surface layer (visible in Figure 6) with a different fatigue crack propagation character (Figure 13b) than for the core of the material, which corresponds to a surface layer with a higher resistance to fatigue crack propagation. This treatment also resulted in increasing the number of initiated fatigue cracks; however, this was not caused by the reduced surface integrity and creation of micro cracks after the peening process, because no such damage was observed before fatigue loading (Figure 6). The impact dimples, created on the peened surface (an increase of the surface roughness visible in Table 1) were, in fact, small surface notches with very similar geometry. Since the fatigue crack initiation in the smooth specimens represents more than 90% of all the loading cycles necessary for its fracture, multiple fatigue-crack initiation means that those cracks had to be initiated after a similar number of loading cycles. The reason is that dimples after the shot peening treatment served as fatigue crack initiation points with very similar stress conditions (defined by the similar dimple geometry, which depends on the peening media shape and size) for fatigue crack initiation, so multiple fatigue cracks were initiated at a very similar number of cycles. Due to the continuous cyclic loading, one of the cracks starts to become dominant and predetermine the specimen’s fatigue lifetime. The initiated secondary fatigue cracks were very narrow (Figure 24) due to the compressive residual stress under the surface, which was closing those cracks in the early stages. The fact that even after a significant increase of the surface roughness, the fatigue life increased, means that the compressive residual stress field and grain refinement were still able to delay crack initiation and partially slow down crack propagation in the first stage of fatigue damage.
All the higher peening intensities and coverages had a strong negative effect on the fatigue life (Figure 3), which can be explained by the creation of micro cracks in the surface layer and peeling-off material from the specimen’s surface (Figure 7, Figure 8 and Figure 9). Further impact of the peening media, after exhaustion of the material’s plastic deformation ability, caused crack creation and delamination of the surface layer, because the material was not able to accumulate more energy and this energy was used for the creation of free surfaces. Again, the difference in the fatigue fracture character in the surface layers was observed, what is a result of intensive surface hardening, with an almost complete loss of the material’s ductility (Figure 19a and Figure 21a). The treatments with higher peening parameters also increased the number of initiated fatigue cracks and the non-uniform appearance of the surface layer with different fracture characteristics was observed due to the layers of material completely peeled off from the surface of the loaded specimen.
In previous work [2], the creation of micro cracks in the surface layer after severe shot peening of a low-alloyed steel was also observed; however, a positive influence of the treatment on the fatigue lifetime was still recorded. This means that even when some cracks on the surfaces are created, the strengthened layer under their tip can restrain their propagation. Thus, it does not necessarily mean that every time the peening treatment results in creation of micro cracks on the surface, the parameters used have to be considered as too extensive and the surface as overpeened. However, the peeling off of large parts of the strengthened surface layer as in Figure 8 and Figure 9 results in non-uniformity of the layer and the process parameters could be considered as too severe. On the other hand, the ductility of the core material plays a role in the fatigue crack propagation process, when the more ductile material can still retard crack growth or stop the crack due to the absorbtion of the energy necessary for crack growth introduced by the cyclic loading.

5. Conclusions

The premature fatigue fracture of a shot peened component can be caused by using unnecessarily severe treatment parameters. This cannot just be a result of using the unoptimized surface parameters, but could also be caused by process inhomogeneity, or when the shot peening is performed on a component with a complicated shape where some parts of the surface are exposed to the peening process for a longer time or at different angles.
Increased surface roughness and multiple fatigue crack initiation on the peened surface certainly do not mean that the peening process was performed wrongly, and uniformity and consistency of the strengthened surface layer in critical places have to be evaluated as criteria for proper surface quality. The presence of a crack on the AW 7075 aluminium alloy surface after shot peening means that unnecessarily extensive shot peening parameters were used, and this treatment will not have a beneficial effect on the fatigue life of the peened component.

Acknowledgments

This research was supported by project of SK/RU International Technical and Scientific Cooperation no. 0393-2016, by project APVV 14-0284, projects VEGA Nos.: 1/0045/17 and 1/0029/18, project CEITEC 2020 (LQ1601) and IPMinfra (LM2015069).

Author Contributions

Libor Trško and Otakar Bokůvka conceived and designed the experiments and wrote the paper. Stanislava Fintová performed the fracture-surface analysis, František Nový analyzed the fracture-surface data and evaluated the fracture mechanisms. Michal Jambor with Zuzana Florková and Monika Oravcová manufactured the fatigue-test specimens and performed the ultrasonic fatigue tests. Zuzana Florková and Filip Pastorek performed the surface roughness analysis and surface-layer documentation and evaluation.

Conflicts of Interest

The authors declare no conflict of interest.

References

  1. Baiker, S. Shot Peening: A Dynamic Application and Its Future, 3rd ed.; Metal Finishing News: Wetzikon, Switzerland, 2012. [Google Scholar]
  2. Trško, L.; Bokuvka, O.; Novy, F.; Guagliano, M. Effect of severe shot peening on ultra-high-cycle fatigue of a low-alloy steel. Mater. Des. 2014, 57, 103–113. [Google Scholar] [CrossRef]
  3. Walker, J.; Thomas, D.; Gao, Y. Effects of shot peening and pre-strain on the fatigue life of dual phase martensitic and Bainitic steels. J. Manuf. Process. 2017, 26, 419–424. [Google Scholar] [CrossRef]
  4. Zhang, J.; Li, W.; Wang, H.; Song, Q.; Lu, L.; Wang, W.; Liu, Z. A comparison of the effects of traditional shot peening and micro-shot peening on the scuffing resistance of carburized and quenched gear steel. Wear 2016, 368, 253–257. [Google Scholar] [CrossRef]
  5. Trško, L.; Guagliano, M.; Bokůvka, O.; Nový, F.; Jambor, M.; Florková, Z. Influence of severe shot peening on the surface state and ultra-high-cycle fatigue behavior of an aw 7075 aluminum alloy. J. Mater. Eng. Perform. 2017, 26, 2784–2797. [Google Scholar] [CrossRef]
  6. González, J.; Bagherifard, S.; Guagliano, M.; Fernández Pariente, I. Influence of different shot peening treatments on surface state and fatigue behaviour of al 6063 alloy. Eng. Fract. Mech. 2017, 185, 72–81. [Google Scholar] [CrossRef]
  7. Barry, N.; Hainsworth, S.; Fitzpatrick, M. Effect of shot peening on the fatigue behaviour of cast magnesium A8. Mater. Sci. Eng. A 2009, 507, 50–57. [Google Scholar] [CrossRef]
  8. Liu, W.; Wu, G.; Zhai, C.; Ding, W.; Korsunsky, A.M. Grain refinement and fatigue strengthening mechanisms in as-extruded Mg-6Zn-0.5Zr and Mg-10Gd-3Y-0.5Zr magnesium alloys by shot peening. Int. J. Plast. 2013, 49, 16–35. [Google Scholar] [CrossRef]
  9. Yao, C.; Wu, D.; Ma, L.; Tan, L.; Zhou, Z.; Zhang, J. Surface integrity evolution and fatigue evaluation after milling mode, shot-peening and polishing mode for TB6 titanium alloy. Appl. Surf. Sci. 2016, 387, 1257–1264. [Google Scholar] [CrossRef]
  10. Shaw, L.; Tian, J.; Ortiz, A.; Dai, K.; Villegas, J.; Liaw, P.; Ren, R.; Klarstrorn, D. A direct comparison in the fatigue resistance enhanced by surface severe plastic deformation and shot peening in a C-2000 superalloy. Mater. Sci. Eng. A 2010, 527, 986–994. [Google Scholar] [CrossRef]
  11. He, B.; Soady, K.; Mellor, B.; Harrison, G.; Reed, P. Fatigue crack growth behaviour in the LCF regime in a shot peened steam turbine blade material. Int. J. Fatigue 2016, 82, 280–291. [Google Scholar] [CrossRef]
  12. Ferreira, N.; Ferreira, J.A.M.; Antunes, P.V.; Costa, J.D.; Capela, C. Fatigue crack propagation in shot peened al 7475-t7351 alloy specimens. Procedia Eng. 2016, 160, 254–261. [Google Scholar] [CrossRef]
  13. Trsko, L.; Guagliano, M.; Lukac, P.; Bokuvka, O.; Novy, F. Effects of severe shot peening on the surface state of AW 7075 Al alloy. Kovove Mater. Met. Mater. 2015, 53, 239–243. [Google Scholar] [CrossRef]
  14. Bagherifard, S.; Slawik, S.; Fernandez-Pariente, I.; Pauly, C.; Mucklich, F.; Guagliano, M. Nanoscale surface modification of AISI 316L stainless steel by severe shot peening. Mater. Des. 2016, 102, 68–77. [Google Scholar] [CrossRef]
  15. Unal, O.; Varol, R. Surface severe plastic deformation of AISI 304 via conventional shot peening, severe shot peening and repeening. Appl. Surf. Sci. 2015, 351, 289–295. [Google Scholar] [CrossRef]
  16. Hassani-Gangaraj, S.; Cho, K.; Voigt, H.; Guagliano, M.; Schuh, C. Experimental assessment and simulation of surface nanocrystallization by severe shot peening. Acta Mater. 2015, 97, 105–115. [Google Scholar] [CrossRef]
  17. Maleki, E. Modeling of severe shot peening effects to obtain nanocrystalline surface on cast iron using artificial neural network. Mater. Today Proc. 2016, 3, 2197–2206. [Google Scholar] [CrossRef]
  18. Mikova, K.; Bagherifard, S.; Bokuvka, O.; Guagliano, M.; Trsko, L. Fatigue behavior of X70 microalloyed steel after severe shot peening. Int. J. Fatigue 2013, 55, 33–42. [Google Scholar] [CrossRef]
  19. Liu, W.; Dong, J.; Zhang, P.; Zhai, C.; Ding, W. Effect of shot peening on surface characteristics and fatigue properties of T5-treated ZK60 alloy. Mater. Trans. 2009, 50, 791–798. [Google Scholar] [CrossRef]
  20. Cammett, J. Are you peening too much? Shot Peener Mag. 2014, 28, 10–14. [Google Scholar]
  21. Higounenc, O. Correlation of shot peening parameters to surface characteristic. In Proceedings of the 9th International Conference for Shot Peening, Paris, France, 6–9 September 2005; Niku-Lari, A., Schulze, V., Eds.; IITT-International: Paris, France, 2005; pp. 28–35. [Google Scholar]
  22. Polmear, I. Light Alloys, 4th ed.; Butterworth-Heinemann: Oxford, UK, 2006; ISBN 978-0-75-066371-7. [Google Scholar]
  23. Davis, J.R.; Committee, A.I.H. ASM Handbook Volume 2: Properties and Selection: Nonferrous Alloys and Special-Purpose Materials; ASM International: Almere, The Netherlands, 1998; ISBN 978-0-87170-378-1. [Google Scholar]
  24. Ringer, S.P.; Raviprasad, K. Developments in age-hardenable aluminium alloys and rational design of microstructure. Mater. Sci. Forum 2000, 24, 59–94. [Google Scholar]
  25. Maloney, S.K.; Hono, K.; Polmear, I.J.; Ringer, S.P. The chemistry of precipitates in an aged Al-2.1Zn-1.7Mg at % alloy. Scr. Mater. 1999, 41, 1031–1038. [Google Scholar] [CrossRef]
  26. Bokuvka, O.; Nicoletto, G.; Guagliano, M.; Kunz, L.; Palcek, P.; Novy, F.; Chalupova, M. Fatigue of Materials at Low and High Frequency Loading, 2nd ed.; University of Zilina: Zilina, Slovakia, 2015; ISBN 978-80-554-0857-6. [Google Scholar]
  27. Zapletal, J.; Věchet, S.; Kohout, J.; Liskutin, P. Fatigue lifetime of 7075 aluminium alloy from ultimate tensile strength to permanent fatigue limit. Commun. Sci. Lett. Univ. Žilina 2009, 11, 17–21. [Google Scholar]
  28. Mahmoudi, A.; Ghasemi, A.; Farrahi, G.; Sherafatnia, K. A comprehensive experimental and numerical study on redistribution of residual stresses by shot peening. Mater. Des. 2016, 90, 478–487. [Google Scholar] [CrossRef]
  29. Srivatsan, T.; Anand, S.; Sriram, S.; Vasudevan, V. The high-cycle fatigue and fracture behavior of aluminum alloy 7055. Mater. Sci. Eng. A 2000, 281, 292–304. [Google Scholar] [CrossRef]
  30. Srivatsan, T. An investigation of the cyclic fatigue and fracture behavior of aluminum alloy 7055. Mater. Des. 2002, 23, 141–151. [Google Scholar] [CrossRef]
  31. Jogi, B.; Brahmankara, P.; Nanda, V.; Prasad, R. Some studies on fatigue crack growth rate of aluminum alloy 6061. J. Mater. Process. Technol. 2008, 201, 380–384. [Google Scholar] [CrossRef]
  32. Xue, Y.; McDowell, D.L.; Horstemeyer, M.F.; Dale, M.H.; Jordon, J.B. Microstructure-based multistage fatigue modeling of aluminum alloy 7075-T651. Eng. Fract. Mech. 2007, 74, 2810–2823. [Google Scholar] [CrossRef]
Figure 1. Microstructure of AW 7075 aluminium alloy—(a) longitudinal cut; and (b) cross cut.
Metals 08 00111 g001
Figure 2. Geometry and dimensions of AW 7075 aluminium alloy specimens for fatigue tests. Dimensions are given in mm.
Metals 08 00111 g002
Figure 3. Dependence of fatigue life on the shot peening intensity and coverage of AW7075 aluminium alloy.
Metals 08 00111 g003
Figure 4. Surface layer of the not-peened (NP) specimen with shallow deformed layer after machining (a); in detail (b). Scanning electron microscope (SEM).
Metals 08 00111 g004
Figure 5. Surface layer of the 8.3 N/100% specimen with uniform strengthened layer after shot peening (a); in detail (b). SEM. Reproduced with permission from Trško, L.; Guagliano, M.; Bokůvka, O.; Nový, F.; Jambor, M.; Florková, Z. J. Mater. Eng. Perform. Published by Springer Nature, 2017 [5].
Metals 08 00111 g005
Figure 6. Surface layer of the 9.6 N/650% specimen with uniform strengthened layer after shot peening (a); in detail (b); SEM.
Metals 08 00111 g006
Figure 7. Surface layer of the 6.9 A/100% specimen with deep strengthened layer after shot peening with surface micro cracks (a); in detail (b); SEM.
Metals 08 00111 g007
Figure 8. Surface layer of the 14.4 A/100% specimen with deep strengthened layer after shot peening with surface micro cracks (a); in detail (b); SEM.
Metals 08 00111 g008
Figure 9. Surface layer of the 14.9 A/650% specimen with deep strengthened layer after shot peening with surface micro cracks and small layers peeling off (a); in detail (b); SEM.
Metals 08 00111 g009
Figure 10. Character of the fatigue crack initiation and propagation in NP fatigue test specimen (σa = 176 MPa, Nf = 6.8 × 10⁷ cycles), longitudinal cut. Reproduced with permission from Trško, L.; Guagliano, M.; Bokůvka, O.; Nový, F.; Jambor, M.; Florková, Z. J. Mater. Eng. Perform. Published by Springer Nature, 2017 [5].
Metals 08 00111 g010
Figure 11. Macro views of fatigue fractures of specimens loaded at stress level σa = 185 MPa, SEM. (a) NP, σa = 185 MPa, Nf = 2.6 × 10⁷ cycles; (b) 8.3 N/100%, σa = 185 MPa, Nf = 1.0 × 10⁸ cycles; (c) 9.6 N/650%, σa = 185 MPa, Nf = 1.6 × 10⁸ cycles; (d) 6.9 A/100%, σa = 185 MPa, Nf = 2.4 × 10⁷ cycles; (e) 14.4 A/100%, σa = 185 MPa, Nf = 4.9 × 10⁶ cycles; (f ) 14.9 A/650%, σa = 185 MPa, Nf = 7.3 × 10⁶ cycles.
Metals 08 00111 g011
Figure 12. Fatigue crack initiation sites of fatigue test specimens: (a) NP , σa = 185 MPa, Nf = 2.6 × 10⁷ cycles; (b) 8.3N/100%, σa = 185 MPa, Nf = 1.0 × 10⁸ cycles, SEM.
Metals 08 00111 g012
Figure 13. Fatigue crack initiation site of 9.6 N/650% shot peened specimen (a); and different character of fatigue crack propagation in the strengthened surface layer—the crack path with respect to the specimen’s surface is marked with arrows (b); σa = 185 MPa, Nf = 1.6 × 10⁸ cycles, SEM. Reproduced with permission from Trško, L.; Guagliano, M.; Bokůvka, O.; Nový, F.; Jambor, M.; Florková, Z. J. Mater. Eng. Perform. Published by Springer Nature, 2017 [5].
Metals 08 00111 g013
Figure 14. Multiple initiated fatigue cracks (a); and in detail (b); specimen treated with 9.6 N/650% parameters, σa = 185 MPa, Nf = 2.5 × 10⁷ cycles, SEM. Reproduced with permission from Trško, L.; Guagliano, M.; Bokůvka, O.; Nový, F.; Jambor, M.; Florková, Z. J. Mater. Eng. Perform. Published by Springer Nature, 2017 [5].
Metals 08 00111 g014
Figure 15. Fatigue crack propagation character near the fatigue crack initiation site (a); and extremely small propagation increments of fatigue crack (b); specimen treated with 6.9 A/100% parameters, σa = 185 MPa, Nf = 2.4 × 10⁷ cycles, SEM.
Metals 08 00111 g015
Figure 16. Net of secondary cracks surrounding the area under the fatigue crack initiation site (a); in detail (b); specimen treated with 6.9 A/100% parameters, σa = 185 MPa, Nf = 2.4 × 10⁷ cycles, SEM.
Metals 08 00111 g016
Figure 17. Different appearance of the strengthened surface layer on the fracture surface (a); and forking of the main crack in the area of fatigue crack initiation (b); specimen treated with 6.9 A/100% parameters, σa = 185 MPa, Nf = 2.4 × 10⁷ cycles, SEM.
Metals 08 00111 g017
Figure 18. Net of secondary cracks under the fatigue crack initiation site (a); in detail (b); specimen treated with 14.4 A/100% parameters, σa = 185 MPa, Nf = 4.9 × 10⁶ cycles, SEM.
Metals 08 00111 g018
Figure 19. Different character of crack propagation in the strengthened surface layer (a); and peeling-off surface layer (b); specimen treated with 14.4 A/100% parameters, σa = 185 MPa, Nf = 4.9 × 10⁶ cycles, SEM.
Metals 08 00111 g019
Figure 20. Net of secondary cracks under the fatigue crack initiation site (a); in detail (b); specimen treated with 14.9 A/650% parameters, σa = 185 MPa, Nf = 7.3 × 10⁶ cycles, SEM.
Metals 08 00111 g020
Figure 21. Different character of crack propagation in the strengthened surface layer (a); and peeling-off surface layer (b); specimen treated with 14.9 A/650% parameters, σa = 185 MPa, Nf = 7.3 × 10⁶ cycles, SEM. Reproduced with permission from Trško, L.; Guagliano, M.; Bokůvka, O.; Nový, F.; Jambor, M.; Florková, Z. J. Mater. Eng. Perform. Published by Springer Nature, 2017 [5].
Metals 08 00111 g021
Figure 22. Multiple initiated fatigue cracks (a); and in detail (b); specimen treated with 14.9 A/650% parameters, σa = 185 MPa, Nf = 7.3 × 10⁶ cycles, SEM.
Metals 08 00111 g022
Figure 23. Peeling-off surface layer on the macro view (a); and in detail (b); specimen treated with 14.9 A/650% parameters, σa = 185 MPa, Nf = 7.3 × 10⁶ cycles, SEM.
Metals 08 00111 g023
Figure 24. Surface layer damaged by fretting (a); and detail of the oxide created on the damaged surface (b); specimen treated with 6.9 A/100% parameters, σa = 185 MPa, Nf = 2.4 × 10⁷ cycles, SEM.
Metals 08 00111 g024
Figure 25. Character of the fatigue-fracture surface (a) 6.9 A/100%, σa = 185 MPa, Nf = 2.4 × 10⁷ cycles; and detail of the striations rarely found on the fracture surface; (b) 9.6 N/650% parameters, σa = 185 MPa, Nf = 1.6 × 10⁸ cycles; SEM.
Metals 08 00111 g025
Figure 26. “Wrinkly” character of the fracture surface created by fracture propagation along precipitates (a) 8.3 N/100%, σa = 185 MPa, Nf = 1.0 × 10⁸ cycles; and separation of the intermetallic phases from the matrix; (b) NP, σa = 185 MPa, Nf = 2.6 × 10⁷ cycles; SEM.
Metals 08 00111 g026
Figure 27. The final fracture, a transcrystalline ductile fracture with coarse dimple morphology (a) NP, σa = 185 MPa, Nf = 2.6 × 10⁷ cycles; and fine dimple morphology; (b) 8.3 N/100%, σa = 185 MPa, Nf = 1.0 × 10⁸ cycles.
Metals 08 00111 g027
Table 1. Mechanical properties of AW 7075 aluminium alloy. Reproduced with permission from Trško, L.; Guagliano, M.; Bokůvka, O.; Nový, F.; Jambor, M.; Florková, Z. J. Mater. Eng. Perform. Published by Springer Nature, 2017 [5].
Ultimate Tensile Strength UTS (MPa)Ductility A (%)Reduction of Area Z (%)Hardness HV10
6314.915.7175
Table 2. Parameters of performed shot peening treatments and resulting surface roughness.
LabelShot TypeAlmen Intensity (0.001 inch)Coverage (%)Roughness Ra (μm)Roughness Rz (μm)
NP---0.1250.913
SP1CEZ 1008.3 N1002.61414.304
SP2CEZ 1009.6 N6503.49320.767
SP3S1106.9 A1003.84920.712
SP4S17014.4 A1007.55334.217
SP5S17014.9 A6507.97135.793
Table 3. Depth of strengthened surface layer after various surface finishing.
Surface FinishingApproximate Depth of Affected Layer (µm)
NP15
8.3 N/100%30
9.6 N/650%30
6.9 A/100%100
14.4 A/100%100
14.9 A/650%200

