Article

The Influence of Cu Addition on Dispersoid Formation and Mechanical Properties of Al-Mn-Mg 3004 Alloy

Department of Applied Science, University of Quebec at Chicoutimi, Saguenay, QC G7H 2B1, Canada
*
Author to whom correspondence should be addressed.
Metals 2018, 8(3), 155; https://doi.org/10.3390/met8030155
Submission received: 30 January 2018 / Revised: 23 February 2018 / Accepted: 27 February 2018 / Published: 2 March 2018

Abstract

:
The effect of Cu addition on dispersoid precipitation, mechanical properties and creep resistance was investigated in an Al-Mn-Mg 3004 alloy. The addition of Cu promoted dispersoid precipitation by increasing the number density and decreasing the size of dispersoids. Metastable β′-Mg2Si and Q-AlCuMgSi precipitates were observed during the heating process and both could provide favorable nucleation sites for dispersoid precipitation. The addition of Cu improved the thermal stability of dispersoids during a long-term thermal holding at 350 °C for 500 h. Results of mechanical testing show that the addition of Cu remarkably improved the hardness at room temperature, as well as the yield strength and creep resistance at 300 °C, which was mainly attributed to dispersoid strengthening and Cu solid solution strengthening. The yield strength contribution at 300 °C was quantitatively evaluated based on the dispersoid, solid solution and matrix contributions. It was confirmed that dispersoid strengthening is the main strengthening mechanism in the experimental alloys.

1. Introduction

Al-Mn-Mg AA3xxx alloys are widely used in the automobile, packaging and architecture industries. Traditionally, AA3xxx alloys are strengthened by work hardening and are classified as non-heat-treatable alloys. However, by applying appropriate heat treatment [1,2,3,4], a number of α-Al(Mn,Fe)Si dispersoids could be precipitated in AA3xxx alloys. The α-Al(Mn,Fe)Si dispersoids are partially coherent with the aluminum matrix [1,5]. Recently, the strengthening effect of α-Al(Mn,Fe)Si dispersoids at ambient and elevated temperatures has been reported [1,6,7,8]. Moreover, the α-Al(Mn,Fe)Si dispersoids have been proven to be thermally stable at 300 °C [6], which is especially attractive to materials for elevated temperature applications.
To improve the room- and elevated-temperature properties of AA3xxx alloys, a number of studies have been conducted to investigate the influences of chemical compositions on the precipitation behaviour of α-Al(Mn,Fe)Si dispersoids in AA3xxx [8,9,10,11,12,13]. In our previous work [13], the effects of Mg and Si on α-Al(MnFe)Si dispersoid precipitation, elevated-temperature strength and creep resistance in AA3xxx alloys were systematically studied. The best combination of yield strength and creep resistance at 300 °C was obtained by the alloy containing 1.0 wt. % Mg and 0.25 wt. % Si with the maximum volume fraction of dispersoids. It was found that Mg would affect the formation of α-Al(Mn,Fe)Si dispersoids by forming metastable Mg2Si [7,10,11]. Metastable Mg2Si precipitated during the heating process and promoted the nucleation of α-Al(Mn,Fe)Si dispersoids [14]. The Mn addition could enhance the precipitation of α-Al(Mn,Fe)Si dispersoids and improve the yield strength [8]. Fe decreased the solubility of Mn and accelerated the precipitation rate of α-Al(Mn,Fe)Si dispersoids [3]. The yield strength and creep resistance at elevated temperatures could be improved with an optimized content of Fe [9]. Si increased the volume fraction of α-Al(Mn,Fe)Si dispersoids [8] while the size of them decreased [13]. With the addition of Mo, the size of dispersoids became finer and the volume fraction of dispersoids increased [12]. Therefore, the yield strength and creep resistance at elevated temperatures were remarkable improved by the Mo addition.
Cu is an important alloying element of AA7xxx alloys (Al-Zn-Mg) and AA6xxx alloys (Al-Mg-Si). By the addition of Cu, and with aging at 100–200 °C, nano-scale metastable Mg(Zn,Al,Cu)2 in 7xxx alloys [15] and Q-AlCuMgSi (Q phase) in 6xxx alloys [16,17] precipitate in the aluminum matrix. Metastable Mg(Zn,Al,Cu)2 and Q-AlCuMgSi possess a lower coarsening rate than metastable MgZn2 and Mg2Si [15,18,19]. However, the influence of Cu on the precipitation and coarsening behaviour of α-Al(Mn,Fe)Si dispersoids has never been reported before. In addition, the effect of Cu on elevated-temperature properties of AA3xxx alloys is rarely found in the literature.
The aim of the present work is to investigate the effect of Cu on the precipitation and coarsening behaviour of dispersoids, as well as on the mechanical properties at ambient and elevated temperatures of an Al-Mn-Mg 3004 alloy.

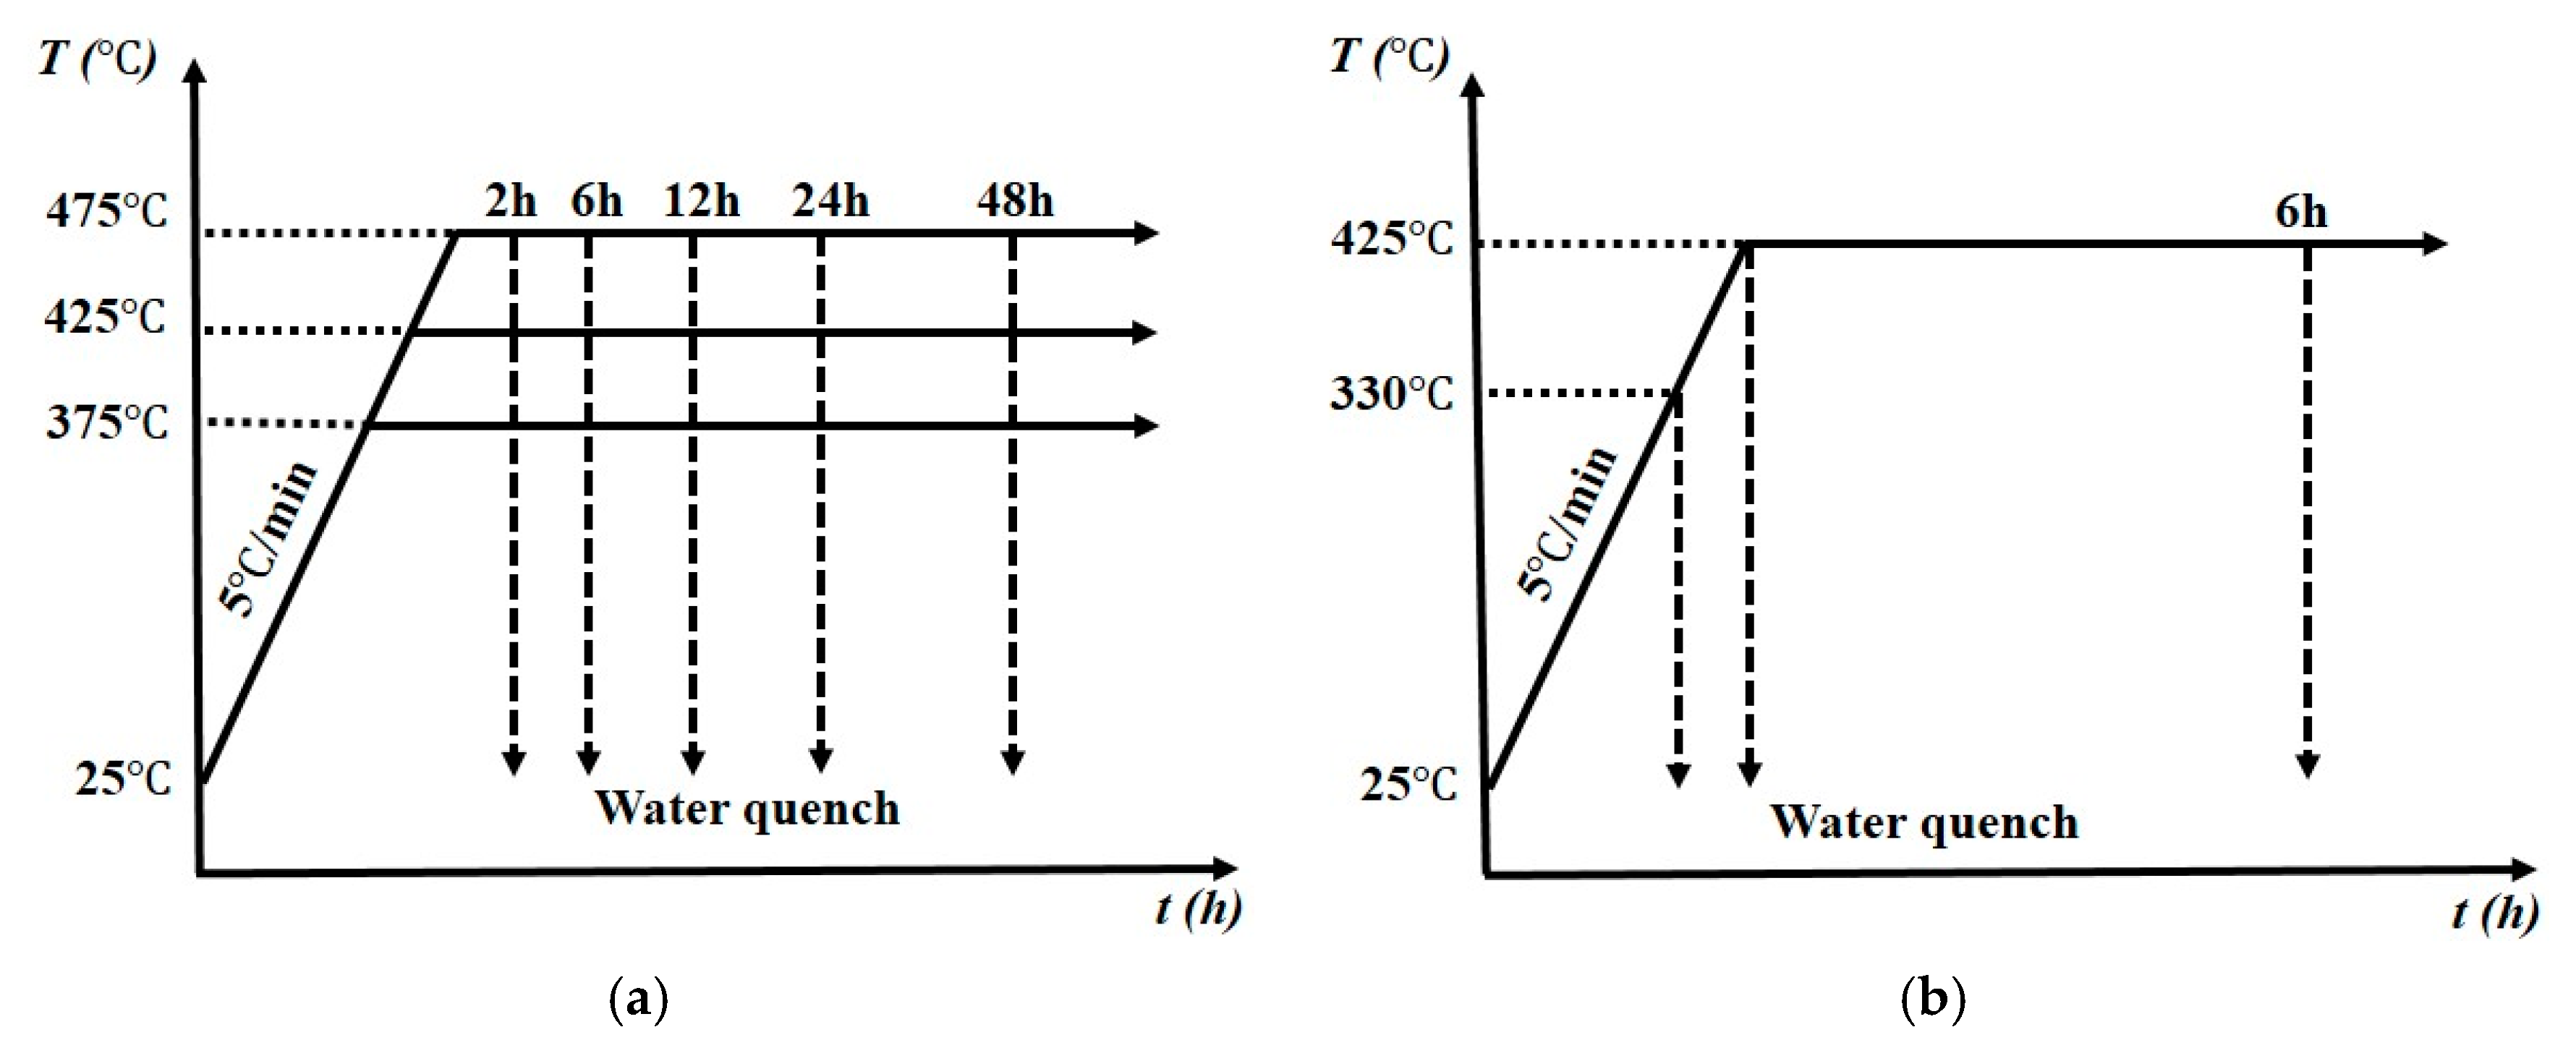
2. Materials and Methods

Four experimental alloys with different levels of Cu content were designed in the present study. The base alloy contained 1.25% Mn, 0.5% Fe, 1.0% Mg, 0.25% Si and without Cu. The other three alloys (DU35, DU75 and DU120) contained 0.37%, 0.72% and 1.23% Cu, respectively. The experimental alloys were prepared with commercially pure Al (99.7%), pure Mg (99.9%), and Al-25% Mn, Al-25% Fe, Al-50% Si and Al-50% Cu master alloys. The chemical compositions of experimental alloys analyzed by an optical emission spectrometer (Thermo Scientific, Waltham, MA, USA) are listed in Table 1 (all of the alloy compositions are in wt. % in the present paper unless indicated otherwise). For each batch, approximately 3 kg of materials were melted in an electrical resistance furnace (Pyradia, Saint-Hubert, QC, Canada). The melt was maintained at 750 °C for 30 min and degassed for 15 min. It was then poured into a preheated steel permanent mold that was preheated at 250 °C. The dimension of cast ingots was 30 mm × 40 mm × 80 mm.
Two different heat treatments were used. For the precipitation of dispersoids, the samples were heated with a heating rate 5 °C/min from room temperature to 375 °C, 425 °C and 475 °C respectively, and then held at those temperature for 2 h to 48 h, followed by water quenching to room temperature, as shown in Figure 1a. To study the dispersoid nucleation process, the samples were heated from room temperature to 330 °C, 425 °C, or held at 425 °C for 6 h, followed by water quench to freeze the microstructure (Figure 1b).
The electrical conductivity was measured by a Sigmascope SMP10 (Fischer, Sindelfingen, Germany) unit. 5 measurements were conducted for each sample. The Vicker hardness was evaluated by a NG-1000 CCD microhardness (NextGen Material Testing, Vancouver, BC, Canada test unit with a load of 200 g and 20 s dwelling time. At least 10 measurements were performed to calculate the average value of each sample. Compression yield strength tests were conducted at 300 °C with a strain rate of 0.001 s−1 using a Gleeble 3800 thermomechanical testing (Dynamic Systems, New York, NY, USA) unit. Cylindrical samples with a 15 mm length and 10 mm diameter were used for the compression yield strength test. The results were obtained from the average value of three samples. Compression creep tests were conducted at 300 °C for 96 h with a constant load of 58 MPa. The dimension of the creep test samples was the same as for the Gleeble samples.
Optical microscopy (Nikon, Tokyo, Japan) was used to observe the intermetallic particles and the distribution of dispersoids. The polished samples were etched by 0.5% HF for 20 s. Image analysis software (Clemex PE 4.0, Clemex Technologies, Longueuil, QC, Canada) was used to quantify the volume fractions of the intermetallic particles, the dispersoid zones and the dispersoid free zones (DFZ). A transmission electron microscope (TEM, JEM-2100, JEOL, Tokyo, Japan), equipped with an energy dispersive X-ray spectroscopy (EDS), was used to observe the dispersoids in detail. TEM foils were prepared by a twin-jet machine with a solution of 25% nitric acid in methanol at −20 to −30 °C. Electron energy loss spectroscopy (EELS) attached to the TEM was used to measure the thickness of the TEM specimens. The TEM bright field images were recorded near <100> zone axis and {200} planes in two–beam diffraction conditions. The size and number density of dispersoids were quantified by image analysis of TEM images. The calculation of the dispersoid volume fraction was based on the following equation [3]:
V v = A A K D ¯ K D ¯ + t ( 1 A D F Z )
where AA is the volume fraction of dispersoids and D ¯ is the average equivalent diameter of the dispersoids in the TEM images; ADFZ is the volume fraction of the dispersoid free zone; t is the TEM foil thickness; and K is the average shape factor of the dispersoids.

3. Results and Discussion

3.1. Influence of Cu on Microstructure

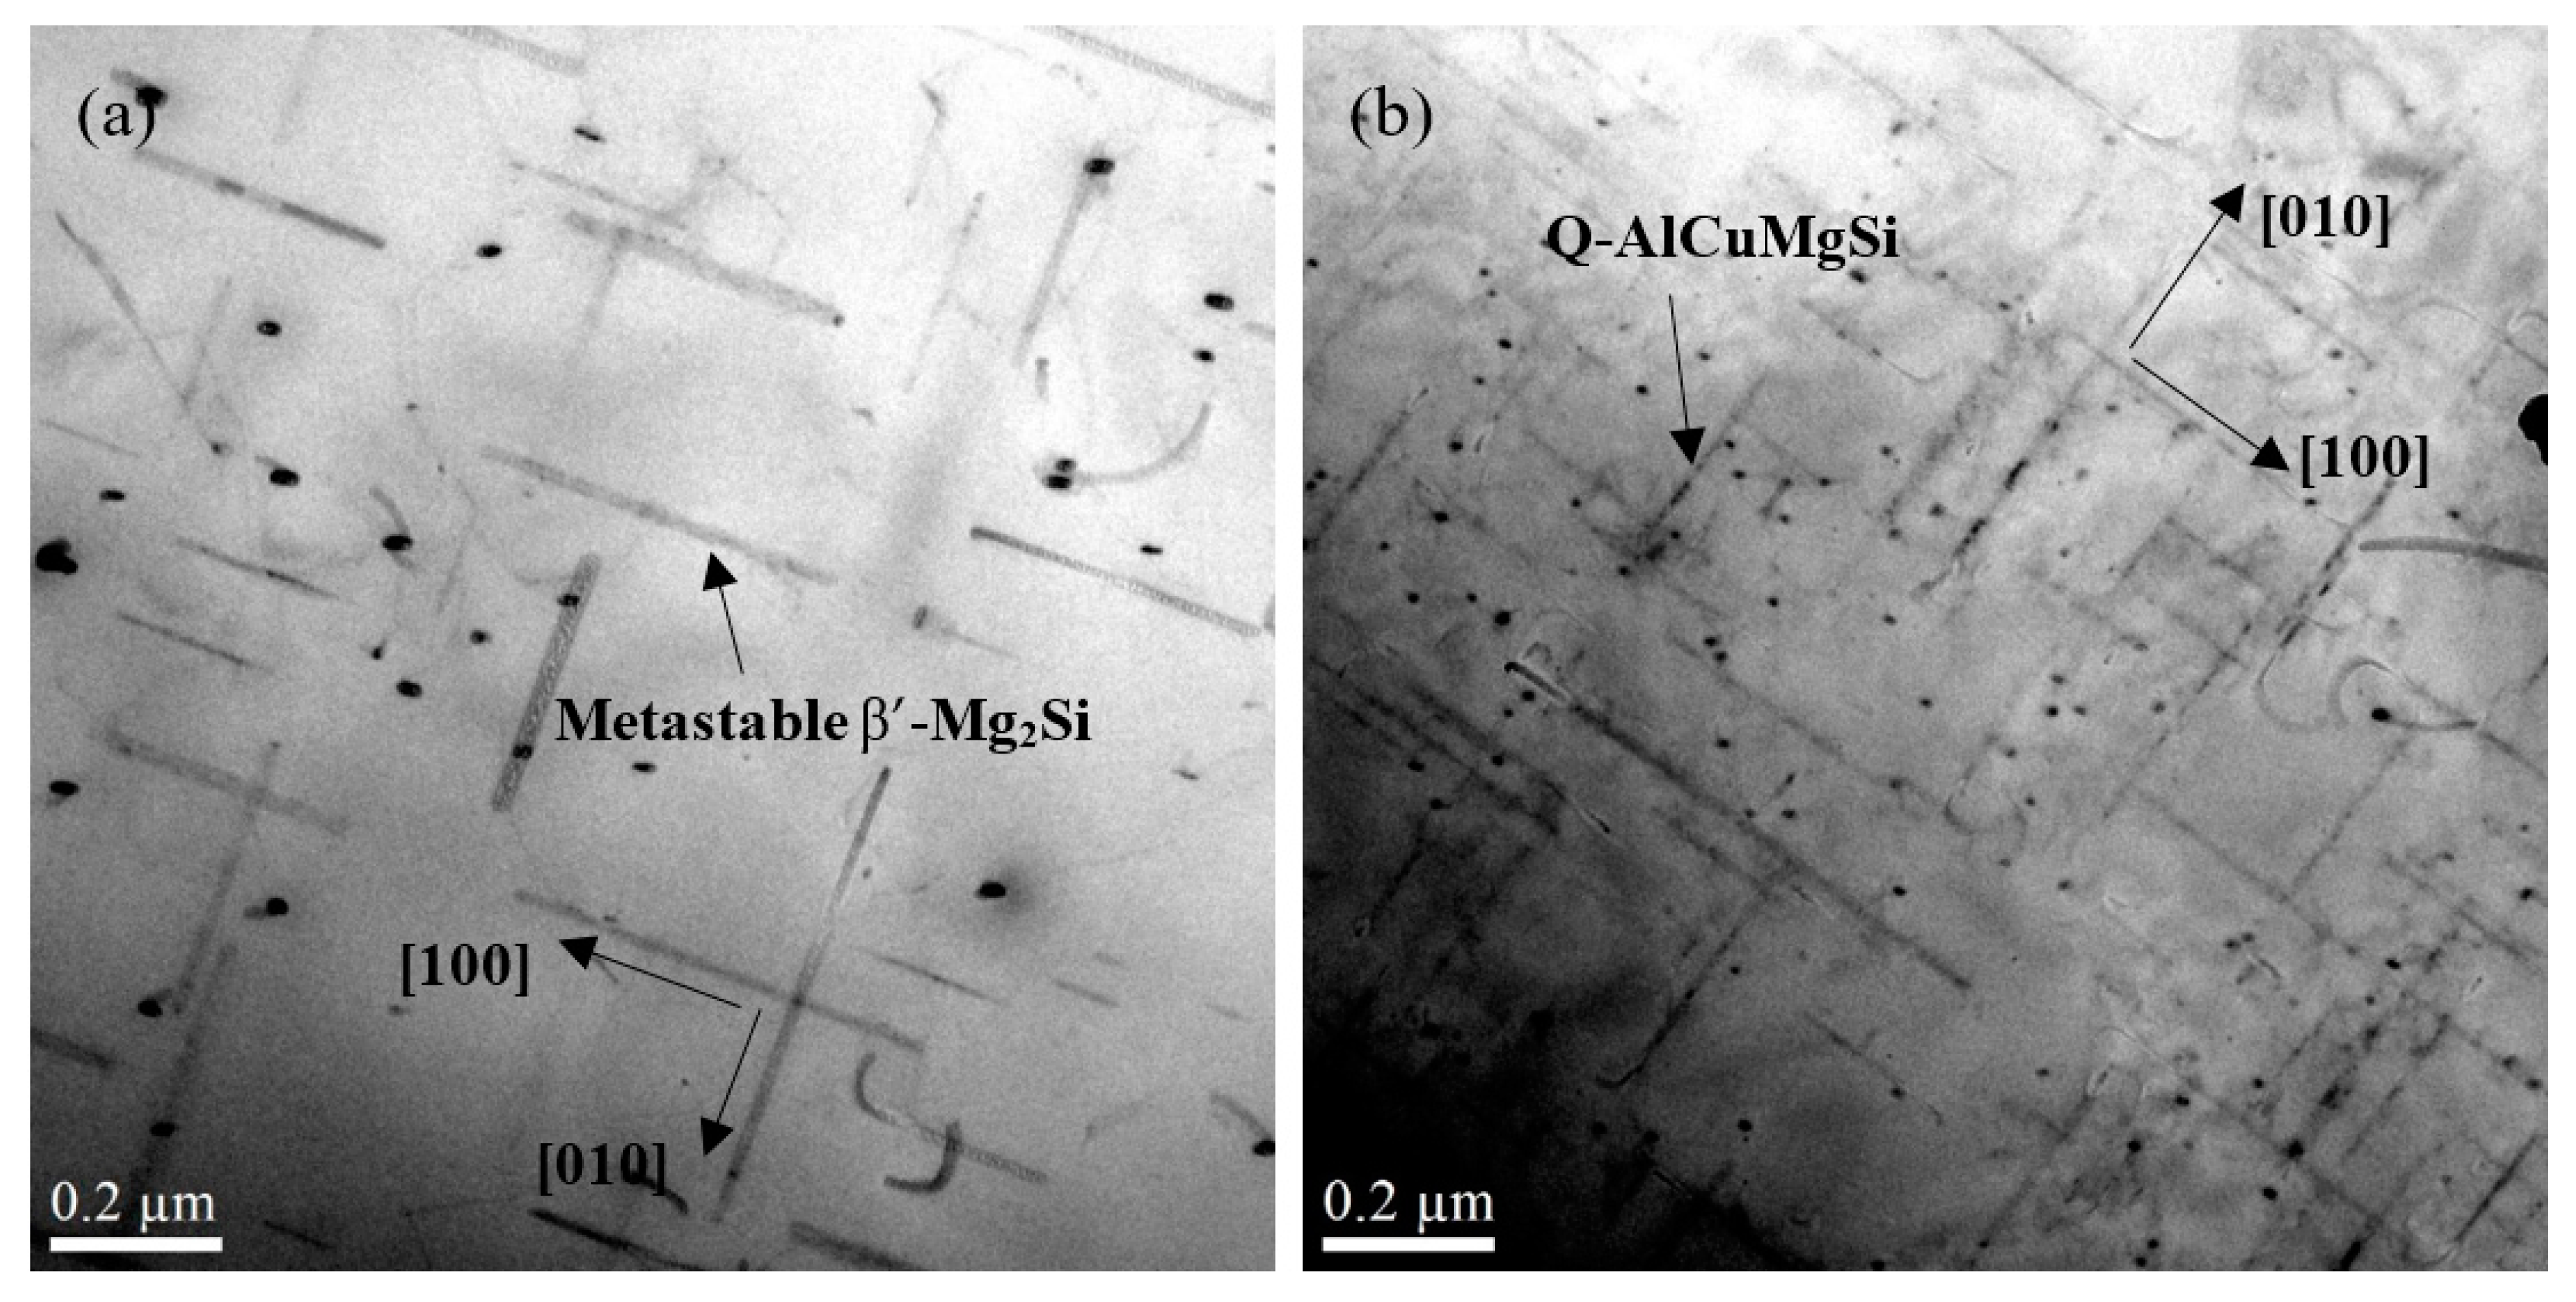
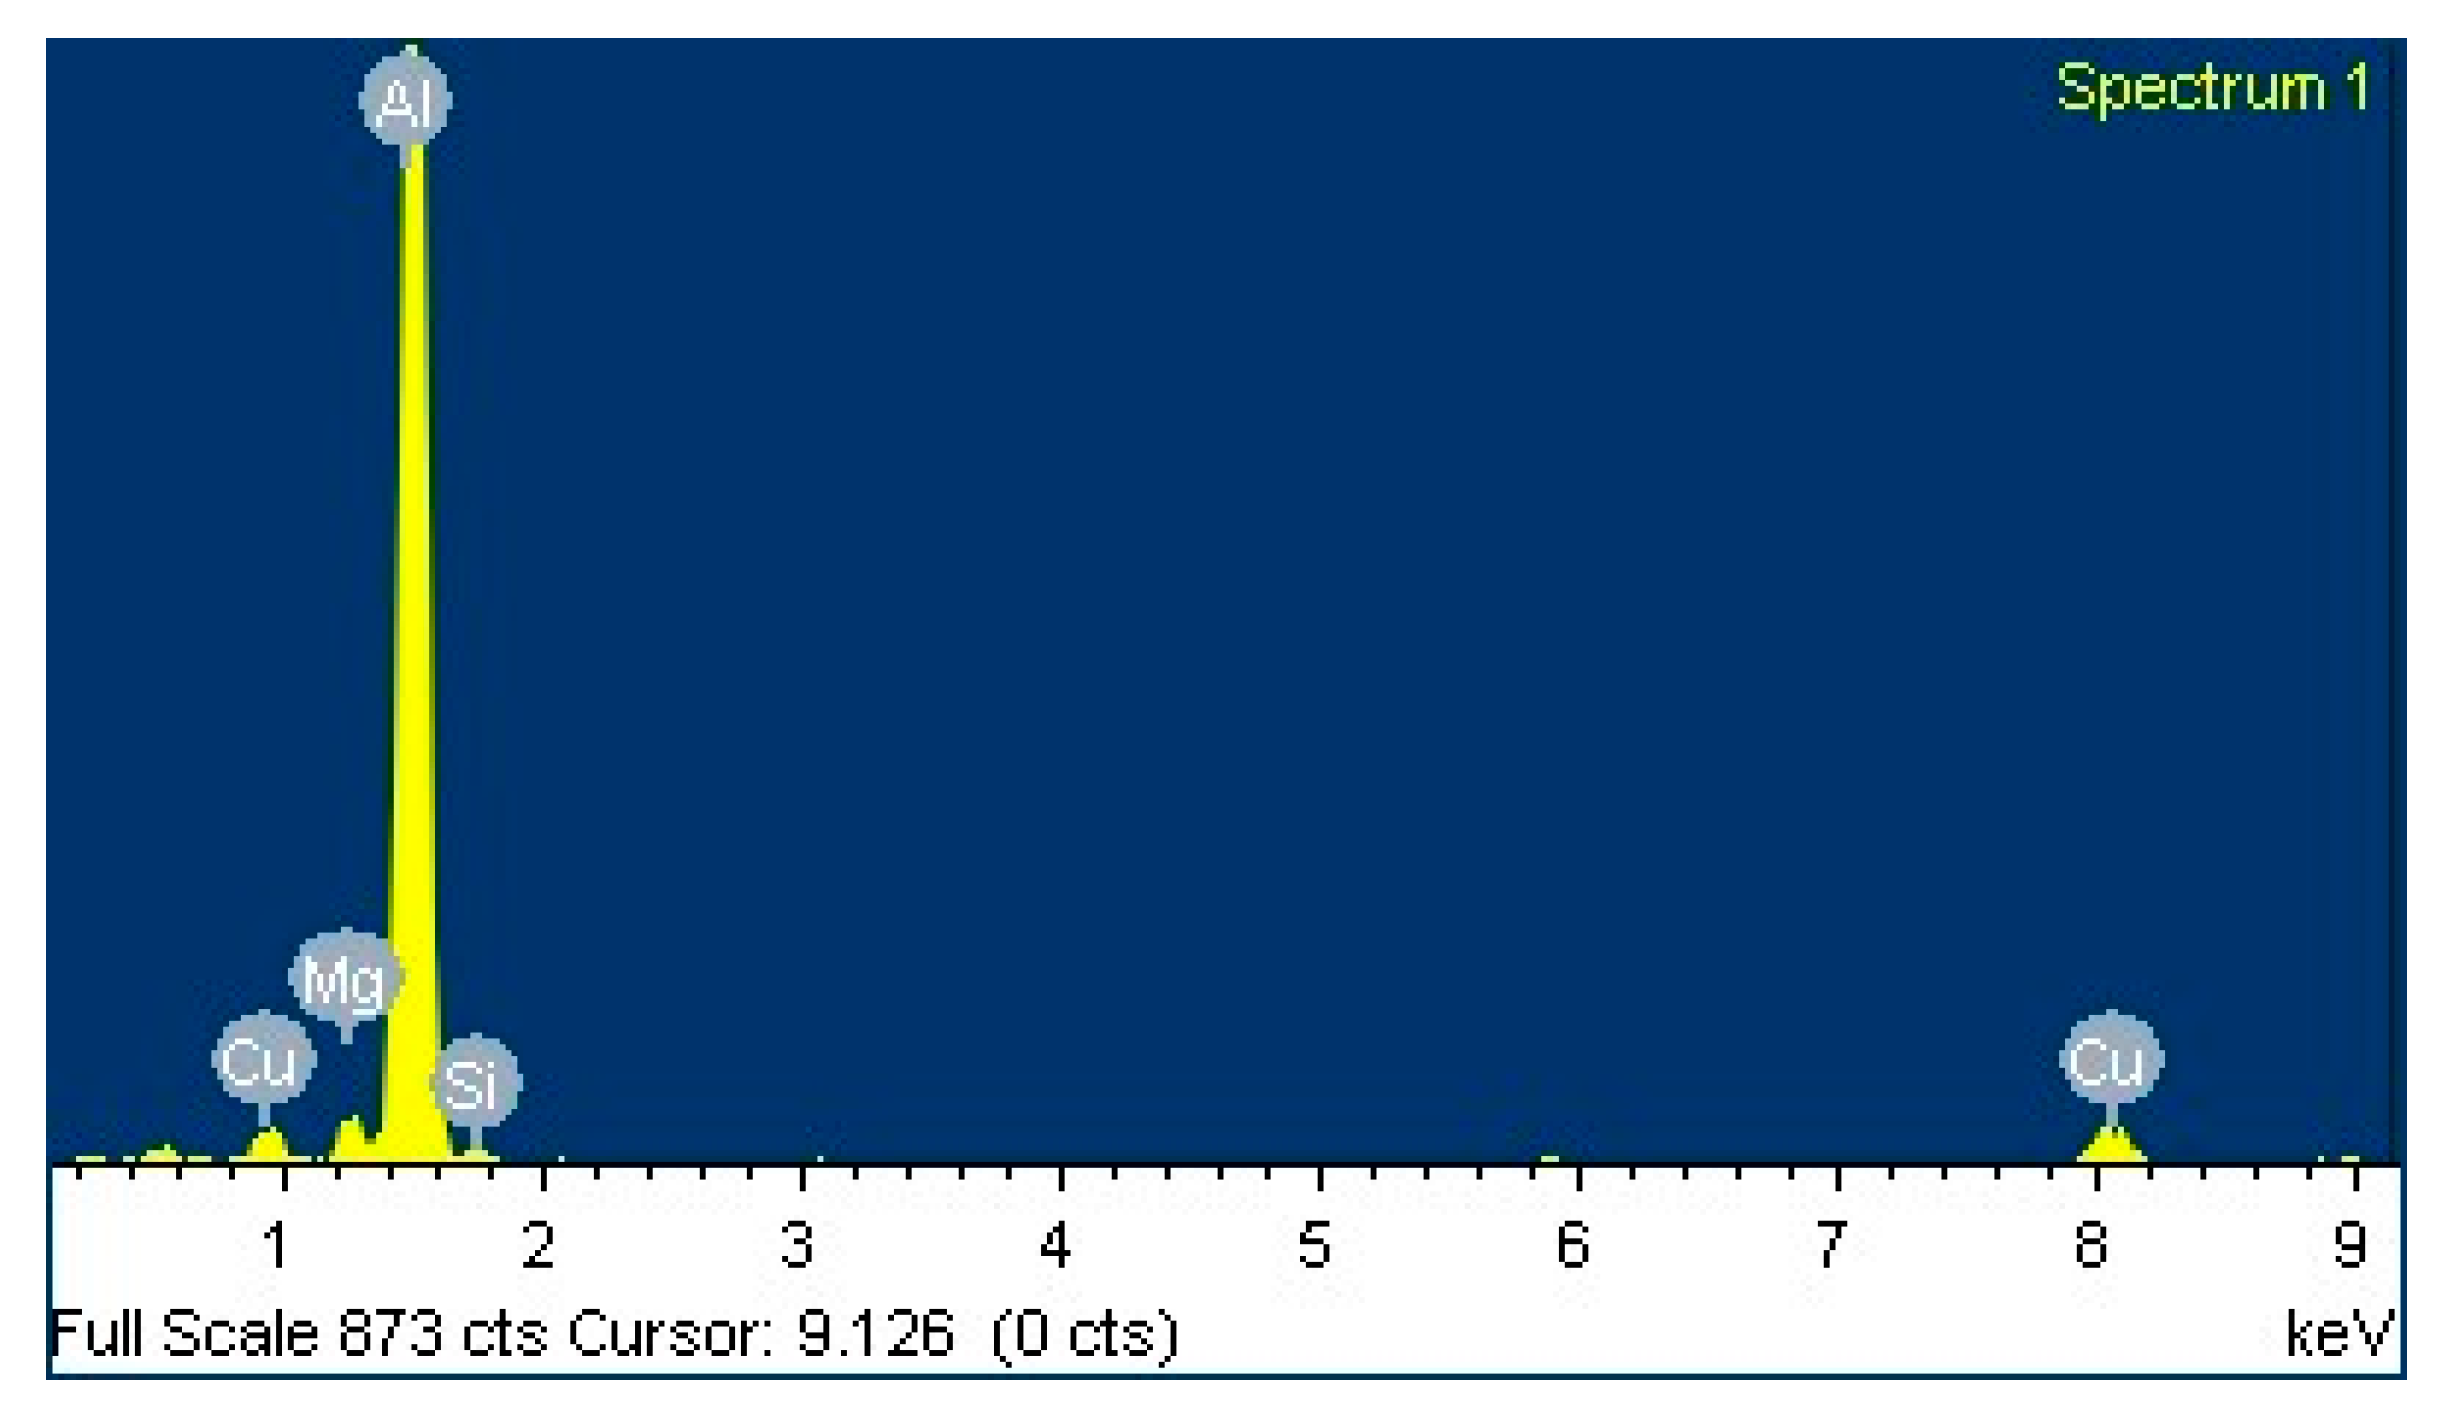
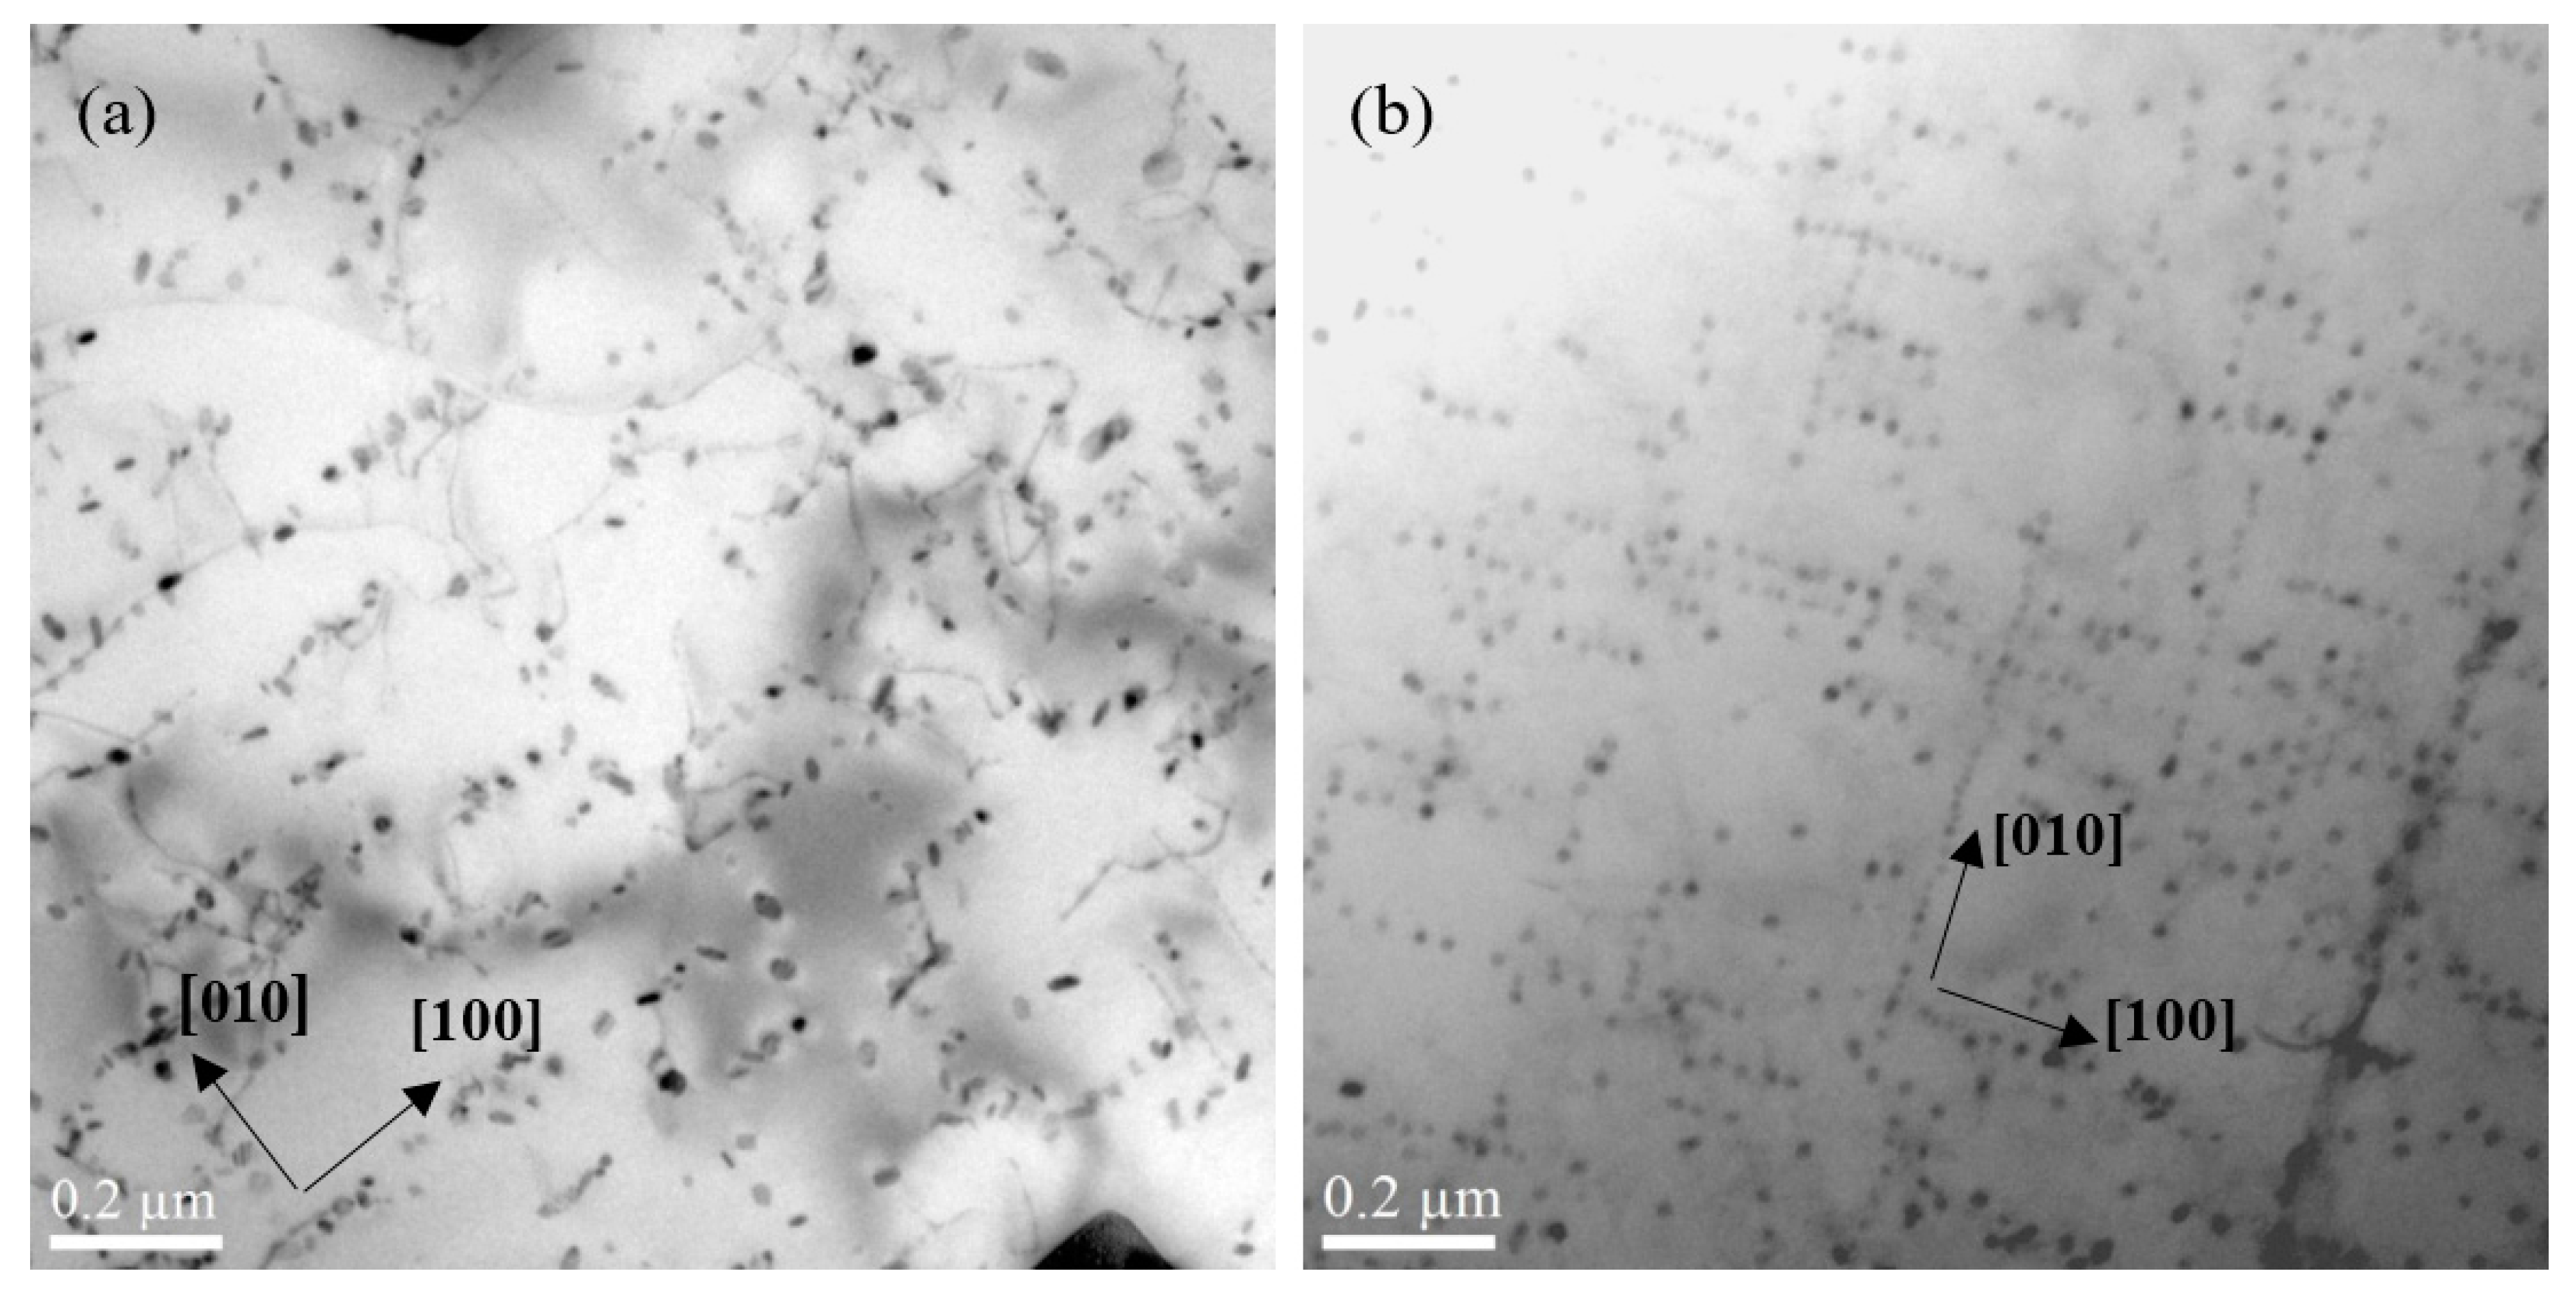
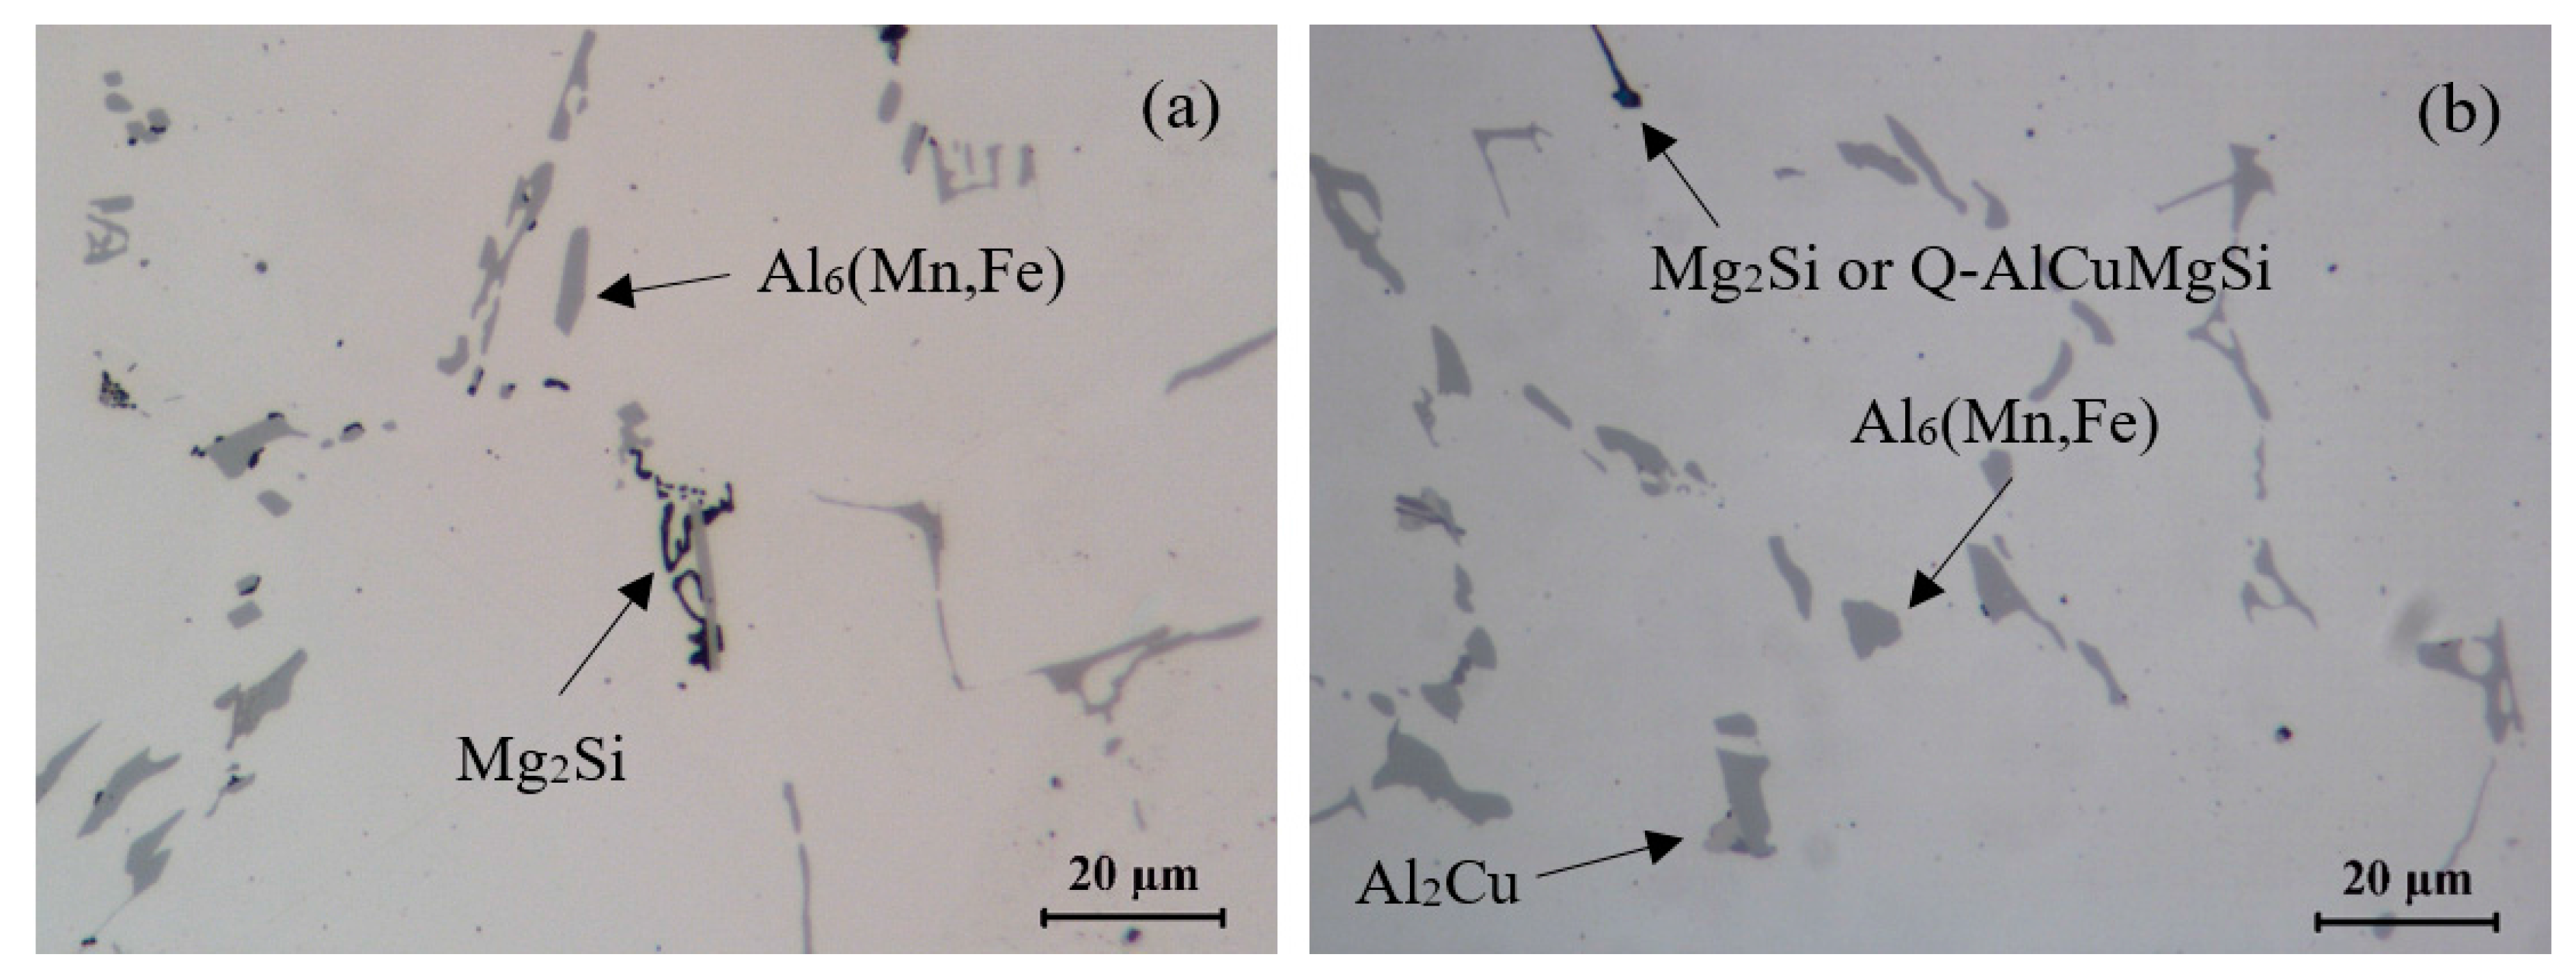
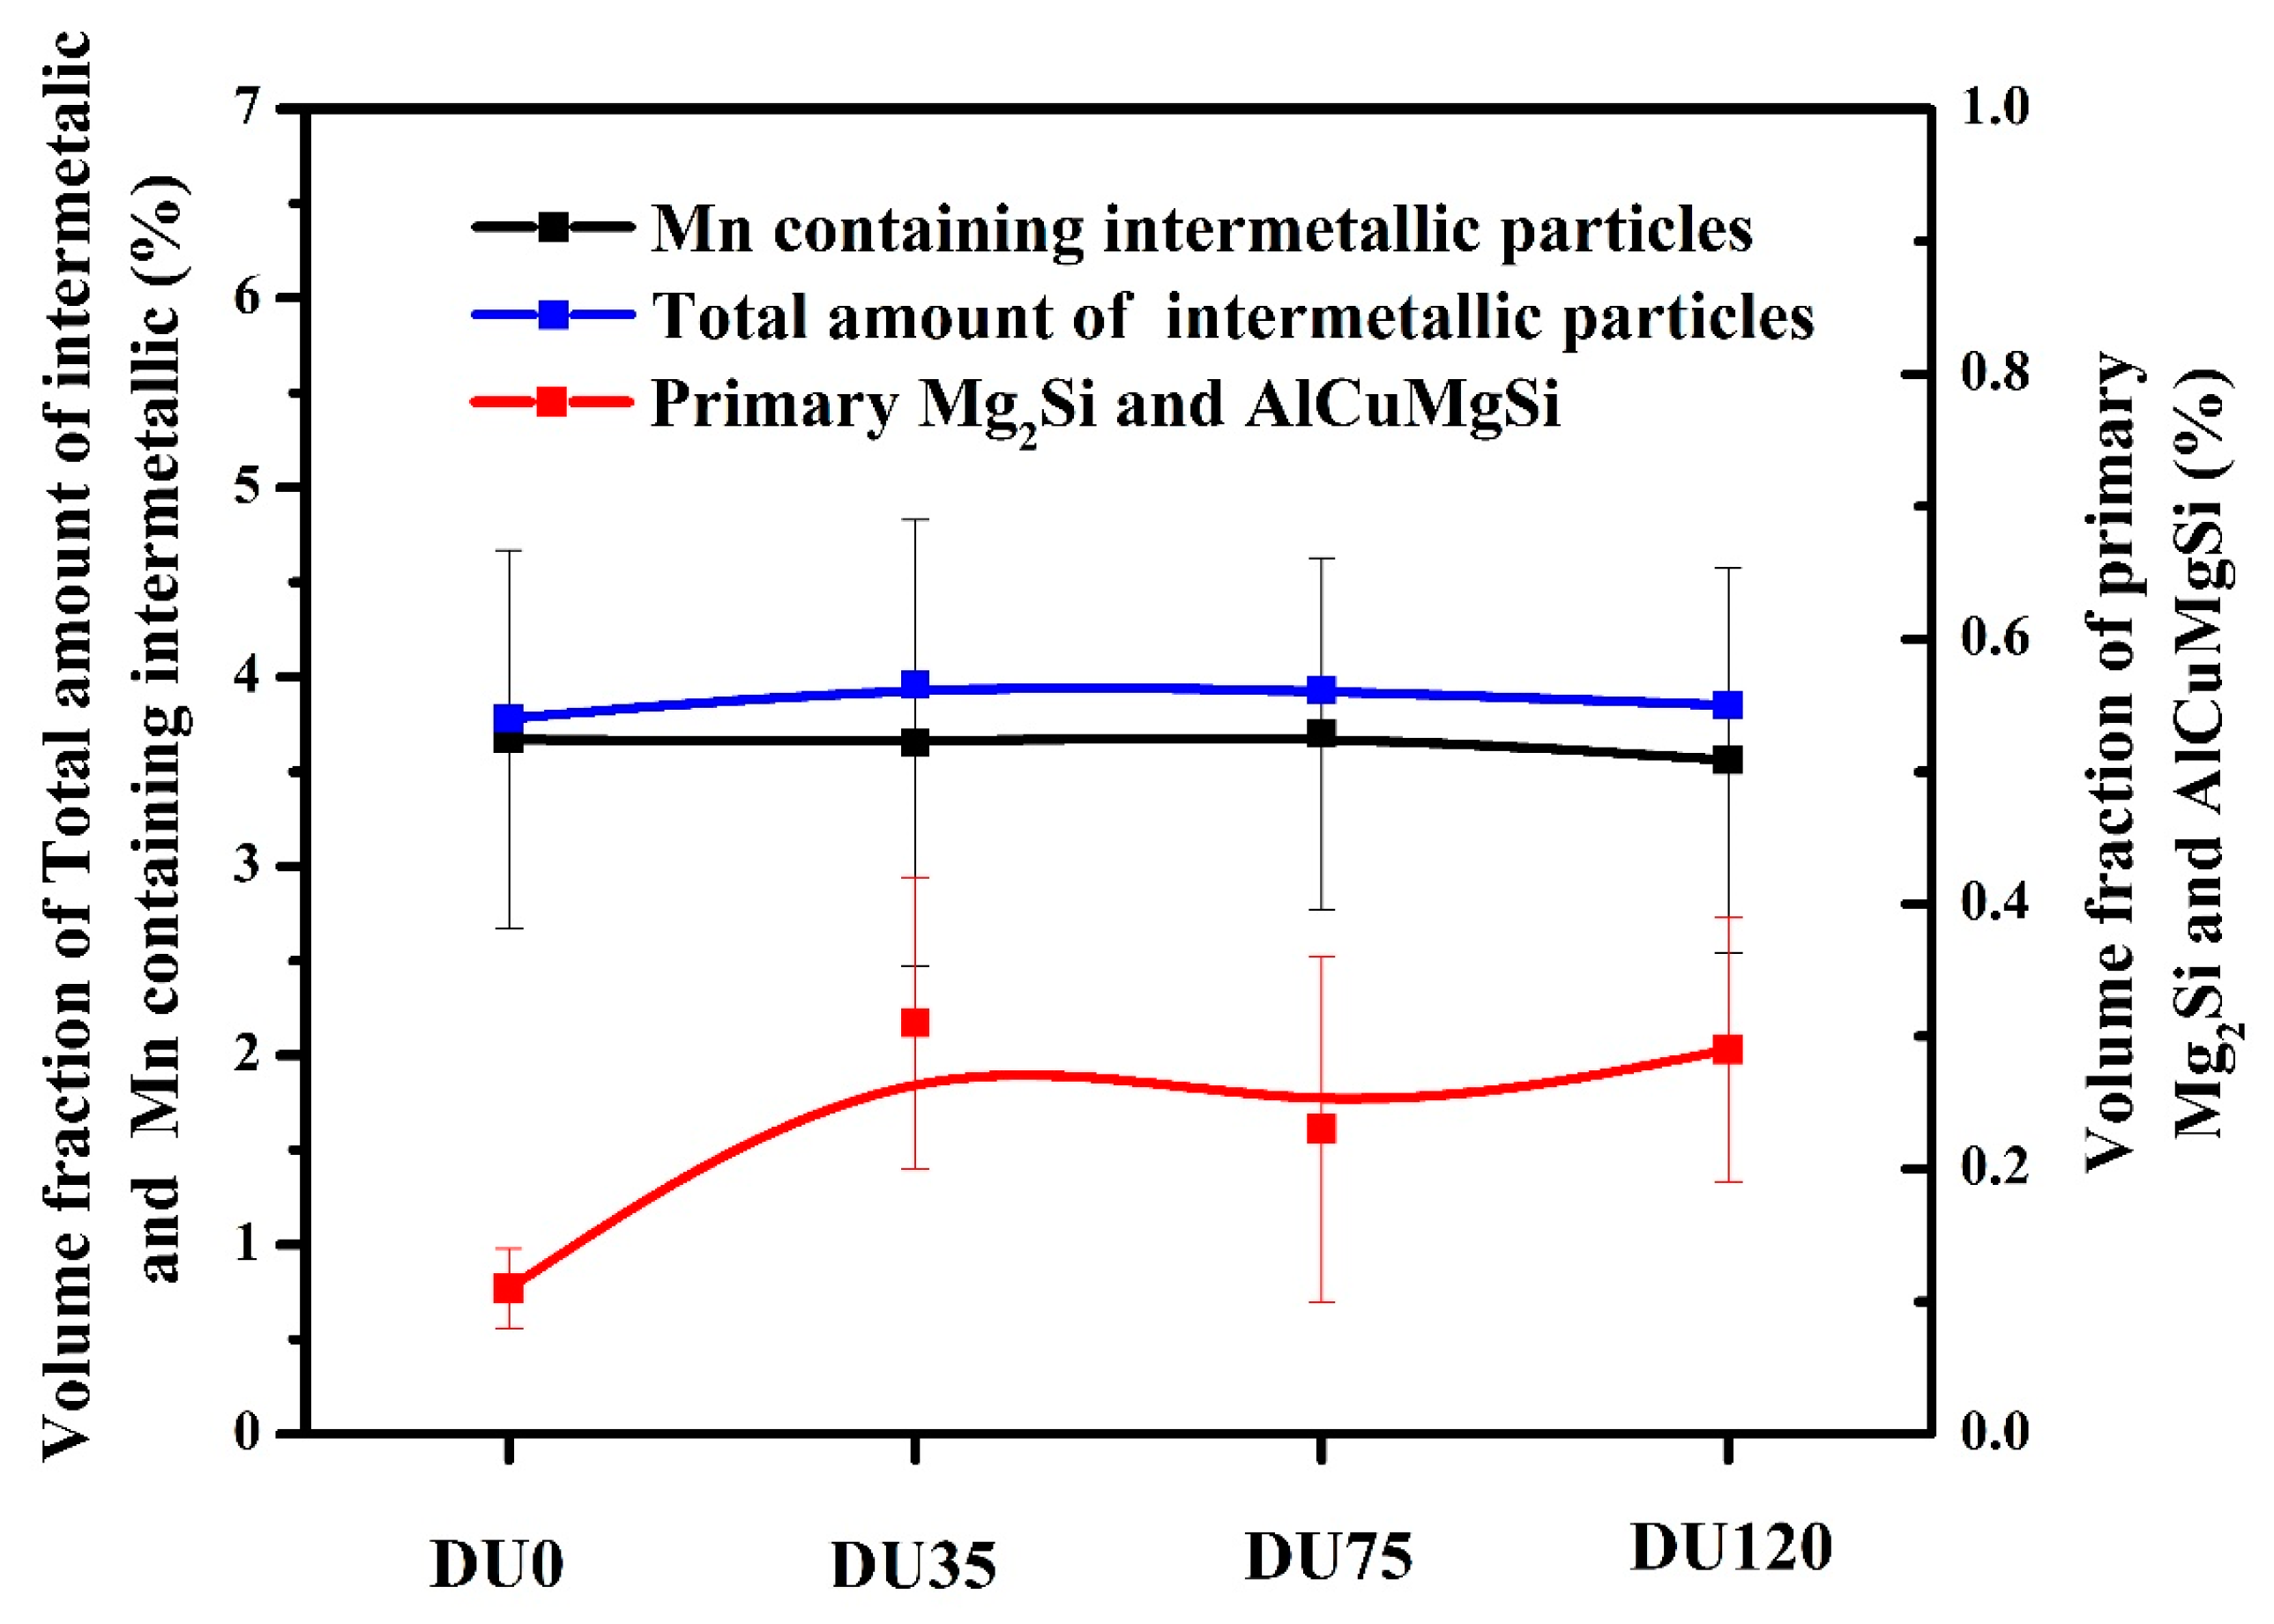
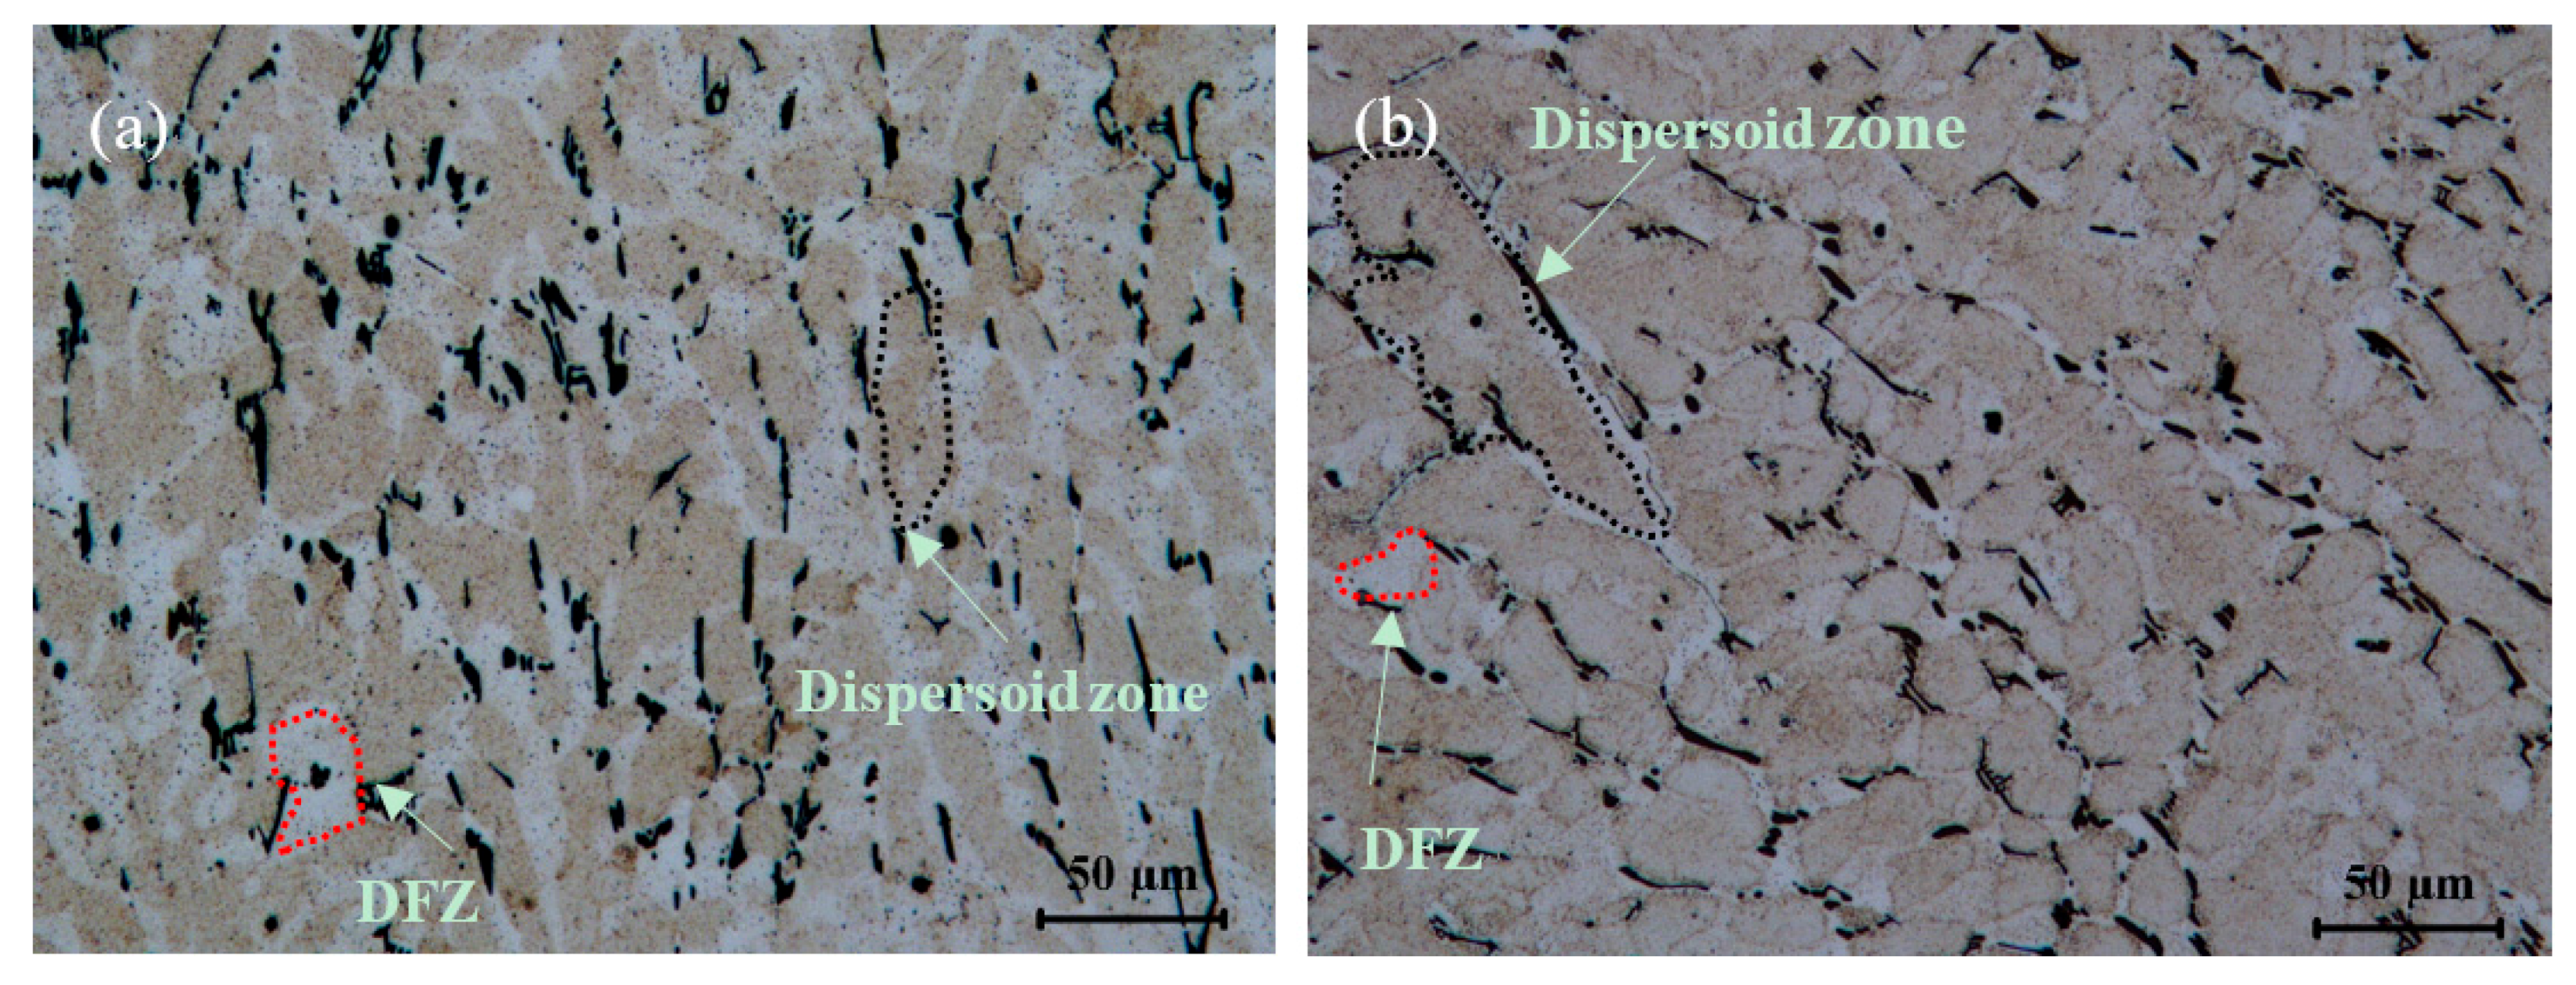
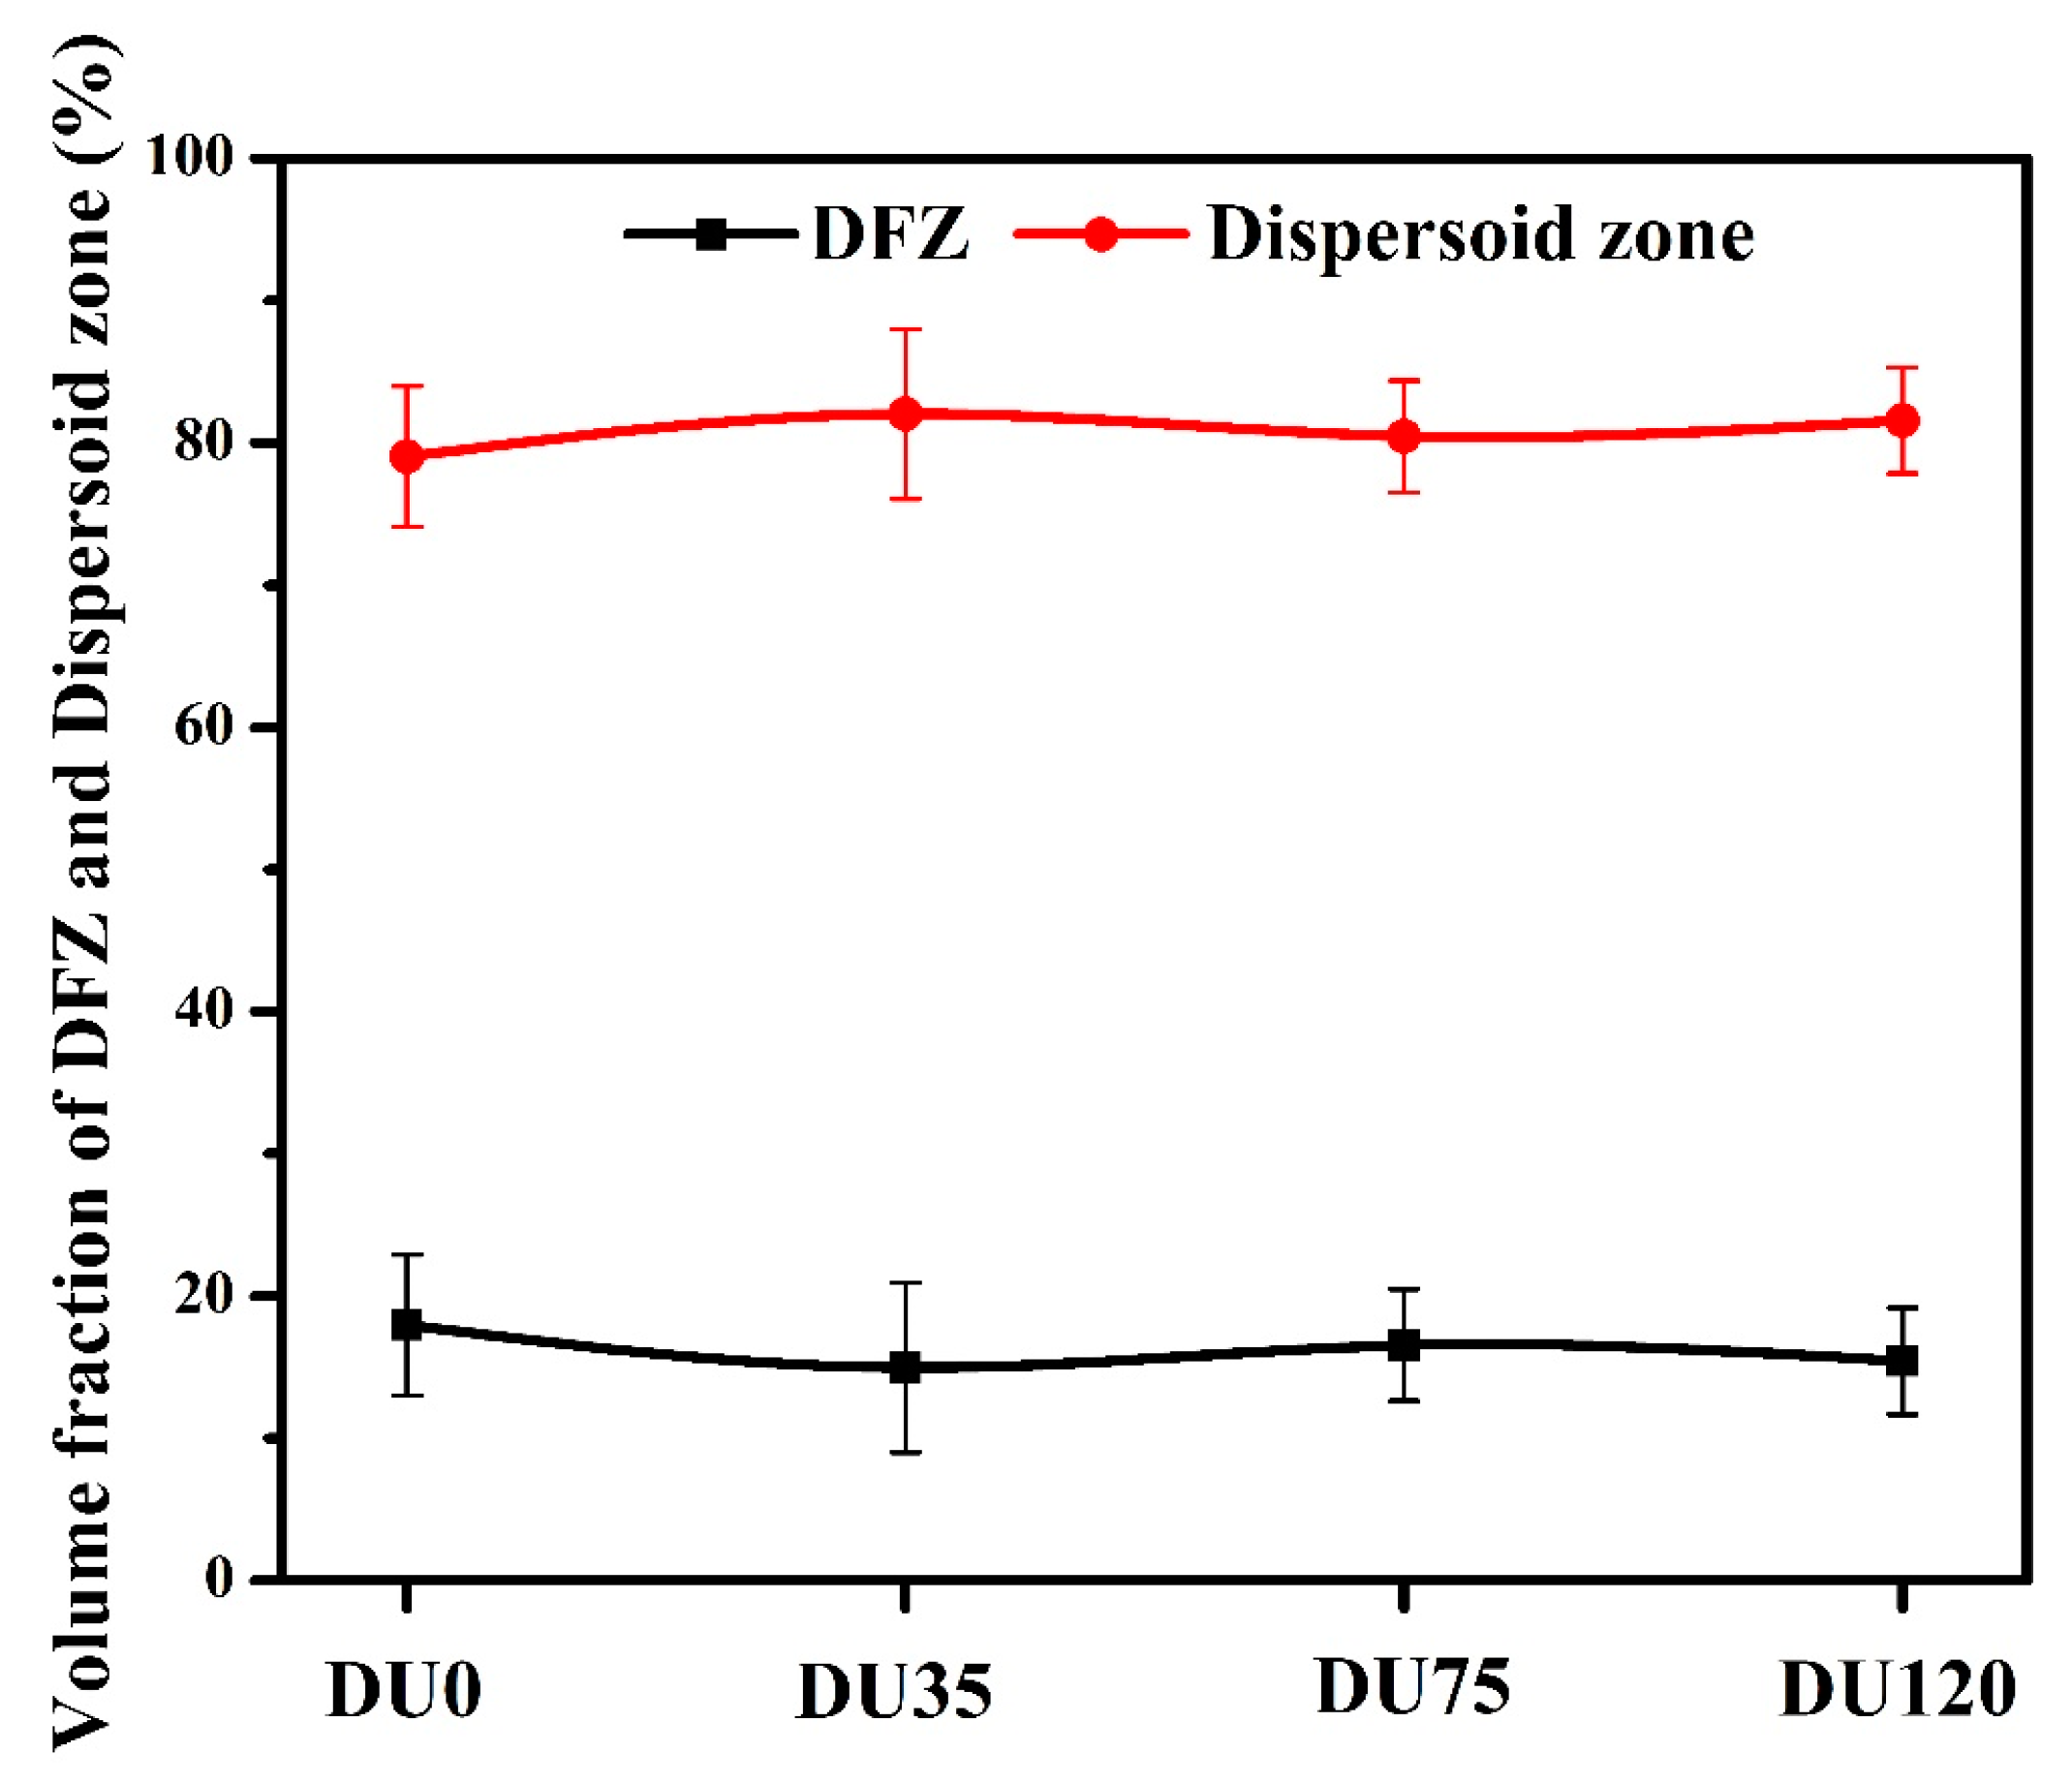
3.1.1. Influence of Cu on Intermetallic Phases and Dispersoid Distribution

The typical as-cast microstructures of experimental alloys are shown in Figure 2. In the base alloy (DU0, Cu-free), two types of intermetallic particles were observed (Figure 2a). The grey particles correspond to the Al6(Mn,Fe) intermetallic phase and the black ones are primary Mg2Si [6,9,13]; both are intermetalllics distributed in the interdendrite regions. In the Cu containing alloys, the grey particles are Al6(Mn,Fe) intermetallic, in which a small amount of Cu can be detected. The dark particles are primary Mg2Si and Q-AlCuMgSi intermetallics. In addition, a small amount of light grey Al2Cu phases co-exist with the Q-phase. The microstructure of the alloy containing 1.2% Cu is shown in Figure 2b. Using image analysis, the volume fractions of intermetallics as a function of Cu content were evaluated (Figure 3). Most of the intermetallic phases in the experimental alloys are the Mn containing Al6(Mn,Fe) particles (approximately 3.5–3.7 vol. %). Although the volume fractions of both Mg2Si and Q-AlCuMgSi phases increase with the Cu content, their amount is limited (0.1–0.3 vol. %) when compared to the Mn containing intermetallic phase. The total volume fractions of the intermetallic phases in all four alloys are very similar (3.8–3.9 vol. %), indicating that Cu addition does not significantly change the number of intermetallic phases.
α-Al(Mn,Fe)Si dispersoids can precipitate at approximately 400 °C during heat treatment in 3xxx alloys [3,6,7]. Figure 4 shows the optical images of DU0 and DU120 alloys after heat treatment at 425 °C for 6 h. The light yellow regions are the dispersoid zones where most of the dispersoids are concentrated and they are located inside the dendrite cells. The white color regions are the dispersoid free zones (DFZ), where only a few dispersoids appeared and the DFZs are generally in the interdendrite regions. The volume fractions of the dispersoid zones and DFZs are shown in Figure 5. The volume fractions of the dispersoid zones are ~80% in all of the experimental alloys. The variation of the volume fractions of the dispersoid zones and DFZs between alloys is quite small, indicating the Cu has no significant influence on dispersoid distribution.

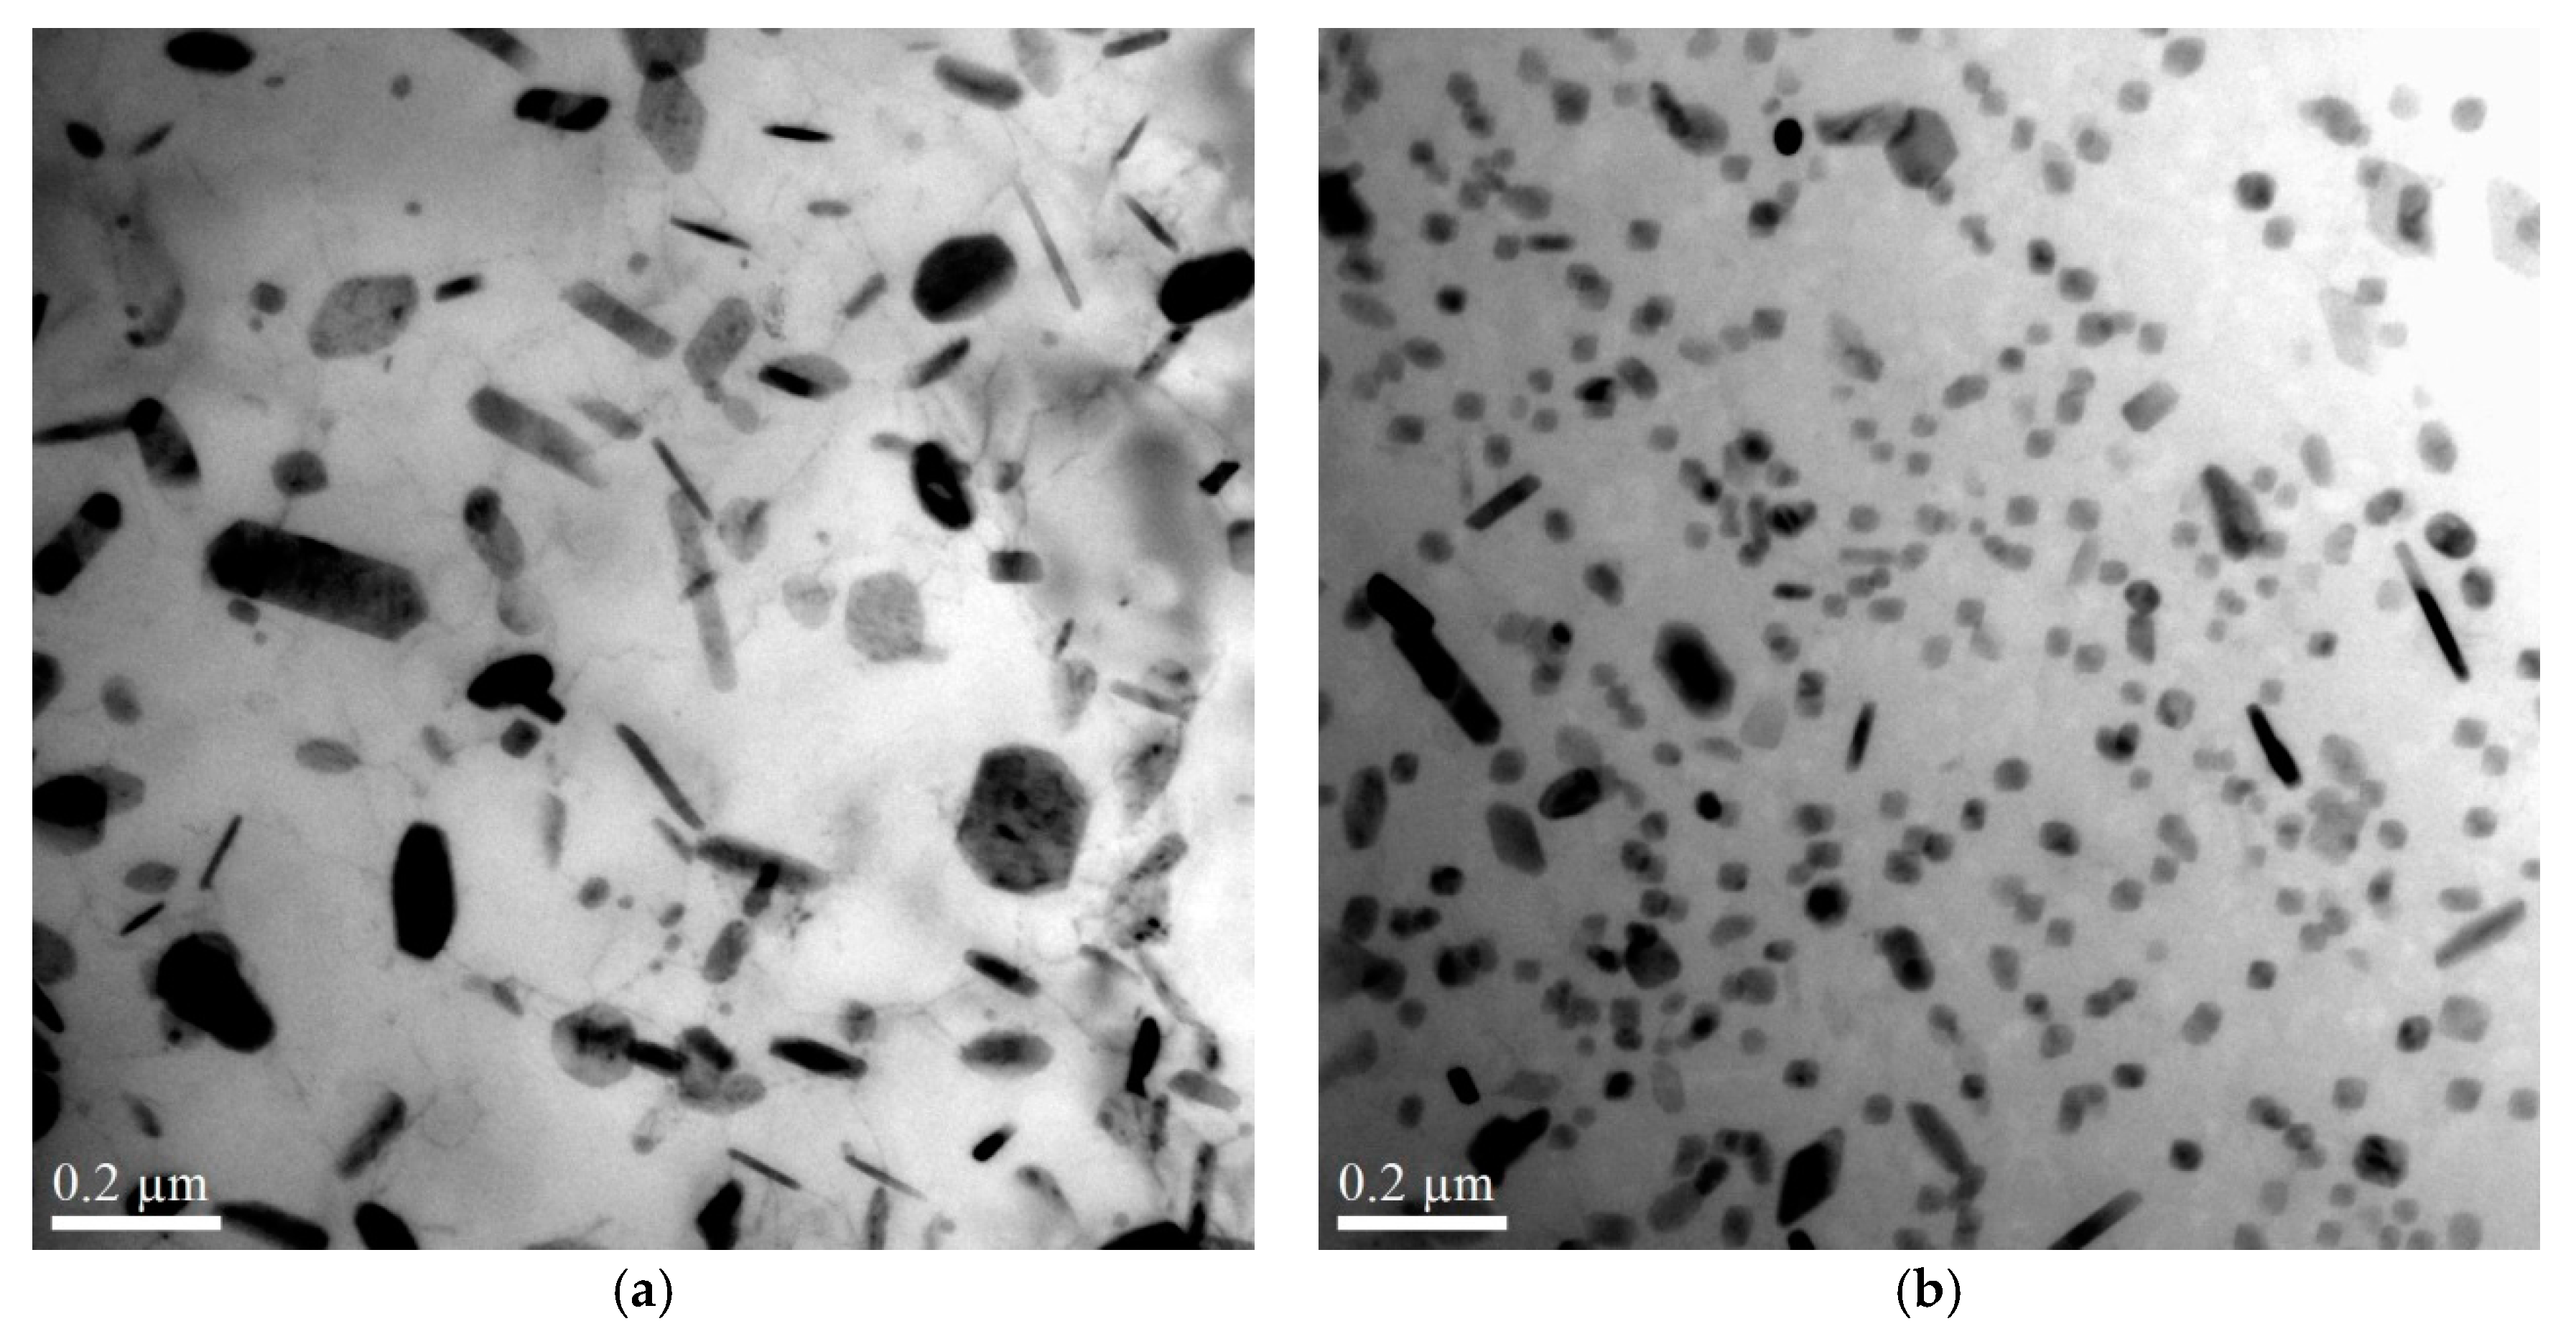
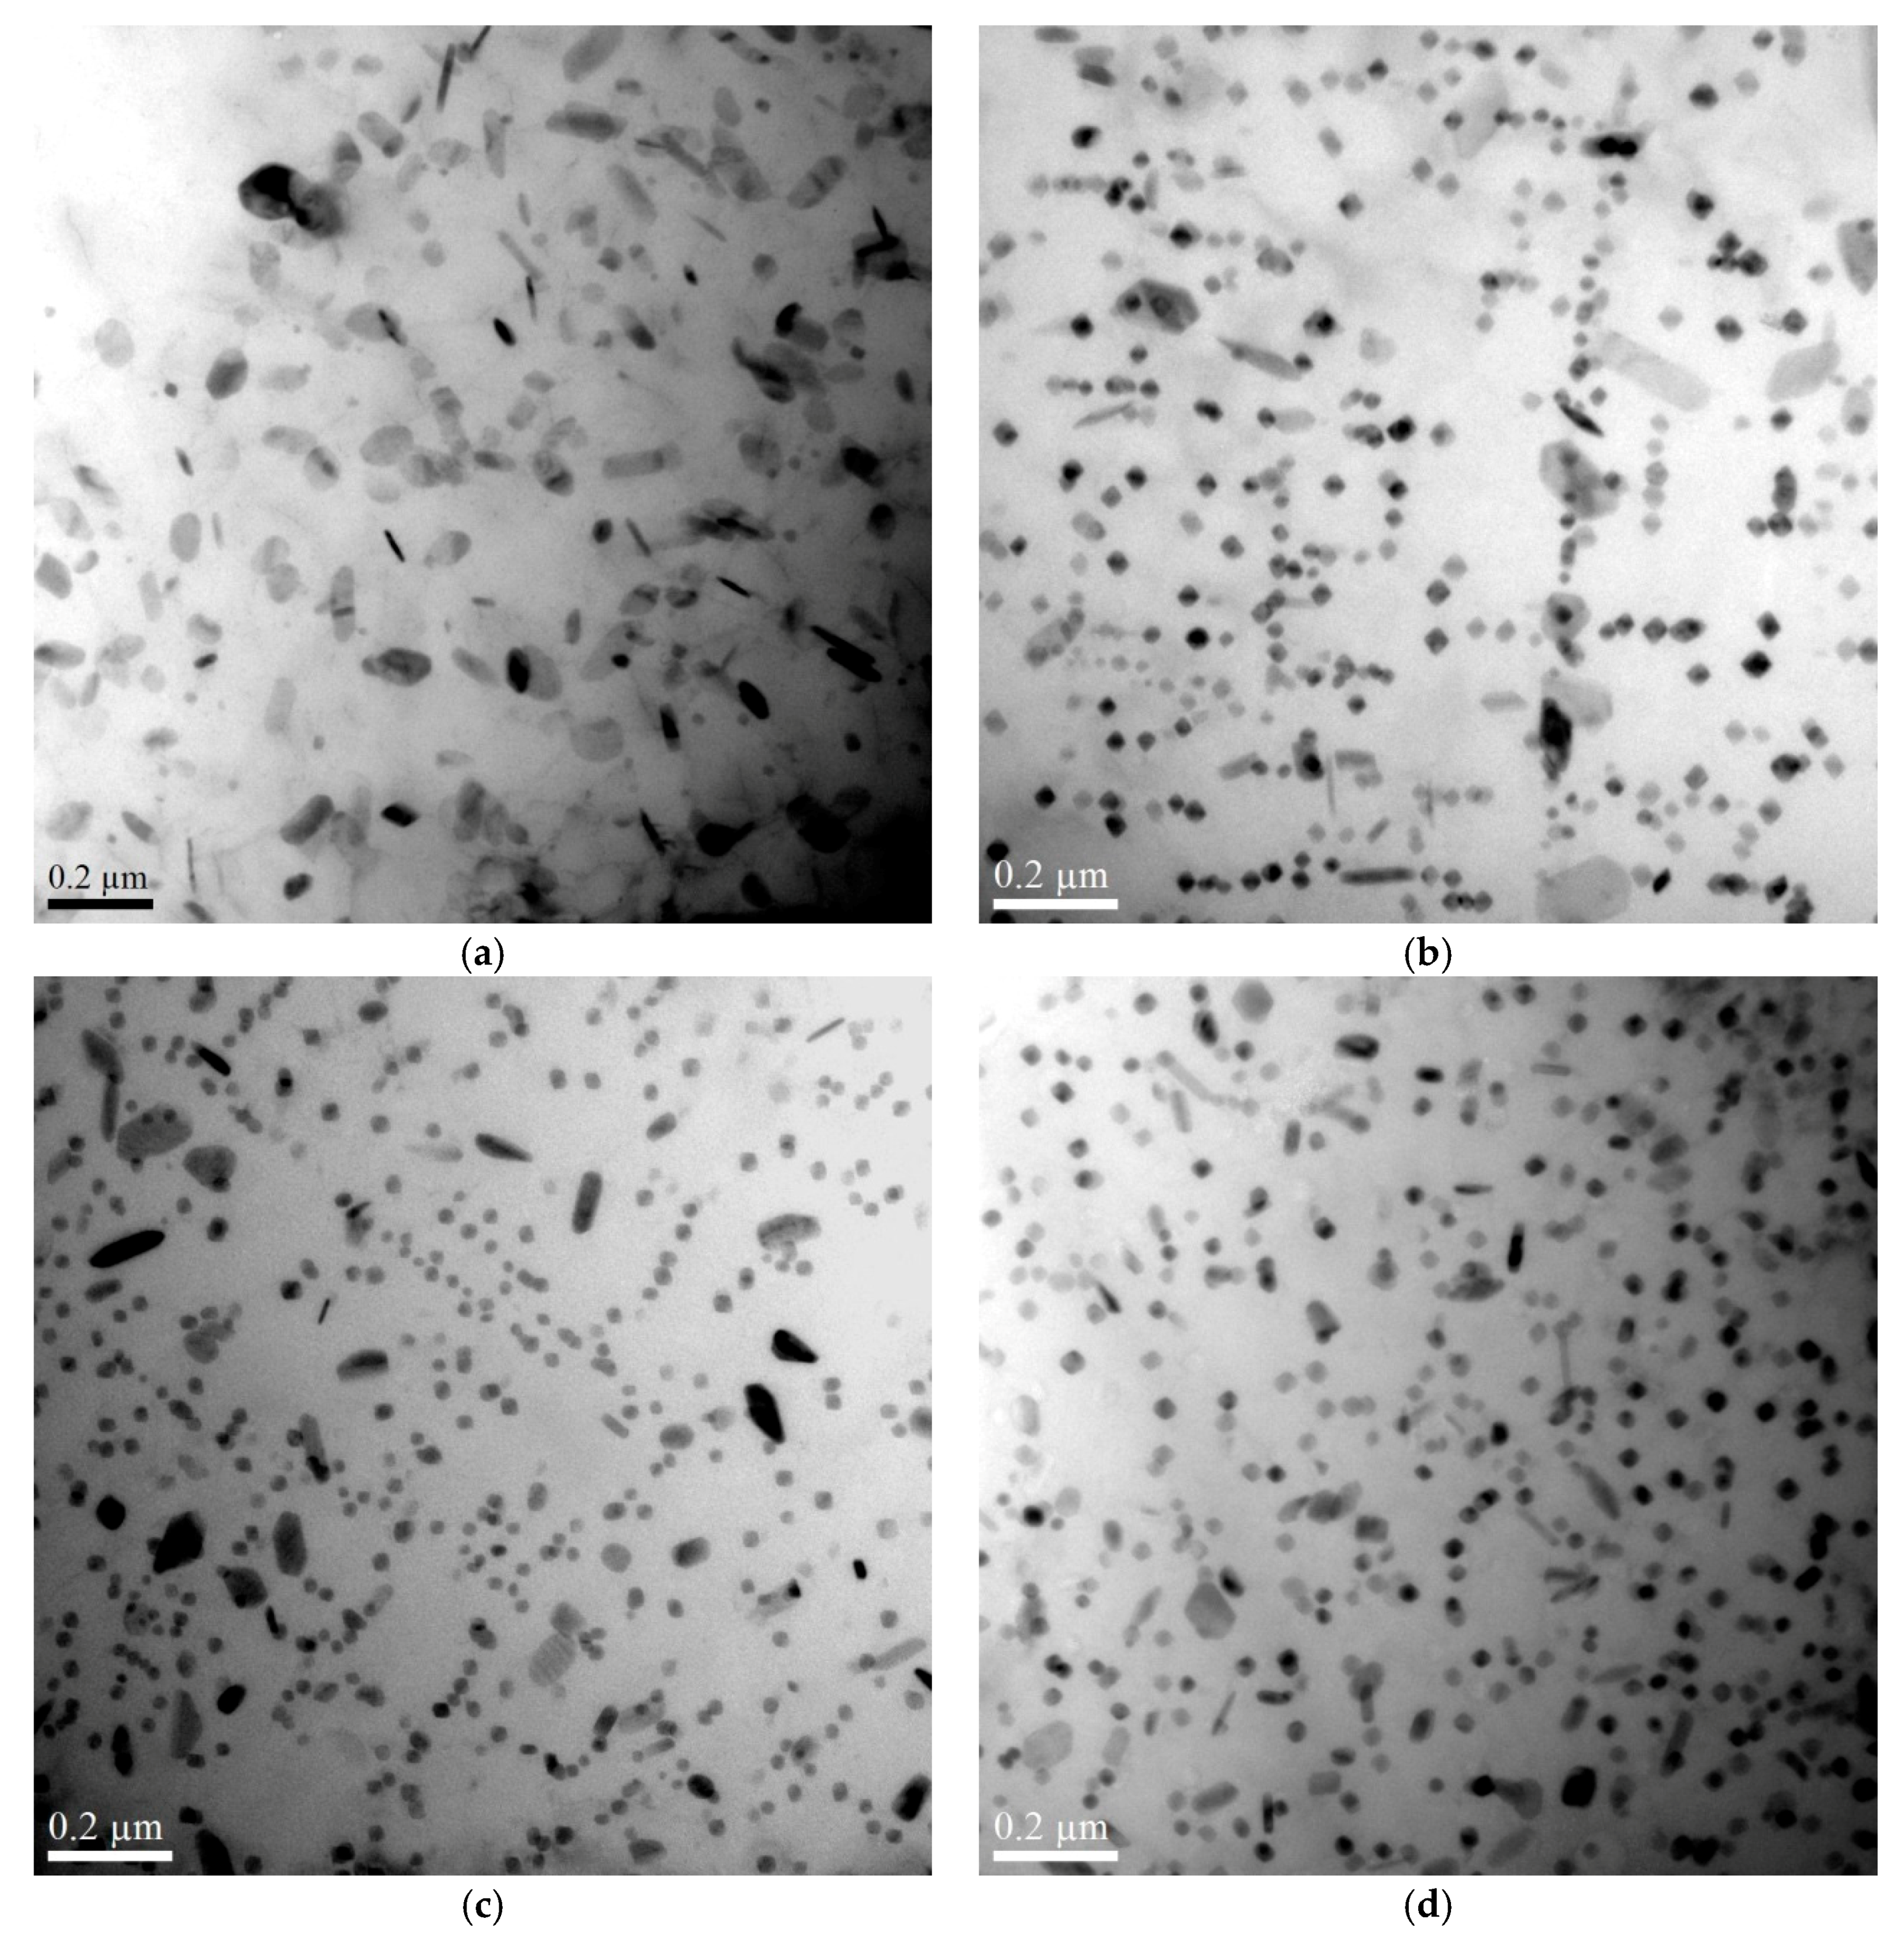
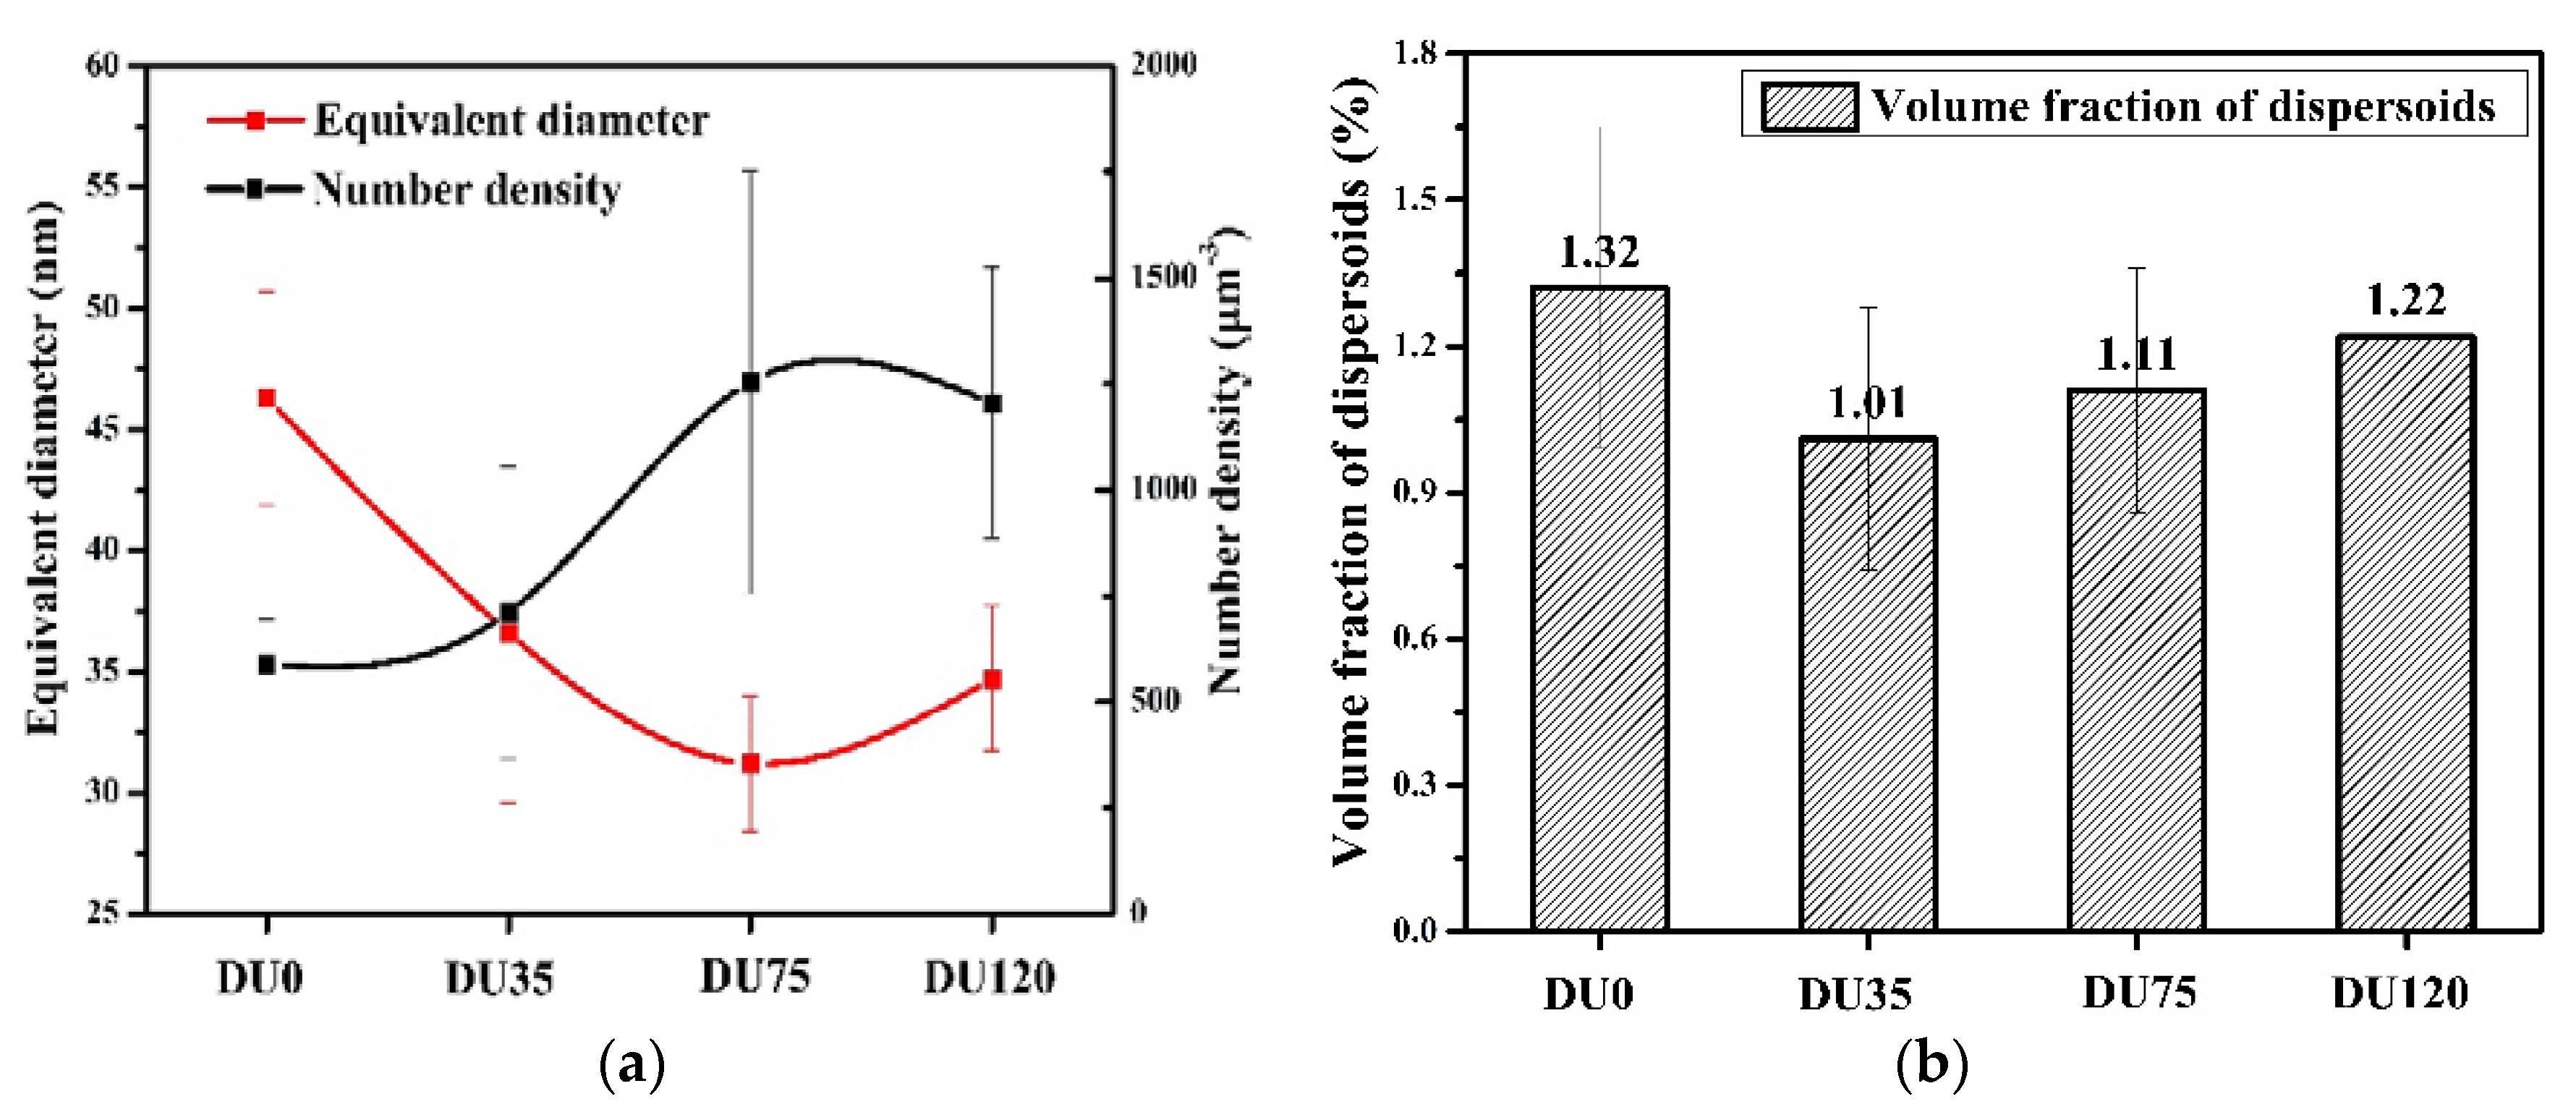
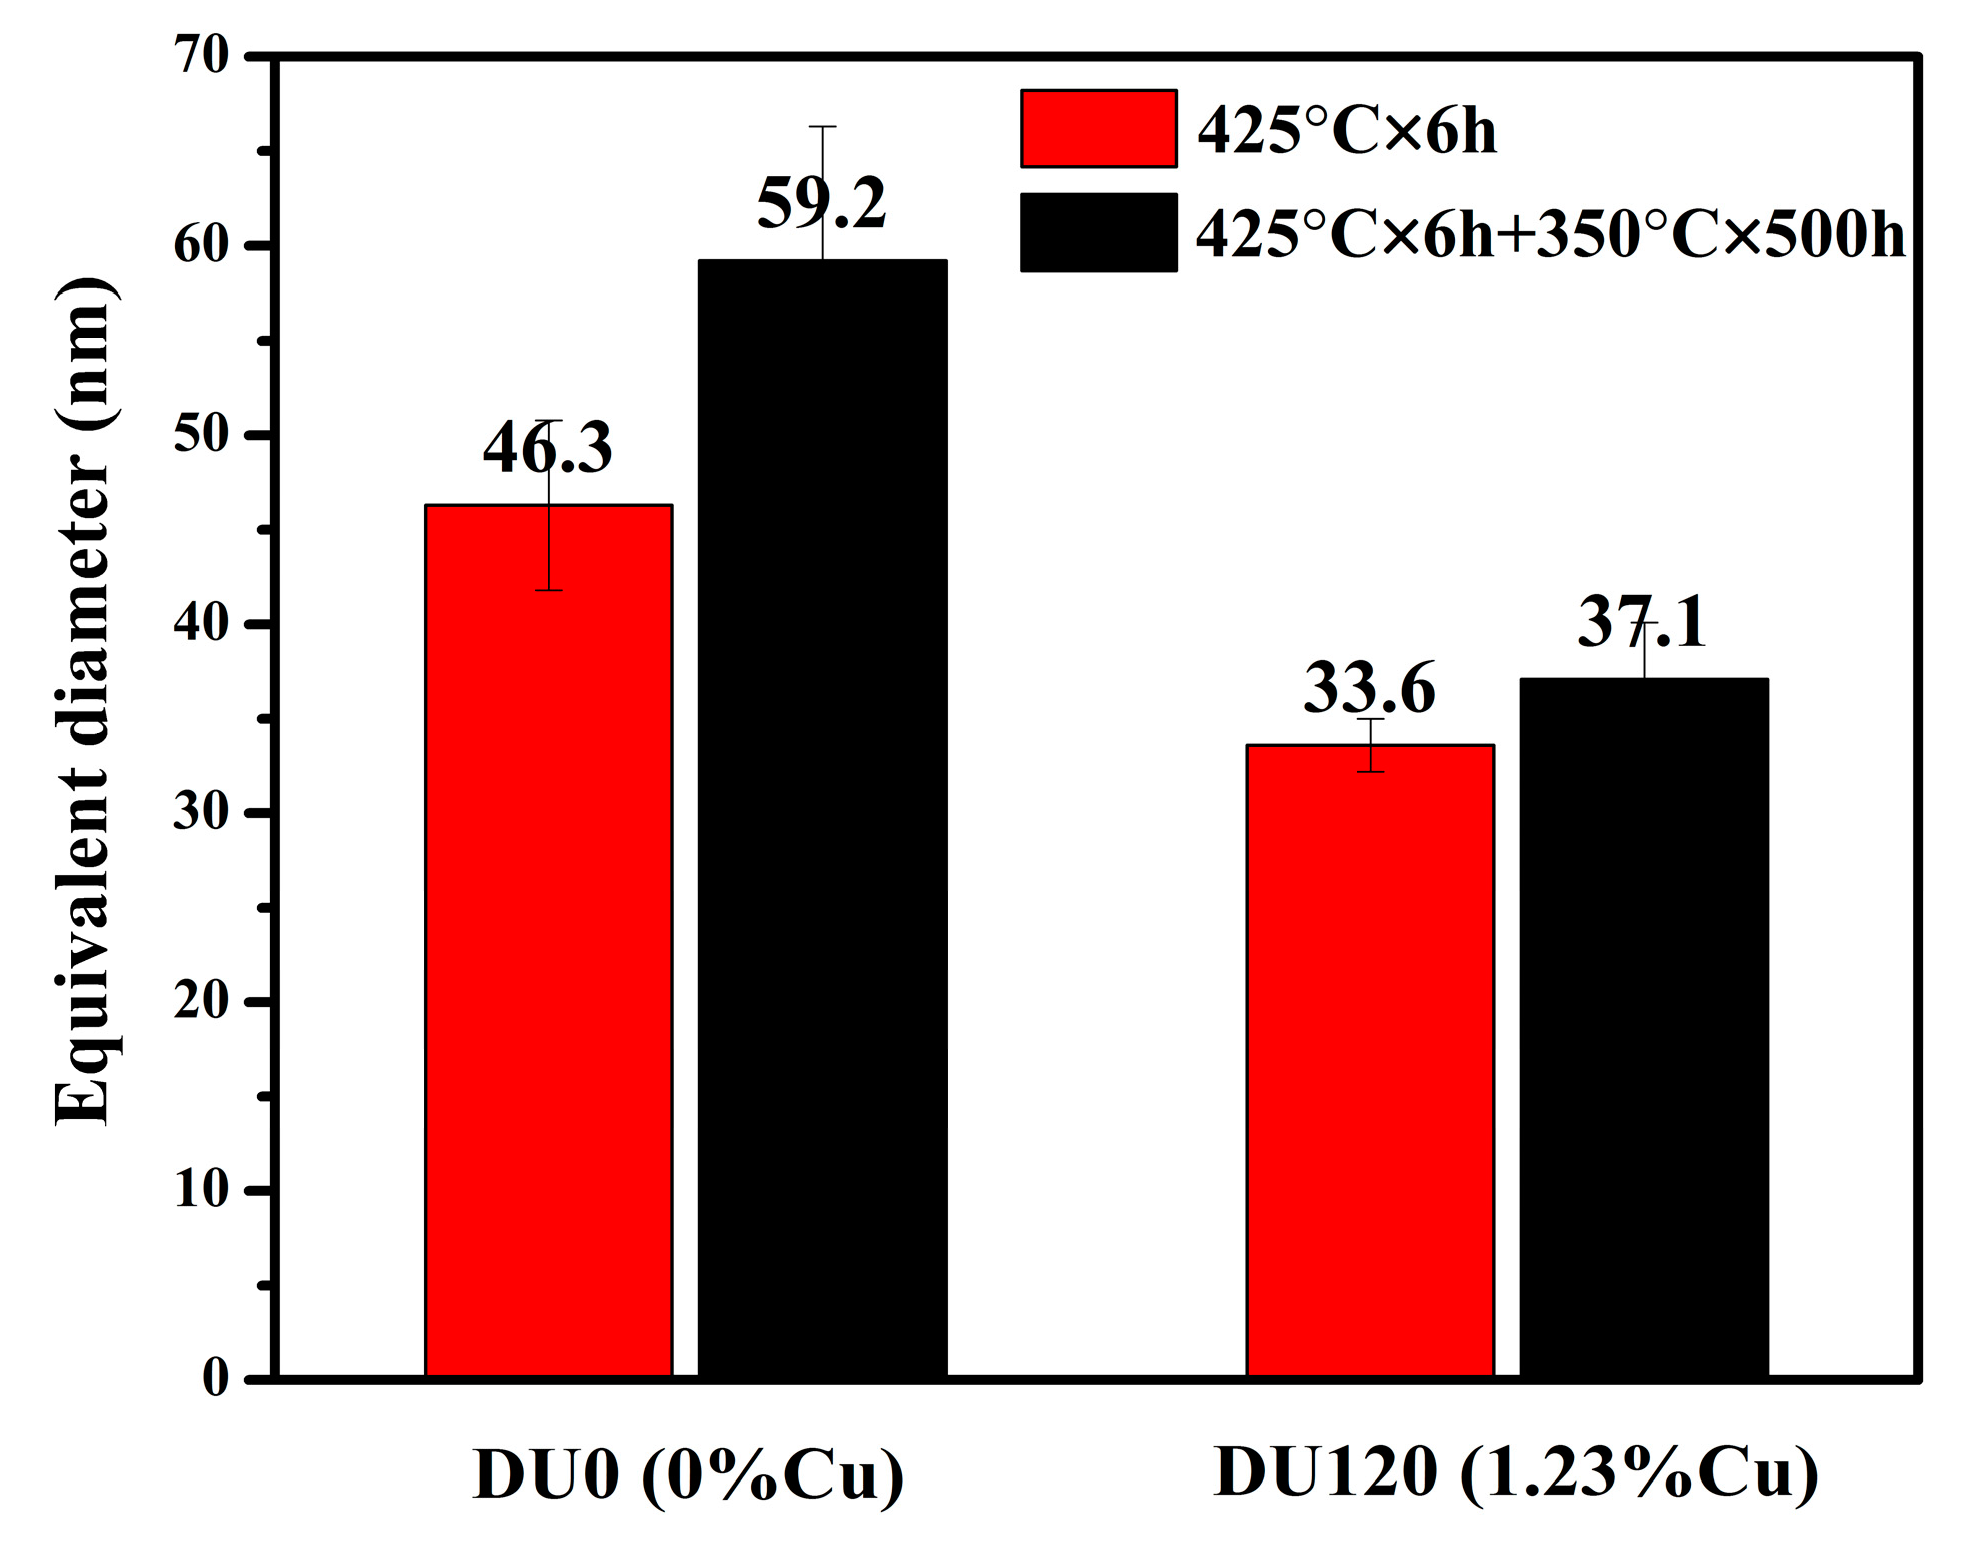
3.1.2. The Influence of Cu on Dispersoid Features and Thermal Stability

To reveal the influence of Cu on the precipitation behaviour of dispersoids, TEM observation was carried out. Figure 6 presents TEM bright field images showing the details of the dispersoids in the samples heat-treated at 425 °C for 6 h. The dispersoids in DU0 alloy (Figure 6a) have a rod-like or plate-like morphology. On the other hand, most of the dispersoids are cubic shaped but a few of the dispersoids have a rod-like or plate-like morphology in the Cu containing alloys (Figure 6b–d). A trace of Cu was detected in the dispersoids in the Cu containing alloys by TEM-EDS analysis. All dispersoids are identified as α-Al(Mn,Fe)Si according to the results of TEM-EDS and literature [1,2,3,5,6]. The equivalent diameter of the dispersoids in the base alloy (DU0) is 47 nm, whereas the diameters of the dispersoids in the Cu containing alloys are between 32 and 37 nm (Figure 7a), which is smaller than that in the base alloy. In addition, the number density of dispersoids in the Cu containing alloys is higher than that of the base alloy. However, the volume fraction of dispersoids in the base alloy is slightly higher than that in the Cu containing alloys (Figure 7b). Results indicate that the addition of Cu has a strong effect on the size and number density of dispersoids.
The effect of Cu on dispersoid nucleation was studied using the quench technique and TEM observations. The typical TEM images of DU0 and DU120 alloys after heating at 330 °C following water quenching are presented in Figure 8. Lath-like and dark-dot precipitates appeared in the DU0 alloy (Figure 8a), which were metastable β′-Mg2Si precipitates [20,21]. The preferred precipitation directions of the β′-Mg2Si are <001>Al. In the DU120 alloy, a large number of lath-like and dark-dot phases were also observed to be precipitated along the <001>Al direction (Figure 8b). Those precipitates were composed of Al, Mg, Si and Cu based on the TEM-EDS analysis (Figure 9) and were identified as the metastable Q-AlCuMgSi phase [16,17]. It is interesting to note that the number density of Q-phase in the DU120 alloy is higher than that of β′-Mg2Si phase in the DU0 alloy, which can be attributed to the presence of Cu [16].
During the heating process from room temperature to ~350 °C, metastable β′-Mg2Si was formed in the DU0 sample, while metastable Q-AlCuMgSi was precipitated in the aluminum matrix of the DU120 sample. With further heating toward 425 °C, β′-Mg2Si and Q-AlCuMgSi dissolved and disappeared. After heating to 425 °C, a large number of small dispersoids precipitated in the aluminum matrix (Figure 10). Interestingly, all of dispersoids in DU0 and DU120 alloys precipitated along <001>Al directions, which were the preferred precipitation orientation of previous β′-Mg2Si and Q-AlCuMgSi phases (Figure 8). In our previous work [14], it was found that without pre-existing β′-Mg2Si in Al-Mn-Mg 3xxx alloys, α-Al(Mn,Fe)Si dispersoids could hardly form. The pre-existing β′-Mg2Si promoted the nucleation of α-Al(Mn,Fe)Si dispersoids. This is probably attributed to the dissolution of β′-Mg2Si leaving local Si-rich areas in their place, which provided favorable nucleation sites for α-Al(MnFe)Si dispersoids but the effect of the Q-AlCuMgSi phase on dispersoid nucleation has not been reported yet. In the present work, it is confirmed that the pre-existing Q-AlCuMgSi can also promote the α-Al(Mn,Fe)Si dispersoid nucleation in the Cu containing 3004 alloys. In fact, the number density of dispersoids in the DU120 alloy is higher than that in the DU0 alloy (Figure 10), suggesting that pre-existing Q-AlCuMgSi precipitates seem to be more effective to promote dispersoid nucleation than pre-existing β ’-Mg2Si precipitates.
When the samples were further held for 6 h at 425 °C, the dispersoids in both alloys grew to a large size (Figure 10 vs. Figure 6). To examine the thermal stability of dispersoids in the experimental alloys, samples after heat treatment at 425 °C/6 h were held for a prolonged period of 500 h at 350 °C. The TEM images after a long-term thermal holding are shown in Figure 11. The dispersoids in DU0 alloy after 350 °C/500 h are much larger than those in DU120 alloys (Figure 11). The equivalent diameter of dispersoids in DU0 alloy increases from an initial 46.3 nm to 59.2 nm after 350 °C/500 h (Figure 12). The size of dispersoids increases by 28% after a long-term thermal holding, indicating a significant coarsening process during prolonged exposure at 350 °C. On the other hand, the equivalent diameter of dispersoids in the Cu containing DU120 alloy increases from an initial 33.6 nm to 37.1 nm after long-term thermal holding (Figure 12), which represents 10% of the size increase. It demonstrates that the coarsening of dispersoids in the Cu containing alloys is remarkably slower than that in the Cu-free base alloy. Therefore, the Cu addition results in an improvement of the thermal stability of dispersoids, which can be beneficial to the elevated-temperature properties of materials during a long-time exposure at a high service temperature. The mechanism by which the presence of Cu improves the thermal stability of dispersoids is not yet clear.

3.2. Influence of Cu on Mechanical Properties

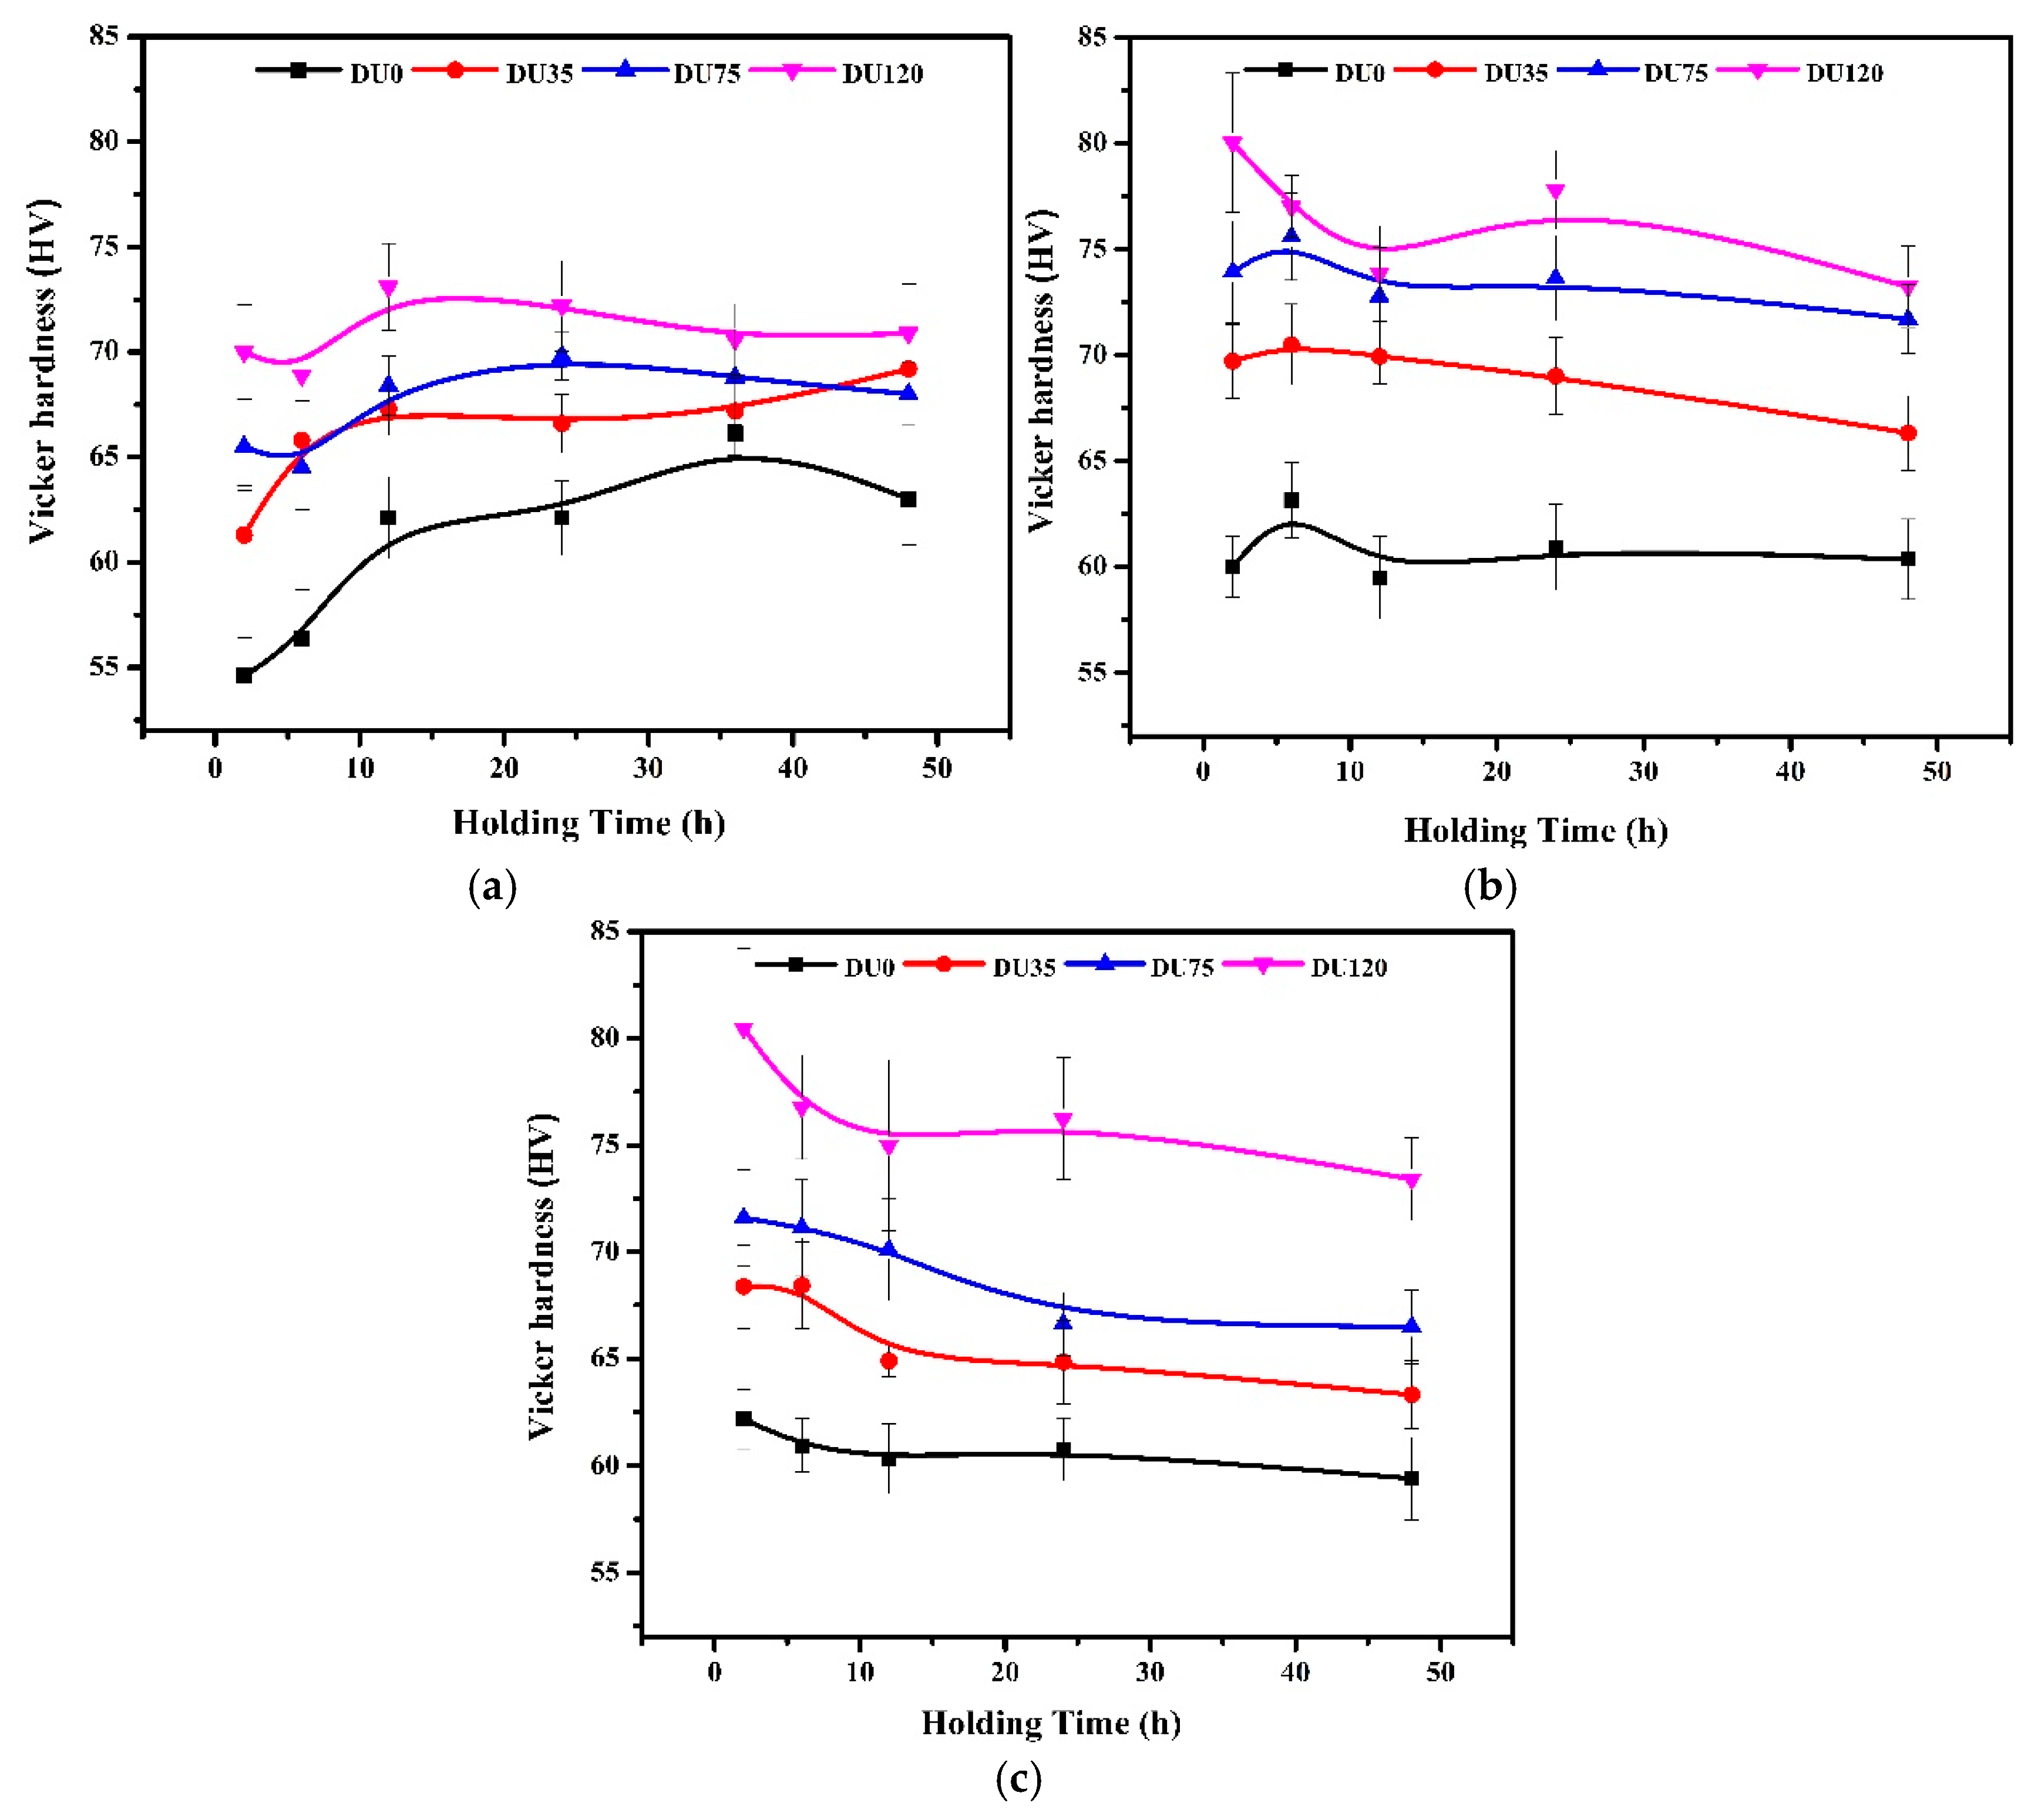
3.2.1. Influence of Cu on Microhardness at Ambient Temperature

Figure 13 shows the microhardness evolution of experimental alloys at three treatment temperatures as a function of holding time. When the samples were treated at 375 °C, the peak hardness was reached at different holding times for the four alloys. For example, the peak hardness of the DU0 alloy (65 HV) was reached after 36 h while it took 12 h (73 HV) for the DU120 alloy. The peak values of microhardness and the corresponding times of all alloys are listed in Table 2. When treated at 425 °C (Figure 13b), the peak hardness of DU0, DU35 and DU75 alloys was reached after holding for 6 h. For the DU120 alloy, the peak value is 80 HV at 425 °C/2 h, which is slightly higher than the value of 77 HV after 425 °C/6 h. When treated at 475 °C (Figure 13c), the peak hardness of all four alloys was reached after 2 h. After holding more than 2 h, the hardness of all four alloys decreased with the increase of the holding time. Based on the above observations, the heat treatment condition, 425 °C for 6 h, is used to study the effect of Cu addition on mechanical properties and creep resistance.
In general, the microhardness of all Cu containing alloys is higher than that of the Cu-free base alloy at any given treatment temperature and holding time. Moreover, the microhardness increases with the increase of Cu content (Figure 13). It is worth mentioning that dispersoid precipitation was observed in all the experimental alloys at the three heat treatment temperatures. The microhardness evolution involves the dispersoid strengthening and solid solution strengthening during heat treatment. The finer size and higher number density of dispersoids in the Cu containing alloys (Figure 7a) promotes dispersoid strengthening. On the other hand, to evaluate the solute solution strengthening, the amount of solute atoms in the aluminum matrix was evaluated by electrical conductivity. The values of electrical conductivity corresponding to the peak hardness are also listed in Table 2. The electrical conductivity of the Cu containing alloys is generally lower than that of the base alloy, and the values decrease with the increase of Cu content. It indicates that more Cu solute atoms are present in the high Cu containing alloys, which are beneficial to the microhadness due to solid solution strengthening.

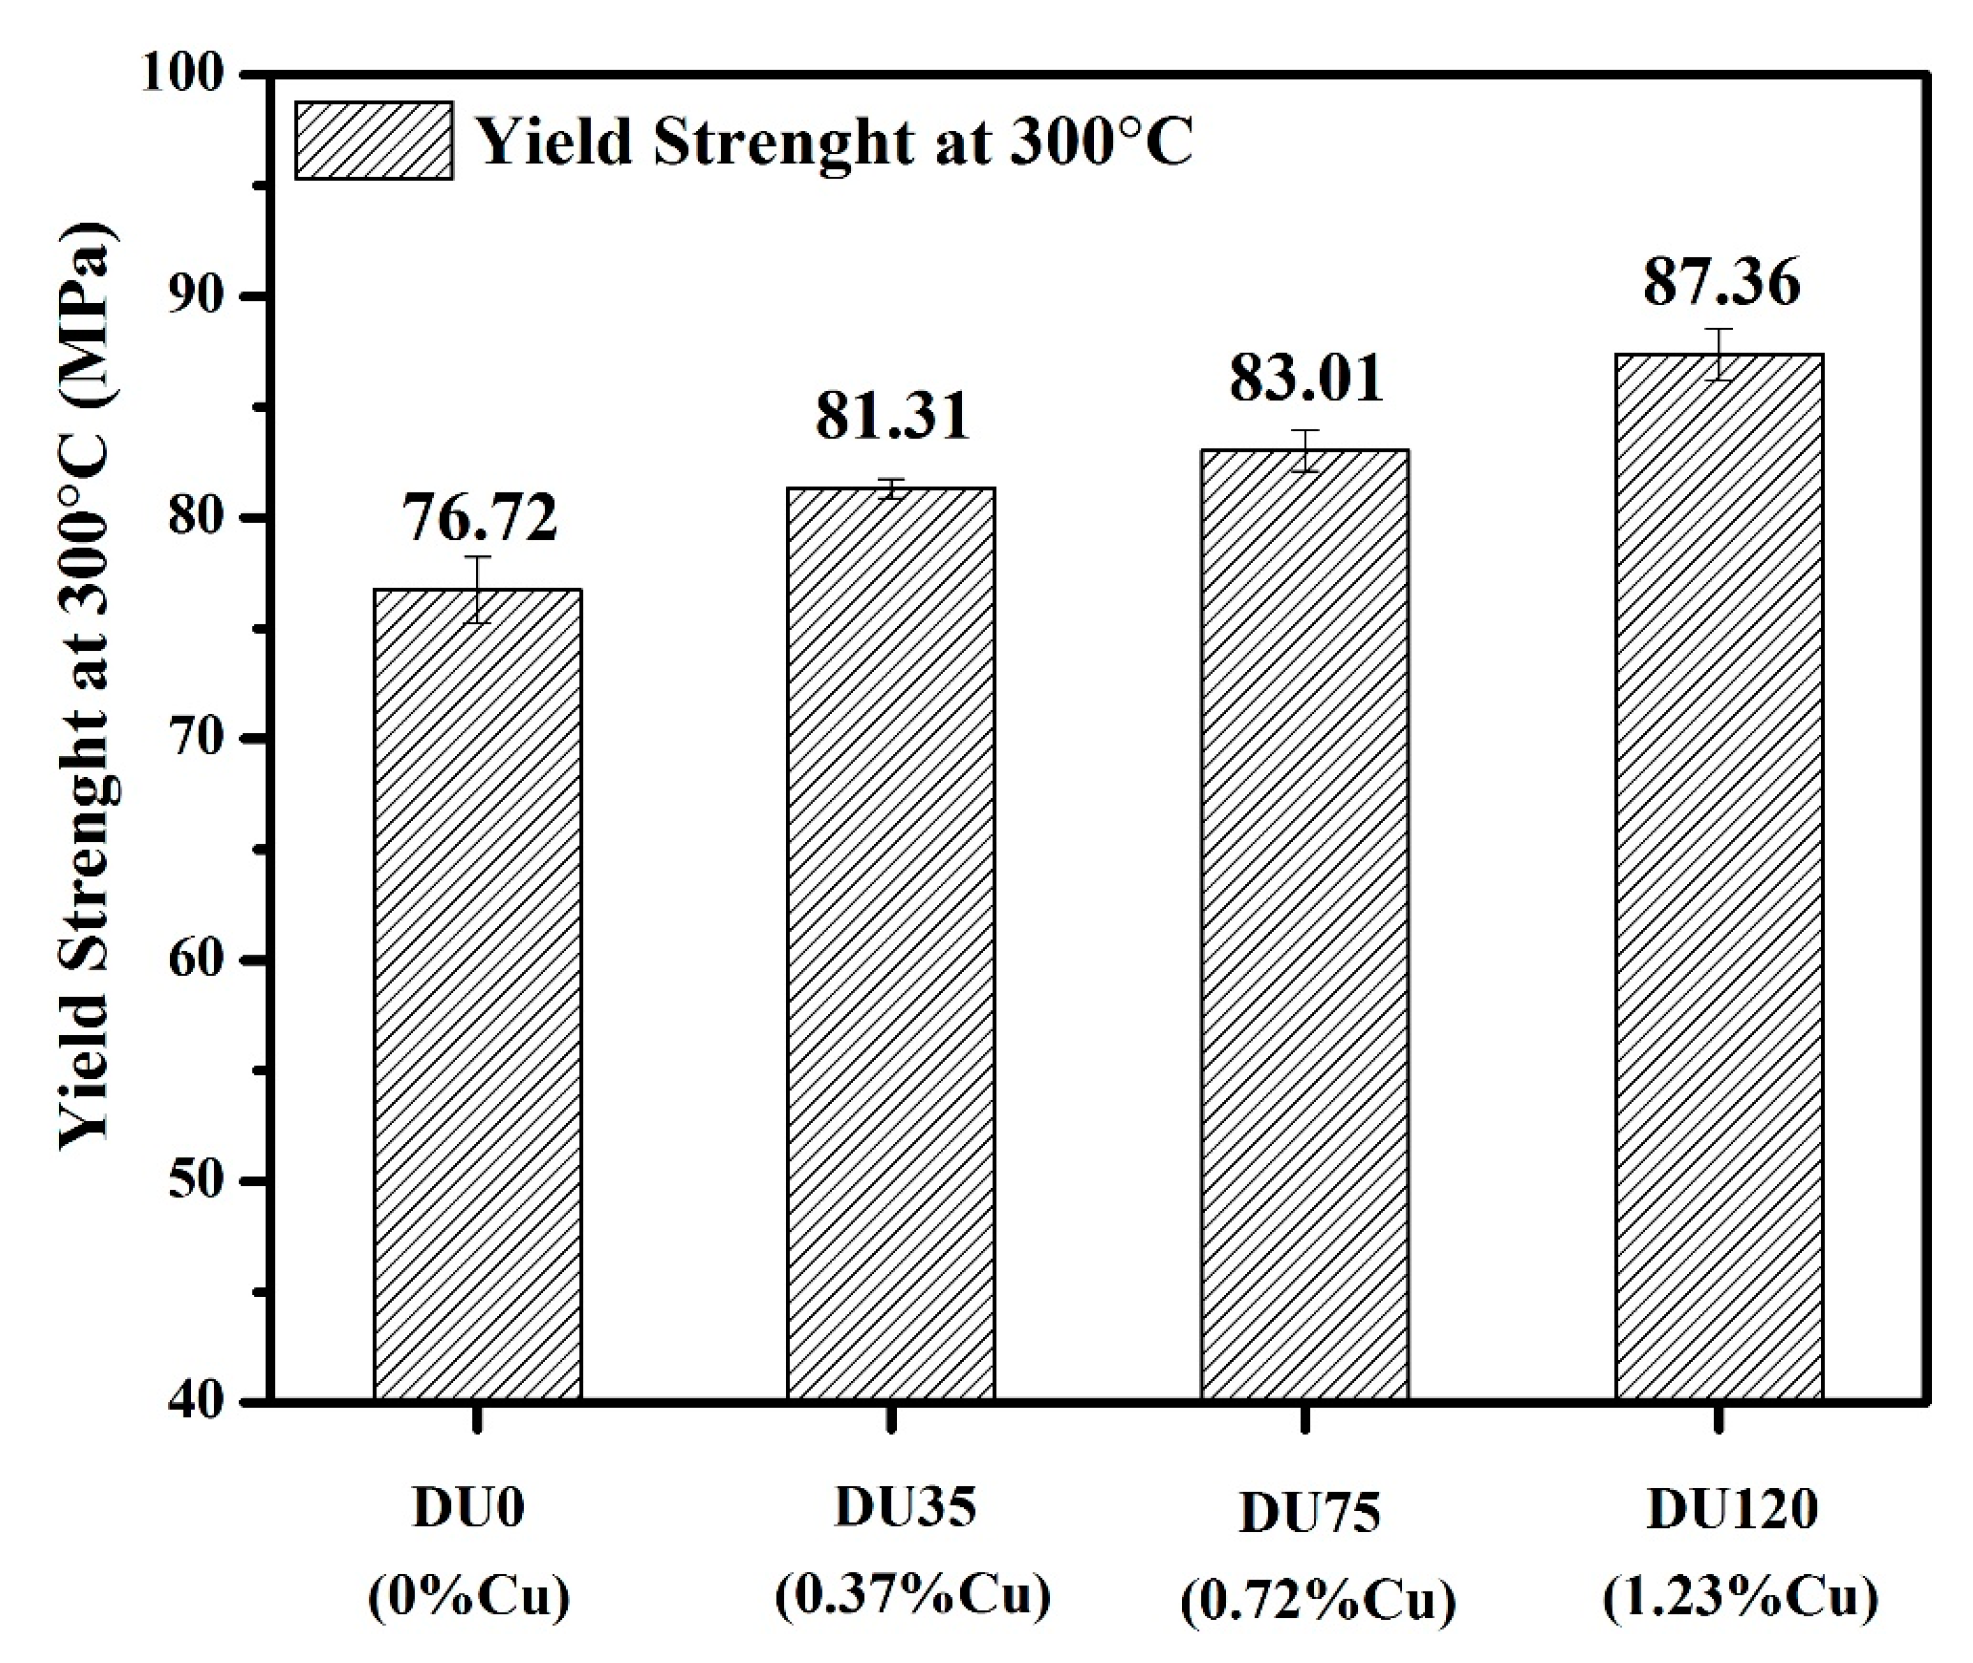
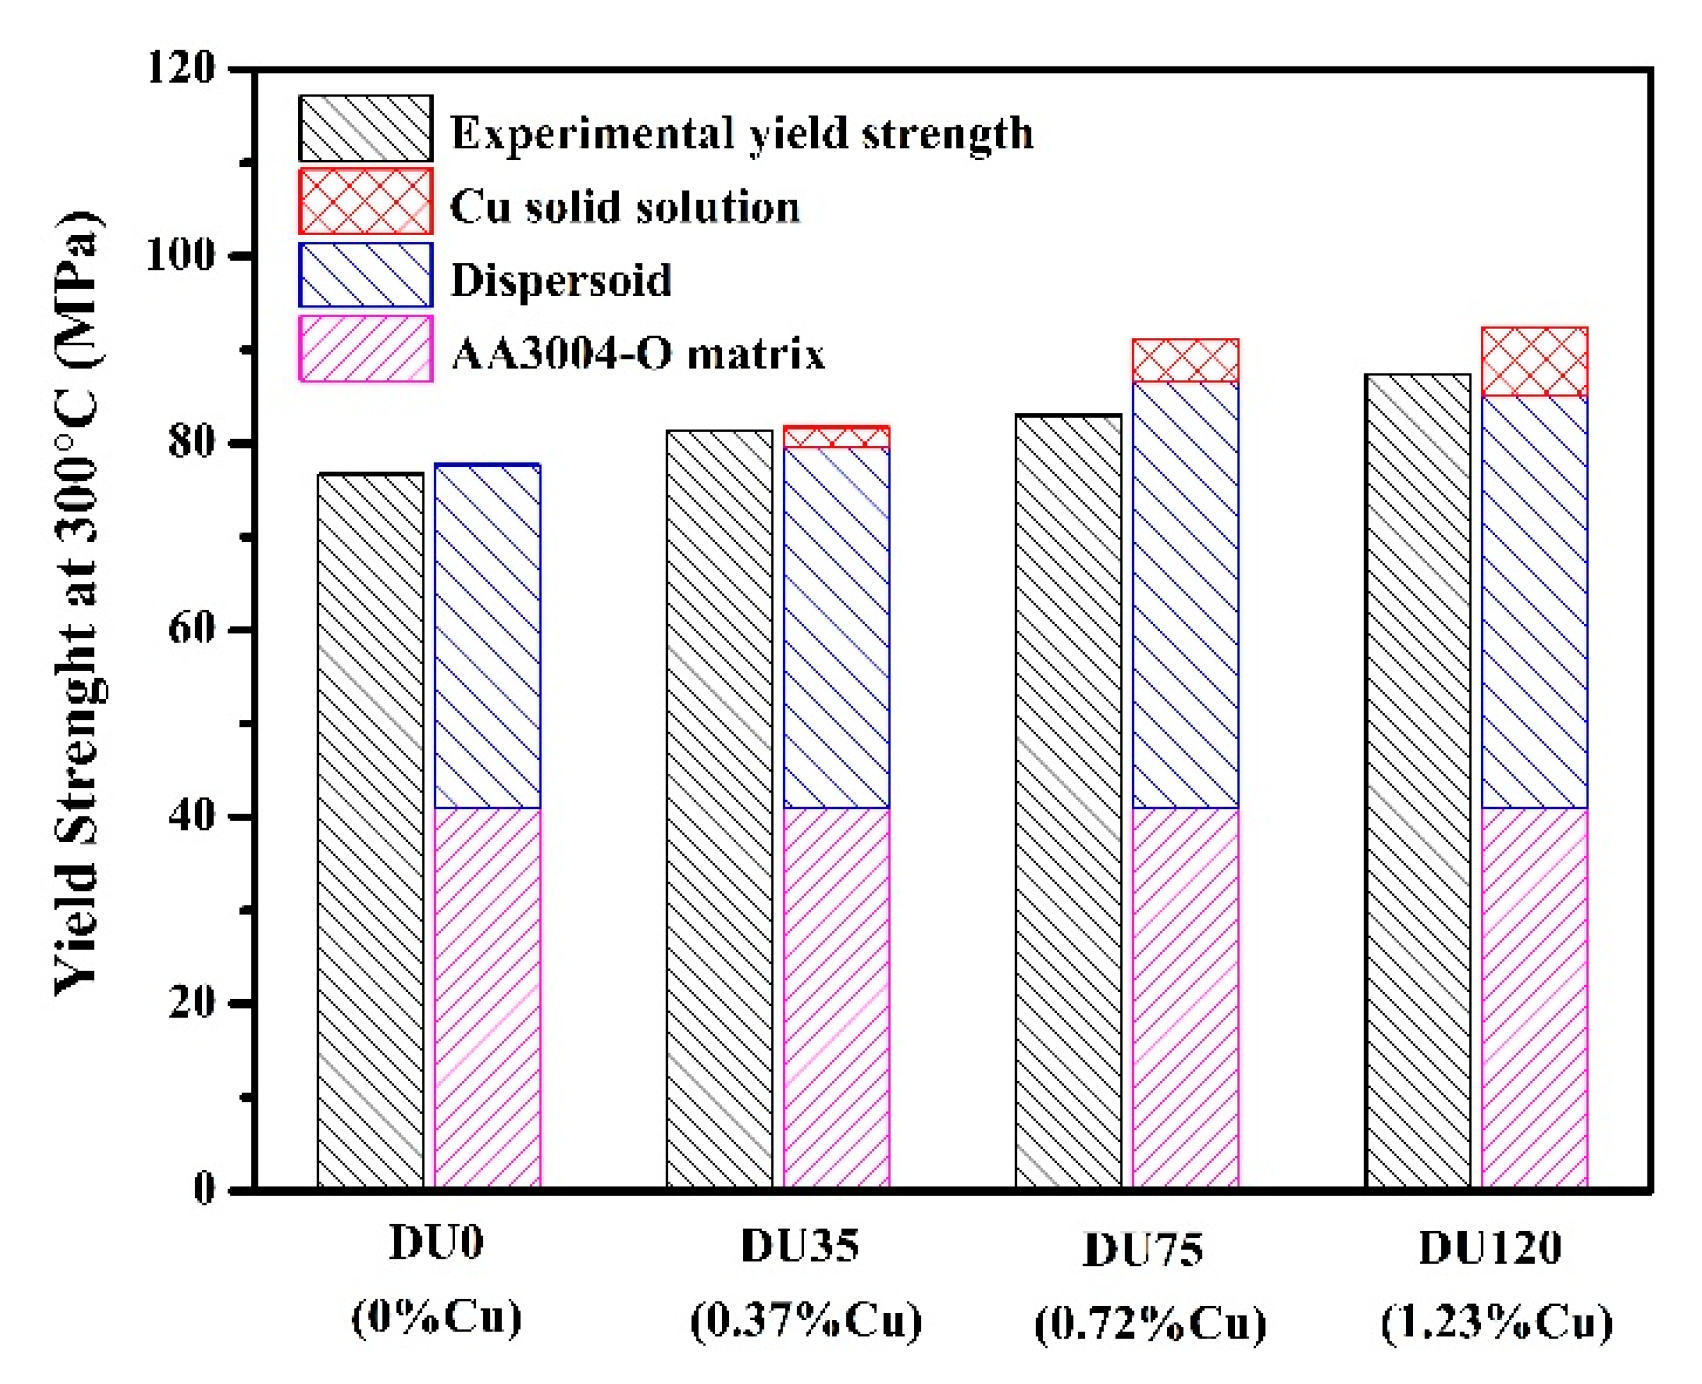
3.2.2. Influence of Cu on Yield Strength at Elevated Temperature

The yield strengths of the four experimental alloys at 300 °C are shown in Figure 14. Generally, the yield strengths of the Cu containing alloys are higher than that of the Cu-free base alloy. Moreover, the yield strength increases with the increase of Cu content. Among all the experimental alloys, the maximum yield strength is 87.4 MPa in the DU120 alloy, which is 14% higher than that in the DU0 alloy (76.7 MPa). It is apparent that the Cu addition improves the yield strength at elevated temperatures, which is likely attributed to dispersoid strengthening and solid solution strengthening.
To clarify the strength contributions, the yield strength at 300 °C is assessed based on the assumption that the contribution of the yield strength is composed of: (1) dispersoid strengthening; (2) Cu solid solution strengthening and (3) aluminum matrix contribution (including contributions of aluminum grains, intermetallic particles and other solute atoms):
σ y = σ m + Δ σ S S + Δ σ d i s p
where σ y is the yield strength, σ m is the matrix strength, Δ σ S S is the strengthening by solid solution, Δ σ d i s p is the strengthening by α-Al(Mn,Fe)Si dispersoids.
For the dispersoid strengthening, Orowan bypassing mechanism can be used to calculate the dispersoid strengthening contribution ( Δ σ D i s p ) using the Equation (3) [1,8]:
Δ σ D i s p   =   0.84 M G b 2 π ( 1 v ) 1 / 2 λ ln r b
λ = r ( 2 π 3 f ) 1 / 2
where M is the Taylor factor for aluminum, which is equal to 3.06 [22]; G is the shear modulus, G = 21.1 GPa for Al matrix at 300 °C [22]; b is the burgers vector, for aluminum b = 2.86 nm [1]; v is the Poison ratio, which is equal to 0.33 for aluminum [1]; λ is the inter-particle spacing of dispersoids; r is the average radius and f is the volume fraction of dispersoids.
Using the dispersoid data in Figure 7, the calculated results of the dispersoid strength contribution are 45.9 MPa, 48.2 MPa, 57.1 MPa and 55.3 MPa for DU0, DU35, DU75 and DU120 alloys, respectively. It should be noticed that the Orowan bypassing mechanism (Equation (3)) assumes that the particles uniformly distribute in the matrix. However, the dispersoids in Al-Mn-Mg 3004 alloy have a non-uniform distribution at the large scale—see Figure 4. At the macro scale view, the dispersoid distribution looks like a shell structure, in which the dispersoid zone where the dispersoids densely formed inside the dendrite cell, is surrounded by a large dispersoid free zone. Under mechanical stress, the movement of dislocations has large resistance in the dispersoid zone. However, the dislocations can easily pass in the surrounding dispersoid free zone. Therefore, the calculated results of the dispersoid strength contribution are most likely overestimated. Up to now, there is no literature available that can provide an accurate constitutive equation to assess the strengthening effect in such a complex situation. Considering the volume fractions of the dispersoid free zone in all experimental alloys are approximately 20% (Figure 5), it might be reasonable to account for 80% of the calculated values of the dispersoid strength contribution from the Equation (3) as a first approximation (Table 3).
On the other hand, solute Cu atoms in the matrix can have contribution to the yield strength. The yield strength contribution ( Δ σ S S ) of solute atoms can be estimated according to Equation (5) [23,24]:
Δ σ S S = H C α
where C is the concentration of solute atoms, H was the yield strength increment provided by solute atoms per weight percentage, α is a constant and α = 1.
Here, most of the Cu content in the experimental alloys are assumed to be in solid solution because the amount of Cu detected in the intermetallic particles and dispersoids is very limited. However, there is no published data on H available for Cu at elevated temperatures. Based on the yield strength difference between an AA1100-O alloy and an AA2024-O alloy (4.5% Cu) measured at 315 °C [25], it was calculated that 1% Cu can contribute 6 MPa yield strength increment, which was used as a close approximation of H for Cu solute atoms at 300 °C. Based on Equation (5), the upper limit of the strength contributions of Cu solute atoms are 2.1 MPa, 4.5 MPa and 7.2 MPa for DU35, DU75 and DU120 alloys, respectively (Table 3).
To estimate the yield strength contribution of the aluminum matrix, the yield strength of AA3004-O alloy at 315 °C (41 MPa) [25] was used as a reasonable approximation, because the chemical compositions of all experimental alloys are similar to AA3004 alloy except the Cu content.
The contribution of the different strengthening components is listed in Table 3. The overall calculated results of the yield strength at 300 °C are compared with the experimentally measured ones (Figure 15). The calculated results agree well with experimentally measured strengths in all four alloys.
It can be seen that the dispersoid strengthening contributes approximately 50% of the total yield strength, indicating that it is the main strengthening mechanism at elevated temperatures in the experimental alloys. Among all four alloys, the dispersoid strengthening contribution of DU0 alloy is the lowest due to large dispersoid size and low number density (Figure 7a). As the Cu content increases, the dispersoid strengthening becomes stronger. The high number density and small size of dispersoids in DU75 and DU120 alloys are main factor providing the positive effect of the dispersoid strengthening. The calculated results of the Cu solute atoms show that the solid solution strengthening increases with increasing Cu content and it reaches the maximum of 7.2 MPa in the DU120 alloy. In brief, the addition of Cu improves the dispersoid strengthening by increasing the dispersoid number density and decreasing of the dispersoid size. Moreover, the Cu solute atoms in the matrix provide the solid solution strengthening for the Cu containing alloys.

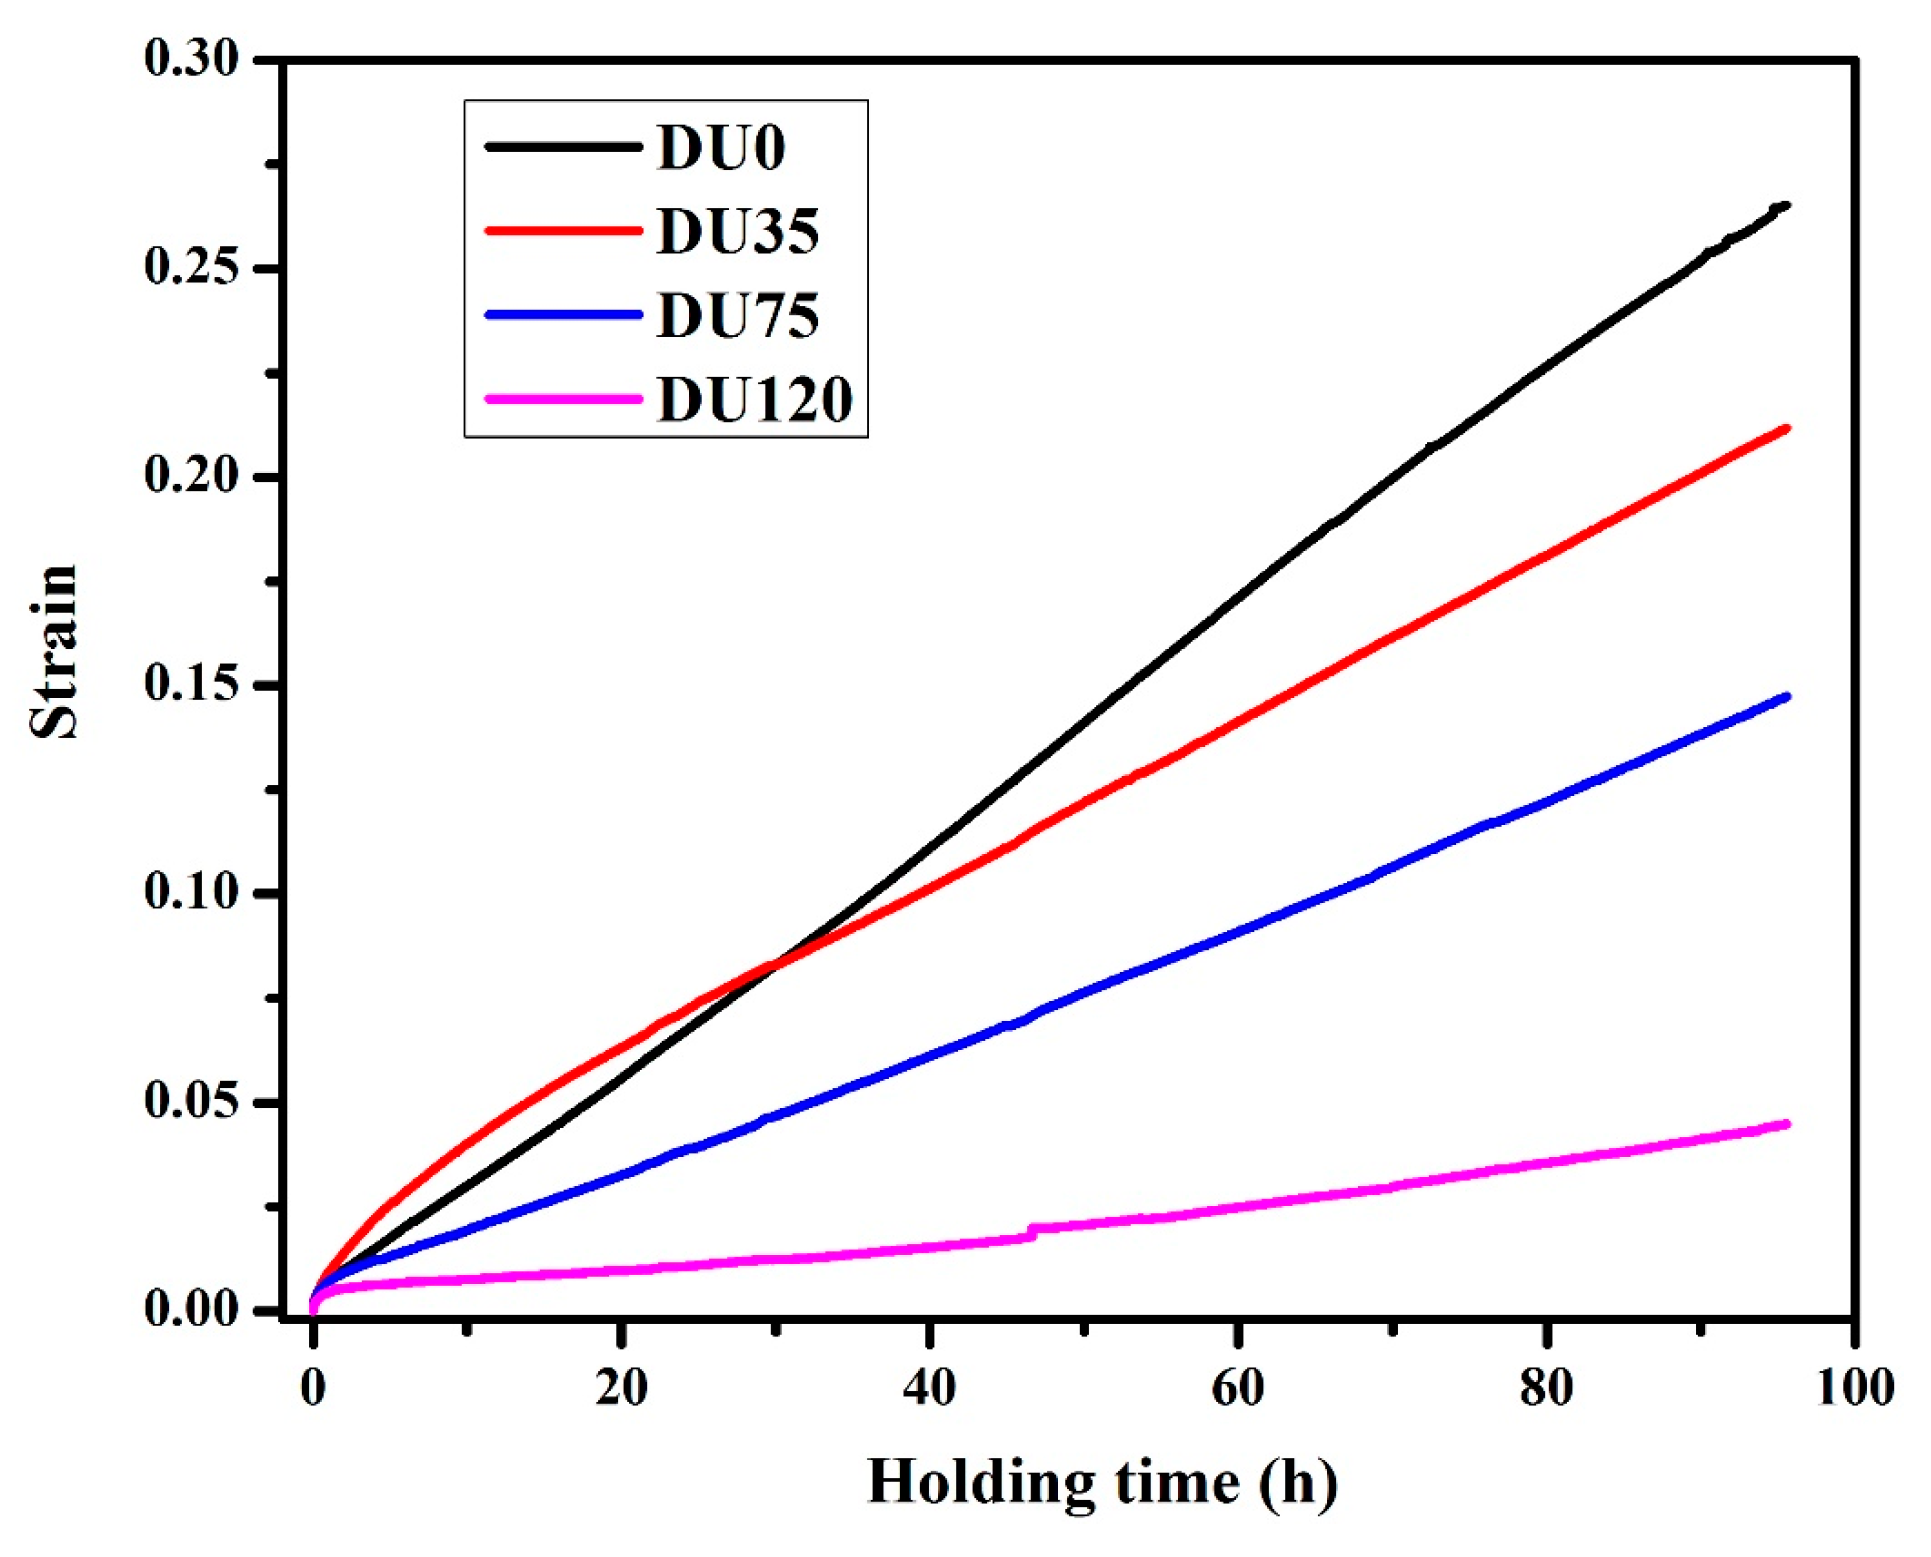
3.2.3. Influence of Cu on Creep Resistance

Creep resistance is an important property for the materials working at elevated temperatures. Figure 16 shows the typical creep curves of all four alloys at 300 °C with a constant load of 58 MPa. The total creep stains are 0.27, 0.22, 0.14 and 0.035 for DU0, DU35, DU75 and DU120 alloys, respectively. It is evident that the total creep strain significantly decreases with increasing Cu content, indicating a remarkable improvement of creep resistance with the increase of Cu content at elevated temperatures. Moreover, the minimum creep rate is calculated to be 7.8 × 10⁻⁷ s−1, 5.88 × 10⁻⁷ s−1, 4.1 × 10⁻⁷ s−1 and 1.2 × 10⁻⁷ s−1 for DU0, DU35, DU75 and DU120 alloys, respectively. Similar to the trend of the total creep stain, the minimum creep rate also significantly decreases with increasing Cu content.
According to the microstructure observations in the Section 3.1, the addition of Cu increased the dispersoid number density and decreased the dispersoid size (Figure 7a). Dispersoids generally act as obstacles to inhibit the movement of dislocations. Obviously, the higher the number density and smaller size of dispersoids, the higher the creep resistance is, due to their inhibiting effect on the dislocation migration during creep deformation. On the other hand, the solute atoms in the aluminum matrix also play an important role on creep resistance because the interactions between solute atoms and dislocations retard the movement of dislocations. Thus, a better creep resistance can be expected with the increase of Cu solute atoms in the Cu containing alloys.

4. Conclusions

(1) The addition of Cu in an Al-Mn-Mg 3004 alloy promotes the α-Al(Mn,Fe)Si dispersoid precipitation by increasing the number density of dispersoids and decreasing the size of dispersoids.
(2) β′-Mg2Si precipitation in the Cu-free base alloy and Q-AlCuMgSi precipitation in the Cu containing alloys were observed during the heating stage of the heat treatment. Although dissolved during further heating, both pre-existing β′-Mg2Si and Q-AlCuMgSi precipitates can provide favorable nucleation sites for dispersoid precipitation.
(3) The coarsening resistance of α-Al(Mn,Fe)Si dispersoids in the 1.2% Cu containing alloy is significantly higher than that in the Cu-free base alloy under a prolonged thermal holding at 350 °C for 500 h.
(4) The addition of Cu improves the microhardness at ambient temperatures as well as the yield strength and creep resistance at 300 °C. The higher the Cu content in the alloys, the higher the strength and the creep resistance the alloys have. It is attributed mainly to dispersoid strengthening and Cu solid solution strengthening.
(5) The yield strength contribution at 300 °C is quantitatively evaluated based on the dispersoid, solid solution and matrix contributions. It is confirmed that dispersoid strengthening is the main strengthening mechanism at elevated temperatures in the experimental alloys. The predicted yield strengths at 300 °C are in good agreement with experimental data.

Acknowledgments

The authors would like to acknowledge the financial support of the Natural Sciences and Engineering Research Council of Canada (NSERC) and Rio Tinto Aluminum through the NSERC Industry Research Chair in the Metallurgy of Aluminum Transformation at University of Quebec at Chicoutimi.

Author Contributions

Zhen Li, Zhan Zhang and X.-Grant Chen conceived and designed the experiment; Zhen Li performed the experiments; Zhen Li, Zhan Zhang and X.-Grant Chen analyzed the data and wrote the paper.

Conflicts of Interest

The authors declare no conflict of interest.

References

  1. Li, Y.J.; Muggerud, A.M.F.; Olsen, A.; Furu, T. Precipitation of partially coherent α-Al(Mn,Fe)Si dispersoids and their strengthening effect in AA 3003 alloy. Acta Mater. 2012, 60, 1004–1014. [Google Scholar] [CrossRef]
  2. Dehmas, M.; Aeby-Gautier, E.; Archambault, P.; Serrière, M. Interaction between Eutectic Intermetallic Particles and Dispersoids in the 3003 Aluminum Alloy during Homogenization Treatments. Metall. Mater. Trans. A 2013, 44, 1059–1073. [Google Scholar] [CrossRef]
  3. Li, Y.J.; Arnberg, L. Quantitative study on the precipitation behavior of dispersoids in DC-cast AA3003 alloy during heating and homogenization. Acta Mater. 2003, 51, 3415–3428. [Google Scholar] [CrossRef]
  4. Huang, H.-W.; Ou, B.-L. Evolution of precipitation during different homogenization treatments in a 3003 aluminum alloy. Mater. Des. 2009, 30, 2685–2692. [Google Scholar] [CrossRef]
  5. Muggerud, A.M.F.; Walmsley, J.C.; Holmestad, R.; Li, Y. Combining HAADF STEM tomography and electron diffraction for studies of α-Al(Fe,Mn)Si dispersoids in 3xxx aluminium alloys. Philos. Mag. 2015, 95, 744–758. [Google Scholar] [CrossRef]
  6. Liu, K.; Chen, X.G. Development of Al–Mn–Mg 3004 alloy for applications at elevated temperature via dispersoid strengthening. Mater. Des. 2015, 84, 340–350. [Google Scholar] [CrossRef]
  7. Li, Z.; Zhang, Z.; Chen, X.G. Effect of magnesium on dispersoid strengthening of Al–Mn–Mg–Si (3xxx) alloys. Trans. Nonferr. Met. Soc. China 2016, 26, 2793–2799. [Google Scholar] [CrossRef]
  8. Muggerud, A.M.F.; Mørtsell, E.A.; Li, Y.; Holmestad, R. Dispersoid strengthening in AA3xxx alloys with varying Mn and Si content during annealing at low temperatures. Mater. Sci. Eng. A 2013, 567, 21–28. [Google Scholar] [CrossRef]
  9. Liu, K.; Chen, X.-G. Evolution of Intermetallics, Dispersoids, and Elevated Temperature Properties at Various Fe Contents in Al-Mn-Mg 3004 Alloys. Metall. Mater. Trans. B 2016, 47, 3291–3300. [Google Scholar] [CrossRef]
  10. Lodgaard, L.; Ryum, N. Precipitation of dispersoids containing Mn and/or Cr in Al–Mg–Si alloys. Mater. Sci. Eng. A 2000, 283, 144–152. [Google Scholar] [CrossRef]
  11. Hirasawa, H. Precipitation process of Al-Mn and Al-Cr supersaturated solid solution in presence of age hardening phases. Scr. Metall. 1975, 9, 955–958. [Google Scholar] [CrossRef]
  12. Liu, K.; Ma, H.; Chen, X.G. Enhanced elevated-temperature properties via Mo addition in Al-Mn-Mg 3004 alloy. J. Alloys Compd. 2017, 694, 354–365. [Google Scholar] [CrossRef]
  13. Li, Z.; Zhang, Z.; Chen, X.G. Microstructure, elevated-temperature mechanical properties and creep resistance of dispersoid-strengthened Al-Mn-Mg 3xxx alloys with varying Mg and Si contents. Mater. Sci. Eng. A 2017, 708, 383–394. [Google Scholar] [CrossRef]
  14. Li, Z.; Zhang, Z.; Chen, X.G. Effect of metastable Mg2Si and dislocations on α-Al(MnFe)Si dispersoid formation in Al-Mn-Mg 3xxx alloys. Metall. Mater. Trans. A 2018. submitted. [Google Scholar]
  15. Marlaud, T.; Deschamps, A.; Bley, F.; Lefebvre, W.; Baroux, B. Influence of alloy composition and heat treatment on precipitate composition in Al–Zn–Mg–Cu alloys. Acta Mater. 2010, 58, 248–260. [Google Scholar] [CrossRef]
  16. Marioara, C.; Andersen, S.; Stene, T.; Hasting, H.; Walmsley, J.; Van Helvoort, A.; Holmestad, R. The effect of Cu on precipitation in Al–Mg–Si alloys. Philos. Mag. 2007, 87, 3385–3413. [Google Scholar] [CrossRef]
  17. Wang, X.; Esmaeili, S.; Lloyd, D.J. The sequence of precipitation in the Al-Mg-Si-Cu alloy AA6111. Metall. Mater. Trans. A 2006, 37, 2691–2699. [Google Scholar] [CrossRef]
  18. Marioara, C.D.; Andersen, S.J.; Røyset, J.; Reiso, O.; Gulbrandsen-Dahl, S.; Nicolaisen, T.-E.; Opheim, I.-E.; Helgaker, J.F.; Holmestad, R. Improving Thermal Stability in Cu-Containing Al–Mg–Si Alloys by Precipitate Optimization. Metall. Mater. Trans. A 2014, 45, 2938–2949. [Google Scholar] [CrossRef]
  19. Man, J.; Jing, L.; Jie, S.G. The effects of Cu addition on the microstructure and thermal stability of an Al–Mg–Si alloy. J. Alloys Compd. 2007, 437, 146–150. [Google Scholar] [CrossRef]
  20. Edwards, G.A.; Stiller, K.; Dunlop, G.L.; Couper, M.J. The precipitation sequence in Al–Mg–Si alloys. Acta Mater. 1998, 46, 3893–3904. [Google Scholar] [CrossRef]
  21. Vissers, R.; van Huis, M.A.; Jansen, J.; Zandbergen, H.W.; Marioara, C.D.; Andersen, S.J. The crystal structure of the β′ phase in Al–Mg–Si alloys. Acta Mater. 2007, 55, 3815–3823. [Google Scholar] [CrossRef]
  22. Qin, J.; Zhang, Z.; Chen, X.-G. Mechanical Properties and Strengthening Mechanisms of Al-15 Pct B4C Composites with Sc and Zr at Elevated Temperatures. Metall. Mater. Trans. A 2016, 47, 4694–4708. [Google Scholar] [CrossRef]
  23. Huskins, E.L.; Cao, B.; Ramesh, K.T. Strengthening mechanisms in an Al–Mg alloy. Mater. Sci. Eng. A 2010, 527, 1292–1298. [Google Scholar] [CrossRef]
  24. Ryen, Ø.; Holmedal, B.; Nijs, O.; Nes, E.; Sjölander, E.; Ekström, H.-E. Strengthening mechanisms in solid solution aluminum alloys. Metall. Mater. Trans. A 2006, 37, 1999–2006. [Google Scholar] [CrossRef]
  25. Kaufman, J.G. Properties of Aluminum Alloys: Tensile, Creep, and Fatigue Data at High and Low Temperatures; ASM International: Materials Park, OH, USA, 1999; pp. 9, 41, 102. ISBN 978-0-87170-632-4. [Google Scholar]
Figure 1. The schematic diagram of two heat treatment conditions: (a) for the precipitation of dispersoids and (b) for the dispersoid nucleation.
Metals 08 00155 g001
Figure 2. Typical as-cast microstructures of (a) DU0 alloy and (b) DU120 alloy.
Metals 08 00155 g002
Figure 3. The volume fractions of intermetallic particles in four experimental alloys.
Metals 08 00155 g003
Figure 4. Optical images of (a) DU0 alloy and (b) DU120 alloy after heat-treatment at 425 °C for 6 h.
Metals 08 00155 g004
Figure 5. The volume fractions of the dispersoid zones and dispersoid free zones (DFZ) in the experimental alloys.
Metals 08 00155 g005
Figure 6. TEM (transmission electron microscope) bright field images of dispersoids after heat-treated at 425 °C for 6 h (a) DU0 alloy (0% Cu); (b) DU35 alloy (0.37% Cu); (c) DU75 alloy (0.72% Cu) and (d) DU120 alloy (1.23% Cu).
Metals 08 00155 g006
Figure 7. (a) The equivalent diameter and number density of dispersoids and (b) the volume fraction of dispersoids in the experimental alloys.
Metals 08 00155 g007
Figure 8. TEM images of as-heated 330 °C samples followed water quenching: (a) DU0 alloy and (b) DU120 alloy.
Metals 08 00155 g008
Figure 9. The chemical composition of Q-phase in DU120 alloy.
Metals 08 00155 g009
Figure 10. TEM images of as-heated 425 °C samples followed water quenching: (a) DU0 and (b) DU120 alloys.
Metals 08 00155 g010
Figure 11. TEM images of dispersoids after holding at 350 °C for 500 h in (a) DU0 alloy and (b) DU120 alloy.
Metals 08 00155 g011
Figure 12. The comparison of the dispersoid size before and after a long-term thermal holding at 350 °C/500 h.
Metals 08 00155 g012
Figure 13. Microhardness of experimental alloys as a function of holding time at (a) 375 °C; (b) 425 °C and (c) 475 °C.
Metals 08 00155 g013
Figure 14. Yield strength at 300 °C of the experimental alloys after the heat treatment at 425 °C/6 h.
Metals 08 00155 g014
Figure 15. The comparison of the yield strength at 300 °C between calculated and experimentally measured ones.
Metals 08 00155 g015
Figure 16. Typical creep curves of four experimental alloys, tested at 300 °C with a constant load of 58 MPa.
Metals 08 00155 g016
Table 1. Chemical composition of experimental alloys (wt. %).
Alloy CodeCuSiFeMnMgAl
DU0 (base)00.240.491.230.97Bal.
DU350.370.270.531.251.03Bal.
DU750.720.240.531.240.99Bal.
DU1201.230.260.481.271.04Bal.
Table 2. Peak hardness values and their corresponding times and electrical conductivity.
Treatment Temperature (°C)PropertiesDU0DU35DU75DU120
375Peak hardness 65 HV/36 h68 HV/48 h70 HV/24 h73 HV/12 h
EC (MS/m)23.022.822.021.0
425Peak hardness 62 HV/6 h70 HV/6 h75 HV/6 h80 HV/2 h
EC (MS/m)22.522.221.620.5
475Peak hardness 62 HV/2 h68 HV/2 h72 HV/2 h80 HV/2 h
EC (MS/m)21.821.521.220.2
Table 3. The contribution of yield strength at 300 °C by different strengthening components.
Strength ContributionDU0DU35DU75DU120
AA3004-O matrix (MPa)41414141
Dispersoids (MPa)36.738.645.744.2
Cu solid solution (MPa)02.14.57.2
The total calculated results (MPa)77.781.791.292.4
The experimental results (MPa)76.781.383.087.4

