Article

Precipitation and Grain Size Effects on the Tensile Strain-Hardening Exponents of an API X80 Steel Pipe after High-Frequency Hot-Induction Bending

1
Departamento de Engenharia Química e de Materiais—PUC-Rio—DEQM, Pontifícia Universidade Católica do Rio de Janeiro, 222541-900 Rio de Janeiro-RJ, Brazil
2
Centro Brasileiro de Pesquisas Físicas (CBPF), 22290-180 Rio de Janeiro-RJ, Brazil
3
Instituto Nacional de Metrologia, Qualidade e Tecnologia—INMETRO/RJ, 25250-020 Rio de Janeiro-RJ, Brazil
*
Author to whom correspondence should be addressed.
Metals 2018, 8(3), 168; https://doi.org/10.3390/met8030168
Submission received: 30 November 2017 / Revised: 21 February 2018 / Accepted: 24 February 2018 / Published: 9 March 2018
(This article belongs to the Special Issue Mechanical Behavior of High-Strength Low-Alloy Steels)

Abstract

:
This study discusses the use of the Morrison model to estimate the strain-hardening exponent (n) in the presence of precipitation hardening for an API X80 steel pipe. As the grain size becomes larger, high values of n are expected according to the Morrison equation. However, the grain size alone is not sufficient to explain the changes of the strain-hardening exponent (n) after hot-induction bending. The vanadium in the ferritic solid solution has an important influence on the decrease of the precipitation hardening, and consequently on the increase of the values of n, despite the refinement of the grain size and high dislocation densities. Therefore, the effects of grain boundaries on the capability to uniformly distribute deformations within the plastic regime become negligible, which limits the application of the Morrison model to estimate the values of n.

1. Introduction

The American Petroleum Institute (API) establishes standards for steels used in oil-and-gas pipelines, such as the API X80 grade steel. In pipeline construction, some steel pipes of the API class can be subjected to hot-induction bending, which is the usual process to obtain smaller radii of curvature and larger bending angles of up to 90°. The hot-induction bending changes the microstructure and, therefore, the mechanical properties of the hot-bent section of the pipe.
The Hollomon equation (Equation (1)) can in many cases be used to fit the data of the true stress-strain curves in the non-linear section between the yield strength (YS) and ultimate tensile strength (UTS). In this equation, K is the strength coefficient, n is the strain-hardening exponent, and σ and ε are the true stress and true strain, respectively. By definition, n is the slope of the straight line in Equation (2), where the pre-exponential, K, can be found by extrapolating to ε = 1.0 [1].
σ   =   K ε n
ln   σ   =   ln   K   +   n   ln   ε
The K parameter indicates the strength level of the material, and the exponent n indicates the capability to uniformly distribute the deformation. In other words, n evaluates the strain-hardening capability of the material. The values of n can be influenced by processing, test temperatures, as well as the strain rate that was used during the tensile tests. Typical values of n tend to be in the range of 0.15–0.18 for high-strength low-alloy (HSLA) steels and in the range of 0.20–0.23 for low-carbon steels. High-strength materials have lower values of n than low-strength materials [1] because the hardening mechanisms interact with the mobile dislocations, and, therefore, influence the values of n. If the value of n is low, the strain-hardening rate initially is high, but this rate decreases rapidly with further loading.
The effect of grain size (d in mm) on the values of n can be evaluated based on the Morrison model [2], as shown in Equation (3). The refinement of the grain size plays an important role in the mechanical properties of the steels—acting as obstacles for the movements of mobile dislocations and affecting the work-hardening mechanisms of steels.
n   =   5 / ( 10   +   d 1 / 2 )
The formation of dislocation loops around precipitates is responsible for the high initial strain-hardening rate of age-hardened alloys. These loops will repel the subsequent dislocations. Therefore, the stresses that are required to keep the new mobile dislocations in movement increase as the distances between the precipitates decrease. The increase in strength can be affected by both a decrease in the size of the precipitates as well as an increase in the volume fraction.
In this study, we discuss the limitations of the Morrison model for estimating the values of n in the presence of precipitation hardening for an API X80 steel microalloyed with titanium, niobium, and vanadium. The motivation for this study comes from the effects of microstructural changes on the mechanical behavior of this HSLA steel under high-frequency hot-induction bending—which leads to a high level of grain refinement, but with a loss of mechanical properties, especially a loss of the YS. High contents of titanium and niobium can result in the formation of coarse precipitates during the solidification process or during the thermo-mechanical controlled processing (TMCP). Titanium and niobium precipitates are of very difficult solubilization during hot-induction bending. This process has a short austenitizing period (nearly 2 min) within the temperature range of 1060–950 °C, followed by external quenching. The temperature gradient is distributed through the wall thickness of the pipe. Within this scenario, the effect of hot-induction bending on the plasticity of the studied steel pipe and the impact of the solubilization of the vanadium precipitates on the mechanical properties are features of interest for the development of this study.

2. Experimental

2.1. Material

The chemical composition and Carbon Equivalent (Pcm) of the API X80 steel pipe are shown in Table 1. The as-received material (straight stretch of the pipe) was produced from a plate treated by TMCP without accelerated cooling and submitted to the UOE forming process (U for U-ing cold forming from the plate, O for O-ing cold forming from the U shape and, E for cold expansion to meet the geometric tolerances). The nominal wall thickness and diameter of the pipe under study are 19 mm and 508 mm, respectively.

2.2. Heat Treatments

Table 2 describes the different routes applied to obtain the samples: TMCP + UOE processes (sample A), hot-induction bending (samples B and C), hot-induction bending followed by tempering (samples D and E), and normalizing heat treatment at 900 °C for 30 min followed by still-air cooling (sample F).
When the hot-bent section does not reach the expected YS, a tempering—that is often used for stress relief of the hot-bent pipe—can also be applied to harden the hot-bent section by precipitation of microalloying elements (at appropriate temperatures). The samples D and E represent this stage of the hot-bending process. All of the processing routes, especially the normalizing (sample F), were used to obtain the samples that allowed the relationship between the experimental values of n and the average microhardness values of the ferritic grains to be evaluated.
The hot-induction bending was performed with the following parameters: 105 kW, 1050 °C, 2500 Hz, and bending speed of 0.6 mm/s. The hot-bent section was externally cooled with water jets at 0.3 kg/cm2. The regions of the hot-bent section tested were the extrados (external section of the curve arc) and the intrados (internal section of the curve arc).
The tempering of the hot-bent section consisted of heating cycles from 200 °C to the soaking plateau temperatures (600 and 650 °C), with a heating rate of 100 °C/h. In these tempering heat treatments, the soaking times were 1 h and the final cooling was performed in still air.
The Morrison model and a modified model were evaluated to estimate the values of n for these samples obtained by the different processing conditions described in Table 2.

2.3. Characterization

During the processing of the hot bending, the Joule effect, due to the induced currents, promotes temperature gradients, and therefore a microstructural gradient is formed within the pipe wall (in the hot-bent section) after the cooling stage (superficial quenching). The thickness of the layer affected by the induced currents only depends on the frequency that is applied, in this case, 2500 Hz, while the thickness of the quenched layer depends on the bending temperature, the hardenability of the steel, as well as the post-bending quenching features. Thus, all of the metallographic specimens, as well as the tensile test specimens, were sampled in the middle of the pipe wall. The transverse cross-sectional samples (20 × 20 × 19 mm3) were cut from different sections of the hot-bent pipe for all of the metallographic analyses. After etching in 2% Nital solution, the samples were examined by optical microscopy (OM) in a Zeiss Axioskop microscope (Carl Zeiss Microscopy GmbH, Göttingen, Germany), and also by scanning electron microscopy (SEM) in a JSM-6510LV JEOL microscope (JEOL Ltd., Tokyo, Japan) operating at 20 kV. Grain sizes were measured in 15 randomly selected fields, using the linear intercept method standardized by the American Society for Testing and Materials (ASTM; West Conshohocken, PA, USA) in Standard E112-96 [3].
Thin-foil samples for transmission electron microscopy (TEM) were prepared from a very thin piece cut from the bulk. These pieces were initially ground to a thickness of 120 μm, and 3 mm diameter disks were punched out of these pieces. Further thinning was obtained by electro polishing in a Tenupol-5 apparatus (Struers ApS, Ballerup, Denmark) at approximately 20 V and 15 °C, using a solution of 95% acetic acid and 5% perchloric acid. The bright-field images were obtained with EM 2010 and EM 2100F microscopes (JEOL Ltd., Tokyo, Japan) operating at 200 kV. TEM analyses of the steel in hot-bent and tempered-and-bent conditions were performed for the intrados and for the intrados tempered at 650 °C, respectively. The objective was to show the interactions between the local precipitation and the dislocations.
The dislocation densities were obtained from the X-ray diffraction (XRD) patterns after the crystallite size effects on the XRD peaks were separated (and removed) from the microstrains (effects). The dislocation density for the steel in the as-received condition (sample A) had already been characterized by TEM in a previous work [4]. The conditions of the XRD measurements were: CoKα radiation (λ = 1.7889 Å), Bragg angles (2θ) ranged from 30° to 135°, angular step of 0.02° and a count time of 5 s per step. The XRD measurements were performed with a D8-Focus diffractometer (Bruker AXS, Karlsruhe, Germany). The standard reference material (SRM) applied for the correction of instrumental broadening was a sample of Corundum SRM 1976 from NIST (National Institute of Standards and Technology, Gaithersburg, MD, USA). Before XRD analyses, the plates of 10 × 10 × 3 mm3 were submitted to traditional metallographic preparation and then electropolished at 15 V to remove the 50 μm superficial layers, using a solution (at 15 °C) of 90% acetic acid and 10% perchloric acid. Due to the anisotropic conditions of the samples, the modified Williamson-Hall methodology was used to obtain the dislocation densities [5,6].
The amounts of the microalloying elements in the ferritic solid solution were determined by ICP-OES techniques using the acidic dissolution method for the preparation of the samples. The tensile specimens were dissolved using a hydrochloric acid solution to extract insoluble carbonitrides of titanium, niobium, vanadium, and molybdenum from the steel [7,8,9]. The supernatants—obtained by centrifugation of the acidic solutions containing the dissolved samples—were analyzed via ICP-OES, and any traces of these elements that were in the ferritic solid solution were determined [10,11,12]. The ICP-OES analyses were performed in an Optima model 7300DV device (PerkinElmer Inc., Waltham, MA, USA) and the vanadium emission line at 292.402 nm was specifically used to determine any vanadium traces in the samples. Given that the chemical composition of the steel is known (Table 1) and is based on the principle of mass conservation (for these elements), the volume fraction of the nano-precipitates (≤10 nm) could be estimated using the Equation (4) [9], where: fv is the volume fraction of the nano-precipitates (total volume of nano-precipitates in 1 μm3 of steel), ρFe and ρppt are the densities of iron (7.87 g/cm3) and the precipitate, respectively, and wt %ppt is the mass percentage of the nano-precipitates in the steel.
f v = ( 1   μ m 3 × ρ Fe × w t   % ppt ) / ρ ppt

2.4. Mechanical Tests

Tensile tests were carried out at room temperature using a universal testing machine EMIC model DL20000 (EMIC, São José dos Pinhais, Brazil). The test speed was 1 mm/min and the strain rate was 0.04 min−1. The test speed remained constant over the strain interval when the values of n were determined, allowing accurate measurements of the loads and of the displacements during the tensile tests [13].
The preparations of the specimens and the tensile tests were performed in accordance with API 5 L standard [14] and ASTM A370 [15]. Three standard round tensile specimens from the reduced section (transverse sub-size specimens from API 5L) were used to characterize the tensile mechanical properties. The values of n were obtained from the stress-strain curves, according to the ASTM E646-07 standard [13]. In the plastic region of the stress-strain curves, seven points uniformly distributed between the YS and the UTS were used to calculate the values of n.
Finally, the Vickers microhardness values (HV) were taken from 100 g of the ferrite using a HMV-2/HMV-2T/SHIMADZU microdurometer (SHIMADZU Corporation, Kyoto, Japan), applying a load of 10 g for 15 s. The sizes of the individual grains of the ferrite were measured simultaneously with the microhardness measurements. Using samples prepared and etched by traditional metallography techniques and applying the same methodology as the measurement used to obtain the diagonals of the microindenters, the grains of the ferrite could be visualized and their sizes measured. Hence, before taking the microhardness measurements, the individual size of each grain was measured. This procedure was repeated 100 times, where 100 g of the ferrite were randomly chosen and then measured. The resolution of the measurements was 0.01 µm, using a 40× objective lens. The average microhardness values of the samples were correlated with the average values of the experimental n to obtain the modified equations (see next section) that describe the behavior of n associated with the different processing routes that are evaluated in this work.

3. Results and Discussion

Initially, the effect of grain size refinement on n was evaluated based on the Morrison equation [2], and lower values of n for the samples with smaller grain sizes were expected [16,17,18]. However, despite the TMCP, the sample in the as-received condition revealed to have an average grain size larger than the steel in the as-bent condition, as can be seen in the micrographs obtained by OM and SEM in Figure 1 and Figure 2. The microstructure of the steel shows a ferritic matrix with dispersed particles of the martensite-austenite (M-A) constituents and other microphases.
Figure 3 shows the engineering stress-strain curves of the samples that were evaluated in this study. The percentages of the microalloying elements from the chemical composition that precipitated are shown in Table 3. Table 4 summarizes the main properties of the samples and shows that the effect of the grain size alone was not sufficient to explain the changes in the values of n after the hot-induction bending.
A refined dispersion of precipitates can act as an obstacle for dislocations, and when this occurs the additional effect of the grain boundaries becomes negligible. The strain hardening of precipitation-hardened materials is initially very high and rapidly decreases, leading to low values of n [1]. However, the grain size, the precipitation, and the dislocation density—all being primary characteristics responsible for different strengthening mechanisms—are dependent on the processing conditions. These hardening mechanisms have a significant influence on the microhardness of the phases. The values of n were obtained from the stress-strain curves that are shown in Figure 3. Equation (5) was obtained from the correlation between the experimental values of n and the average microhardness of the ferritic grains. The microhardness values that were used to obtain this fitted curve (Figure 4) are related to the processing conditions. Equations (6)–(8) show that it is possible to replace the constants of the Morrison model with the microhardness dependent variables. These modified equations were able to satisfy the experimental results in this work. Therefore, the effects of the processing and also of all the hardening mechanisms were considered additionally to the effect of the refinement of the grain size (d in mm), despite the redundancy introduced by the grain size effects on the hardness of the ferrite phase.
n   =   0.118   +   1.49 Exp ( 0.0081   ×   HV   ( 10   g ) )
n   =   a f ( HV   ( 10   g ) ) / { b f ( HV   ( 10   g ) )   +   d 1 / 2 }
a   =   { b f ( HV   ( 10   g ) ) } / 2
b   =   1.316   +   214.46 Exp ( 0.0156   ×   HV   ( 10   g ) )
Table 3 shows the influences of hot-induction bending and tempering on the percentage of the alloying elements that are precipitated. For example, for the steel in the as-received condition, 41.7% of the vanadium precipitated, while 58.3% of the vanadium is in ferritic solid solution. The percentage of precipitated vanadium decreases due to the hot-induction bending (to 25.9% in the intrados and to 12.7% in the extrados), increasing again after the post tempering (to approximately 30% in the tempered extrados). Thus, the tempering changes the amount of the vanadium in the ferritic solid solution of this steel in the hot-bent condition due to the precipitation process.
Table 3 shows that most of the titanium, as well as the niobium, remained in the precipitates, possibly as carbonitrides like in the as-received steel where the coarser precipitates were not dissolved during hot-bending. Amounts of copper and molybdenum remain similar for the steel in all conditions studied. The solubilization behaviors of the microalloying elements in the austenite and their precipitates are extensively reported in the literature [8,19,20]. The amount of vanadium that precipitates varies due to the hot-induction bending and also due to the tempering. This variation is reflected in the improvement of the YS after tempering of the steel in the hot-bent condition, as shown in Table 4, where the higher volume fractions of VC0.75 are related to the higher values of YS.
The cooling rate that is induced by the superficial quenching was high enough to delay the formation of the precipitates, including the chromium, vanadium, titanium, molybdenum, and niobium precipitates. Additionally, the precipitation of molybdenum delays the precipitation of chromium, vanadium, titanium and niobium [21]. Thus, after the hot-induction bending, the ferrite became enriched in vanadium and chromium and the precipitation of these elements was induced by post tempering, improving the YS at the hot-bent section, as mentioned above.
Figure 5 shows how the Morrison model and the modified equations compare with each other, and shows that the experimental data combines closely and accurately with the modified equations that use an average microhardness value of the material to estimate the values of n and not only an average grain size, as applied by the Morrison model.
The distribution of the n values for the ferrite grains as a function of their individual sizes is shown in Figure 6, where the values of n were obtained from Equation (5) using the individual values of the microhardness HV (10 g) of the ferritic grains. It is interesting to note that the values of n tend to increase with the growth of the grain size for all of the conditions under study. However, Figure 6 shows that within a range of the ferritic grain sizes from 10 to 15 μm, the steel in the as-received condition has ferritic grains with lower values of n than those from hot-bent section, and from the as-normalized steel. In other words, the values of n that were obtained for these samples (from the same steel) show the influence of the processing and therefore of the associated hardening mechanisms. Although this behavior can be expected, based on the current knowledge of physical metallurgy, experimental examples of this effect are not usually found in the literature. For example, small precipitates act as barriers for the movement of dislocations [1], leading to low values of n as those obtained for the steel in the as-received condition. When compared with the values of n characterized for the steel in hot-bent and as-normalized conditions, the steel in the as-received condition showed a lower capability to uniformly distribute the plastic deformation. This is because of the high volume fraction of small precipitates that hinder the movement of dislocations more rapidly. This precipitation causes an increase in the shear stresses, hindering the movement of dislocations that interact with the stress fields that surround the precipitates. Thus, for the steel studied here, the precipitation of the microalloying elements is a limiting factor for the Morrison model, as shown by the decreasing trend in the values of n with the intensification of the refined precipitation due to the tempering of extrados at 600 °C. For the hot-bent section, an increase in the volume fraction of VC0.75 occurred at tempering temperatures in the range from 600 to 650 °C, however, at 650 °C, some grain growth was observed (Table 4). Thus, the influence of the tempering on the capability of the API X80 steel to uniformly distribute the plastic deformation depends on heat-treatment temperature.
The interaction between the M-A constituents and the ferritic matrix has some effect on the work-hardening behavior of steels. After the tempering of the extrados at 600 °C, a certain increase of the values of n could be expected due to the decomposition of the hard particles of the M-A constituents (Figure 2c). However, for the steel in the as-tempered condition (at 600 °C) the main effect on n was observed due to the precipitation of the microalloying elements. Thus, the precipitation of vanadium decreased the values of n for the steel studied here (Table 4), while the effects of the decomposition of the M-A constituents (due to tempering) were not strong enough to increase the values of n for the steel in the as-tempered condition.
Figure 7 shows the dislocation structures (irregular, random and cluster) for the steel under study in the hot-bent condition (intrados) and in the tempered-and-bent condition (intrados tempered at 650 °C). The interaction of dislocations with the local precipitates and the formation of the loops around the precipitates can be seen in Figure 7. Additionally, Figure 7b shows (inside the square) one precipitate—possibly a titanium-niobium carbonitride due to its morphological features—that was not dissolved by the hot-induction bending, which is in agreement with the results of Table 3. It is assumed that the titanium-niobium carbonitrides have similar contributions to the precipitation hardening in both the as-received and the hot-bent conditions. The solubilization of the vanadium carbides also proved to be significant as the volume fractions of VC0.75 decreased for all of the samples in the hot-bent condition (Table 4).
The trend of precipitation is often represented by the solubility products of the precipitates. The effectiveness of the precipitation hardening depends on the solubility limits of these microalloying elements in the austenite. The limit of solubility controls the content of the microalloying element that can be dissolved in the austenite and then to be available to precipitate during the cooling stage. Due to the high solubility of VC0.75 when compared with titanium and niobium precipitates (carbides, nitrides, and carbonitrides), the steels that are microalloyed with vanadium can be hardened after normalizing at temperatures close to 950 °C, where the titanium and niobium precipitates have very low solubilities [22]. The steel in the as-normalized condition discussed in this work is hardened mainly by the grain refinement because the normalizing temperature of 900 °C is not high enough to dissolve the coarser precipitates of the microalloying elements in the austenite. Despite the refined grain size in the normalized condition, the tensile properties of the normalized condition, especially YS, are very low when compared to the tensile properties of this steel processed under the other conditions. Also, both models agree closely with the experimental value of n of the studied steel in its as-normalized condition (Table 4 and Figure 5).
Precipitates are known to interact with the dislocations by blocking and/or generating new dislocations during deformation in the tensile test. The mobile dislocations predominantly cut through small coherent precipitates, creating particles of the sheared precipitates (Friedel cutting). When the precipitates are incoherent with the ferritic matrix the dislocations make loops around them (Orowan looping) [1,23,24,25].
The Orowan mechanism becomes the main mechanism of interaction between the precipitates and the dislocations, after the size of the precipitate reaches the critical value. In this context, the increase of the strain-hardening rates is associated with the increase of the stresses that are required to loop the dislocations around the precipitates [20].
The samples of the hot-bent section showed high experimental values of n, despite the higher dislocation densities and larger grain refinement than the as-received steel. These results were associated with the different levels of precipitation hardening, which resulted from the various processing routes. In materials with high initial dislocation densities, the sessile dislocations increase the work hardening, since this type of the dislocation can hinder the movement of mobile dislocations [1]. Sessile dislocations do not have their Burgers vector lying in the fault plane with which they are associated, and are incapable of gliding [26]. Consequently, the sessile dislocations can decrease the capability of the steel to uniformly distribute the plastic deformation (n). However, the results in Table 4 suggest that the values of n are more significantly reduced by precipitation hardening than by work hardening.
As mentioned above, the cutting mechanism of the precipitates by the action of the dislocations occurs for coherent and small particles (less than 10 nm). The presence of pairs of dislocations is a proof of this mechanism [27]. However, the authors in [28] reported that the small precipitates of vanadium can be incoherent and interact with the dislocations through the formation of Orowan loops. In the present case, Figure 7a shows dislocations pinned by nano-precipitates suggesting the formation of Orowan looping. Additionally, Figure 7c,d shows the formation of dislocation loops (Orowan mechanism) around coarse precipitates whose interfaces with the ferritic matrix are generally of the incoherent type. Some bend contours appear as broad, fuzzy dark lines in the bright-field images [29] in Figure 7b, where there is the presence of coarse precipitation that was not dissolved during hot-induction bending. This coarser precipitation does not contribute to the mechanical strength of this steel.

4. Conclusions and Final Considerations

  • The impact of precipitation hardening on the stable plastic behavior of the steel increased as the precipitation hardening became more intense. The effect of precipitation hardening on n become dominant, when compared with the effects of hardening mechanisms by dislocations and grain size.
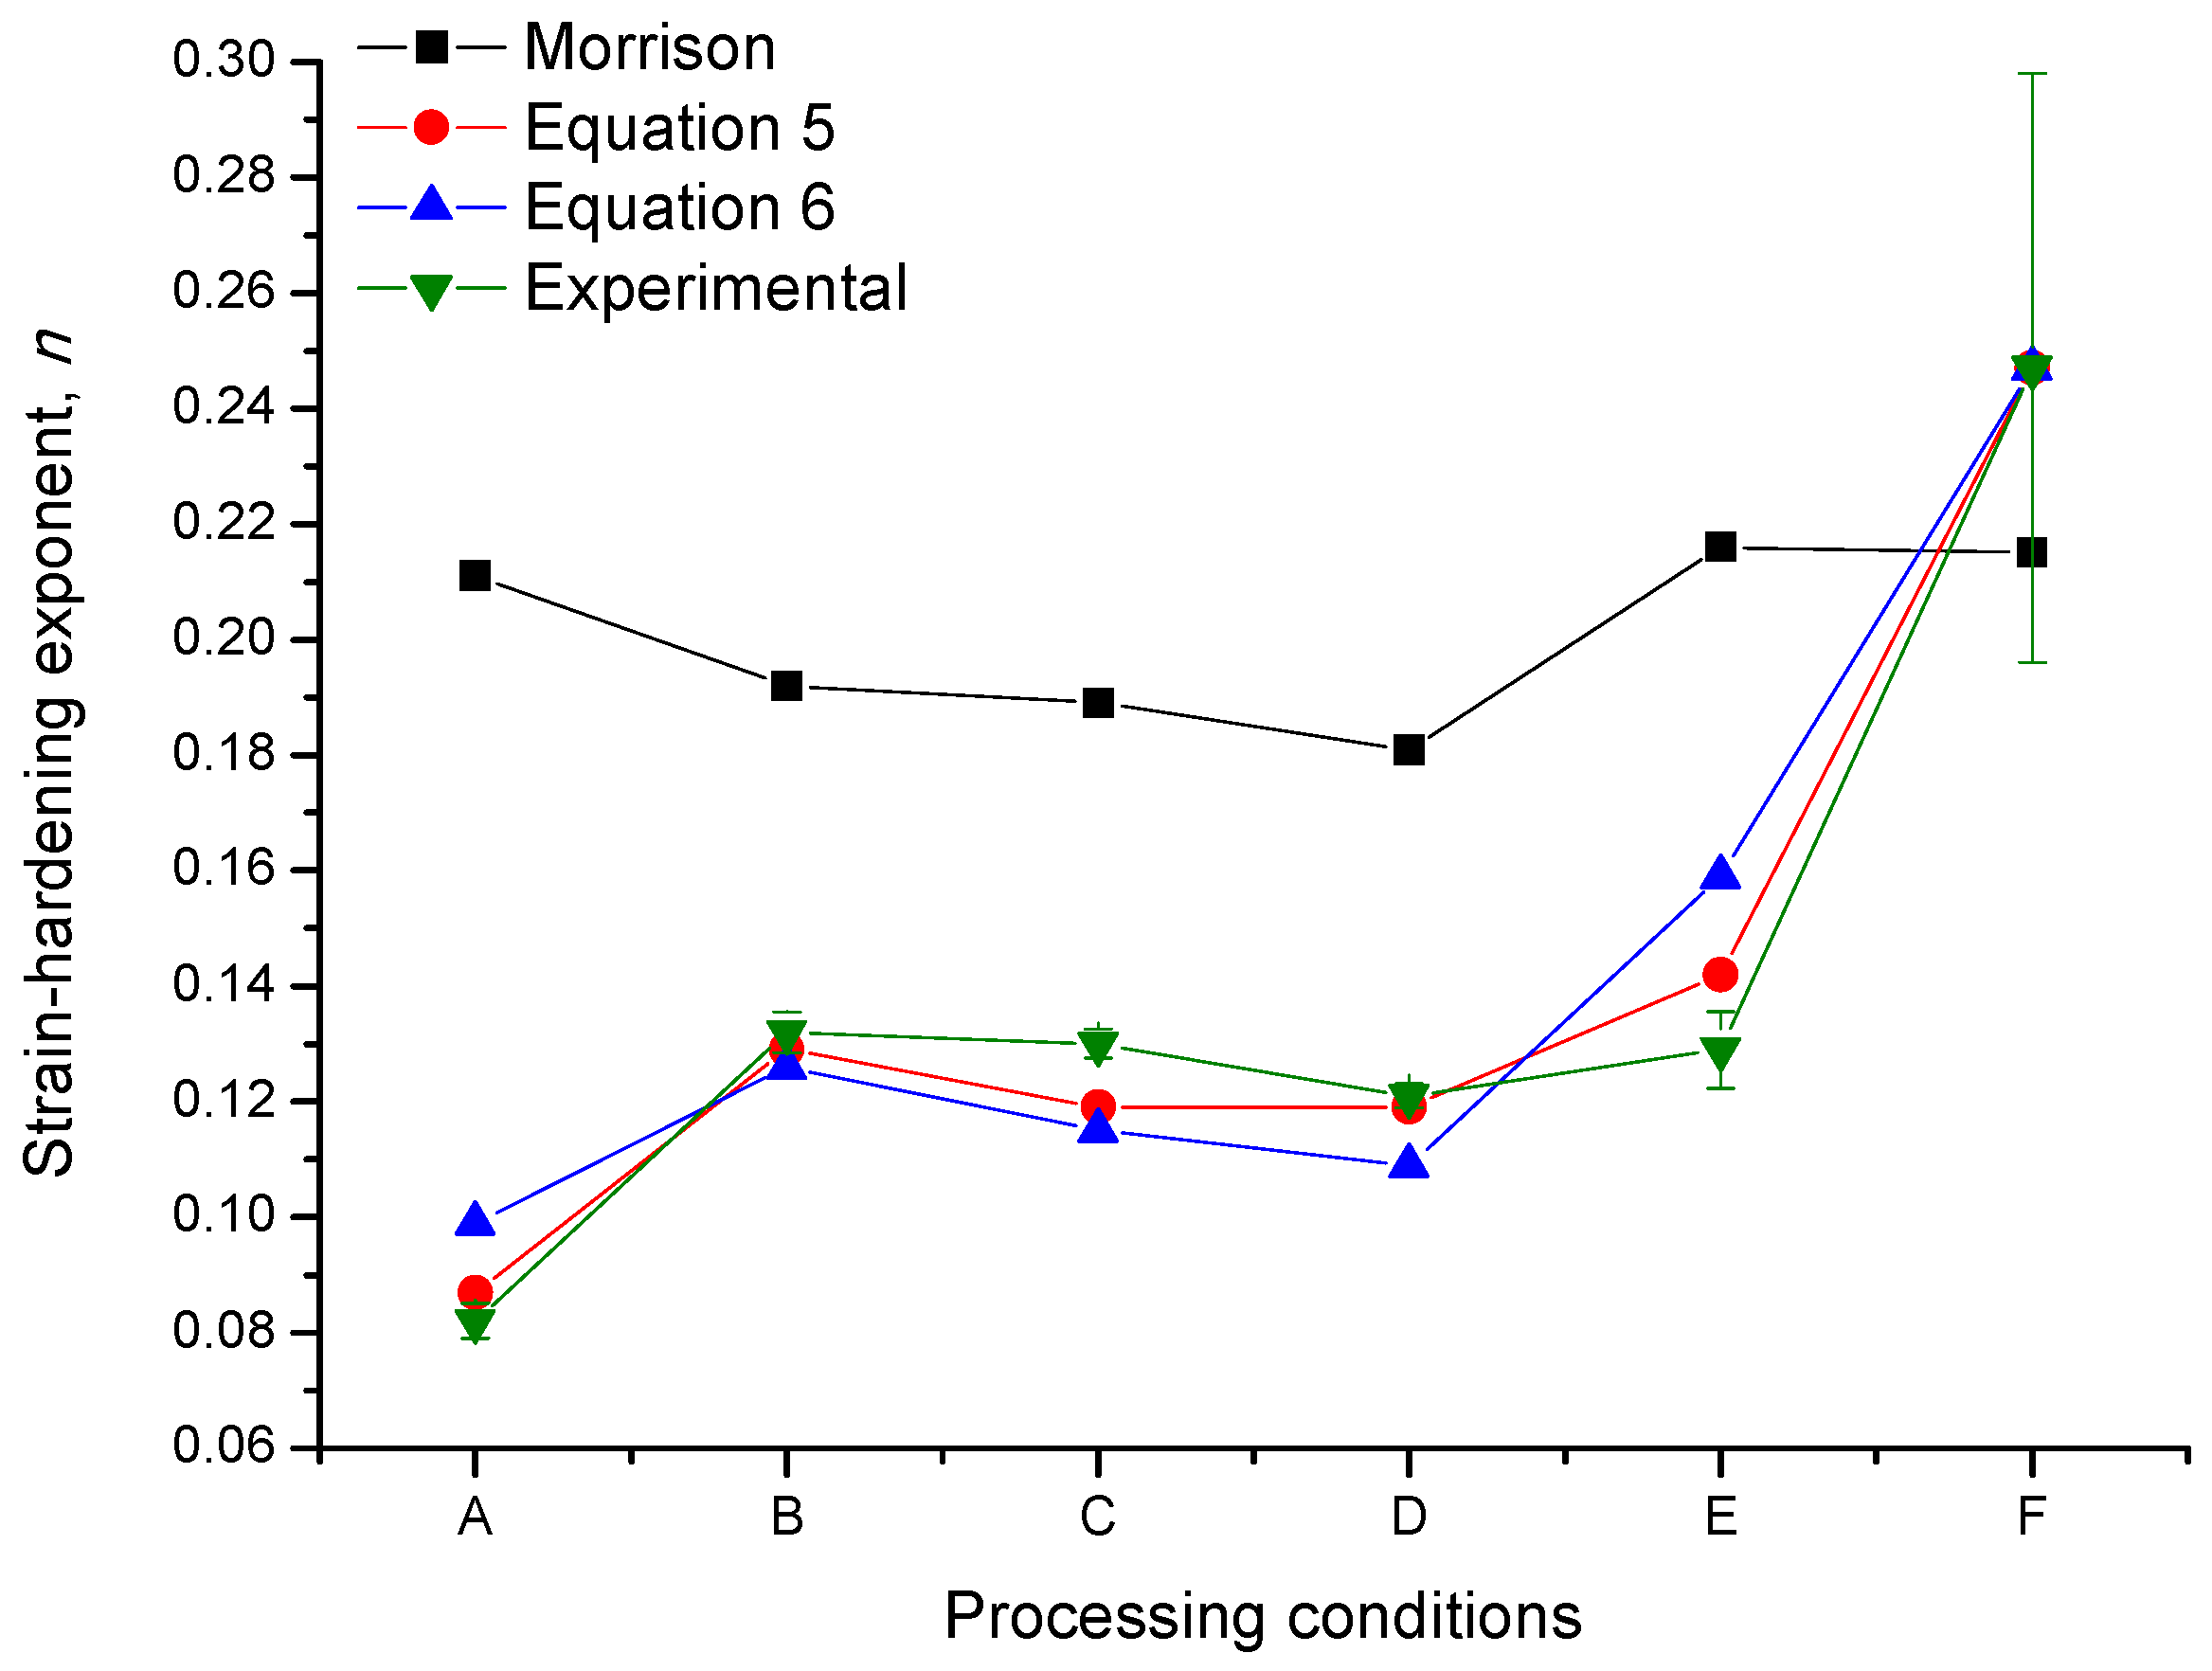
  • The values of n could not be accurately estimated by the Morrison equation due to the different levels of precipitation shown—after different processing routes—by the pipeline microalloyed steel of this work.
  • The values of n calculated from the modified equations agree well with the experimental results, revealing that the application of the microhardness of the material can be an alternative to estimate the capability to uniformly distribute the plastic deformation due to good correlations involving microhardness, processing conditions, and the hardening mechanisms.

Acknowledgments

This work was supported by the Conselho Nacional de Desenvolvimento Científico e Tecnológico (CNPq), Coordenação de Aperfeiçoamento de Pessoal de Nível Superior (CAPES) and Fundação Carlos Chagas Filho de Amparo à Pesquisa do Estado do Rio de Janeiro (FAPERJ). Authors would like to thank LABNANO of CBPF for the use of electron microscopy facilities, and Fundação de Amparo à Computação Científica (FACC) for providing the article processing charge funds, and Ana Luiza Rocha for her help with JEOL 2010 microscope of PUC-Rio and TEM samples preparation.

Author Contributions

Ivani S. Bott conceived and supervised the research. Rafael A. Silva completed the DSC for the influence of induction hot bending parameters on the microstructure evolution of an API X80 Pipe steel. Alexei Kuznetsov contributed to the XRD results and André L. Pinto contributed to TEM results and analysis. All the authors contributed in writing this paper.

Conflicts of Interest

The authors declare no conflict of interest.

References

  1. Hosford, W.F. Mechanical Behavior of Materials, 2nd ed.; Cambridge University Press: Cambridge, UK, 2010; p. 163. [Google Scholar]
  2. Morrison, W.B. The effect of grain size on the stress-strain relationship in low carbon steel. Trans. ASM 1966, 59, 824–846. [Google Scholar]
  3. ASTM E112-96. Standard Test Methods for Determining Average Grain Size; American Society for Testing and Materials: West Conshohocken, PA, USA, 2004. [Google Scholar]
  4. Morales, E.V.; Silva, R.A.; Bott, I.S.; Paciornik, S. Strengthening mechanisms in a pipeline microalloyed steel with a complex microstructure. Mater. Sci. Eng. A 2013, 585, 253–260. [Google Scholar] [CrossRef]
  5. Ungar, T.; Dragomir, I.; Révész, Á.; Borbély, A. The contrast factors of dislocations in cubic crystal: The dislocation model of strain anisotropy in practice. J. Appl. Cryst. 1999, 32, 992–1002. [Google Scholar] [CrossRef]
  6. Ungár, T.; Gubicza, J.; Hanák, P.; Alexandrov, I. Densities and character of dislocations and size-distribution of subgrains in deformed metals by X-ray diffraction profile analysis. Mater. Sci. Eng. A 2001, 319–321, 274–278. [Google Scholar] [CrossRef]
  7. Silva, R.A. Correlation between the Induction Hot Bending Parameters for API X80 Pipe and the Resulting Mechanical and Microstructural Properties. Master’s Thesis, Pontifical Catholic University of Rio de Janeiro, Rio de Janeiro, Brazil, 21 October 2009; p. 207. (In Portuguese). [Google Scholar]
  8. Park, J.S.; Ha, Y.S.; Lee, S.J.; Lee, Y.K. Dissolution and precipitation kinetics of Nb(C,N) in austenite of a low-carbon Nb-microalloyed steel. Metall. Mater. Trans. A 2009, 40, 560–568. [Google Scholar] [CrossRef]
  9. Lu, J. Quantitative Microstructural Characterization of Microalloyed Steels. Ph.D. Thesis, University of Alberta, Edmonton, AB, Canada, November 2009; pp. 213–214. [Google Scholar]
  10. Garcia-Sanchez, R.; Bettmer, J.; Ebdon, L. Development of a new method for the separation of vanadium species and chloride interference removal using modified silica capillaries-DIN-ICP-MS. Microchem. J. 2004, 76, 161–171. [Google Scholar] [CrossRef]
  11. Karbasi, M.H.; Jahanparast, B.; Shamsipur, M.; Hassan, J. Simultaneous trace multielement determination by ICP-OES after solid phase extraction with modified octadecyl silica gel. J. Hazard. Mater. 2009, 170, 151–155. [Google Scholar] [CrossRef] [PubMed]
  12. Aydin, I.; Aydin, F.; Hamamci, C. Vanadium fractions determination in asphaltite combustion waste using sequential extraction with ICP-OES. Microchem. J. 2013, 108, 64–67. [Google Scholar] [CrossRef]
  13. ASTM E646-07. Standard Test Method for Tensile Strain-Hardening Exponents (n-Values) of Metallic Sheet Materials; American Society for Testing and Materials: West Conshohocken, PA, USA, 2007. [Google Scholar]
  14. API 5L. Specification for Line Pipe; American Petroleum Institute: Washington, WA, USA, 2004. [Google Scholar]
  15. ASTM A370. Standard Test Methods and Definitions for Mechanical Testing of Steel Products; American Society for Testing and Materials: West Conshohocken, PA, USA, 2003. [Google Scholar]
  16. Spindola, M.O.; Ribeiro, E.A.S.; Gonzalez, B.M.; Santos, D.B. Modeling of work hardening behaviour of high Mn and low C polycrystalline austenitic steel with TWIP effect. Rev. Mater. 2010, 15, 145–152. [Google Scholar]
  17. Lucas, J.P.; Gerberich, W.W. Low temperature and grain size effects on the cyclic strain hardening exponent of an HSLA steel. Scr. Metall. 1981, 15, 327–330. [Google Scholar] [CrossRef]
  18. Antoine, P.; Vandeputte, S.; Vogt, J.B. Empirical model predicting the value of the strain-hardening exponent of a Ti-IF steel grade. Mater. Sci. Eng. A 2006, 433, 55–63. [Google Scholar] [CrossRef]
  19. Gao, N.; Baker, T.N. Influence of AlN precipitation on thermodynamic parameters in C-Al-V-N microalloyed steel. ISIJ Int. 1997, 37, 596–604. [Google Scholar] [CrossRef]
  20. Hong, S.G.; Jun, H.J.; Kang, K.B.; Park, C.B. Evolution of precipitates in the Nb-Ti-V microalloyed HSLA steels during reheating. Scr. Mater. 2003, 48, 1201–1206. [Google Scholar] [CrossRef]
  21. Lee, W.-B.; Hong, S.-G.; Park, C.-G.; Park, S.-H. Carbide precipitation and high-temperature strength of hot-rolled high-strength, low-alloy steels containing Nb and Mo. Metall. Mater. Trans. A 2002, 33, 1689–1698. [Google Scholar] [CrossRef]
  22. Pickering, F.B. Physical Metallurgy and Design of Steels; Applied Science Publishers: London, UK, 1978. [Google Scholar]
  23. ASM Handbook. Metallography and Microstructures; ASM International: Materials Park, OH, USA, 1985; p. 116. [Google Scholar]
  24. Padilha, A.F. Materiais de Engenharia—Microestrutura e Propriedades; Hemus: Curitiba, Brazil, 2000; pp. 257–258. [Google Scholar]
  25. Lui, M.-W.; Le May, I. On the “Friedel Relation” in precipitation hardening. Scr. Metall. 1975, 9, 587–589. [Google Scholar] [CrossRef]
  26. Smallman, R.E.; Bishop, R.J. Modern Physical Metallurgy and Materials Engineering: Science, Process, Applications, 6th ed.; Butterworth-Heinemann: Oxford, UK, 1999; pp. 102–103. [Google Scholar]
  27. Morales, E.V.; Gallego, J.; Kestenbachz, H.-J. On coherent carbonitride precipitation in commercial microalloyed steels. Philos. Mag. Lett. 2003, 83, 79–87. [Google Scholar] [CrossRef]
  28. Morales, E.V.; Galeano Alvarez, N.J.; Morales, A.M.; Bott, I.S. Precipitation kinetics and their effects on age hardening in an Fe–Mn–Si–Ti martensitic alloy. Mater. Sci. Eng. A 2012, 534, 176–185. [Google Scholar] [CrossRef]
  29. Fultz, B.; Howe, J. Transmission Electron Microscopy and Diffractometry of Materials, 3rd ed.; Springer: Berlin/Heidelberg, Germany, 2008; p. 353. [Google Scholar]
Figure 1. Optical micrographs from (a) straight stretch, (b) extrados, (c) extrados tempered at 600 °C and, (d) straight stretch normalized at 900 °C.
Metals 08 00168 g001
Figure 2. SEM micrographs from (a) straight stretch, (b) extrados, (c) extrados tempered at 600 °C, and (d) straight stretch normalized at 900 °C.
Metals 08 00168 g002aMetals 08 00168 g002b
Figure 3. Engineering stress-strain curves.
Metals 08 00168 g003
Figure 4. Relationship between experimental values of n and the average microhardness HV (10 g) of 100 ferritic grains. Where: A = straight stretch, B = Intrados, C = Extrados, D = Extrados tempered at 600 °C, E = Extrados tempered at 650 °C and F = straight stretch normalized at 900 °C.
Metals 08 00168 g004
Figure 5. Strain-hardening exponent (n) from Morrison model, modified equations and experimental data. Where: A = straight stretch, B = Intrados, C = Extrados, D = Extrados tempered at 600 °C, E = Extrados tempered at 650 °C and F = straight stretch normalized at 900 °C.
Metals 08 00168 g005
Figure 6. Distribution of the strain-hardening exponents (n) of the individual grains of ferrite, obtained from Equation (5), plotted as a function of the individual grain size. Where: A = straight stretch, B = Intrados, C = Extrados and F = straight stretch normalized at 900 °C.
Metals 08 00168 g006
Figure 7. Dislocation structures (irregular, random and cluster) and the interaction of the dislocations with the local precipitation. (a,b) intrados and (c,d) intrados tempered at 650 °C.
Metals 08 00168 g007
Table 1. Chemical composition (wt %) of the API X80 steel pipe.
CMnSiPSNiCrMoTiNbVNPcm
0.051.740.210.0180.0020.0110.1470.1770.0140.0690.0220.0050.17
Table 2. Identification of the samples obtained using different processing conditions.
SamplesDescriptionCondition
AStraight stretchAs-received
BIntradosHot-bent
CExtradosHot-bent
DExtrados tempered at 600 °CHot-bent + as-tempered
EExtrados tempered at 650 °CHot-bent + as-tempered
FStraight stretch normalized at 900 °CAs-normalized
Table 3. Effects of the hot-induction bending and tempering on the percentage of the alloying elements that precipitated.
SamplesV (%)Cr (%)Cu (%)Mo (%)Ti (%)Nb (%)
A41.735.066.18310099.9
B25.928.166.882.710099.9
C12.719.265.280.499.999.8
D29.522.366.38110099.8
E30.521.967.58110099.9
Table 4. Tensile mechanical properties (YS and UTS), average microhardness (HV), average grain size (d), amount of vanadium in ferritic solid solution (V%), volume fraction (fv) of VC0.75, dislocation density (ρ), strain-hardening exponent (n) from the experimental data, the Morrison model and the modified model (Equation (5)) for the API X80 steel submitted to different processing conditions.
SamplesYS (MPa)UTS (MPa)HV (10 g)d (μm)V% (wt %)fv VC0.75 (%)
A604 ± 20679 ± 9.0245 ± 225.35 ± 0.90.0130.0150
B477 ± 10673 ± 1.5222 ± 193.90 ± 0.40.0160.0093
C472 ± 16658 ± 8.6227 ± 173.70 ± 0.60.0190.0046
D558 ± 1.7628 ± 1.7227 ± 143.20 ± 0.60.0160.0106
E550 ± 19594 ± 2.1215 ± 135.80 ± 0.70.0150.0110
F239 ± 9.5573 ± 4.0174 ± 145.71 ± 0.8--
Samplesρ (m−2)n (Experimental)n (Morrison)Error (%)n (Equation (5))Error (%)
A1.81 × 10140.082 ± 0.003010.2111580.0876.6
B4.26 × 10140.132 ± 0.003510.192460.1292.3
C4.12 × 10140.130 ± 0.002520.189450.1198.3
D2.94 × 10140.121 ± 0.002060.181490.1191.5
E1.38 × 10140.129 ± 0.006670.216680.14210
F-0.247 ± 0.0510.215130.2470.1

