Article

Development and Characterisation of Aluminium Matrix Nanocomposites AlSi10Mg/MgAl2O4 by Laser Powder Bed Fusion

1
Department of Applied Science and Technology, Politecnico di Torino, Corso Duca degli Abruzzi 24, 10129 Torino, Italy
2
Center for Sustainable Future Technologies—CSFT@POLITO, Istituto Italiano di Tecnologia, Corso Trento 21, 10129 Torino, Italy
3
Department of Management and Production Engineering, Politecnico di Torino, Corso Duca degli Abruzzi 24, 10129 Torino, Italy
*
Author to whom correspondence should be addressed.
Metals 2018, 8(3), 175; https://doi.org/10.3390/met8030175
Submission received: 19 February 2018 / Revised: 4 March 2018 / Accepted: 7 March 2018 / Published: 10 March 2018
(This article belongs to the Special Issue Production and Properties of Light Metal Matrix Nanocomposites)

Abstract

:
Recently, additive manufacturing techniques have been gaining attention for the fabrication of parts from aluminium alloys to composites. In this work, the processing of an AlSi10Mg based composite reinforced with 0.5% in weight of MgAl2O4 nanoparticles through laser powder bed fusion (LPBF) process is presented. After an initial investigation about the effect of process parameters on the densification levels, the LPBF materials were analysed in terms of microstructure, thermo-mechanical and mechanical properties. The presence of MgAl2O4 nanoparticles involves an increment of the volumetric energy density delivered to the materials, in order to fabricate samples with high densification levels similar to the AlSi10Mg samples. However, the application of different building parameters results in modifying the size of the cellular structures influencing the mechanical properties and therefore, limiting the strengthening effect of the reinforcement.

Graphical Abstract

1. Introduction

Additive manufacturing (AM) is nowadays well recognised as a breakthrough in the manufacturing of metal components. Many specific technologies exist in the AM family, among which powder bed fusion (standard term according to ISO/ASTM52900-15) assume particular interest. Generally, powder bed AM techniques are widely used to produce components made of Ti-alloys, Ni-based alloys, Fe-based alloys, Co-based alloys, intermetallics, as well as Al-based alloys [1,2,3,4]. Among this family of AM technologies, laser powder bed fusion (LPBF) process works on the principle of spreading a layer of loose powder and then melting it through a focused laser beam in definite positions, determined by a 3D computer-aided design (CAD) data.
Regarding the aluminium alloys, among the several possible compositions, aluminium-silicon systems are particularly suitable for these technologies due to their good melting behaviour. In particular, the aluminium alloys commonly used in AM are hypoeutectic Al-Si alloys such as AlSi10Mg and A357 [5,6,7,8], together with few Al-Si iper-eutectic alloys such as AlSi12 and AlSi20 [9,10]. The high thermal gradients typical of LPBF process lead to a microstructure where fine α-Al cells are surrounded by Al-Si eutectic [11]. This fine microstructure significantly improves the mechanical strength, compared to the same alloy produced by casting [12].
In order to improve the strength of LPBF-processed aluminium alloys, in recent years, some studies have been carried out on the production of aluminium matrix composites (AMCs), using as reinforcement different ceramic particles, the most common being SiC and TiC.
For instance, Chang et al. [13] studied the AlSi10Mg + SiC system, characterised by different SiC particle sizes. They found that during the building process, a laser induced reaction between aluminium and SiC arises. The mechanical characterisation of these composites showed that the best mechanical performance was achieved when fine SiC particles were used.
Gu et al. [14] investigated the densification behaviour of AlSi10Mg reinforced with TiC nanoparticles and they revealed that TiC dispersion within the matrix strongly depends on the building parameters used. When high energy density was used, the particles agglomerate driven by the Marangoni flow and due to the relatively long melt pool lifetime. When low energy density was used, on the contrary, the lower intensity of the thermocapillary flow and the shorter melt pool lifetime do not allow the particles agglomeration. This correlation was confirmed by the model presented by Dai et al. [15] who predicted the effect of the thermodynamics of the melt pool on the distribution of AlN nanoparticles in LPBF AlSi10Mg matrix composites.
On the other hand, the reinforcement of aluminium-magnesium spinel (MgAl2O4) is less common, notwithstanding it can be an attractive substitute for the typical reinforcements, e.g., SiC and TiC, owing to its high Young modulus as well as low coefficient of thermal expansion (CTE). Furthermore, MgAl2O4 is crystallographically compatible with aluminium on a specific set of planes, suggesting that a good interface can form between matrix and reinforcement, thanks to the lattice mismatch of the MgAl2O4 (100) plane with the Al (100) plane, which is only 0.25% [16,17]. For these peculiar features, a previous investigation of AlSi10Mg powder with 1 wt % of nanoMgAl2O4 ceramic particles was carried out, obtaining nanocomposites with lower hardness and densification level than the alloy [18]. In addition, it was demonstrated that also a lower filler content does not imply a positive effect on the mechanical performances of the AlSi10Mg alloy [19].
On the basis of this, the primary goal of this work is to study the effect of the different process parameters (scanning speed, hatching distance and building direction) on the microstructure and mechanical behaviour of nanocomposites obtained through LPBF, using AlSi10Mg powder and adding only 0.5 wt % of nanoMgAl2O4.

2. Materials and Methods

2.1. Materials

The AlSi10Mg powder was supplied by EOS GmbH (Krailling, Germany), while the MgAl2O4 nanoparticles, with an average diameter of 30 nm [20], were produced from Nanocerox (Ann Arbor, MI, USA). Powders were characterised by field emission scanning electron microscope (FESEM—Zeiss SupraTM 40, Zeiss, Jena, Germany) in terms of size and shape. A particle size distribution mainly from 1 to 39 µm was determined by FESEM for AlSi10Mg powder, analysing 100 particles. Pycnometric analysis (Ultrapyc 1200 e Quantachrome INSTRUMENTS, Boynton Beach, FL, USA) was used to determine the skeletal density of the AlSi10Mg powder.
In order to prepare the composite powder avoiding both particle agglomeration and deformation, AlSi10Mg and 0.5 wt % nanoMgAl2O4 powders were dry mixed in the correct proportions for 48 h using a ceramic jar in a ball milling system and with a speed rate of 60 rpm, without using any grinding media. After milling, the powders were dried to remove humidity and then sieved with a 63 μm sieve.
For the rest of the paper, the AlSi10Mg + 0.5 wt % nanoMgAl2O4 composite will be indicated with the term nanocomposite. Both AlSi10Mg alloys and nanocomposite samples were fabricated using an EOSINT M270 Dual Mode system (EOS GmbH, Krailling/Munich, Germany). The LPBF machine is equipped with a 200 W Yb (ytterbium) fibre laser with a spot size of 100 µm working under protective argon atmosphere with an oxygen content lower than 0.10%.

2.2. Specimen Manufacturing

Firstly, it was studied the effect of different process parameters on the densification levels. The basic parameters of LPBF technology are the laser power P (in W), the scanning speed of the laser v (in mm/s), the layer thickness t and the hatching distance hd (both in mm). By a combination of these single parameters, it is possible to define the volumetric energy density (VED, in J/mm3), as illustrated in Equation (1) [7,8,19,21]:
VED = P v   t   h d
In this work, the EOS stripe scanning strategy was used, rotating the laser scanning direction by 67° between consecutive layers, avoiding possible orientation issues and reducing residual stresses. Both AlSi10Mg alloy and nanocomposite samples were produced with different VED values.
Due to low laser absorption of the Al-based alloys, the laser powder was fixed at 195 W. A layer thickness of 30 µm, generally used for the AlSi10Mg samples, was employed [6,22]. A hatching distance of 0.10 mm was chosen, according to the best process parameters selected for composite materials already investigated [19]. Finally, the scan speed was modified using six different values. In view of a comparison between materials produced with the same conditions, the standard process parameters used for AlSi10Mg (195 W, 800 mm/s and 0.17 mm) were also included [6].
In this way, it is possible to determine the parameters to build nanocomposite samples with a good compromise between the densification levels and build-up rate. In order to investigate the effect of different setup parameters on the densification levels, 3 sets of cubic samples with a dimension of 10 × 10 × 10 mm3 were produced for each VED value, as listed in Table 1.
Before removing the specimens from the building platform, they were heat treated for 2 h at 300 °C (as suggested by EOS for the AlSi10Mg alloy [23]) in order to reduce residual stresses. The porosity values were determined by Archimedes method according to the ASTM B311-17 standard and by image analysis method using optical microscope (OM—Leica DMI 5000 M, Leica Microsystems, Wetzlar, Germany).
In the latter case, the images were analysed by means of Image J software (version: v1.51J8, National Institutes of Health, Bethesda, MD, USA) that allows the determination of the percent porosity in area. For OM analysis, the samples were cut along the building direction (z-axis), then ground and polished to 0.03 µm using a colloidal silica suspension and analysed along this orientation. For each sample, 6 images at a magnification of 50× were taken, analysing a total area of about 13 mm2. The average porosity values and standard deviation determined by Archimedes method and optical microscopy were assessed on three LPBF samples realised with the same parameters. Finally, the samples were also etched with Keller’s reagent for 10 s to observe the microstructural features by means of the FESEM analysis, along the building direction.

2.3. Thermal Characterisation

The thermal properties of alloy and nanocomposite samples built with specific parameters were tested. Thermo-mechanical analysis (TMA—SETSYS Evolution, Setaram Instrumentation, Caluire-et-cuire, France) was used to determine the coefficient of thermal expansion (CTE) in the range of 100–400 °C under argon atmosphere with a heating rate of 5 °C/min. In order to eliminate deviation due to the relaxation of residual stresses, two consecutive cycles were performed on each sample and only the second cycle was used to evaluate the CTE.
Laser Flash analysis (LFA—Flashline™ 4010, Anter Corporation, Pittsburgh, PA, USA) allowed the measurement of the thermal diffusivity in the 200–400 °C range with a step of 100 °C in agreement with the ASTM E1461-13.

2.4. Microstructural and Mechanical Characterisation

The microstructures of AlSi10Mg and nanocomposite samples were analysed by means of OM and FESEM.
The AlSi10Mg alloy and nanocomposite samples built with the selected parameters were firstly tested by means of Brinell hardness measurements HBW2.5/62.5 according to the ASTM E10-17 standard. Five measurements were carried out on each cross section of the cubic samples.
Furthermore, oversized specimens for tensile test were produced with AlSi10Mg alloy and the nanocomposite with the selected process parameters. The oversized specimens were built both along x-axis and y-axis.
The LPBF samples were then machined to obtain specimens with a gauge a gauge length of 40 mm and a diameter of 8 mm, according to the ASTM E8/E8M-16a standard. Tensile tests were performed on a Zwick/Roell Z100 testing machine (Zwick/Roell, Ulm, Germany) , with a strain rate value of 8 × 10⁻³ s−1, using three tensile specimens for each condition. After the tests, tensile fracture surfaces were analysed by FESEM.

3. Results and Discussion

3.1. Powders Characterisation

The powders were investigated by FESEM, revealing that the AlSi10Mg particles were fairly spherical (Figure 1a), while nanoMgAl2O4 particles were agglomerated, due to enormous surface energies [24], as shown in Figure 1b.
The theoretical density of the nanocomposite was calculated with the rule of mixture, using for the AlSi10Mg its skeletal density of 2.66 ± 0.10 g/cm3, whereas for the nanoMgAl2O4 was considered the theoretical density of 3.58 g/cm3, calculating for the nanocomposite a density of 2.663 g/cm3.
Mixing without grinding media allowed the aluminium alloy particles to maintain the spherical shape (Figure 1c), guaranteeing a uniform spreading of the powder in the machine. In addition, the AlSi10Mg particles exhibited a uniform coating of the nanoMgAl2O4 particles on their surface, as highlighted in Figure 1d. In this way, by avoiding the deformation of the AlSi10Mg particles but merely coating them with the nano-reinforcement, the powder mixture should maintain a good flow behaviour.

3.2. Effect of the Process Parameters on the Densification Levels

The metallic and composite powders were then employed to produce cubic specimens with a combination of different parameters and consequently, a various range of VED values, then heat-treated and characterised. In particular, the residual porosity of AlSi10Mg alloy and nanocomposite samples built with different VED values was determined using both Archimedes and image analysis methods, which are conventional techniques used to determine the residual porosity within the specimens, as reported in Table 2 [25].
The values determined by Archimedes method and image analysis are different since the fact that Archimedes method takes into account the whole sample volume, while the image analysis considers only some cross-sections of the samples.
By analysing the residual porosity of AlSi10Mg alloy and nanocomposite samples built using different VED values of Table 1, it is evident that denser samples were produced with higher VED. In both cases, slighter differences were recorded at high VED, even if these values are diverse for the two materials. The trend of residual porosity versus VED for AlSi10Mg alloy and nanocomposite materials are published elsewhere [19].
High densification levels are obtained for the alloy and nanocomposite samples employing a VED value of 47.8 J/mm3 and 81.3 J/mm3, respectively. These evidences that for the nanocomposite samples the nanoparticles slow down the flow of liquid aluminium, requiring a longer time in the liquid phase (i.e., higher VED) to assure proper densification of the parts, as also reported for LPBF TiC/AlSi10Mg system [14].
For the nanocomposite, by further increasing the VED values it seems that a slightly higher densification level can be obtained. However, this would imply even slower scan speeds and consequently, lower build-up rates (see Table 1). Hence, in order to avoid an excessive build-up rate reduction, a VED of 81.3 J/mm3 was chosen as the reasonable compromise to fabricate dense nanocomposite samples.
Figure 2 show the OM images of AlSi10Mg and nanocomposite samples built using low VED values and the selected parameters resulting in high densification levels. In the first case, the micrographs reveal the presence of elongated pores, as visible in Figure 2a,c, probably related to lack of fusion. In fact, in literature, similar pores were mainly attributed to an improper selection of the process parameters [5].
On the contrary, using appropriate process parameters, the microstructure only exhibits fine spherical pores, as highlighted in Figure 2b,d, which are caused by the solubility of gas in the melt pool and are typically called “trapped gas porosities” [26,27]. The comparison of the OM images, well underlines how the selection of appropriate process parameters and therefore, specific VED values, are crucial to fabricate dense parts. Moreover, by comparing Figure 2b,c, it is possible to note that the production of metallic and composite specimens with the same VED value leads to different porosity amounts, confirming the effect of the ceramic particles on the melt pool behaviour.

3.3. Microstructural Investigations

The LPBF process, due to the high cooling rates (around 106 K/s [28]) that occur over the areas subjected to the laser beam, typically leads to the formation of fine microstructures consisting of α-Al cellular structures separated by areas of Al-Si eutectic [11,29]. The effect of the nanoparticles can be observed by high magnification FESEM images (Figure 3a,b), analysing the size of the cellular structures in the central part of the melt pool for AlSi10Mg and nanocomposite samples.
By FESEM investigations, in both samples, the α-Al phase appears darker while the silicon-rich zones of the aluminium-silicon eutectic appear brighter. In the alloy, the eutectic microstructure was very fine, with the α-Al cell and Si particle size of 600 and 100 nm, respectively. On the other hand, for the nanocomposite, a larger size of both the aluminium and silicon phases was observed, with values of 800 and 250 nm, respectively. This suggest that the higher VED employed for nanocomposite densification implies slightly coarser microstructure with respect to the base alloy. Regarding the MgAl2O4 nanoparticles, it was not possible to observe them by FESEM analysis or to distinguish them from silicon particles.

3.4. Thermal Properties

The CTE values and thermal diffusivity of AlSi10Mg and nanocomposite samples built with specific parameters were determined by means of TMA and LFA analyses, respectively. In the range 100–400 °C, the AlSi10Mg had an average CTE of 25.3 × 10⁻⁶ K−1, whereas for the nanocomposite a value of 24.4 × 10⁻⁶ K−1 was recorded.
The thermal diffusivity of the two materials revealed very similar values, as can be seen in Table 3. The results showed that adding only 0.5 wt % of MgAl2O4 particles did not have a relevant effect on the CTE as well as the thermal diffusivity with respect to the base alloy.

3.5. Mechanical Characterisation

Brinell hardness values of the AlSi10Mg built with standard parameters and nanocomposite built with the selected parameters were respectively 104 ± 1 HBW and 103 ± 1 HBW, showing that the low amount of the ceramic reinforcement had a negligible impact on the hardness performances.
Figure 4 illustrates the stress-strain curves of AlSi10Mg and nanocomposite samples, while the tensile data are given in Table 4. First of all, it is possible to note that the EOS stripe scanning strategy guarantees the isotropy of mechanical properties in the x-y plane: for each material, in fact, very slight differences are recorded for samples built along the two different directions. On the other hand, it is easily visible that the two materials exhibit significantly different behaviours. In particular, the AlSi10Mg specimens revealed greater tensile properties than nanocomposite ones: the AMC presents a reduction of the yield (σ0.2) and ultimate tensile strength (σUTS) of about 30% and 20%, respectively, with respect to the alloy.
As already demonstrated [19], the LPBF nanocomposite can present lower tensile properties than the alloy, contrarily to the production of AMCs by traditional methods (powder metallurgy, squeeze casting, stir casting and similar processes), in which the nanoparticle addition implies a strengthening of the metal matrix, mainly owing to a refinement of the structure [30].
In our materials, the higher VED value chosen for nanocomposite production causes larger cell size and eutectic sizes mainly due to lower solidification rates, thus explaining the different tensile properties between the alloy and the nanocomposite.
The cell structures of LPBF aluminium samples are strongly correlated to the cooling rates, which is the key factor influencing the dendritic size: more precisely, the higher is the cooling rate the finer is the microstructure [31,32].
The cooling rates can be modified by heat input and so by VED values; in fact, the more intensive are the heat input, the lower are the cooling rates and therefore, the larger are the dendritic structures [31].
For this reason, it is reasonable to suppose that the higher VED used for nanocomposite processing provides more intense power to materials resulting in a higher temperature within the melt pools, thus reducing the cooling rates [19].
In order to support this hypothesis, tensile tests were performed on AlSi10Mg samples built along the x-direction using the selected VED of the nanocomposite (81.3 J/mm3) and the results are compared with those of AlSi10Mg (built with standard VED of 47.8 J/mm3) and nanocomposites (VED of 81.3 J/mm3) in Figure 5a and Table 5. Furthermore, the microstructures of the specimens were observed (Figure 5b–d) within the central part of the melt pool, as schematically reported in Figure 5e.
The tensile curves of AlSi10Mg samples built using the standard VED value revealed greater tensile strengths and ductility than AlSi10Mg ones built using a high VED, pointing out the influence of the building parameters on the tensile properties. Comparing the microstructures in Figure 5b,c, it is possible to state that the cell structures of AlSi10Mg present higher dimensions when higher VED was employed, thus resulting in lower tensile properties.
These results are in line with literature on traditional cast aluminium alloys, for which typically the tensile properties tend to decrease with the increment of the dendrite size [33].
Finally, the tensile properties of the nanocomposite revealed higher σUTS (around 7%) and elongation at failure (about 16%) than AlSi10Mg alloy built with the same parameters (VED 81.3 J/mm3), without observing significant differences in their microstructure (Figure 5c,d).
In the case of the nanocomposite, it is reasonable to suppose that, in addition to the hindering of the dislocations by the cell structure boundaries, the nanoparticles scattered throughout the material help to obstruct the dislocation movements, slightly enhancing the tensile properties [34].

3.6. Fracture Surfaces Analysis

The FESEM images of the fracture surfaces of AlSi10Mg and nanocomposite samples built along x-direction with selected VED values (47.8 and 81.3 J/mm3, respectively) are displayed in Figure 6a,b, respectively.
The micrographs mainly revealed a ductile fracture mode with microvoids coalescence, although few brittle fractures were presented. At a higher magnification view (Figure 6c,d), both AlSi10Mg alloy and nanocomposite samples revealed ductile areas consisted of fine dimples, the size of which can be correlated to the cellular-dendritic dimensions [35]. In fact, it has been demonstrated that in LPBF AlSi10Mg samples the fractures tend to arise along the boundaries of the cellular structures, due to the presence of the hard eutectic phase [35]. This seems to suggest that the larger dimple size of the nanocomposite with respect to the base alloy (Figure 6c,d) derives from larger cellular-dendritic size, as observed during FESEM investigations (Figure 3a,b).

4. Conclusions

In this work, the effect of process parameters (scanning speed, hatching distance and building direction) on the microstructure and the mechanical behaviour of an aluminium alloy and a nanocomposite AlSi10Mg + 0.5 wt % nanoMgAl2O4 produced by LPBF were compared.
The main results can be summarised as follows:
(1)
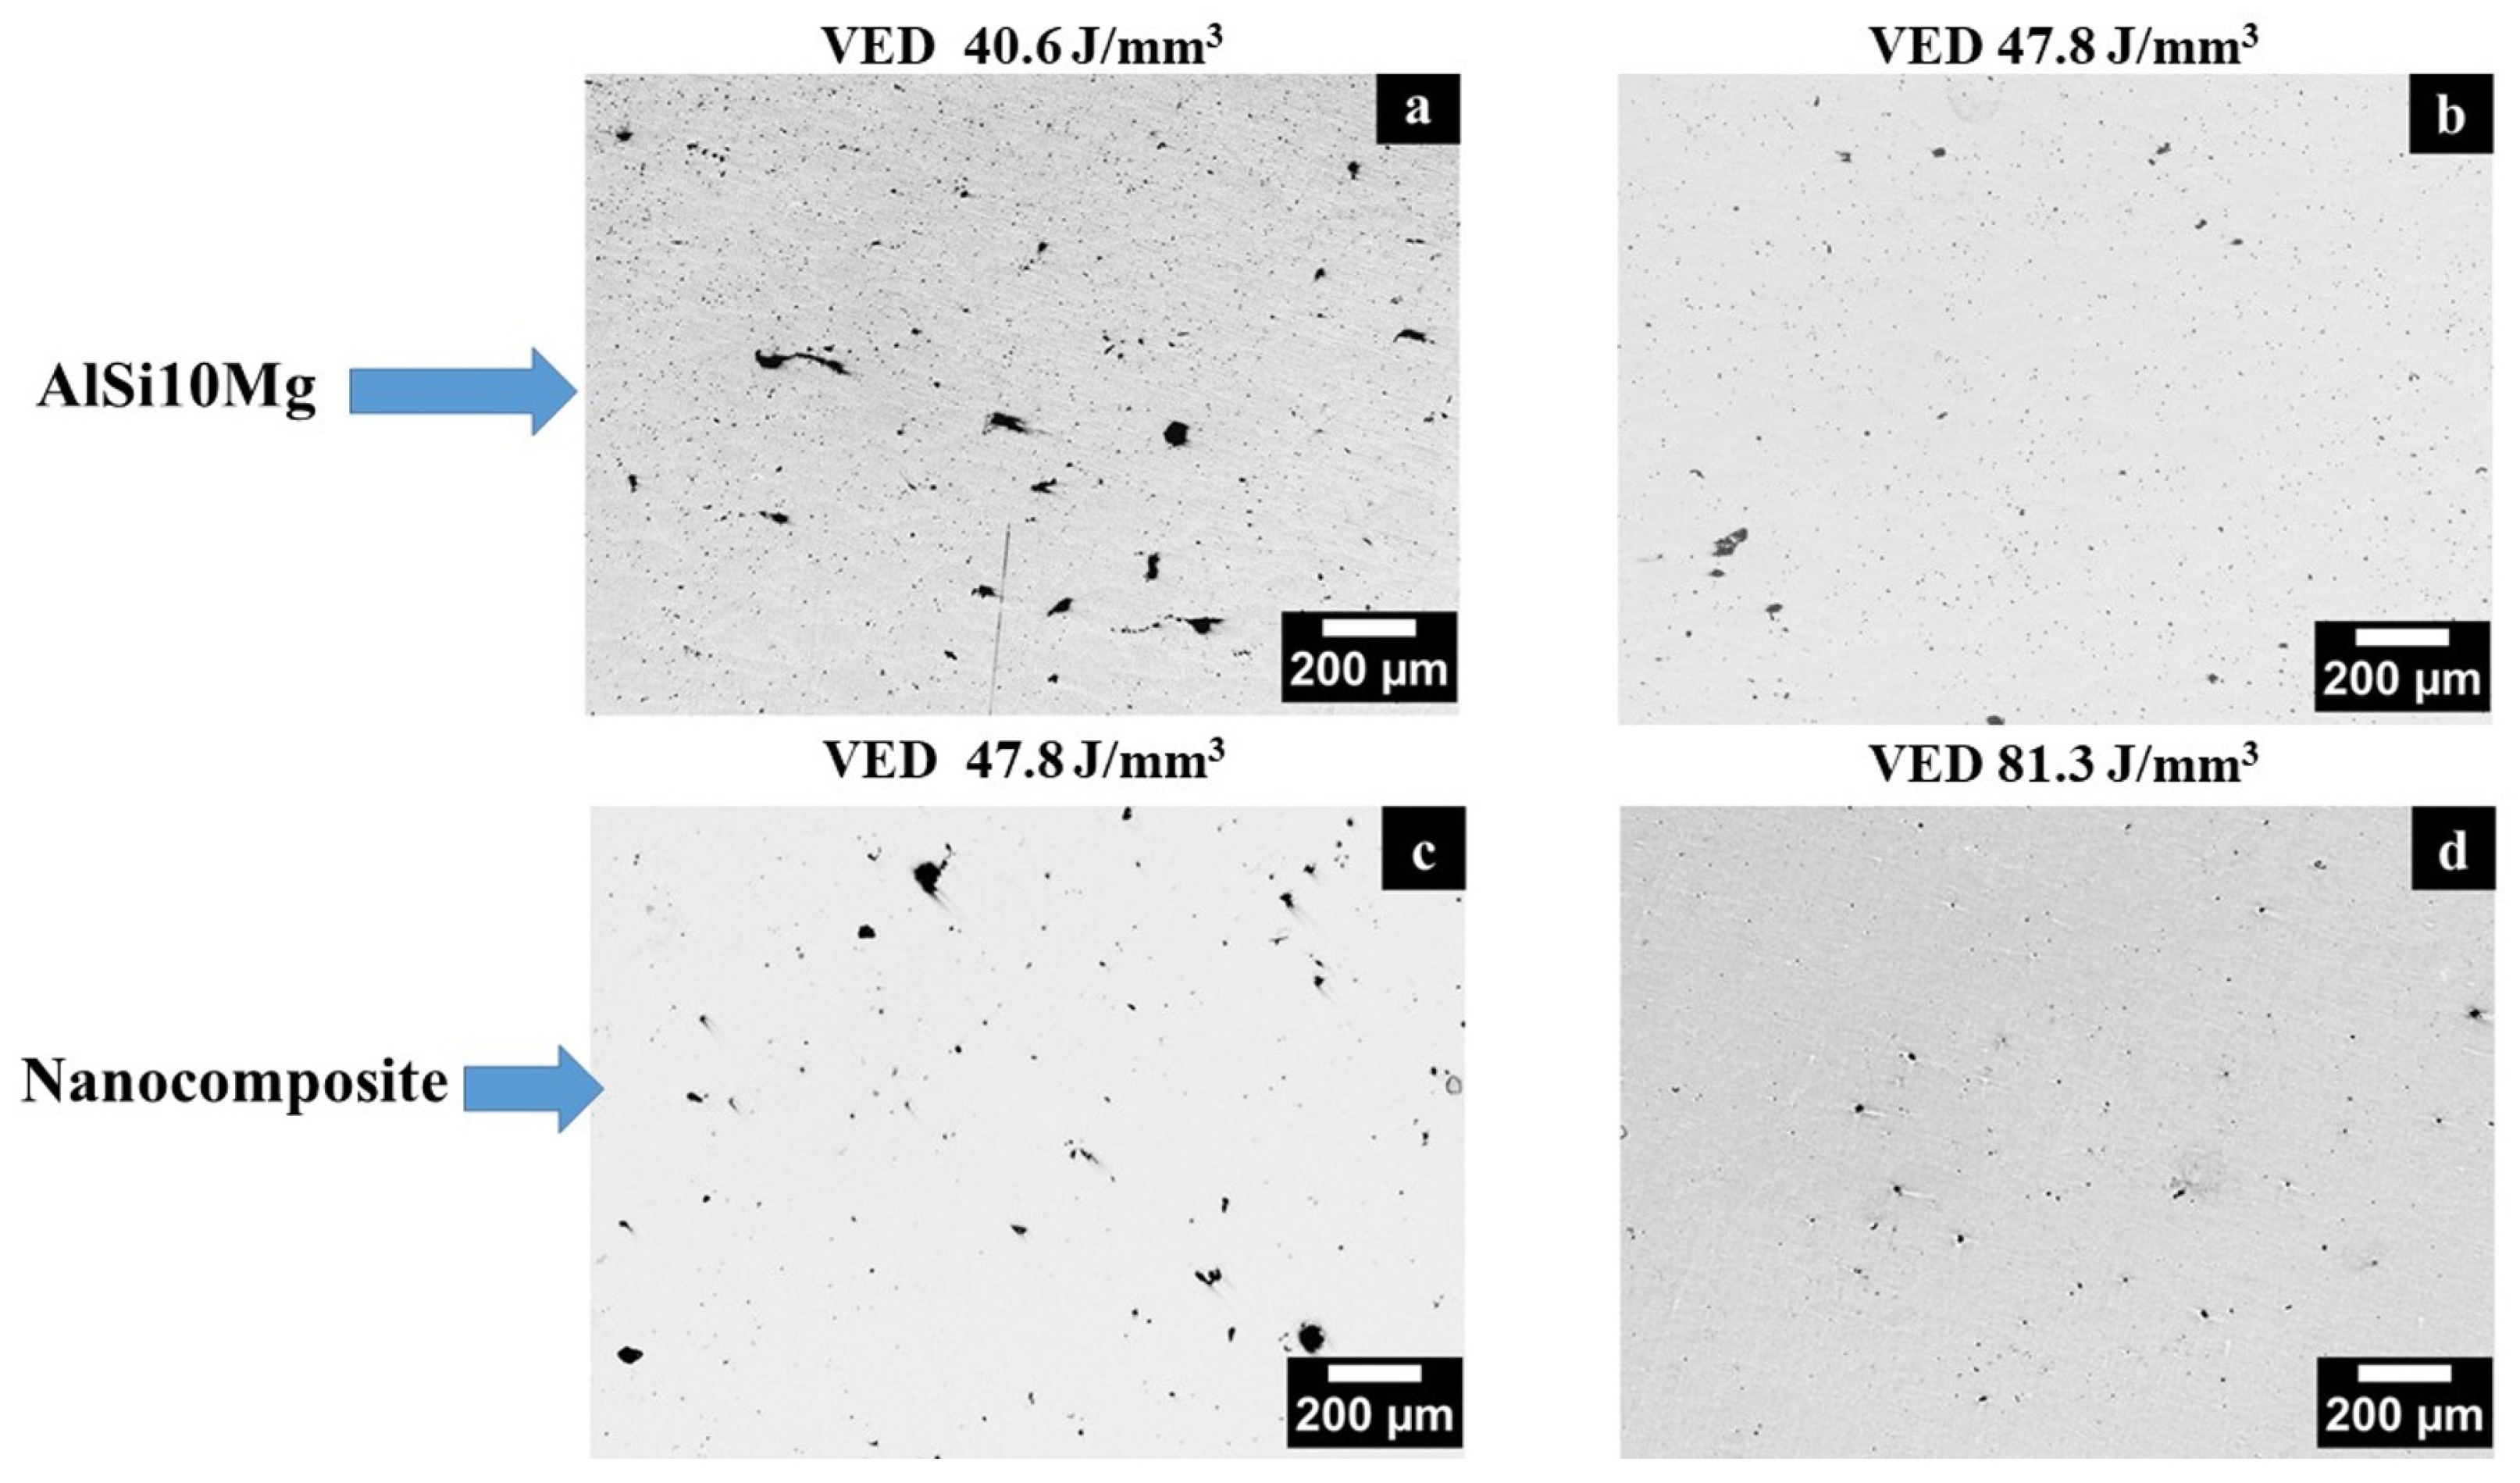
The effect of the combination of different process parameters on the densification levels allowed the fabrication of dense and crack-free nanocomposites with a residual porosity of 0.59 ± 0.09% using a VED of 81.3 J/mm3, reaching densification levels similar to AlSi10Mg alloy (residual porosity of 0.37 ± 0.08% using a VED of 47.8 J/mm3).
(2)
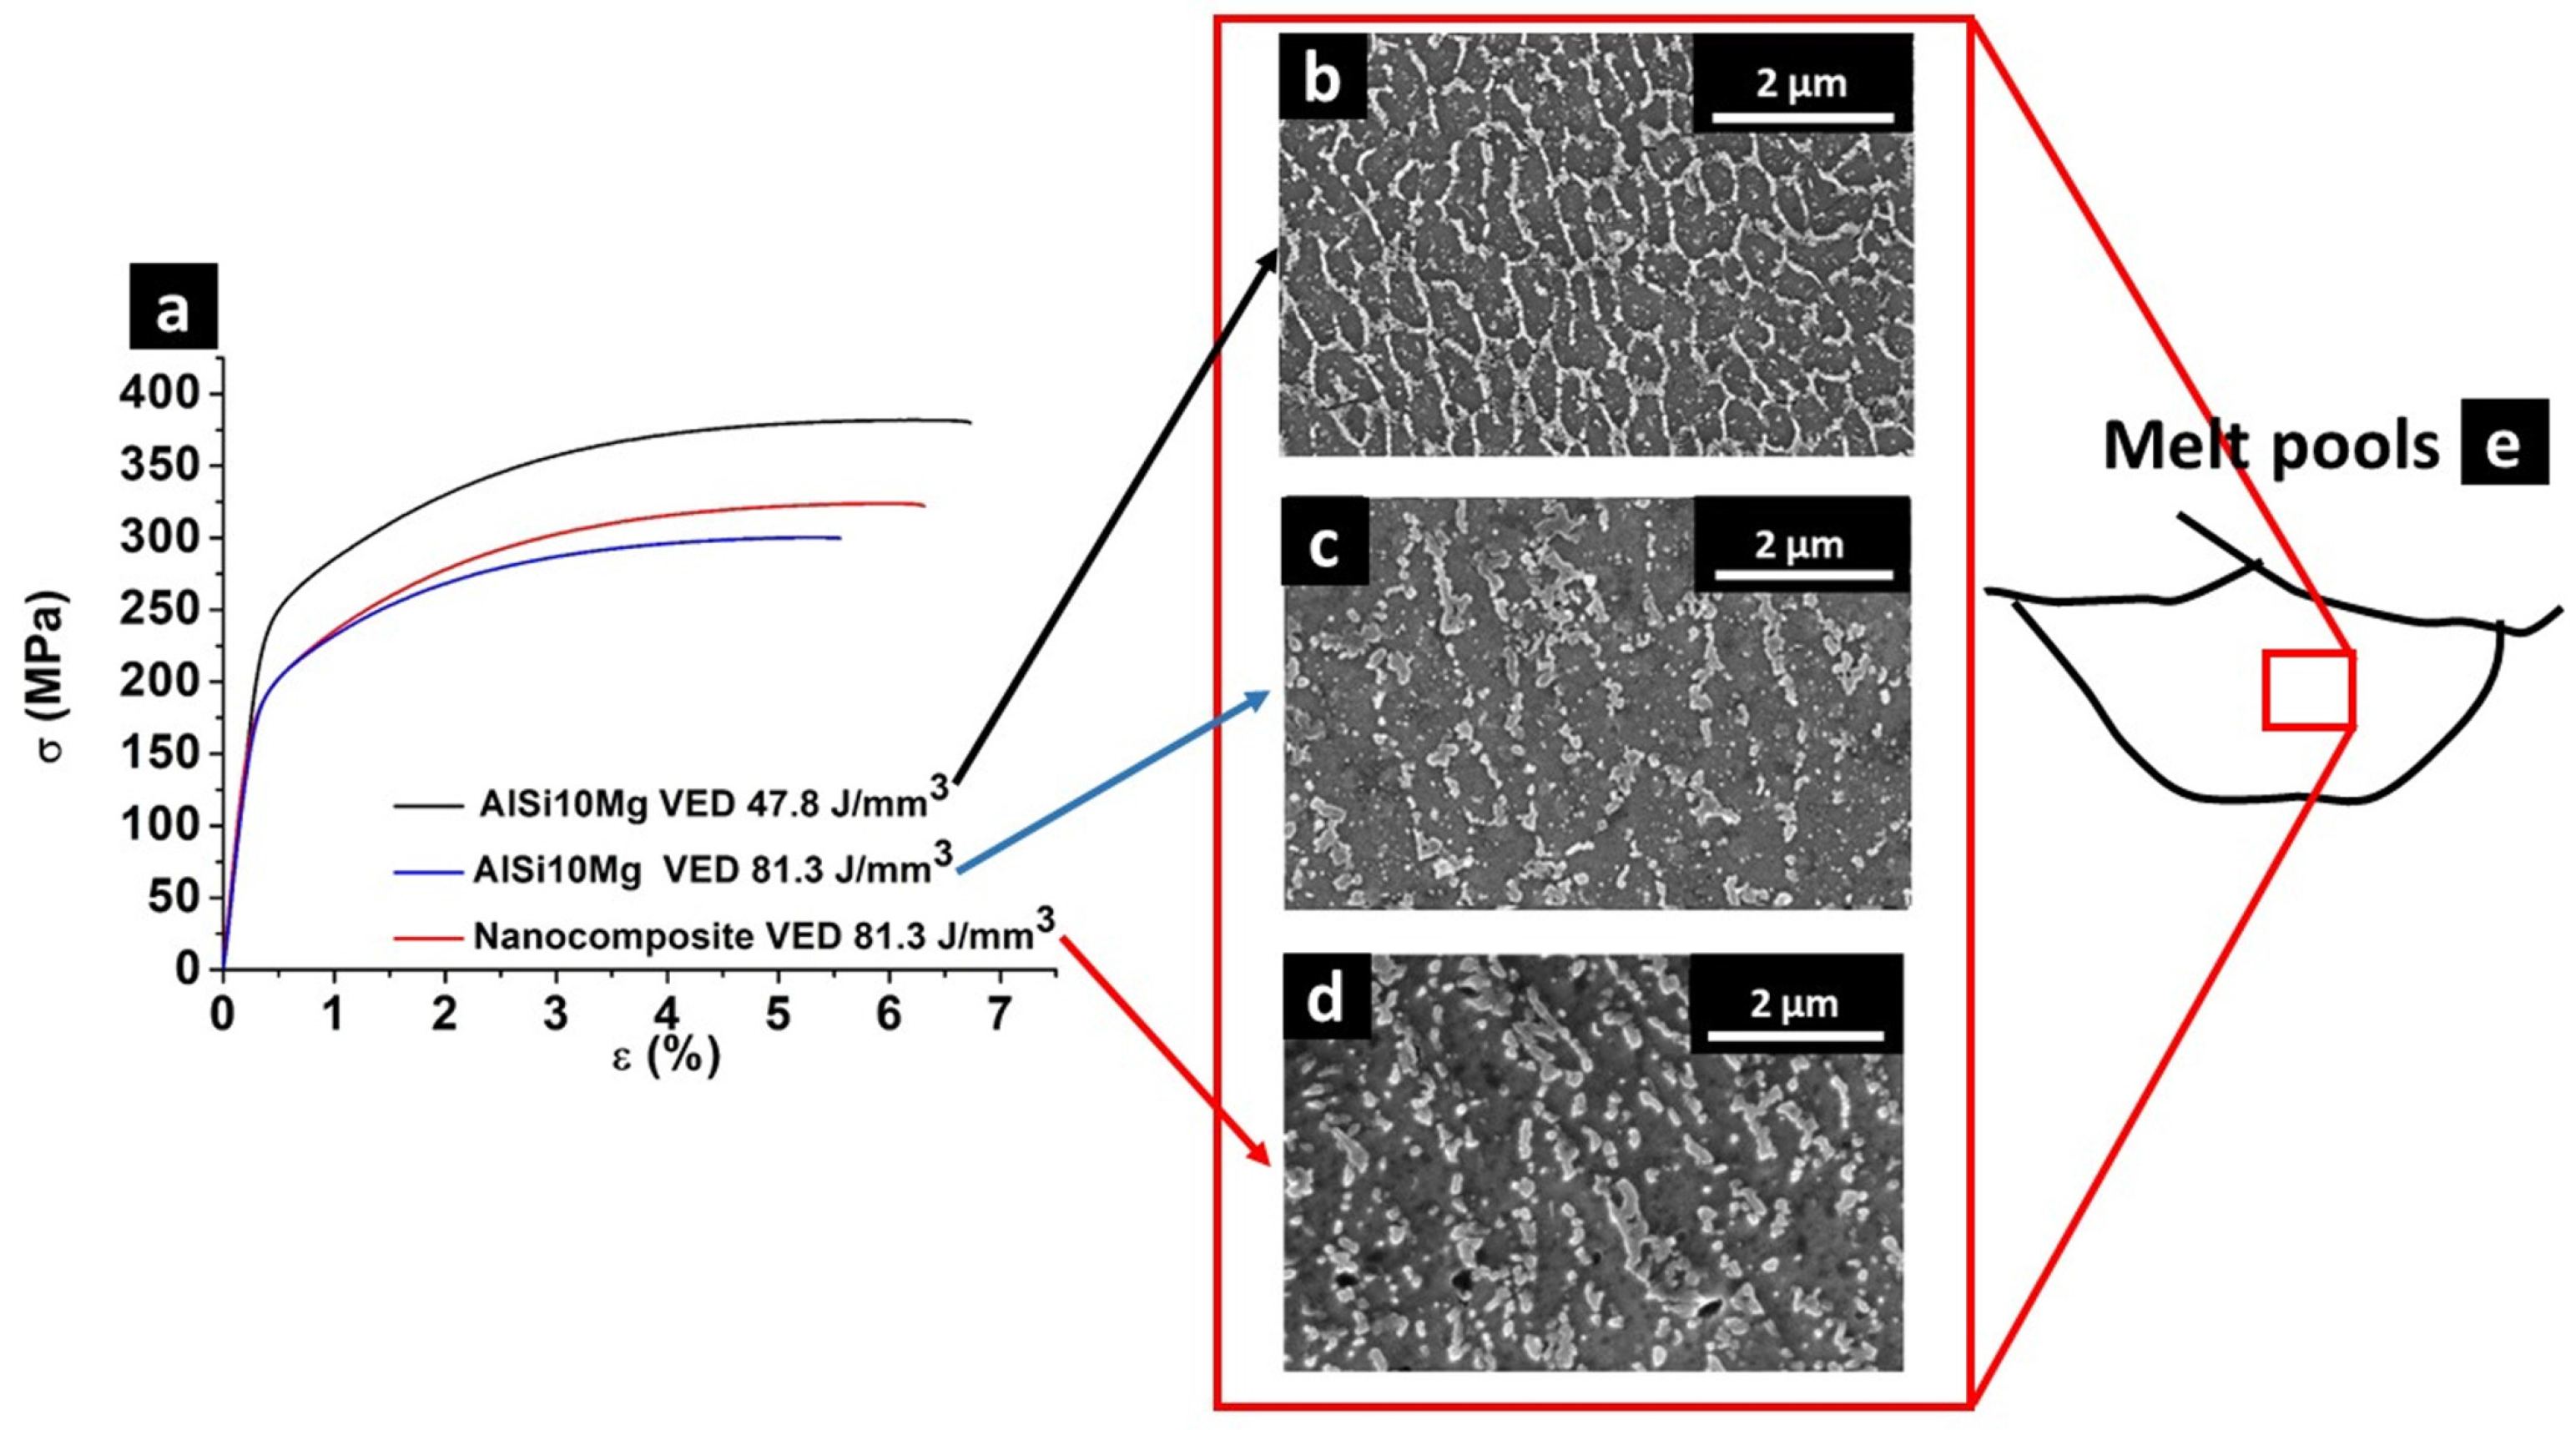
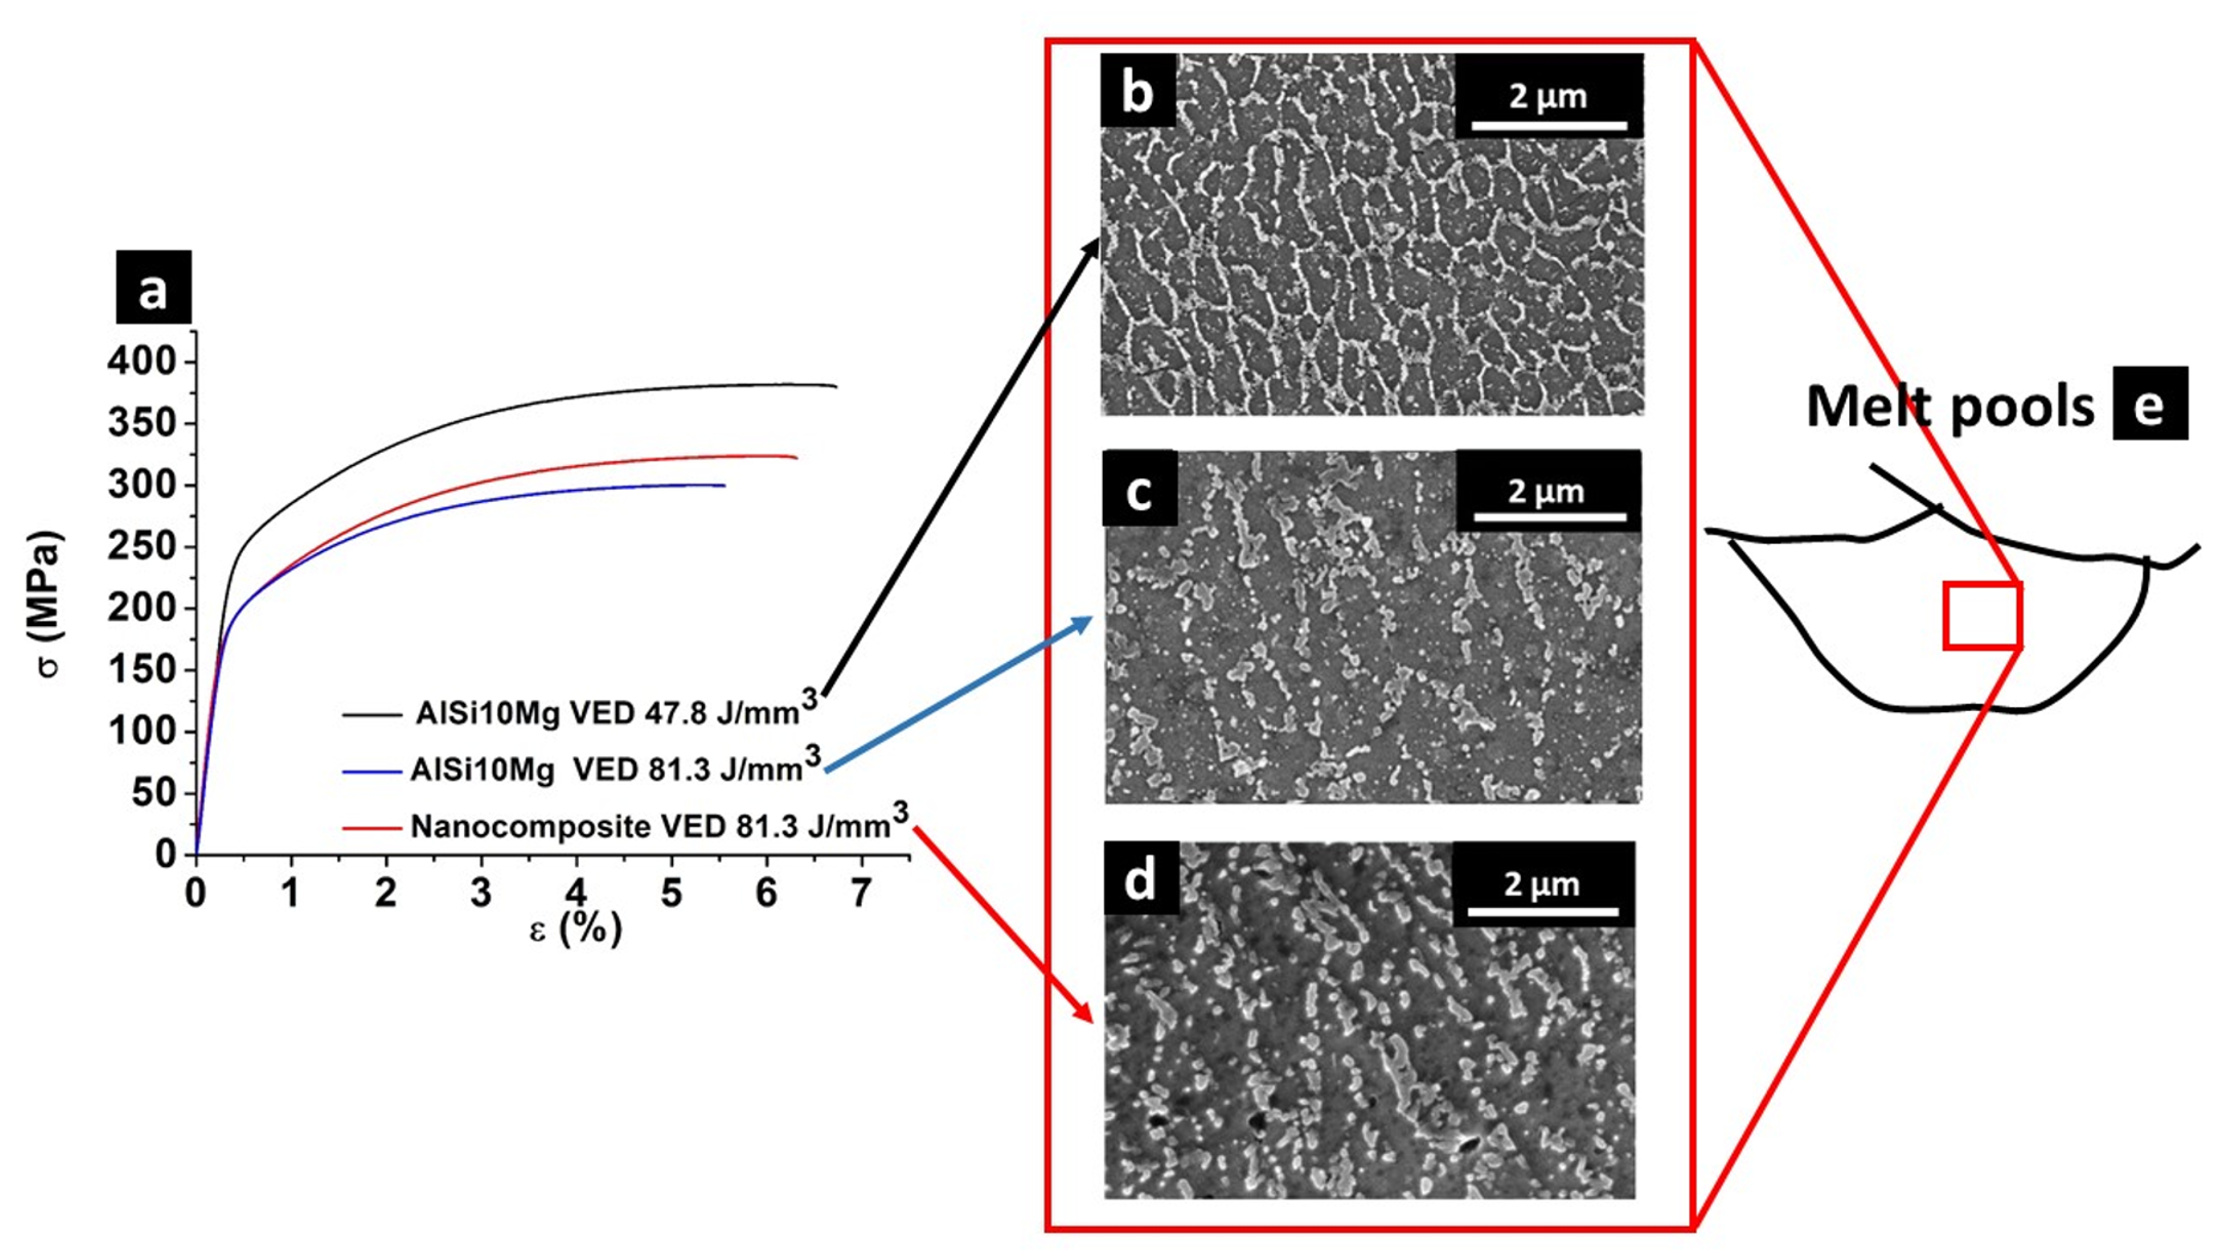
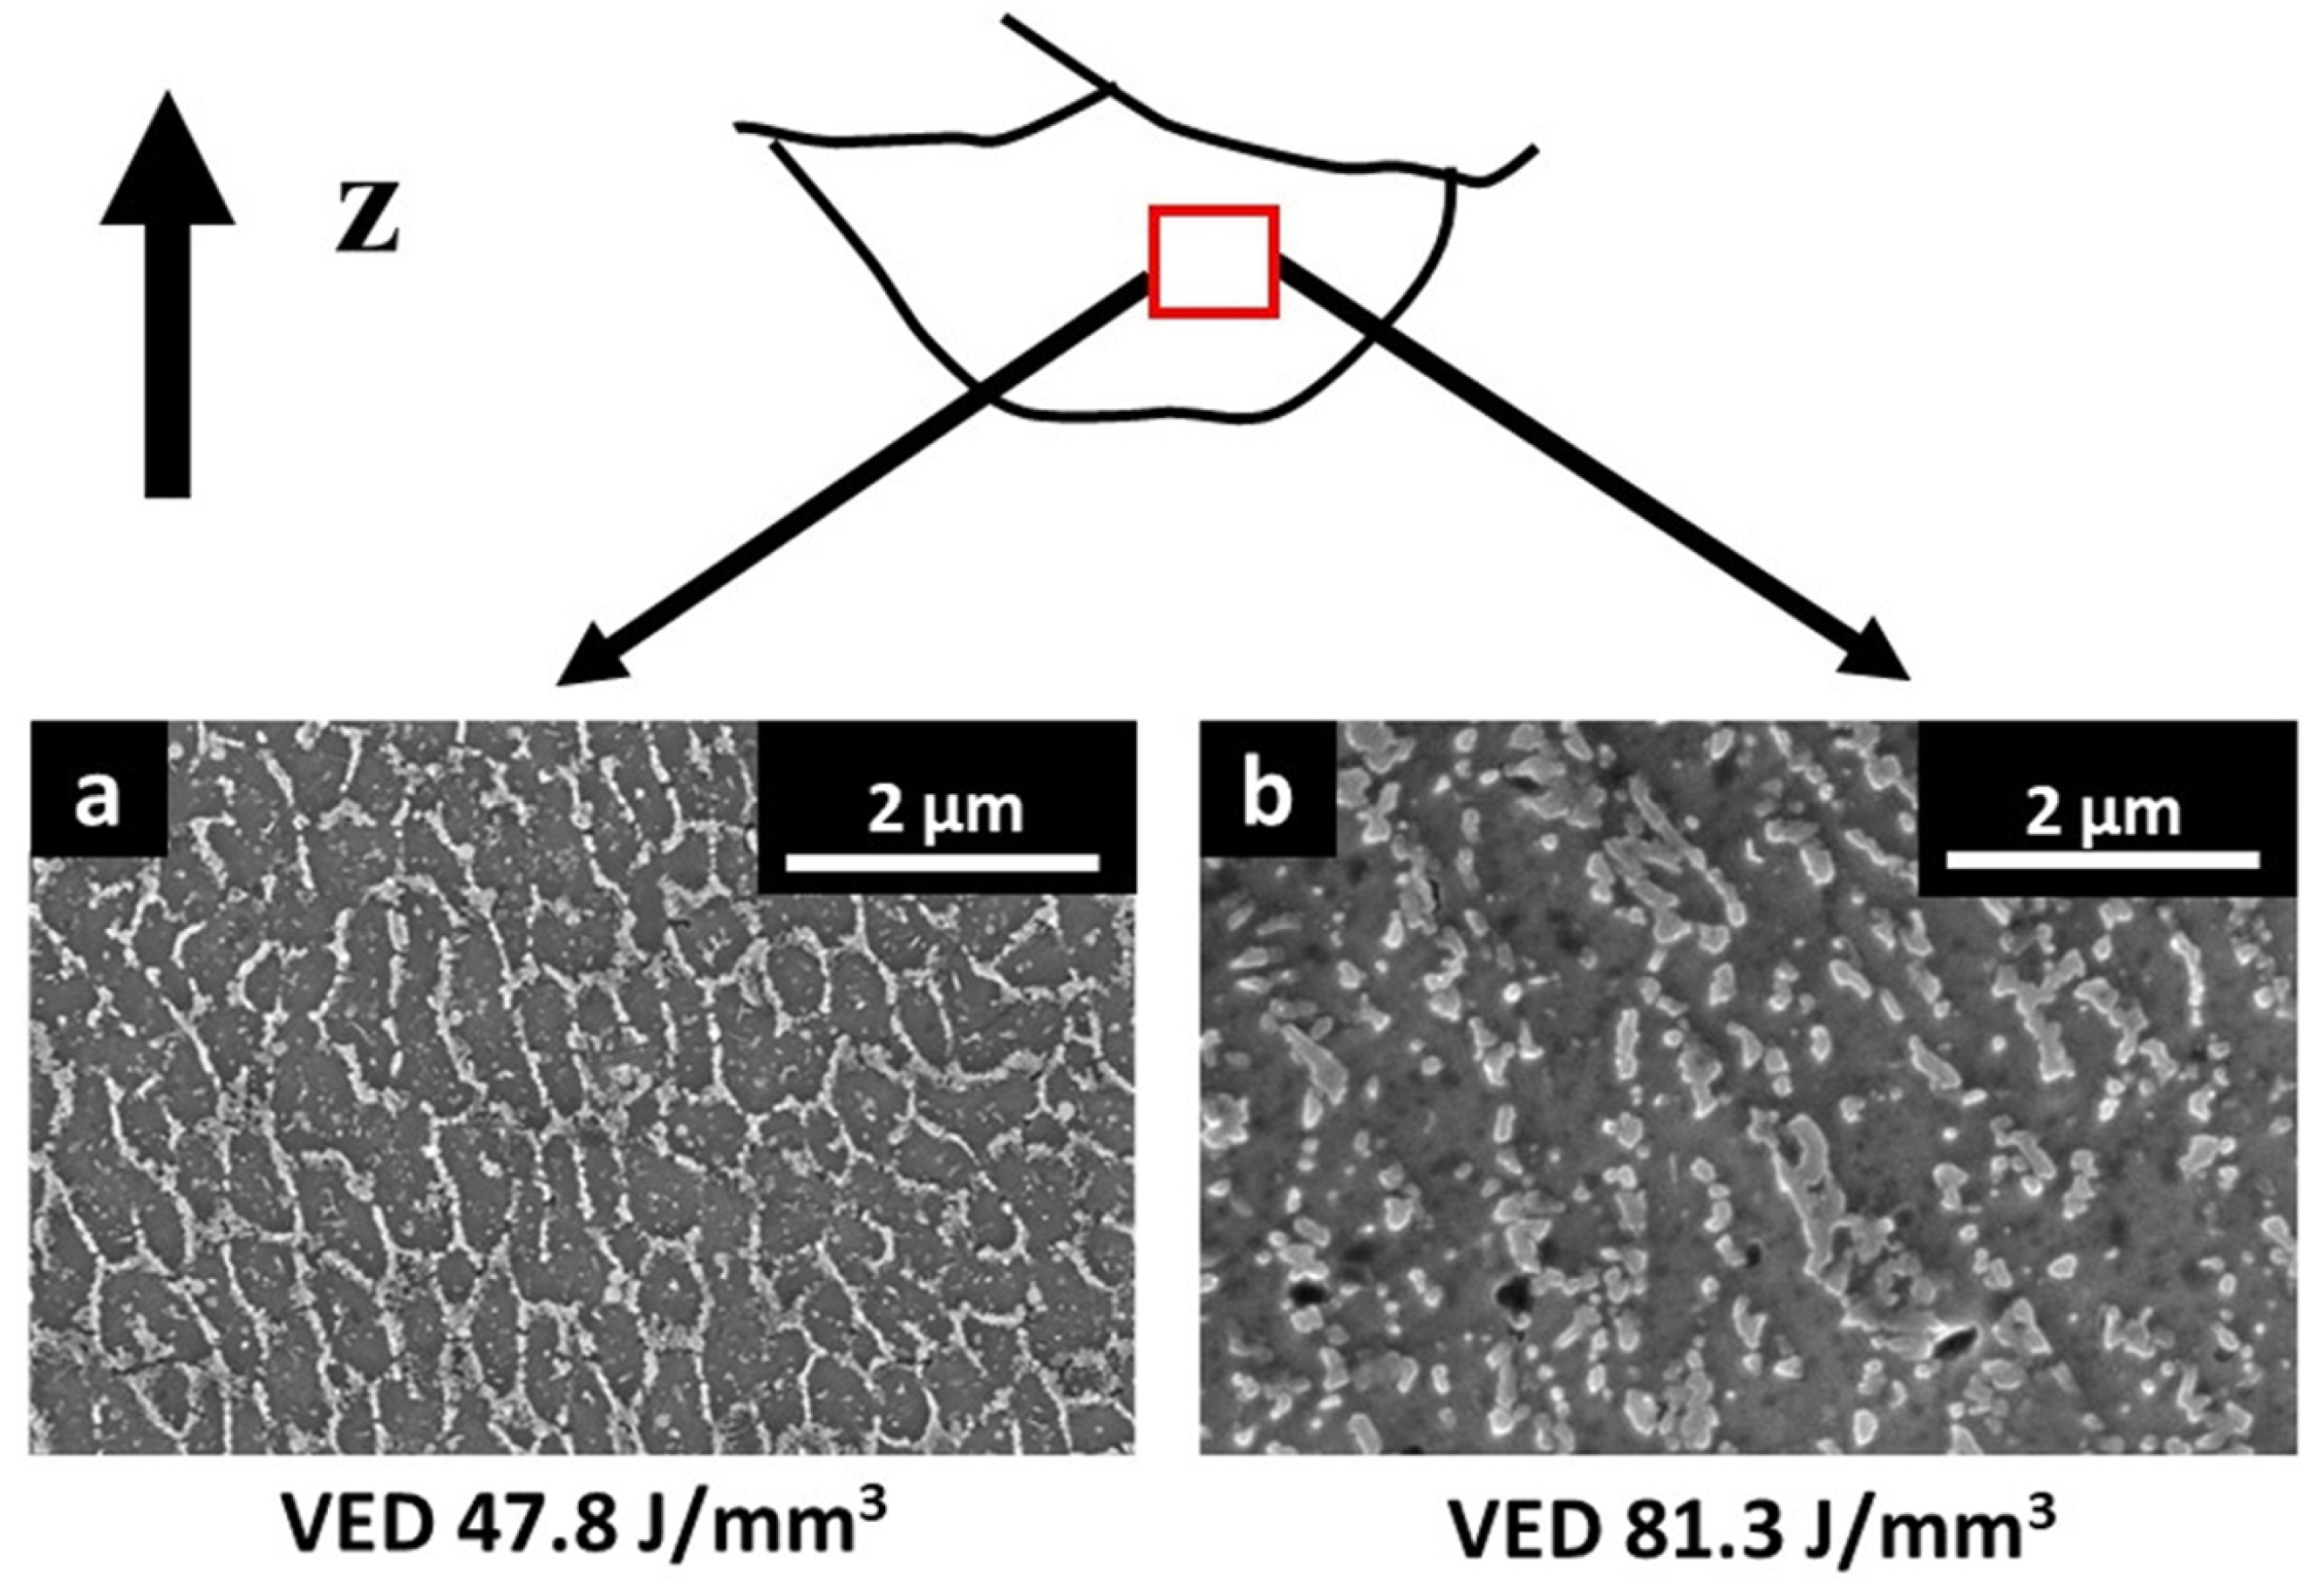
The nanocomposite samples built with a VED of 81.3 J/mm3 presented larger cellular structures and consequently, lower tensile properties than AlSi10Mg samples built with a lower VED value (47.8 J/mm3).
(3)
The different cellular dimensions appear to be chiefly influenced by the VED values; the higher is the VED values, the coarser is the cellular size. In fact, AlSi10Mg samples built with a higher VED value (81.3 J/mm3) exhibited lower tensile properties than AlSi10Mg built with a VED of 47.8 J/mm3.
(4)
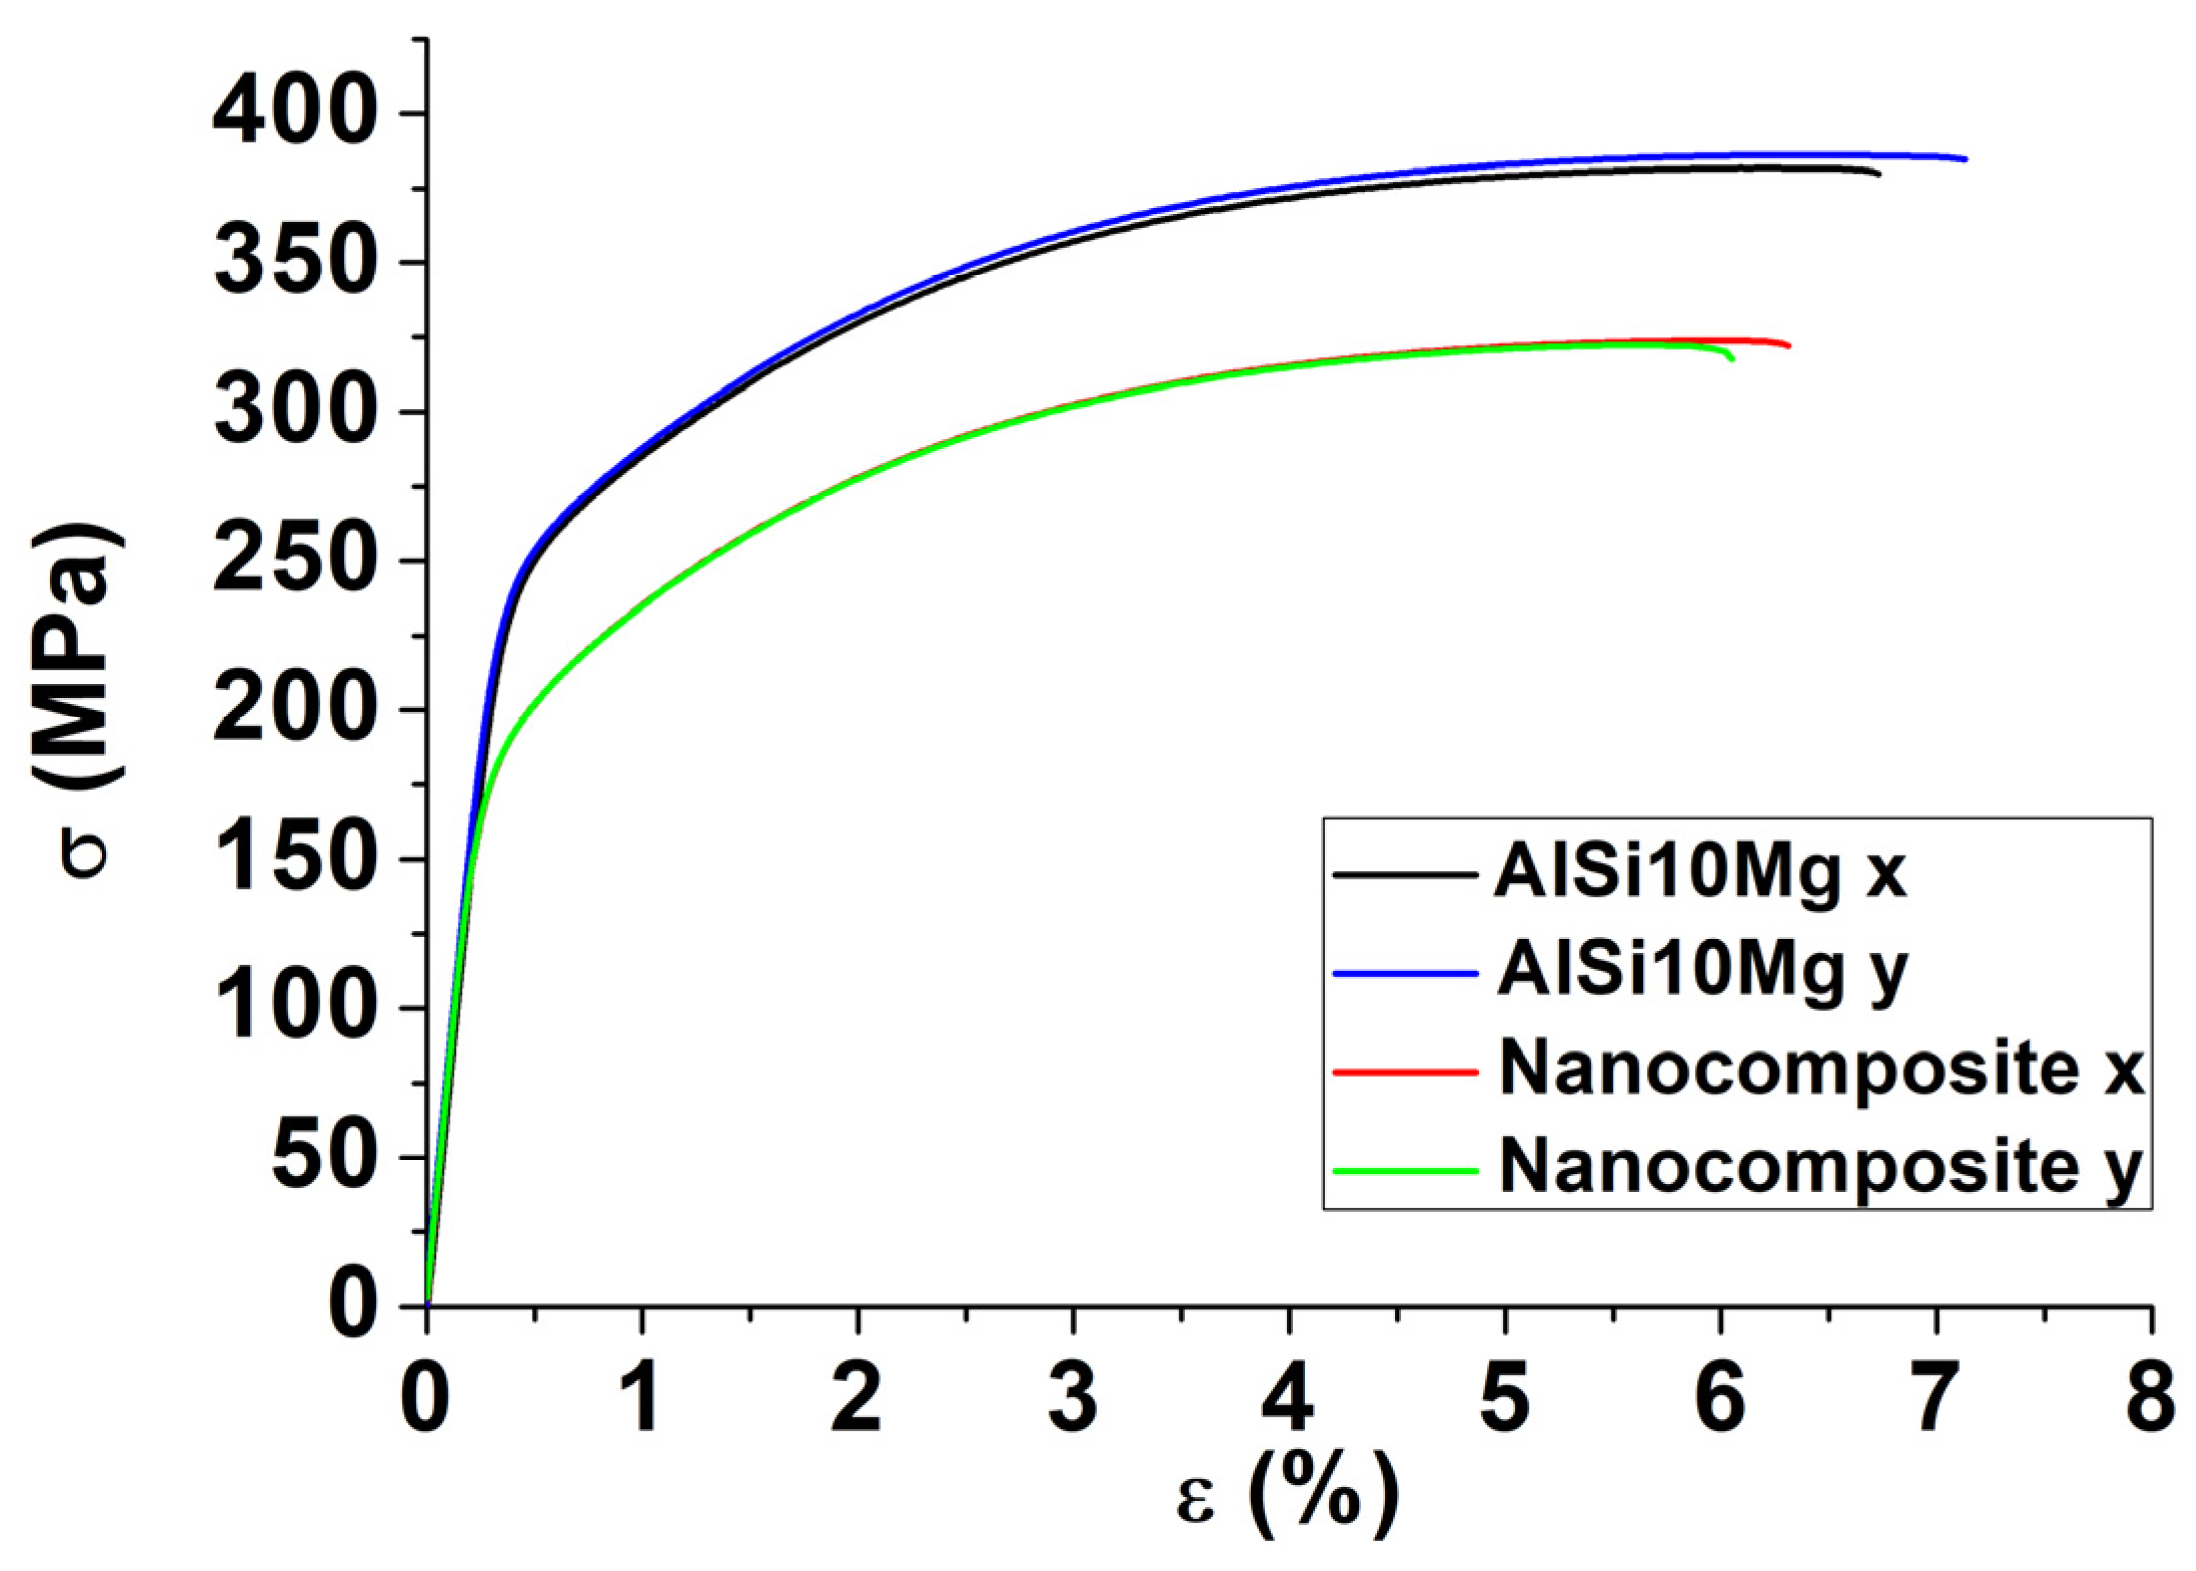
When the samples obtained with equal VED value are considered, the nanocomposites revealed slight higher σUTS than AlSi10Mg samples, suggesting an effect of the nanoparticles on hindering the dislocations.
(5)
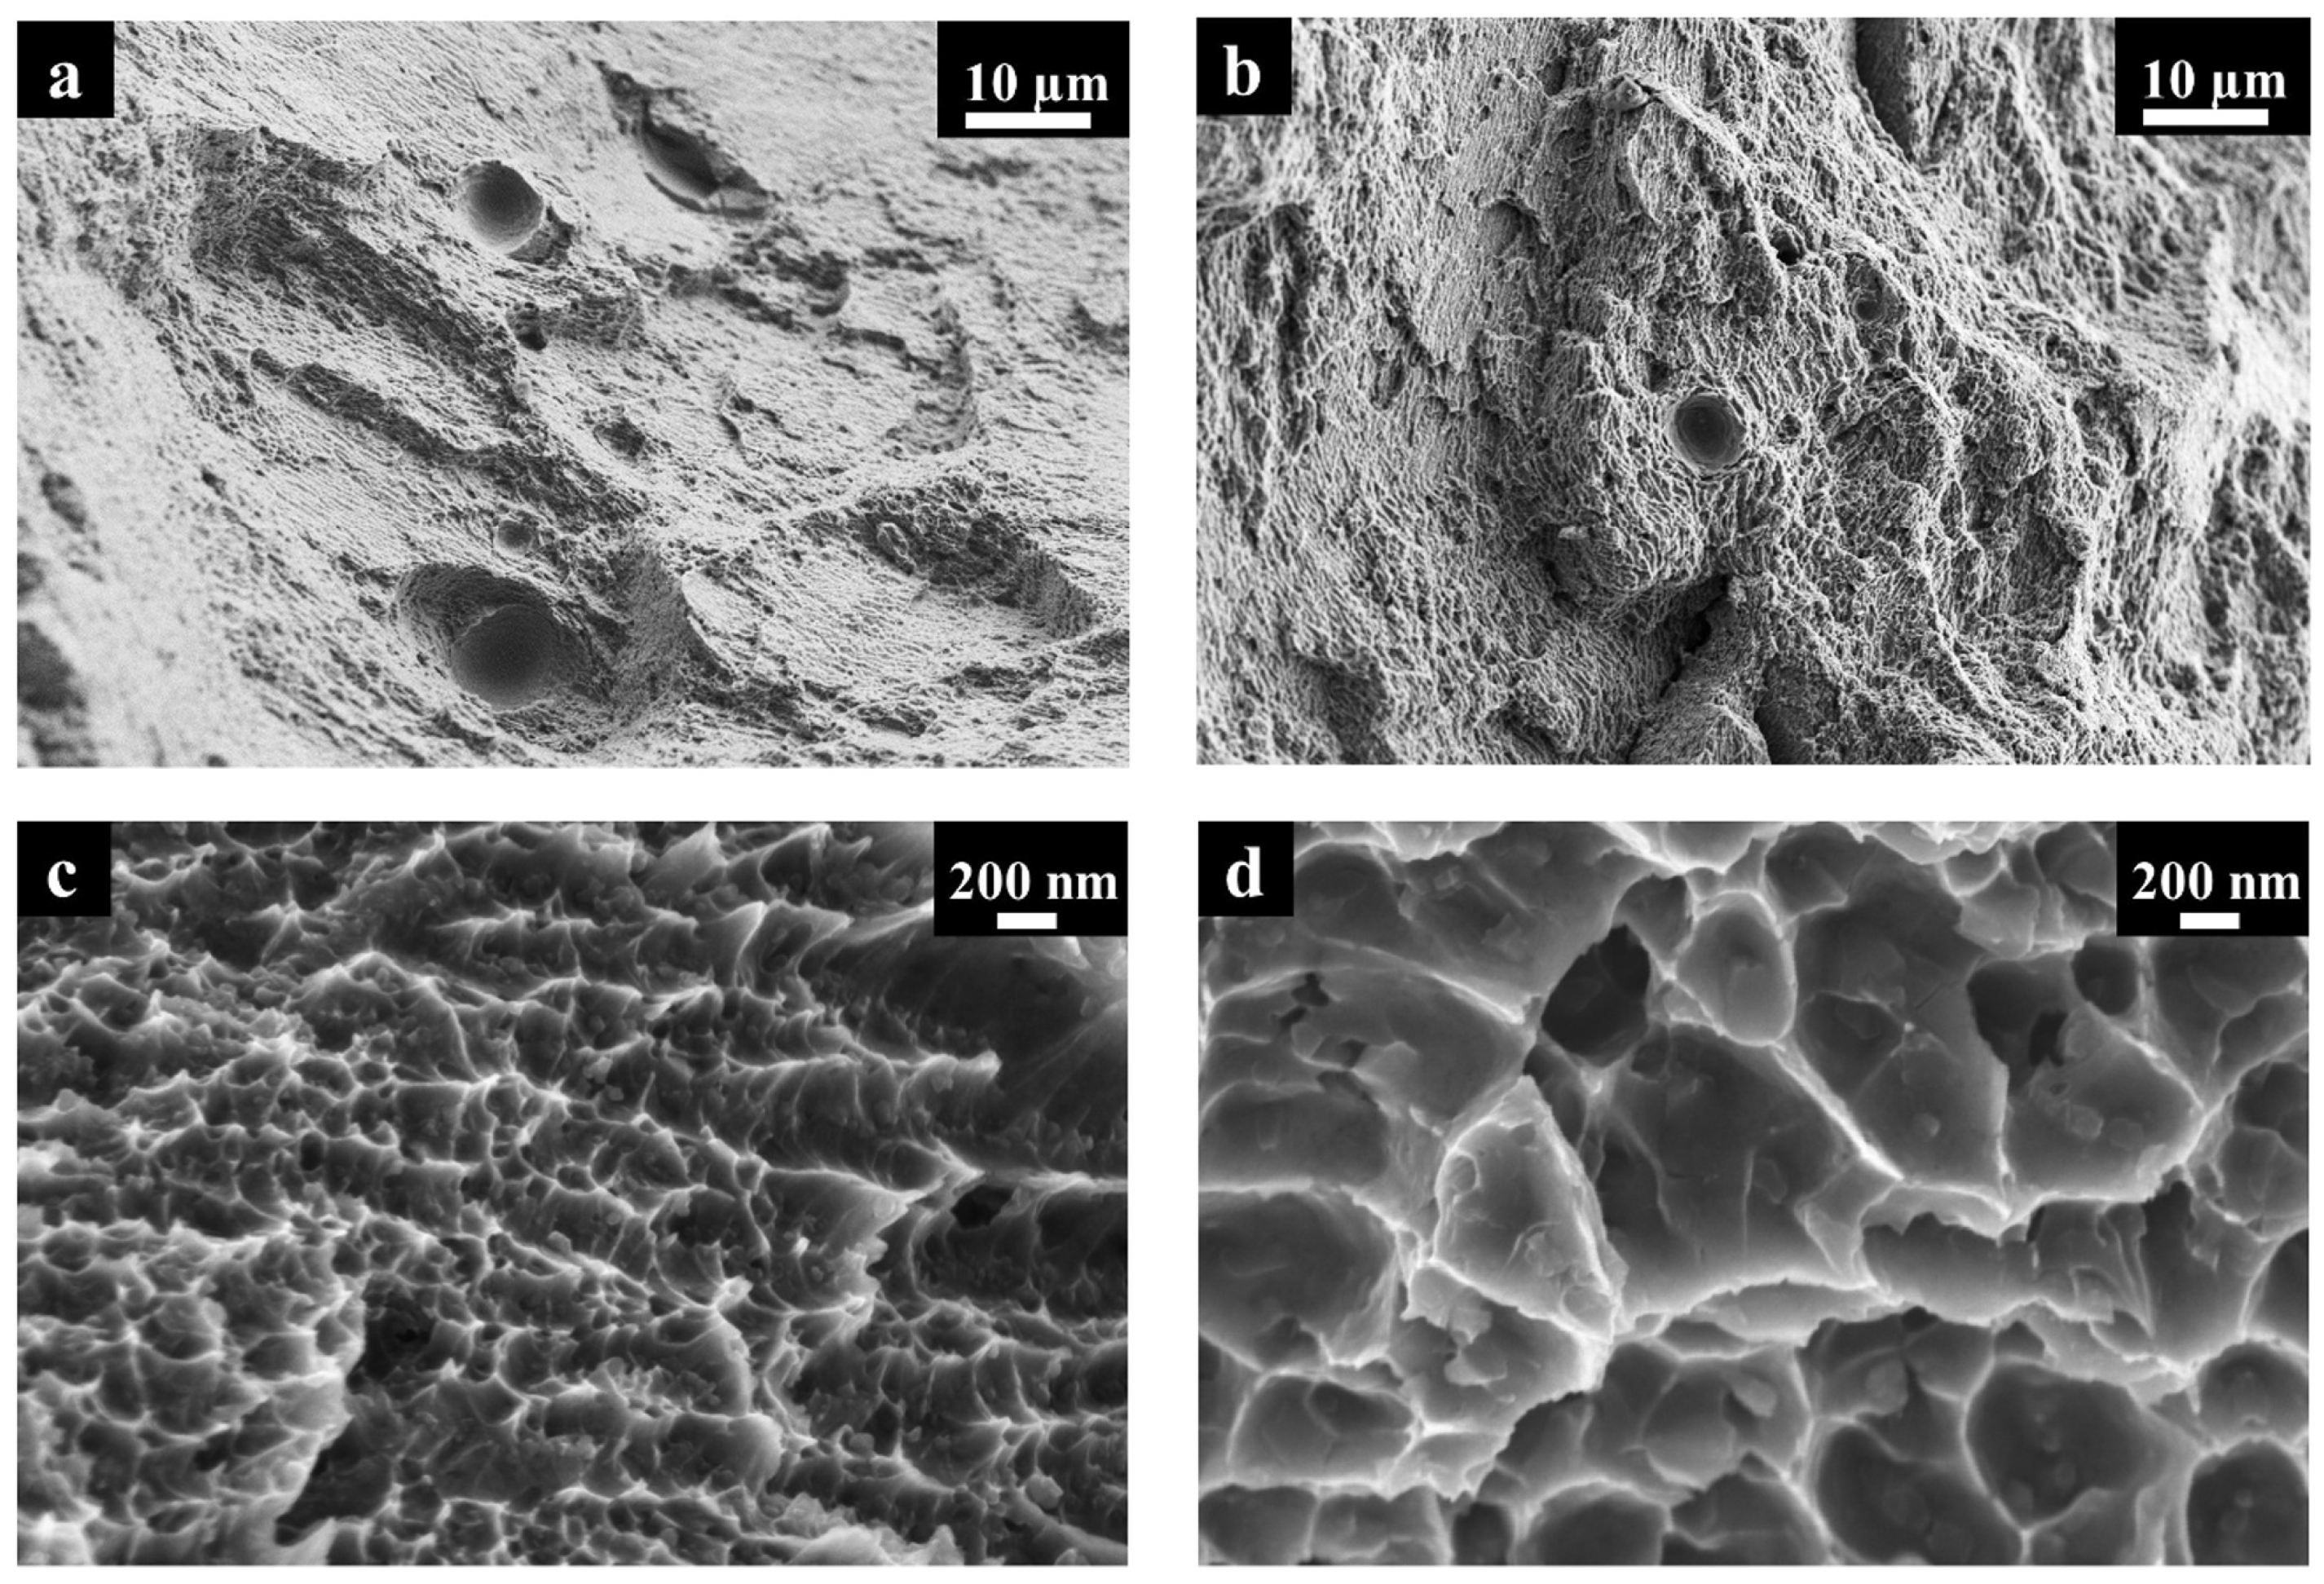
Both AlSi10Mg and nanocomposite materials built with selected VED exhibited mainly ductile fractures with dimples as well as some brittle fractures. It is interesting to note that the nanocomposite samples revealed larger dimples, mostly due to larger cellular structures with respect to the base alloy.
The results indicate that for fabricating LPBF nanocomposites, it is not only essential to determine appropriate parameters to generate dense samples but it is also crucial to consider the effect of the parameters on the microstructure. In particular, a different combination of building parameters, involving a different VED value, may give rise to some alterations on the microstructure and mechanical properties, restricting the positive effect of adding the nanoparticles.

Acknowledgments

The authors would like to acknowledge the European research project belonging to the VII framework program AMAZE, Additive Manufacturing Aiming Toward Zero Waste and Efficient Production of High-Tech Metal Products.

Author Contributions

Giulio Marchese carried out the main characterisations and wrote the paper. Alberta Aversa performed part of the experiments and took part in the writing process. Massimo Lorusso contributed to the experimental work by performing tensile tests. Diego Manfredi carried out FESEM analysis and revised the paper. Flaviana Calignano was responsible for the LPBF process and revised the paper. Mariangela Lombardi, Sara Biamino and Matteo Pavese supervised the whole work, taking part in the design of the experiment and revising the manuscript.

Conflicts of Interest

The authors declare no conflict of interest.

References

  1. Herzog, D.; Seyda, V.; Wycisk, E.; Emmelmann, C. Additive manufacturing of metals. Acta Mater. 2016, 117, 371–392. [Google Scholar] [CrossRef]
  2. Gu, D.D.; Meiners, W.; Wissenbach, K.; Poprawe, R. Laser additive manufacturing of metallic components: materials, processes and mechanisms. Int. Mater. Rev. 2012, 57, 133–164. [Google Scholar] [CrossRef]
  3. Trevisan, F.; Calignano, F.; Aversa, A.; Marchese, G.; Lombardi, M.; Biamino, S.; Ugues, D.; Manfredi, D. Additive manufacturing of titanium alloys in the biomedical field: processes, properties and applications. J. Appl. Biomater. Funct. Mater. 2017. [Google Scholar] [CrossRef] [PubMed]
  4. Marchese, G.; Garmendia Colera, X.; Calignano, F.; Lorusso, M.; Biamino, S.; Minetola, P.; Manfredi, D. Characterization and comparison of inconel 625 processed by selective laser melting and laser metal deposition. Adv. Eng. Mater. 2017, 19, 1600635. [Google Scholar] [CrossRef]
  5. Olakanmi, E.O.; Cochrane, R.F.; Dalgarno, K.W. A review on selective laser sintering/melting (SLS/SLM) of aluminium alloy powders: Processing, microstructure and properties. Prog. Mater. Sci. 2015, 74, 401–477. [Google Scholar] [CrossRef]
  6. Manfredi, D.; Calignano, F.; Krishnan, M.; Canali, R.; Ambrosio, E.P.; Atzeni, E. From powders to dense metal parts: Characterization of a commercial AlSiMg alloy processed through direct metal laser sintering. Materials 2013, 6, 856–869. [Google Scholar] [CrossRef] [PubMed]
  7. Rao, H.; Giet, S.; Yang, K.; Wu, X.; Davies, C.H.J. The influence of processing parameters on aluminium alloy A357 manufactured by selective laser melting. Mater. Des. 2016, 109, 334–346. [Google Scholar] [CrossRef]
  8. Trevisan, F.; Calignano, F.; Lorusso, M.; Pakkanen, J.; Aversa, A.; Ambrosio, E.P.; Lombardi, M.; Fino, P.; Manfredi, D. On the selective laser melting (SLM) of the AlSi10Mg alloy: Process, microstructure and mechanical properties. Materials 2017, 10, 76. [Google Scholar] [CrossRef] [PubMed]
  9. Olakanmi, E.O.; Cochrane, R.F.; Dalgarno, K.W. Densification mechanism and microstructural evolution in selective laser sintering of Al-12Si powders. J. Mater. Process. Technol. 2011, 211, 113–121. [Google Scholar] [CrossRef]
  10. Ma, P.; Prashanth, K.; Scudino, S.; Jia, Y.; Wang, H.; Zou, C.; Wei, Z.; Eckert, J. Influence of annealing on mechanical properties of Al-20Si processed by selective laser melting. Metals 2014, 4, 28–36. [Google Scholar] [CrossRef]
  11. Wu, J.; Wang, X.Q.; Wang, W.; Attallah, M.M.; Loretto, M.H. Microstructure and strength of selectively laser melted AlSi10Mg. Acta Mater. 2016, 117, 311–320. [Google Scholar] [CrossRef]
  12. Manfredi, D.; Calignano, F.; Krishnan, M.; Canali, R.; Ambrosio, E.P.; Biamino, S.; Ugues, D.; Pavese, M.; Fino, P. Additive manufacturing of Al alloys and aluminium matrix composites (AMCs). In Light Metal Alloys Applications; Monteirio, A., Waldemar, Eds.; InTech: Rijeka, Croatia, 2014; ISBN 978-953-51-1588-5. [Google Scholar]
  13. Chang, F.; Gu, D.; Dai, D.; Yuan, P. Selective laser melting of in-situ Al4SiC4 + SiC hybrid reinforced Al matrix composites: Influence of starting SiC particle size. Surf. Coat. Technol. 2015, 272, 15–24. [Google Scholar] [CrossRef]
  14. Gu, D.; Wang, H.; Dai, D.; Chang, F.; Meiners, W.; Hagedorn, Y. Densification behavior, microstructure evolution and wear property of TiC nanoparticle reinforced AlSi10Mg bulk-form nanocomposites prepared by selective laser melting. J. Laser Appl. 2015, 17003. [Google Scholar] [CrossRef]
  15. Dai, D.; Gu, D. Influence of thermodynamics within molten pool on migration and distribution state of reinforcement during selective laser melting of AlN/AlSi10Mg composites. Int. J. Mach. Tools Manuf. 2016, 100, 14–24. [Google Scholar] [CrossRef]
  16. De Vita, A.; Roitti, S.; Sbaizero, O. Creep of aluminum metal matrix composites reinforced with magnesium spinel. Key Eng. Mater. 2004, 264–268, 953–956. [Google Scholar] [CrossRef]
  17. Schweinfest, R.; Ernst, F.; Wagner, T.; Rühle, M. High-precision assessment of interface lattice offset by quantitative HRTEM. J. Microsc. 1999, 194, 142–151. [Google Scholar] [CrossRef] [PubMed]
  18. Manfredi, D.; Canali, R.; Krishnan, M.; Ambrosio, E.P.; Calignano, F.; Pavese, M.; Miranti, L.; Belardinelli, S.; Biamino, S.; Fino, P. Aluminium matrix composites (AMCs) by DMLS. In High Value Manufacturing: Advanced Research in Virtual and Rapid Prototyping, Proceedings of the 6th International Conference on Advanced Research in Virtual and Rapid Prototyping, Leiria, Portugal, 1–5 October 2013; CRC Press: Boca Raton, FL, USA, 2013; p. 249. [Google Scholar]
  19. Aversa, A.; Marchese, G.; Lorusso, M.; Calignano, F.; Biamino, S.; Ambrosio, E.P.; Manfredi, D.; Fino, P.; Lombardi, M.; Pavese, M. Microstructural and mechanical characterization of aluminum matrix composites produced by laser powder bed fusion. Adv. Eng. Mater. 2017, 19, 1700180. [Google Scholar] [CrossRef]
  20. Nanocerox Spinel—MgAl2O4. Available online: http://www.nanocerox.com/product_spinel (accessed on 7 February 2018).
  21. Olakanmi, E.O. Selective laser sintering/melting (SLS/SLM) of pure Al, Al-Mg and Al-Si powders: Effect of processing conditions and powder properties. J. Mater. Process. Technol. 2013, 213, 1387–1405. [Google Scholar] [CrossRef]
  22. Sercombe, T.B.; Li, X. Selective laser melting of aluminium and aluminium metal matrix composites: Review. Mater. Technol. 2016, 31, 77–85. [Google Scholar] [CrossRef]
  23. EOS GmbH—Electro Optical Systems Material Data Sheet: EOS Aluminium AlSi10Mg. Available online: www.agile-manufacturing.com/files/materials/aluminum.pdf (accessed on 7 February 2018).
  24. Kreyling, W.G.; Semmler-Behnke, M.; Chaudhry, Q. A complementary definition of nanomaterial. Nano Today 2010, 5, 165–168. [Google Scholar] [CrossRef]
  25. Spierings, A.B.; Schneider, M.; Eggenberg, R. Comparison of density measurement techniques for additive manufactured metallic parts. Rapid Prototyp. J. 2011, 5, 380–386. [Google Scholar] [CrossRef]
  26. Frazier, W.E. Metal additive manufacturing: A review. J. Mater. Eng. Perform. 2014, 23, 1917–1928. [Google Scholar] [CrossRef]
  27. Vilaro, T.; Colin, C.; Bartout, J.D. As-fabricated and heat-treated microstructures of the Ti-6Al-4V alloy processed by selective laser melting. Metall. Mater. Trans. A Phys. Metall. Mater. Sci. 2011, 42, 3190–3199. [Google Scholar] [CrossRef]
  28. Yuan, P.; Gu, D. Molten pool behaviour and its physical mechanism during selective laser melting of TiC/AlSi10Mg nanocomposites: simulation and experiments. J. Phys. D Appl. Phys. 2015, 48, 35303. [Google Scholar] [CrossRef]
  29. Wei, P.; Wei, Z.; Chen, Z.; Du, J.; He, Y.; Li, J.; Zhou, Y. The AlSi10Mg samples produced by selective laser melting: Single track, densification, microstructure and mechanical behavior. Appl. Surf. Sci. 2017, 408, 38–50. [Google Scholar] [CrossRef]
  30. Chawla, N.; Chawla, K.K. Metal Matrix Composites; Springer-Verlag New York: New York, NY, USA, 2013; ISBN 978-1-4614-9547-5. [Google Scholar]
  31. Tang, M.; Pistorius, P.C.; Narra, S.; Beuth, J.L. Rapid solidification: Selective laser melting of AlSi10Mg. J. Miner. Met. Mater. Soc. 2016, 68, 960–966. [Google Scholar] [CrossRef]
  32. Liu, Y.J.; Liu, Z.; Jiang, Y.; Wang, G.W.; Yang, Y.; Zhang, L.C. Gradient in microstructure and mechanical property of selective laser melted AlSi10Mg. J. Alloy. Compd. 2017, 735, 1414–1421. [Google Scholar] [CrossRef]
  33. Davis, J.R. Aluminum and Aluminum Alloys; ASM Specialty Handbook; ASM International: Almere, The Netherlands, 1993; ISBN 9780871704962. [Google Scholar]
  34. Chen, B.; Moon, S.K.; Yao, X.; Bi, G.; Shen, J.; Umeda, J.; Kondoh, K. Strength and strain hardening of a selective laser melted AlSi10Mg alloy. Scr. Mater. 2017, 141, 45–49. [Google Scholar] [CrossRef]
  35. Tradowsky, U.; White, J.; Ward, R.M.; Read, N.; Reimers, W.; Attallah, M.M. Selective laser melting of AlSi10Mg: Influence of post-processing on the microstructural and tensile properties development. Mater. Des. 2016, 105, 212–222. [Google Scholar] [CrossRef]
Figure 1. FESEM (field emission scanning electron microscope) images of: (a) the AlSi10Mg alloy; (b) the nanoMgAl2O4 spinel; (c,d) and the mixed particles at different magnifications.
Metals 08 00175 g001
Figure 2. Optical images of the polished cross section of: (a) AlSi10Mg alloy built using a VED of 40.6 J/mm3; (b) AlSi10Mg built using the standard VED of 47.8 J/mm3; (c) nanocomposites built using a VED of 47.8 J/mm3; (d) nanocomposite built using the chosen VED of 81.3 J/mm3.
Metals 08 00175 g002
Figure 3. Schematic melt pool representation along building direction, pointing out the position of the FESEM images of (a) fine cellular structures for the AlSi10Mg alloy built using the standard parameters; (b) cellular structure not continuous of the nanocomposites built using the selected parameters to generate dense samples (after etching with Keller’s reagent).
Metals 08 00175 g003
Figure 4. Stress-strain curves for AlSi10Mg alloy and nanocomposite specimens built along the two different orientations.
Metals 08 00175 g004
Figure 5. (a) Tensile stress-strain curves of nanocomposite samples built using the selected VED (81.3 J/mm3); AlSi10Mg built using the chosen VED of nanocomposite (81.3 J/mm3) and with standard VED (47.8 J/mm3). All the samples were built along the x-direction; (bd) FESEM images of the samples revealing their cellular structure sizes along the building direction; (e) Schematic melt pools representation along the building direction, indicating the position of the taken FESEM images.
Metals 08 00175 g005
Figure 6. FESEM images of tensile fracture surface of LPBF samples built along x: (a,c) AlSi10Mg sample; (b,d) nanocomposite sample.
Metals 08 00175 g006
Table 1. LPBF (laser powder bed fusion) process parameters used for the fabrication of AlSi10Mg alloy and nanocomposite samples.
Volumetric Energy Density (VED)Laser Power (P)Scan Speed (v)Hatching Distance (hd)Layer Thickness (t)
(J/mm3)(W)(mm/s)(mm)(µm)
40.619516000.1030
47.81958000.1730
65.019510000.1030
81.31958000.1030
108.31956000.1030
130.01955000.1030
162.51954000.1030
Table 2. Values of residual porosity with their standard deviation obtained by Archimedes method and by image analysis on AlSi10Mg and nanocomposite samples.
VED (J/mm3)AlSi10MgNanocomposite
Archimedes MethodImage AnalysisArchimedes MethodImage Analysis
Residual Porosity (%)Residual Porosity (%)Residual Porosity (%)Residual Porosity (%)
40.61.31 ± 0.222.21 ± 0.302.35 ± 0.122.87 ± 0.15
47.80.37 ± 0.081.21 ± 0.181.40 ± 0.132.03 ± 0.15
65.00.53 ± 0.101.22 ± 0.270.75 ± 0.021.43 ± 0.20
81.30.61 ± 0.071.20 ± 0.100.59 ± 0.090.96 ± 0.07
108.30.50 ± 0.090.95 ± 0.220.68 ± 0.051.37 ± 0.14
130.00.56 ± 0.031.01 ± 0.190.67 ± 0.070.97 ± 0.10
162.50.47 ± 0.051.00 ± 0.270.51 ± 0.021.00 ± 0.12
Table 3. Average thermal diffusivity values with their standard deviation obtained for AlSi10Mg alloy and nanocomposite samples.
T (°C)AlSi10Mg (cm2/s)Nanocomposite (cm2/s)
2000.69 ± 0.010.67 ± 0.03
3000.66 ± 0.010.64 ± 0.02
4000.63 ± 0.010.62 ± 0.01
Table 4. Tensile properties obtained for AlSi10Mg and nanocomposite specimens built with different VED values in order to reach high densification levels, tested after a stress relieving treatment.
LPBF SpecimensOrientationVEDYoung ModulusYield StrengthUltimate Tensile StrengthElongation at Break
(J/mm3)(GPa)(MPa)(MPa)(%)
AlSi10Mg *x47.873 ± 3257 ± 2384 ± 26.7 ± 0.8
y47.873 ± 2256 ± 2382 ± 37.3 ± 0.2
Nanocomposite *x81.376 ± 1198 ± 1323 ± 36.3 ± 0.7
y81.374 ± 0.2198 ± 1322 ± 16.0 ± 0.1
* Stress relieved at 300 °C for 2 h.
Table 5. Tensile properties obtained for AlSi10Mg built using different VED values and nanocomposite samples built with the selected VED value along the x-direction.
LPBF SpecimensVED Young ModulusYield StrengthUltimate Tensile StrengthElongation at Break
(J/mm3)(GPa)(MPa)(MPa)(%)
AlSi10Mg *47.873 ± 3257 ± 2384 ± 26.7 ± 0.8
AlSi10Mg *81.371 ± 2203 ± 3301 ± 65.4 ± 0.4
Nanocomposite *81.376 ± 1198 ± 1323 ± 36.3 ± 0.7
* Stress relieved at 300 °C for 2 h.

