Article

Agglomeration Behavior of Non-Metallic Particles on the Surface of Ca-Treated High-Carbon Liquid Steel: An In Situ Investigation

by
Yasuhiro Tanaka
1,2,
Farshid Pahlevani
1,* and
Veena Sahajwalla
1
1
Centre for Sustainable Materials Research and Technology, School of Materials Science and Engineering, UNSW Sydney, 2052 Sydney, Australia
2
Steelmaking Division, Yawata Works, Nippon Steel & Sumitomo Metal Corporation, 8050058 Yawata, Japan
*
Author to whom correspondence should be addressed.
Metals 2018, 8(3), 176; https://doi.org/10.3390/met8030176
Submission received: 2 December 2017 / Revised: 9 March 2018 / Accepted: 10 March 2018 / Published: 12 March 2018

Abstract

:
The agglomeration behavior of non-metallic inclusion is a critical phenomenon that needs to be controlled as it has a direct relationship with the performance of produced steel. Although the agglomerates can be potential points for serious defects in every grade of steel, they are likely to be more serious in high-carbon steel due to the low ductility of these grades of steels as well as their usage in severe conditions. Confocal scanning laser microscopes (CSLM) have been used by different researchers to investigate the agglomeration behavior of non-metallic particles at the interface of liquid steel and Ar gas, in situ. In recent decades, the agglomeration of Al2O3 particle in and on the surface of low-carbon steel has been widely investigated. However, there are very few studies focussing on non-Al2O3 inclusions which are included in a Ca-treated high-carbon steel. In this study, the agglomeration behaviors of sulfide/sulfide and sulfide/oxide particles on the surface of liquid high-carbon steel have been investigated in detail using CSLM. Agglomerations on the liquid surface are governed by capillary forces similar to the Al2O3 particle but this study demonstrates that agglomeration forces among non-Al2O3 particles on the surface of re-melted high-carbon samples are lower than pure-Al2O3 on the surface of low-carbon steel. Despite this, they show similar or longer acting lengths than pure-Al2O3.

1. Introduction

The importance of producing steels with higher performance has increased drastically. Removing the inclusions from liquid steel to its maximum extent is one of the most important ways of enhancing wear resistance, ductility and longevity in the realisation of produced steels. Especially, when high strength, hardness and wear resistance are required, non-metallic inclusions can be critical. Individual sub-micron inclusions may not affect the performance of steel. However, the agglomerates of the sub-micron inclusions will produce a larger-size inclusion which is a weak point for steel. In addition to their effect on the final product, they may cause problems in production steps such as nozzle-clogging in a continuous casting process, leading to higher production costs.
There is a strong attraction force between alumina inclusions which cause them to agglomerate into a chain-like cluster. This behavior has been investigated intensively [1,2]. Recently, it was clarified by Sasai et al. that the agglomeration force of alumina inclusions was not originated from a Van der Waals force or capillary force but a cavity bridge force [3]. According to this research, when alumina inclusions come close to each other, a cavity bridge tends to be formed between them. If the contact angle between the oxide inclusion and liquid metal is less than 90°, this means that due to wettability a cavity bridge will not be formed between the oxides. It has been indicated that bonding through the cavity bridge may be the main reason for alumina inclusions strongly agglomerating in liquid steel. Furthermore, Zheng et al. investigated the attractive forces between different shapes of alumina inclusions based on the theory of spontaneous cavitation [4]. By calculating the rupture energy of a cavity bridge, Zheng et al. [4] demonstrated that a faceted inclusion has the strongest attractive force, which was reflected in a plate-like, dendritic and spherical shape. Also Fuchigami et al. [5] developed an agglomeration model by combining a coagulation calculation and flow simulation of liquid steel, where coagulation of alumina and slag-origin oxide inclusions were considered [5]. In this model, agglomeration frequency Z (m−3·s−1) was estimated by:
Z = α × N
where α is the agglomeration coefficient (-), and N is collision frequency between inclusions (m−3·s−1). Arai et al. [6] re-estimated the agglomeration coefficient α by re-calculating it based on the results reported by Nakaoka et al. [7] and Higashitani et al. [8], as slag-origin inclusion has a wide size distribution.
The agglomeration of non-metallic inclusions can occur not only between pure-alumina but also in other types of inclusions such as non-alumina oxides and sulfides. Additionally, a majority of high-carbon steels, including sulfur-containing materials, are deoxidised by silicon to avoid the generation of alumina-based inclusions such as an alumina cluster and spinel (MgO-Al2O3). Therefore, oxide inclusions in these grades of steel are combination of SiO2, CaO and Al2O3. Therefore, it is critically important to investigate the agglomeration behavior of non-alumina oxide and sulfide inclusions in liquid steel. High-carbon steel is one of the most important high-performance steel manufactures due to its high hardness and wear resistance, but there are very few studies focusing on the agglomeration behavior of inclusions.
In order to derive useful information associated with agglomeration behavior, in situ observation is one of the most suitable methods for this form of study. Yin et al. performed an in situ observation of alumina agglomeration by using a confocal scanning laser microscope (CSLM) combined with an infrared ray (IR) furnace [9,10]. Yin et al. [9,10] investigated the collision of alumina particles and the formation of alumina clusters at the interface of low-carbon Al-killed liquid steel and inert gas (Ar). The attraction force between two alumina particles on liquid surface was found to be in the order of 10−16 N, which was close to the capillary force that originated from the difference of capillary pressure between the inner and outer side of a particle pair [11]. Kang et al. [12] investigated on various surfaces oxide particles such as spinel, calcium aluminate and SiO2-based particles in 0.4 wt % C steel including 1 wt % Si and 5.3 wt % Cr by in situ observation with a CSLM. It was indicated by Kang et al. that although attractive behavior between pure-alumina particles could be observed, capillary forces between the other particles were too weak to be detected. Aneziris et al. [13,14] and Schröder et al. [15] have also conducted in situ investigation on agglomeration behaviors between various surface particles in stainless steel by putting Al2O3, spinel and MgO particles on top of steel samples in a CSLM. Although Al2O3 showed strong attraction forces [13], MgO showed a much weaker attraction force [15], and in the case of spinel there were no agglomerations [14]. To the authors’ best knowledge, there are no studies focusing on in situ observation of the agglomeration behavior of sulfide particles, which have significant importance in production of high-carbon steel. Hence, in this study, an in situ observations of surface agglomerates has been conducted using a CSLM, aiming to provide new information about behaviour of non-Al2O3 surface agglomerates in high-carbon steel.

2. Experimental Procedure

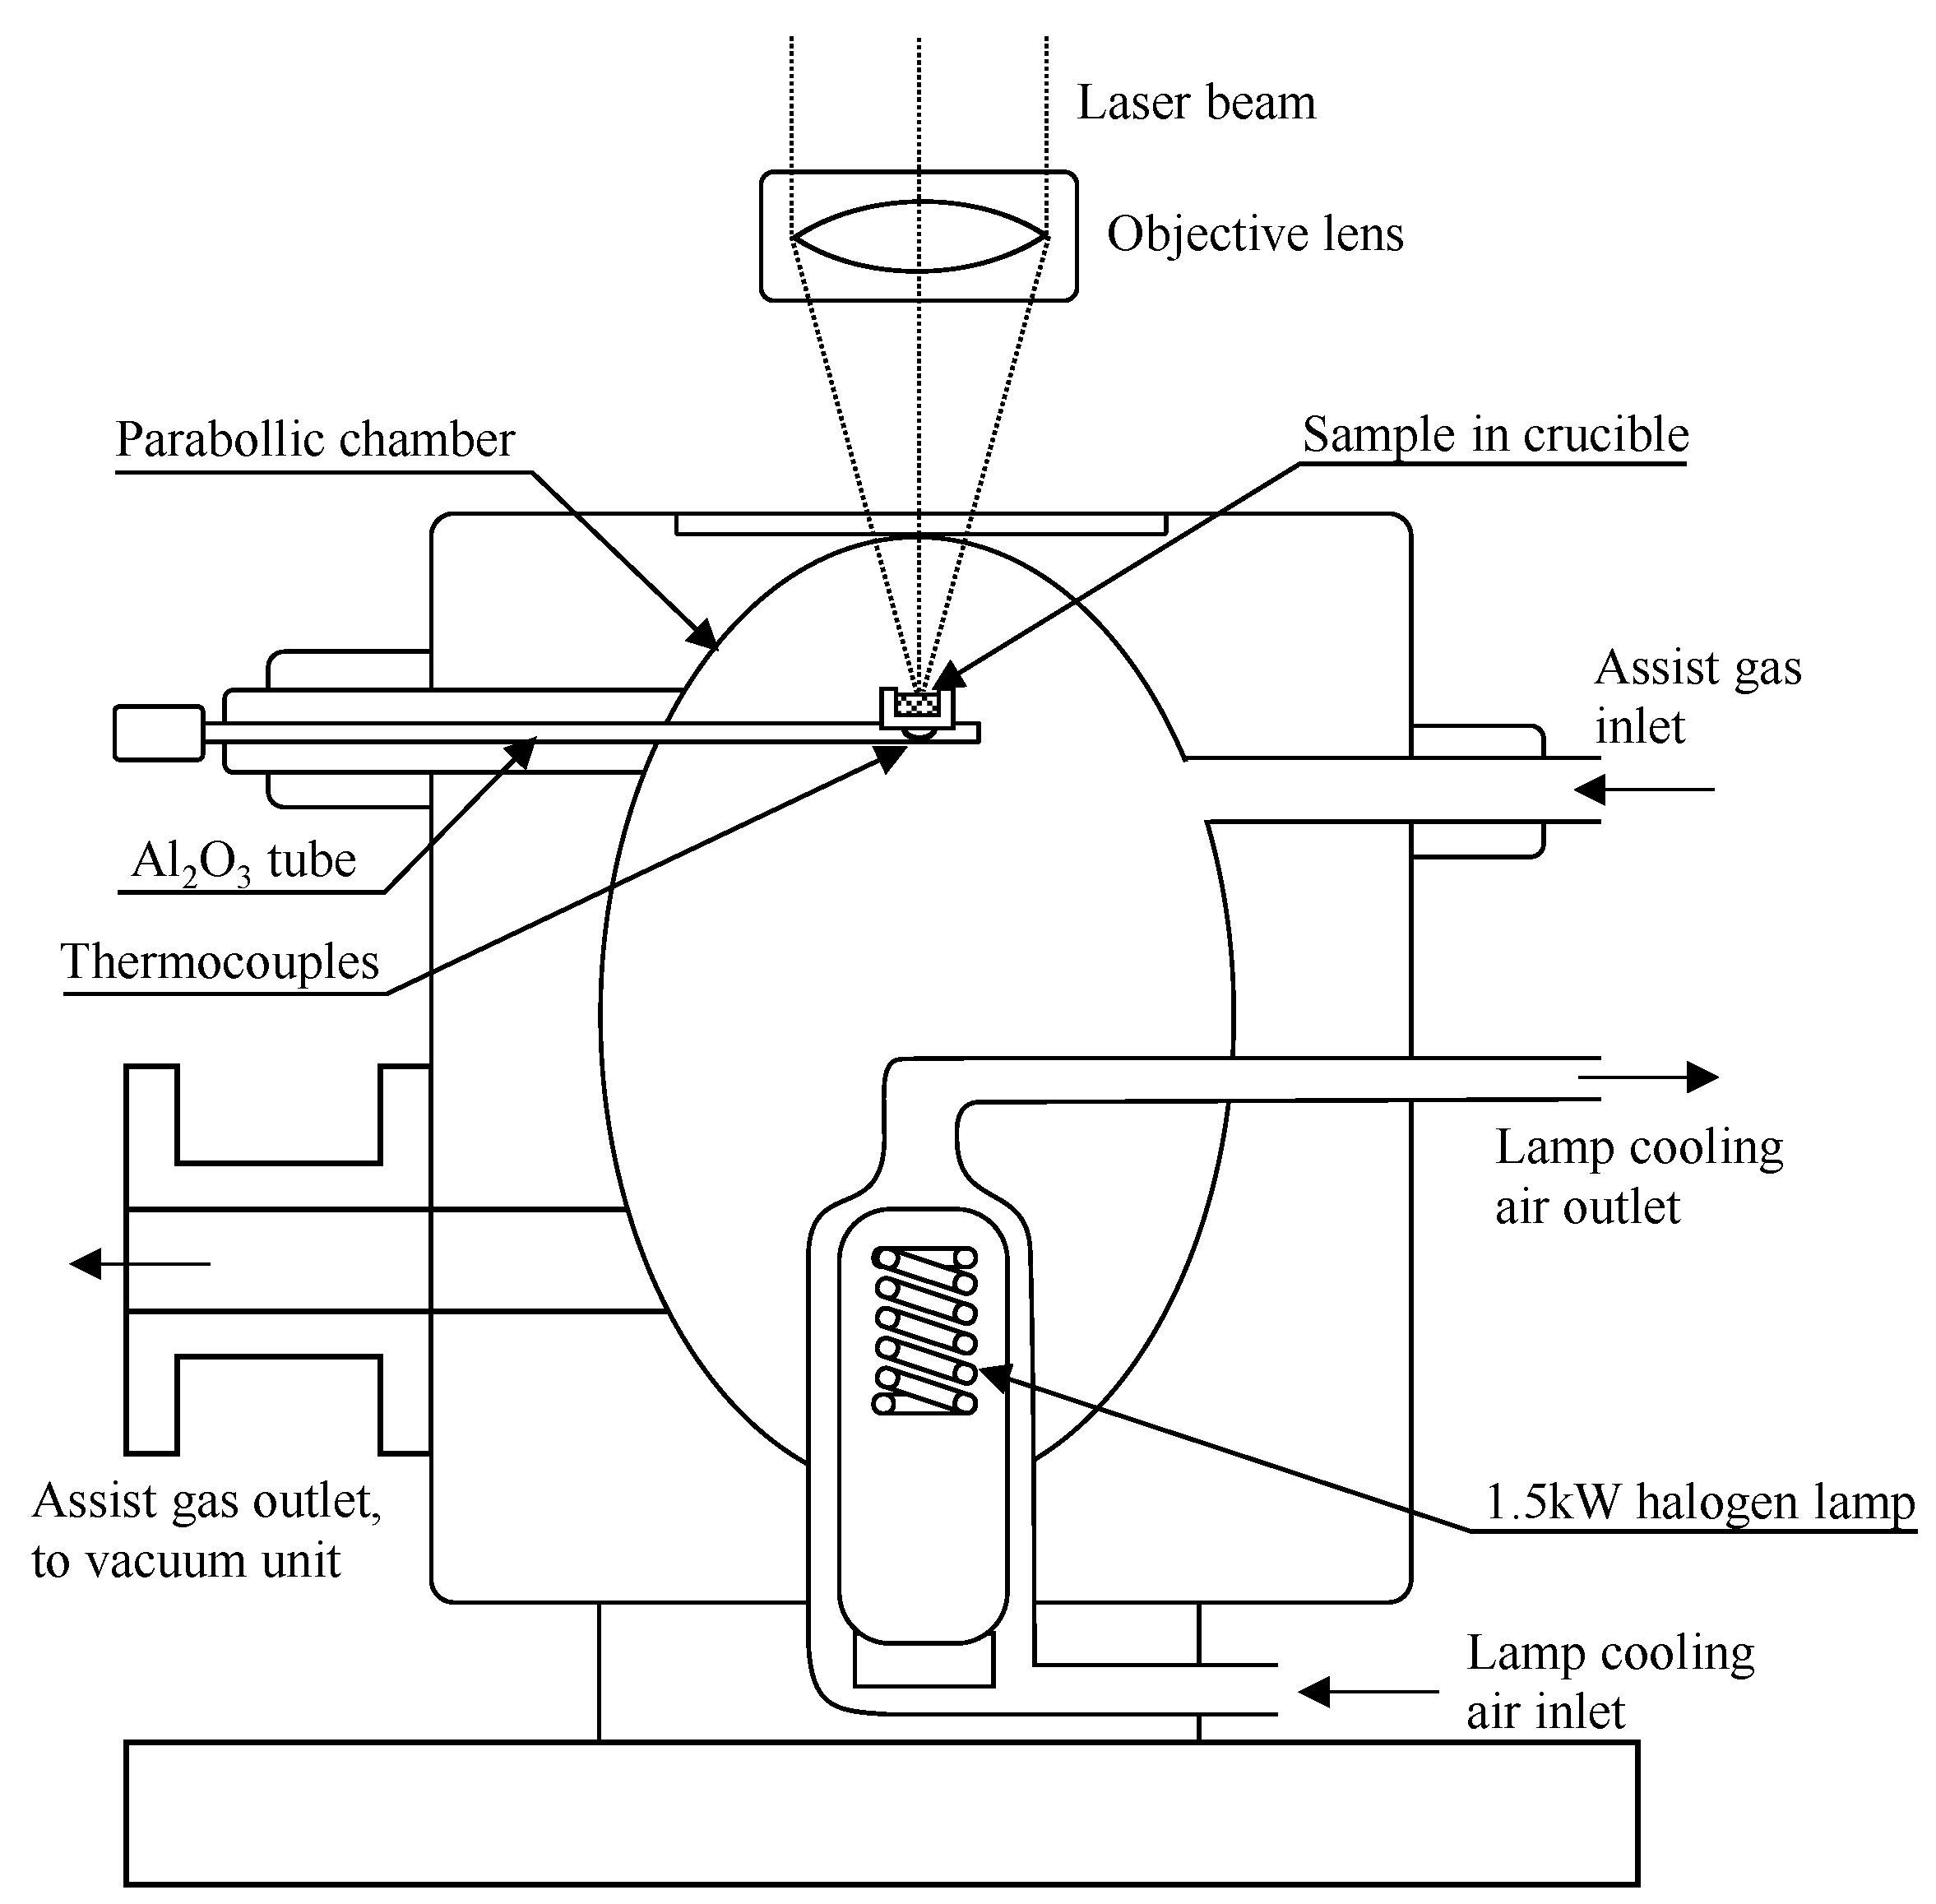
2.1. Equipment for In Situ Observation

In situ observations were performed by an IR furnace SVF17-SP from the Yonekura Corporation (Kanagawa, Japan), combined with laser microscopy with CSLM VL2000DX from the Lasertec Corporation (Yokohama, Japan), illustrated in Figure 1. The heat source, infrared rays, is radiated from halogen lamp which is located at the bottom focal point in a gold-coated elliptic chamber. The sample is positioned at the top focal point in the ellipsoidal mirror. For efficient control of the temperature, the sample sits above the thermocouple. A laser beam with 408 nm wavelength, which is lower than the thermal radiation spectrum emitted from the sample, was used for capturing images of the liquid surface with 30 times per second frame rate and 1024 × 1024 pixel resolution. At the beginning of the experiment, the chamber was evacuated by an oil-sealed rotary pump for more than three minutes and filled with high-purity argon gas which contained less than 3.0 ppm H2O and 2.0 ppm O2. Then, the argon pressure in the chamber was kept at approximately 7 kPa higher than the outer atmospheric pressure for more than three minutes. These purging procedures were repeated for four times per experiment to make the chamber oxygen free. During heating, the argon gas was continuously flowing, and the chamber pressure was kept approximately 7 kPa higher than the atmospheric pressure. To avoid the sample’s oxidation at high temperature, oxygen and H2O in the argon gas were further removed from the flowing argon by a clean column and purifier which reduced the H2O and O2 content to less than 1.0 ppm.

2.2. Materials and Heating Pattern

Table 1 shows the chemical compositions of high-carbon steels measured with spark emission spectrometry. Both grades of steel are Si-killed, which include Mn, S and approximately 10 ppm of Ca, which was added as CaSi wire in a secondary refining process. The sample was cut out and grinded to fit in a MgO crucible with 8.0 mm inner diameter and 3.5 mm depth.
In 60C steel, the sample was heated to 1400 °C at a heating rate of 200 °C/min and followed by heating to 1510 °C at 60 °C/min where the solid and liquid phase coexist on the surface; in the final stage it was heated to 1540 °C at a 30 °C/min heating rate where the whole steel phase melts down. In 95C steel, samples were heated to 1360 °C at a 200 °C heating rate and then at 60 °C/min to 1485 °C, followed by heating to 1515 °C at 30 °C/min. Heating profiles were designed to avoid overheating the sample surface and achieve uniform temperature for uniform melting. After keeping the samples at the final temperatures for less than 5 min in the furnace, samples were quenched with purified helium gas which has higher thermal conductivity.

3. Results and Discussion

3.1. Chemical Compositions

On the surface of remelted 60C and 95C steel, many agglomerates which consist of a round-shaped oxide phase and surrounding sulfide particles, were identified. No single oxide or single sulfide particle was found because of agglomeration of the particles in the liquid steel or during solidification. Table 2 and Table 3 summarize the average compositions of the oxide and sulfide phases identified on the surface of the steels, derived by scanning electron microscipy—energy-dispersive X-ray spectroscopy (SEM-EDS) analysis. Table 2 also presents the liquid fractions of each oxide phase calculated from average compositions by using FactSage 7.0 with FToxid databases, indicating that most of the oxide particles are in a semi-solid stage. Figure 2 shows representative morphologies of these agglomerates on the surface of 60C and 95C steel quenched after five minutes’ remelting in the MgO crucible, observed by SEM-EDS (Hitachi S-3400N SEM, Kantō, Japan, Bruker XFlash SDD-EDS, Billerica, MA, USA) at beam energy of 20 kV. In the EDS mapping image in Figure 2b,d, the Si-detected and S-detected area indicate oxide and sulfide phases, respectively. It can be observed from Figure 2 that in both 60C and 95C steel, the oxide phases are surrounded by relatively small sulfide phases, which was caused by the surface agglomeration phenomenon. Even though the average liquid fraction of the oxide phase in 95C steel is low (5.7%) as presented in Table 2, the shape of surface oxide particle is round as shown in Figure 2. It should be noted here that %Mg enhancement in the oxide phase from the MgO crucible was not identified in any experimental condition.

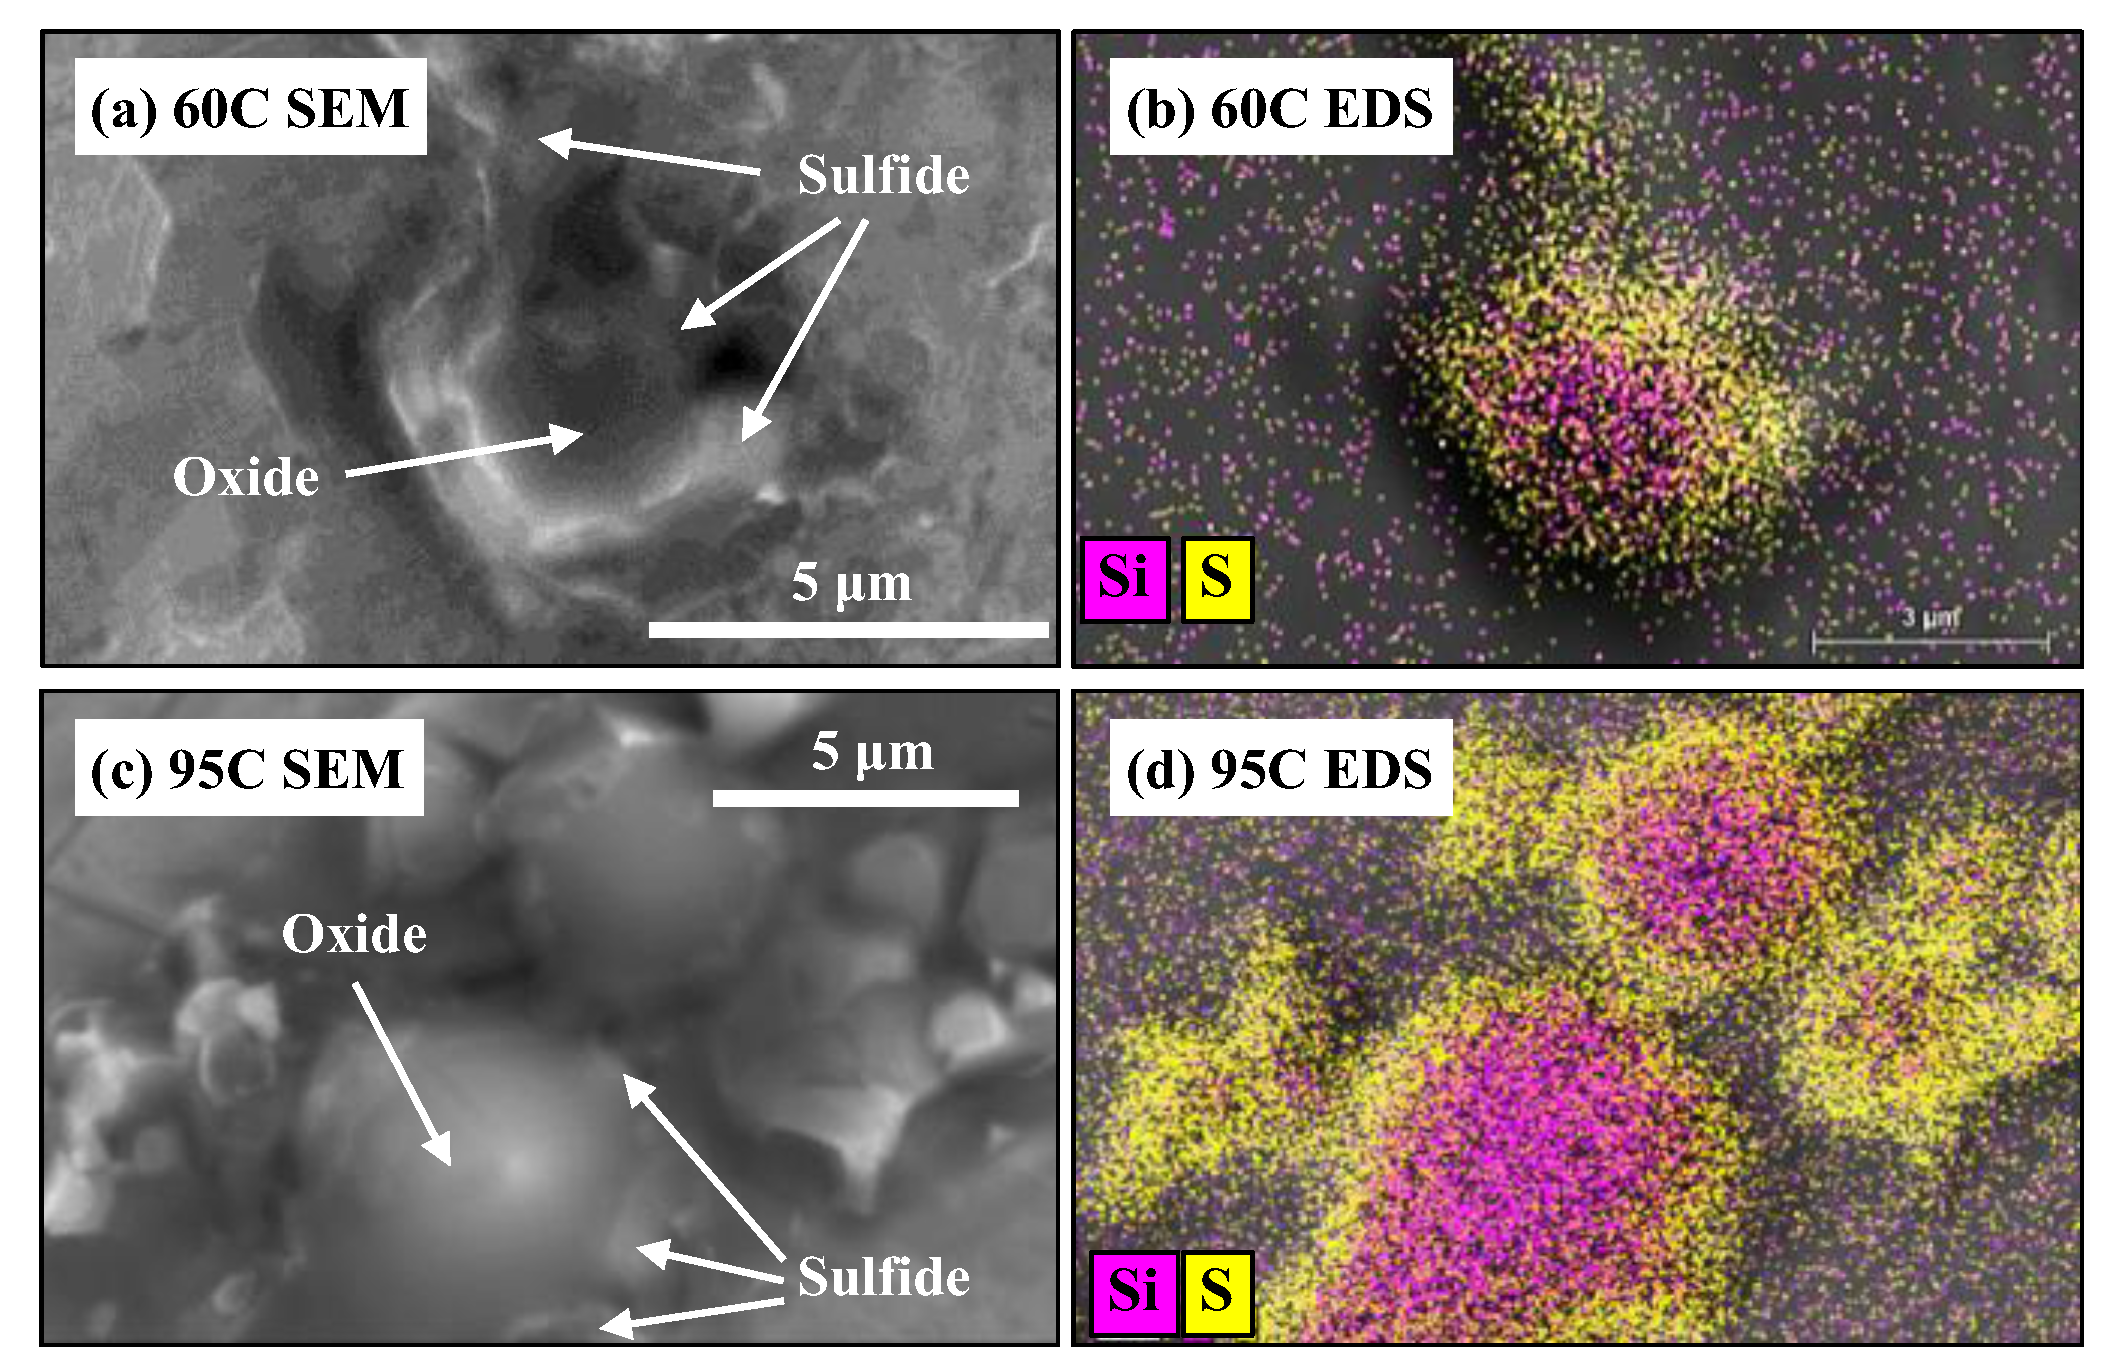
3.2. Morphologies in Confocal Scanning Laser Microscope (CSLM)

The morphologies of surface agglomerates have been investigated using in situ observation in CSLM which has been summarized in Table 4. Table 4 shows the typical morphology of oxide, sulfide and agglomerated particles on liquid 60C and 95C steel in the CSLM. As shown in these images, while the oxide phases appear to be spherical and bigger than 5 μm diameter, the sulfide phases are polygonal and relatively smaller (<3 μm). The morphologies of the agglomerates, illustrated in the bottom line in Table 4, are exactly same as in the SEM-EDS analysis in Figure 2. The spherical shape of oxide particles indicates the liquid percentage in these particles, as reported in Table 2.

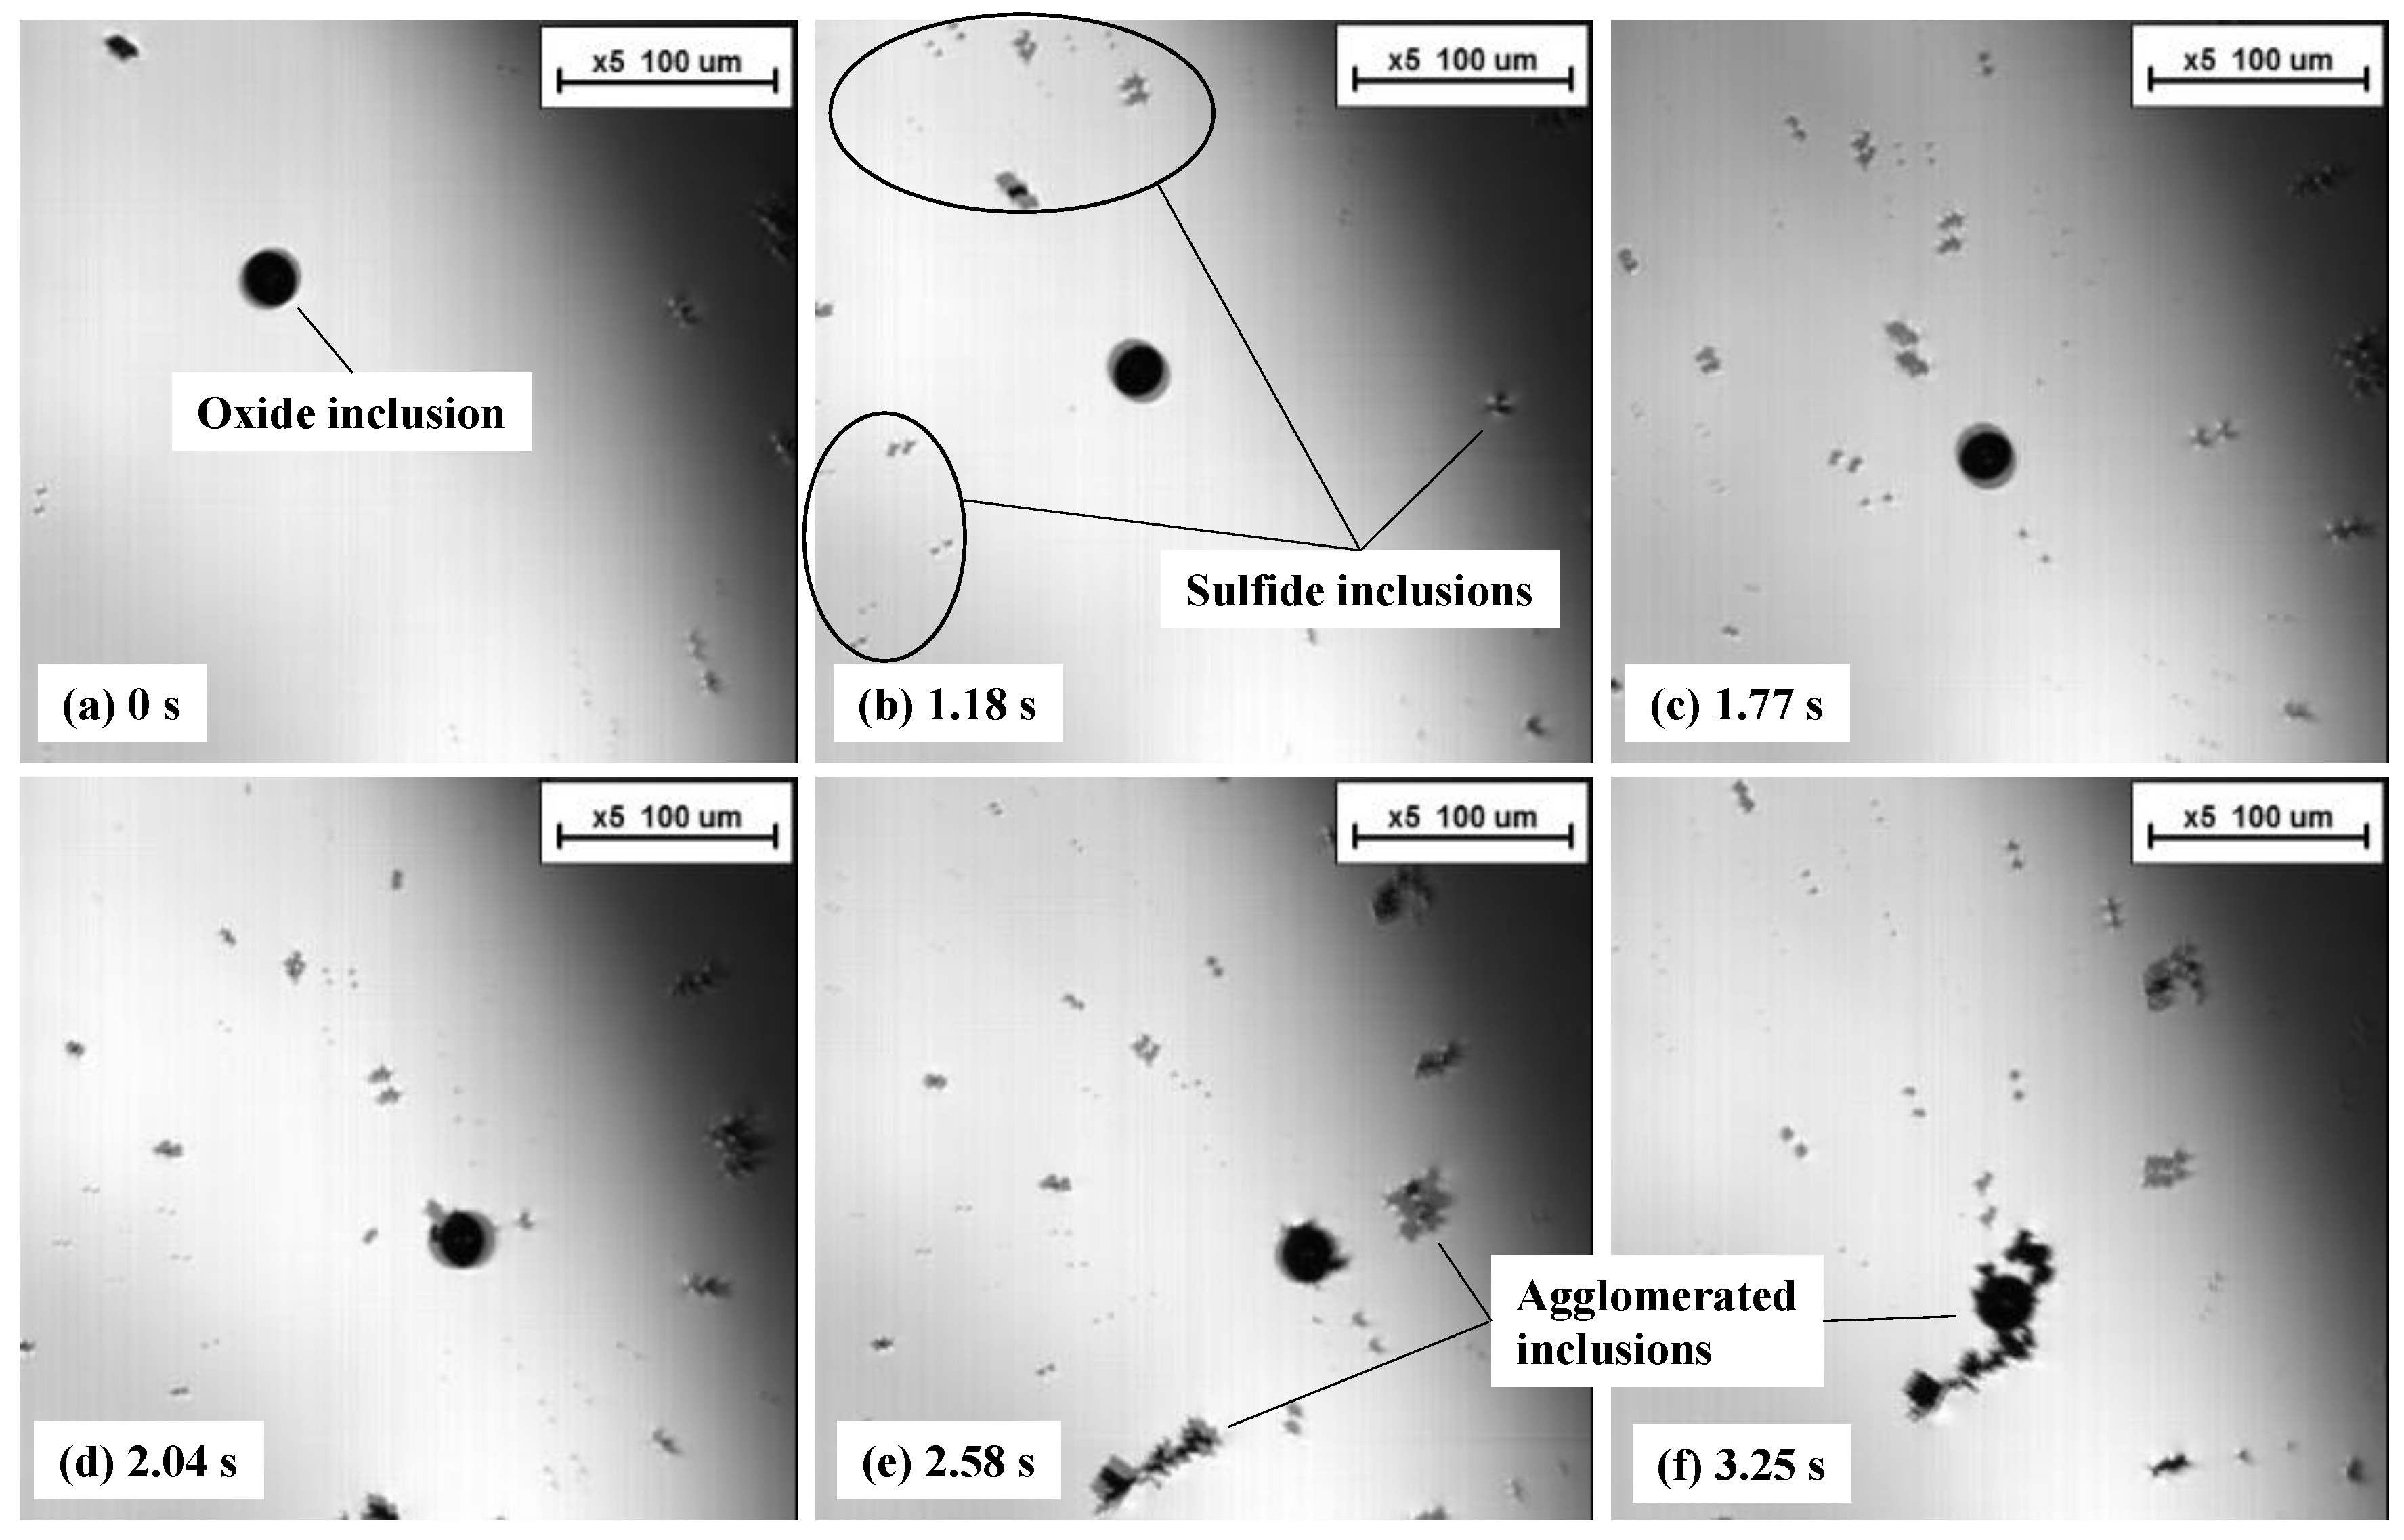
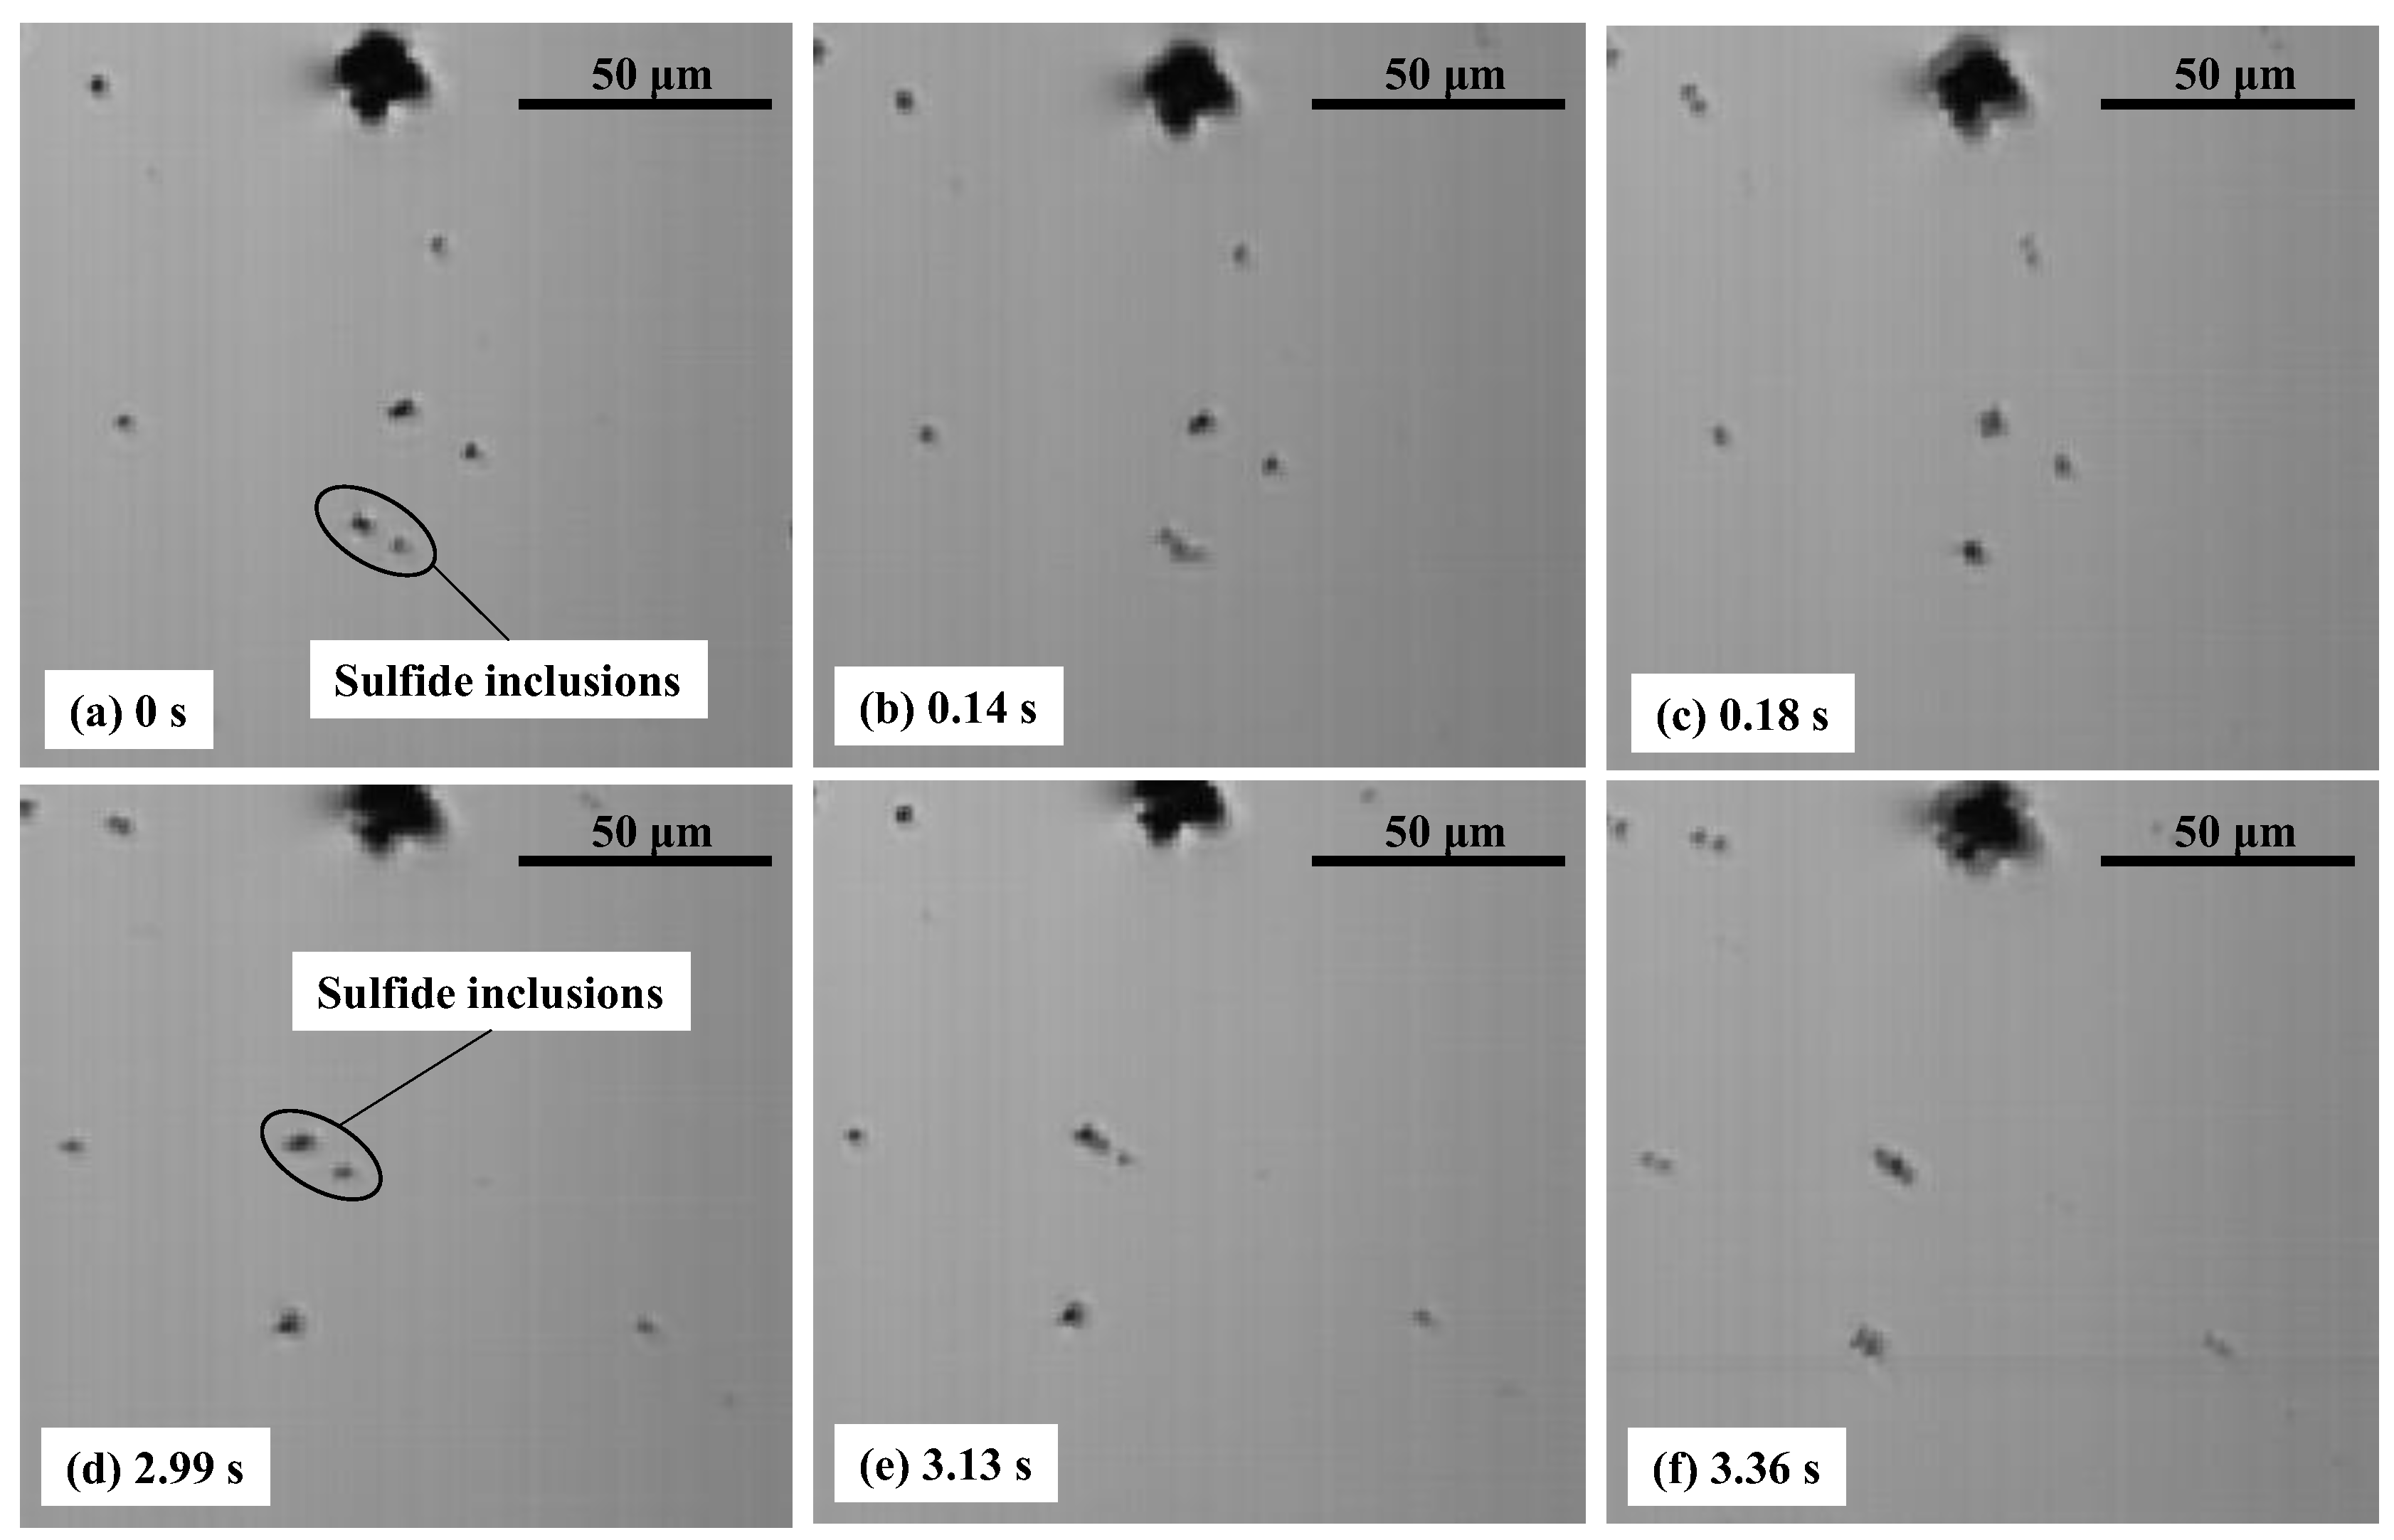
3.3. Agglomeratrion Behaviors

The agglomeration behaviors of oxide and sulfide surface particles are presented in Figure 3. As shown in Figure 3a, one spherical oxide particle can be identified, which has floated up when the steel fully melted. In Figure 3b,c, the oxide particle moves with the natural flow of liquid steel and, at the same time, some sulfide particles are strongly attracted to the oxide. Subsequently, sulfide particles start to collide with the oxide particle in Figure 3d. From Figure 3e,f, not only sulfide particles but also agglomerated particles are observed being pulled toward the spherical oxide particle. In this strong agglomeration phenomenon, while several particles came from a relatively distant area more than 100 μm from the collision position, the spherical surface oxide particle has limited movability. Therefore, it can be summarized that the round oxide has a considerably strong attraction force.
A previous study by Yin et al. [10] reported that there is no attraction force between full-liquid particles on the liquid steel surface, and attraction forces are effective between semi-liquid particles. Also, a study by Kang et al. [12] proposed that due to the rise of liquid steel around the surface liquid particle because of surface tension, there is no attraction force between full-liquid particles. The rise of the liquid level is caused by high wettability between the liquid oxide and steel, which means the contact angle is lower than 90°. Therefore, the spherical oxide particle in Figure 3 is expected to be a semi-liquid particle because the attraction force was identified from in situ investigation in CSLM. This is consistent with the calculated liquid fraction presented in Table 2, where liquid fractions of the oxide particles are less than 100%.
Step-by-step agglomeration phenomena among surface sulfide particles is demonstrated in Figure 4. As illustrated in Figure 4a, there is a pair of sulfide particles indicated by a circle. From Figure 4b,c, the surfaced particle pair is attracted toward each other and agglomerated. Subsequently, another pair of sulfide particles also agglomerated in Figure 4d–f. As shown in Figure 4, the distance between the agglomerates when agglomeration starts is approximately 10 μm, which is much shorter than the agglomeration distance in Figure 3.
Due to the limited number of oxide particles in the steels studied, the agglomeration behavior between two oxide particles has not been investigated. Also, the semi-liquid oxide particle is likely to be instantly surrounded by sulfide particles when it emerges on the surface because of the number of sulfide particles. Agglomeration between oxide/oxide could occur only when two oxide particles simultaneously emerge at surface close to each other.

3.4. Measurement of Attraction Force and Acting Length from CSLM Video File

To estimate the attraction force F between the surface particles, it is necessary to measure acceleration a from a CSLM video file. An example of the transition of the surface agglomerate’s location is presented in Figure 5. As shown in this graph, before the attraction force F starts working on the surface particle, it floats along the natural flow of liquid steel. This natural flow can be recognized clearly and visually in the CSLM video, because not only one particle but also a group of particles follow the same direction. Once a surface particle comes close to another one and starts being attracted toward it, the particle goes out of the flow and its velocity starts increasing gradually. This distance between particles when the particles start deviating toward each other is called the acting length (L). By considering the trajectory as a quadratic curve, a quadratic equation can be derived as presented in Figure 5a,b.
Attraction force F (N) and acceleration a (m/s2) can be estimated by following the equations:
a = ( d 2 x d t 2 ) 2 + ( d 2 y d t 2 ) 2
F = m a
where m is mass of the surface particle (kg). In this estimation, acceleration a, of the attracted particle is regarded as constant throughout the agglomerating behavior even though the host particle also moves during agglomeration. Additionally, frictional resistance on the liquid surface is ignored. It should be noted that these calculations can be considered to be an estimation of attraction force.

3.5. Type of Attraction Force

There are several types of attraction forces between non-metallic inclusions. Figure 6 summarized three types of attraction force the Van der Waals force, the force due to the gas cavity and the capillary force, which have been estimated by Zheng et al. [4]. The measured attraction force at the molten steel surface is calculated by Equation (2) and also plotted in this graph. While the Van der Waals force and the force due to the gas cavity are effective when two particles are very close, less than single micrometers, the capillary force can be effective at a longer distance, around 100 μm. As shown in Figure 6, current data in this study are located near the capillary force; therefore, it can be implied that attraction force identified in the current study is a capillary force. Furthermore, it has been already revealed by Yin et al. [9,10] that the dominant attraction force between particles on a liquid steel surface is the capillary force.

3.6. Comparison with Other Materials

Figure 7 shows estimated attraction force F and acting length L between non-metallic surface particles observed on 60C and 95C liquid surfaces in the CSLM in situ experiment. In Figure 7a,b, F working on the smaller guest particle (particle 1) is measured and plotted against the larger host particle 2’s radius (R2). In Figure 7c, the relationship between F and L is presented. In each graph of Figure 7, the black dotted line shows the solid alumina pairs’ data derived by Shibata et al. in low carbon Al-killed steel [16]. The blue dotted line shows data of semi-liquid oxide pairs derived by Yin et al. in a high-carbon liquid steel (0.84%C) [10].
Figure 7a shows that a smaller size of either guest particle (R1) or host particle (R2) leads to weaker attraction force, F. This can be explained by considering the mechanism of the capillary force, where shallower depression between surface particles causes a weaker capillary force. In both 60C and 95C steels, sizes of guest sulfide particles are smaller than other studies as highlighted in the legend table in Figure 7, which can be the main reason why the attraction force, F, of 60C and 95C is weaker than the others. Also, by comparing current results with the results of the smallest R1 (<5 μm) of the Al2O3 particle derived by Shibata et al. [16], there are still slight gaps of the attraction force, F. The main reason could be the average size of the surface agglomerates and differences in wettability. Shibata’s data includes results of larger guest particles, more than 3 μm, but in this study the maximum size of the investigated sulfide particles is 3 μm. Alternatively, the gap between attraction forces, F, of this study and the previous study of the Al2O3 particle could also be caused by the difference in wettability. The wettability of different particles is a function of various parameters such as the surface tension of liquid steel and the roughness of the particle surface. Kawai et al. [17] mentioned that carbon concentration and the temperature of the liquid steel will affect its surface tension. Also, it was reported by Nakajima et al. [18] and Schröder et al. [13] that if the surface roughness of particles increases, its wettability will increase which leads to a stronger attraction force. However, at this moment further work is required to clarify which particle size, surface tension and roughness is most dominant on the attraction force gap between this study and Shibata’s data.
In terms of acting length, L, the sulfide/sulfide pair shows a similar acting length with Al2O3 but sulfide/oxide agglomerates show a higher acting length compare to other surface particles despite having a weaker attraction force, F. The reason could be related to drag resistance. A floating object on the surface of a liquid can accelerate toward another object when applied horizontal force exceeds the static friction force of the object. In this study, the sizes of the guest particles are smaller compared to other studies, hence static frictional forces are weaker and the required attraction force to accelerate toward another object is smaller. Therefore, sulfide guest particles in this study will start accelerating toward host particle from farther away.

3.7. Agglomeration Behavior Caused by Capillary Force

When surface agglomeration occurs between semi-liquid and solid surface particles, the solid particle is sometimes completely dissolved into the other semi-liquid particle instead of being physically attached to it. This phenomenon has already been identified among oxide surface particles by Yin et al. [10] and was also observed in sulfide/oxide agglomerates in this study. Figure 8 shows an example of growth of semi-liquid agglomerates in 95C, which was observed at 1495 °C during temperature being raised to the final value, 1515 °C. In these images, a chain-like agglomerate is hooked at the interface between solid/liquid steel. In Figure 8a, a lot of relatively small surface particles gathering at its tip can be observed. Subsequently, some of them are dissolved in the semi-liquid phase, as shown in image (b)–(d). Finally, the semi-liquid phase leads to bigger particles in image (e). This semi-liquid phase includes not only oxide but also sulfide particles; however, sulfide phases are considered to be dissolved in the liquid oxide phase. Therefore, semi-liquid oxide surface particles can become bigger and bigger.
As discussed above, bigger surface particles cause a stronger capillary force and smaller particles tend to be accelerated from farther away. It is highly important to note that the surface agglomeration phenomenon is much more likely to occur under the condition where large sized and small sized particles co-exist. Furthermore, as shown in Figure 9, the particle growth described above happens more frequently, which may lead to a stronger capillary force. This process can be repeated numerous times like a chain reaction. In summary, on the surface of high-carbon steel including solid sulfide and semi-liquid oxide particles, these find it easier to agglomerate than in other materials. In recent decades, a lot of manufacturing companies use Ar bubbling in a ladle in the secondary refining process. Agglomeration behavior at the interface between the stirring gas and liquid steel may significantly affect not only the performance of steel manufactures but also the capability for stable production by causing nozzle-clogging in the continuous casting process. Therefore, it will be very important to control the agglomeration behavior of high-carbon steel by conducting further research.

4. Conclusions

In this study, the agglomeration behavior of non-Al2O3 particles on the surface of liquid high-carbon steel has been investigated by re-melting specimens. The main findings include the following:
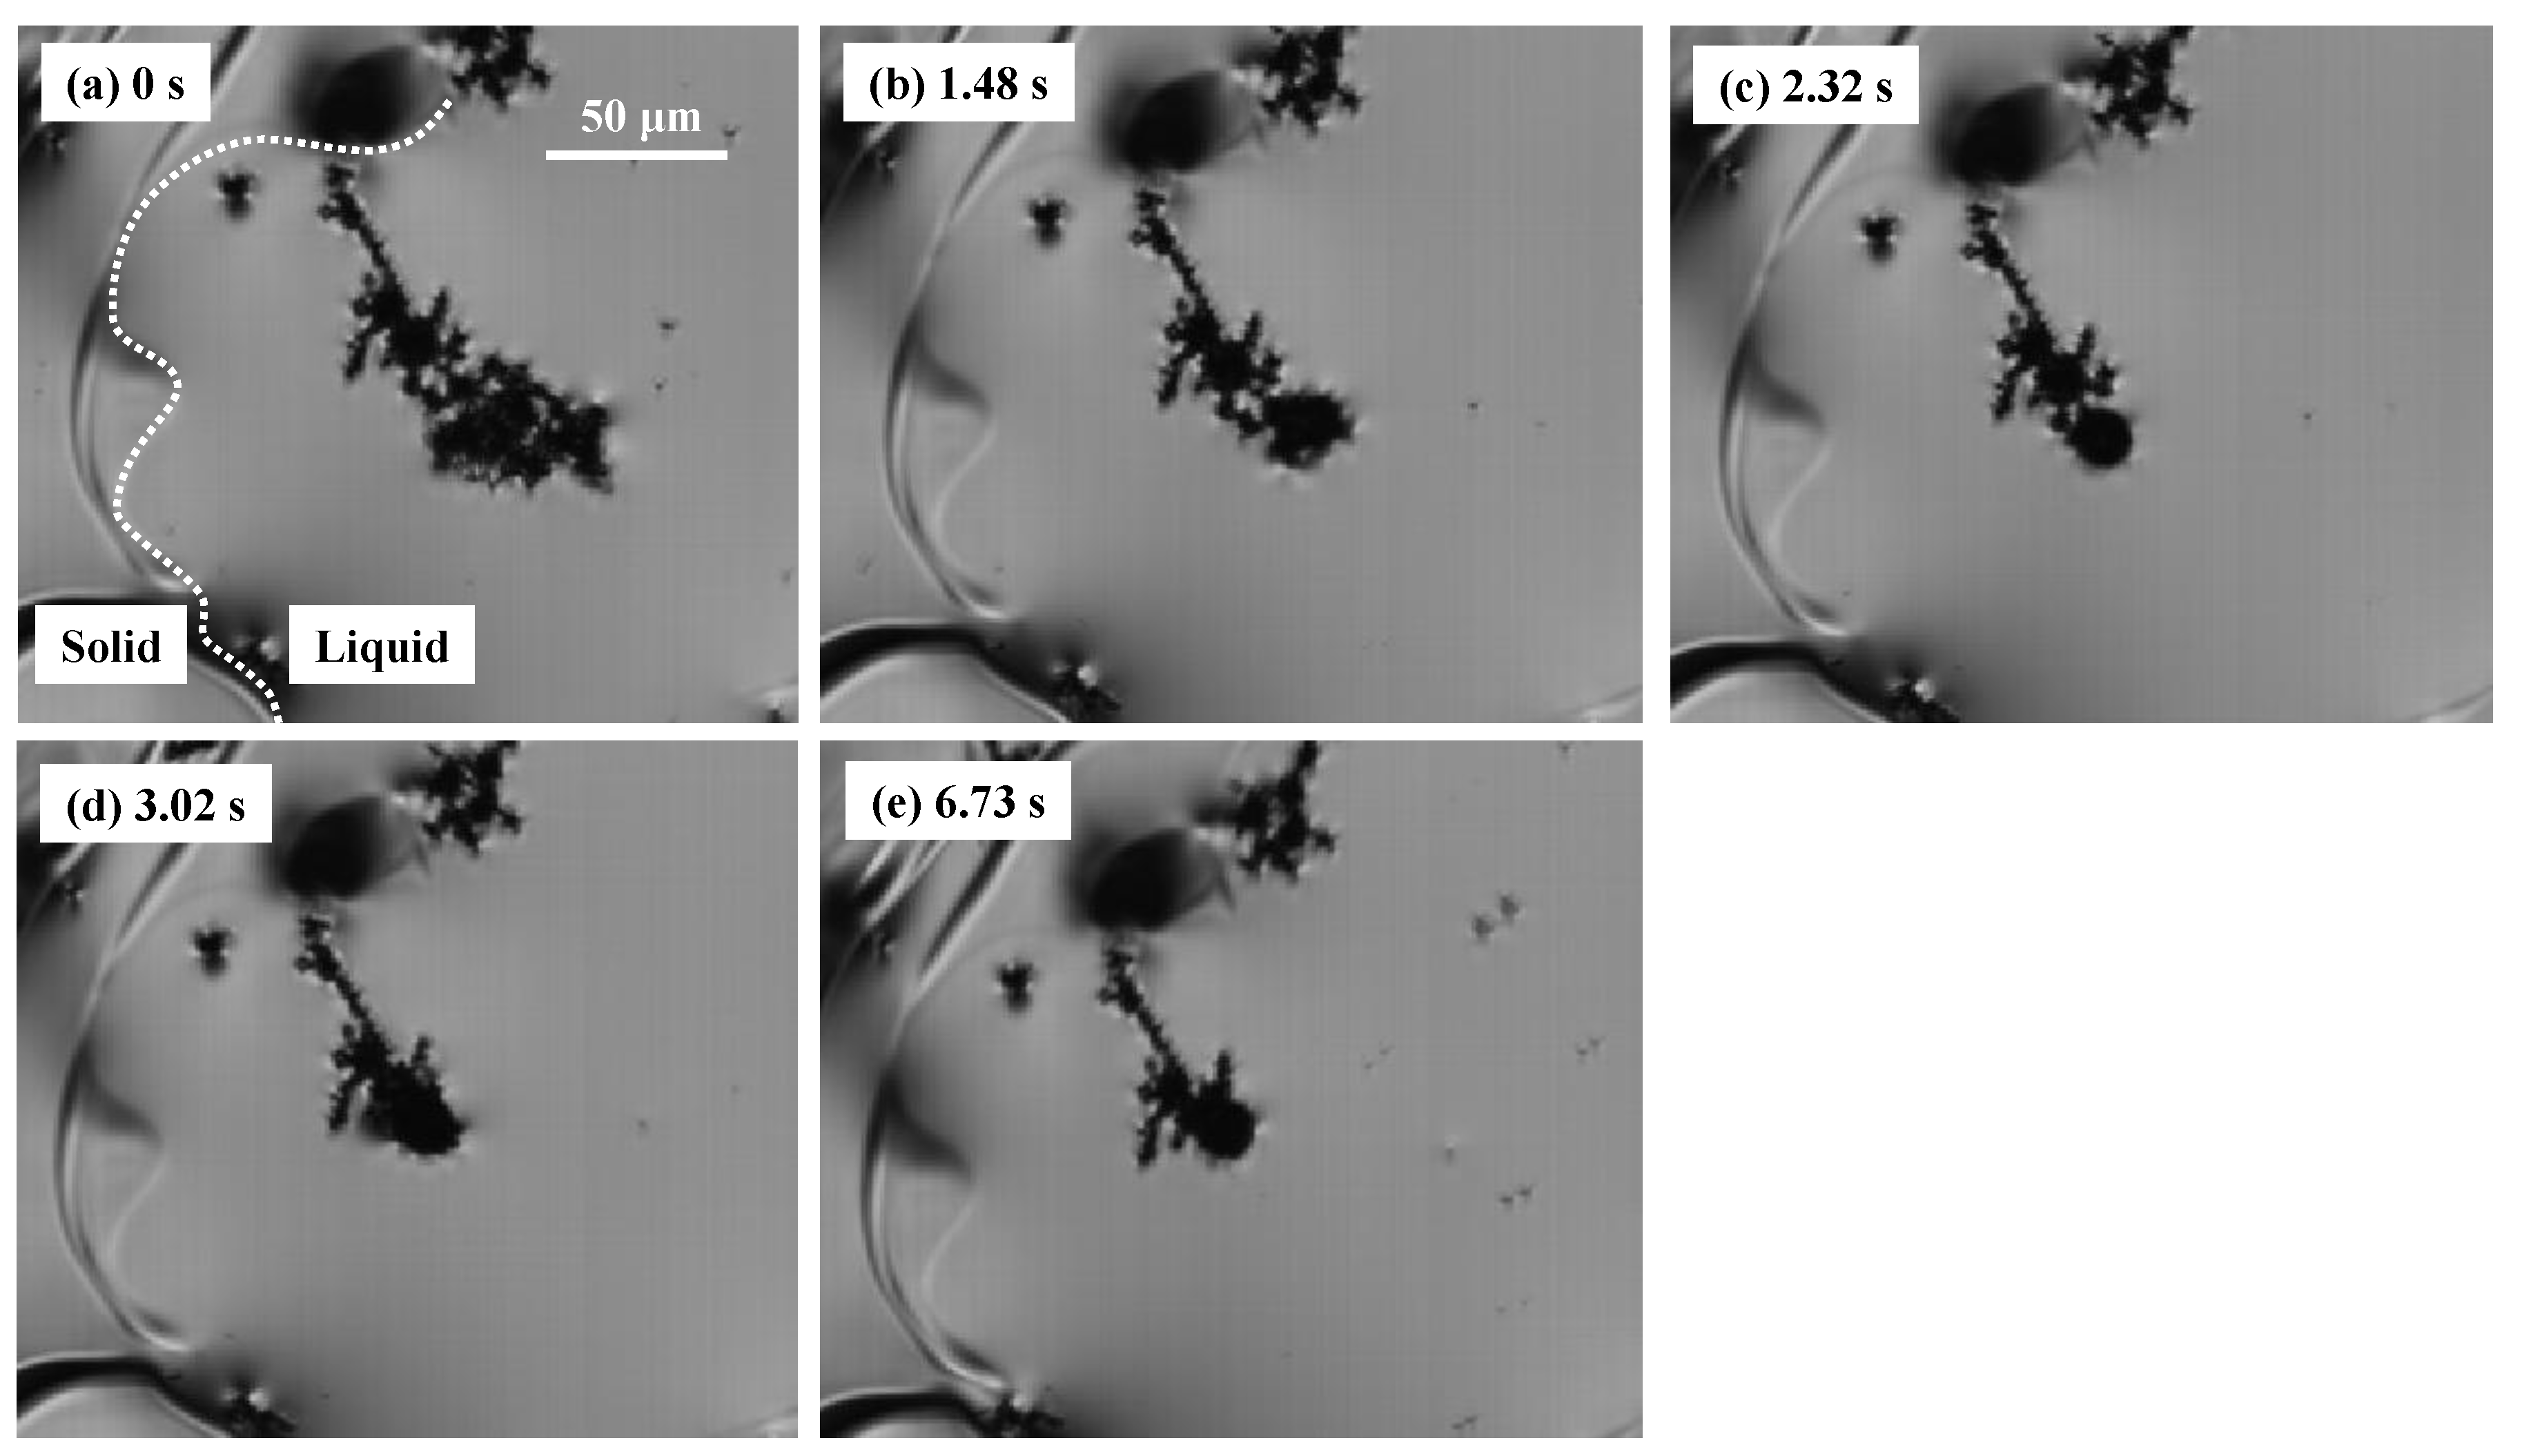
  • The agglomeration behaviors of sulfide/sulfide particle pairs and sulfide/semi-liquid oxide pairs on the surface of liquid high-carbon steels were observed in situ by using CSLM. Agglomerations between oxide/oxide pairs were not detected because they were surrounded by sulfide particles shortly after floating up to the surface.
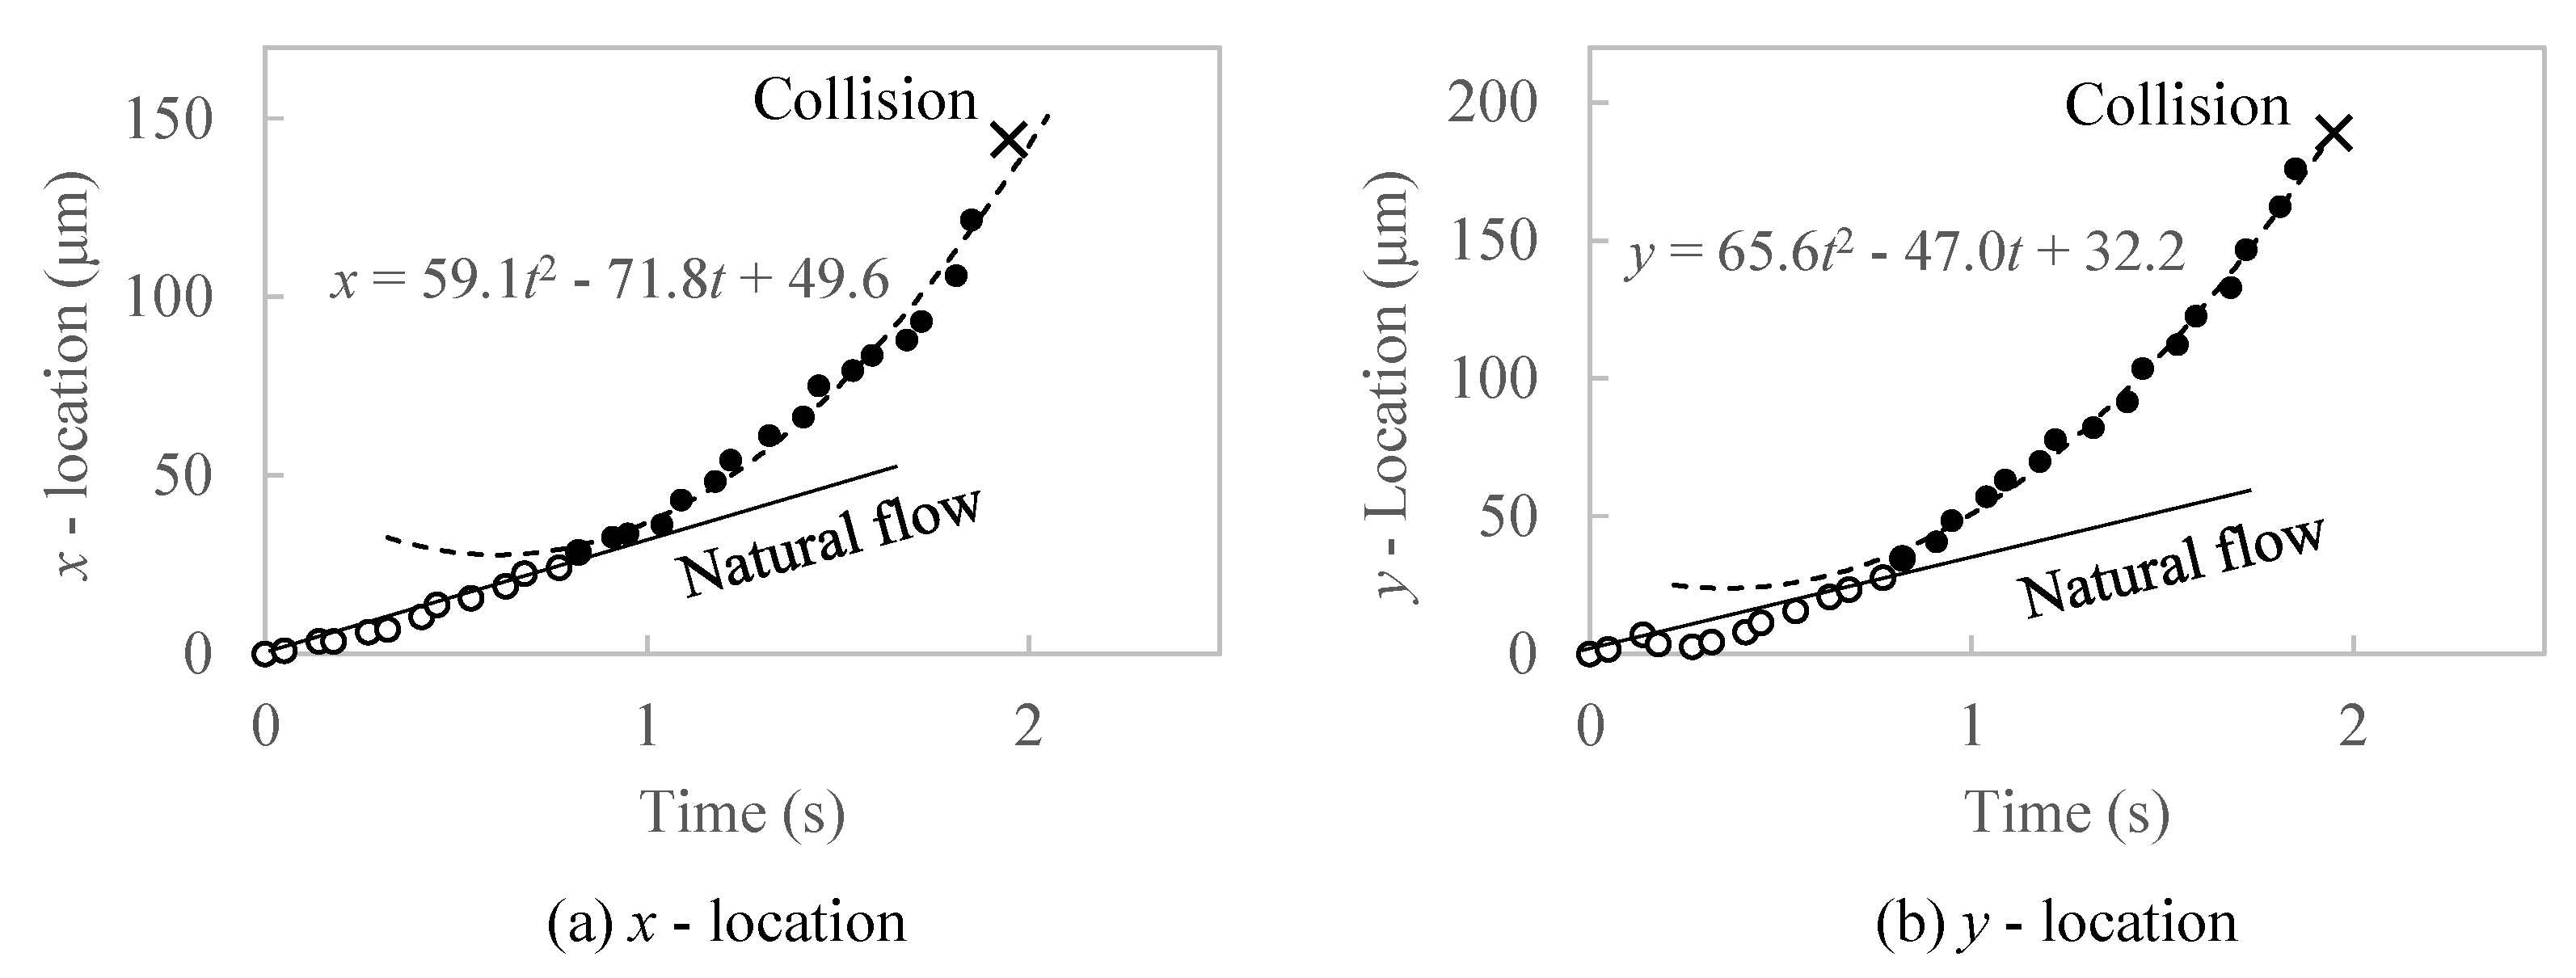
  • Attraction forces between the surface particles were calculated from acceleration, estimated by tracking the trajectories of each particle in CSLM video files. The acting length is defined as the distance between particles when they start to accelerate.
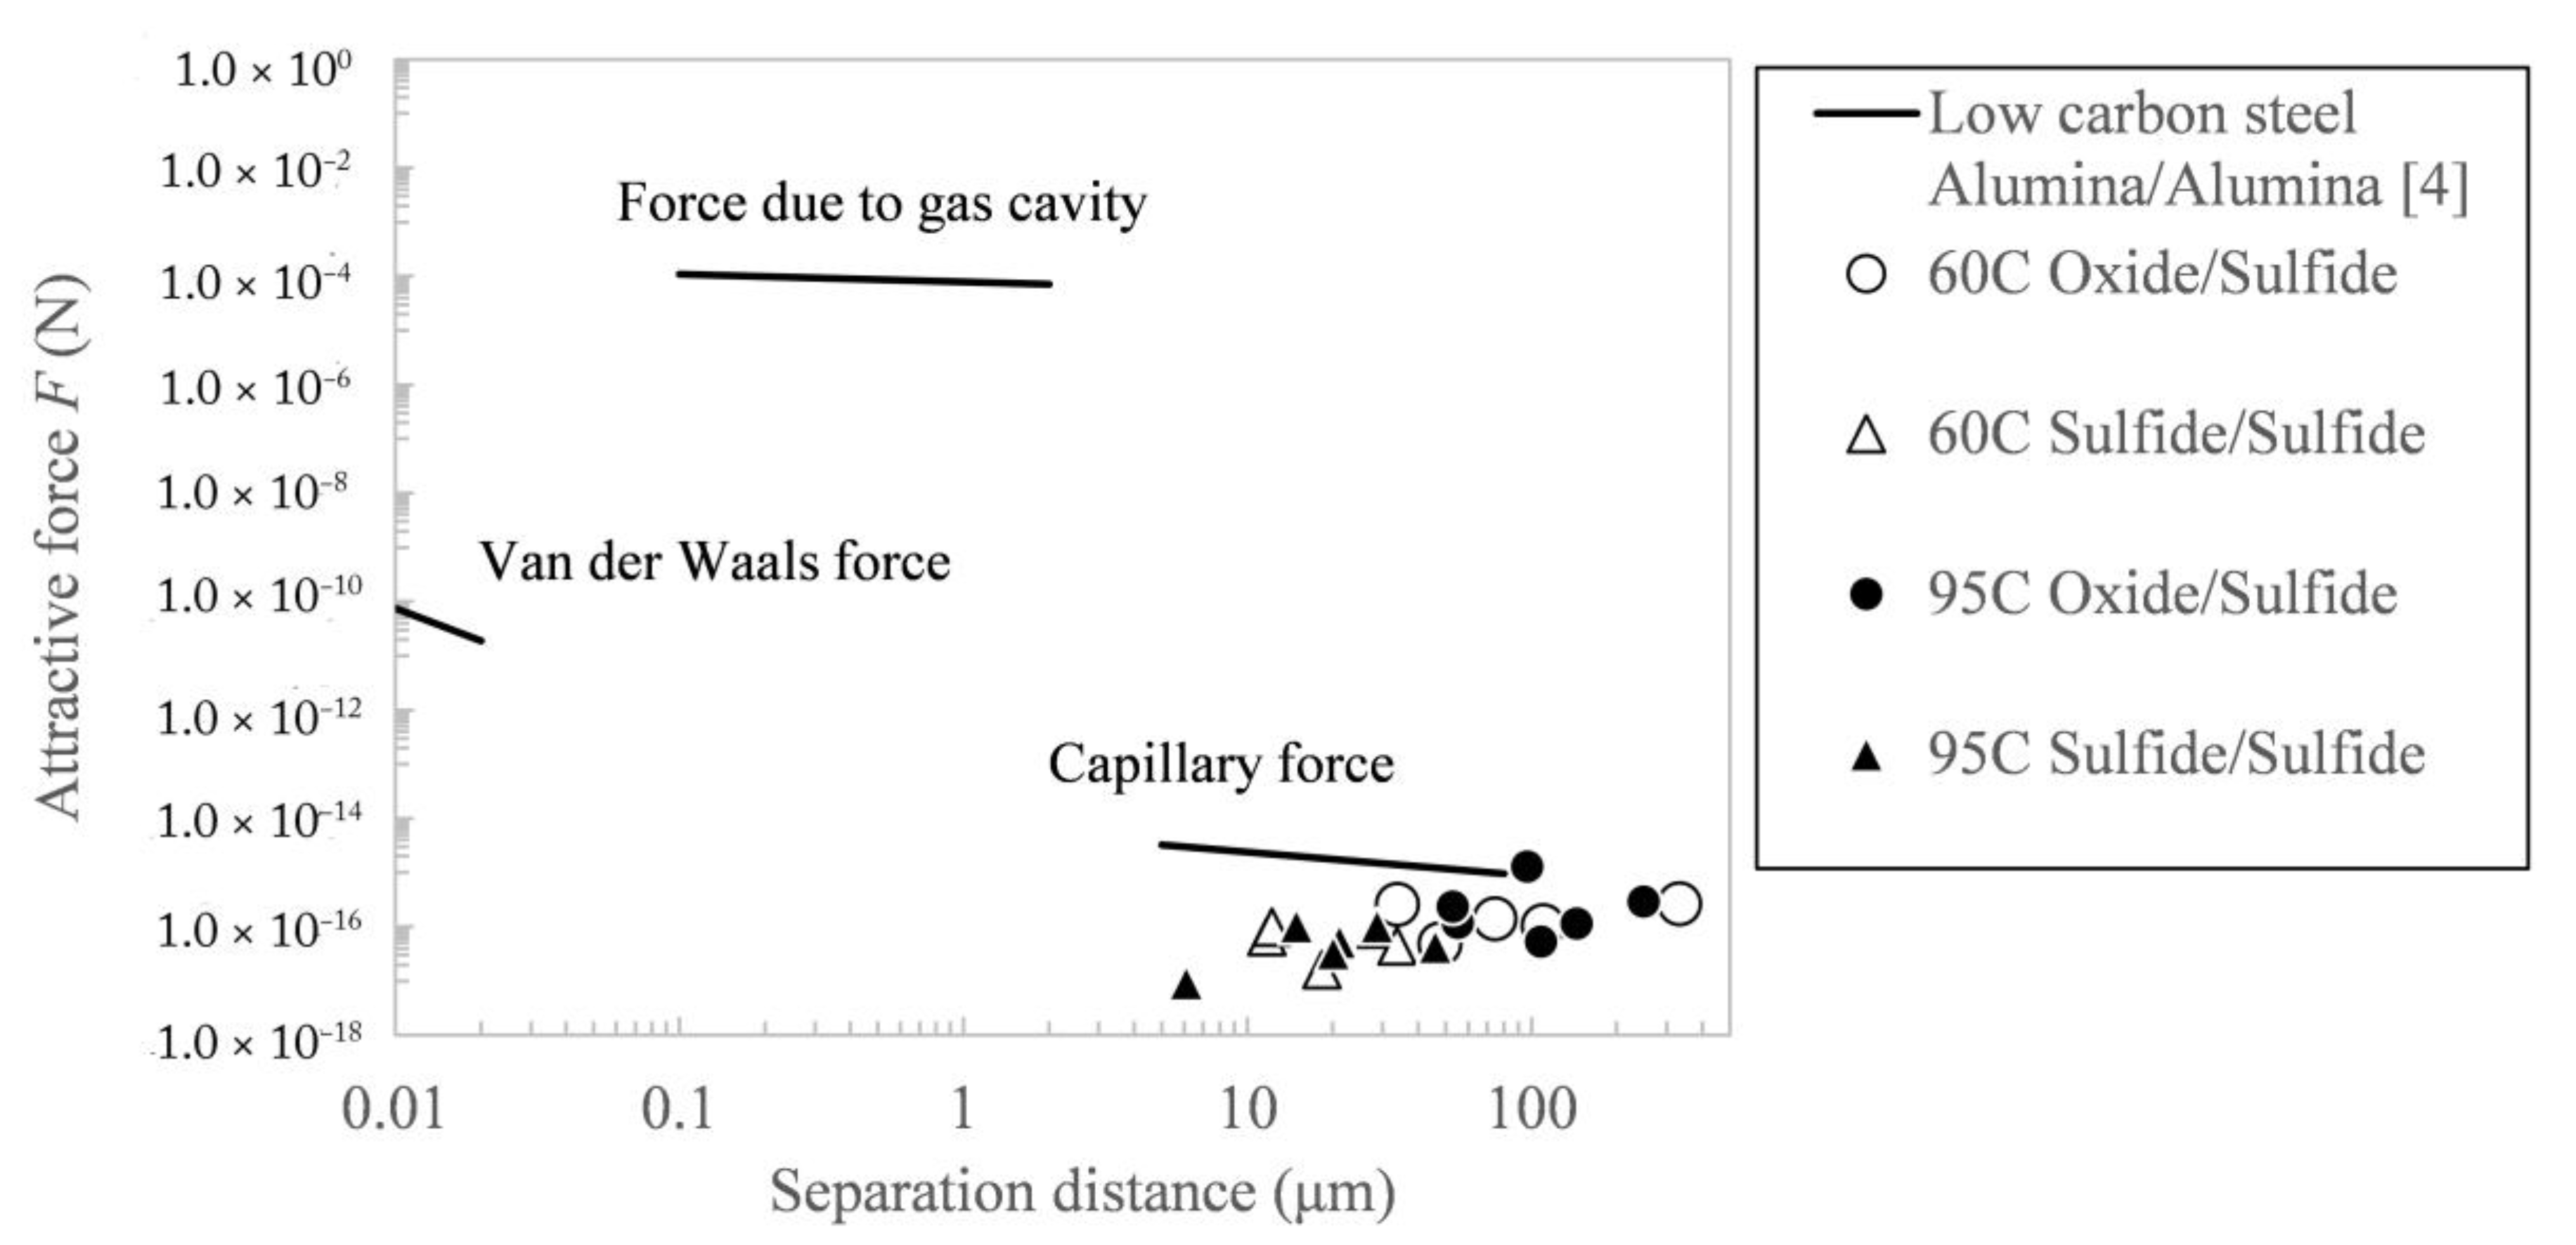
  • Estimated attraction forces and identified acting length are quite close to the values of the capillary phenomenon estimated in recent studies.
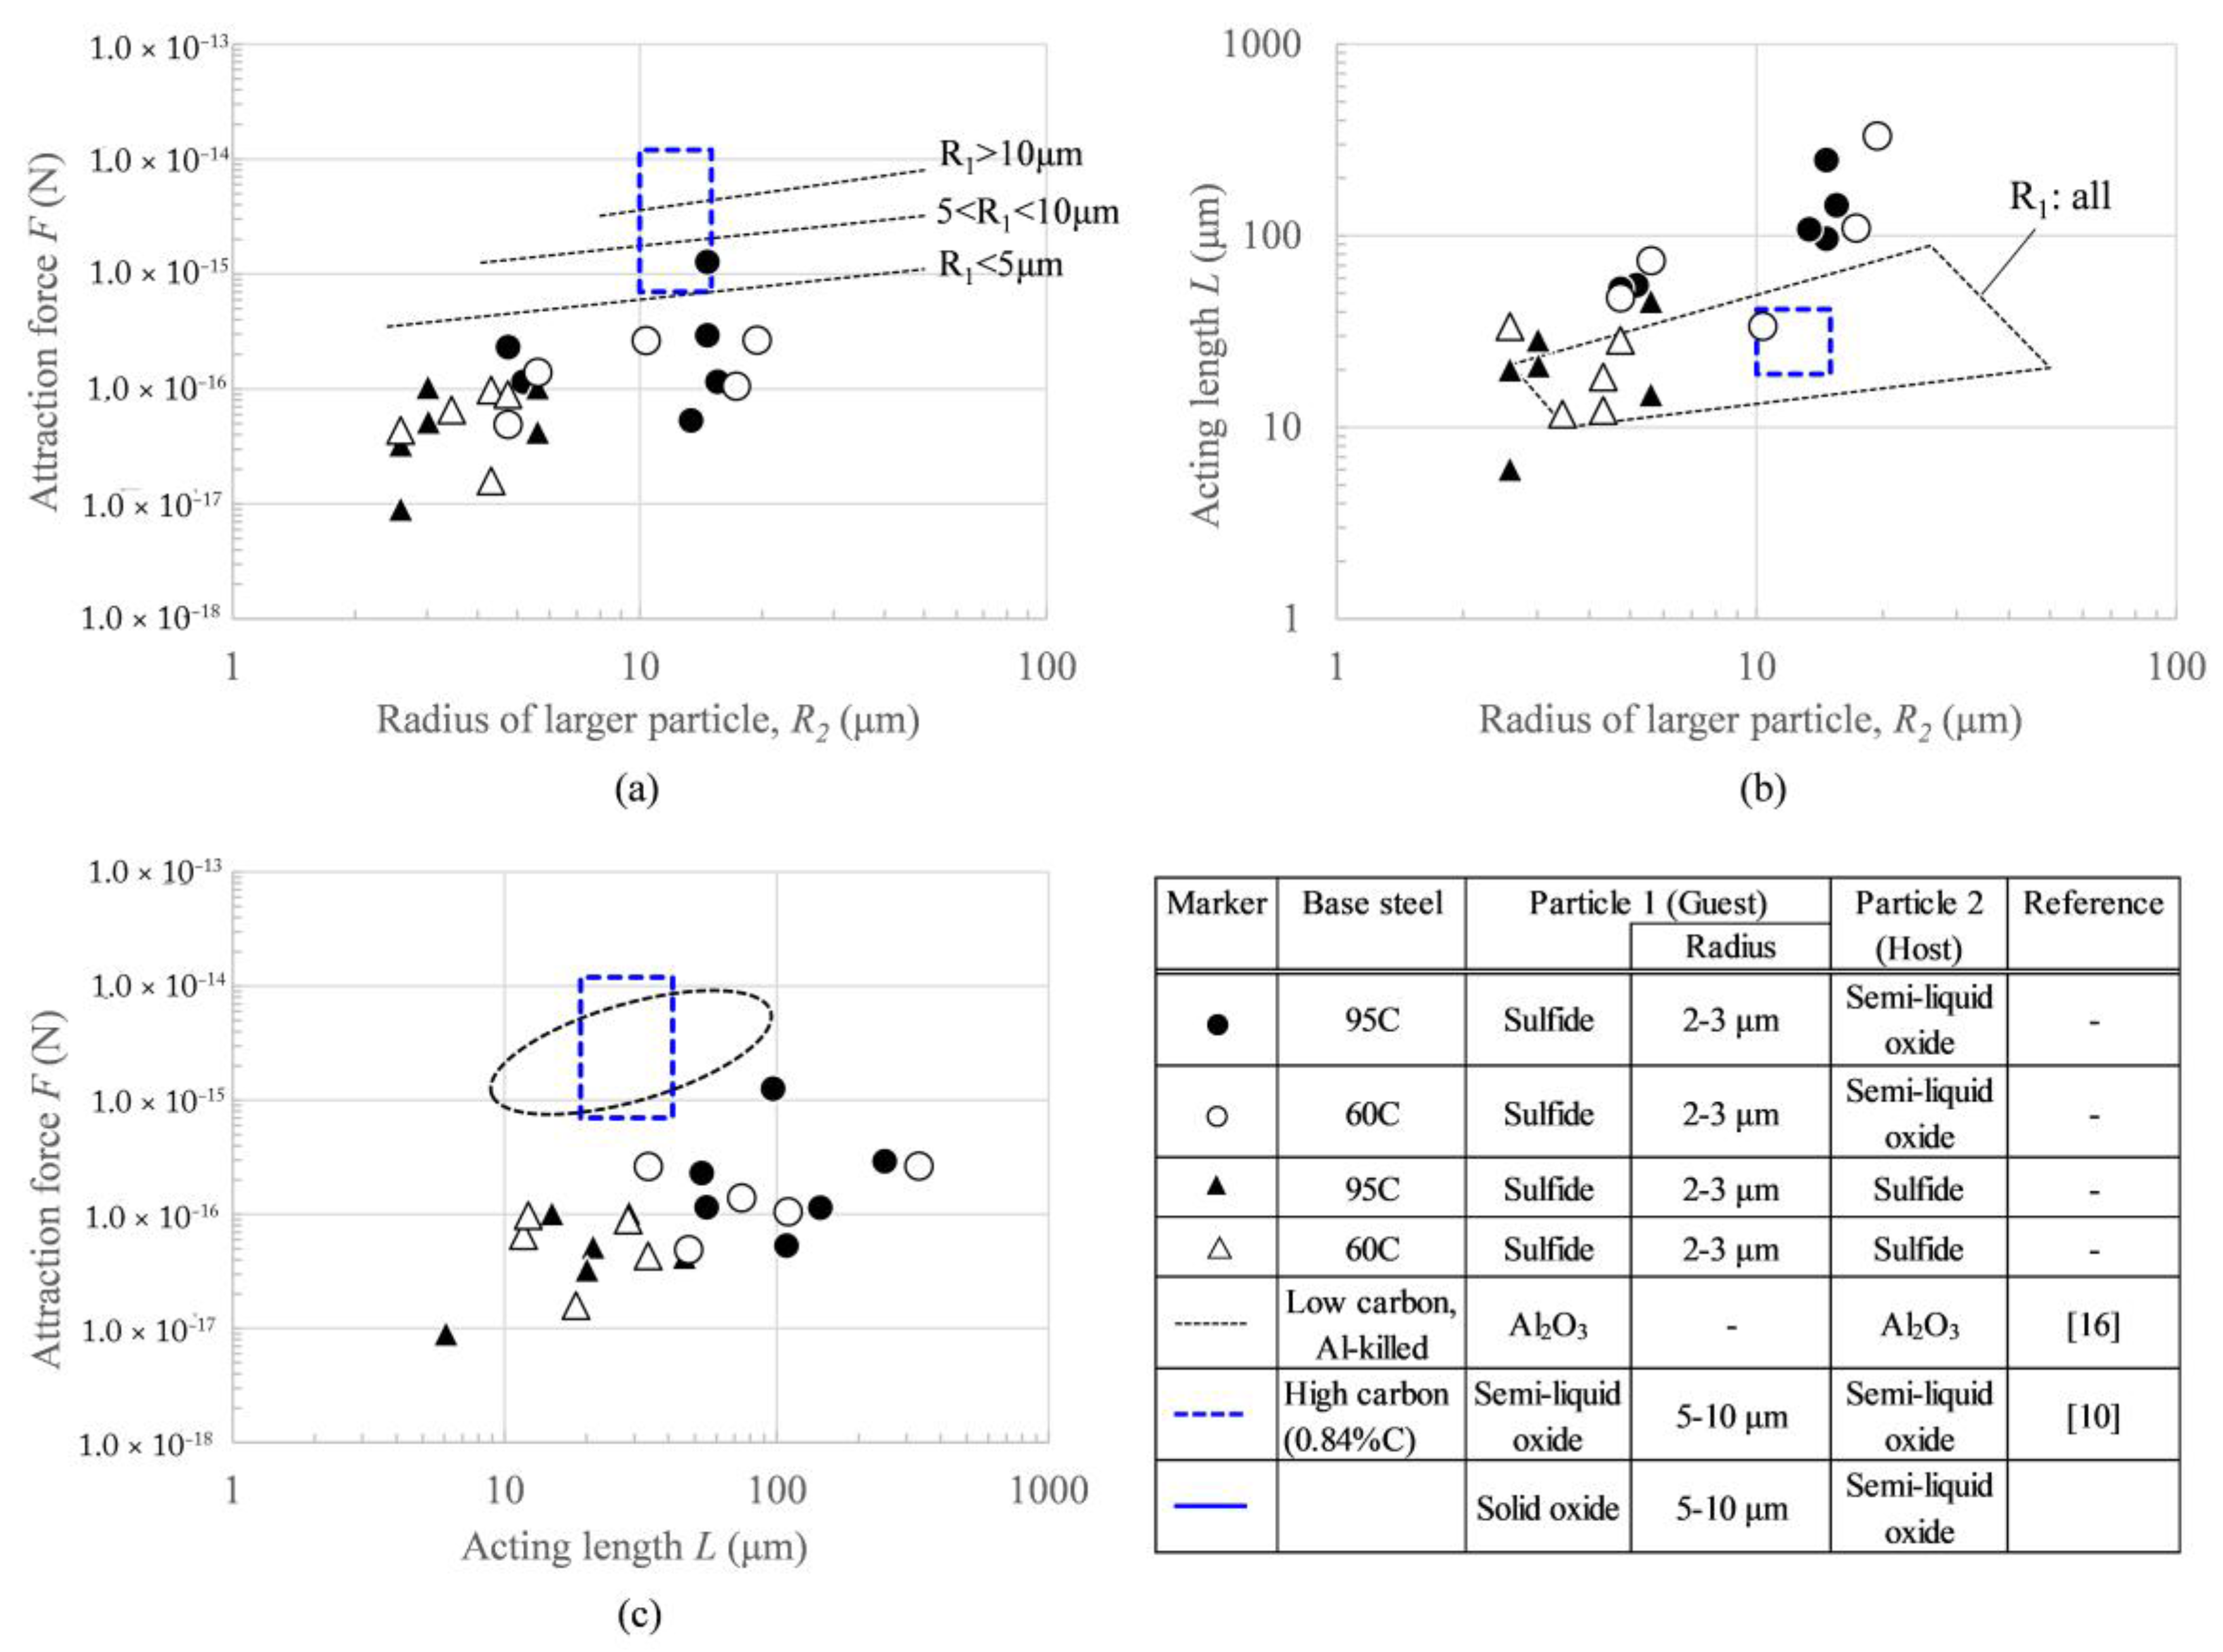
  • The attraction force of sulfide/sulfide and sulfide/semi-liquid oxide pairs on the surface of high-carbon steel was revealed to be slightly weaker than that of the alumina particle pair on the surface of low-carbon steel. Possible reasons could be the particle size and wettability, which is affected by the temperature and carbon percentage in liquid steel and the surface roughness of solid particle.
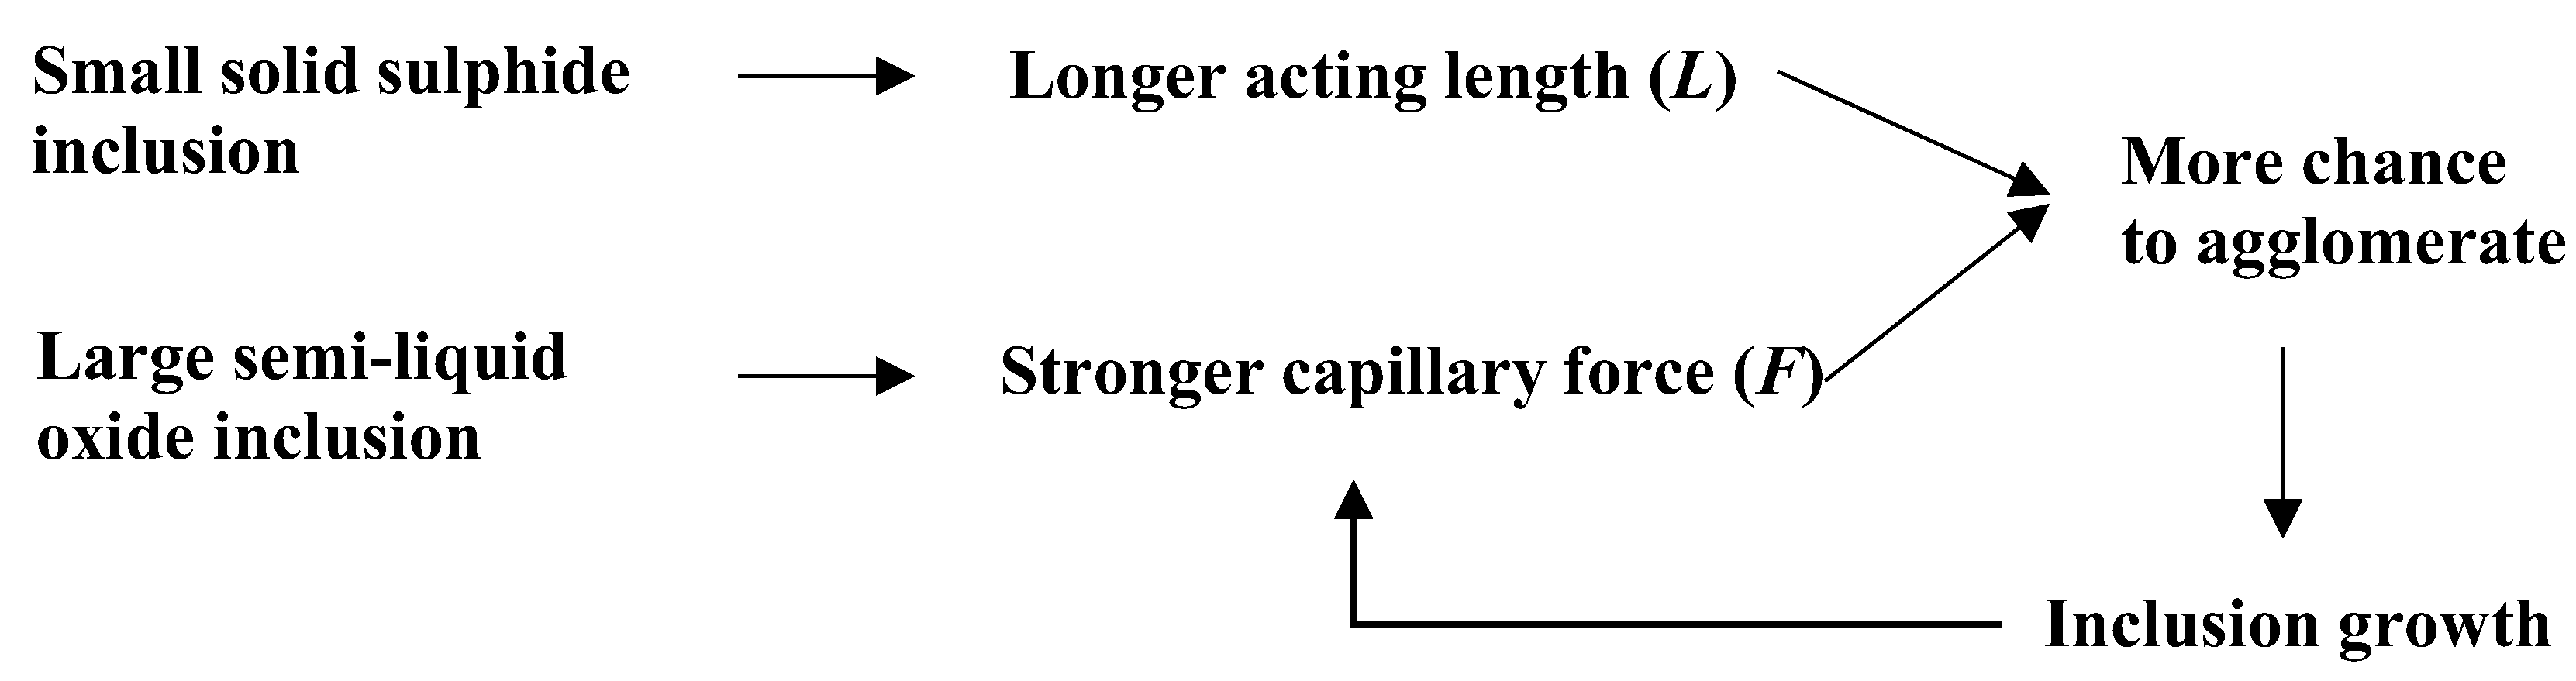
  • Semi-liquid oxide particles can grow through surface agglomeration, leading to further, stronger capillary forces. It is indicated that agglomeration among non-metallic surface particles is more likely to occur under conditions where small sulfide particles and large semi-liquid oxide particles that are capable of growing co-exist with each other.

Acknowledgments

This research was financially supported under the Australian Research Council’s Industrial Transformation Research Hub funding scheme (project IH130200025). Yasuhiro Tanaka would like to thank Nippon Steel and Sumitomo Metal Corporation, Japan, for financial support for his Ph.D. study in UNSW Sydney. The authors acknowledge the facilities and the scientific and technical assistance of the Australian Microscopy and Microanalysis Research Facility at the Electron Microscope Unit, University of New South Wales.

Author Contributions

Yasuhiro Tanaka performs experiments and data analysis. He conducted the sample preparation, confocal microscopy investigation and SEM analysis. Farshid Pahlevani designed the project and experiments and critically analysed the data. Veena Sahajwalla supervised the study and gave suggestions for experimental and theoretical investigation and to revise the manuscript. Yasuhiro Tanaka and Farshid Pahlevani wrote the manuscript and all authors analysed data, discussed the results, read and approved the final manuscript.

Conflicts of Interest

The authors declare no conflict of interest.

References

  1. Sasai, K. Direct Measurement of Agglomeration Force Exerted between Alumina Particles in Molten Steel. ISIJ Int. 2014, 54, 2780–2789. [Google Scholar] [CrossRef]
  2. Mizoguchi, T.; Ueshima, Y.; Sugiyama, M.; Mizukami, K. Influence of Unstable Non-equilibrium Liquid Iron Oxide on Clustering of Alumina Particles in Steel. Tetsu-to-Hagané 2013, 99, 601–609. [Google Scholar] [CrossRef]
  3. Sasai, K. Interaction between Alumina Inclusions in Molten Steel Due to Cavity Bridge Force. ISIJ Int. 2016, 56, 1013–1022. [Google Scholar] [CrossRef]
  4. Zheng, L.; Malfliet, A.; Wollants, P.; Blanpain, B.; Guo, M. Effect of Alumina Morphology on the Clustering of Alumina Inclusions in Molten Iron. ISIJ Int. 2016, 56, 926–935. [Google Scholar] [CrossRef]
  5. Fuchigami, K.; Wakoh, M.; Imamura, N.; Endoh, K.; Kiyose, A.; Sawada, I. Analysis of Inclusion Behavior in a Ladle Refining Process by a Newly Developed Coagulation Model. Tetsu-to-Hagané 1999, 85, 368–374. [Google Scholar] [CrossRef]
  6. Arai, H.; Nakamura, Y.; Shimasaki, S.; Taniguchi, S. Theoretical Model on Heterocoagulation of Inclusion in Molten Steel and its Experimental Verification: Part I. The Theoretical Model. Tetsu-to-Hagané 2015, 101, 129–138. [Google Scholar] [CrossRef]
  7. Nakaoka, T.; Taniguchi, S.; Matsumoto, K.; Johansen, S.T. Particle-Size-Grouping Method of Inclusion Agglomeration and its Application to Water Model Experiments. ISIJ Int. 2001, 41, 1103–1111. [Google Scholar] [CrossRef]
  8. Higashitani, K.; Ogawa, R.; Hosokawa, G.; Matsuno, Y. Kinetic Theory of Shear Coagulation for Particles in a Viscous Fluid. J. Chem. Eng. Jpn. 1982, 15, 299–304. [Google Scholar] [CrossRef]
  9. Yin, H.; Shibata, H.; Emi, T.; Suzuki, M. “In-Situ” Observation of Collision, Agglomeration and Cluster Formation of Alumina Inclusion Particles on Steel Melts. ISIJ Int. 1997, 37, 936–945. [Google Scholar] [CrossRef]
  10. Yin, H.; Shibata, H.; Emi, T.; Suzuki, M. Characteristics of Agglomeration of Various Inclusion Particles on Molten Steel Surface. ISIJ Int. 1997, 37, 946–955. [Google Scholar] [CrossRef]
  11. Bikerman, J.J. Physical Surfaces; Academic Press: New York, NY, USA, 1970; Chapter 1. [Google Scholar]
  12. Kang, Y.; Sahebkar, B.; Scheller, P.R.; Morita, K.; Sichen, D. Observation on Physical Growth of Nonmetallic Inclusion in Liquid Steel during Ladle Treatment. Metall. Mater. Trans. B 2011, 42, 522–534. [Google Scholar] [CrossRef]
  13. Aneziris, C.G.; Schroeder, C.; Emmel, M.; Schmidt, G.; Heller, H.P.; Berek, H. In Situ Observation of Collision between Exogenous and Endogenous Inclusions on Steel Melts for Active Steel Filtration. Metall. Trans. B 2013, 44, 954–968. [Google Scholar] [CrossRef]
  14. Aneziris, C.G.; Schroeder, C.; Fischer, U.; Berek, H.; Emmel, M.; Kortus, J.; Amirkhanyan, L.G.; Weißbach, T. Interactions between Exogenous Spinel Inclusions with Endogenous Inclusions in a Steel Melt. Adv. Eng. Mater. 2013, 15, 1169–1176. [Google Scholar] [CrossRef]
  15. Schröder, C.; Fischer, U.; Schmidt, A.; Schmidt, G.; Volkova, O.; Aneziris, C.G. Interactions between Exogenous Magnesia Inclusions with Endogenous Inclusions in a High Alloyed Steel Melt. Adv. Eng. Mater. 2017, 19. [Google Scholar] [CrossRef]
  16. Shibata, H.; Yin, H.; Emi, T. The Capillary Effect Promoting Collision and Agglomeration of Inclusion Particles at the Inert Gas-Steel Interface. Philos. Trans. R. Soc. Lond. A 1998, 356, 957–966. [Google Scholar] [CrossRef]
  17. Kawai, Y.; Mori, K.; Kishimoto, M.; Ishikura, K.; Shimada, T. Surface Tension of Liquid Fe-C-Si Alloys. Tetsu-to-Hagané 1974, 60, 29–37. [Google Scholar] [CrossRef]
  18. Nakajima, K. Estimation of Interfacial Tensions between Phases in the Molten Iron-Slag-Inclusion (Alumina) System. Tetsu-to-Hagané 1994, 80, 383–388. [Google Scholar] [CrossRef]
Figure 1. Schematic diagram of the infrared ray (IR) furnace combined with a confocal scanning laser microscope (CSLM).
Metals 08 00176 g001
Figure 2. Scanning electron microscope (SEM) image and EDS mapping (Si, S) of particles on the surface of (a,b) 60C and (c,d) 95C steel quenched after 5 min remelting in the MgO crucible.
Metals 08 00176 g002
Figure 3. Agglomeration behavior of oxide and sulfide particles on the surface of liquid 95C steel at 1515 °C ((a) 0 s; (b) 1.18 s; (c) 1.77 s; (d) 2.04 s; (e) 2.58 s; (f) 3.25 s).
Metals 08 00176 g003
Figure 4. Agglomeration behavior between sulfide particles at the surface of liquid 60C steel at 1540 °C ((a) 0 s; (b) 0.14 s; (c) 0.18 s; (d) 2.99 s; (e) 3.13 s; (f) 3.36 s).
Metals 08 00176 g004
Figure 5. An example of (a) x-location and (b) y-location transition of surface agglomerates.
Metals 08 00176 g005
Figure 6. Measured attraction force and various types of force between alumina particles (plots are attraction force measured from CSLM video. Lines are calculated values by Zheng et al. [4]).
Metals 08 00176 g006
Figure 7. Attraction force F and acting length L between non-metallic surface particles ((a) relation between F and R2; (b) relation between L and R2; (c) relation between F and L; the table shows the legend of graph (ac)).
Metals 08 00176 g007
Figure 8. Growth of semi-liquid surface agglomerates in 95C steel at 1495 °C.
Metals 08 00176 g008
Figure 9. Schematic concept of agglomeration behavior on the surface of high-carbon steel.
Metals 08 00176 g009
Table 1. Chemical composition of samples measured with spark emission spectrometry.
SteelC
(wt %)
Si
(wt %)
Mn
(wt %)
P
(wt %)
S
(wt %)
Ni
(wt %)
Cr
(wt %)
Mo
(wt %)
Al
(wt %)
T.Ca
(ppm)
T.O
(ppm)
60C0.580.260.740.0140.0220.070.200.020.0048.830.9
95C0.950.230.880.0120.0280.060.230.120.0027.916.0
Table 2. Compositions and liquid fractions of surface oxide particles in 60C and 95C steels measured with quantitative energy-dispersive X-ray spectroscopy (EDS) analysis.
SteelCrucibleHolding Time (min)Holding Temperature (°C)Average CompositionLiquid Fraction (wt %)
CaO (wt %)SiO2 (wt %)Al2O3 (wt %)
60CMgO5154038.927.633.676.1
95CMgO5151556.830.812.45.7
Table 3. Compositions of surface sulfide particles in 60C and 95C steels measured with quantitative EDS analysis.
SteelCrucibleHolding Time (min)Holding Temperature (°C)Average Composition
CaS (wt %)MnS (wt %)
60CMgO5154049.650.4
95CMgO5151588.911.1
Table 4. Morphology of oxide, sulfide and agglomerated particle on the surface of 60C and 95C liquid steel. (All images are in the same magnification with each other).
Particle Type60C Steel95C Steel
Oxide particle Metals 08 00176 i001 Metals 08 00176 i002
Sulfide particle Metals 08 00176 i003 Metals 08 00176 i004
Agglomerated particle Metals 08 00176 i005 Metals 08 00176 i006

