Effects of Solution Treating on Microstructural and Mechanical Properties of a Heavily Deformed New Biocompatible Ti–Nb–Zr–Fe Alloy


Materials Science and Engineering Faculty, University POLITEHNICA of Bucharest, 060042 Bucharest, Romania
*
Author to whom correspondence should be addressed.
Metals 2018, 8(5), 297; https://doi.org/10.3390/met8050297
Submission received: 8 March 2018
/
Revised: 17 April 2018
/
Accepted: 22 April 2018
/
Published: 26 April 2018
Abstract
:The effects of heavy cold plastic deformation by rolling on microstructural features and mechanical properties of Ti–25Nb–6Zr–1.7Fe (wt %) biocompatible alloy (TNZF) were studied. After a preliminary alloy processing, a heavy plastic deformation by cold-rolling (CR) with a total relative degree of plastic deformation of 90% (equivalent plastic strain, ε = 2.42) and a subsequent solution heat treatment (CR+ST) at 900 °C for 0.6 ks/water quenching were applied and then investigated. The CR and CR+ST states have microstructures consisting of mixtures of β-Ti phases and α″-Ti. The alloy in CR state shows a pronounced deformation texture, with highly deformed and elongated β-Ti grains, exhibiting internal highly fragmented areas, with shear lines at about 45° and a sub-micron/nanocrystalline fine dispersed α″-Ti phase. The alloy in CR+ST state has completely recrystallized equiaxed polyhedral β-Ti grains, with average grain size close to 52 μm and a sub-micron/nanocrystalline fine dispersed α″-Ti phase. Recorded mechanical properties, for both CR and CR+ST states, show quite similar values for the yield strength (σ0.2), ultimate tensile strength (σUTS) and Vickers microhardness (HV0.1) for CR state (σ0.2 = 603 MPa, σUTS = 1282 MPa and 287 HV0.1) in comparison with CR+ST state (σ0.2 = 598 MPa, σUTS = 1256 MPa and 256 HV0.1). Values for the modulus of elasticity (E) are lower (E = 72 GPa for CR state and E = 61 GPa for CR+ST state) than those for conventional biocompatible alloys (E ~ 110 GPa).

1. Introduction
During the last decade, major efforts have been dedicated to studying multicomponent Ti alloys containing non-toxic and non-allergic alloying elements such as Nb, Zr, and Ta due to their appropriate combination of properties: good mechanical properties, high corrosion resistance in body fluids or simulated body fluids, and enhanced biocompatibility [1,2,3,4,5,6]. If one considers the mechanical properties, i.e., the demand for a low modulus of elasticity in implantable biomedical applications [7,8,9], it was demonstrated that the values of elastic modulus are strongly dependent on thermomechanical processing parameters [10,11,12].
The necessity of obtaining alloys exhibiting a low elastic modulus appears to surpass the “stress shielding effect” [13], which leads to bone resorption around the implant [14] due to the large difference in elastic modulus values between the implant material and natural bone. At present, there are some studies concerning titanium alloys with low elastic modulus (55–65 GPa) containing non-toxic and non-allergic alloying elements, such as Ti–29Nb–13Ta–4.6Zr (wt %), Ti–24Nb–4Zr–7.9Sn (wt %) [15], Ti–35Nb–2Ta–3Zr (wt %) [16], and Ti–35Nb–7Zr–5Ta (wt %) [17,18].
A suitable thermomechanical processing route is a key issue in obtaining adequate microstructures containing a favorable phase combination to achieve a final desired combination of properties, i.e., low elastic modulus and suitable mechanical properties together with corrosion resistance and biocompatibility. It was proven that a bimodal microstructure consisting of a mixture of β-Ti and α″-Ti phases, with an increased α″-Ti phase fraction can lead to a structural state exhibiting a lower elastic modulus, due to the lower elastic modulus of the α″-Ti phase in comparison with the β-Ti phase [19,20]. Constituent phase fractions can be manipulated by thermomechanical processing to adequately steer the mechanical properties towards the desired values.
The purpose of the present study is to examine the effects of heavy plastic deformation, applied by cold-rolling and followed by a solution heat treatment, on the microstructural features and mechanical properties of a Ti–25Nb–6Zr–1.7Fe (wt %) alloy, to gain a larger perspective on the correlation between thermomechanical processing conditions and the properties that result. When designing the chemical composition for the investigated alloy, reducing production costs was one of the objectives, without compromising the alloy’s characteristics suitable for biomedical applications. Thus, the content of some expensive materials was reduced (Nb) or even substituted (Ta) in the alloy composition. On the other hand, considering the high differences in melting points between these elements and Ti, synthesis technology is significantly simplified for the Ti–25Nb–6Zr–1.7Fe (wt %) alloy, compared to other titanium alloys containing Ta and a higher level of Nb.
2. Materials and Methods
The Ti–25Nb–6Zr–1.7Fe (TNZF) (wt %) alloy was produced starting from high-purity elemental components supplied by Sigma-Aldrich, Taufkirchen, Germany (Ti 99.9%, Nb 99.8%, Zr 99.9%, Fe 99.5% minimal purity), in a cold crucible levitation melting furnace (FIVES CELES MP25, Fives, Paris, France) under an argon protective atmosphere. The melt was cast in ∅20 × 45 mm ingots inside the melting furnace chamber. To increase the alloy homogeneity, three re-melts were performed; they were imposed by the high difference concerning the specific weight and melting temperature values of the alloying elements.
A preliminary alloy processing was necessary to obtain the so-called precursor samples to be used for heavy plastic deformation procedure.
From the initial ingots, 6 × 16 × 40 mm longitudinal slices were cut and plastic deformed by cold-rolling with 50% relative degree of plastic deformation, to refine the initial as-cast microstructure. After cold-rolling, a recrystallization at 950 °C for 1.2 ks, followed by water quenching, was applied in order to remove all unwanted effects induced by the cold plastic deformation (highly deformed and fragmented grains, high density of defects, accumulated strain hardening, etc.) and to obtain a pristine recrystallized microstructure, with equiaxed polyhedral grains, with an average grain size close to 60–80 μm. Samples obtained as described above were precursor samples for the alloy final thermomechanical processing, based on heavy plastic deformation, which is the subject of this paper.
For this processing stage the cold rolling deformation degrees, as well as the parameters for heat treatment were established based on the authors’ previous results [21].
The thermomechanical processing route based on heavy plastic deformation consisted, firstly, of a plastic deformation by cold-rolling (CR), realized in deformation steps with 5% relative plastic deformation degree, to achieve the final imposed 90% total deformation degree (equivalent plastic strain, ε = 2.42). After cold plastic deformation, a solution heat treatment at 900 °C for 0.6 ks, in a high vacuum (CR+ST) with final water quenching was applied. The alloy was investigated in both states, CR and CR+ST.
In the processing procedures described above, cold-rolling processes were performed using a Mario Di Maio LQR120AS laboratory mill (Mario Di Maio, Milan, Italy), at 3 m/min rolling speed. The heat treatments were performed using a GERO SR 100X500/12 high-temperature laboratory furnace (Carbolite Gero, Neuhausen, Germany).
Samples resulted from CR and CR+ST processing were cut and prepared for further investigation. For microstructural analysis, XRD, EBSD, EDS, and SEM techniques were used, while for mechanical characterization tensile testing and micro-hardness testing were applied. The samples for microstructural analysis were metallographic grinded down to 1200-grit SiC paper and polished with 6 μm and 1 μm polycrystalline diamond suspension followed by super-polishing with 0.02 μm colloidal silica mixed with 10% H2O2 as a mild oxidizing agent.
After this stage, samples for EBSD analysis and for SEM analysis were prepared differently. For EBSD analysis, the samples were further polished by vibropolishing for 10 h using a short flocked polishing pad and as polishing agent 0.02 μm colloidal silica mixed with 10% H2O2. For SEM analysis the metallographic prepared samples were etched by swabbing for 10–15 s with a mixture of 6% HNO3 + 3% HF + 91% H2O. XRD and SEM analysis were realized on different directions in a sample reference frame (Figure 1). XRD investigations were performed on the sample surfaces defined by RD (rolling direction)–TD (transverse direction), while SEM investigation were performed on the sample surfaces defined by RD–TD and RD–ND (normal direction), according to the specified sample reference frame shown in Figure 1.
The XRD investigations were performed using a PANalytical X’Pert PRO MRD diffractometer (PANalytical, Almelo, The Netherlands) with a wavelength of Cu k-alpha (λ = 1.5418 Å); recorded XRD spectra were fitted to determine the phase structure and to calculate lattice parameters of observed phases. The fitting procedure was performed using PeakFit v.4.11 software package (Systat Software, Erkrath, Germany), to determine for each observed diffracted peak its position, intensity and broadening. A pseudo-Voigt diffraction line profile was used for fitting the results. Data obtained from the fitting procedure was further processed using UnitCell software (Department of Earth Sciences, University of Cambridge, Cambridgeshire, UK), in order to compute the lattice parameters. The SEM analysis was performed using a TESCAN Vega II-XMU microscope (TESCAN, Brno, Czech Republic) fitted with an EBSD Bruker Quantax eFlash detector (Bruker Corporation, Billerica, MA, USA) and an EDS EDAX Octane Plus detector (EDAX, Mahwah, NJ, USA). Mechanical characterization was performed using a DEBEN MicroTest 2000N universal micromechanical testing module (Deben, Woolpit, Bury Saint Edmunds, UK), at 0.4 mm/min cross-head speed, and a microhardness tester Wilson–Wolpert 401MVA (Wilson Hardness, Norwood, MA, USA), using a testing load of 100 gf and a dwell time of 30 s. Five bone-shaped specimens (0.7 × 2.1 × 10 mm—calibrated area dimensions) were cut and prepared for tensile testing for each structural state (CR and CR+ST). All specimens were machined such that the testing direction is parallel to the rolling direction (RD). Microhardness investigations were performed on the same samples used also for SEM analysis (RD–ND sample surface). Tensile and microhardness tests were repeated five times for each microstructural state and, finally, the mean and standard deviation were calculated.
3. Results and Discussion
3.1. The Effect of Thermomechanical Processing upon Microstructure Evolution
The microstructural characterization aimed to analyze the TNZF alloy’s component phases and phase morphology for both CR and CR+ST microstructural states.
Figure 2 and Figure 3 present the XRD spectra corresponding to CR and CR+ST processed states together with detailed zooms of cumulative diffraction peaks. For CR state (Figure 2) both β-Ti and α″-Ti phases were identified. It was found that β-Ti phase shows presence of (110), (200) and (211) diffraction lines, while α″-Ti phase shows presence of (111), (022), (131), (113) and (220) diffraction lines. The β-Ti phase was indexed in Im-3m body centered cubic system, with a calculated lattice parameter of about a = 3.31 Å, while α″-Ti phase was indexed in Cmcm orthorhombic system, with calculated lattice parameters as follows: a = 3.26 Å, b = 4.74 Å and c = 4.63 Å. Considering the specific of microstructural transformations induced by deformation under a high plastic strain (equivalent plastic strain, ε = 2.42) [13,22] it can be assumed that α″-Ti phase is a stress-induced one. Also, broad β-Ti and α″-Ti peaks indicate highly distorted Ultra-Fine Crystalline (UFC)/Nanocrystalline (NC) grains because of the intense plastic deformations applied [23].
The CR+ST state (Figure 3) shows the presence of the same phases, β-Ti and α″-Ti, with the same diffraction lines. In the CR+ST state, calculated lattice parameter of β-Ti phase was about a = 3.30 Å, while calculated lattice parameters of α″-Ti phase were about a = 3.29 Å, b = 4.76 Å and c = 4.66 Å. In CR+ST state, α″-Ti phase is a temperature-induced one due to recrystallization at 900 °C for 0.6 ks of cold-deformed TNZF alloy, followed by water quenching. This assumption is sustained by the difference in lattice parameters of α″-Ti phase: for CR state a = 3.26 Å, b = 4.74 Å and c = 4.63 Å; for CR+ST state a = 3.29 Å, b = 4.76 Å and c = 4.66 Å.
For titanium alloys belonging to other alloying systems some data concerning lattice parameters were reported. Similar values of lattice parameters for β-Ti and α″-Ti phases were reported in the case of thermomechanically processed Ti–22Nb–6Ta alloy [24]; in this case, the parent β-Ti phase has the lattice parameter a = 3.289 Å, while the lattice parameters of α″-Ti phase are: a = 3.221 Å; b = 4.766 Å and c = 4.631 Å. In the case of Ti–27Nb alloy [25] it was reported that β-Ti phase has the lattice parameter a = 3.285 Å, while the lattice parameters of α″-Ti phase are: a = 3.225 Å; b = 4.780 Å and c = 4.682 Å. Also, in the case of Ti–10Zr–5Nb–5Ta alloy [26] it was reported that the lattice parameters for α″-Ti phase are: a = 3.257 Å; b = 4.741 Å and c = 4.851 Å.
As concerning the intensities of diffraction peaks, it is known that high intensity peaks of α″-Ti phase suggest a relatively high volume fraction of α″-Ti phase present in the β-Ti matrix. Recently, it was showed that heavy plastic deformation can induce recoverable transformation of parent β-Ti phase in stress-induced α″-Ti phase [27].
To confirm the presence of constituent phases, β-Ti and α″-Ti, a SEM-EBSD investigation was performed on the alloy in CR+ST state. Taking into account the possibility of introducing artefacts during specimen preparation due to high distorted grains of alloy in CR state, SEM-EBSD was used as a tool for qualitative phase analysis only for the alloy in CR+ST state.
Figure 4 presents a high-magnification SEM-EBSD image of phase composite map of both constituent phases: β-Ti and α″-Ti (Figure 4a) and separately, the phase distribution map for β-Ti phase (Figure 4b) and for α″-Ti phase (Figure 4c). It can be observed that only in some parent polyhedral β-Ti grains is present a fine, small-size (NC) fraction of dispersed α″-Ti phase (Figure 4b), while for the rest of β-Ti grains a higher fraction of the dispersed α″-Ti phase (Figure 4c) is present.
SEM microscopy was performed on both CR and CR+ST states, to analyze TNZF alloy’s morphological aspects. The microstructure for CR state is presented in Figure 5. Some differences appear between the micrograph features in the case of the RD–TD and RD–ND planes in sample reference space. The RD–TD surface investigated (Figure 5a) shows plate-like, highly deformed grains with the plate surface disposed almost parallel to RD–TD surface. The RD–ND surface investigated (Figure 5b) shows highly deformed grains disposed parallel to RD direction. As can be observed, the highly deformed grains have an elongated shape, with internal fragmented areas having as features shear lines at about 45° (Figure 5c,d), indicating a pronounced deformation texture.
Figure 6 illustrates specific microstructures of the alloy in the CR+ST state for RD–TD surface (Figure 6a) and for RD–ND surface (Figure 6b). The RD–TD surface investigated (Figure 6a) shows the presence of completely recrystallized equiaxed polyhedral β-Ti grains, with an average grain size close to 52 μm, with sub-micron (NC) α″-Ti phase dispersed inside β-Ti grains (confirmed by Figure 4a). In the case of RD–ND investigated surface it can be seen, besides new grain boundaries, traces of initial grain boundaries of CR structure, disposed parallel to the RD sample direction (Figure 6b), suggesting that the CR+ST sample partially retains the effects of initial cold heavy plastic deformation (see Figure 5b), even after subsequent heat treatment.
Similar microstructures have been observed in the case of other thermomechanical processed β-Ti alloys [28,29,30,31].
To analyze the chemical homogeneity of recrystallized equiaxed polyhedral grains existing in TNZF alloy in the CR+ST state, two random grains (light gray—EDS area 1 and dark gray—EDS area 2) were investigated (Figure 6a) by EDS. Figure 6c,d show the EDS spectra of investigated areas 1 and 2.
Table 1 and Table 2 present the obtained composition analysis by EDS. It can be observed that the contents of Zr and Fe are higher in the first grain analyzed: Zr = 6.22 wt % and Fe = 1.78 wt % for the first analyzed grain, while Zr = 5.17 wt % and Fe = 1.63 wt % for the second grain analyzed. Regarding the content of Nb, a higher quantity is present in the second grain (Nb = 27.30 wt %) in comparison with the first (Nb = 23.36 wt %). However, we can say that the EDS analysis shows no significant compositional differences between the two investigated grains. Small gaps between the EDS compositional analysis for randomly selected area 1 and area 2 indicate a good chemical homogeneity for the TNZF alloy.
3.2. The Effect of Thermomechanical Processing upon Mechanical Characteristics’ Evolution
The mechanical characterization aimed to determine the mechanical properties of the TNZF alloy, expressed by the yield strength (σ0.2), ultimate tensile strength (σUTS), elongation to fracture (εf), elastic modulus (E) and microhardness (HV0.1), for both CR and CR+ST microstructural states.
Five samples were mechanically tested to fracture in tensile tests for each structural state, Figure 7 showing some representative stress-strain diagrams for the TNZF alloy in CR (blue line) and CR+ST (red line) microstructural states.
As can be observed from Figure 7, the CR state shows a limited plasticity in comparison with the CR+ST state; if the plastic flow plateau (material flow at maximum load) is compared, it is a few times larger for the CR+ST state comparing to the CR state, due to increased deformation capacity by slip/twinning of recrystallized structure. Also, another feature is that CR and CR+ST states are showing a high necking prior to fracture, indicating the presence of a ductile fracture mechanism.
Based on the obtained stress-strain curves, data concerning the yield strength (σ0.2), ultimate tensile strength (σUTS), elongation to fracture (εf) and elastic modulus (E) were computed (Figure 8a–d). Also, the data obtained from microhardness tests are presented in Figure 8e. The results shown in Figure 8 were computed via statistical processing of data recorded in tensile and microhardness tests, the standard deviation for each mechanical property being between ±2.1% and ±3.3% relative to the results presented by this figure.
For CR and CR+ST states, the yield strength (σ0.2) (Figure 8a) and ultimate tensile strength (σUTS) (Figure 8b), have quite similar values: around 600 MPa for the yield strength (σ0.2) and around 1250–1280 MPa for ultimate tensile strength (σUTS). In the case of elongation to fracture (εf) (Figure 8c) a different situation is observed; the highest value, close to 15.7%, is exhibited by the CR+ST state, while the CR state exhibits a value close to 5%. The microhardness testing (Figure 8e) showed that CR state exhibits a value close to 287 HV0.1, while CR+ST state a value close to 256 HV0.1. Finally, the elastic modulus (E) values are important for this study; CR state exhibits a value close to 72 GPa, while CR+ST state a value close to 61 GPa, both lower than those for conventional biocompatible titanium alloys (i.e., Ti–6Al–4V around 110 GPa) [32,33].
In explanation for this behavior, as evidenced by Figure 8a–e, three competitive mechanisms can be taken into consideration. The first mechanism refers to the influence of phase fractions, a higher phase fraction of a certain phase having a higher influence upon properties. In this case, it is known that α″-Ti phase exhibits much lower mechanical properties in comparison with parent β-Ti phase [34,35]. In this study, a higher α″-Ti phase fraction in CR+ST state in comparison with CR state can be evaluated due to much intense α″-Ti peaks in comparison with β-Ti peaks obtained in the case of CR+ST state (Figure 3) versus CR state (Figure 2).
The second mechanism refers to the presence of UFC/NC grains, being known that the size of crystalline grains influences mechanical properties, this being expressed by the Hall–Petch correlation [36]; a smaller grain size leads to increasing resistance properties. In this case, a smaller grain size, for both α″-Ti and β-Ti phases, is obtained as a result of heavy cold plastic deformation (CR state) in comparison with CR+ST state, proved by the broad α″-Ti and β-Ti peaks obtained in the case of CR state (Figure 2) in comparison with CR+ST state (Figure 3).
The third mechanism refers to the alloy’s strengthening by the presence of an increased dislocation density, which ultimately improves the mechanical properties [19]. In this case, a higher dislocation density is obtained in the case of CR state due to heavy cold plastic deformation applied: up to 90% relative degree of plastic deformation, ε = 2.42 equivalent plastic strain.
All three mechanisms are strongly influenced by the processing route; the cold-rolling (CR state) involves the formation of stress-induced α″-Ti phase with small grain sizes of both β-Ti and α″-Ti phases and higher dislocation density, while recrystallization followed by water quenching (CR+ST state) involves the formation of temperature-induced α″-Ti phase with higher grain sizes of both β-Ti and α″-Ti phases and lower dislocation density.
Considering the demand of implantable biomaterials with a low Young’s elastic modulus [7,8,9,10,11,12], the necessity of an internal microstructure able to assure this requirement arises; an increased α″-Ti phase volume fraction, due to the low elastic modulus of α″-Ti phase in comparison with β-Ti phase [19,20] is necessary. If one will apply a cold-deformation after CR+ST, it is expected that, besides existing thermally induced α″-Ti phase, supplementary stress-induced α″-Ti phase to be generated, increasing the alloy’s total α″-Ti phase volume fraction and as a consequence, further decreasing the alloy’s elastic modulus. So, further research should focus on finding the optimal thermomechanical processing route that could lead to an additional reduction in elastic modulus towards values even closer to the human bone, by increasing α″-Ti phase volume fraction. Nevertheless, the results of this study highlight that the TNZF alloy is a suitable candidate for materials used in medical implantable applications.
4. Conclusions
The effects of solution heat treatment upon evolution of microstructure and mechanical properties for a heavily plastic deformed Ti–25Nb–6Zr–1.7Fe alloy were investigated. The main results can be summarized as follows:
(1) In both cold-rolled (CR) and solution treated (CR+ST) states, microstructures consisting of mixtures of α″-Ti and β-Ti phases were obtained. The CR state showed a pronounced deformation texture, with highly deformed and elongated β-Ti grains, with internal fragmented areas having as feature shear lines at 45° and containing a sub-micron/nanocrystalline fine dispersed α″-Ti phase. The CR+ST state showed the presence of completely recrystallized equiaxed polyhedral β-Ti grains, with and average grain size close to 52 μm, containing a sub-micron/nanocrystalline fine dispersed α″-Ti phase. In the CR state, the α″-Ti phase is a stress-induced one, while in the CR+ST state it is a temperature-induced one.
(2) The lattice parameters of both α″-Ti and β-Ti phases were computed based on the XRD recorded spectra. The CR state showed for β-Ti phase a lattice parameter a = 3.31 Å, and for the stress-induced α″-Ti phase the following lattice parameters: a = 3.26 Å, b = 4.74 Å and c = 4.63 Å. The CR+ST state showed for β-Ti phase a lattice parameter a = 3.30 Å, and for the thermal-induced α″-Ti phase the following lattice parameters: a = 3.29 Å, b = 4.76 Å and c = 4.66 Å.
(3) Mechanical characteristics for both CR and CR+ST states, have quite similar values for the yield strength (σ0.2), ultimate tensile strength (σUTS) and Vickers microhardness (HV0.1) for the CR state (σ0.2 = 603 MPa, σUTS = 1282 MPa and 287 HV0.1) in comparison with the CR+ST state (σ0.2 = 598 MPa, σUTS = 1256 MPa and 256 HV0.1).
(4) The plasticity expressed by elongation to fracture (εf), indicates a drastically increased plastic behavior obtained in the CR+ST state, with a value close to 15%, much higher than the CR microstructural state (a value close to 5%).
(5) The values obtained for the elastic modulus (E) are very important for this study; the investigated alloy in CR state has a value of E close to 72 GPa, while the alloy in CR+ST state has a value close to 61 GPa. Taking into account that both values are lower than those for conventional biocompatible titanium alloys (~110 GPa) [30,31] and not so much higher than those for natural human bone (~25 GPa) [37,38,39,40], the results of this present study are promising and recommend that the Ti–25Nb–6Zr–1.7Fe (wt %) alloy be further developed for implantable medical applications.
Author Contributions
Vasile Dănuț Cojocaru and Nicolae Șerban contributed equally in conceiving, designing, and performing the experiments, analyzing the data, and writing the paper.
Acknowledgments
This work was supported by a grant of the Romanian National Authority for Scientific Research and Innovation, CNCS/CCCDI-UEFISCDI, project number PN-III-P2-2.1-PED-2016-1352, within PNCDI III.
Conflicts of Interest
The authors declare no conflict of interest. The founding sponsors had no role in the design of the study; in the collection, analyses, or interpretation of data; in the writing of the manuscript, and in the decision to publish the results.
References
- Okazaki, Y.; Rao, S.; Ito, Y.; Tateishi, T. Corrosion resistance, mechanical properties, corrosion fatigue strength and cytocompatibility of new Ti alloys without Al and V. Biomaterials 1998, 19, 1197–1215. [Google Scholar] [CrossRef]
- Niinomi, M.; Nakai, M.; Hieda, J. Development of new metallic alloys for biomedical applications. Acta Biomater. 2012, 8, 3888–3903. [Google Scholar] [CrossRef] [PubMed]
- Geetha, M.; Singh, A.K.; Asokamani, R.; Gogia, A.K. Ti based biomaterials, the ultimate choice for orthopaedic implants—A review. Prog. Mater. Sci. 2009, 54, 397–425. [Google Scholar] [CrossRef]
- Datta, S.; Mahfouf, M.; Zhang, Q.; Chattopadhyay, P.P.; Sultana, N. Imprecise knowledge based design and development of titanium alloys for prosthetic applications. J. Mech. Behav. Biomed. Mater. 2016, 53, 350–365. [Google Scholar] [CrossRef] [PubMed]
- Elias, C.N.; Fernandes, D.J.; Resende, C.R.S.; Roestel, J. Mechanical properties, surface morphology and stability of a modified commercially pure high strength titanium alloy for dental implants. Dent. Mater. 2015, 31, e1–e13. [Google Scholar] [CrossRef] [PubMed]
- Grandin, H.M.; Berner, S.; Dard, M. A review of Titanium Zirconium (TiZr) alloys for use in endosseous dental implants. Materials 2012, 5, 1348–1360. [Google Scholar] [CrossRef]
- Brailovski, V.; Prokoshkin, S.; Gauthier, M.; Inaekyan, K.; Dubinskiy, S.; Petrzhik, M.; Filonov, M. Bulk and porous metastable beta Ti-Nb-Zr(Ta) alloys for biomedical applications. Mater. Sci. Eng. C 2011, 31, 643–657. [Google Scholar] [CrossRef]
- Xu, Y.F.; Yi, D.Q.; Liu, H.Q.; Wang, B.; Yang, F.L. Age-hardening behavior, microstructural evolution and grain growth kinetics of isothermal ω phase of Ti-Nb-Ta-Zr-Fe alloy for biomedical applications. Mater. Sci. Eng. A 2011, 529, 326–334. [Google Scholar] [CrossRef]
- Ionita, D.; Grecu, M.; Dilea, M.; Cojocaru, V.D.; Demetrescu, I. Processing Ti-25Ta-5Zr bioalloy via anodic oxidation procedure at high voltage. Metall. Mater. Trans. B 2011, 42, 1352–1357. [Google Scholar] [CrossRef]
- Eckert, J.; Das, J.; Xu, W.; Theissmann, R. Nanoscale mechanism and intrinsic structure related deformation of Ti-alloys. Mater. Sci. Eng. A 2008, 493, 71–78. [Google Scholar] [CrossRef]
- Xu, W.; Kim, K.B.; Das, J.; Calin, M.; Eckert, J. Phase stability and its effect on the deformation behavior of Ti-Nb-Ta-In/Cr β alloys. Scr. Mater. 2006, 54, 1943–1948. [Google Scholar] [CrossRef]
- Xu, W.; Kim, K.B.; Das, J.; Calin, M.; Rellinghaus, B.; Eckert, J. Deformation-induced nanostructuring in a Ti-Nb-Ta-In β alloy. Appl. Phys. Lett. 2006, 89, 031906. [Google Scholar] [CrossRef]
- Li, S.J.; Cui, T.C.; Li, Y.L.; Hao, Y.L.; Yang, R. Ultrafine-grained β-type titanium alloy with nonlinear elasticity and high ductility. Appl. Phys. Lett. 2008, 92, 043128. [Google Scholar] [CrossRef]
- Zhu, Y.T.; Lowe, T.C.; Langdon, T.G. Performance and applications of nanostructured materials produced by severe plastic deformation. Scr. Mater. 2004, 51, 825–830. [Google Scholar] [CrossRef]
- Tane, M.; Akita, S.; Nakano, T.; Hagihara, K.; Umakoshi, Y.; Niinomi, M.; Mori, H.; Nakajima, H. Low Young’s modulus of Ti-Nb-Ta-Zr alloys caused by softening in shear moduli c′ and c44 near lower limit of body-centered cubic phase stability. Acta Mater. 2010, 58, 6790–6798. [Google Scholar] [CrossRef]
- Cai, M.H.; Lee, C.Y.; Kang, S.; Lee, Y.K. Fine-grained structure fabricated by strain-induced martensite and its reverse transformations in a metastable β titanium alloy. Scr. Mater. 2011, 64, 1098–1101. [Google Scholar] [CrossRef]
- Azushima, A.; Kopp, R.; Korhonen, A.; Yang, D.Y.; Micari, F.; Lahoti, G.D.; Groche, P.; Yanagimoto, J.; Tsuji, N.; Rosochowski, A.; et al. Severe plastic deformation (SPD) processes for metals. CIRP Ann. 2008, 57, 716–735. [Google Scholar] [CrossRef]
- Ivasishin, O.M.; Markovsky, P.E.; Matviychuk, Y.V.; Semiatin, S.L.; Ward, C.H.; Fox, S. A comparative study of the mechanical properties of high-strength β-titanium alloys. J. Alloys Compd. 2008, 457, 296–309. [Google Scholar] [CrossRef]
- Xu, Y.F.; Yi, D.Q.; Liu, H.Q.; Wu, X.Y.; Wang, B.; Yang, F.L. Effects of cold deformation on microstructure, texture evolution and mechanical properties of Ti-Nb-Ta-Zr-Fe alloy for biomedical applications. Mater. Sci. Eng. A 2012, 547, 64–71. [Google Scholar] [CrossRef]
- Zhang, Y.; Liu, Z.; Zhao, Z.; Ma, M.; Shu, Y.; Hu, W.; Liu, R.; Tian, Y.; Yu, D. Preparation of pure α″-phase titanium alloys with low moduli via high pressure solution treatment. J. Alloys Compd. 2017, 695, 45–51. [Google Scholar] [CrossRef]
- Cojocaru, V.D.; Raducanu, D.; Gloriant, T.; Gordin, D.M.; Cinca, I. Effects of cold-rolling deformation on texture evolution and mechanical properties of Ti-29Nb-9Ta-10Zr alloy. Mater. Sci. Eng. A 2013, 586, 1–10. [Google Scholar] [CrossRef] [Green Version]
- Nocivin, A.; Cojocaru, V.D.; Raducanu, D.; Cinca, I.; Angelescu, M.L.; Dan, I.; Serban, N.; Cojocaru, M. Finding an Optimal Thermo-Mechanical Processing Scheme for a Gum-Type Ti-Nb-Zr-Fe-O Alloy. J. Mater. Eng. Perform. 2017, 26, 4373–4380. [Google Scholar] [CrossRef]
- Sun, F.; Nowak, S.; Gloriant, T.; Laheurte, P.; Eberhardt, A.; Prima, F. Influence of a short thermal treatment on the superelastic properties of a titanium-based alloy. Scr. Mater. 2010, 63, 1053–1056. [Google Scholar] [CrossRef]
- Kim, H.Y.; Sasaki, T.; Okutsu, K.; Kim, J.I.; Inamura, T.; Hosoda, H.; Miyazaki, S. Texture and shape memory behavior of Ti-22Nb-6Ta alloy. Acta Mater. 2006, 54, 423–433. [Google Scholar] [CrossRef]
- Castany, P.; Yang, Y.; Bertrand, E.; Gloriant, T. Reversion of a parent {130}<310>α’’ martensitic twinning system at the origin of {332}<113>β twins observed in metastable β titanium alloys. Phys. Rev. Lett. 2016, 117, 245501. [Google Scholar] [CrossRef] [PubMed]
- Cojocaru, V.D.; Raducanu, D.; Gordin, D.M.; Cinca, I. Texture evolution during ARB (Accumulative Roll Bonding) processing of Ti-10Zr-5Nb-5Ta alloy. J. Alloys Compd. 2013, 546, 260–269. [Google Scholar] [CrossRef]
- Matsumoto, H.; Watanabe, S.; Hanada, S. Microstructures and mechanical properties of metastable β TiNbSn alloys cold rolled and heat treated. J. Alloys Compd. 2007, 439, 146–155. [Google Scholar] [CrossRef]
- Talling, R.J.; Dashwood, R.J.; Jackson, M.; Dye, D. On the mechanism of superelasticity in Gum metal. Acta Mater. 2009, 57, 1188–1198. [Google Scholar] [CrossRef]
- Ivasishin, O.M.; Markovsky, P.E.; Matviychuk, Y.V.; Semiatin, S.L. Precipitation and recrystallization behavior of beta titanium alloys during continuous heat treatment. Metall. Mater. Trans. A 2003, 34, 147–158. [Google Scholar] [CrossRef]
- Sadeghpour, S.; Abbasi, S.M.; Morakabati, M.; Bruschi, S. Correlation between alpha phase morphology and tensile properties of a new beta titanium alloy. Mater. Des. 2017, 121, 24–35. [Google Scholar] [CrossRef]
- Hayama, A.O.F.; Lopes, J.F.S.C.; Gomes da Silva, M.J.; Abreu, H.F.G.; Caram, R. Crystallographic texture evolution in Ti-35Nb alloy deformed by cold rolling. Mater. Des. 2014, 60, 653–660. [Google Scholar] [CrossRef]
- Long, M.; Rack, H.J. Titanium alloys in total joint replacement—A materials science perspective. Biomaterials 1998, 19, 1621–1639. [Google Scholar] [CrossRef]
- Weaver, J.S.; Kalidindi, S.R. Mechanical characterization of Ti-6Al-4V titanium alloy at multiple length scales using spherical indentation stress-strain measurements. Mater. Des. 2016, 111, 463–472. [Google Scholar] [CrossRef]
- Wang, L.; Lu, W.; Qin, J.; Zhang, F.; Zhang, D. Microstructure and mechanical properties of cold-rolled TiNbTaZr biomedical β titanium alloy. Mater. Sci. Eng. A 2008, 490, 421–426. [Google Scholar] [CrossRef]
- Zhang, Y.; Kent, D.; Wang, G.; St John, D.; Dargusch, M. An investigation of the mechanical behaviour of fine tubes fabricated from a Ti-25Nb-3Mo-3Zr-2Sn alloy. Mater. Des. 2015, 85, 256–265. [Google Scholar] [CrossRef]
- Salem, A.A.; Kalidindi, S.R.; Doherty, R.D. Strain-hardening of titanium: Role of deformation twinning. Acta Mater. 2003, 51, 4225–4237. [Google Scholar] [CrossRef]
- Niinomi, M. Recent research and development in titanium alloys for biomedical applications and healthcare goods. Sci. Technol. Adv. Mater. 2003, 4, 445–454. [Google Scholar] [CrossRef]
- Niinomi, M. Biologically and mechanically biocompatible titanium alloys. Mater. Trans. 2008, 49, 2170–2178. [Google Scholar] [CrossRef]
- Ishimoto, T.; Hagihara, K.; Hisamoto, K.; Sun, S.H.; Nakano, T. Crystallographic texture control of beta-type Ti-15Mo-5Zr-3Al alloy by selective laser melting for the development of novel implants with a biocompatible low Young’s modulus. Scr. Mater. 2017, 132, 34–38. [Google Scholar] [CrossRef]
- Okulov, I.V.; Volegov, A.S.; Attar, H.; Bönisch, M.; Ehtemam-Haghighi, S.; Calin, M.; Eckert, J. Composition optimization of low modulus and high-strength TiNb-based alloys for biomedical applications. J. Mech. Behav. Biomed. Mater. 2017, 65, 866–871. [Google Scholar] [CrossRef] [PubMed]
Figure 1.
Samples’ reference frame.

Figure 2.
XRD spectra for the TNZF alloy in CR microstructural state.

Figure 3.
XRD spectra for the TNZF alloy in CR+ST microstructural state.
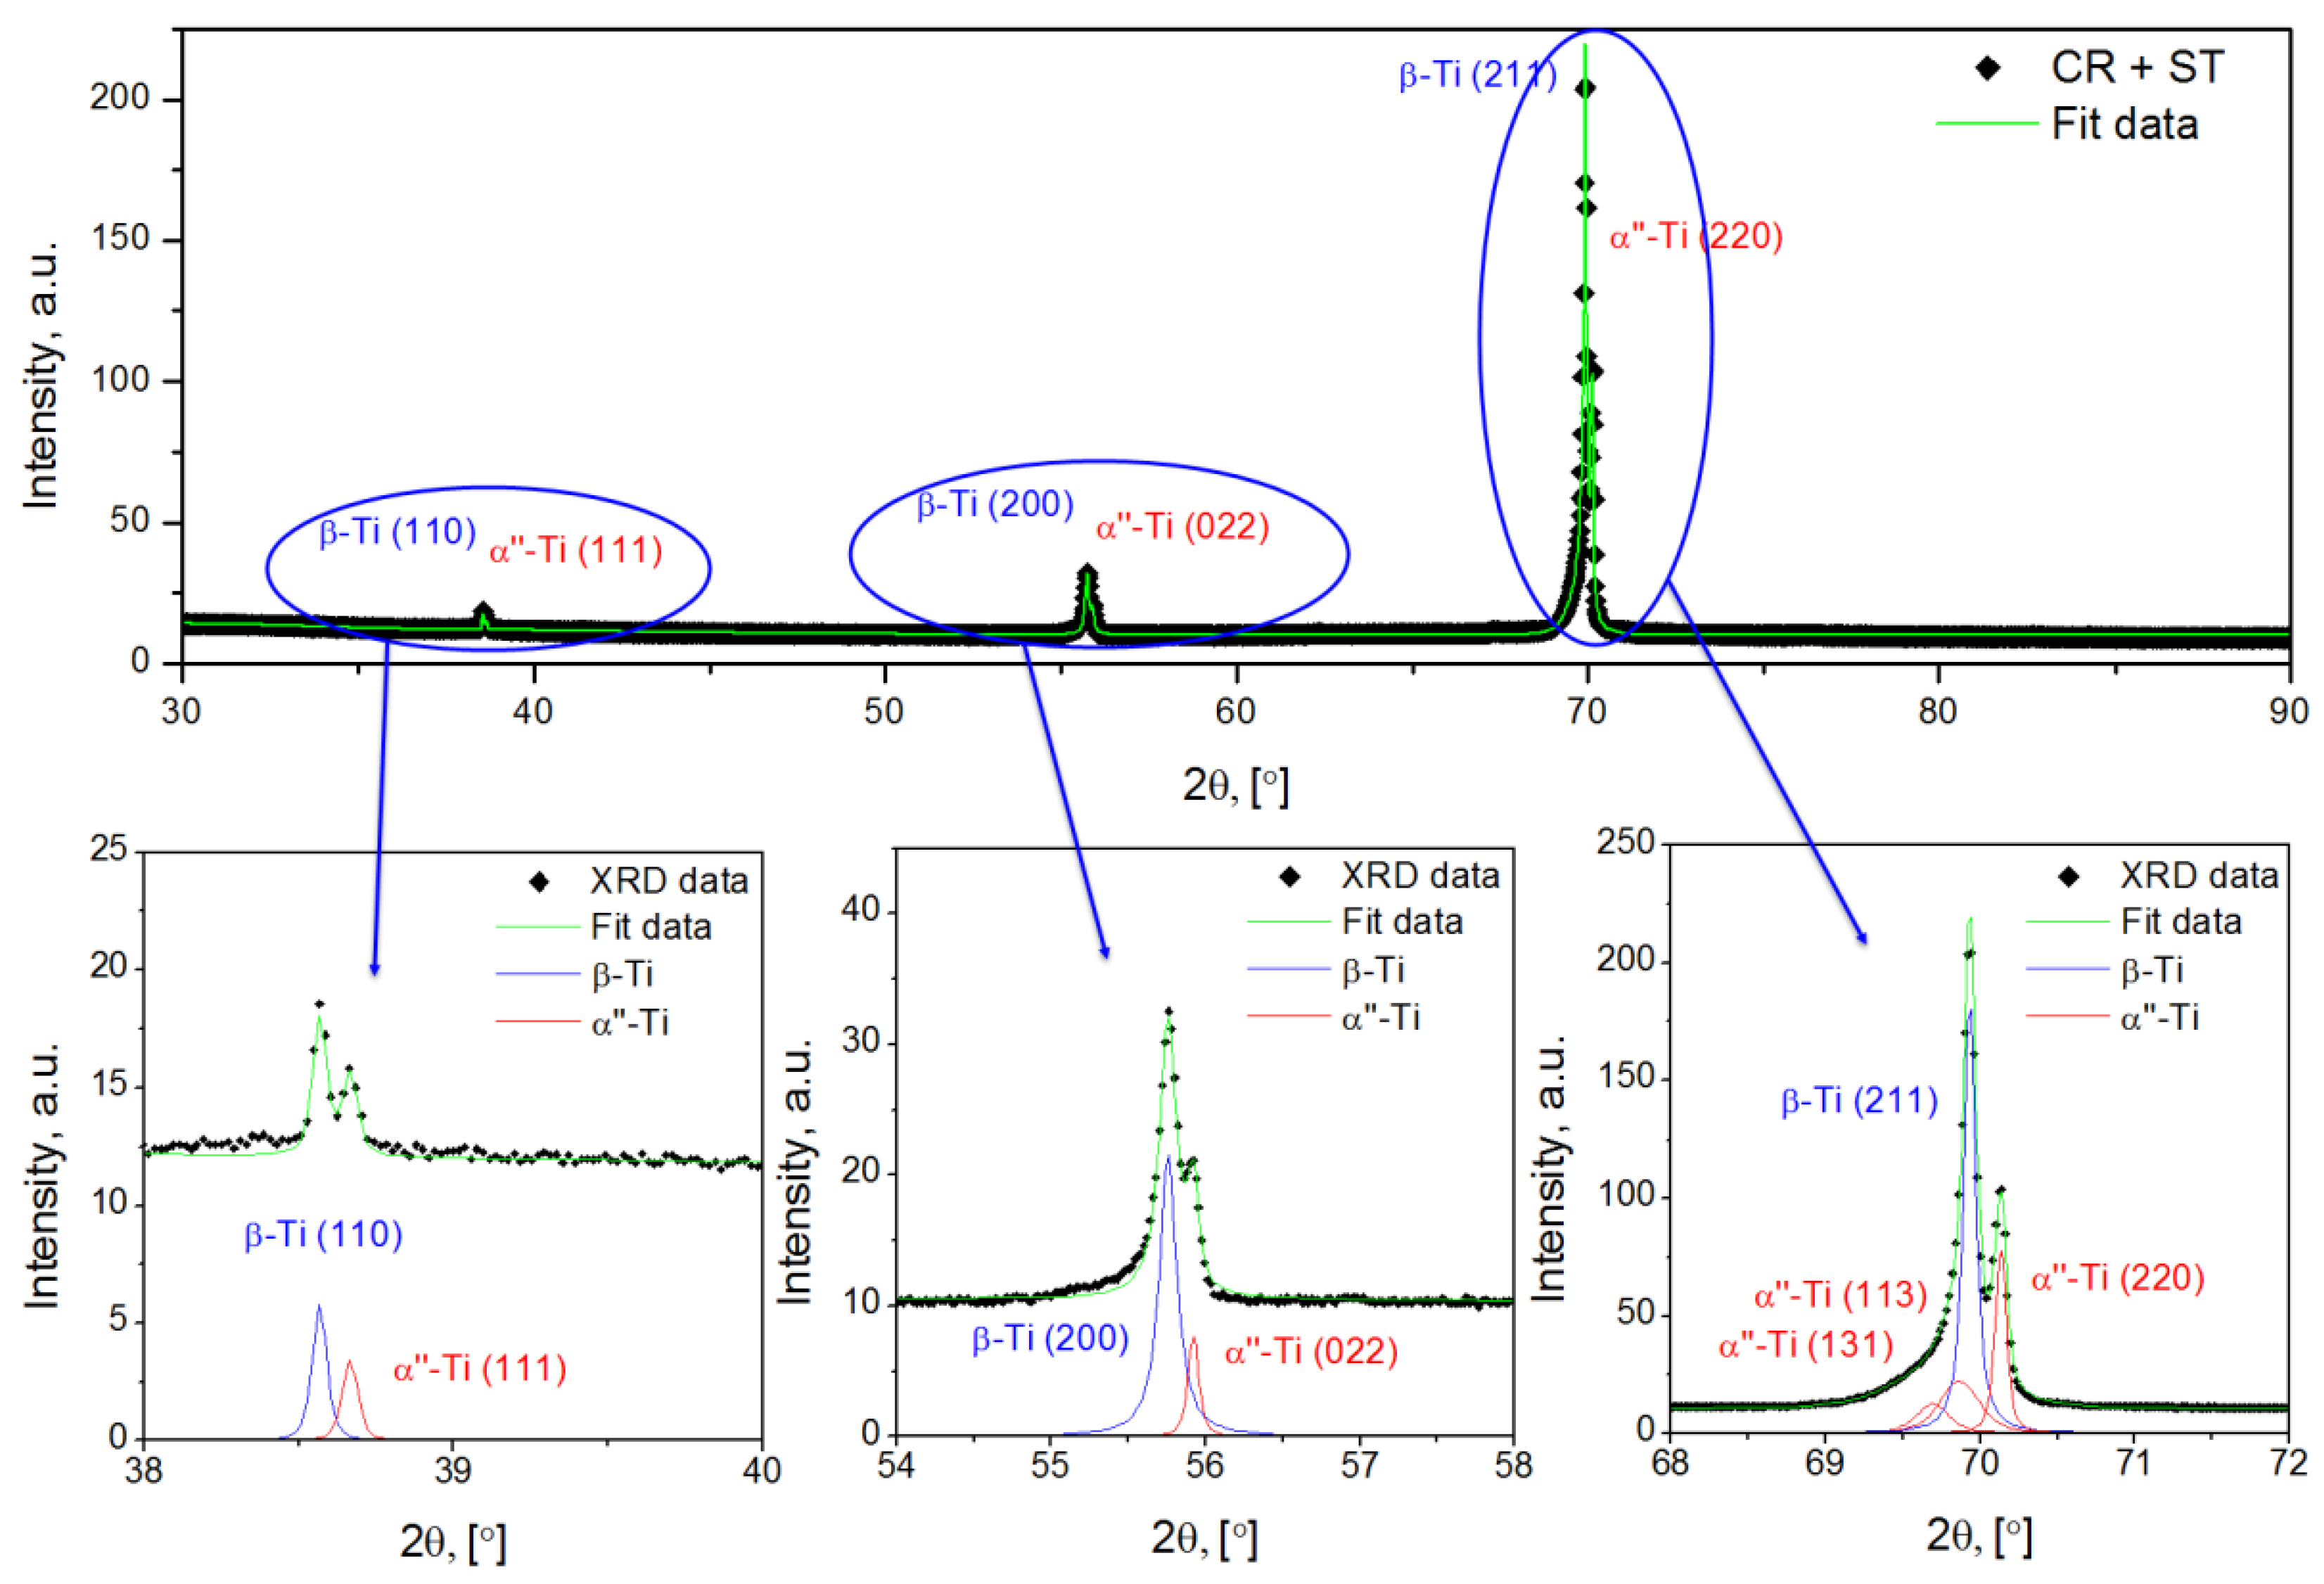
Figure 4.
SEM-EBSD images of TNZF alloy in CR+ST microstructural state (phase map of constituent phases β-Ti and α″-Ti): (a) phase map distribution of both constituent β-Ti and α″-Ti phases; (b) phase map distribution of β-Ti phase; (c) phase map distribution of α″-Ti phase.
Figure 4.
SEM-EBSD images of TNZF alloy in CR+ST microstructural state (phase map of constituent phases β-Ti and α″-Ti): (a) phase map distribution of both constituent β-Ti and α″-Ti phases; (b) phase map distribution of β-Ti phase; (c) phase map distribution of α″-Ti phase.

Figure 5.
SEM micrographs of TNZF alloy in the CR microstructural state: (a) SEM micrograph in the RD–TD sample plane; (b) SEM micrograph in the RD–ND sample plane; (c) zoom area 1 of SEM micrograph in the RD–ND plane; (d) zoom area 2 of SEM micrograph in the RD–ND plane.
Figure 5.
SEM micrographs of TNZF alloy in the CR microstructural state: (a) SEM micrograph in the RD–TD sample plane; (b) SEM micrograph in the RD–ND sample plane; (c) zoom area 1 of SEM micrograph in the RD–ND plane; (d) zoom area 2 of SEM micrograph in the RD–ND plane.

Figure 6.
SEM micrographs of TNZF alloy in the CR+ST microstructural state: (a) SEM micrograph considering the RD–TD sample surface; (b) SEM micrograph considering the RD–ND sample surface; (c) EDS spectra of selected area 1; (d) EDS spectra of selected area 2.
Figure 6.
SEM micrographs of TNZF alloy in the CR+ST microstructural state: (a) SEM micrograph considering the RD–TD sample surface; (b) SEM micrograph considering the RD–ND sample surface; (c) EDS spectra of selected area 1; (d) EDS spectra of selected area 2.

Figure 7.
Engineering stress-strain diagrams of TNZF alloy in CR and CR+ST microstructural states.

Figure 8.
Mechanical properties for the TNZF alloy in CR and CR+ST microstructural states: (a) yield strength; (b) ultimate tensile strength; (c) elongation to fracture; (d) elastic modulus; (e) HV0.1 microhardness.
Figure 8.
Mechanical properties for the TNZF alloy in CR and CR+ST microstructural states: (a) yield strength; (b) ultimate tensile strength; (c) elongation to fracture; (d) elastic modulus; (e) HV0.1 microhardness.


Table 1.
EDS compositional analysis for selected area 1.
| Element | Weight % | Atomic % | Net Int. | Rel. Err. % | K Ratio | Z | R | A | F |
|---|---|---|---|---|---|---|---|---|---|
| ZrL | 6.22 | 3.82 | 430.55 | 4.37 | 0.0528 | 0.9365 | 1.0940 | 0.8830 | 1.0266 |
| NbL | 23.36 | 14.09 | 1675.06 | 2.62 | 0.2042 | 0.9411 | 1.1002 | 0.9119 | 1.0187 |
| TiK | 68.64 | 80.30 | 8303.14 | 2.46 | 0.6142 | 1.0292 | 0.9703 | 0.8550 | 1.0168 |
| FeK | 1.78 | 1.79 | 134.05 | 12.07 | 0.0150 | 1.0246 | 0.9959 | 0.7900 | 1.0425 |
Table 2.
EDS compositional analysis for selected area 2.
| Element | Weight % | Atomic % | Net Int. | Rel. Err. % | K Ratio | Z | R | A | F |
|---|---|---|---|---|---|---|---|---|---|
| ZrL | 5.17 | 3.23 | 337.60 | 4.73 | 0.0441 | 0.9389 | 1.0901 | 0.8857 | 1.0275 |
| NbL | 27.30 | 16.74 | 1853.70 | 2.36 | 0.2409 | 0.9435 | 1.0964 | 0.9189 | 1.0175 |
| TiK | 65.90 | 78.37 | 7392.17 | 2.61 | 0.5824 | 1.0320 | 0.9673 | 0.8421 | 1.0170 |
| FeK | 1.63 | 1.66 | 115.75 | 13.22 | 0.0138 | 1.0276 | 0.9930 | 0.7914 | 1.0434 |
© 2018 by the authors. Licensee MDPI, Basel, Switzerland. This article is an open access article distributed under the terms and conditions of the Creative Commons Attribution (CC BY) license (http://creativecommons.org/licenses/by/4.0/).
Share and Cite
MDPI and ACS Style
Cojocaru, V.D.; Șerban, N. Effects of Solution Treating on Microstructural and Mechanical Properties of a Heavily Deformed New Biocompatible Ti–Nb–Zr–Fe Alloy. Metals 2018, 8, 297. https://doi.org/10.3390/met8050297
AMA Style
Cojocaru VD, Șerban N. Effects of Solution Treating on Microstructural and Mechanical Properties of a Heavily Deformed New Biocompatible Ti–Nb–Zr–Fe Alloy. Metals. 2018; 8(5):297. https://doi.org/10.3390/met8050297
Chicago/Turabian StyleCojocaru, Vasile Dănuț, and Nicolae Șerban. 2018. "Effects of Solution Treating on Microstructural and Mechanical Properties of a Heavily Deformed New Biocompatible Ti–Nb–Zr–Fe Alloy" Metals 8, no. 5: 297. https://doi.org/10.3390/met8050297
Note that from the first issue of 2016, this journal uses article numbers instead of page numbers. See further details here.