Numerically Based Phase Transformation Maps for Dissimilar Aluminum Alloys Joined by Friction Stir-Welding
by
 , , ,
, , ,
Carter Hamilton
1,* ,
,
Stanisław Dymek
2,
Mateusz Kopyściański
2,
Aleksandra Węglowska
3 and
Adam Pietras
3 1
Department of Mechanical and Manufacturing Engineering, College of Engineering and Computing, Miami University, Oxford, OH 45056, USA
2
Faculty of Metal Engineering and Industrial Computer Science, AGH University of Science and Technology, 30-059 Krakow, Poland
3
Department of the Testing of Materials Weldability and Welded Construction, Institute of Welding, 44-100 Gliwice, Poland
*
Author to whom correspondence should be addressed.
Metals 2018, 8(5), 324; https://doi.org/10.3390/met8050324
Submission received: 31 March 2018
/
Revised: 30 April 2018
/
Accepted: 4 May 2018
/
Published: 8 May 2018
(This article belongs to the Special Issue Phase Transformations in Alloy Processing)
Abstract
:Sheets of aluminum 2017A-T451 and 7075-T651 were friction stir-welded in a butt-weld configuration. An existing computational model of the welding process for temperature distribution and material flow was adapted to estimate the phase transformations that occur across the weld zone. Near the weld center, process temperatures are sufficient to fully dissolve the equilibrium η phase in 7075 and partially dissolve the equilibrium S phase in 2017A. Upon cooling, Guinier–Preston (GP) and Guinier–Preston–Bagaryatsky (GPB) zones re-precipitate, and hardness recovers. Due to the more complete dissolution of the equilibrium phase in 7075, the hardness recovery skews toward whichever side of the weld, i.e., the advancing or retreating side, represents the 7075 workpiece. Phase transformation maps generated by the numerical simulation align not only with the hardness profiles taken across the weld zone, but also with positron lifetimes obtained through positron annihilation lifetime spectroscopy (PALS). Boundaries between the aluminum matrix and the secondary phases provide open volumes to trap positrons; therefore, positron lifetimes across the weld correspond with the phase transformations that occur in 7075 and 2017A during processing.
1. Introduction
Friction stir-welding (FSW) is now a common technique utilized to join metallic materials and produce high-quality welds. Since the friction stir-welding process takes place at lower temperatures than traditional welding methods, i.e., below the melting and solidus temperatures of the alloys, FSW generally circumvents the detrimental effects that can arise from melting and re-solidification. Kumar et al. [1] and Mishra et al. [2,3] have published a book series on friction stir-welding/processing that thoroughly details the current state of knowledge for this technology. Despite being a mature technology, however, the majority of FSW research and development efforts have studied the production of single-alloy welds [4,5]. Yet numerous manufacturing sectors, such as the aerospace and automotive industries, require dissimilar-metal welds in order to produce structures that are lightweight and mechanically sound. Common materials for these structures are aluminum alloys from the 2xxx and 7xxx series, which are classified as “non-weldable” with traditional fusion methods. In contrast, because joining occurs in solid-state, FSW mitigates the chemical and mechanical incompatibilities between dissimilar metals that typically degrade weld quality during traditional processes.
DebRoy et al. [6] and Murr [7] provide comprehensive literature surveys regarding the friction stir-welding of dissimilar alloys, and Kumar et al. [1] recently reviewed the current state of knowledge regarding this topic. Due to tool rotation and forward translation, FSW is an inherently asymmetric process relative to the workpieces. On the advancing side of the weld, tool rotation and forward translation are aligned, but on the retreating side, tool rotation and forward translation are opposed. Not surprisingly, material flow and temperature distribution during friction stir-welding are also asymmetric. When welding dissimilar materials, the asymmetric character of the process is compounded by the discontinuity in material properties across the weld zone. In fact, the placement of the alloys on either the advancing or retreating sides significantly influences the final weld properties. As noted by Ma et al. [8] in their review of friction stir-welding and processing in aluminum alloys, the theoretical prediction of heat generation, material flow and mechanical properties in dissimilar friction stir-welding is challenging.
The temperature distribution, material flow and secondary phase transformations during FSW of dissimilar alloys are critical to the overall quality and mechanical performance of the dissimilar-alloy joint. Hamilton et al. [9] investigated the welding of 2017A-T4 and 7075-T6 and successfully developed a numerical simulation of the process to predict material flow and temperature distribution during welding. In addition to mapping the hardness behavior across the weld, they further characterized the weld through positron annihilation spectroscopy (PALS) [10]. The researchers demonstrated that positron lifetimes correlate with the hardness trends across the weld zone and with the microstructural characteristics of the weld. The interphase boundaries between secondary phases and the aluminum matrix provide open volumes that trap positrons. Because the interphase boundaries have a lower electron density than the crystal lattice, a positron trapped within a boundary has a longer lifetime than one trapped in the bulk. Even though many investigations of FSW welds concentrate just on the weld center and its vicinity, their research clearly demonstrated that variations related to phase transformations also occur at larger distances from the weld center (up to 40 mm).
Hamilton et al. [10] aligned the temperature distribution predicted by the model with the known phase transformation temperatures in the two alloys (from differential scanning calorimetry) to explain the positron lifetime and hardness curves across the weld. The simulation itself, however, could not directly predict the phase transformations occurring in 2017A and 7075 during processing. The goal of the present study, therefore, is to adapt the computational model developed for the FSW of 2017A-T451 and 7075-T651 such that it can generate maps of the phase transformations that occur in the alloys during welding. These maps can then facilitate the analysis of positron spectra and hardness data and their correlation with the microstructural characteristics of the weld.
2. Materials and Methods
The Instytut Spawalnictwa (Institute of Welding) in Gliwice, Poland, friction stir-welded the aluminum 2017A-T451 and 7075-T651 sheets utilizing a conventional milling machine modified for the FSW process. The workpiece dimensions for both alloys were 250 mm in length, 100 mm in width and 6 mm in thickness. The FSW tool (HS6-5-2 high-speed steel) had a 24 mm diameter, scrolled shoulder with a 2.5 mm pitch. The threaded pin (3 mm pitch) tapered linearly from a 6 mm diameter at the shoulder to a 4.5 mm diameter at the tip with an overall height of 5.7 mm. The tool tilt angle of 1.5° remained constant during processing. The rotational speed, ω, and tool velocity, uw, were 355 rev min−1 and 112 mm min−1, respectively, and the applied force during processing was set to 32.8 kN. The Instytut produced two butt-weld configurations: (1) 2017A on the advancing side and 7075 on the retreating side (AS 2017A/RS 7075), and (2) 7075 on the advancing side and 2017A on the retreating side (AS 7075/RS 2017A). St. Węglowski et al. [11,12] discuss in detail the capabilities of the FSW equipment, such as force, torque and temperature measurement.
Sections perpendicular to the welding direction were excised from the welds and examined by light microscopy utilizing polarized light on a Zeiss Axio Imager M1m light microscope. Representative micrographs of the two weld configurations are presented in Figure 1 with the characteristic zones of friction stir-welding indicated, i.e., the nugget (or stir zone), the thermo-mechanically affected zone (TMAZ), and the heat-affected zone (HAZ). Discs (3 mm diameter) were also excised from the baseline alloys to obtain differential scanning calorimetry (DSC) traces to indicate the phase transformation temperatures characteristic to the two alloys. These traces associated with the baseline materials are shown in Figure 2. Straumal et al. [13], however, demonstrated that the grain size in Al–Zn–Mg alloys, such as the 7075 studied here, can influence the heat flow during DSC, i.e., the shape and position of peaks, particularly in or near the melt state due to the wetting angle between the liquid and the grain boundary. Moreover, these same researchers found that the solidus temperature in severely deformed nano-grained Al–Zn alloys can shift to lower temperatures depending on the extent of deformation and grain size [14]. Friction stir-welding certainly introduces thermo-mechanical deformation into the microstructure and produces a distribution of grain sizes across the weld zones suggesting that the process could influence the heat flow data obtained from DSC analysis as suggested by Straumal. However, these influences in Al–Zn alloys are most pronounced above 773 K, while the maximum welding temperatures presented by Hamilton et al. [9] for 7075 (and 2017A) are below 773 K. For this reason, the DSC traces from the baseline material are reasonable representations of the phase transformation characteristics across the process zones.
Positron lifetime spectra were obtained with a conventional fast-fast spectrometer equipped with BaF2 scintillators and a time resolution of 280 ps in full width at half maximum (FWHM). Two identical specimens were excised from each welding variant in the form of rods, and a 30-µCi activity positron source containing the 22Na isotope encapsulated in a thin Kapton foil (7 μm) was placed between them. Since the diameter of an area emitting positrons was approximately 5 mm, the positron source was moved by 5 mm along the centerline for consecutive PALS measurements. Positron spectra were captured up to 40 mm from the weld center on the advancing and retreating sides. Hamilton et al. [10] discuss in greater depth the specifics of the PALS method, such as signal detection, energy quanta and signal deconvolution. Additional information regarding the processing and analysis of positron spectra is presented by Krause-Rehberg et al. [15] and by Kansy [16].
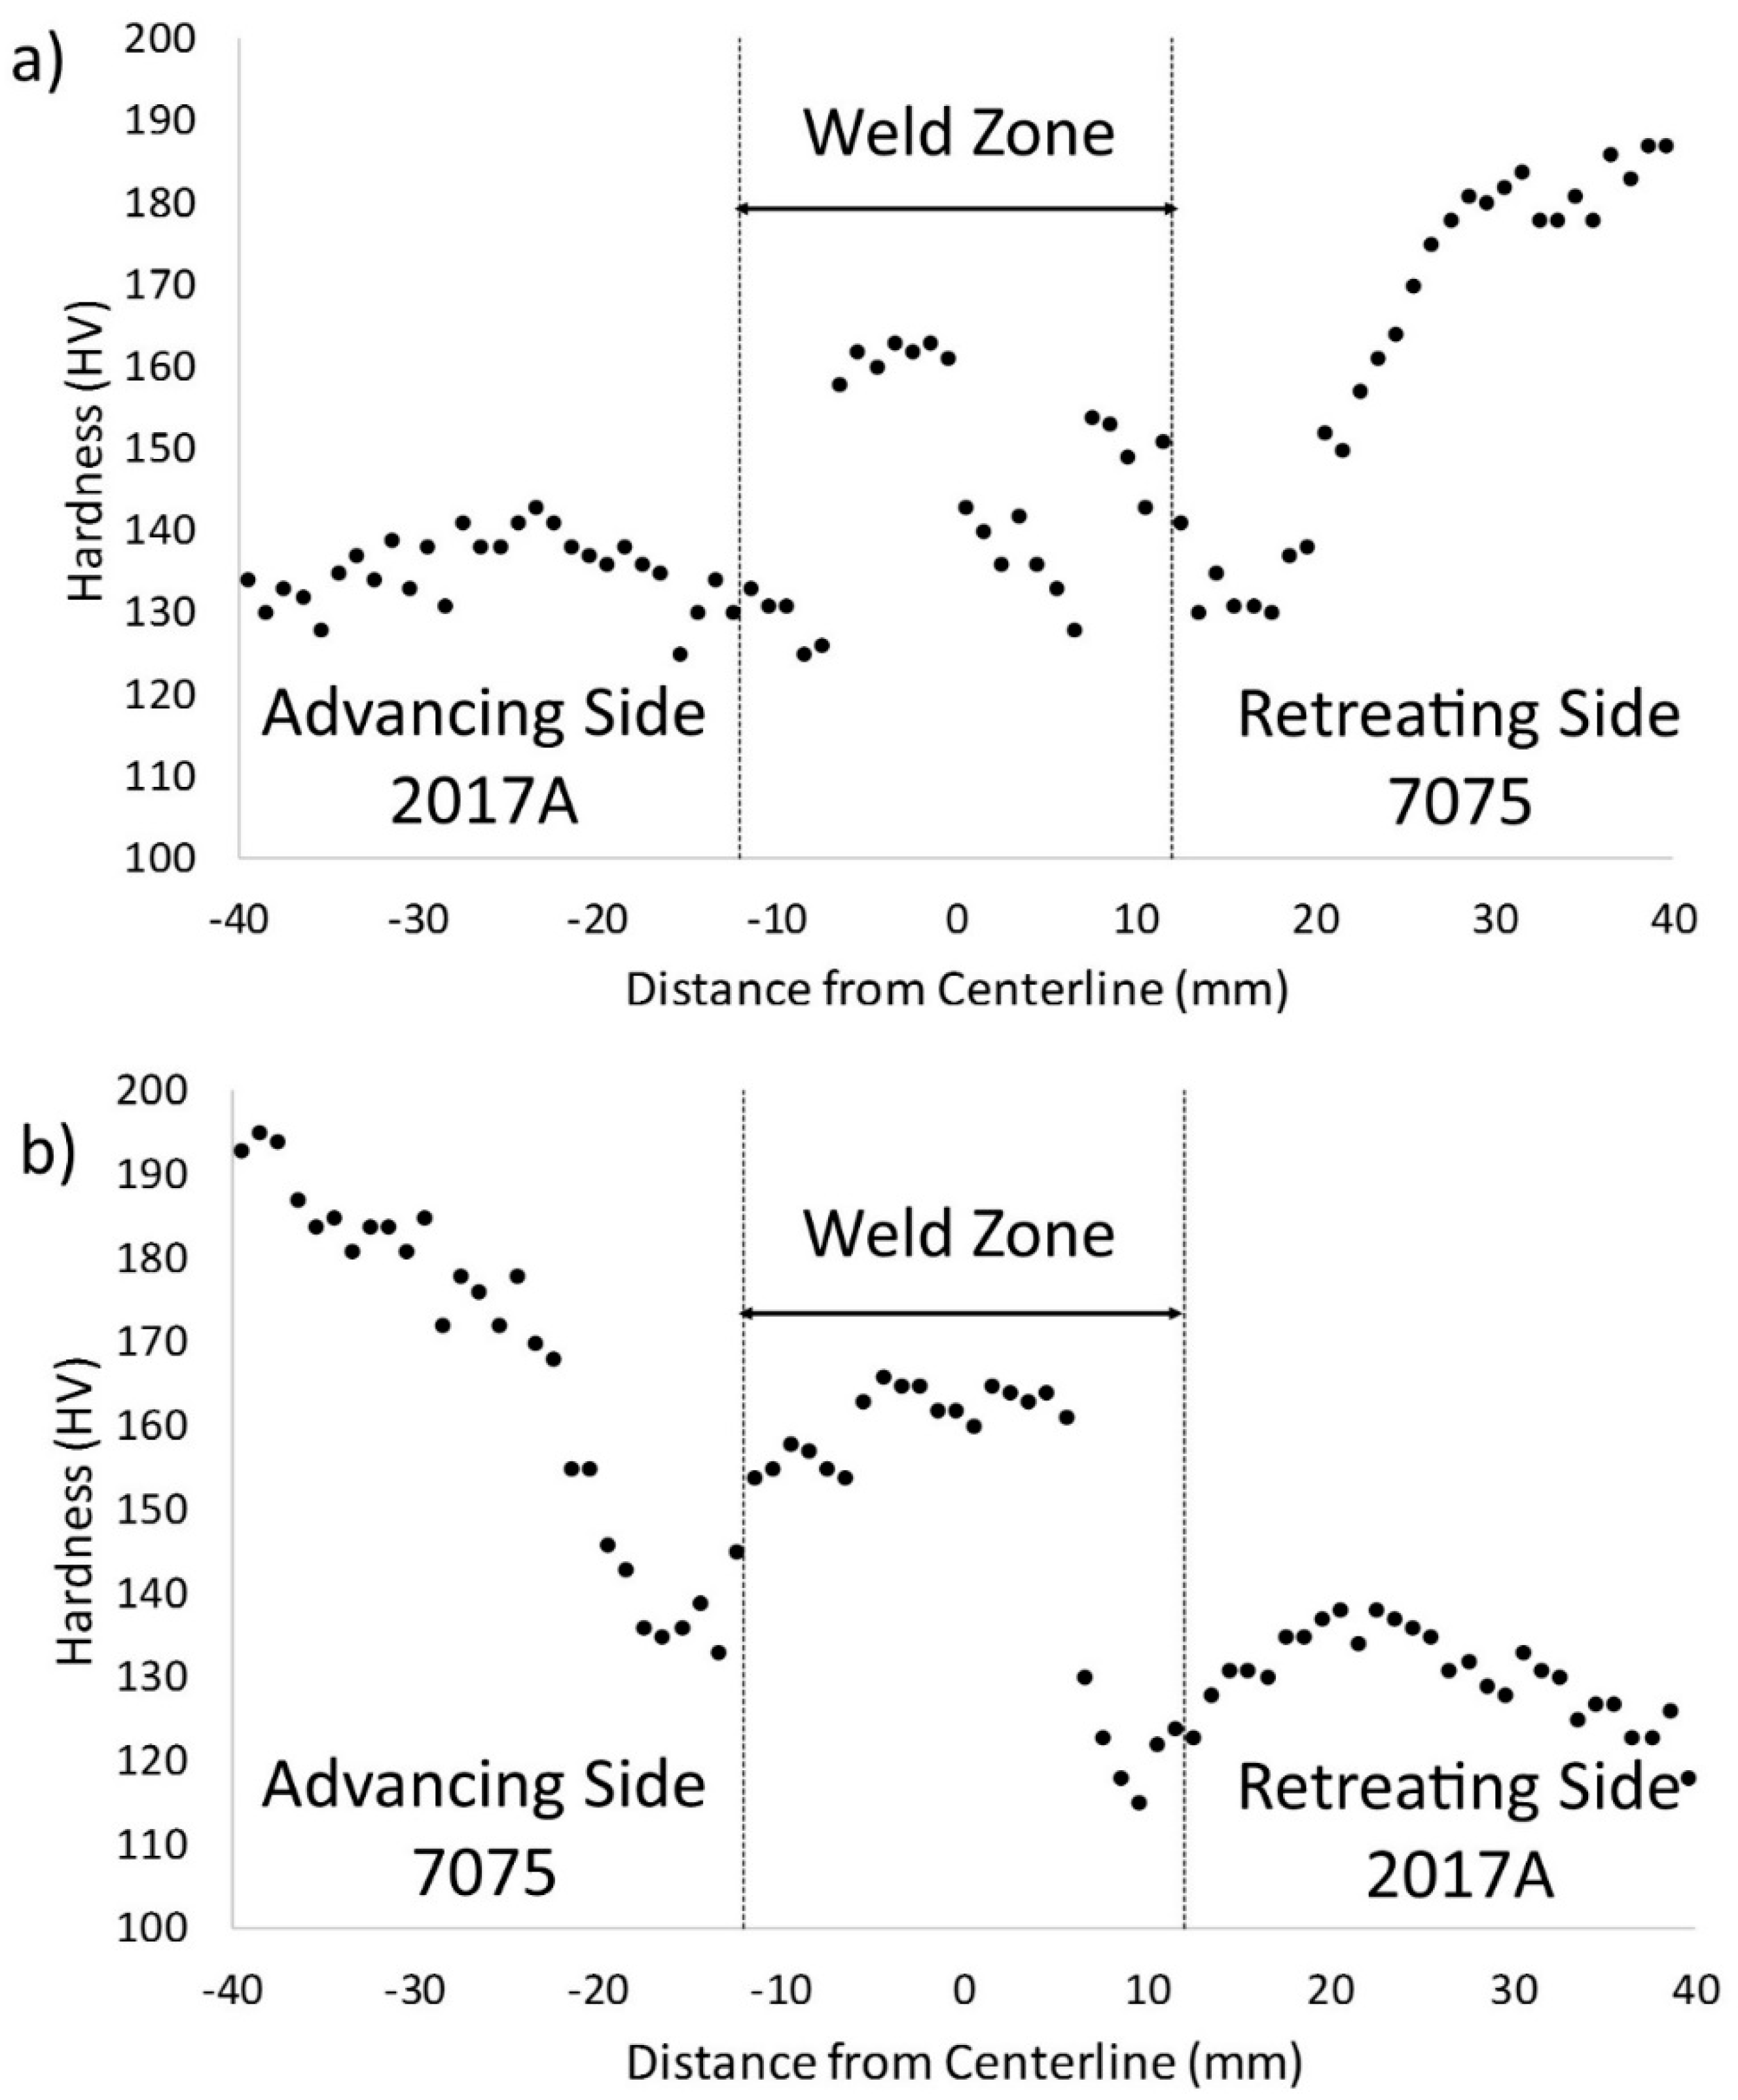
Hardness measurements (Vickers) were performed on the same sections as the metallographic/PALS studies using a Wolpert-Wilson Tukon 2500 apparatus. These measurements enabled the construction of the hardness profile along the line of the mid-thickness plane across the cross-section of the weld. The applied load was 1 kg, and the distance between test points was 1.0 mm. The hardness profiles of the welds across the weld zone and into the heat-affected zones of the base materials (up to 40 mm) are shown in Figure 3 (each point represents a single hardness measurement made at the 1.0 mm intervals). The shape of the profiles was similar for both configurations, resembling the W-contour that is typical for all heat-treatable aluminum alloys [5]. It should be noted, however, that the construction of hardness maps, as well as PALS analysis, were performed about three years after welding, i.e., after natural aging, which can substantially alter the shape of the hardness profiles [17].
3. Results and Discussion
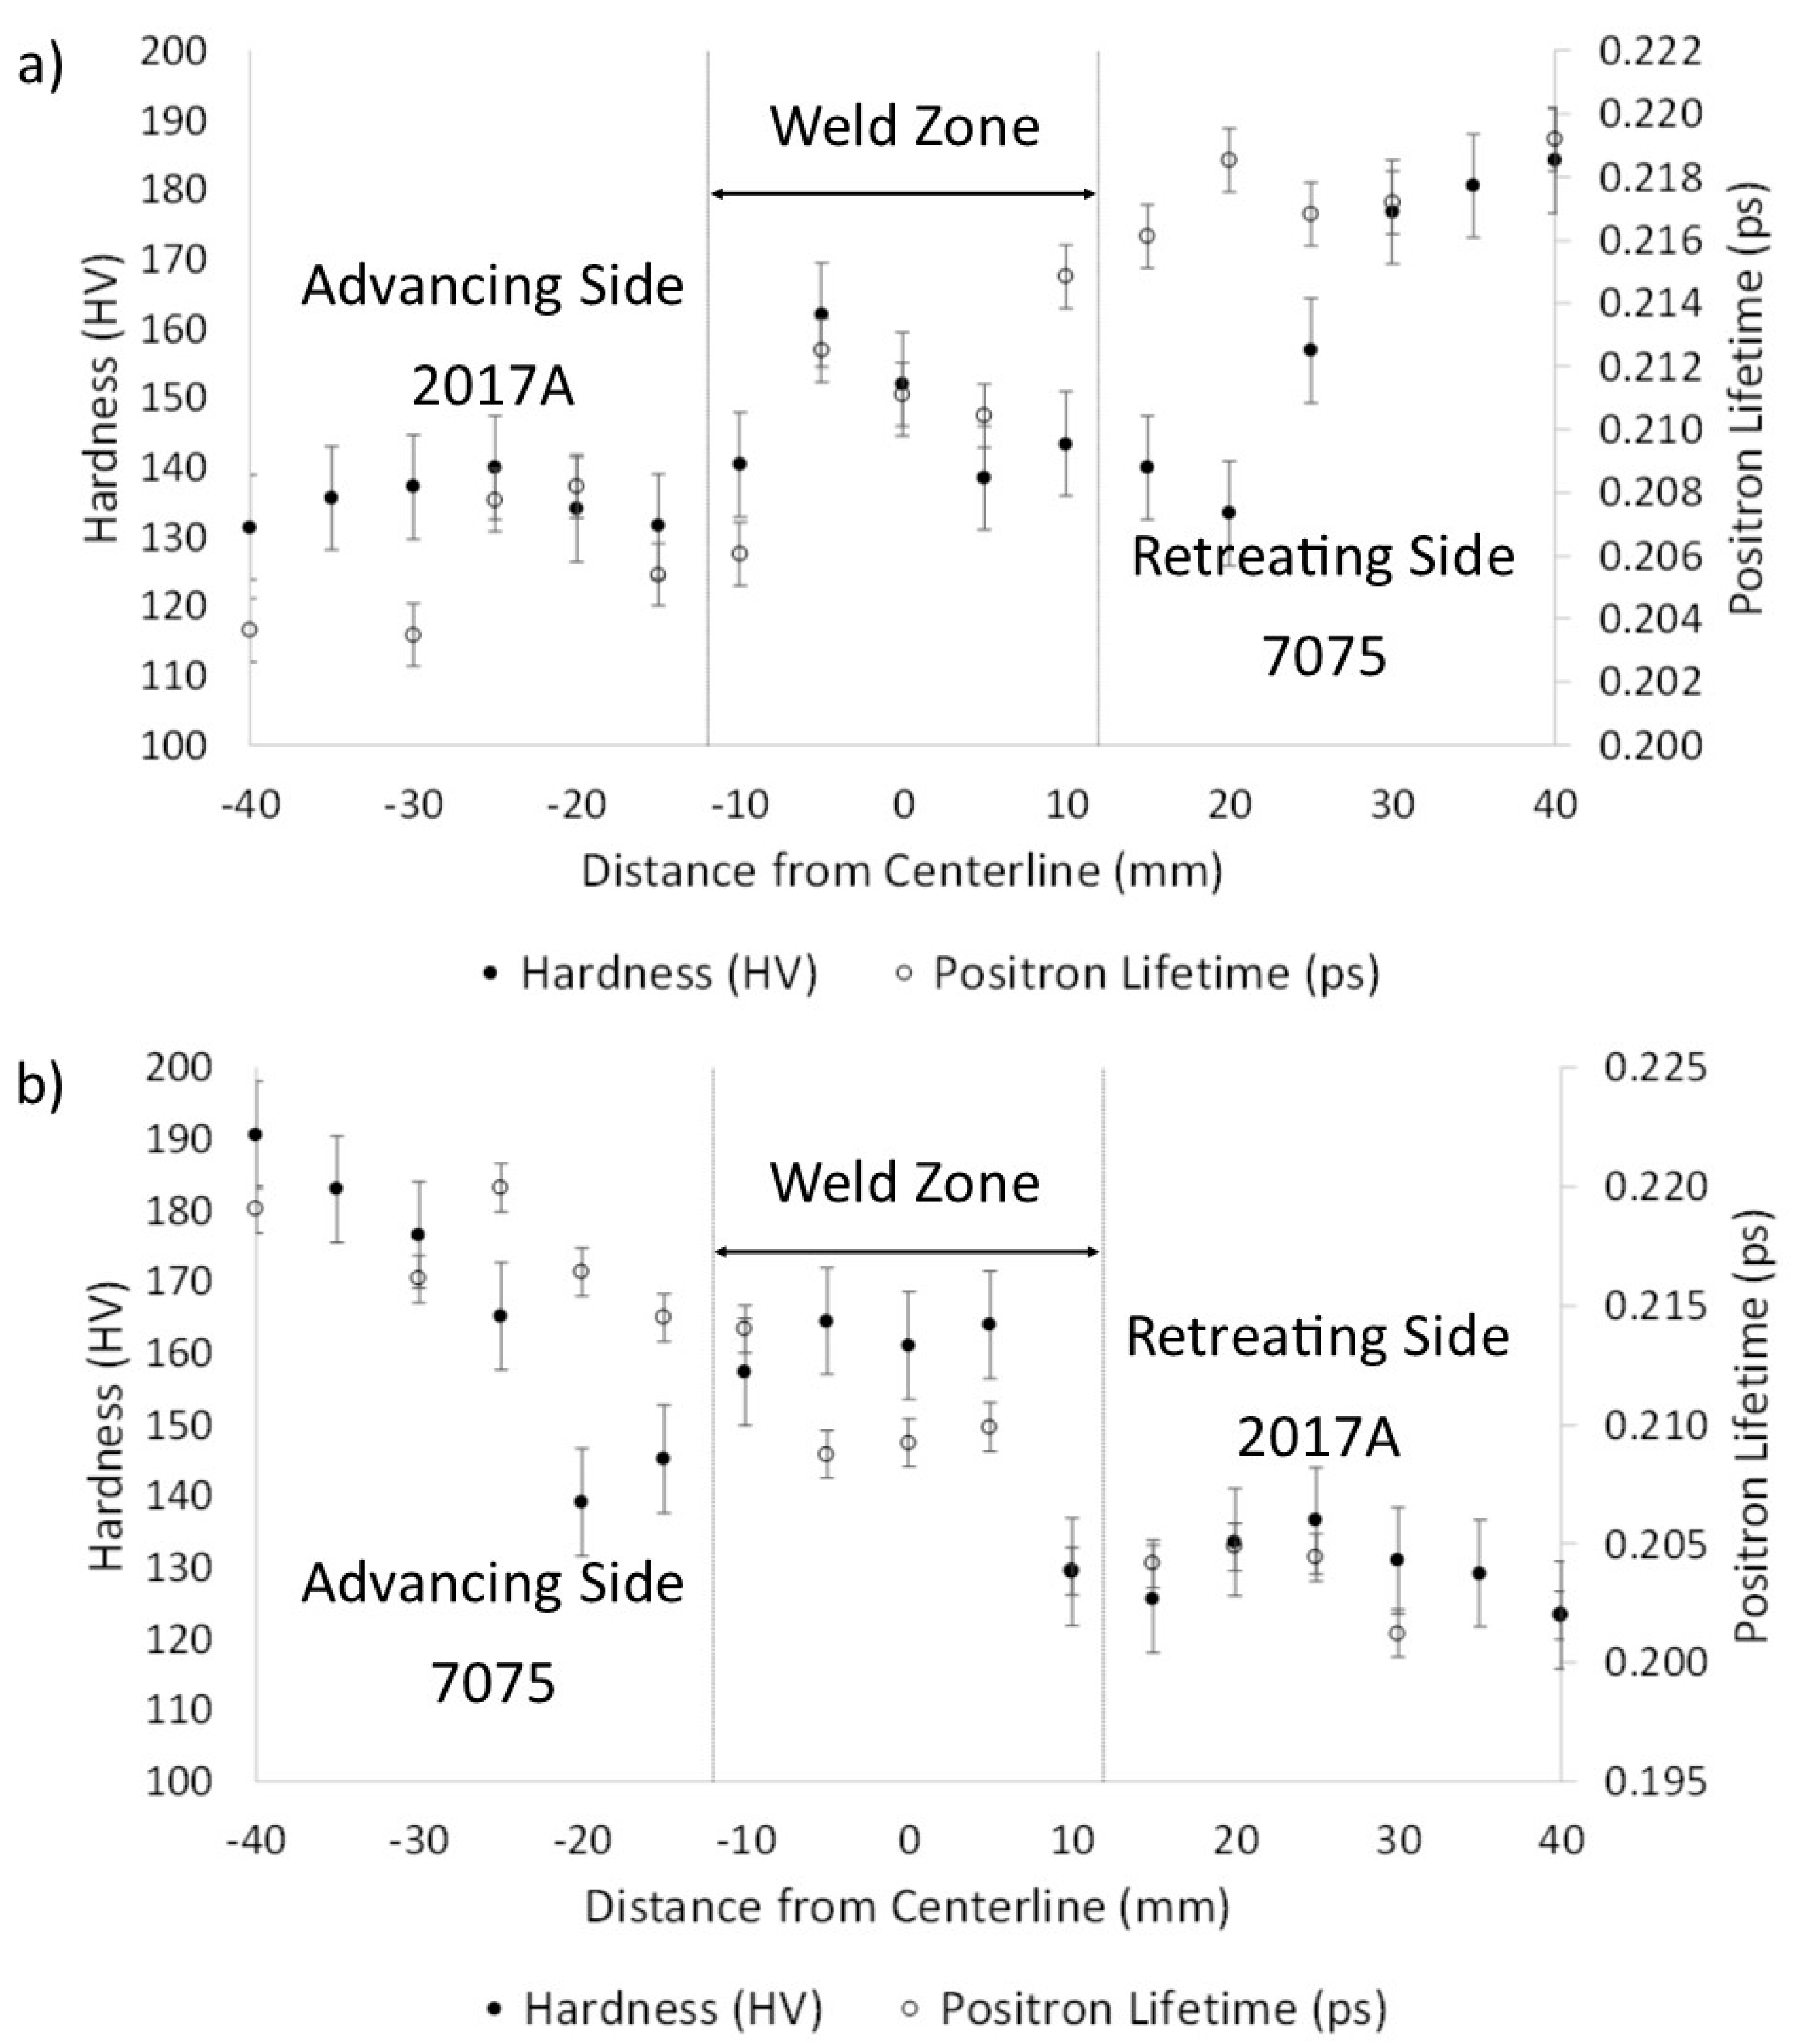
Figure 4 presents the hardness data from Figure 3, but averaged from a 5 × 5 mm area (five hardness measurements) to best approximate the 5 mm-diameter sampling area of the positron probe from which the lifetimes are determined. The hardness data is then superimposed on the positron lifetime curves to display the relationship between these two parameters. Although the correlation between hardness and positron lifetime is not one-to-one (for example, there is a divergence between the two parameters just outside of the weld zone on the retreating side for the AS 2017A/RS 7075 configuration), overall, hardness and positron lifetime follow similar trends across the weld zones. Hamilton et al. [10] thoroughly discuss the association between these parameters for 2017A/7075 weldments and the correlation of these parameters with the microstructural characteristics of the welds. For example, positron lifetimes across the weld revealed local maxima and minima that correlated with the secondary phases in these areas and, therefore, with the hardness. Interphase boundaries between the aluminum matrix and secondary phases create open volumes that can trap positrons, thus sensitizing positron lifetimes to the volume fraction of interphase boundaries and, like hardness, accentuate variations in secondary phase size, density and distribution [18,19]. By comparing the predicted temperature distribution (provided by the temperature/flow simulation developed for 2017A/7075 weldments in [9]) against the precipitation/dissolution temperatures of the two alloys, Hamilton et al. [10] could rationalize the variations in positron lifetime and hardness across the weld zone. Clearly, changes in positron lifetime and hardness due to secondary phase transformations extend beyond the primary weld zone, even up to distances of 40 mm from the weld center.
The simulation that was utilized only predicted the temperature distribution and, therefore, did not provide direct phase transformation data in the alloys that could underscore the trends in positron lifetime and hardness across the weld zone. To that end, the computational model developed by Hamilton et al. [10] for 2017A/7075 weldments was adapted to map the degree of phase transformations occurring in the two alloys and, therefore, to correlate the phase transformations in the microstructure with the hardness profiles and positron lifetimes. Effectively, the precipitation/dissolution peaks revealed in the DSC curves for 7075 and 2017A are each modeled as a temperature-dependent step function with the “width” of the step corresponding to the width of the DSC peak. For example, the DSC curve for 7075 shows that the η phase precipitates at ~508 K with the peak width beginning at ~490 K and ending at ~530 K. Within the simulation, a corresponding step function centered at 508 K models the transition from one state of transformation, i.e., no η phase in this example, beginning at 490 K to a second state of complete transformation at 530K, i.e., η phase precipitated throughout the aluminum matrix. Integrating the DSC data into the simulation, therefore, facilitates the creation of phase transformation maps based upon the temperature distribution in the workpieces and across the weld zone.
Figure 5 shows a representative phase transformation map for 7075 when placed on the advancing side for a plane located just below the weld surface (~1 mm). As seen in the figure, along a reference line located across the surface just behind the tool pinhole, the weld temperatures dissolve the Guinier–Preston (GP) zones in the heat-affected zone between ~40 mm and 45 mm away from the weld center. Still in the heat-affected zone, but progressing closer to the weld zone along the reference line, the η’ phase (between ~35 mm and ~40 mm from the centerline) and then the η phase precipitate and ripen (between 12 mm and ~35 mm from the centerline). The phase transformation within the weld zone is dominated by a region of supersaturated 7075 around the FSW tool, i.e., the weld temperatures exceed the solution heat treatment of the alloy. The supersaturated region extends ~6 mm in a ring from the pin/workpiece interface. 7075 does not readily naturally age, and, upon cooling, supersaturated material tends to remain in that condition immediately after welding. However, with sufficient time, fine GP zones will form and promote a recovery in hardness in this area. With that in mind, it is again mentioned that hardness measurements and PALS analysis were performed three years after welding.
Interestingly, Santos et al. [20] utilized electrical conductivity to map the precipitate distribution across friction stir welds of 7075-T6 and revealed an inverse correlation between the hardness and electrical conductivity. They also demonstrated that in 7075 the welding temperatures can be sufficient to dissolve secondary phases in the matrix, i.e., the η’ and η phases, but also noted that grain refinement in the stir zone due to dynamic recrystallization can contribute to a hardness recovery in this process zone. Consistent with the observations presented here, Dumont et al. [21] noted that in friction stir-welds of 7449, hardness recovery in the stir zone occurs with natural aging and the precipitation of GP zones [8].
Figure 6 shows a representative phase transformation map for 2017A when placed on the retreating side on the same plane located just below the weld surface (~1 mm). Along the same reference line located behind the tool pinhole, the weld temperatures precipitate and ripen the S’ phase in the 2017A between ~25 mm and 45 mm away from the weld center. Between ~18 mm and ~25 mm from the center in the heat-affected zone the S phase precipitates and then ripens in the region closer to the weld zone (between 12 mm and ~18 mm from the centerline). Within the weld zone, the S phase continues to ripen, and in a region around the pinhole (~2 mm ring around the pin/workpiece interface), partial saturation of the alloy occurs. Upon cooling, Guinier–Preston–Bagaryatsky (GPB) zones will precipitate in the 2017A as a part of the natural aging process promoting hardness recovery in this area. These observations are consistent with those of Genevois et al. [8,22]. Genevois concluded that temperatures within the stir zone of 2024 friction stir-welds produce a small fraction of coarse S and S’ phases and a higher level of solute. As such, GPB zones nucleate upon cooling after welding and promote a recovery in hardness.
Figure 7 presents the phase transformation maps for the AS 2017A/RS 7075 weld configuration overlaid on the positron lifetime/hardness curves from Figure 4. Again, a reference line is taken behind the FSW tool akin to the location where positron spectra would have been collected and hardness measurements made after welding. The phase transformation boundaries along the reference line are indicated on the maps and extended to the lifetime/hardness curves to highlight the regions of different microstructural characteristics. Within the weld zone, extending to ~9 mm on the advancing side (2017A) and ~10 mm on the retreating side (7075) is a region of partial saturation for 2017A and full saturation for 7075. As such, upon cooling and with time, hardness recovery will occur as the GPB zones form in 2017A and GP zones in 7075. Since 2017A more readily naturally ages than 7075, the across recovery will be more pronounced on the advancing side of the weld, as indeed shown in the figure. However, because the dissolution temperature for the η phase in 7075 (~700 K) is lower than that of the S phase in 2017A (~725 K), the saturation region extends farther into the 7075, i.e., the RS, than it extends in the 2017A, i.e., the AS. The hardness recovery zone, therefore, appears shifted toward the retreating side of the weld.
Still within the weld zone, but outside of the saturation region (~9 mm to 12 mm on the AS and ~10 mm to 12 mm on the RS) are areas of equilibrium phase ripening. In 2017A, the S phase ripens due to the processing temperatures, thus promoting a distinctly lower hardness in this band of the weld zone. Similarly, the η phase ripens in the 7075, also promoting a declining trend in hardness into the heat-affected zone on that side of the weld. The local trends in hardness also correspond to the local trends in positron lifetime. Lifetime values decrease due to the ripening of strengthening phases and a corresponding reduction in the volume fraction of interphase boundaries. The ripening areas continue outside the weld zone by up to ~22 mm on the AS and ~25 mm on the RS with hardness values lower than those in the nugget region of the weld.
Between ~22 mm and ~25 mm on the advancing side, a narrow region corresponds to the precipitation of the S phase in 2017A, and the local hardness increases. Likewise, between ~25 mm and ~28 mm on the retreating side, a narrow band indicates the precipitation of the equilibrium η phase in 7075, and the local hardness noticeably rises in this area. Outside these regions, the non-equilibrium phases dominate, and progressing away from the weld center, the hardness moves toward the baseline values in each of the alloys, ~130 HV for 2017A-T4 and ~190 HV for 7075-T6.
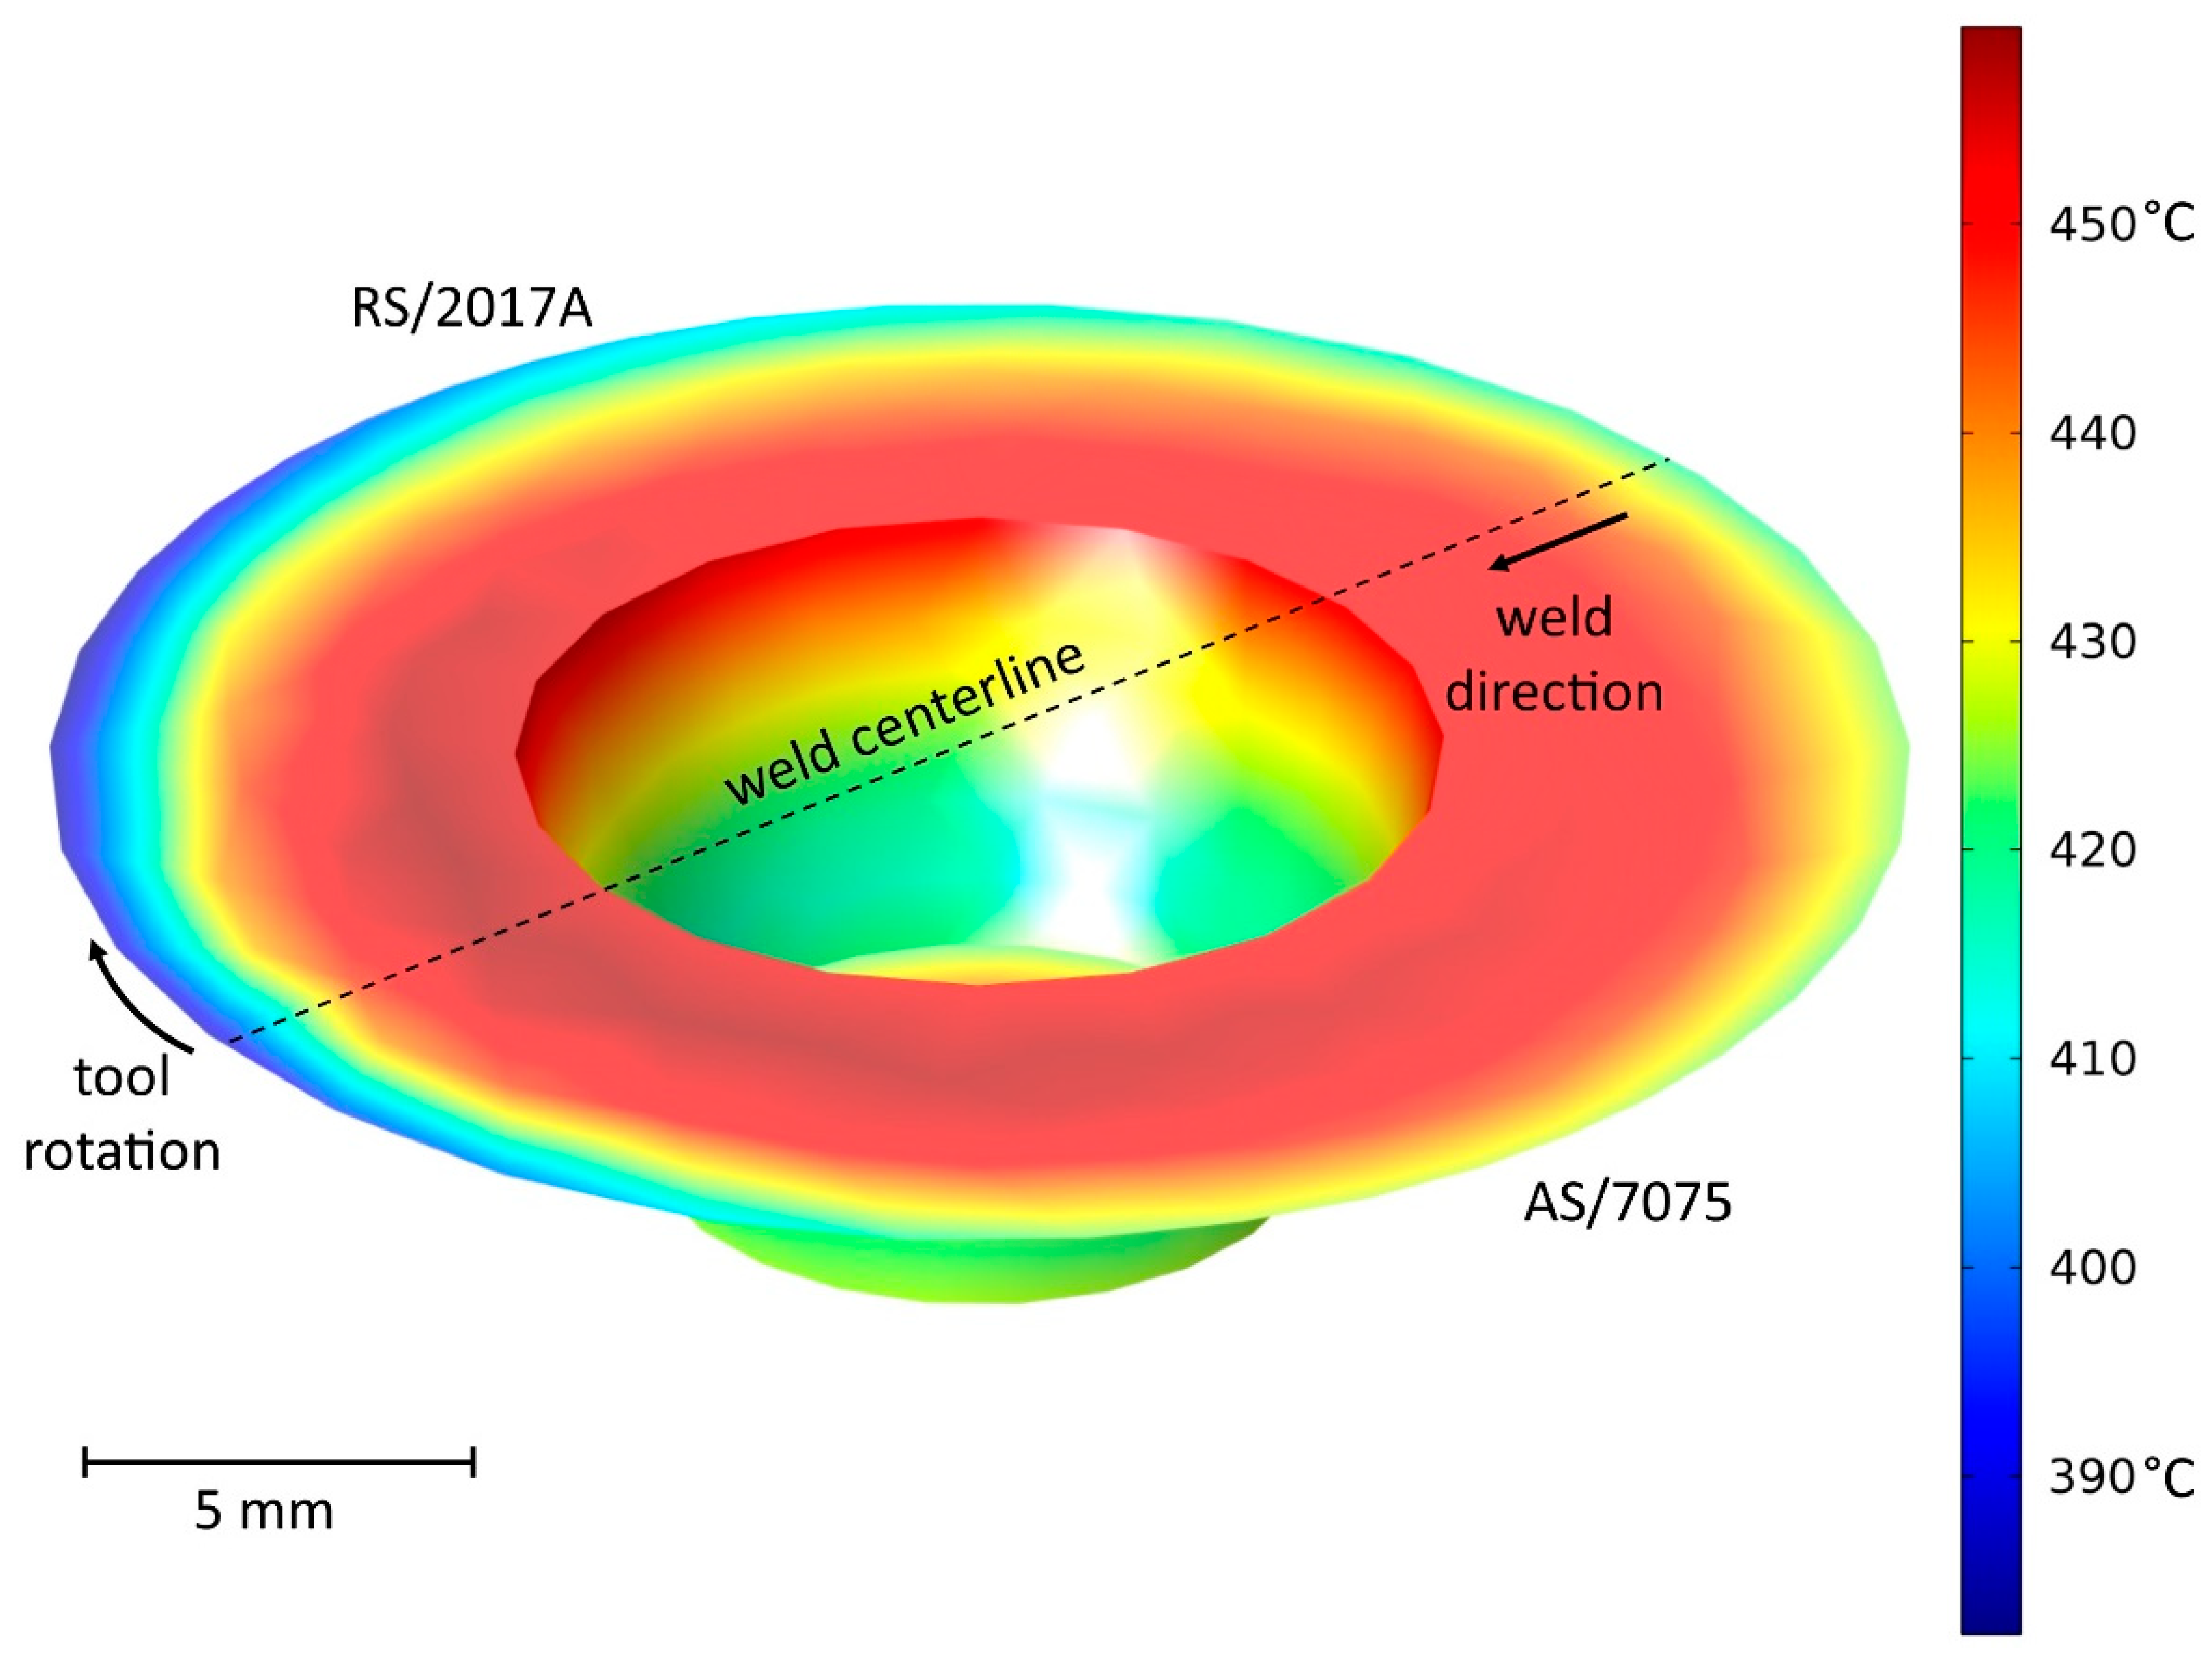
Figure 8 presents the phase transformation maps for the AS 7075/RS 2017A weld configuration overlaid on the positron lifetime/hardness curves from Figure 4. Similar observations and discussions regarding the impact of phase transformations can be made for this weld configuration as well. What is quite noticeable in this weld configuration is the even more pronounced shift in the saturation region in weld zone into the 7075, i.e., the AS. Recall again, that the dissolution temperature of the equilibrium η phase in 7075 is lower than that of the S phase in 2017A. During friction stir-welding, relatively cooler material ahead of the tool is swept toward the retreating side of the weld and heated. The heated material transfers to the advancing side of the weld where it is pulled into the weld zone by the action of the tool shoulder and pin [23]. As such, FSW produces an asymmetrical temperature distribution with the advancing side relatively hotter than the retreating side, as representatively shown in Figure 9 for the AS 7075/RS 2017A configuration. Therefore, with 7075 on the advancing side, the region of saturation extends further into the 7075 than when it is placed on the retreating side (~11 mm as opposed to ~10 mm) due to the higher processing temperatures on this side of the weld. Equally, with the relatively lower temperatures on the retreating side, when 2017A is placed on the RS, the saturation zone into the alloy is smaller than when it is placed on the AS (~7 mm as opposed to ~9 mm). The net effect is a marked shift in the hardness recovery zone toward the 7075 side of the weld as seen in the figure.
4. Conclusions
Differential scanning calorimetry curves for 2017A and 7075 were integrated into a computational model of friction stir-welding to create maps of the phase transformations that occur in the alloys during processing. The phase transformation maps predicted by the simulation correlate with the hardness profiles and positron lifetime curves taken across the weld zone from the weld center (nugget) through the TMAZ to the HAZ. Open volumes, such as the interphase boundaries between the aluminum matrix and secondary phases, trap positrons, and, therefore, sensitize positron lifetimes to the phase transformations occurring in the alloys during welding. The variations in both the positron lifetime and hardness profiles highlight the secondary phases that are present after joining and reflect their density and distribution.
Near the weld center in the proximity of the FSW tool, the processing temperatures are sufficient to fully dissolve the equilibrium phase in 7075 and partially dissolve the equilibrium phase in 2017A. Upon cooling and with sufficient natural aging time, the hardness in this region recovers, producing the W-shaped hardness profile typical of age-hardenable aluminums joined by friction stir-welding. Because the dissolution temperature of the η phase in 7075 is less than that of the S phase in 2017A, the hardness recovery zone skews toward the 7075-side of the weld. This shift is particularly pronounced in the AS 7075/RS 2017A weld configuration as the weld temperatures are relatively higher on the advancing side than on the retreating side.
Author Contributions
Alexsandra Węglowska and Adam Pietras designed and performed the friction stir welding trials. Stanisław Dymek and Mateusz Kopyściański performed the materials characterization work. Carter Hamilton developed the numerical simulation and authored the paper.
Acknowledgments
This work was supported by AGH University of Science and Technology, grant No. 11.11.110.295.
Conflicts of Interest
The authors declare no conflict of interest.
References
- Kumar, N.; Mishra, R.; Yuan, W. Friction Stir Welding of Dissimilar Alloys and Materials, 1st ed.; Butterworth-Heinemann: Waltham, MA, USA, 2015; ISBN 978-0-12-802418-8. [Google Scholar]
- Mishra, R.; Komarasamy, M. Friction Stir Welding of High Strength 7XXX Aluminum Alloys, 1st ed.; Butterworth-Heinemann: Waltham, MA, USA, 2016; ISBN 978-0-12-809465-5. [Google Scholar]
- Mishra, R.; Sidhar, H. Friction Stir Welding of 2XXX Aluminum Alloys including Al-Li Alloys, 1st ed.; Butterworth-Heinemann: Waltham, MA, USA, 2016; ISBN 978-0-12-805368-3. [Google Scholar]
- Uday, M.B.; Ahmad Fauzi, M.N.; Zuhailawati, H.; Ismail, A.B. Advances in friction welding process: A review. Sci. Technol. Weld. Join. 2010, 15, 534–558. [Google Scholar] [CrossRef]
- Threadgill, P.L.; Leonard, A.J.; Shercliff, H.R.; Withers, P.J. Friction stir welding of aluminium alloys. Int. Mater. Rev. 2009, 54, 49–93. [Google Scholar] [CrossRef]
- DebRoy, T.; Bhadeshia, H.K.D.H. Friction stir welding of dissimilar alloys: A perspective. Sci. Technol. Weld. Join. 2010, 15, 266–270. [Google Scholar] [CrossRef]
- Murr, L.E. A review of FSW research on dissimilar metal and alloy systems. J. Mater. Eng. Perform. 2010, 19, 1071–1089. [Google Scholar] [CrossRef]
- Ma, Z.Y.; Feng, A.H.; Chen, D.L.; Shen, J. Recent advances in friction stir welding/processing of aluminum alloys: Microstructural evolution and mechanical properties. Crit. Rev. Solid State Mater. Sci. 2017. [Google Scholar] [CrossRef]
- Hamilton, C.; Kopyściański, M.; Węglowska, A.; Dymek, S.; Pietras, A. A numerical simulation for dissimilar aluminum alloys joined by friction stir welding. Metall. Mater. Trans. A 2016, 47, 4519–4529. [Google Scholar] [CrossRef]
- Hamilton, C.; Dymek, S.; Dryzek, E.; Kopyściański, M.; Pietras, A.; Węglowska, A.; Wróbel, M. Application of positron lifetime annihilation spectroscopy for characterization of friction stir welded dissimilar aluminum alloys. Mater. Charact. 2017, 132, 431–436. [Google Scholar] [CrossRef]
- Węglowski, M.S.; Dymek, S. Microstructural modification of cast aluminium alloy AlSi9Mg via friction modified processing. Arch. Metall. Mater. 2012, 57, 71–78. [Google Scholar] [CrossRef]
- Węglowski, M.S.; Pietras, A.; Dymek, S.; Hamilton, C. Characterization of friction modified processing—A novel tool for enhancing surface properties in cast aluminium alloys. Key Eng. Mater. 2012, 504–506, 1231–1236. [Google Scholar] [CrossRef]
- Straumal, B.B.; Kogtenkova, O.A.; Protasova, S.G.; Zięba, P.; Czeppe, T.; Baretzky, B.; Valiev, R.Z. First measurement of the heat effect of the grain boundary wetting phase transition. J. Mater. Sci. 2011, 46, 4243–4247. [Google Scholar] [CrossRef]
- Straumal, B.; Valiev, R.; Kogtenkova, O.; Zięba, P.; Czeppe, T.; Bielanska, E.; Faryna, M. Thermal evolution and grain boundary phase transformations in severely deformed nanograined Al–Zn alloys. Acta Mater. 2008, 56, 6123–6131. [Google Scholar] [CrossRef]
- Krause-Rehberg, R.; Leipner, H.S. Positron Annihilation in Semiconductors; Solid-State Sciences; Springer: Berlin, Germany, 1999; Volume 127. [Google Scholar]
- Kansy, J. Microcomputer program for analysis of positron annihilation lifetime spectra. Nucl. Instrum. Methods Phys. Res. Sect. A Accel. Spectrom. Dect. Assoc. Equip. 1996, 374, 235–244. [Google Scholar] [CrossRef]
- Kalemba, I.; Hamilton, C.; Dymek, S. Natural aging in friction stir welded 7136-t76 aluminum alloy. Mater. Des. 2014, 60, 295–301. [Google Scholar] [CrossRef]
- Dlubek, G.; Lademann, P.; Krause, H.; Unger, R. Positron lifetime studies of decomposition in 2014 (Al-Cu-Mg) and 7010 (Al-Zn-Cu-Mg) alloys. Scr. Mater. 1998, 39, 893–899. [Google Scholar] [CrossRef]
- Dlubek, G.; Krause, H.; Krause, S.; Unger, R.; Heyroth, W. Positron lifetime studies of decomposition in engineering and laboratory 2024 (Al-Cu-Mg) and 7075 (Al-Zn-Cu-Mg) alloys. Phys. Status Solidi A Appl. Mater. 1998, 169, 11–12. [Google Scholar] [CrossRef]
- Santos, T.G.; Miranda, R.M.; Vilaça, P.; Teixeira, J.P.; dos Santos, J. Microstructural mapping of friction stir welded AA 7075-T6 and AlMgSc alloys using electrical conductivity. Sci. Technol. Weld. Join. 2011, 16, 630–635. [Google Scholar] [CrossRef]
- Dumont, M.; Steuwer, A.; Deschamps, A.; Peel, M.; Withers, P.J. Microstructure mapping in friction stir welds of 7449 aluminum alloy using SAXS. Acta Mater. 2006, 54, 4793–4801. [Google Scholar] [CrossRef]
- Genevois, C.; Deschamps, A.; Denquin, A.; Cottignies, B.D. Quantitative investigation of precipitation and mechanical behavior for AA2024 friction stir welds. Acta Mater. 2005, 53, 2447–2458. [Google Scholar] [CrossRef]
- Reynolds, A.P. Visualization of material flow in autogenous friction stir welds. Sci. Technol. Weld. Join. 2000, 5, 120–124. [Google Scholar] [CrossRef]
Figure 1.
Macrographs of the weld configurations with the characteristic friction stir-weld zones noted, i.e., the nugget/stir zone, the thermo-mechanically affected zone (TMAZ) and heat-affected zone (HAZ): (a) AS 2017A/RS 7075 and (b) AS 7075/RS 2017A (AS: advancing side and RS: retreating side) [10].

Figure 2.
Differential scanning calorimetry (DSC) curves for workpiece materials with significant phase transformation peaks indicated: (a) 2017A and (b) 7075 [9].
Figure 2.
Differential scanning calorimetry (DSC) curves for workpiece materials with significant phase transformation peaks indicated: (a) 2017A and (b) 7075 [9].

Figure 3.
Hardness profiles for: (a) AS 2017A/RS 7075 and (b) AS 7075/RS 2017A. Profiles reveal the typical W-shape associated with precipitation-hardenable aluminum alloys. Hardness measurement error is ±7.5 HV.
Figure 3.
Hardness profiles for: (a) AS 2017A/RS 7075 and (b) AS 7075/RS 2017A. Profiles reveal the typical W-shape associated with precipitation-hardenable aluminum alloys. Hardness measurement error is ±7.5 HV.

Figure 4.
Positron lifetime curves superimposed on average hardness profiles highlighting the correlation between the characterization methods: (a) AS 2017A/RS 7075 and (b) AS 7075/RS 2017A.
Figure 4.
Positron lifetime curves superimposed on average hardness profiles highlighting the correlation between the characterization methods: (a) AS 2017A/RS 7075 and (b) AS 7075/RS 2017A.

Figure 5.
Phase transformation map for 7075 representatively shown on the advancing side. Regions of phase transformations associated with GP zones and the η’/η phases are annotated.
Figure 5.
Phase transformation map for 7075 representatively shown on the advancing side. Regions of phase transformations associated with GP zones and the η’/η phases are annotated.

Figure 6.
Phase transformation map for 2017A representatively shown on the retreating side. Regions of phase transformations associated with S’/S phases are annotated.
Figure 6.
Phase transformation map for 2017A representatively shown on the retreating side. Regions of phase transformations associated with S’/S phases are annotated.

Figure 7.
Phase transformation maps overlaid on lifetime/hardness profiles for the AS 2017A/RS 7075 configuration. Boundaries between phase transformation regions align with transition areas in both hardness and positron lifetime.
Figure 7.
Phase transformation maps overlaid on lifetime/hardness profiles for the AS 2017A/RS 7075 configuration. Boundaries between phase transformation regions align with transition areas in both hardness and positron lifetime.

Figure 8.
Phase transformation maps overlaid on lifetime/hardness profiles for the AS 7075/RS 2017A configuration. Boundaries between phase transformation regions align with transition areas in both hardness and positron lifetime.
Figure 8.
Phase transformation maps overlaid on lifetime/hardness profiles for the AS 7075/RS 2017A configuration. Boundaries between phase transformation regions align with transition areas in both hardness and positron lifetime.

Figure 9.
Temperature distribution at the tool/workpiece interface representatively shown for the AS 7075/RS 2017A configuration (units: °C). Figure shows the asymmetric character of temperature distribution with the advancing side relatively hotter than the retreating side.
Figure 9.
Temperature distribution at the tool/workpiece interface representatively shown for the AS 7075/RS 2017A configuration (units: °C). Figure shows the asymmetric character of temperature distribution with the advancing side relatively hotter than the retreating side.

© 2018 by the authors. Licensee MDPI, Basel, Switzerland. This article is an open access article distributed under the terms and conditions of the Creative Commons Attribution (CC BY) license (http://creativecommons.org/licenses/by/4.0/).
Share and Cite
MDPI and ACS Style
Hamilton, C.; Dymek, S.; Kopyściański, M.; Węglowska, A.; Pietras, A. Numerically Based Phase Transformation Maps for Dissimilar Aluminum Alloys Joined by Friction Stir-Welding. Metals 2018, 8, 324. https://doi.org/10.3390/met8050324
AMA Style
Hamilton C, Dymek S, Kopyściański M, Węglowska A, Pietras A. Numerically Based Phase Transformation Maps for Dissimilar Aluminum Alloys Joined by Friction Stir-Welding. Metals. 2018; 8(5):324. https://doi.org/10.3390/met8050324
Chicago/Turabian StyleHamilton, Carter, Stanisław Dymek, Mateusz Kopyściański, Aleksandra Węglowska, and Adam Pietras. 2018. "Numerically Based Phase Transformation Maps for Dissimilar Aluminum Alloys Joined by Friction Stir-Welding" Metals 8, no. 5: 324. https://doi.org/10.3390/met8050324
Note that from the first issue of 2016, this journal uses article numbers instead of page numbers. See further details here.