Effect of Austenite-to-Ferrite Phase Transformation at Grain Boundaries on PWHT Cracking Susceptibility in CGHAZ of T23 Steel

Abstract
:1. Introduction
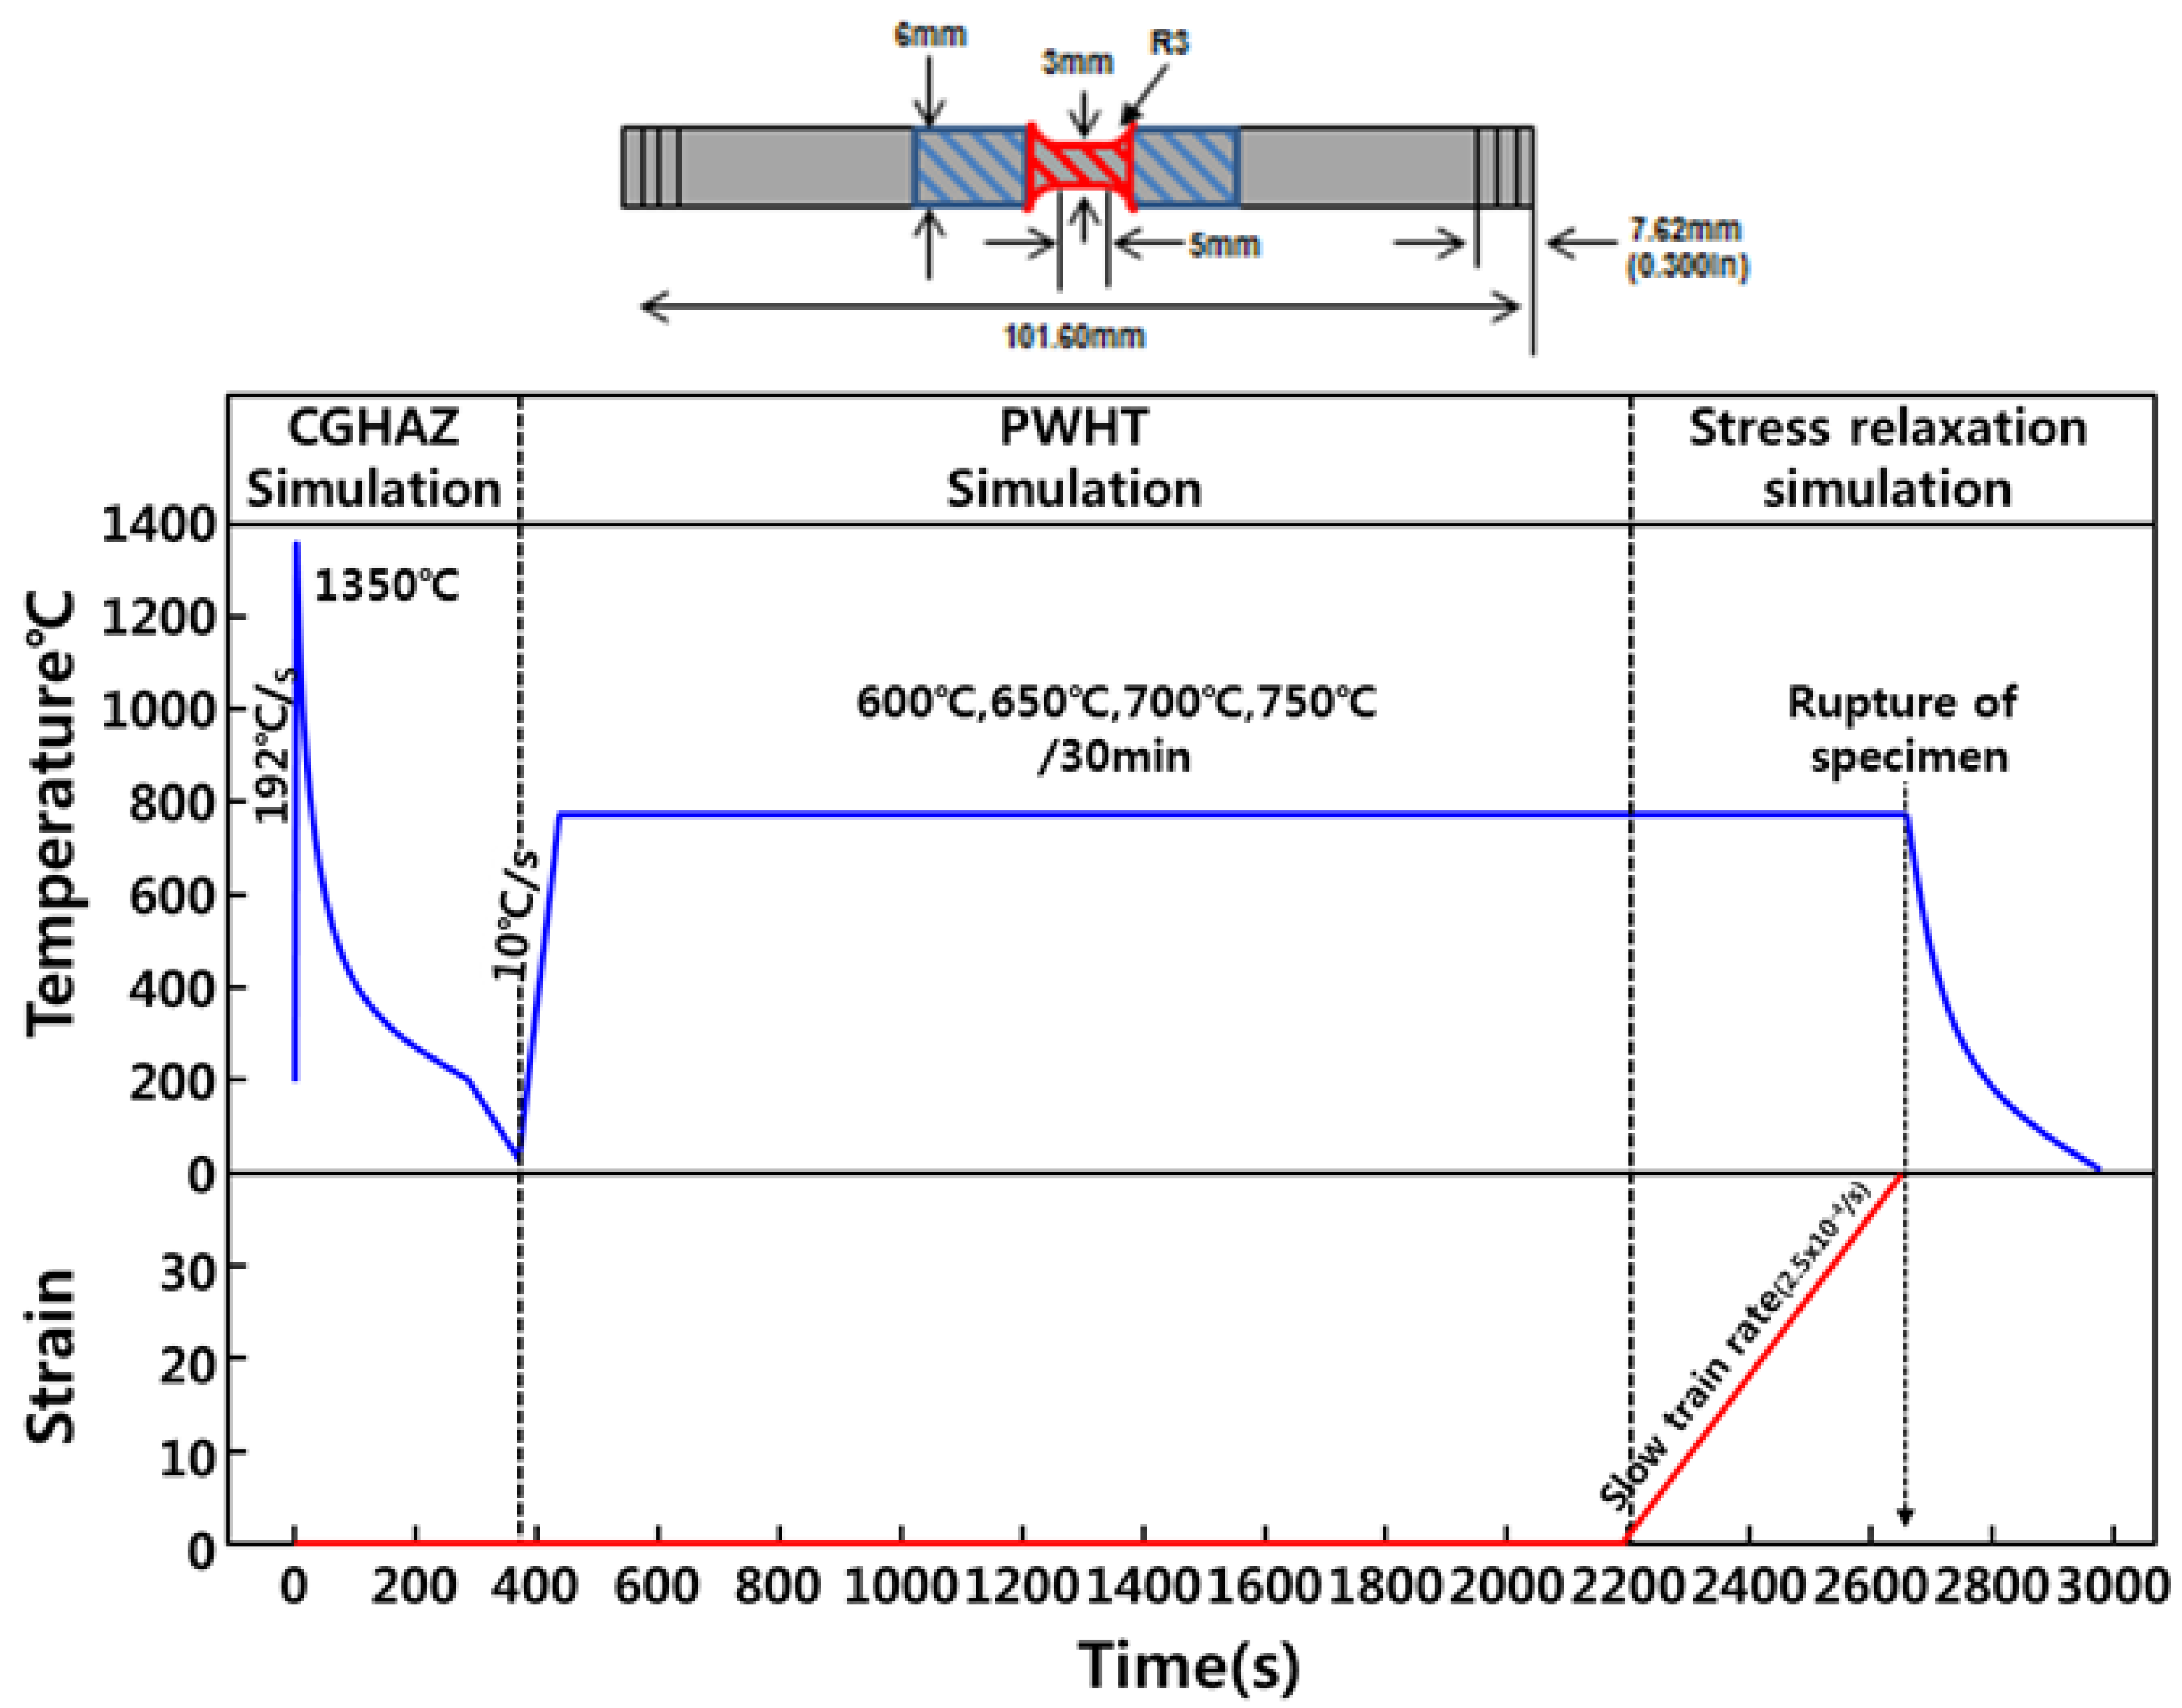
2. Materials and Methods
3. Results and Discussion
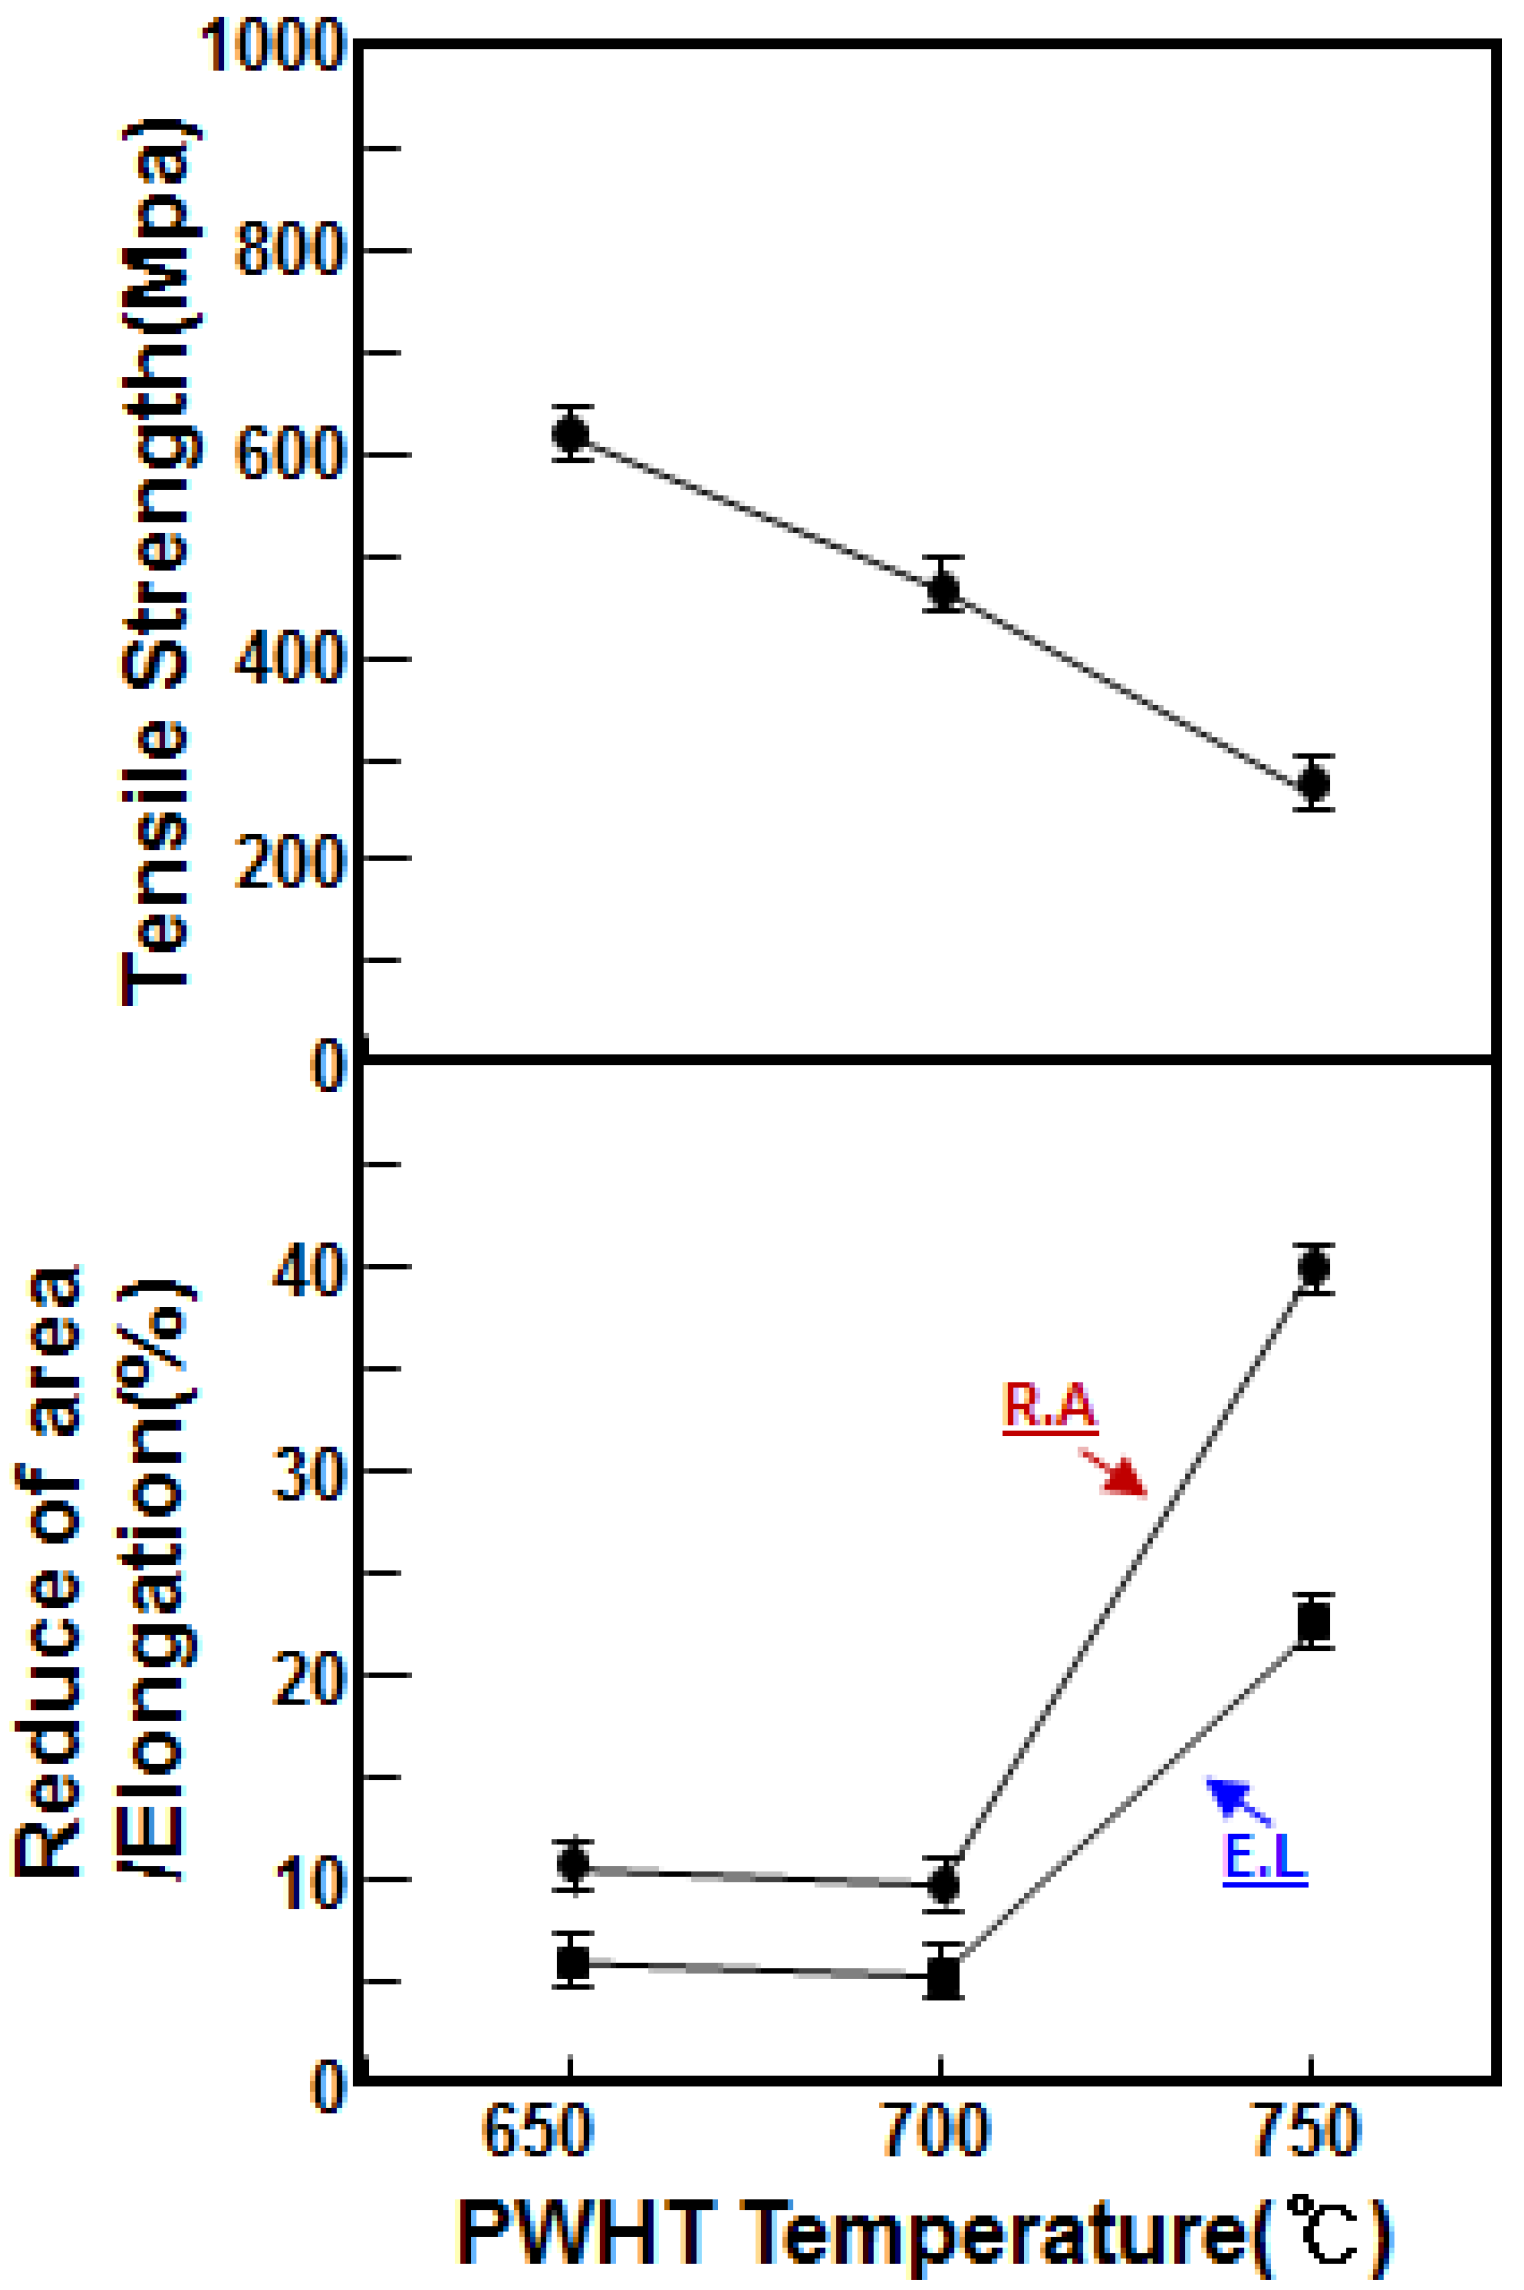
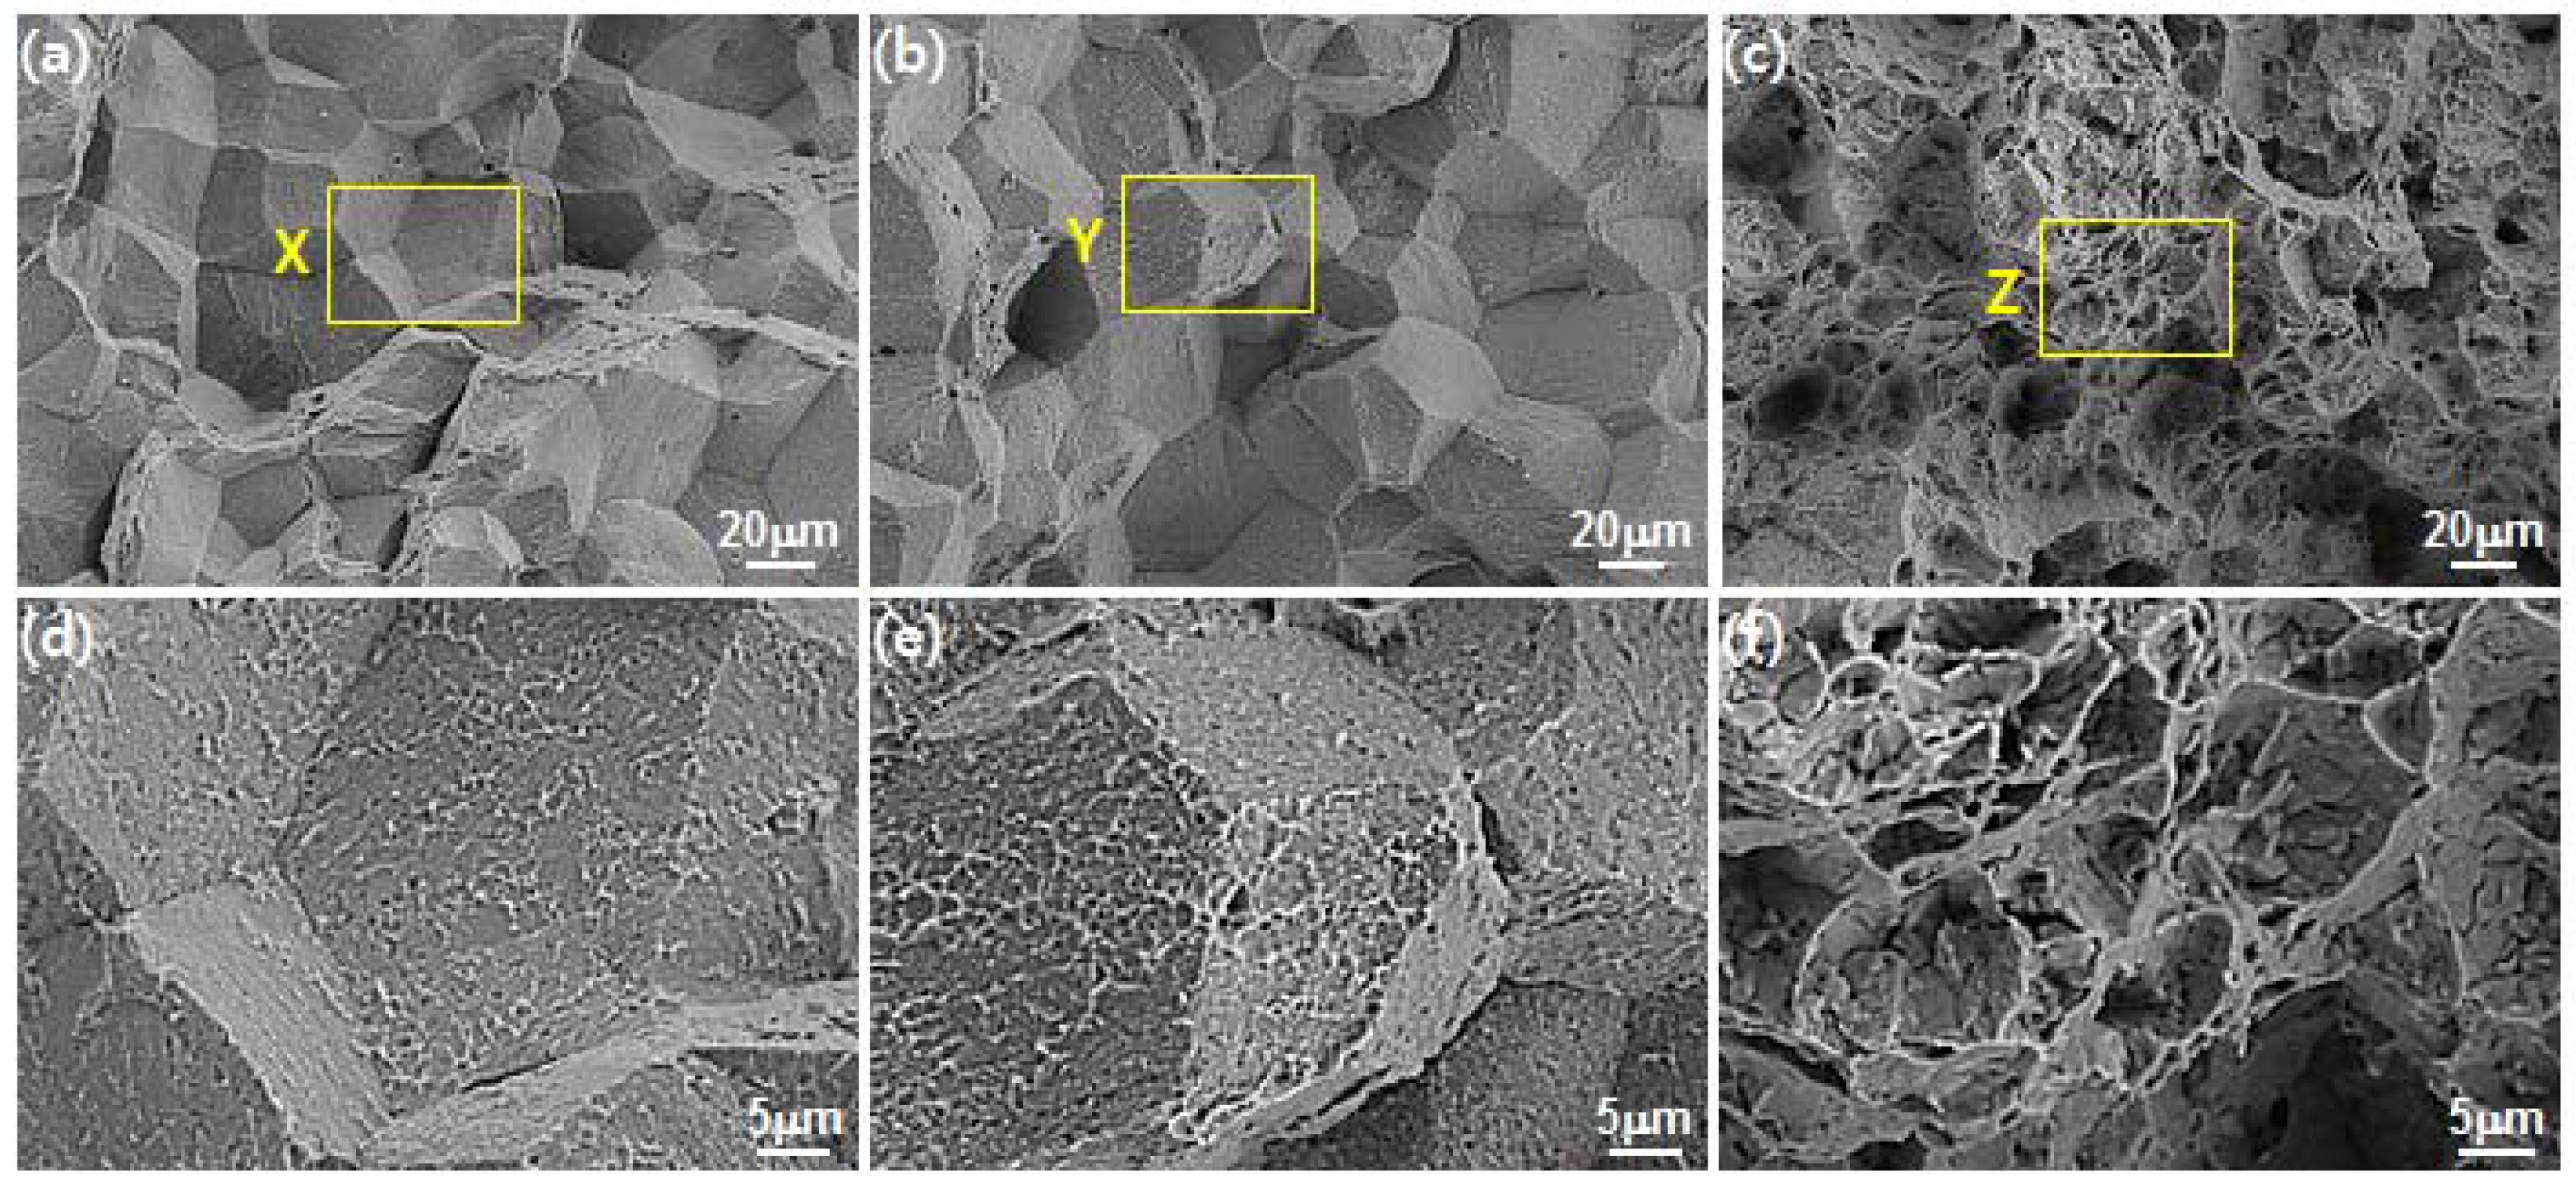
3.1. PWHT Cracking Susceptibility Test
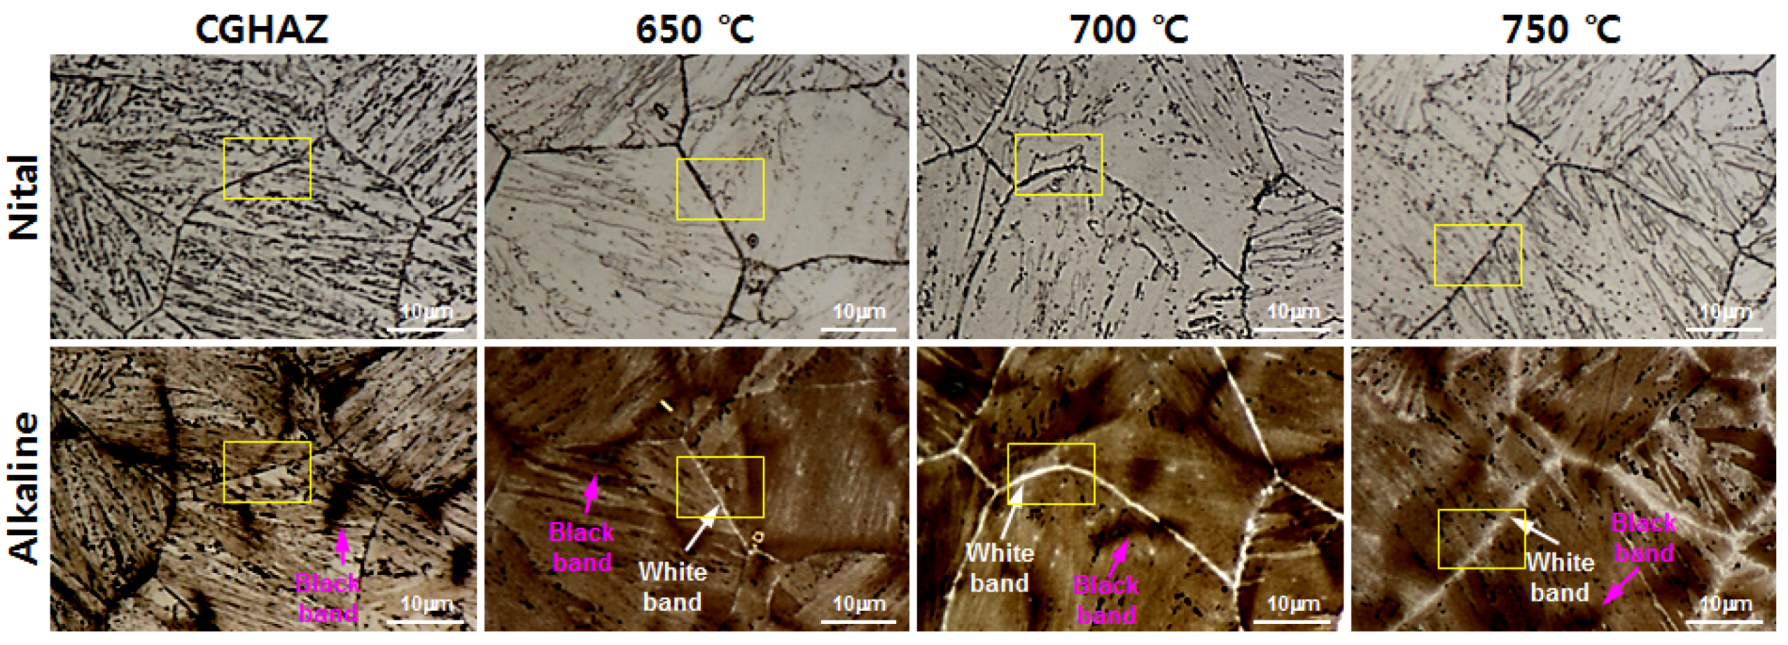
3.2. Correlation between Microstructure and PWHT Cracking Susceptibility
3.3. Formation Mechanism of Ferrite at Prior Austenite Grain Boundary
4. Conclusions
- (1)
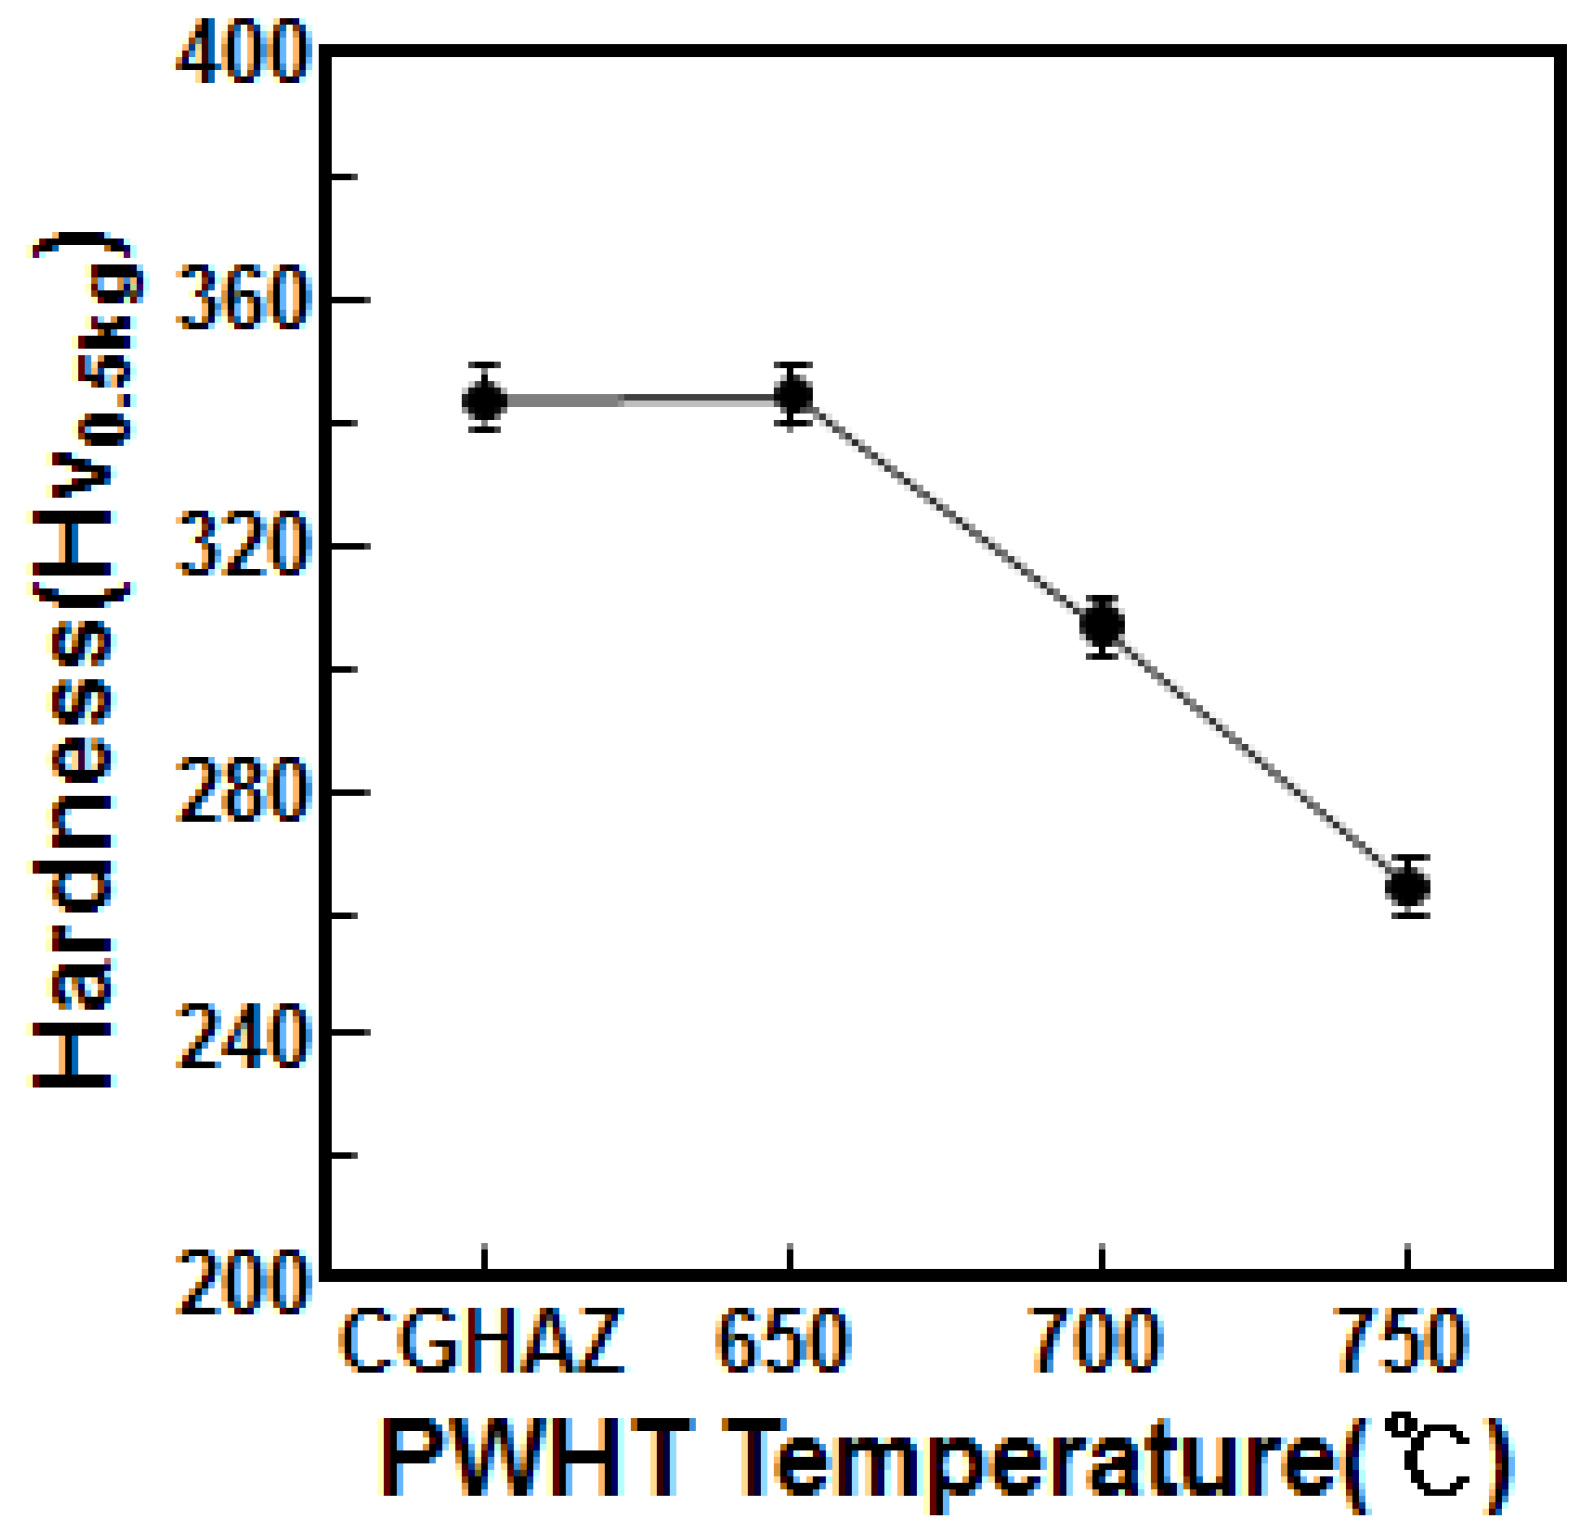
- As a result of the PWHT cracking susceptibility test of CGHAZ at 650 °C, 700 °C, and 750 °C, it was found that CGHAZ was sensitive to PWHT at 650 °C and 700 °C, but not at 750 °C. The surfaces at 650 °C and 700 °C contain intergranular fractures, but at 750 °C, they contain transgranular fractures.
- (2)
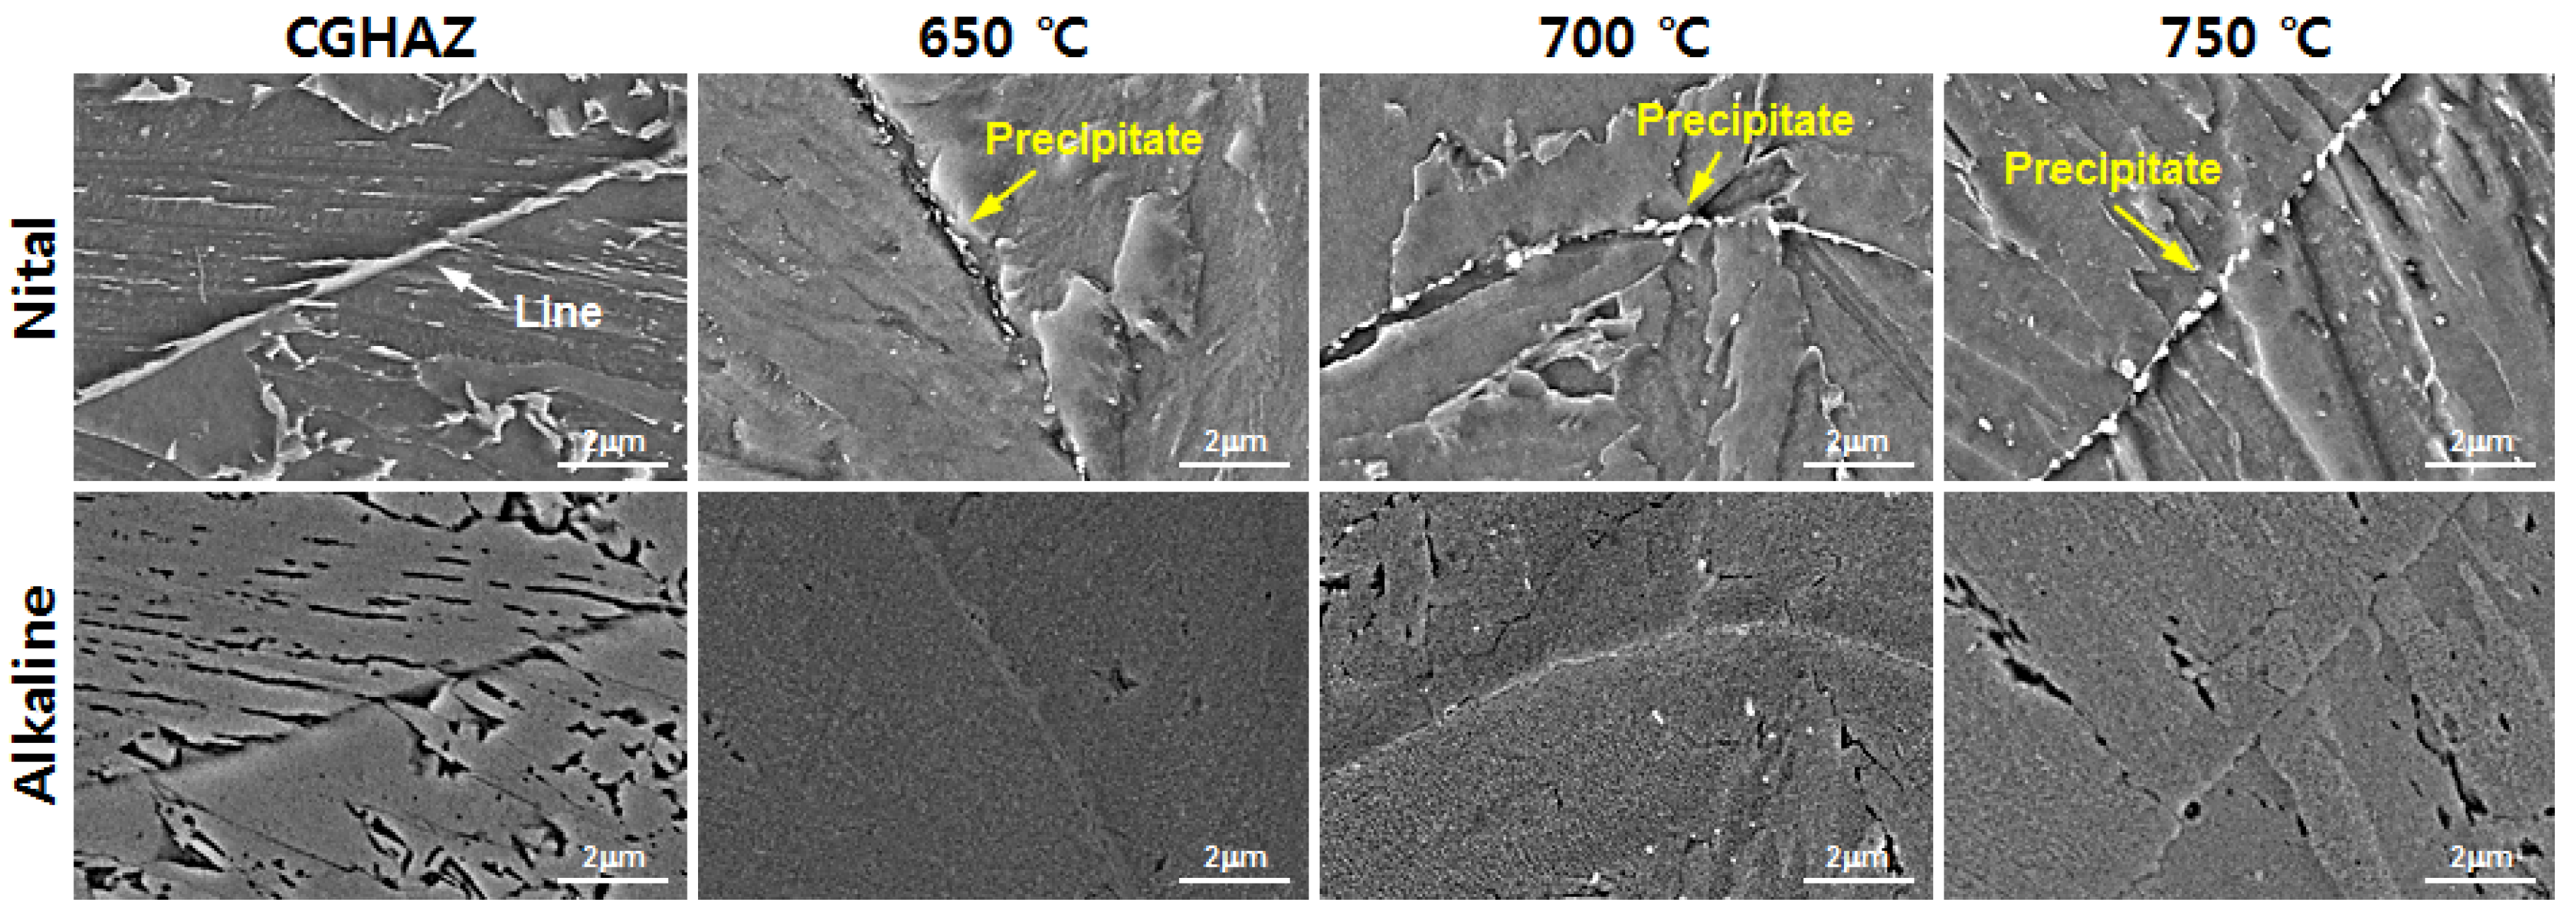
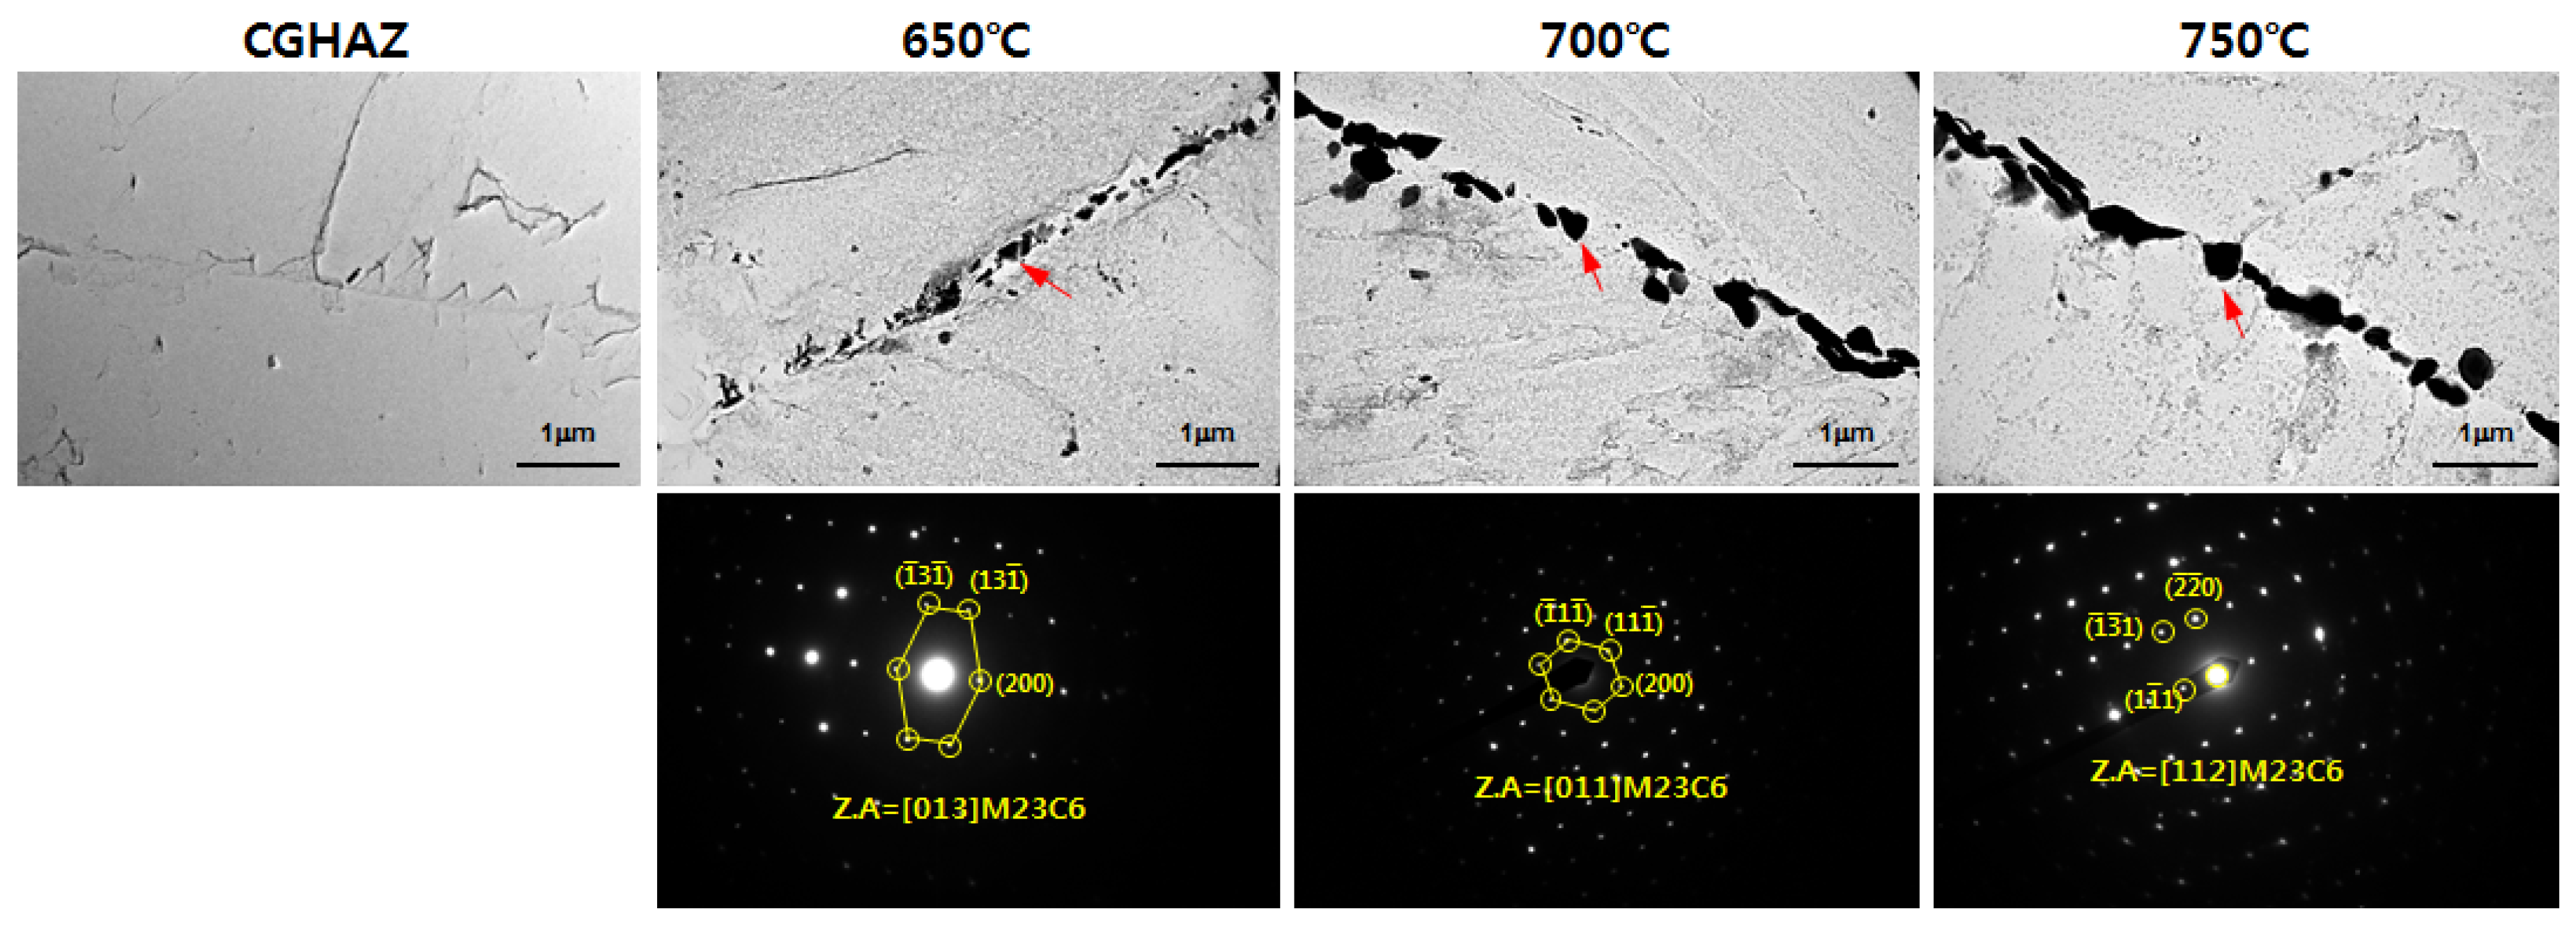
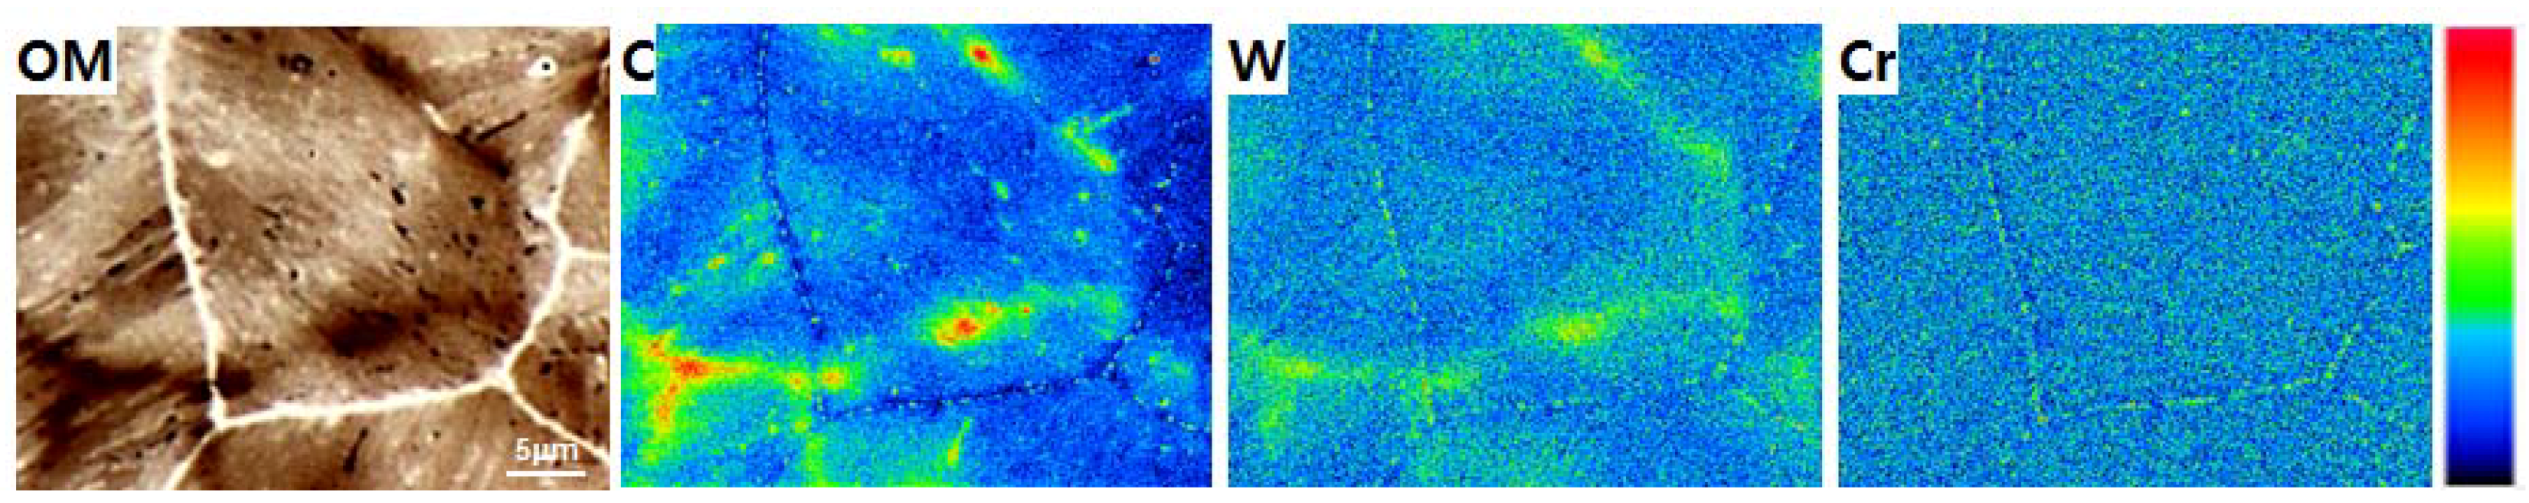
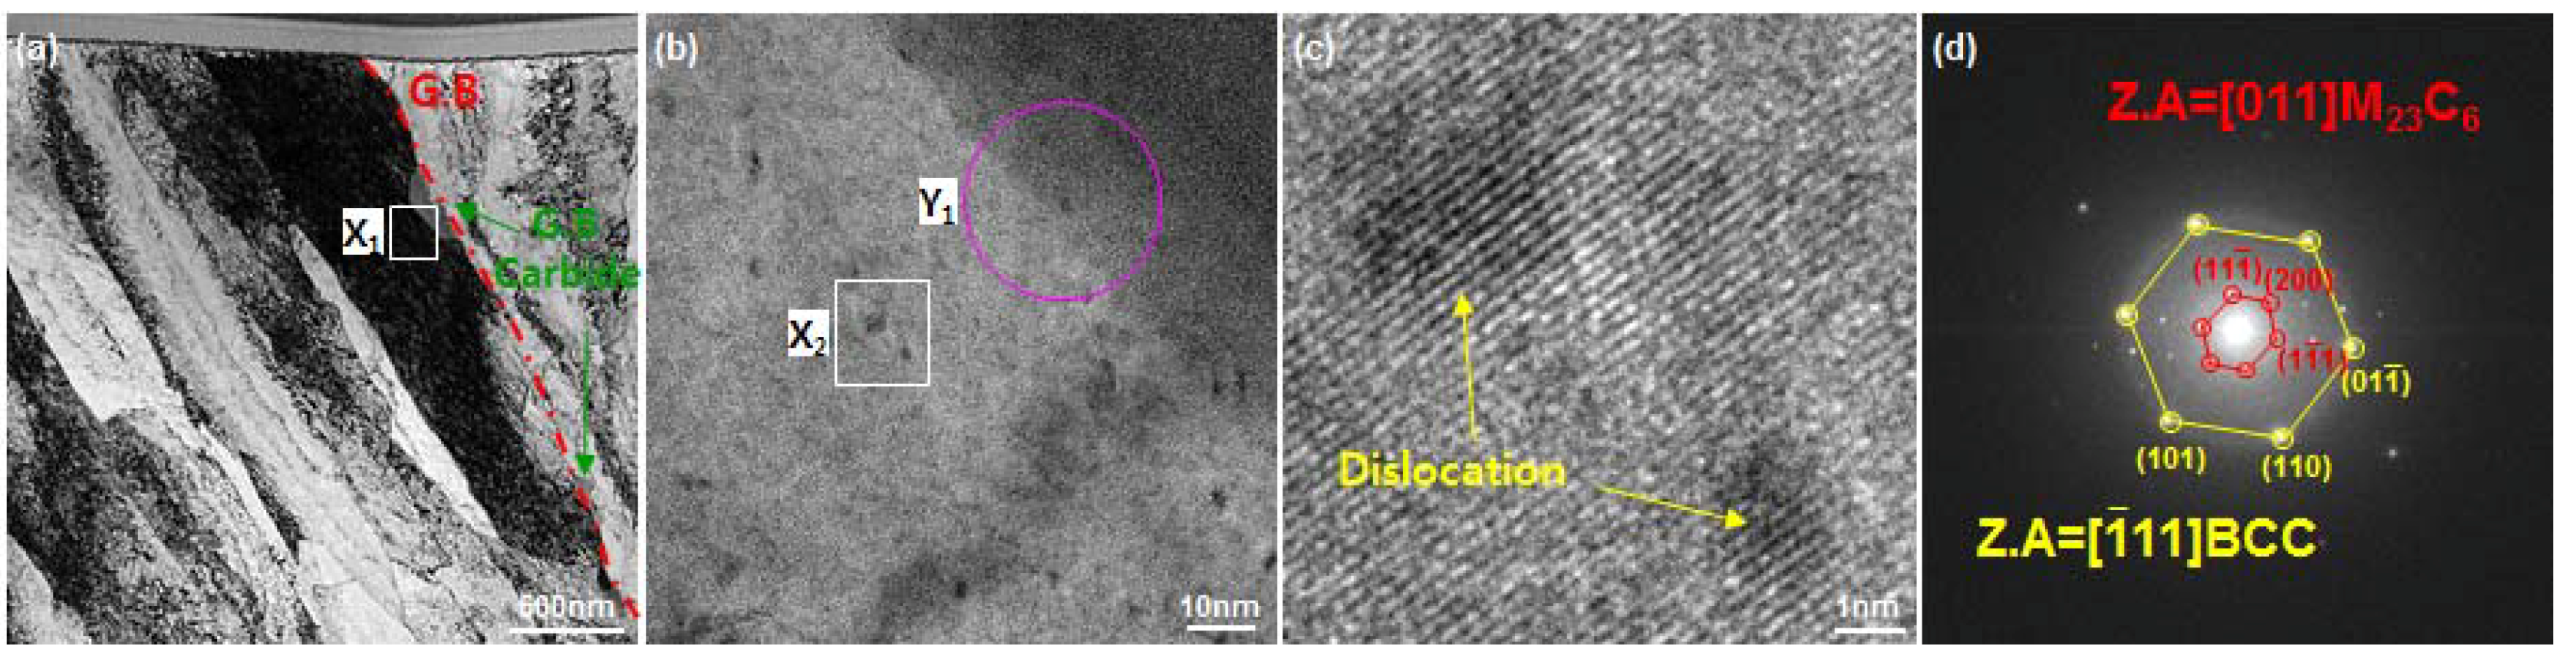
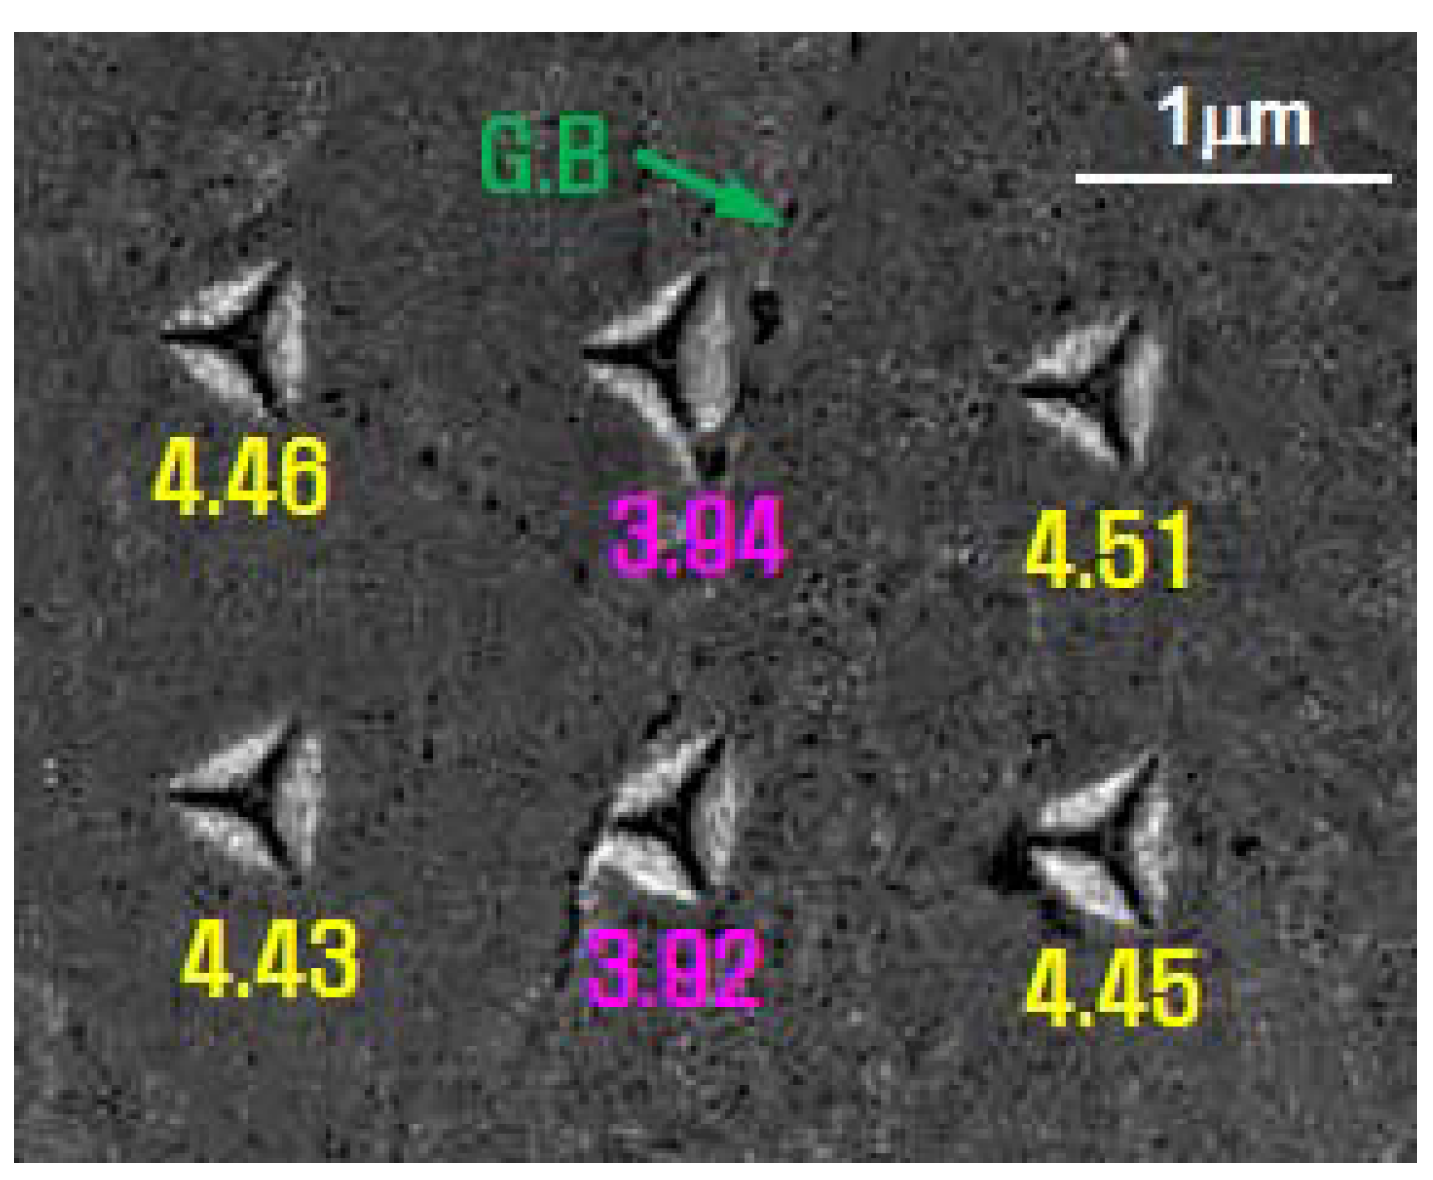
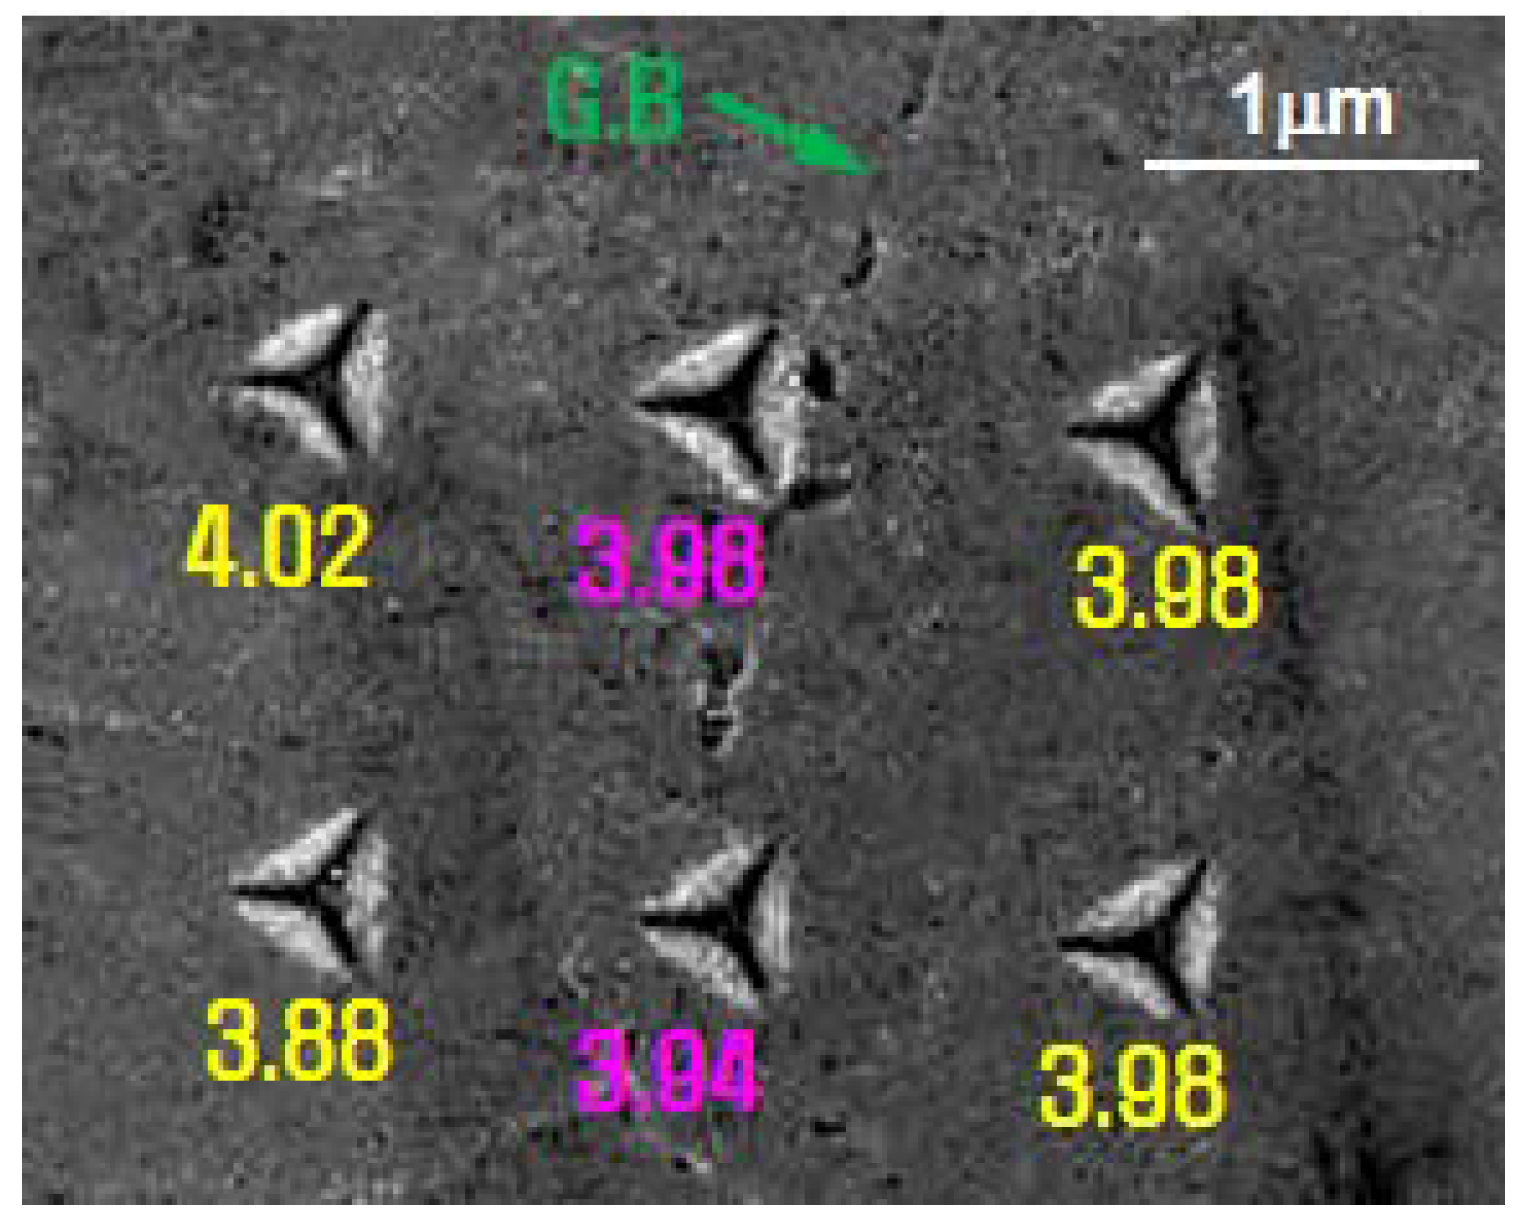
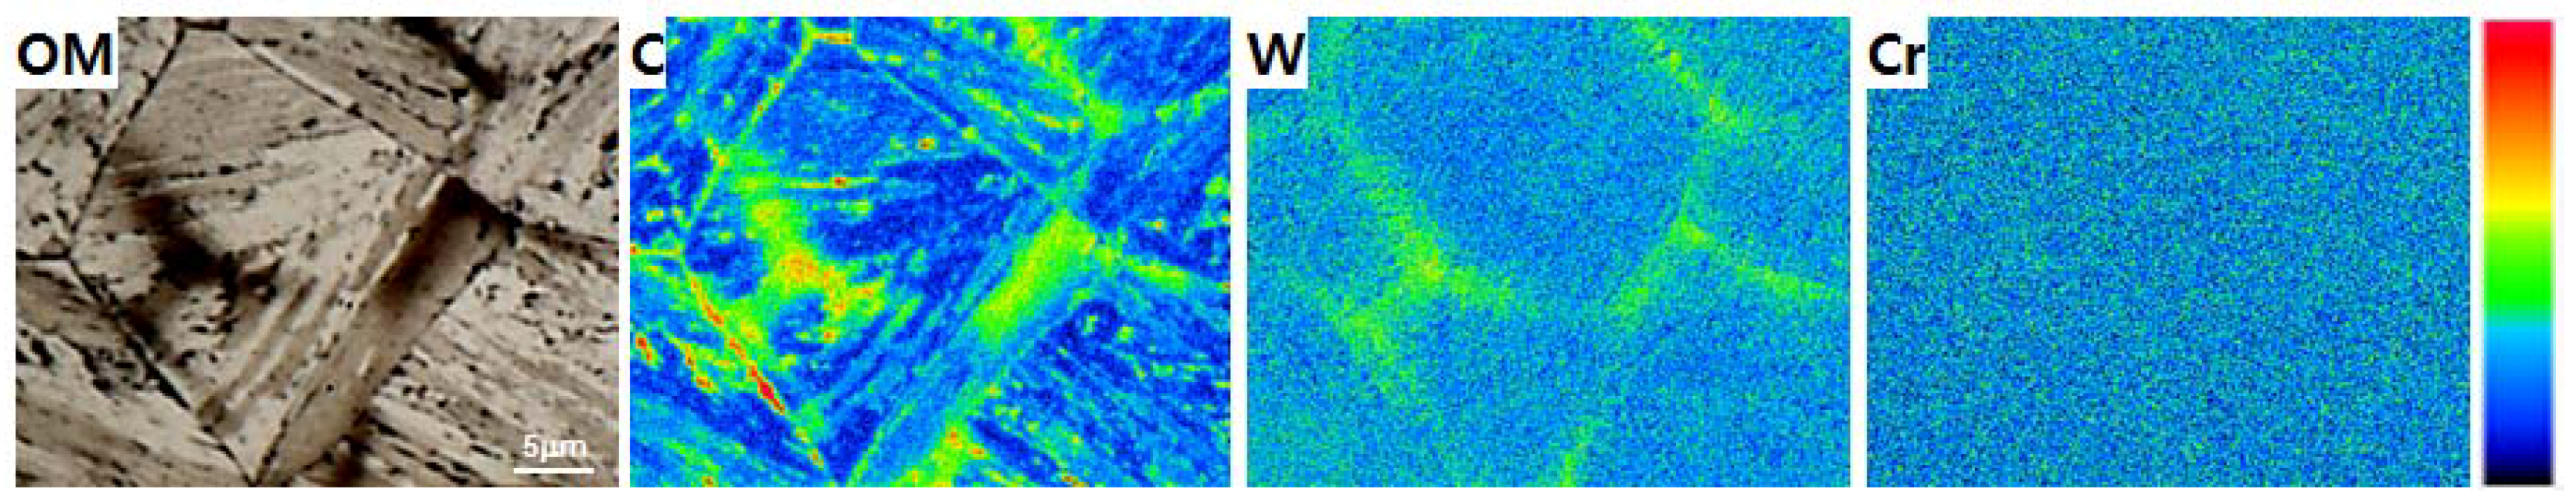
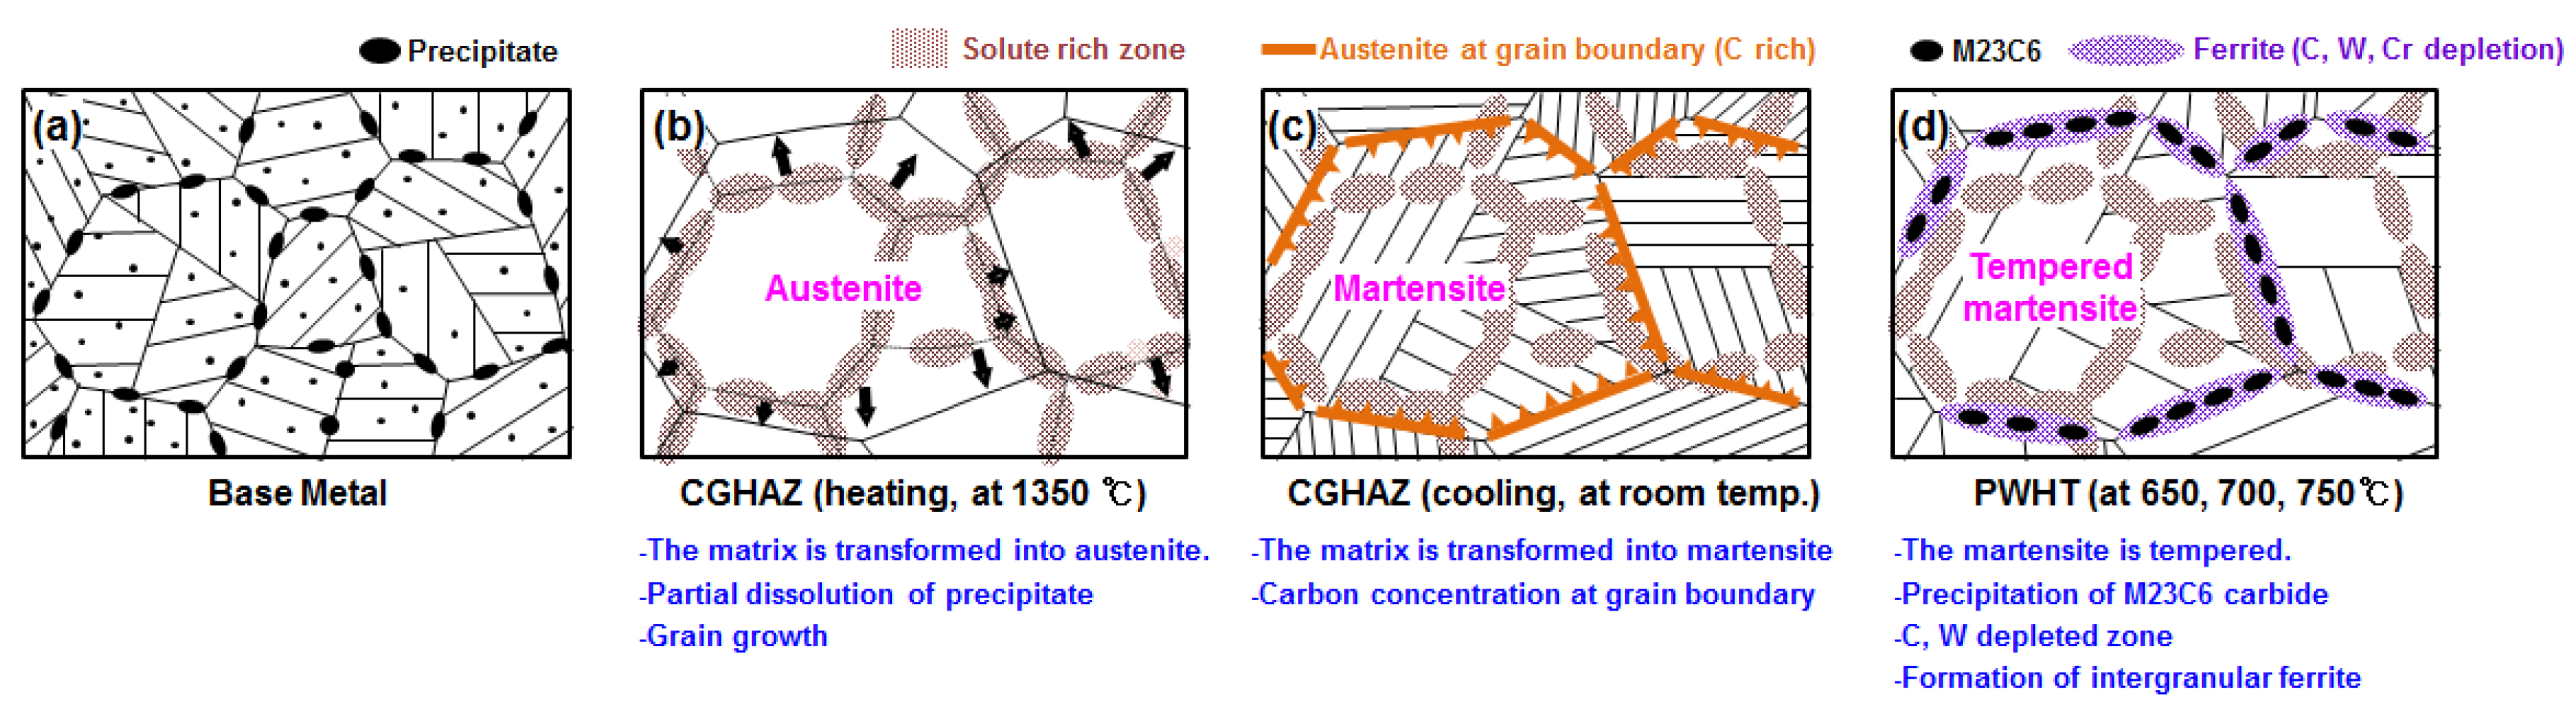
- In order to investigate the microstructural characteristics of CGHAZ at PWHT temperatures, microstructures were observed by etching with nital and alkaline sodium picrate etchants. Alkaline sodium picrate-etched microstructures at 650 °C, 700 °C, and 750 °C showed white bands at grain boundaries that did not appear in nital etching. In the EPMA and TEM analyses, the white band at the grain boundaries of 650 °C, 700 °C, and 750 °C was intergranular ferrite depleted in C, W, and Cr.
- (3)
- The reason why an intergranular fracture appears largely at 650 °C and 700 °C and is sensitive to PWHT cracking is that the intergranular strength is lower than the transgranular strength due to ductile intergranular ferrite. The intergranular ferrite appears due to C and Cr depletion by M23C6 precipitation during PWHT. At 750 °C, the surface fracture is mostly transgranular fracture, and is not susceptible to PWHT cracking. The reason is that the intergranular ferrite lowers the intergranular strength, but the transgranular strength is also lowered by the high tempering effect, so that the intergranular strength and the transgranular strength are similar to each other.
- (4)
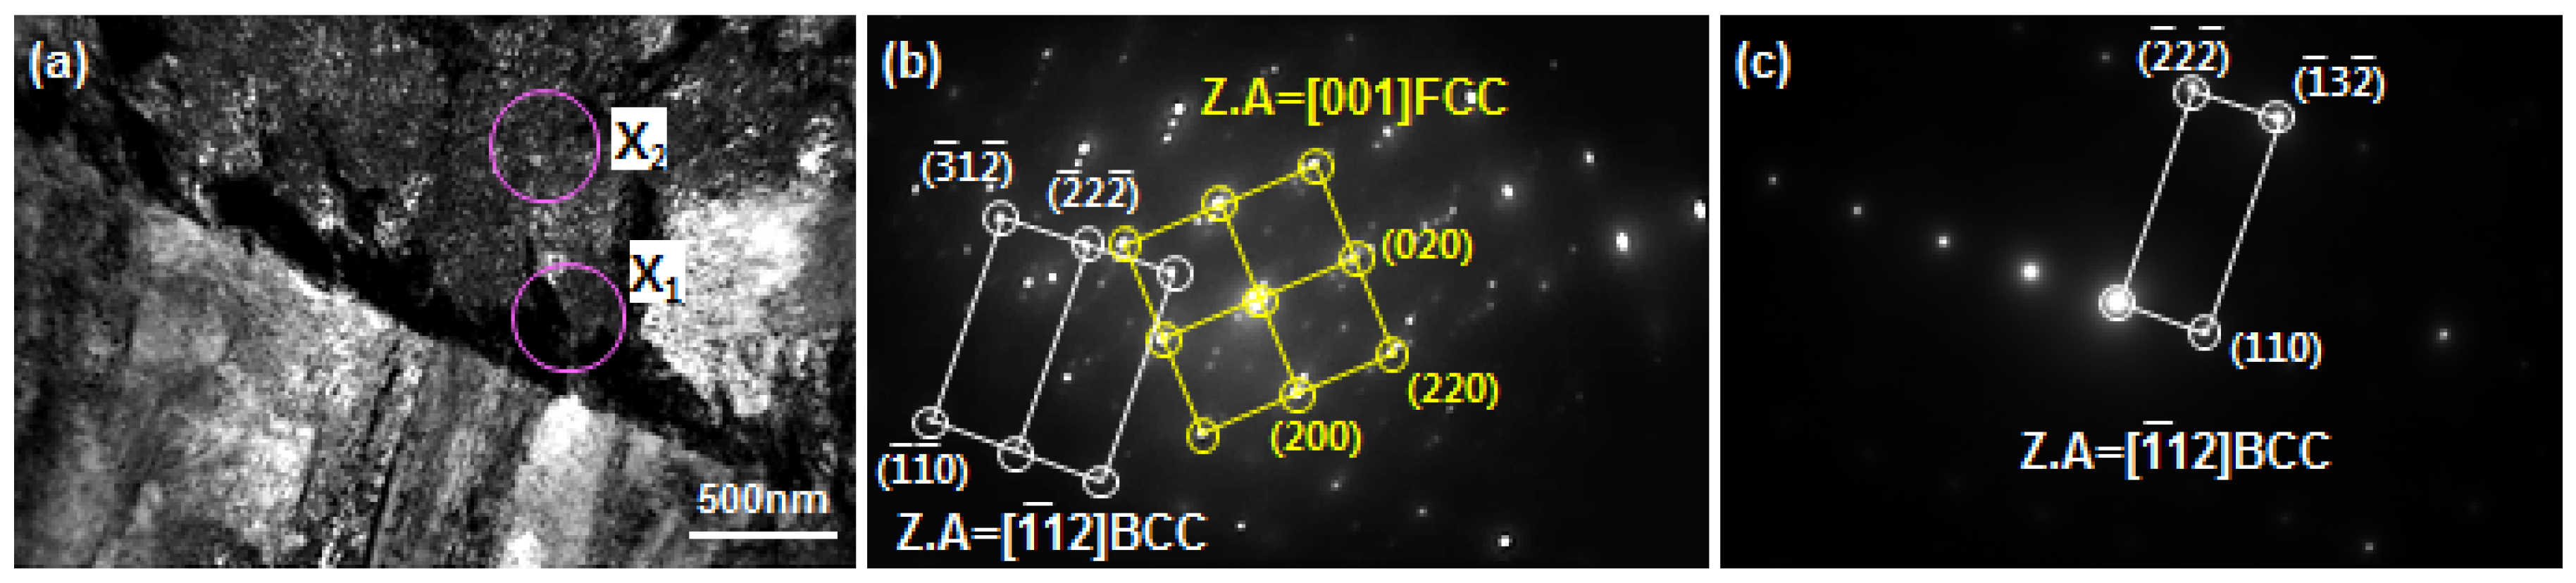
- A line observed at the grain boundary of CGHAZ was found to be austenite with carbon concentration, on the basis of EPMA and TEM analysis.
- (5)
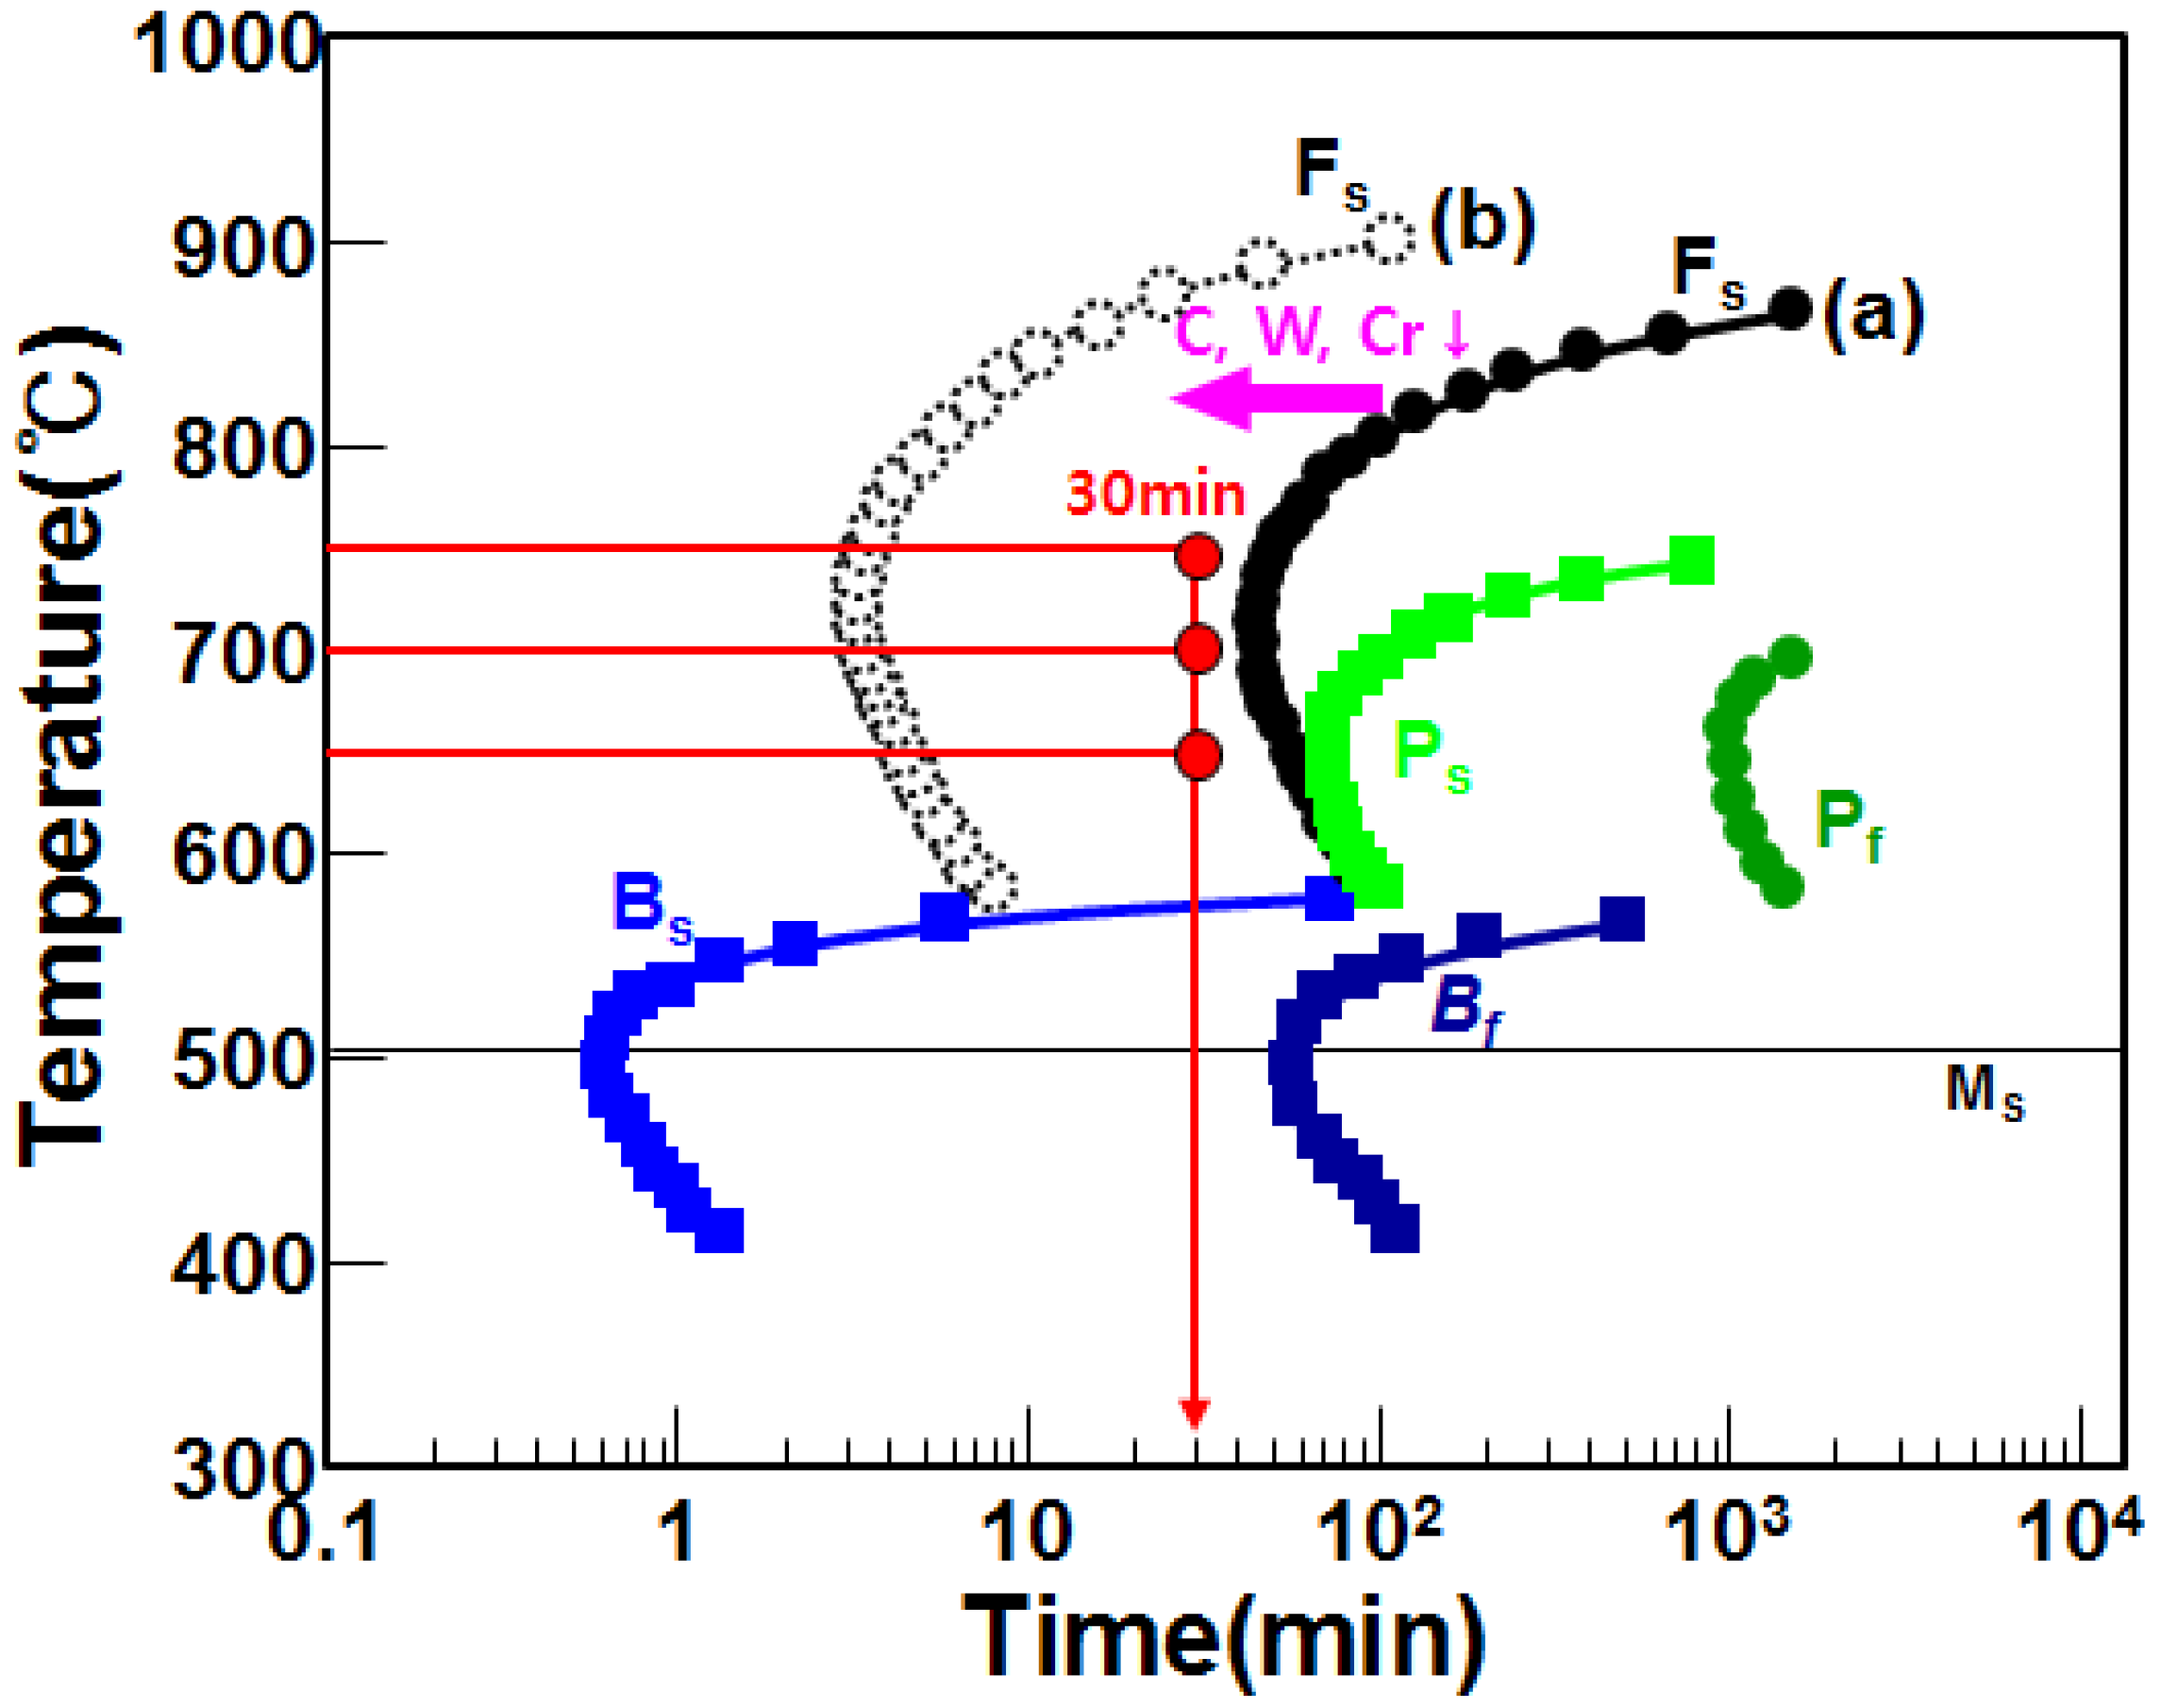
- In the case of the PWHT of the alloy composition of the matrix for 30 min at 650 °C, 700 °C, and 750 °C, the austenite at the grain boundary of CGHAZ does not transform into ferrite, because the ferrite nose time in the TTT curve is longer than 30 min. However, the grain boundary is a region where C, W, and Cr are depleted by M23C6 precipitation with high C, W, and Cr components. When C, W, and Cr are depleted, the ferrite nose time becomes shorter than 30 min, so that austenite at the grain boundary of CGHAZ is then transformed into ferrite.
Author Contributions
Funding
Acknowledgments
Conflicts of Interest
References
- Klueh, R.; Nelson, A. Ferritic/martensitic steels for next-generation reactors. J. Nucl. Mater. 2007, 371, 37–52. [Google Scholar] [CrossRef]
- Bendick, W.; Gabrel, J.; Hahn, B.; Vandenberghe, B. New low alloy heat resistant ferritic steels T/P23 and T/P24 for power plant application. Int. J. Press. Vessels Pip. 2007, 84, 13–20. [Google Scholar] [CrossRef]
- Haarmann, K.; Kottmann, G.; Vaillant, J. The T23/24 Book; Vallourec & Mannesmann: Dusseldorf-Rath, Germany, 2000. [Google Scholar]
- Nawrocki, J.; Dupont, J.; Robino, C.V.; Marder, A. The Stress-Relief Cracking Susceptibility of a New Ferritic Steel-Part I: Single-Pass Heat-Affected Zone Simulations; Sandia National Labs.: Livermore, CA, USA, 1999. [Google Scholar]
- Nawrocki, J.; Dupont, J.; Robino, C.; Puskar, J.; Marder, A. The mechanism of stress-relief cracking in a ferritic alloy steel. Weld. J. N. Y. 2003, 82, 25-S. [Google Scholar]
- Masuyama, F.; Yokoyama, T.; Sawaragi, Y.; Iseda, A. Service Exposure and Reliability Improvement: Nuclear, Fossil, and Petrochemical Plants; ASME: New York, NY, USA, 1994; Volume 288, pp. 141–146. [Google Scholar]
- Jiménez, J.A.; Carsí, M.; Ruano, O.A. Effect of rhenium on the microstructure and mechanical behavior of Fe–2.25 Cr–1.6 W–0.25 V-0.1 C bainitic steels. J. Mater. Sci. Technol. 2017, 33, 1487–1493. [Google Scholar] [CrossRef]
- Di Gianfrancesco, A. Materials for Ultra-Supercritical and Advanced Ultra-Supercritical Power Plants; Woodhead Publishing: Cambridge, UK, 2016. [Google Scholar]
- Wang, B.; Xueyuan, X.; Feng, Z.; Anfang, Q.; Zhengran, L.; Bo, Z.; Yongqiang, J.; Xiaoli, L. Research on water wall tubes and welded joints of 1000 MW USC tower boiler. In Proceedings of the 7th International Conference on Advances in Materials Technology for Fossil Power Plants, Waikoloa, HI, USA, 22–25 October 2013. [Google Scholar]
- Viswanathan, R. Advances in materials technology for fossil power plants. In Proceedings of the Fifth International Conference, Marco Island, FL, USA, 3–5 October 2007; ASM International: Materials Park, OH, USA, 2008. [Google Scholar]
- Heo, N.; Chang, J.; Kim, S.-J. Elevated temperature intergranular cracking in heat-resistant steels. Mater. Sci. Eng. A 2013, 559, 665–677. [Google Scholar] [CrossRef]
- Park, K.; Kim, S.; Chang, J.; Lee, C. Post-weld heat treatment cracking susceptibility of T23 weld metals for fossil fuel applications. Mater. Des. 2012, 34, 699–706. [Google Scholar] [CrossRef]
- Chang, J.; Kim, B.; Heo, N. Stress relief cracking on the weld of T/P23 steel. Procedia Eng. 2011, 10, 734–739. [Google Scholar] [CrossRef]
- Heo, N.; Chang, J.; Yoo, K.; Lee, J.; Kim, J. The mechanism of elevated temperature intergranular cracking in heat-resistant alloys. Mater. Sci. Eng. A 2011, 528, 2678–2685. [Google Scholar] [CrossRef]
- Chang, J.; Heo, N.; Lee, C. Intergranular cracking susceptibility of 2.25Cr1.3W and 9Cr1MoVNb weld metals at elevated temperatures. Met. Mater. Int. 2010, 16, 981–985. [Google Scholar] [CrossRef]
- Chang, J.; Heo, N.; Lee, C. Effects of mo addition on intergranular cracking behavior of 2.25CrW (P23) weld metal at elevated temperatures. Met. Mater. Int. 2011, 17, 131–135. [Google Scholar] [CrossRef]
- Belde, M.; Springer, H.; Inden, G.; Raabe, D. Multiphase microstructures via confined precipitation and dissolution of vessel phases: Example of austenite in martensitic steel. Acta Mater. 2015, 86, 1–14. [Google Scholar] [CrossRef]
- Raabe, D.; Sandlöbes, S.; Millán, J.; Ponge, D.; Assadi, H.; Herbig, M.; Choi, P.P. Segregation engineering enables nanoscale martensite to austenite phase transformation at grain boundaries: A pathway to ductile martensite. Acta Mater. 2013, 61, 6132–6152. [Google Scholar] [CrossRef]
- Lee, K.; Lee, S.; Na, H.; Kang, C. Ghost microstructure evolution and identification in the coarse grain heat affected zone of 2.25 Cr-1Mo-V-Ti steel using tint etching. Mater. Charact. 2016, 121, 31–39. [Google Scholar] [CrossRef]
- Lee, S.H.; Na, H.S.; Lee, K.W.; Choe, Y.; Kang, C.Y. Microstructural characteristics and M23C6 precipitate behavior of the course-grained heat-affected zone of T23 steel without post-weld heat treatment. Metals 2018, 8, 170. [Google Scholar] [CrossRef]
- Dhooge, A.; Vekeman, J. New generation 2 1/4 Cr steels T/P 23 and T/P 24 weldability and high temperature properties. Weld. World 2005, 49, 75–93. [Google Scholar] [CrossRef]
- Shinya, T.; Tomita, Y. Effect of calcium treatments and strain rate on reheat cracking of vanadium-modified 2.25 cr-1mo steel. Mater. Charact. 1998, 40, 221–225. [Google Scholar] [CrossRef]
- Nevasmaa, P.; Salonen, J. Reheat cracking susceptibility and toughness of 2% CrMoWVNb P23 steel welds. Weld. World 2008, 52, 68–78. [Google Scholar] [CrossRef]
- Kaneko, K.; Fukunaga, T.; Yamada, K.; Nakada, N.; Kikuchi, M.; Saghi, Z.; Barnard, J.S.; Midgley, P.A. Formation of M23C6-type precipitates and chromium-depleted zones in austenite stainless steel. Scr. Mater. 2011, 65, 509–512. [Google Scholar] [CrossRef]
- Thorvaldsson, T.; Dunlop, G. Grain boundary Cr-depleted zones in Ti and Nb stabilized austenitic stainless steels. J. Mater. Sci. 1983, 18, 793–803. [Google Scholar] [CrossRef]
- Almubarak, A.; Abuhaimed, W.; Almazrouee, A. Corrosion behavior of the stressed sensitized austenitic stainless steels of high nitrogen content in seawater. Int. J. Electrochem. 2013, 2013. [Google Scholar] [CrossRef]
- Nakamichi, H.; Sato, K.; Miyata, Y.; Kimura, M.; Masamura, K. Quantitative analysis of Cr-depleted zone morphology in low carbon martensitic stainless steel using Fe-(s) TEM. Corros. Sci. 2008, 50, 309–315. [Google Scholar] [CrossRef]
- Gaško, M.; Rosenberg, G. Correlation between hardness and tensile properties in ultra-high strength dual phase steels–short communication. Mater. Eng. 2011, 18, 155–159. [Google Scholar]
- Shen, Y.-L.; Chawla, N. On the correlation between hardness and tensile strength in particle reinforced metal matrix composites. Mater. Sci. Eng. A 2001, 297, 44–47. [Google Scholar] [CrossRef]
- Chenna, K.S.; Kumar, G.N.; Jha Abhay, K.; Bhanu, P. On the prediction of strength from hardness for copper alloys. J. Mater. 2013, 2013. [Google Scholar] [CrossRef]
- Na, H.S.; Kim, B.H.; Lee, S.H.; Kang, C.Y. Thermodynamic alloy design of high strength and toughness in 300 mm thick pressure vessel wall of 1.25 Cr-0.5 Mo steel. Metals 2018, 8, 70. [Google Scholar] [CrossRef]


| Material | Chemical Composition (at. %) | |||||||||||||
|---|---|---|---|---|---|---|---|---|---|---|---|---|---|---|
| C | Si | Mn | Ni | Cr | Mo | V | Nb | Al | Ti | B | W | N | Fe | |
| SA213-T23 | 0.07 | 0.24 | 0.50 | 0.11 | 2.09 | 0.15 | 0.22 | 0.028 | 0.018 | 0.042 | 0.0017 | 1.66 | 0.0095 | Bal |
© 2018 by the authors. Licensee MDPI, Basel, Switzerland. This article is an open access article distributed under the terms and conditions of the Creative Commons Attribution (CC BY) license (http://creativecommons.org/licenses/by/4.0/).
Share and Cite
Lee, S.-H.; Na, H.-S.; Lee, K.-W.; Lee, J.-Y.; Kang, C.Y. Effect of Austenite-to-Ferrite Phase Transformation at Grain Boundaries on PWHT Cracking Susceptibility in CGHAZ of T23 Steel. Metals 2018, 8, 416. https://doi.org/10.3390/met8060416
Lee S-H, Na H-S, Lee K-W, Lee J-Y, Kang CY. Effect of Austenite-to-Ferrite Phase Transformation at Grain Boundaries on PWHT Cracking Susceptibility in CGHAZ of T23 Steel. Metals. 2018; 8(6):416. https://doi.org/10.3390/met8060416
Chicago/Turabian StyleLee, Seong-Hyeong, Hye-Sung Na, Kyong-Woon Lee, Jeong-Yong Lee, and Chung Yun Kang. 2018. "Effect of Austenite-to-Ferrite Phase Transformation at Grain Boundaries on PWHT Cracking Susceptibility in CGHAZ of T23 Steel" Metals 8, no. 6: 416. https://doi.org/10.3390/met8060416
APA StyleLee, S.-H., Na, H.-S., Lee, K.-W., Lee, J.-Y., & Kang, C. Y. (2018). Effect of Austenite-to-Ferrite Phase Transformation at Grain Boundaries on PWHT Cracking Susceptibility in CGHAZ of T23 Steel. Metals, 8(6), 416. https://doi.org/10.3390/met8060416