Article

Synthesis and Electrochemical Properties of Ti-Si Alloys Prepared by Mechanical Alloying and Heat Treatment

1
Departamento de Ingeniería en Metalurgia, Universidad de Atacama, Copiapó 1530000, Chile
2
Departamento de Ingeniería en Metalúrgica y de Materiales, Universidad Técnica Federico Santa María, Valparaíso 2340000, Chile
3
Escuela de Diseño, Universidad Adolfo Ibáñez, Santiago 7910000, Chile
4
Centro de Estudios e Investigaciones Técnicas de Gipuzkoa, CEIT-IK4, 20018 San Sebastián, España
*
Author to whom correspondence should be addressed.
Metals 2018, 8(6), 417; https://doi.org/10.3390/met8060417
Submission received: 28 April 2018 / Revised: 29 May 2018 / Accepted: 30 May 2018 / Published: 4 June 2018
(This article belongs to the Special Issue Mechanical Alloying 2018)

Abstract

:
The aim of this work was to study the synthesis and electrochemical properties of Ti 2 wt %-Si alloys prepared by mechanical alloying (MA) and heat treatment. The MA process was performed under Ar atmosphere. The structural, morphological, and compositional evolutions during the milling and subsequent heat treatment were investigated by X-ray diffraction, energy-dispersive spectroscopy, and scanning electron microscopy. The electrochemical behavior was evaluated by open circuit potential and linear sweep voltammetry measurements. The results showed that the MA process promotes the formation of a supersaturated α-Ti-Si solid solution. During heat treatment, the Si remaining in the mechanically alloyed powders and the Si from the α-Ti-Si supersaturated solid solution reacted with Ti to form Ti-Si intermetallic compounds. These compounds have a fine and homogeneous distribution in the α-Ti matrix, which cannot be achieved by conventional casting methods. Additionally, the electrochemical evaluations revealed that the mechanically alloyed and heat-treated Ti 2 wt %-Si powders have better corrosion resistance in 1.63 M H2SO4 than the pure Ti and MA Ti-Si samples. This is likely due to the particular microstructure produced during the milling and subsequent heat treatment.

1. Introduction

A rolled Pb-Ca-Sn alloy (0.07 wt % Ca and 1.35 wt % Sn) is the preferred anode composition for Cu electrowinning because of its low cost and relatively good corrosion resistance in sulfuric acid [1]. The normal working life of this anode ranges from 4 to 5 years [2].
On the other hand, dimensionally stable anodes (DSAs) are characterized by a conducting substrate (usually Ti) coated with an active layer (RuO2, IrO2, Ta2O5, TiO2, etc.), which catalyzes specific electrochemical reactions. DSAs were developed by H. Beer in the 1960s for the chlorine industry. The original DSA consisted of a Ti substrate with RuO2-TiO2 coating [3].
It has been reported that the typical Ti/RuO2-TiO2 DSA used in the chlor-alkali industry has a very limited life under Cu electrowinning conditions because of serious corrosion of the RuO2 [4]. Because IrO2 has good electrocatalytic activity, good electrical conductivity, and better stability than RuO2, oxide electrodes with IrO2 as the main active component have been extensively studied [5,6]. Thus, IrO2 30 mol % Ta2O5 has been determined as the optimum coating for Cu electrowinning conditions [7,8]. The addition of Ta2O5 improves the stability of IrO2 without significantly decreasing its electrocatalytic activity [7].
The main advantage of DSAs, compared with Pb-based anodes, is their low O2 overpotential (0.3–0.5 V), excellent dimensional stability, and absence of slime formation. The lower energy consumption can be directly translated into substantial operating costs savings [9]. However, the application of DSAs in the Cu electrowinning industry has been very limited because of their high costs and reduced lifetime (1 to 3 years) [10]. In this context, Hu et al. [11] found that the degradation process of DSAs begins with the penetration of electrolyte through the porous structure of the catalytic oxide layer and then follows the dissolution and anodic oxidation of the Ti base that directly leads to mechanical loss of the oxide catalyst layer.
On the basis of these results, the DSAs’ durability may be extended by improving the corrosion resistance of the Ti-based material. Accordingly, Jiang et al. [12] reported that Ti-Si alloys exhibit high resistance to corrosion in acid conditions. This is due to the formation of SiO2 and Si-doping the TiO2 surface oxide film. However, the presence of Ti-Si intermetallics decreases the electrical conductivity of the alloys, impeding their use as substrates in DSAs. Because of the low solubility of Si in an α-Ti phase (0.3 wt % Si at 865 °C [13]), only far-from-equilibrium synthesis methods could be successful in producing a supersaturated solid solution (SS), suitable for DSAs.
Mechanical alloying (MA) is a solid-state and powder processing technique that involves the repeated cold welding, fracturing, and re-welding of a mixture of powder particles in a high-energy ball mill, to produce a material with a controlled microstructure [14]. Originally, MA was developed for oxide-dispersion strengthened nickel- and iron-based superalloys, for applications in the aerospace industry [15]. Today, this technique is used to synthesize equilibrium and non-equilibrium materials, such as amorphous alloys [16,17], nanocrystalline materials [18,19], intermetallic compounds [20,21], and supersaturated SSs [22].
There are a few reports on MA for the Ti-Si system. Most of them focus on the synthesis of intermetallic compounds, because of their attractive properties such as high melting point temperature, low specific weight, good oxidation resistance, and high biocompatibility. Ahn et al. [23] and Oleszak et al. [24] studied the MA of Ti 26 wt % Si powders (Ti5Si3 intermetallic composition). They found that prolonged milling time promotes the amorphization of the initial powder mixture. Similarly, Oehring and Bormann [25] reported the formation of a Ti5Si3 intermetallic compound after 12.5 h of planetary milling. Additionally, Park et al. [26] found that Ti5Si3 can also be obtained by the combination of MA and heat treatment. Yang et al. [27] studied the MA of TixSi100−x (x = 75, 62.5, 50, 33.3, and 25) powders. They reported that Ti75Si25, Ti62.5Si37.5, and Ti50Si50 powders were completely amorphized after 45 h of planetary milling, in contrast to Ti33.3Si66.7 and Ti25Si25, where no obvious amorphization was observed. Also, Gu et al. [28] investigated the MA process of Ti 8.39 wt % Si (eutectic composition) powders and reported the formation of a supersaturated SS of Si in Ti with traces of an amorphous phase.
Although MA has been investigated for the Ti-Si system, there is no information about the behavior of Ti-rich-Si alloys (Ti > 92 wt %) when using this process. Moreover, the electrochemical behavior of Ti-Si alloys synthetized by MA has not been investigated. Based on the above, the aim of this work was to study the synthesis and electrochemical properties of Ti 2 wt %-Si alloys prepared by MA and heat treatment and to evaluate the possibility of obtaining a Ti-Si supersaturated SS that can be used as substrate in DSAs.

2. Materials and Methods

Elemental Ti (99.7% purity, particle size less than 150 µm, Sigma-Aldrich, St. Louis, MO, USA) and Si (99.0% purity, particle size less than 45 µm, Sigma-Aldrich) powders were mechanically alloyed in a Ti 2 wt %-Si ratio in a SPEX 8000D mill under a controlled Ar atmosphere using a ball-to-powder-weight ratio of 10 to 1. To prevent excessive welding during MA, 1 wt % stearic acid was added as a processing control agent. The milling times employed were 0.5, 1, 3, 5, and 10 h. To minimize temperature rise caused by mechanical alloying during the 3, 5, and 10 h processes, these were performed discontinuously, i.e., 1 h of milling followed by rest periods of 0.5 h.
The microstructural evolution of the powders during milling was studied by X-ray diffraction (XRD) in a Shimadzu XDR-6000 diffractometer (Kyoto, Japan) using Cu Kα radiation. The XRD analyses were carried out using an angular step of 0.02° (2θ) and a counting time per step of 4 s. XRD patterns were analyzed with the Rietveld method [29], using the Materials Analysis Using Diffraction (MAUD) program [30]. Additionally, the chemical homogeneity of some cross-sectioned samples was determined using a Zeiss Sigma 500 VP field emission scanning electron microscope (FE-SEM, Oberkochen, Germany) equipped with an energy-dispersive X-ray analyzer (EDS). The morphology of the powders was evaluated using a Zeiss EVO MA 10 thermionic scanning electron microscope (SEM, Oberkochen, Germany).
Thermal behavior of the mechanically alloyed powder was studied through a combination of differential scanning calorimetry (DSC, TA Instruments, Wilmington, DE, USA), XRD, and FE-SEM. The DSC analyses were carried out in TA Instruments Q20 equipment. Under an Ar flow of 50 mL min−1, samples were heated from room temperature to 650 °C at a heating rate of 10 °C min−1 and cooled immediately thereafter to 50 °C at the same rate.
The electrochemical characterization of the Ti-Si alloy powders was performed on a modified carbon paste electrode immersed in an aerated 1.63 M H2SO4 solution. For the preparation of the working electrodes, 0.25 g of the Ti-Si alloy and 0.25 g of graphite powders were hand-mixed with 0.2 cm3 of mineral oil until a homogeneous paste was obtained. This paste was then tightly packed into a glass tube with an internal diameter of 3 mm and a copper wire was used to ensure the electrical contact. The electrochemical measurements were carried out in a conventional three-electrode cell with an Ag/AgCl (sat. KCl) and platinum wire as reference and counter electrodes, respectively. Open circuit potential (EOC) and linear sweep voltammetry (LSV) were performed at room temperature (22 ± 0.5 °C) using a BioLogic (SP-150) potentiostat/galvanostat. To determine the EOC for each sample, the working electrode was maintained for 13 h in the test solution. After reaching steady state, LSV measurements were performed at a scan rate of 1 mV s−1 in the anodic direction. The concentration of Ti dissolved was determined after each electrochemical test by inductively coupled plasma spectrometry (ICP) using Perkin Elmer Optima 8000 equipment (Waltham, MA, USA).

3. Results and Discussion

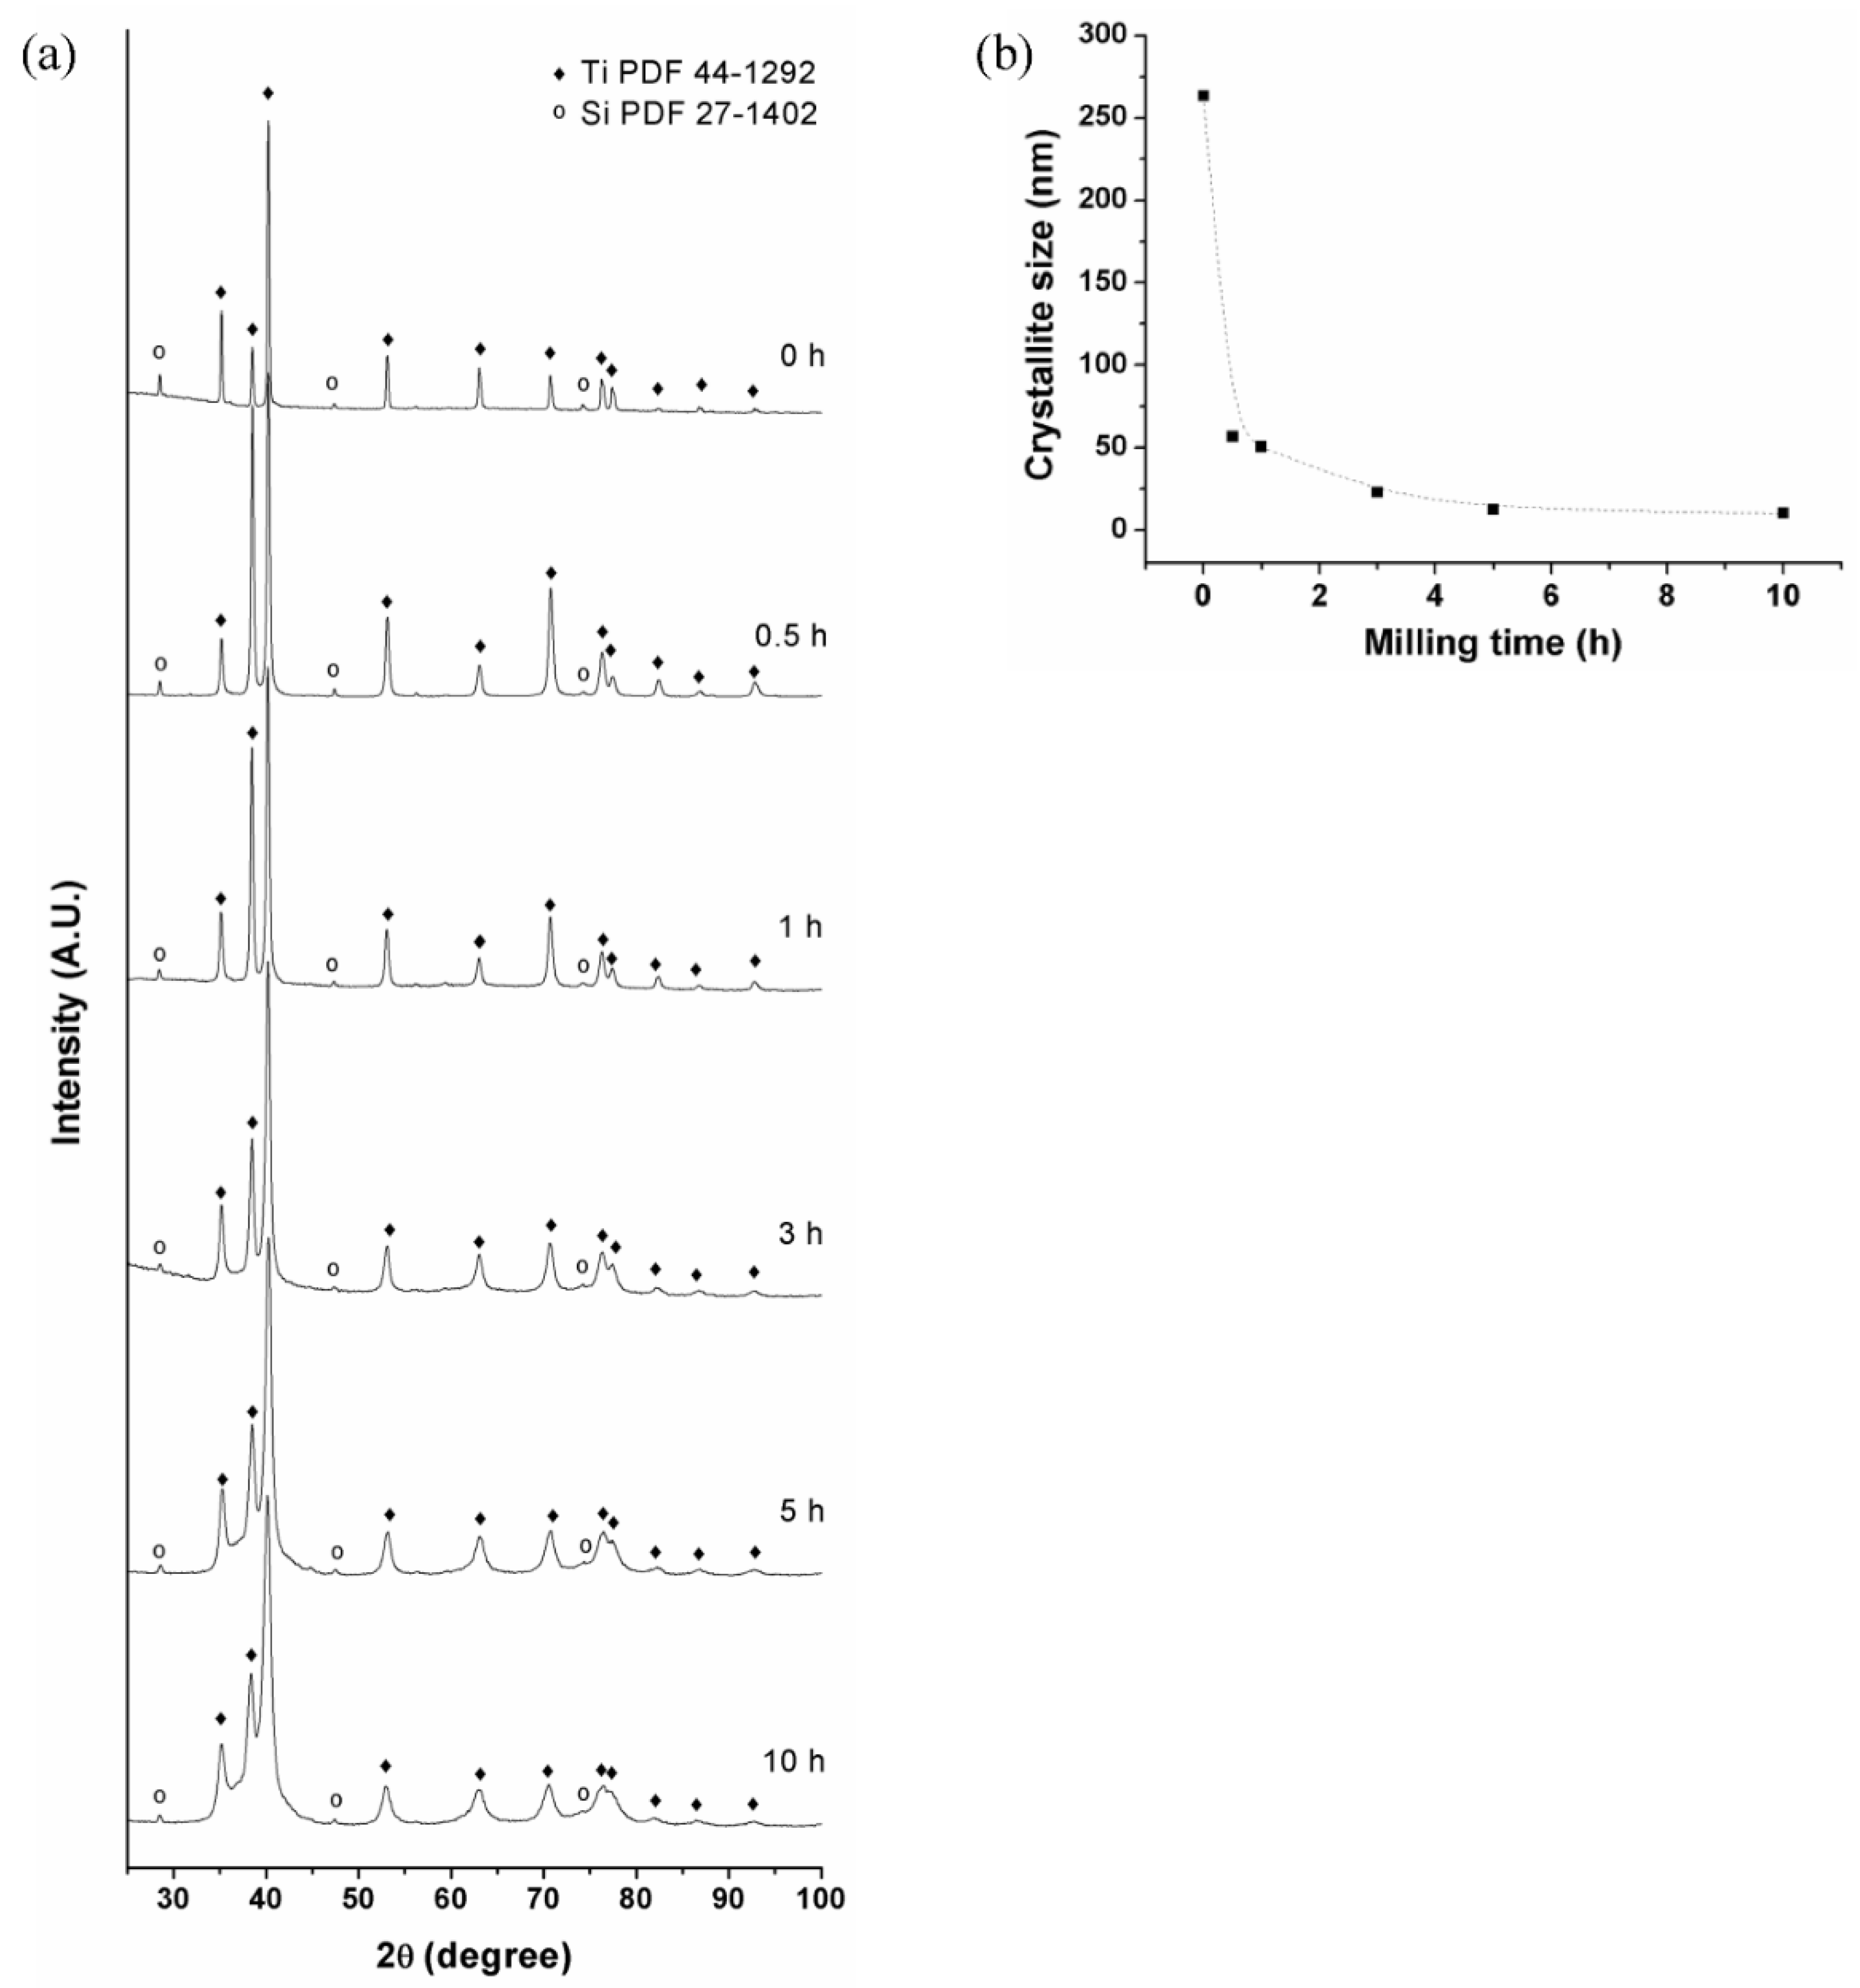
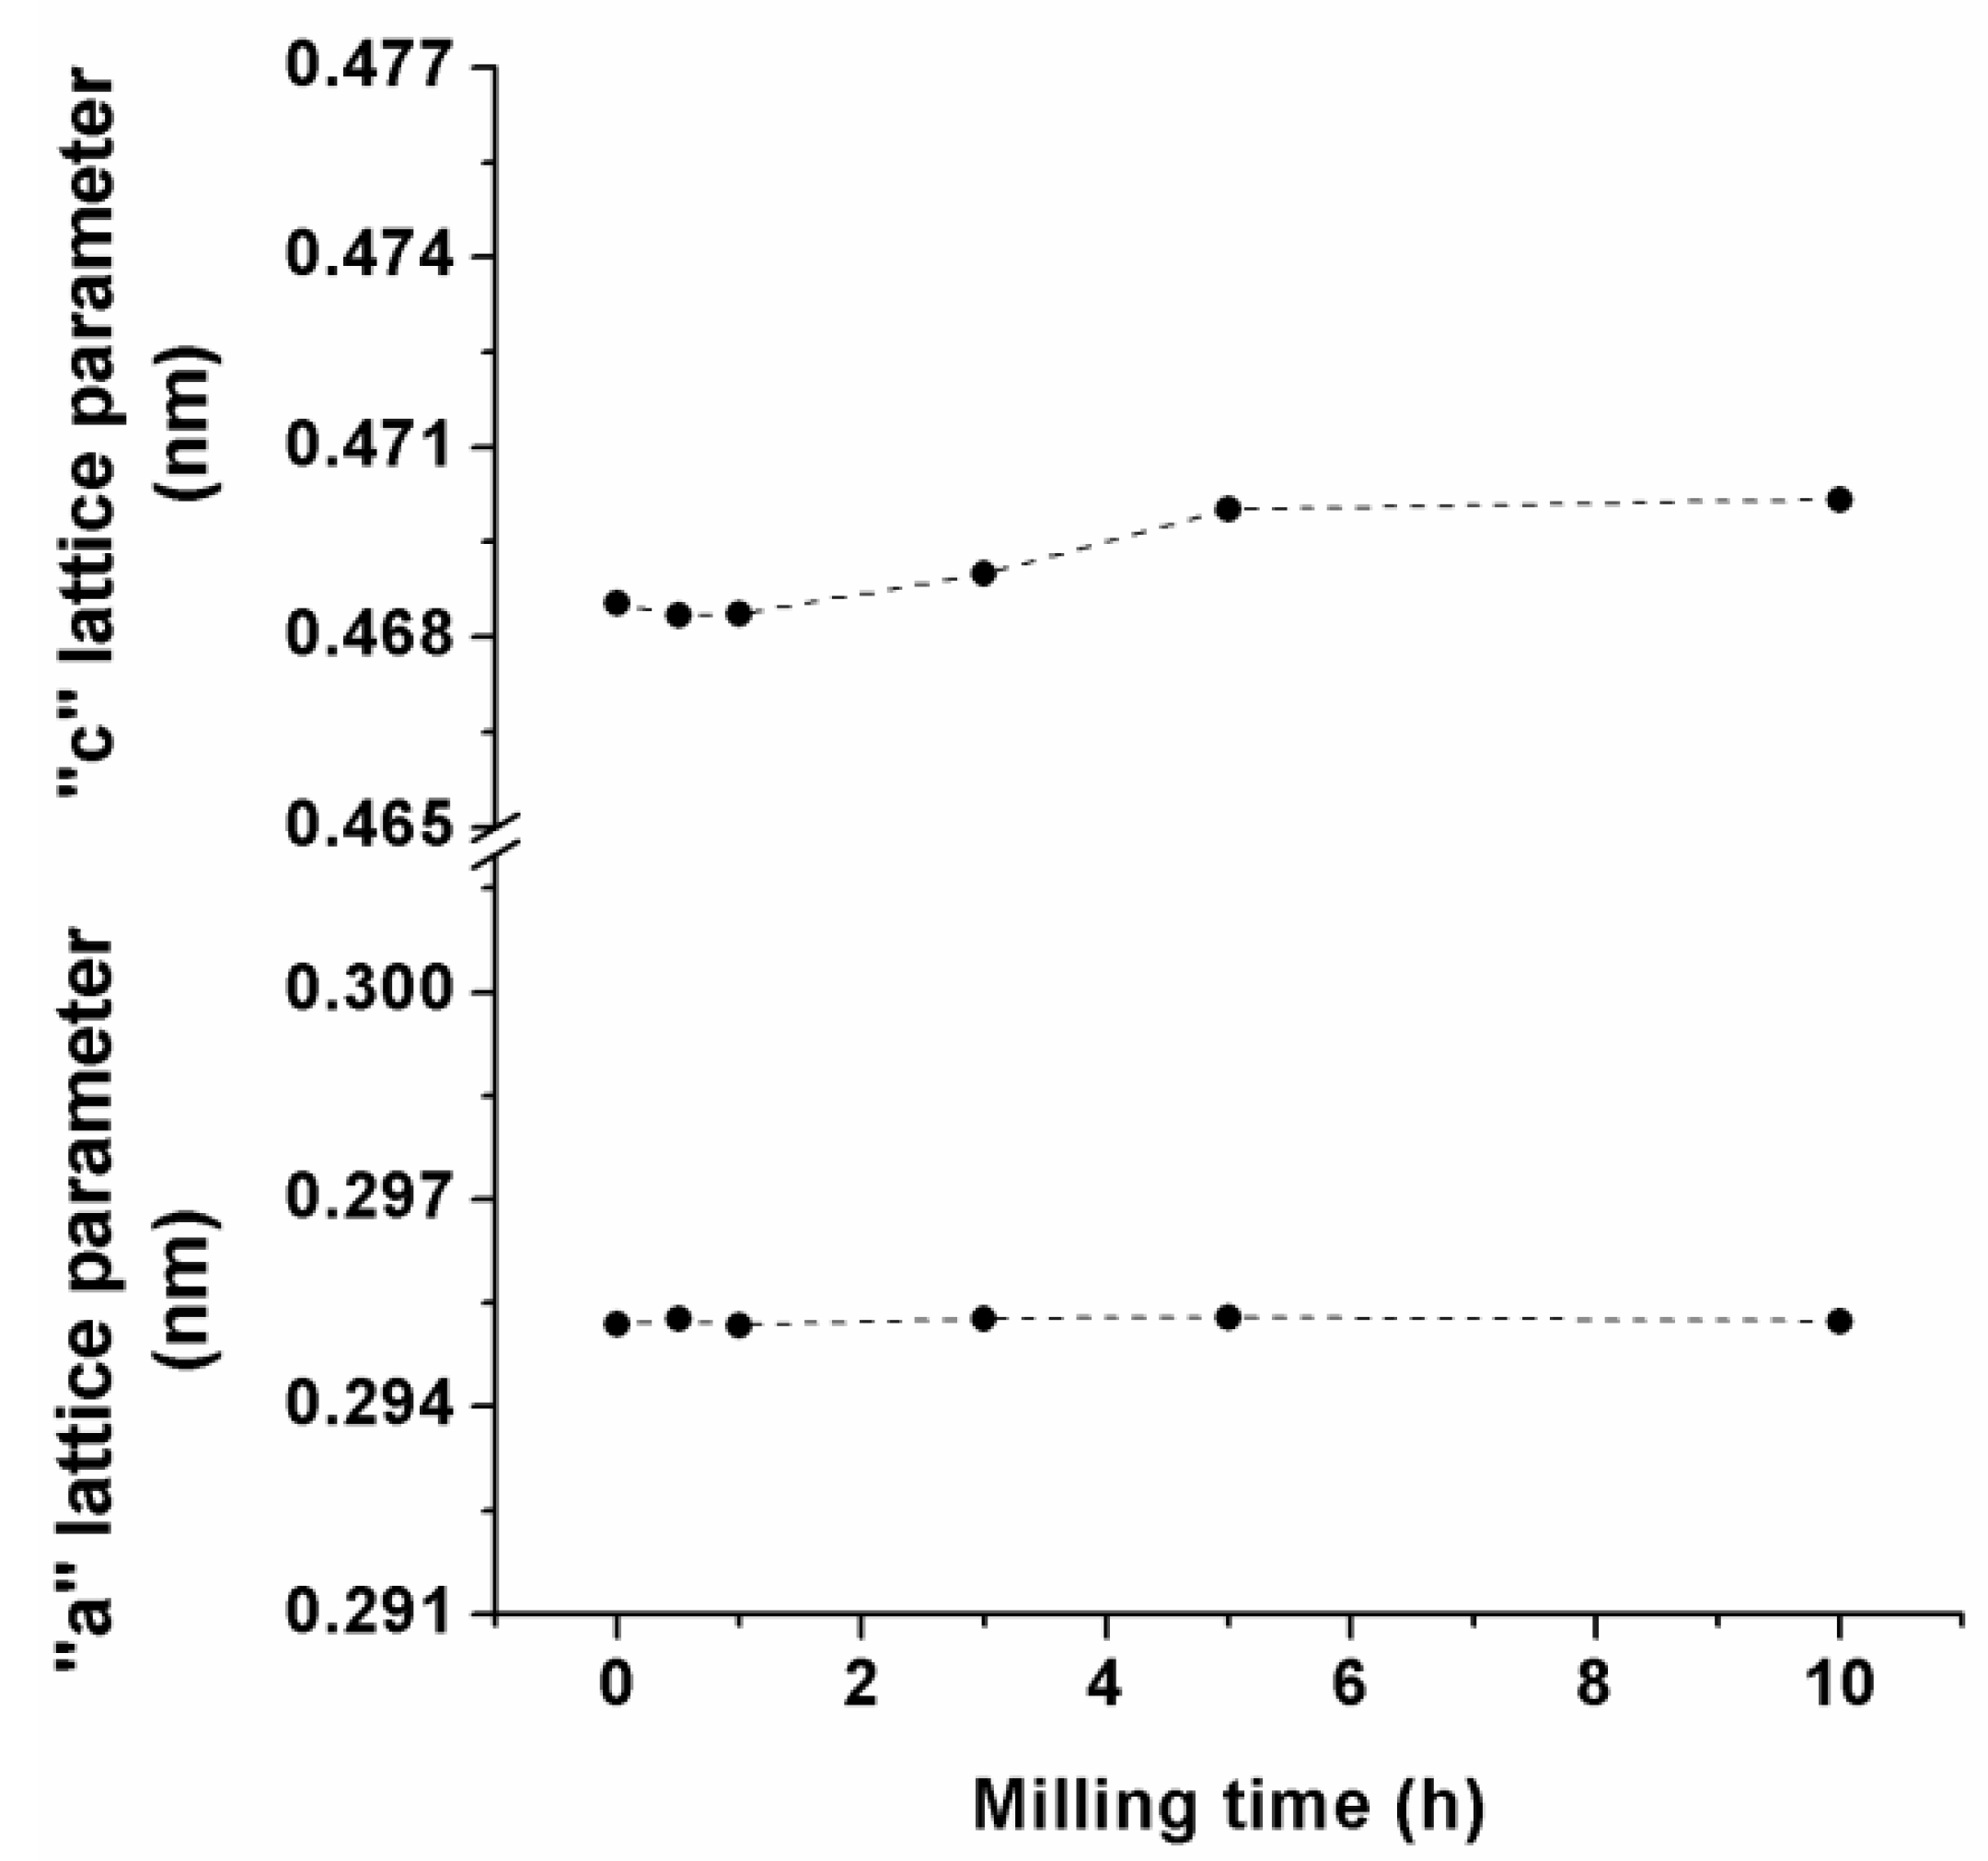
3.1. Mechanical Alloying

Figure 1 shows the evolution of the powder morphology during the MA process. It can be observed that, in the initial stage of milling (Figure 1b), the powders consist of flat agglomerates produced because of the ductile nature of Ti, which is plastically deformed. These agglomerates present an average diameter of 125 ± 18 µm, which is larger than that of the initial elemental powders. At intermediate milling time, flat agglomerates are fractured and the flat particles produced are welded together by cold deformation to form large agglomerates with rough surfaces (Figure 1c). Between 3 and 5 h of milling, a significant decrease in agglomerate sizes is observed (Figure 1a). This is due to the fracture of hardened powder resulting from the high plastic deformation accumulated during milling [31]. Finally, between 5 and 10 h, the agglomerate size approaches a minimum value, which remains constant (Figure 1d). This behavior suggests that a balance between fracturing and cold welding has been achieved [32]. Additionally, with increased milling time, the particle size distribution becomes narrower. For example, the sample milled for 0.5 h has an average agglomerated size of 125 ± 18 µm, whereas 10 h of milling yielded a size of 16 ± 2 µm. This can be explained by considering that in the final stage of milling, the larger-than-average particles are reduced in size and the smaller-than-average fragments simultaneously grow through the agglomeration of smaller particles [33].
Figure 2a shows the XRD patterns of the samples obtained with different milling times. To observe the evolution of the phases during MA, the XRD patterns were normalized in relation to the maximum intensity. It can be seen that the Ti and Si peaks widen with increased milling time, likely due to the reduction in the crystallite size and accumulation of micro-strain in the powders during the process. Crystallite sizes were calculated from XRD patterns via Rietveld refinement in the MAUD program. As seen in Figure 2b, the crystallite size of the Ti phase rapidly reduced from 264 to 51 nm during the first hour of milling, and after 5 h, it reached an equilibrium value of about 11 nm. This steady state is determined by the balance between processes that tend to decrease the crystallite size (plastic deformation and dislocation motion) and those that increase the size (recovery and recrystallization) [34]. Unfortunately, it was difficult to determine the Si crystallite size because of the low intensity of the diffraction peaks. In order to rigorously analyze and discuss the evolution of micro-strain during the mechanical alloying process, it is necessary to isolate the contributions of non-uniform lattice distortion (solid solution inhomogeneity), dislocation, and twinning, among other factors [35]. This work is complicated for the system under study and it is beyond the scope of this research.
During the first hour of milling, an increase in the relative intensity of the second Ti diffraction peak (I (0 0 2), 2θ = 38.44°) was observed (Figure 2a). This indicates that the texture is produced by the preferential plastic deformation during the initial stage of milling, resulting in powder with a laminar morphology (Figure 1b). As MA continues, the morphology of the particles changes from laminar to equiaxial and the texture is no longer observed. This “basal texture” is the most common in α-Ti alloys cross rolled below 900 °C [36]. On the basis of the careful analysis of the XRD patterns published by Yang et al. [27], it is possible to observe the development of this texture in the first stage of milling in that work, even though the authors did not mention such behavior.
In order to determine the phase distribution during the MA process, the 10 h powders were metallographically prepared and observed by FE-SEM (Figure 3). On the basis of the EDS analyses, the black areas in Figure 3 correspond to Si, dark gray areas to Ti oxides, and white areas to Fe impurities from the erosion of the vial and balls. The presence of Si confirms the results obtained by XRD, where this element could be detected even after 10 h of milling (Figure 2a). The existence of Ti oxide in the milled powders is explained by the high thermodynamic affinity between oxygen and Ti.
The table on Figure 3 lists the average of five EDS analyses carried out to determine the matrix composition. It can be seen that the Si concentration exceeded its maximum equilibrium solid solubility limit in the α-Ti phase (0.3 wt % Si at 865 °C [13]), indicating the formation of a supersaturated SS during the milling process. A similar observation was reported by Gu et al. [28] who studied the MA of the Ti 8.39 wt %-Si system. They concluded that after 60 h of milling, a complete dissolution of Si in Ti is achieved. In this work, the Si solubility was not measured; it was only estimated using Vegard’s law. It is important to note that the diffraction peaks presented in that reference [28] show great broadening and intensity reduction after 45 h of milling; this makes the calculation of lattice parameter sizes of the α-Ti phase difficult, consequently, Vegard’s law should not be used to determine the Si content of the supersaturated SS. Therefore, the high Si solubility in the crystalline α-Ti phase reported by Gu et al. [28] may be overestimated.
Respective lattice parameter sizes for powder treatments were obtained from Rietveld refinements of their X-ray diffraction patterns using the MAUD software. Figure 4 presents the evolution of the lattice parameter sizes of α-Ti during milling. It is possible to observe that the lattice parameters did not show significant changes during the MA process. These results are not in agreement with previous reports [27,28,37]. It is well established that the Si incorporation in substitutional positions in the hexagonal-closed-packed structure of Ti shrinks the unit cell. This discrepancy can be explained by considering the high oxygen content in the α-Ti phase obtained in this work (Figure 3). It has been reported that the oxygen atoms occupy the octahedral interstices in the α-Ti SS, expanding the unit cell [38,39]. This expansion may compensate the shrinkage due to the Si atoms. The oxygen contamination is probably from the stearic acid used as processing control agent, initial powders, and/or the milling atmosphere. The effect of oxygen on the size of the α-Ti lattice parameters is further discussed in the next section.

3.2. Thermal Stability

To evaluate the thermal stability of the powders after MA, they were analyzed by DSC. Figure 5 shows the DSC traces for the powder milled during 10 h. Two heating steps were performed to determine the reversibility of the process. There is mainly one irreversible exothermic event between 430 °C and 650 °C: all the samples exhibited a similar behavior.
To determine the origin of the exothermic reaction, the heated powders were analyzed by XRD. The results are presented in Figure 6a. In addition to the Ti-Si intermetallic compounds and TiO2, there were at least two α-Ti SSs with different lattice parameters. Figure 6b presents the lattice parameters of the α-Ti SSs after the MA and heat treatment. The lattice parameters of the α-Ti SS1 did not significantly differ from those obtained from the MA samples, contrary to the “c” parameter of the α-Ti SS2, which increased considerably. This can be explained by considering that during the heat treatment, the α-Ti-Si supersaturated SS (with high oxygen concentration) lost Si because of the Ti-Si intermetallic formation, thus expanding its unit cell. Simultaneously, during this process the powders could absorb more oxygen from the atmosphere. It is known that when oxygen atoms are incorporated in a Ti structure, the “c” lattice parameter suffers a considerable increase, whereas “a” remains practically constant [38]. This is due to the anisotropic strain in the crystal lattice produced by the incorporation of oxygen atoms in the octahedral interstices of the Ti structure [40].
Additionally, an increase in α-Ti SS crystallite size was observed during heat treatment. For example, the crystallite size of α-Ti increased from 10 (MA) to 40 nm (α-Ti SS1 and α-Ti SS2 average crystallite sizes) when the sample milled for 10 h was heated to 650 °C. Considering the experimental conditions employed in this work (continuous heating to 650 °C immediately followed by cooling to 50 °C, both at 10 °C/min), α-Ti SS crystallite size growth was due to recovery and recrystallization, and not grain growth; the temperature employed was not high enough to promote the latter process [36,41].
The heated powders were metallographically prepared and observed by FE-SEM. On the basis of the EDS analyses, the white areas in Figure 7a correspond to Fe impurities and the grey areas to Ti-Si intermetallic compounds. Additionally, isolated zones with a high TiO2 content were observed (Figure 7b). It is worth noting that elemental Si was not detected in the heat-treated powders. The EDS analyses of the matrix (table in Figure 7a) indicated a lower Si content compared with the matrix composition of the mechanically alloyed powders (table in Figure 3). These observations confirmed the results obtained by XRD (Figure 6a).
According to the results, the elemental Si in the MA powders (Figure 3) and the Si from the α-Ti-Si supersaturated SS reacted with Ti to form Ti-Si intermetallic precipitates during the heat treatment. These intermetallic compounds showed a fine and homogeneous distribution in the α-Ti matrix, which cannot be achieved using conventional casting methods [42,43]. Obtaining this particular microstructure was most likely due to the high density of crystalline defects generated during milling, which acted as preferential sites for Ti-Si intermetallic nucleation. Additionally, recrystallization of α-Ti SS and localized Ti oxidation were also observed during heating.

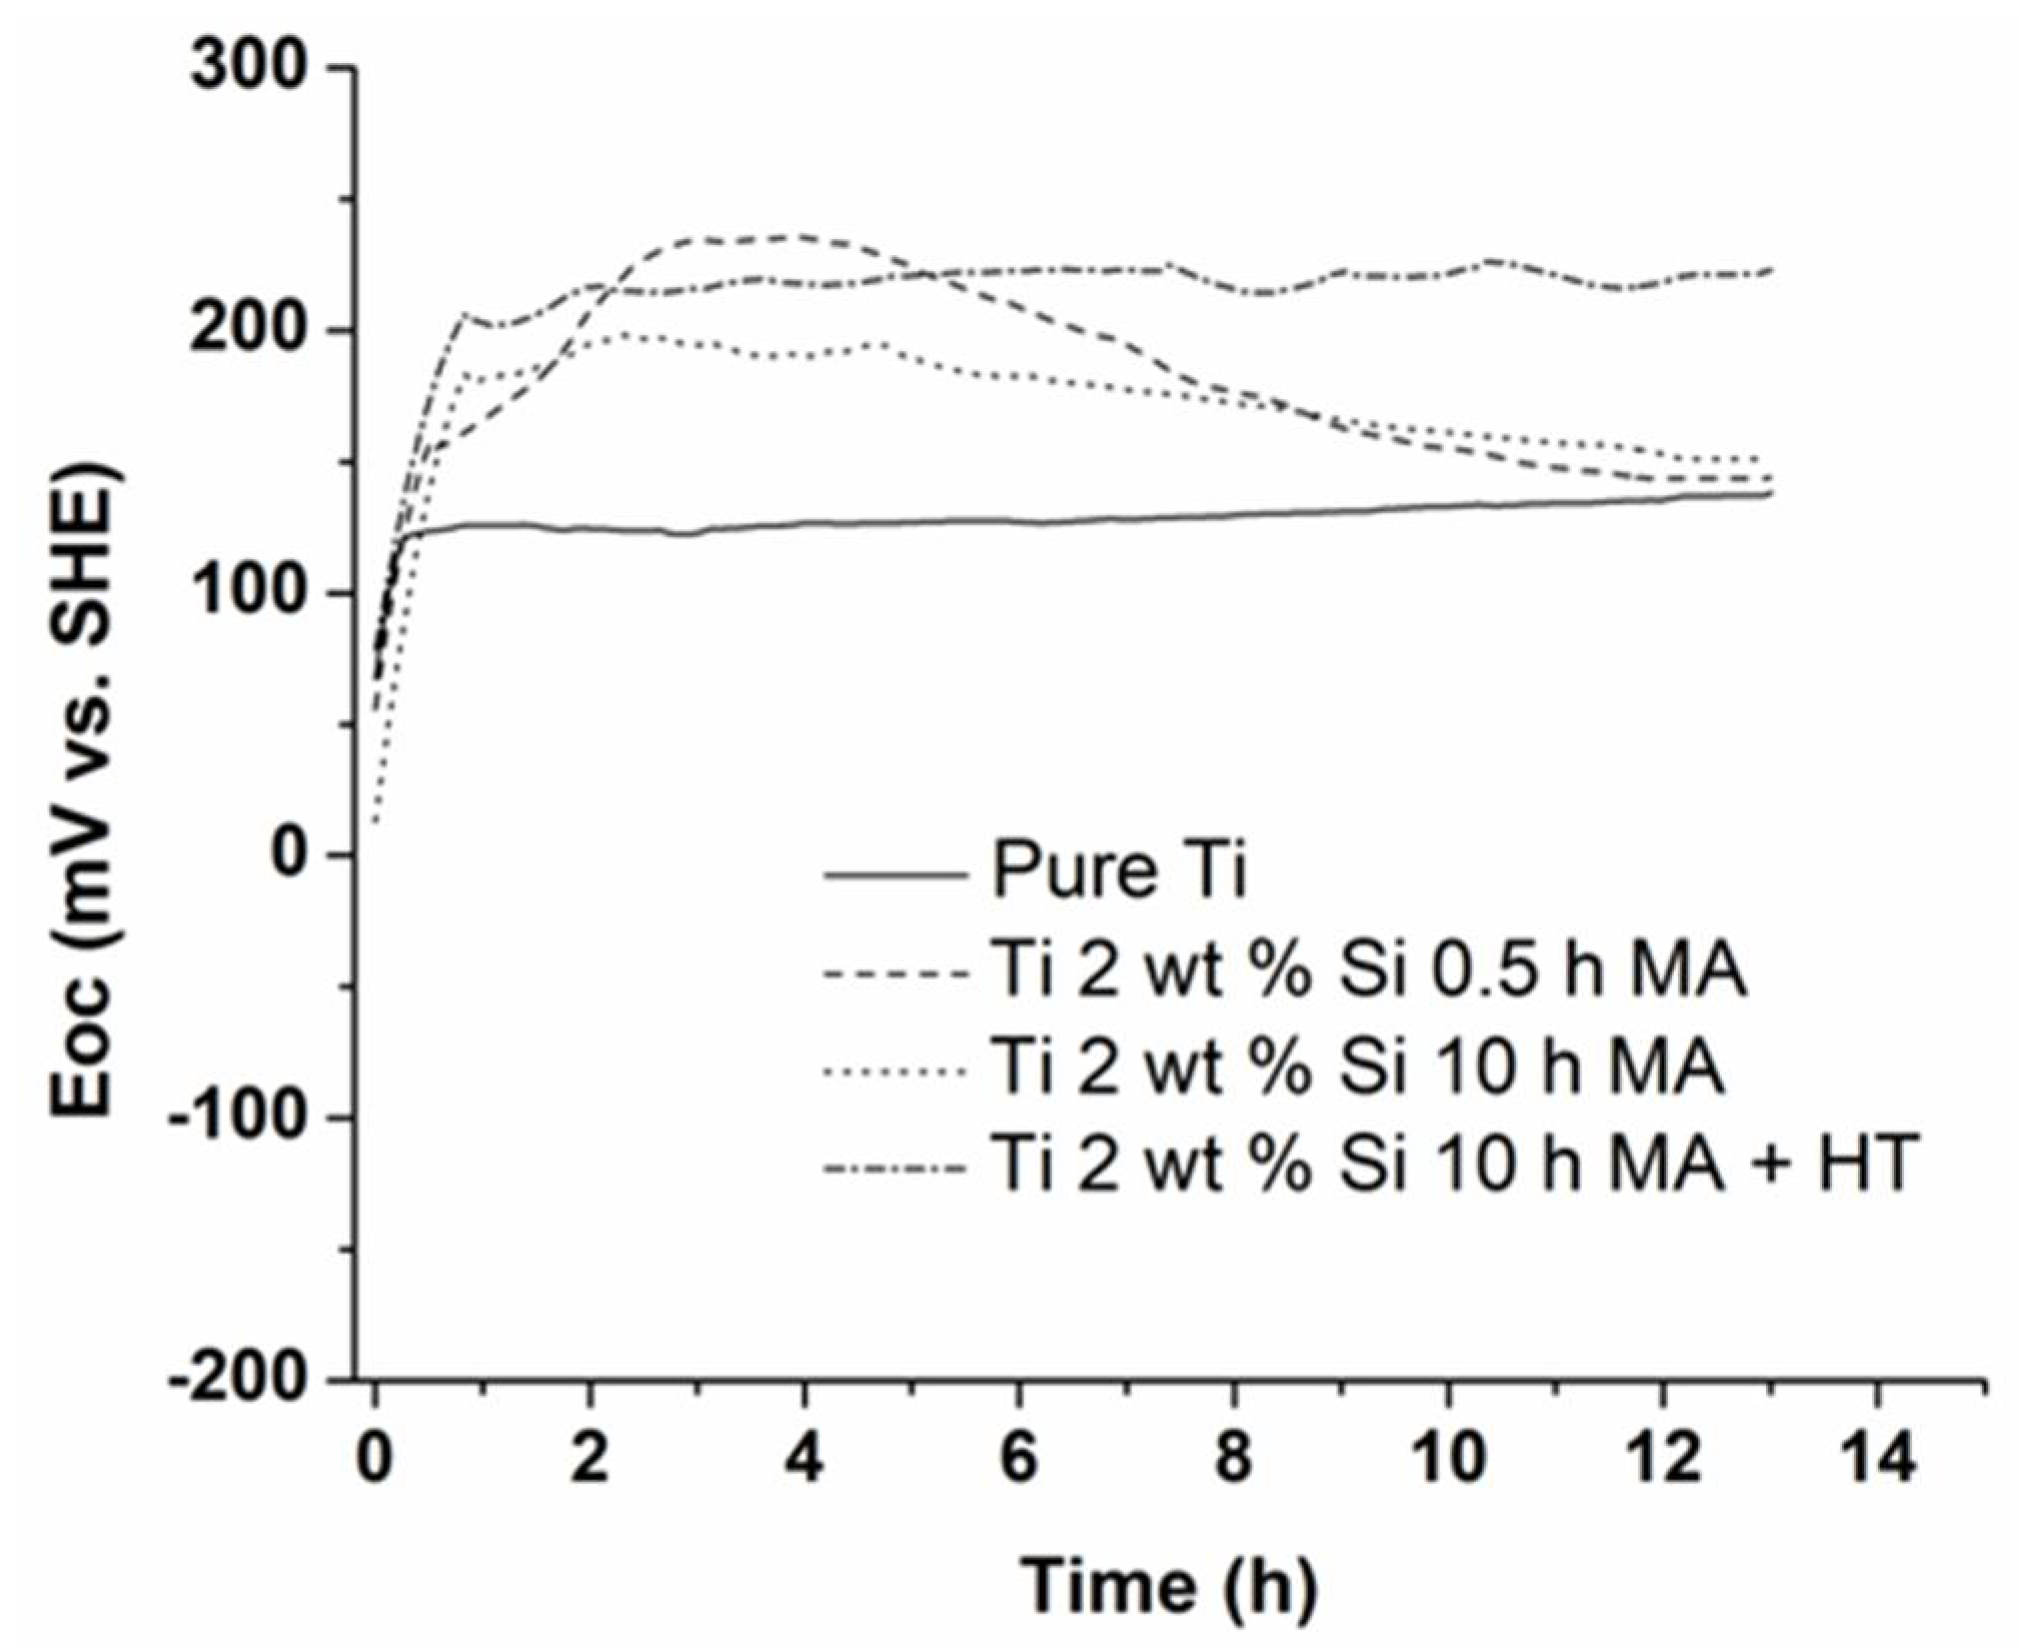
3.3. Open Circuit Potential Measurements

The EOC variations for pure Ti and Ti 2 wt %-Si electrodes milled during 0.5 and 10 h in 1.63 M H2SO4 solution with respect to the standard hydrogen electrode (SHE) are shown in Figure 8. The Ti-Si sample milled during 10 h and heat treated is also presented. In all cases, the starting potential values are close to 40 mV/SHE. This potential shifted to more positive values as the immersion time increased, until a steady state was reached. According to the Pourbaix diagram of Ti [44] for a bulk pH of 1.5, the changes on the potential values indicate an initial oxidation behavior followed by a spontaneous passivation where a Ti oxide was formed on the electrode surface.
For the pure Ti sample, the electrode rapidly achieved a steady state during the first 0.5 h, maintaining a potential of 138 mV/SHE. When Ti was subject to the MA process with Si, the values of EOC shifted to a more positive direction, reaching a maximum plateau during the first 4 h; afterwards, the values decreased with the immersion time until reaching a steady state. This clearly indicates an initial fast passivation process, where a Ti oxide was formed, followed by the dissolution of this oxide to form Ti+2 and Ti+3 aqueous ions [45]. This was more noticeable for samples milled during 0.5 h. Finally, for the Ti-Si alloy electrodes subjected to MA and heat treatment, the EOC values were slightly more positive than those of the samples without heat treatment and pure Ti.

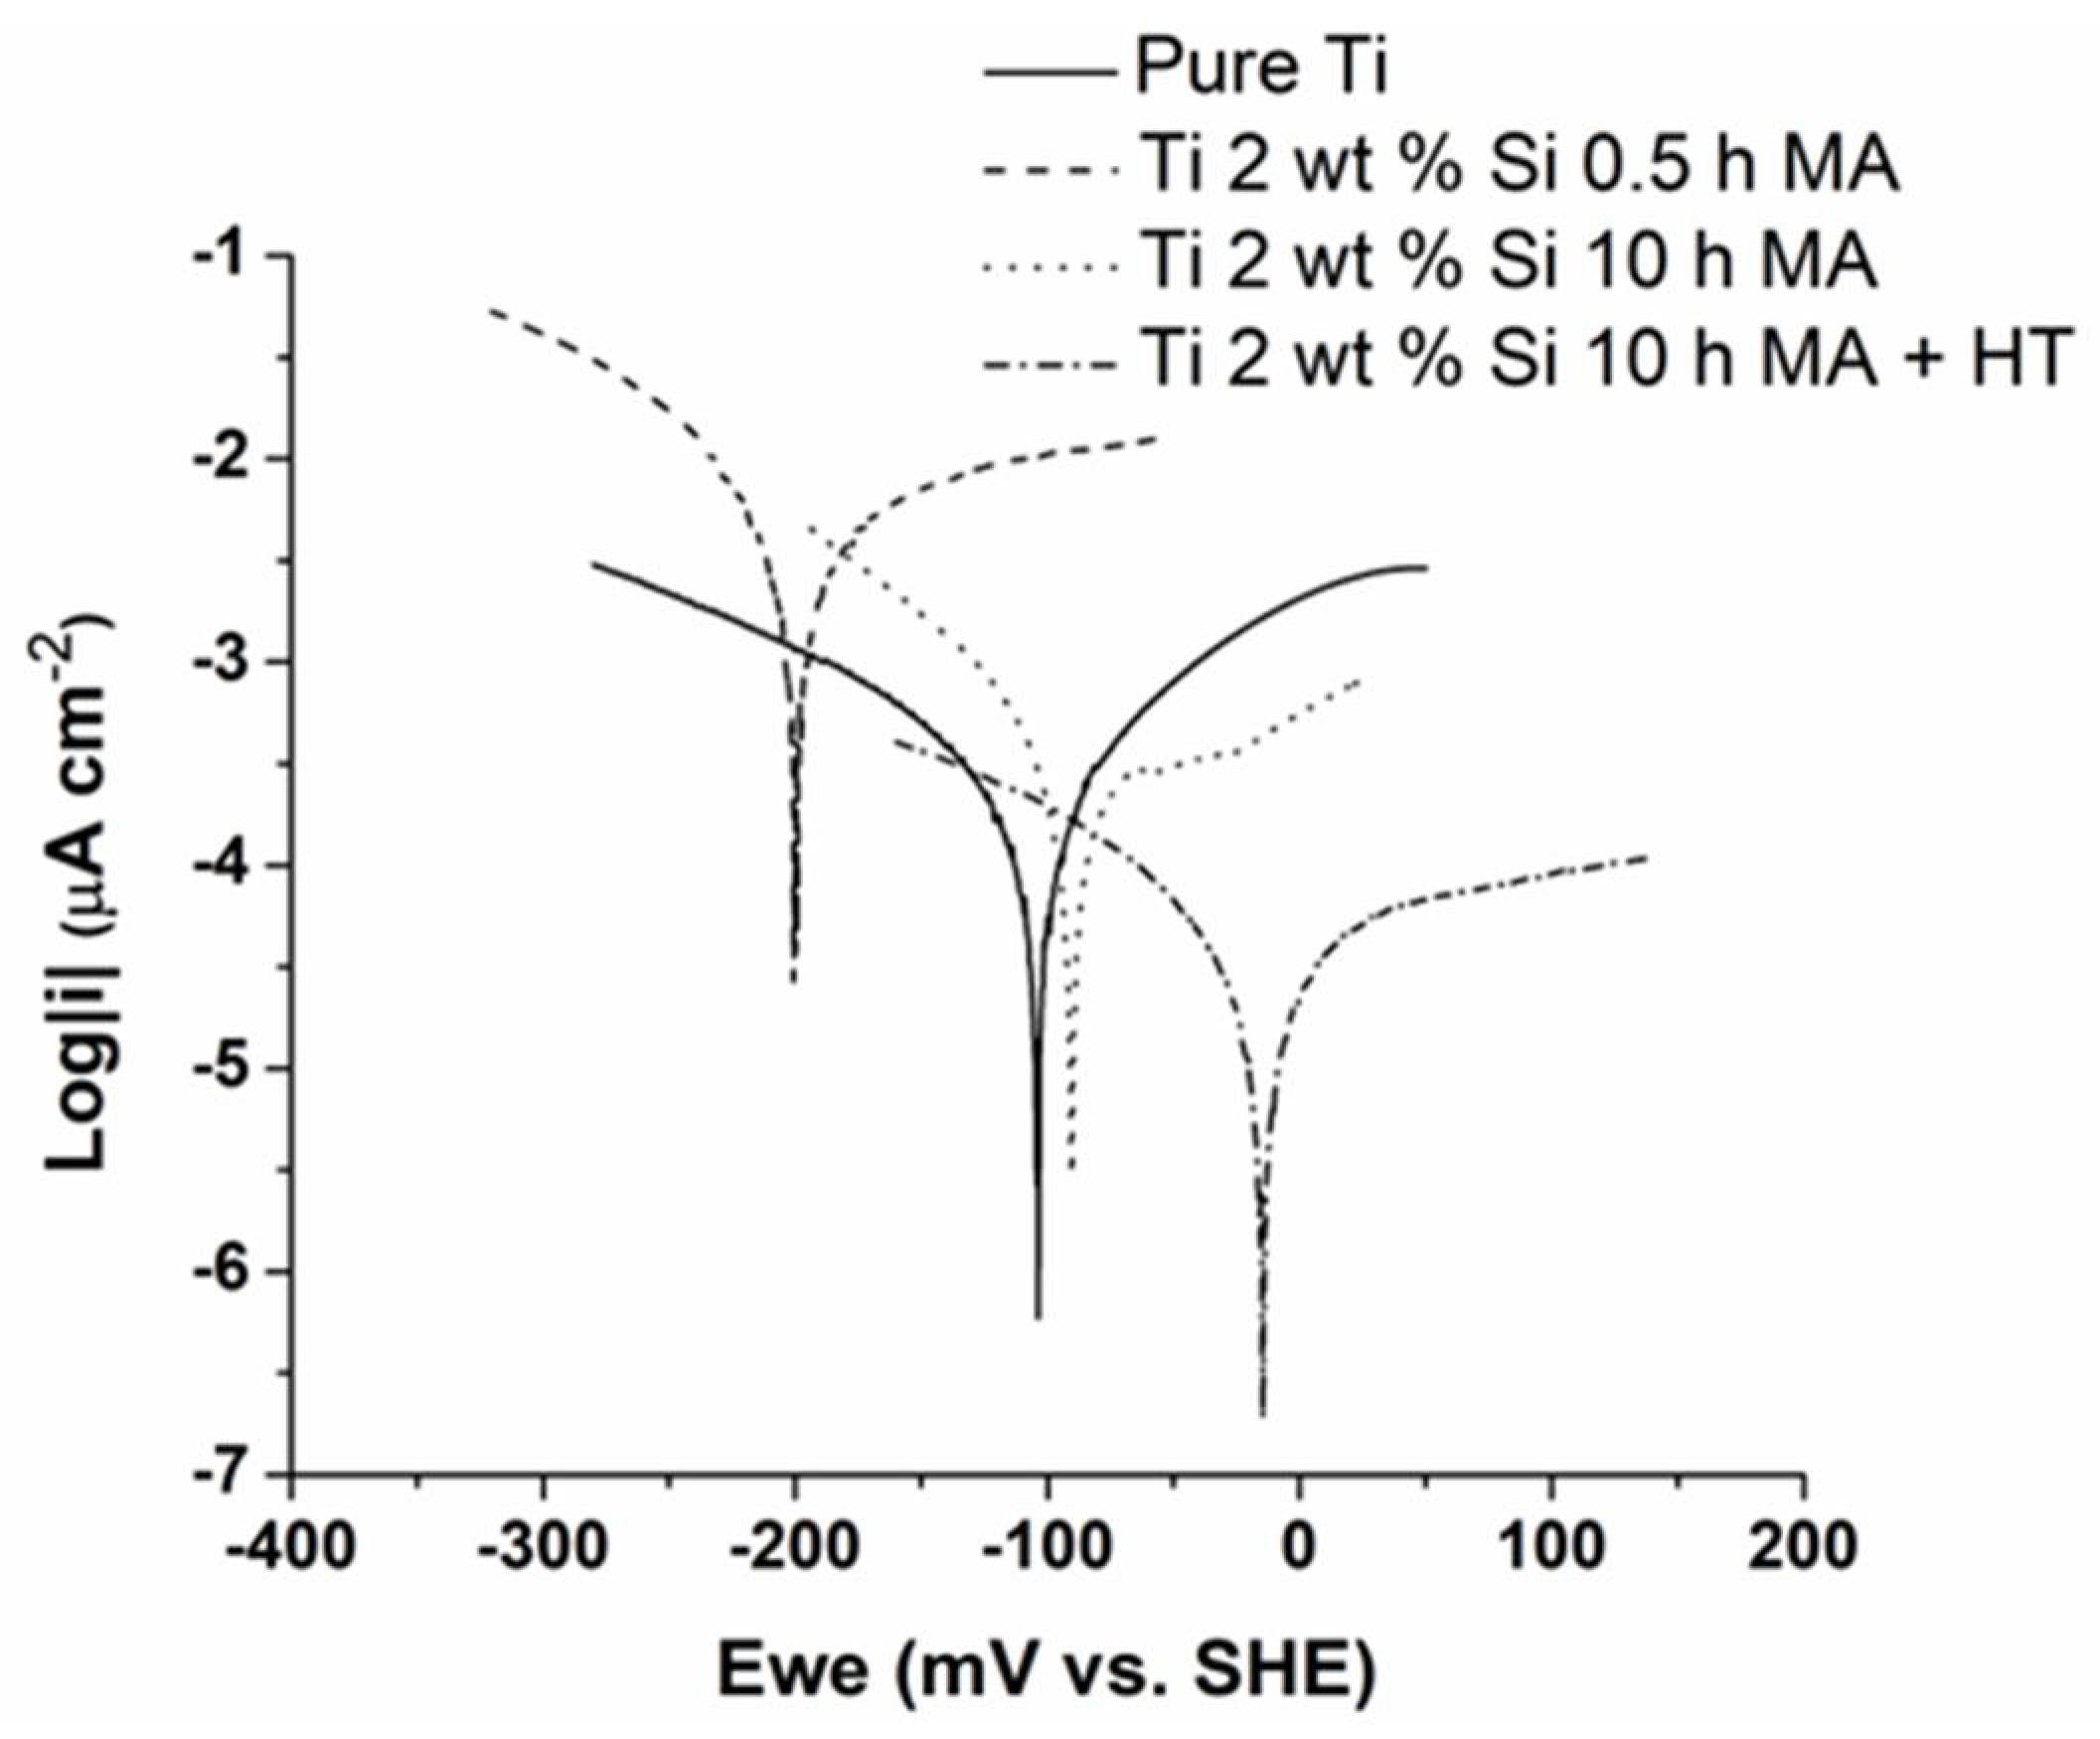
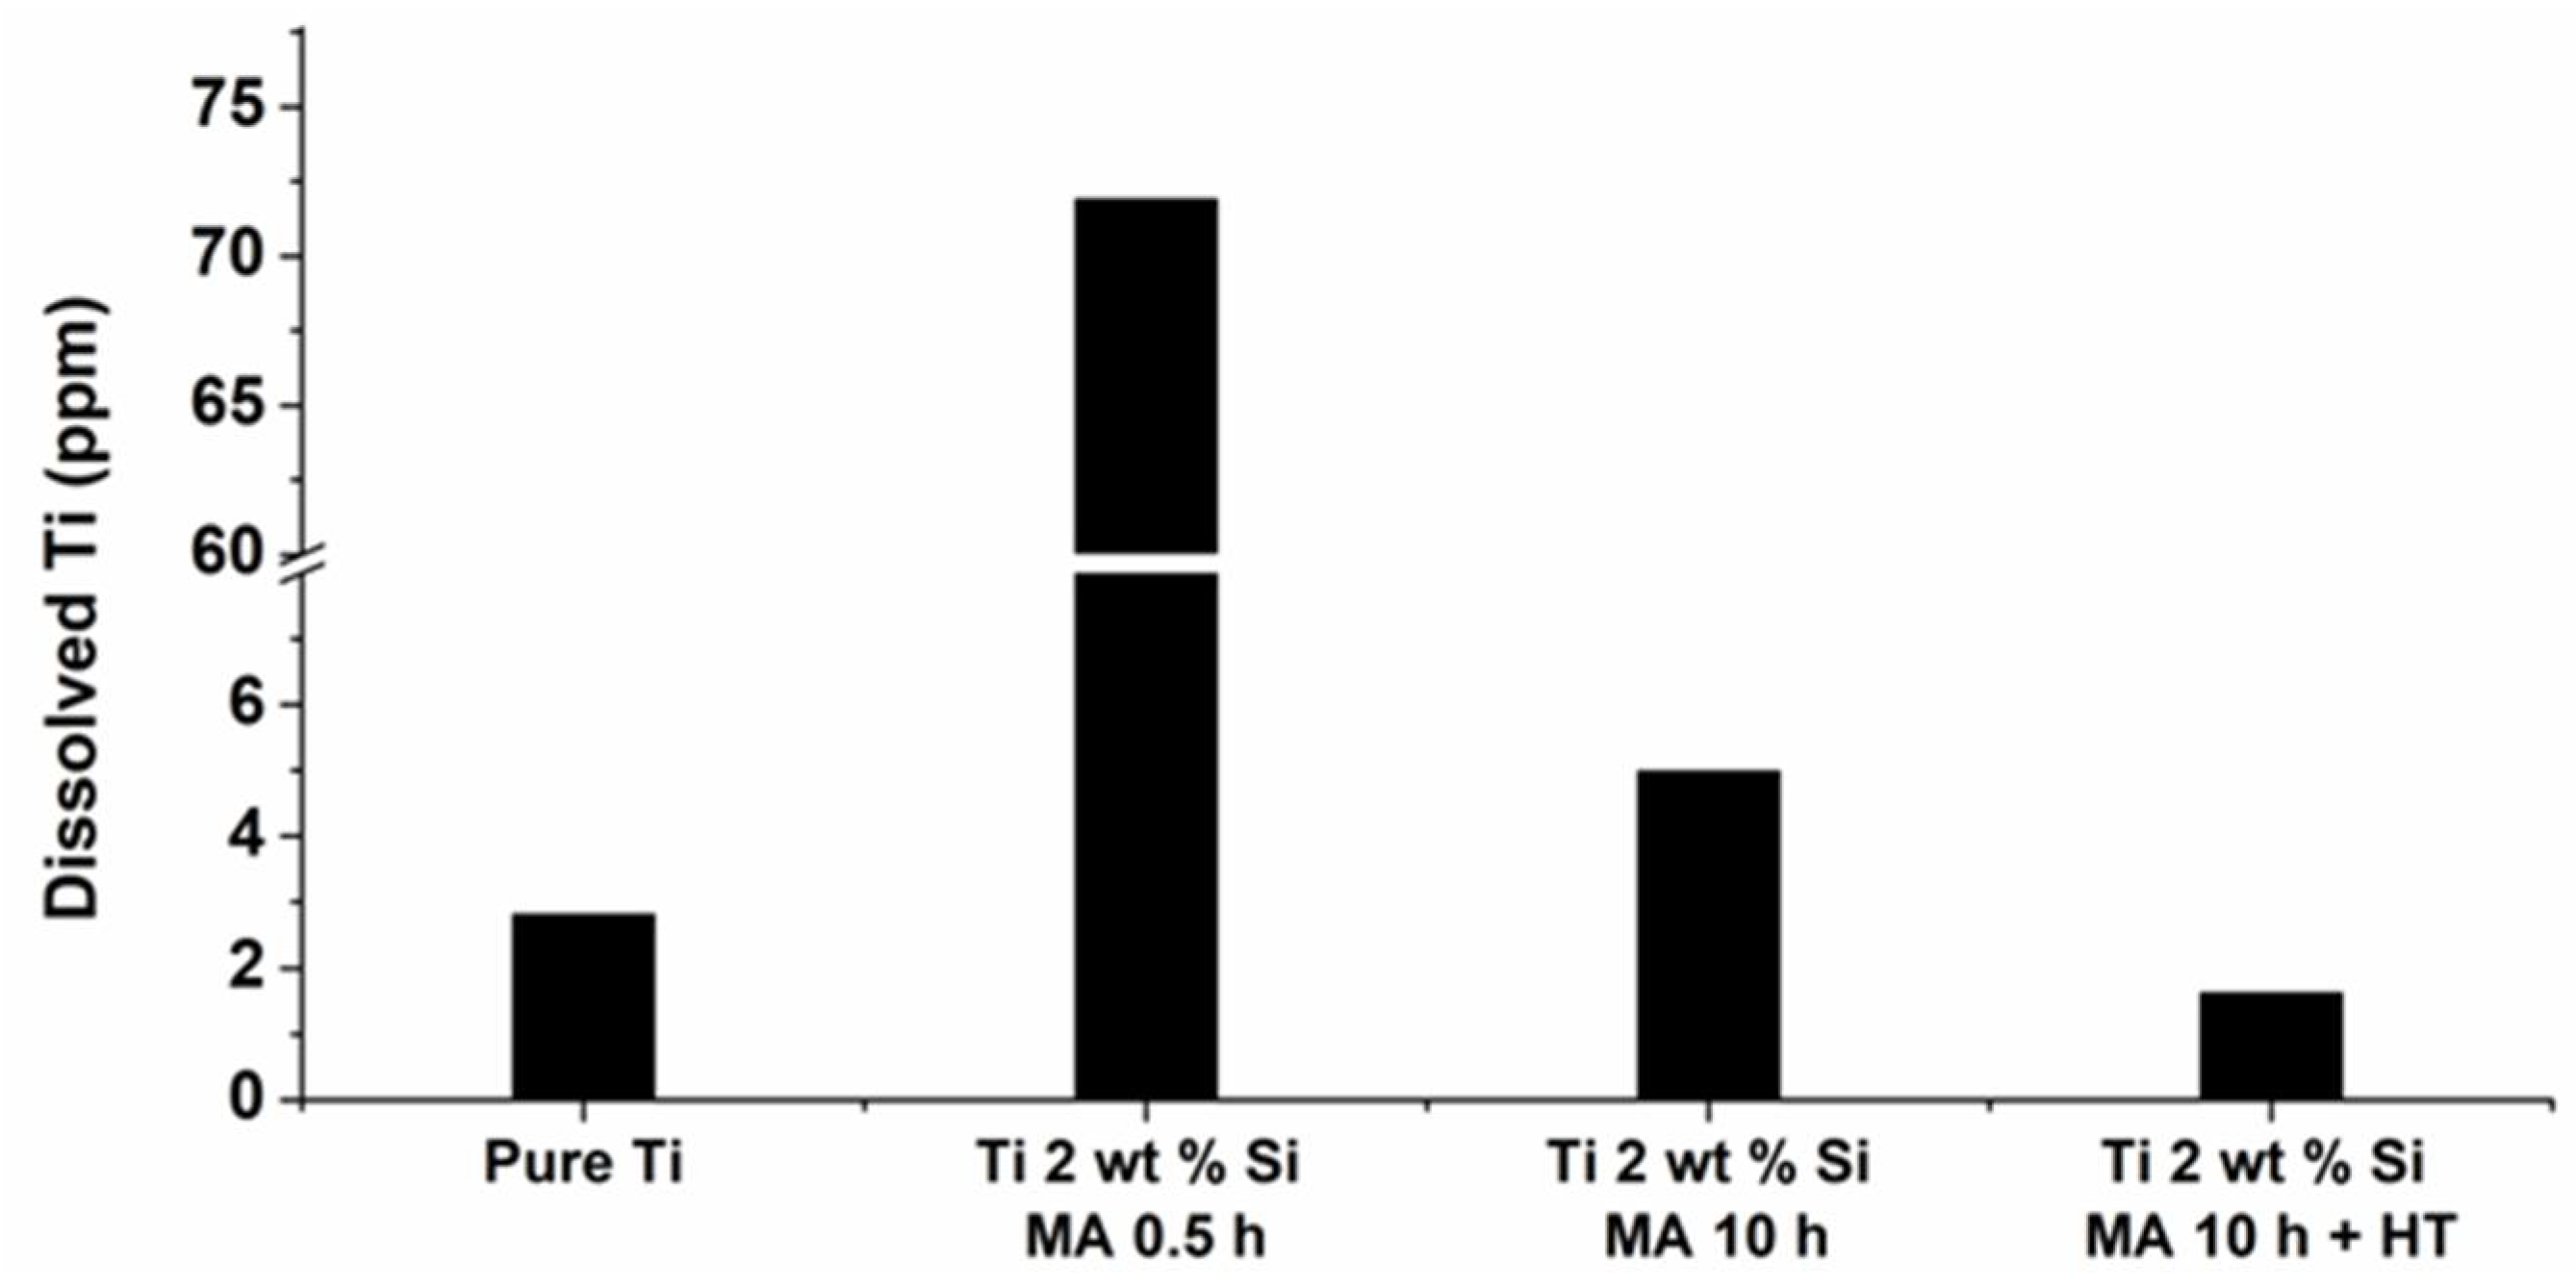
3.4. Linear Voltammetry Measurements

Figure 9 shows the Tafel polarization curves for pure Ti and the Ti-Si alloy milled during 0.5 and 10 h. The results for the heat-treated sample are also presented. The corrosion parameters were determined using the Tafel extrapolation method and are listed in Table 1. The samples milled during 0.5 h showed a higher corrosion rate compared with the pure Ti and the sample milled during 10 h. This can be attributed to the chemical homogenization promoted by the MA process and the formation of the α-Ti-Si supersaturated SS, which may improve the passive film deposited on the electrode surface. The Ti-Si sample milled during 10 h and heat treated exhibited the lowest corrosion rate of all the samples, which clearly resulted from the particular microstructure obtained after the heat treatment. The presence of a fine and homogeneous distribution of Ti-Si intermetallic precipitates in the α-Ti matrix could contribute to the formation of a more stable superficial oxide layer during corrosion. Jian et al. [12] reported that the high corrosion resistance exhibited by Ti-Si alloys obtained by casting is due to the formation of stable SiO2 and to Si-doping of the TiO2 oxide film. An extensive kinetic study would help explain the formation of the protective layer in the Ti-Si alloys produced by MA and heat treatment; however, such study is beyond the scope of this work.
The electrochemical results were corroborated by chemical analysis using ICP. Figure 10 shows the total dissolved titanium concentration determined after the potentiodynamic measurements. As seen in the figure, the tendencies observed for pure Ti and the Ti-Si alloy are similar to the corrosion rates obtained from the potentiodynamic measurements, confirming the influence of the MA and heat treatment on the corrosion behavior of the alloy.
In conclusion, the Ti-Si alloy subjected to MA and heat treatment had a remarkable corrosion resistance: the use of this alloy as e.g., a substrate for DSAs, would prolong useful life in Cu electrowinning applications. Furthermore, due to this high corrosion resistance and Si content, this alloy could also be used for the manufacture of orthopedic and dental implants [46,47].

4. Conclusions

Concerning the morphology evolution of the powders during the MA process, it is possible to conclude that in the early stage of milling, flat agglomerates were observed because of the ductile nature of Ti. As the milling time increased, the powders were welded and fractured until reaching a steady state, where small equiaxed agglomerates were formed. Regarding the microstructure evolution, during the first hour of milling, a preferential plastic deformation of Ti was detected. This texture, called “basal texture,” disappeared with increased milling time because of the preponderance of fracturing events over plastic deformation. On the basis of the XRD and FE-SEM analyses, it was possible to establish that the MA process promoted the formation of a supersaturated α-Ti-Si SS. The main phases detected after 10 h of milling were a supersaturated α-Ti-Si SS, TiO2, and remaining Si. For the thermal stability of these powders, it was determined that the remaining Si in the mechanically alloyed powders and the Si from the α-Ti-Si supersaturated SS reacted with Ti during heating to form Ti-Si intermetallic compounds, which showed a fine and homogeneous distribution in the α-Ti matrix, which is impossible to achieve using conventional casting methods. The electrochemical behavior revealed a series of changes that were highly dependent on the Ti-Si alloy treatment. The corrosion rate was significantly lower when the Ti-Si alloy was subjected to MA and heat treatment, showing the best corrosion resistance. This is the result of the fine and homogeneous distribution of Ti-Si intermetallic precipitates in the α-Ti matrix, which would contribute to the formation of a more stable superficial oxide layer during corrosion.

Author Contributions

D.G. analyzed the data, optimized the research plan, and wrote the paper; C.G. performed the experiments, collaborated in the analysis of results, and revised the paper; A.S. analyzed the electrochemical results and collaborated in the writing of the manuscript; R.S. collaborated with the ICP tests and analyzed the results obtained; C.A. and P.R. analyzed and interpreted the XRD analyses and revised the manuscript; I.I. and C.L.-B. performed the FE-SEM analyses and interpreted the images obtained.

Acknowledgments

This study was financially supported by the FONDECYT [Project No. 1151204] and DIUDA [Project No. 22267]. The authors wish to thank the Metallurgy Department of University of Atacama for the XRD, SEM, and DSC analyses [Projects EQM 130125, EQUV 003, and EQUR 16002]. Additionally, Carolina García thanks to the University of Atacama for the postgraduate fellowship.

Conflicts of Interest

The authors declare no conflict of interest.

References

  1. Felder, A.; Prengaman, D. Lead alloys for permanent anodes in the nonferrous metals industry. JOM J. Miner. Met. Mater. Soc. 2006, 58, 28–31. [Google Scholar] [CrossRef]
  2. Camurri, C.; Araneda, E.; Pagliero, A.; Dile, J. Optimal operational conditions during production of lead calcium-tin anodes for improve their mechanical properties. Mater. Sci. Forum 2005, 475–479, 2631–2634. [Google Scholar] [CrossRef]
  3. Beer, H. Electrode and Coating Therefor. U.S. Patent 3,632,498 A, 4 January 1972. [Google Scholar]
  4. Lodi, G.; Sivieri, E.; de Battisti, A.; Trasatti, S. Ruthenium dioxide-based film electrodes-effect of chemical composition and surface morphology on oxygen evolution in acid solutions. J. Appl. Electrochem. 1978, 8, 135–143. [Google Scholar] [CrossRef]
  5. Otogawa, R.; Morimitsu, M.; Matsunaga, M. Effects of microstructure of IrO2-based anodes on electrocatalytic properties. Electrochim. Acta 1998, 44, 1509–1513. [Google Scholar] [CrossRef]
  6. Vazquez-Gomez, L.; Ferro, S.; De Battisti, A. Preparation and characterization of RuO ternary mixtures for advanced electrochemical technology. Appl. Catal. B 2006, 67, 34–40. [Google Scholar] [CrossRef]
  7. Comninellis, C.; Vercesi, G.P. Characterization of DSA®-type oxygen evolving electrodes: Choice of a coating. J. Appl. Electrochem. 1991, 21, 335–345. [Google Scholar] [CrossRef]
  8. Rolewicz, J.; Comninellis, C.; Hinden, J. Charactérisation des électrodes de type DSA pour le dégagement de O2-I. L’électrode Ti/IrO2-Ta2O5. Electrochim. Acta 1988, 33, 573–580. [Google Scholar] [CrossRef]
  9. Bagri, P. Evaluation of Coated Titanium Anodes. Master’s Thesis, Utah University, Salt Lake City, UT, USA, 2012. [Google Scholar]
  10. Moats, M. Will lead-based anodes ever be replaced in aqueous electrowinning? JOM J. Miner. Met. Mater. Soc. 2008, 60, 46–49. [Google Scholar] [CrossRef]
  11. Hu, J.M.; Meng, H.M.; Zhang, J.Q.; Cao, C.N. Degradation mechanism of long service life Ti/IrO2-Ta2O5 oxide anodes in sulphuric acid. Corros. Sci. 2002, 44, 1655–1668. [Google Scholar] [CrossRef]
  12. Jiang, Z.; Dai, X.; Middeton, H. Effect of silicon on corrosion resistance of Ti–Si alloys. Mater. Sci. Eng. B Adv. 2011, 176, 79–86. [Google Scholar] [CrossRef]
  13. ASM International. Handbook Committee, ASM Handbook Volume 3: Alloy Phase Diagrams; ASM International: Novelty, OH, USA, 1992; p. 1741. ISBN 0-87170-381-5. [Google Scholar]
  14. Suryanarayana, C. Mechanical alloying and milling. Prog. Mater. Sci. 2001, 46, 1–184. [Google Scholar] [CrossRef]
  15. Benjamin, J.S. Dispersion strengthened superalloys by mechanical alloying. Metall. Trans. 1970, 1, 2943–2951. [Google Scholar] [CrossRef]
  16. Guzmán, D.; Ordoñez, S.; Serafini, D.; Rojas, P.; Bustos, O. Effect of the milling energy on the production and thermal stability of amorphous Mg50Ni50. J. Alloy. Compd. 2009, 471, 435–441. [Google Scholar] [CrossRef]
  17. Lee, P.; Cheng, Y.; Chen, J.; Hu, C. Formation and corrosion behavior of mechanically-alloyed Cu–Zr–Ti bulk metallic glasses. Metals 2017, 7, 148. [Google Scholar] [CrossRef]
  18. Guzmán, D.; Rivera, O.; Aguilar, C.; Ordoñez, S.; Martínez, C.; Serafini, D.; Rojas, P. Mechanical alloying and subsequent heat treatment of Ag–Zn powders. Trans. Nonferr. Met. Soc. 2013, 23, 2071–2078. [Google Scholar] [CrossRef]
  19. Dayani, D.; Shokuhfar, A.; Vaezi, M.; Rezaei, S.; Hosseinpour, S. Structural and mechanical evaluation of a nanocrystalline Al–5 wt %Si alloy produced by mechanical alloying. Metals 2017, 7, 232. [Google Scholar] [CrossRef]
  20. Liu, E.; Jia, J.; Bai, Y.; Wang, W.; Gao, Y. Study on preparation and mechanical property of nanocrystalline NiAl intermetallic. Mater. Des. 2014, 53, 596–601. [Google Scholar] [CrossRef]
  21. Nobuki, T.; Moriya, T.; Hatate, M.; Crivello, J.; Cuevas, F.; Joubert, J. Synthesis of TiFe hydrogen absorbing alloys prepared by mechanical alloying and SPS treatment. Metals 2018, 8, 264. [Google Scholar] [CrossRef]
  22. Aguilar, C.; Castro, F.; Martínez, V.; Guzmán, D.; de las Cuevas, F.; Lozada, L.; Vielma, N. Structural study of nanocrystalline solid solution of Cu–Mo obtained by mechanical alloying. Mater. Sci. Eng. A Struct. 2012, 548, 189–194. [Google Scholar] [CrossRef]
  23. Ahn, A.H.; Chung, H.S.; Watanabe, R.; Park, Y.H. Microstrutural refinemet amorphization in Ti-Al, Ti-Si and Si-W system by mechanical alloying. Mater. Sci. Forum. 1992, 88–90, 347–354. [Google Scholar] [CrossRef]
  24. Oleszak, D.; Burzynska-Szyszko, M.; Matyja, H. Structural changes during mechanical alloying of elemental Al-Ti, Al-Nb and Ti-Si powders. J. Mater. Sci. Lett. 1993, 12, 3–5. [Google Scholar] [CrossRef]
  25. Oehring, M.; Bormann, R. Nanocrystalline alloys prepared by mechanical allotting and ball milling. Mater. Sci. Eng. A Struct. 1991, 134, 1330–1333. [Google Scholar] [CrossRef]
  26. Park, Y.; Hashimoto, H.; Wtanabe, R. Phase evolution and formation process of compound during ball milling of Ti-Si powder mixtures. Mater. Sci. Eng. A Struct. 1994, 181–182, 1212–1216. [Google Scholar] [CrossRef]
  27. Yang, J.; Wu, J.; Hua, W. Study on mechanical alloying and subsequent heat treatment of the Ti–Si system. Phys. B Condens. Matter 2000, 279, 241–245. [Google Scholar] [CrossRef]
  28. Gu, Y.W.; Goi, L.S.; Jarfors, A.E.W.; Butler, D.L.; Lim, C.S. Structural evolution in Ti–Si alloy synthesized by mechanical alloying. Phys. B Condens. Matter 2004, 32, 299–304. [Google Scholar] [CrossRef]
  29. Rietveld, H. A profile refinement method for nuclear and magnetic structures. J. Appl. Crystallogr. 1969, 2, 65–71. [Google Scholar] [CrossRef] [Green Version]
  30. Lutterotti, L. MAUD—Materials Analysis Using Diffraction. Available online: http://maud.radiographema.eu/ (accessed on 16 April 2018).
  31. Chaubey, A.; Scudino, S.; Khoshkhoo, M.; Prashanth, K.; Mukhopadhyay, N.; Mishra, B.; Eckert, J. Synthesis and Characterization of Nanocrystalline Mg-7.4%Al Powders Produced by Mechanical Alloying. Metals 2013, 3, 58–68. [Google Scholar] [CrossRef]
  32. Suryanarayana, C. Mechanical Alloying and Milling; Marcel Dekker: New York, NY, USA, 2004; ISBN 0-8247-4103-X. [Google Scholar]
  33. Lee, P.; Yang, J.; Lin, H. Amorphization behaviour in mechanically alloyed Ni—Ta powders. J. Mater. Sci. 1998, 33, 235–239. [Google Scholar] [CrossRef]
  34. Ecker, J.; Holzer, J.C.; Krill, C.E.; Johnson, W.L. Structural and thermodynamic properties of nanocrystalline FCC metals prepared by mechanical attrition. J. Mater. Res. 1992, 7, 1751–1761. [Google Scholar] [CrossRef]
  35. Ungár, T. Microstructural parameters from X-ray diffraction peak broadening. Scr. Mater. 2004, 51, 777–781. [Google Scholar] [CrossRef]
  36. Froes, F.H. Titanium: Physical Metallurgy, Processing and Applications; ASM International: Novelty, OH, USA, 2015; pp. 98–99. ISBN 978-1-62708-079-8. [Google Scholar]
  37. Simổes, F.; Trindade, B.; Santos, J.A.; Froes, F.H. Ti-Al and Ti-Si Intermetallics Powders Coated with Aluminium. Mater. Technol. Adv. Perform. Mater. 2003, 18, 98–101. [Google Scholar] [CrossRef]
  38. Andersson, S.; Collen, B.; Kuyenstierna, U. Phase Analysis Studies on the Titanium–Oxygen System. Acta Chem. Scand. 1957, 11, 1641–1652. [Google Scholar] [CrossRef]
  39. Montanari, R.; Costanza, G.; Tata, M.E.; Testani, C. Lattice expansion of Ti-6Al-4V by nitrogen and oxygen absorption. Mater. Charact. 2008, 59, 334–337. [Google Scholar] [CrossRef] [Green Version]
  40. Blanter, M.S.; Granovskiy, E.B.; Magalas, L.B. Interaction of dissolved atoms and relaxation due to interstitial atoms in hcp metals. Mater. Sci. Eng. A Struct. 2004, 370, 88–92. [Google Scholar] [CrossRef]
  41. Contieri, R.; Zanotello, M.; Caram, R. Recrystallization and grain growth in highly cold worked CP-Titanium. Mater. Sci. Eng. A Struct. 2010, 527, 3994–4000. [Google Scholar] [CrossRef]
  42. Ramos, A.S.; Nunes, C.A.; Coelho, G.C. On the peritectoid Ti3Si formation in Ti–Si alloys. Mater. Charact. 2006, 56, 107–111. [Google Scholar] [CrossRef]
  43. Hsu, H.C.; Wu, S.C.; Hsu, S.K.; Li, Y.C.; Ho, W.F. Structure and mechanical properties of as-cast Ti-Si alloys. Intermetallics 2014, 47, 11–16. [Google Scholar] [CrossRef]
  44. Pourbaix, M. Atlas of Electrochemical Equilibria in Aqueous Solutions, 2nd ed.; NACE International: Houston, TX, USA, 1974; p. 219. ISBN 0915567989. [Google Scholar]
  45. Muñoz-Portero, M.J.; García-Antón, J.; Guiñón, J.L.; Leiva-García, R. Pourbaix diagrams for titanium in concentrated aqueous lithium bromide solutions at 25 °C. Corros. Sci. 2011, 53, 1440–1450. [Google Scholar] [CrossRef]
  46. Kim, H.; Kim, W.; Lim, S. Microstructure and elastic modulus of Ti–Nb–Si ternary alloys for biomedical applications. Scr. Mater. 2006, 54, 887–891. [Google Scholar] [CrossRef]
  47. Hsu, H.; Wu, S.; Hsu, S.; Liao, Y.; Ho, W. Effect of different post-treatments on the bioactivity of alkali-treated Ti–5Si alloy. BioMed. Mater. Eng. 2017, 28, 503–514. [Google Scholar] [CrossRef] [PubMed]
Figure 1. (a) Average agglomerate size as a function of milling time. Morphology of the powders after (b) 0.5; (c) 3; and (d) 10 h of milling.
Metals 08 00417 g001
Figure 2. (a) XRD patterns of mechanically alloyed powders; (b) crystallite size as function of milling time.
Metals 08 00417 g002
Figure 3. Back-scattering electron (BSE) image of cross-sectioned powders milled during 10 h. The table shows the average of five energy-dispersive X-ray analyzer (EDS) analyses on the matrix.
Metals 08 00417 g003
Figure 4. Lattice parameters of α-Ti as a function of milling time.
Metals 08 00417 g004
Figure 5. DSC curves of the sample milled during 10 h.
Metals 08 00417 g005
Figure 6. (a) XRD patterns of the mixture of powders without milling (0 h MA), milled during 10 h (10 h MA), and heat treated (10 h MA + HT); (b) Lattice parameters of the α-Ti SS after mechanical alloying (MA) and heat treatment (HT) as a function of milling time.
Metals 08 00417 g006
Figure 7. BSE images of the cross-sectioned heat-treated powders showing (a) Fe impurities; and (b) Ti oxide-rich zone; (c) other sector of the sample. The table presents the average of five EDS analyses on the matrix.
Metals 08 00417 g007
Figure 8. Eoc measurements for pure Ti and Ti 2 wt %-Si alloys in 1.63 M H2SO4 solution.
Metals 08 00417 g008
Figure 9. Potentiodynamic curves for pure Ti and Ti-Si alloys in 1.63 M H2SO4. Scan rate 1 mV s−1.
Metals 08 00417 g009
Figure 10. Inductively coupled plasma spectrometry (ICP) analysis for the titanium samples in 1.63 M H2SO4 after the potentiodynamic measurements.
Metals 08 00417 g010
Table 1. Corrosion parameters (Eoc = open circuit potential; Ecorr = corrosion potential; and icorr = corrosion current density) obtained for pure Ti and the Ti-Si alloys in 1.63 M H2SO4.
Corrosion ParametersPure TiTi 2 wt % Si
0.5 h 10 h10 h + HT
Eoc, mV/SHE138146147218
Ecorr, mV/SHE−104−204−90−13
icorr, (µA cm−2)4.7081.633.000.45

