Machinability Study of Developed Composite AA6061-ZrO2 and Analysis of Influence of MQL


1
School of Mechanical Engineering, VIT, Vellore 632014, India
2
Centre for Innovative Manufacturing Research, VIT, Vellore 632014, India
*
Author to whom correspondence should be addressed.
Metals 2018, 8(7), 472; https://doi.org/10.3390/met8070472
Submission received: 23 May 2018
/
Revised: 18 June 2018
/
Accepted: 18 June 2018
/
Published: 21 June 2018
(This article belongs to the Special Issue Metals Machining – Recent Advances in Experimental and Modeling of the Cutting Process)
Abstract
:Aluminium metal matrix replaces high melting point and high density conventional materials, thus minimizing the usage of energy and supporting the environment. This work develops a low-weight, high-strength composite material with the help of AA 6061 and ZrO2 through a stir casting route incorporated with a squeeze casting setup. Machining and machining tools create impacts on clean environments, as they deal with lubricants and power consumption. Having taken this issue into consideration, this research studies the effect of machining parameters on surface roughness, tool wear, and cutting force, while turning the developed metal matrix composite in dry and minimum quantity lubrication conditions. The turning experiment was performed by designing parameters using an L27 orthogonal array. The turning condition was dry and with minimum quantity lubrication (MQL). The responses obtained in the turning process were analysed using the analysis of variance (ANOVA) technique to find the most influential factor and its percentage contribution. Optimal machining parameters were investigated and tabulated with the help of main effect plots and S/N ratio graphs. Studies prove that there is a linear relationship between MQL versus surface roughness and tool wear, and there was no substantial effect on cutting force.
1. Introduction
Metal matrix composites have extensive applications in the area of structural engineering and materials engineering [1]. Aluminium metal matrix is one of the important engineering materials that widely replaces conventional materials, super alloys, and ceramics in defence and automotive sectors due to its various superior properties. Conventional materials and ceramics are difficult to machine as they produce a lot of heat, consume a lot of energy, and need huge amounts of lubrication during machining [2]. In aluminium matrix composites, approximately 80–90% of the matrix part is composed of aluminium, which is light weight, corrosion resistant, ductile, and also completely recyclable. The remaining 10–20 wt % is comprised of any kind of ceramic, which is called reinforcement in a composite material, which gives strength to the composite. In this developed composite, the reinforcement chosen is ZrO2. Its most naturally-occurring form is with a monoclinic crystalline structure. It offers chemical and corrosion inertness to temperatures well above the melting point of alumina. The main use of zirconia is in the production of ceramics. Stabilized zirconia is used in oxygen sensors and fuel cell membranes. High-density ZrO2 also provides better corrosion resistance. Zirconia could survive longer in highly-corrosive environments and is considered the best material in chemistry laboratories. It is biocompatible and produces no environmental hazards [3]. This combination of ceramic and metal matrix phase has replaced so many conventional materials, which paved the way for cleaner production in industry and supports the environment. This enables low-heat energy during synthesis, and a huge reduction of cutting force during machining. This in turn leads to power reduction, surface integrity, and lubricant reduction which confirms clean and safe machining or production. Stir casting is one of the most simple and economical manufacturing techniques among the other manufacturing techniques [4]. Turning is one of the major machining techniques among the other techniques used in the manufacturing industry. Therefore, in the production industry, turning processes need to be planned judicially in order to achieve high quality at minimum cost. This includes selection of tools, selection of a lubrication processes, and optimization of machining parameters to achieve quality, and time and cost reductions. The analysis of machining parameters is a prime work needed to be carried out in the machining sector of aerospace, automotive, and structural industry. The author used Artificial Neural Network and Response surface methodology to optimize machining parameters of Al 7075 hybrid composite [5]. During the machining process, there were various responses like surface roughness, cutting force, tool wear, quantity of lubricant used, material removal rate, energy consumption, etc. The author minimized surface roughness value and energy consumption by optimizing machining parameters while turning AISI 6061 T6 aluminium [6]. Previous works show the usefulness of the design of an experiment’s technique and response surface methodology (RSM), artificial neural networking (ANN), Analysis of variance (ANOVA) in finding the percentage of contribution of machining parameters. However, turning processes involve chip formation; this creates cutting force and heat. Both cutting force and heat generation is inevitable and can be minimized only. In the past, energy consumption, machine tool life, employee hazard, and cleaner production were not major considerations. Flooding lubrication was in common practice for most of the conventional metals and composites. This flooding lubrication is commonly in practice even now due to the lack of technological awareness and lack of importance for environmentally friendly processes [2]. This practice of flooded lubrication is expensive and hazardous to the environment. It affects the health of the operator, which leads to negative impacts on production rate and time, due to regular cleaning of machine tools and shop floor, etc. To overcome these issues Minimum Quantity Lubrication, or “going green”, can be integrated with machining tools. Minimum Quantity Lubrication is the process of applying minute amounts of high-quality lubricant directly to the cutting tool/work piece interface instead of using traditional flood coolants. Minimum Quantity Lubrication minimizes an environmental impact by significantly reducing fluid usage and eliminating the need for coolant treatment and disposal. The researcher concludes that minimum quantity lubrication technology seems to be an appropriate alternative for economically and environmentally compatible production process [7]. Furthermore, he concludes that machining parameters and MQL flow rate play a vital role in determining tool wear. Minimum Quantity Lubrication flow rate needs to be judicially chosen (i.e., it has to be minimal to reap benefits like low cost, clean production, and high efficiency). In this case, MQL flow rate was 0.03 mL/min for AA6061-T6. Turning of Inconel 718 was carried out under an MQL environment with a flow rate of 250 mL/h. The author concludes that the overall machining performance was improved due to the integration of an MQL setup [8]. Murat Sarıkaya analysed machining parameters while Computer Numerical Control (CNC) turning of AISI 1050 steel. The flow rate of MQL was varied from 60 mL/h and 120 mL/h. The other parameters were cutting speed, feed rate, and depth of cut. ANOVA results show that cooling conditions and the feed rate had a high influence on the surface of roughness. The author performed experimental and statistical analysis during the turning process, which needed to be applied carefully during fabrication processes [9]. Murat Sarıkaya in his further work performed the turning process using difficult to cut alloy Haynes 25. He optimized machining parameters using Design of Experiments (DOE) while turning cobalt base super alloy. He used a vegetable-based lubricant with a flow rate of 180 mL/h for the MQL process. He concluded that minimum quantity lubrication is a good quality tool in order to raise the machining productivity and to reduce the negative effects on the environment during machining processes [10]. A. Shokrani in his review of environmentally mindful machining of hard to machine materials concluded that even though various machining methods like MQL, chilled air, and cryogenic machining employed to decrease or eradicate the application of conventional cutting fluids in material cutting, none of the methods can be used entirely as a substitute for cutting fluids unless and until additional research on cooling methods, cutting parameters, and cutting tool materials are analysed to have major advantages [11].
2. Materials and Methods
The metal matrix chosen was AA6061 and the reinforcement material was ZrO2. The size of the reinforcement particles ranged from 20–30 microns. The fabrication of composite was employed using stir casting techniques integrated with a squeeze casting unit. The manufacturing of composite using stir casting usually involves melting metal matrix and the introduction of reinforcement particles into the melt while stirring. The 1.5 kg measure of AA 6061 ingots was charged in an electric furnace and heated up to 750 °C, which is above super heating temperature. ZrO2 particles were heated at a temperature of 400 °C to eradicate moisture content. Once the aluminium matrix was completely melted and become liquid in form, separately pre-heated ZrO2 particle at a temperature of 200 °C was gradually poured into the liquid aluminium which was in the furnace. While pouring, the stirrer rotated at 400 rpm and formed a vortex which supported equal distribution of particles along the metal matrix phase. The stirring was done for 300 s, and the mixture of AA 6061 and ZrO2 was held in the crucible for 300 s. To achieve wettability, 1.5 wt % of magnesium was added into the melt. Magnesium reacts with oxygen, sliming the gas layer which thus reduces agglomeration and enhances wetting. The slag formed on the upper layer of the melt was removed. Finally, the molten slurry was poured into a steel die coated with zirconium oxide using a bottom pouring setup. Also, the stir casting setup was integrated with squeeze casting facility to prevent agglomeration, which resulted in porosity and uneven distribution [12]. An applied pressure of 40 tons was maintained to the end of solidification. Three specimens were produced by following the same technique, but by varying weight percent of reinforcement as mentioned above. The dimension of the cast specimen was 280 mm length and 50 mm diameter.
The three developed composite specimens were used as work piece material for the CNC turning operation. The machine chosen for the operation was a Simple Turn 5075-SPM CNC lathe. The specifications were spindle speed: 2000 rpm, spindle motor power: 7.5 kW, maximum turning dia: 320 mm, maximum turning length: 500 mm, etc. The cutting tool selected to carry out this operation was Tungsten carbide with ISO designation CNMG 120408 THM-X manufactured by Kennametal uncoated grade with good edge stability. Tests were conducted under dry and MQL condition with two different oil flow rate. Two nozzles were set, one at 0° and the other at 45° to the nose of the cutting insert. Cutting fluid in MQL was crushed through a nozzle using an air compressor at 0.6 bar pressure. The surface roughness was measured using MarSurf GD 120. Nine readings were taken from different locations, and the average value was taken into account for calculations. Cutting force was measured using a type-3-component dynamometer, with a measuring range of −5 to 5 kN. Tool wear and chip thickness were measured using a digital microscope.
The machining parameters and their levels were judicially designed from various related works and manufacturers’ hand books [13]. The levels of machining parameters are tabulated in Table 1. The best combinations were designed based on experiments using the Taguchi approach. In this study, 27 experiments were carried out with five factors and three levels. It has been approved by many researchers who investigate machining performance using a variety of metals and materials [14].
where y1, y2, y3, … yn are the responses of the machining characteristic, for a trial condition repeated n times. The analyses were carried out in Minitab 18 software.
S/N ratio = −10log1/n (y21 + y22 + ……… y2n)
3. Results and Discussions
3.1. Characterization of the Developed Composite
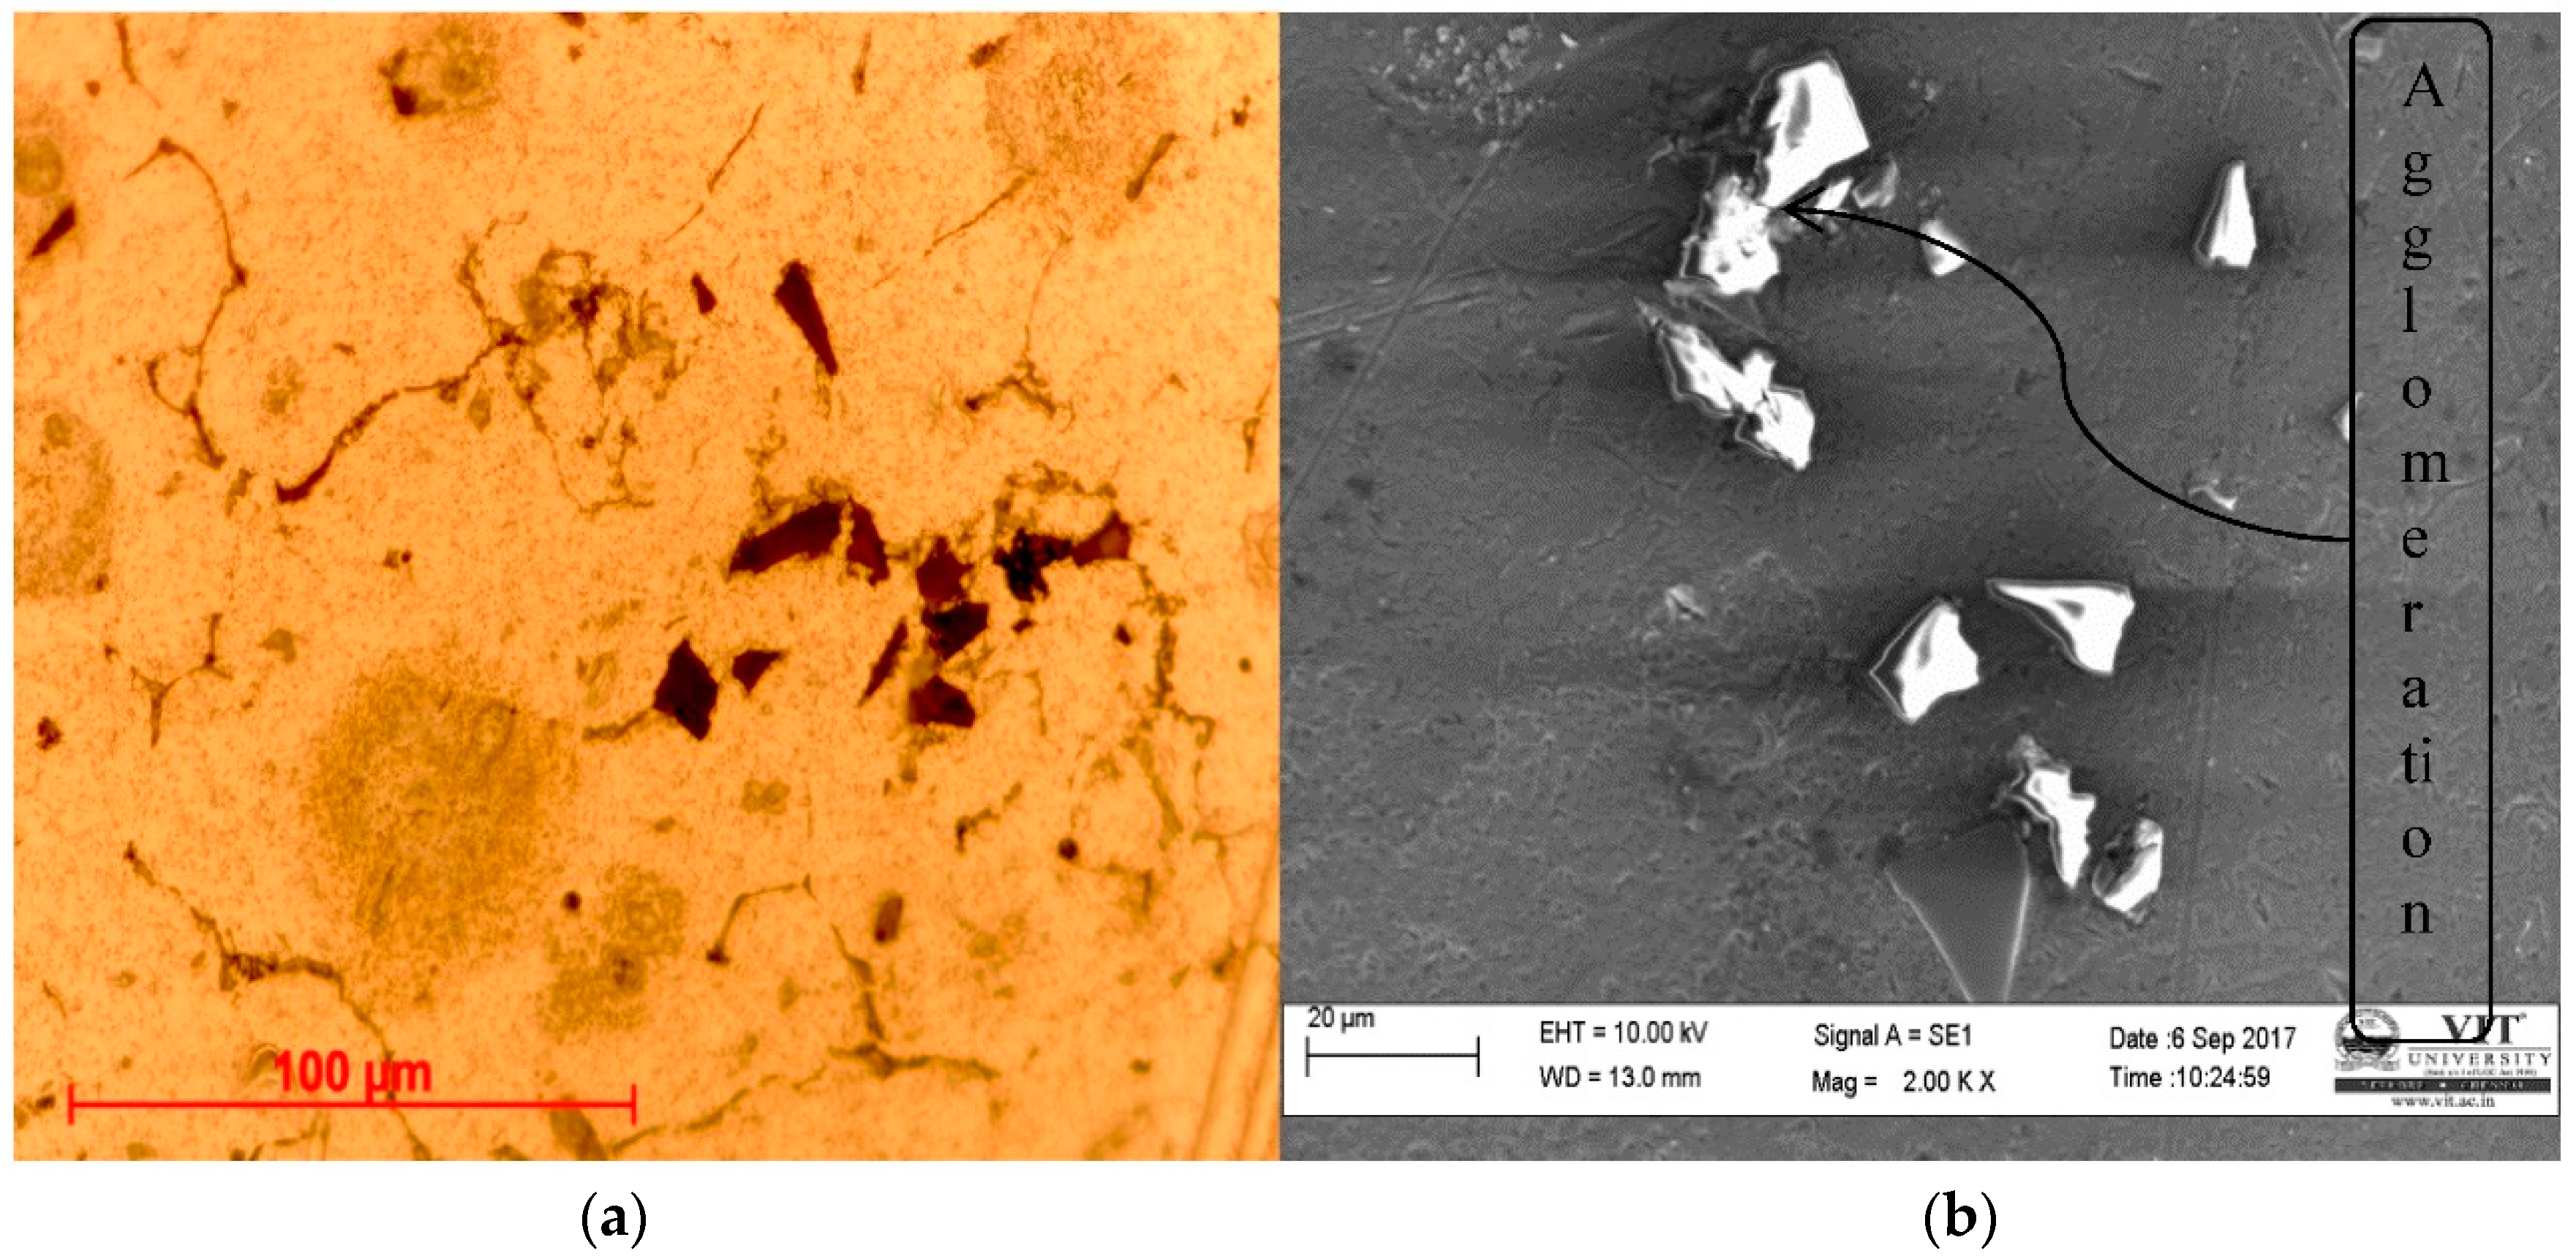
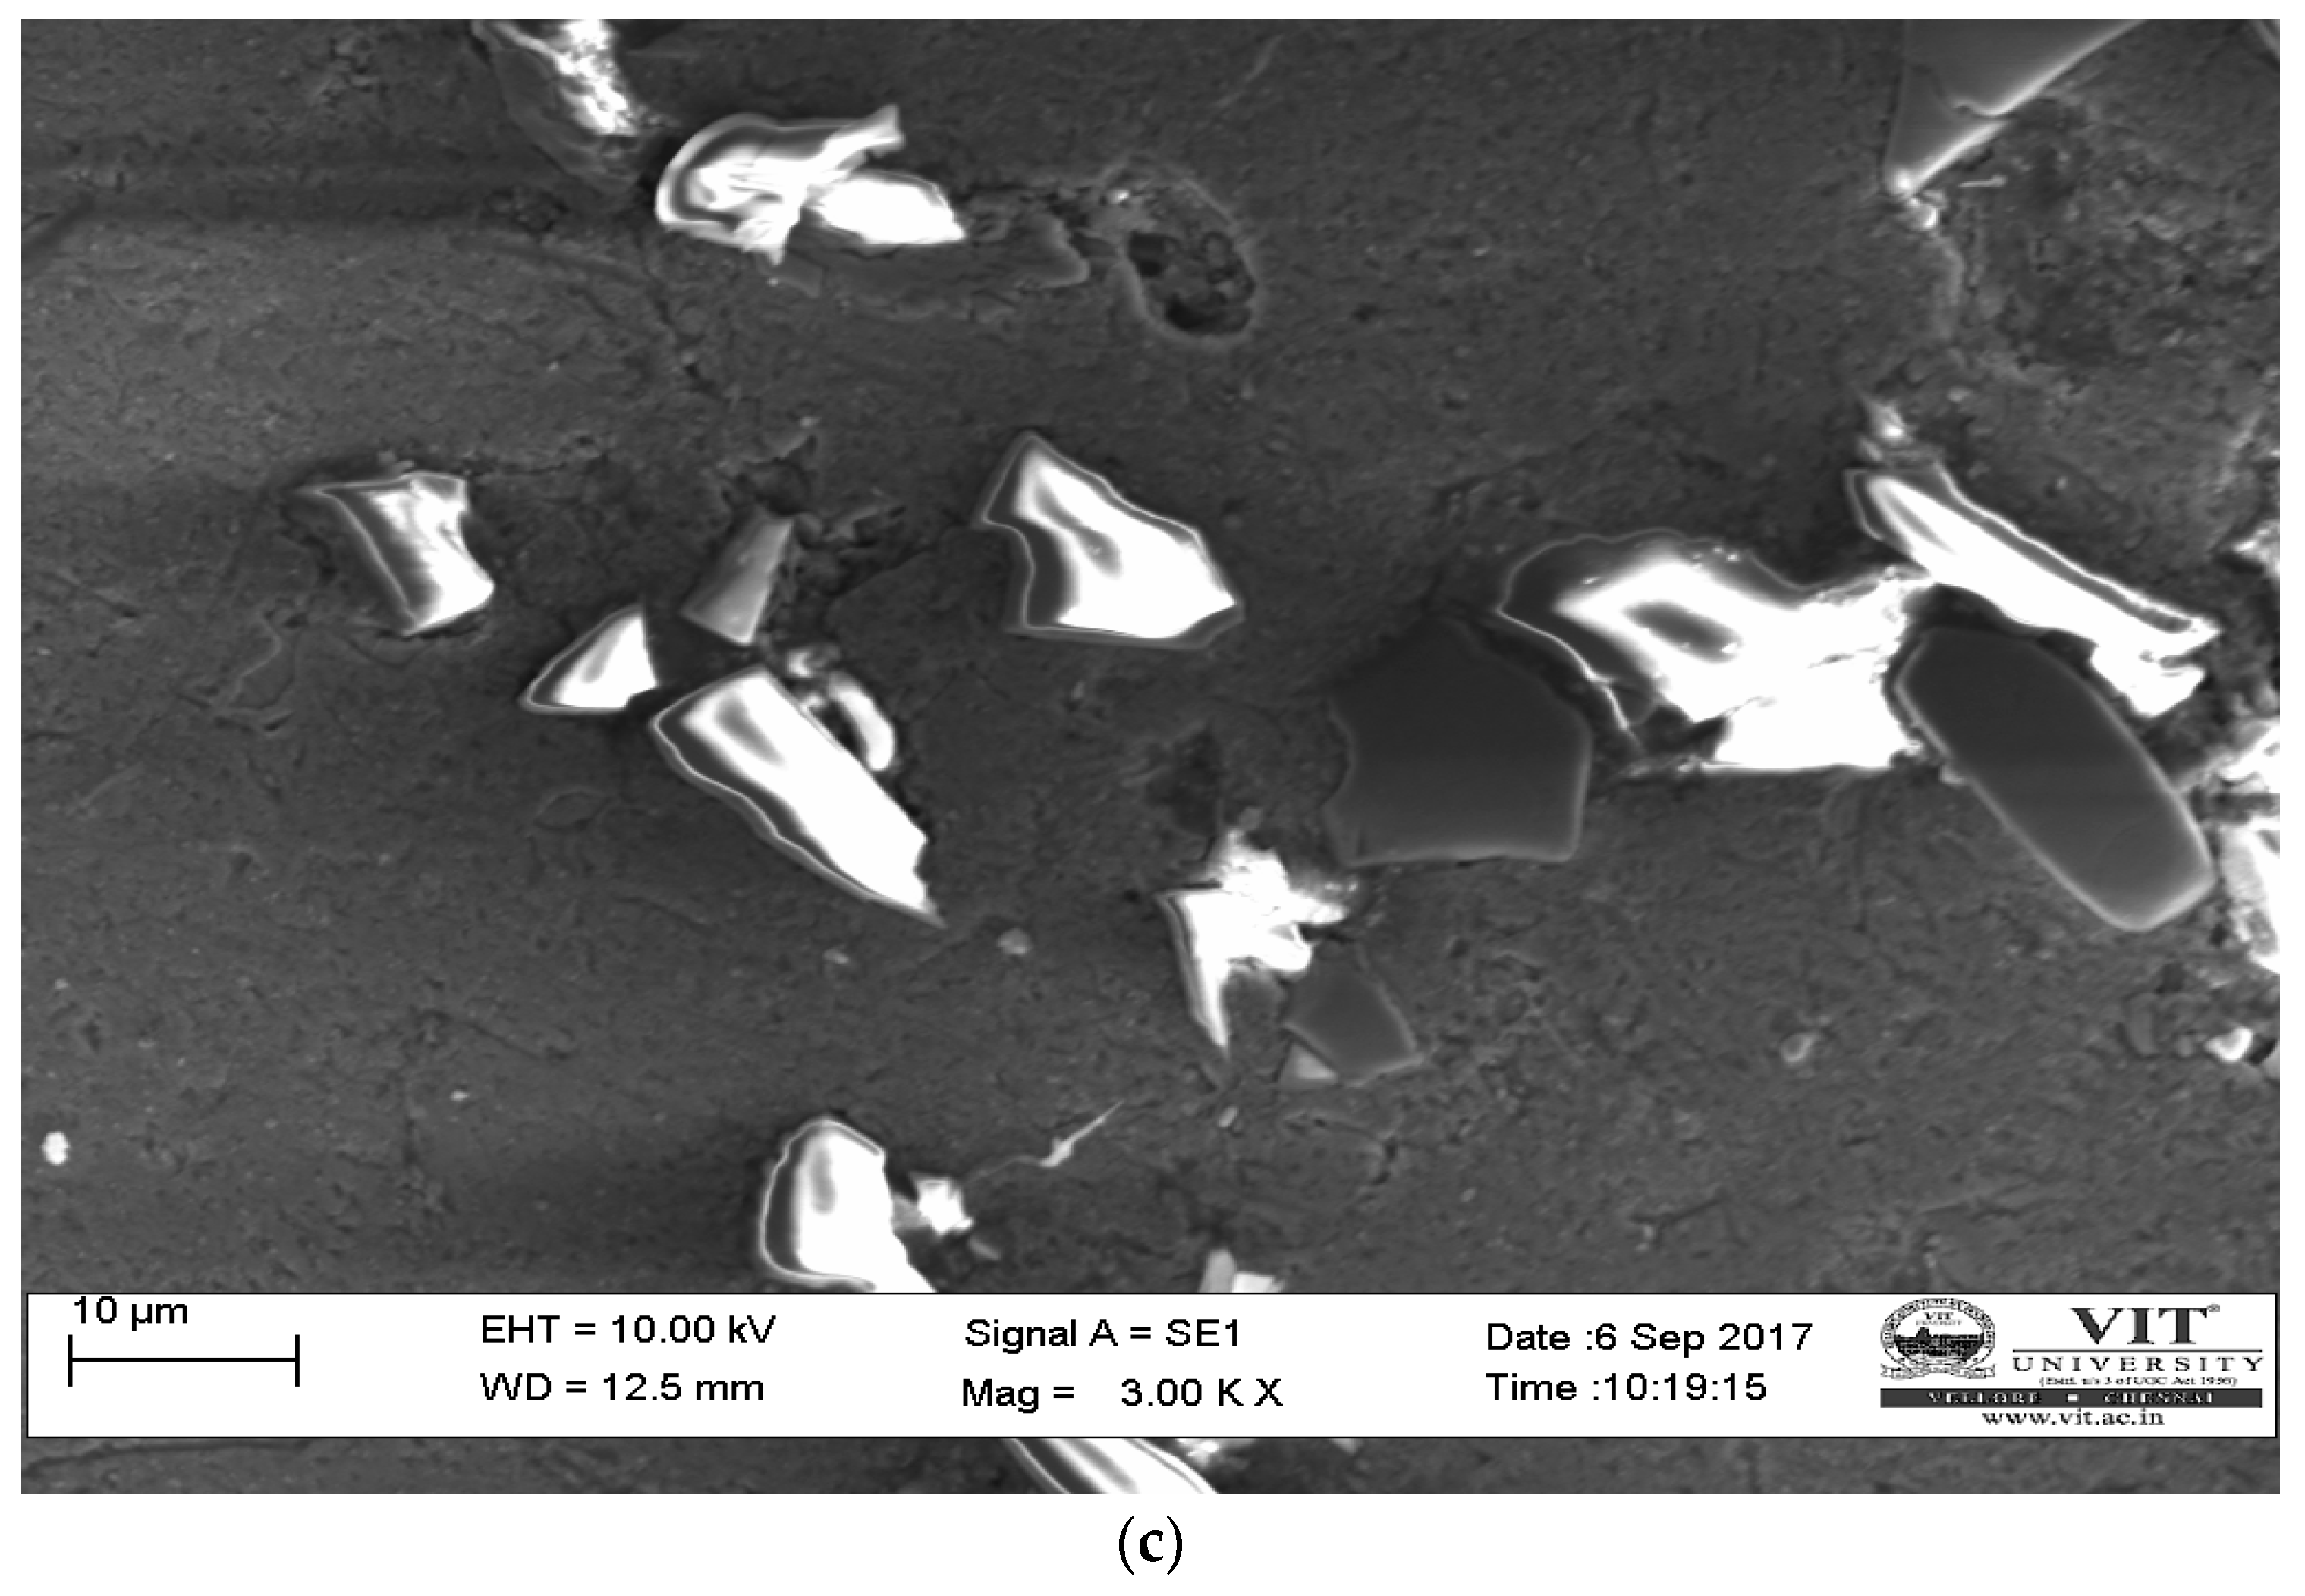
Both scanning electron microscope (SEM) and optical microscope images were captured to study its micro structure and to find an out dispersion of ZrO2 reinforcement particles along the AA6061 matrix alloy. Scanning electron microscope and optical image helped to find second phase elements in the developed composite, as shown in Figure 1a–c. The optical images exhibited the distribution of ZrO2 particles in the matrix phase. An agglomeration of particles was seen in the SEM images. This attribute was due to the improper dispersion and mixing of particles in the metal matrix phase. This agglomerate will fall during the machining process as the metal matrix phase fails to hold the reinforcement particles. This paves the way for pores in the cast composite. This agglomerate or cluster formation has a direct effect on hardness value. The clusters were due to the increased wt % of the ZrO2 particles (i.e., 15%). This microstructure analysis confirms that wt % of reinforcement particles above 10% may cause property degradation and cause the poor surface finish. Scanning electron microscope images clearly show the size and shape of the ZrO2 particles and with the help of an indicated scale in the images, the sizes of the particles were clearly measured, and it was an average of 20 microns. Energy-dispersive X-ray spectroscopy (EDS) identifies and confirms the presence zirconium, aluminium, and oxygen. Table 2 shows the weight of composition of AA6061/ZrO2. Figure 2 shows the list of elements present in the developed composite. The wt % of elements as per EDS analysis was oxygen (29.2), aluminium (6.2), and zirconium (0.11). The main constituent of AA6061 alloy is aluminium, and ZrO2 is zirconium and oxygen. As the EDS spectrum concentrates on the matrix part, and few ZrO2 particles were present within the selected area, the amount of zirconium detected was low. Furthermore, Fe and Cr content were high in EDS due to the mild steel stirrer which was used to stir the molten material. Not always, but in rare cases during stirring, the hard ZrO2 particles impinge on the mild steel blade which causes removal of material. This removed material from the stirrer blade pooled with molten material and caused an increase in Cr and Fe content, as detected in Figure 2.
3.2. Hardness Test
The hardness test specimen was cut from the developed alloy and composite, and the test was carried out using Vickers Micro-Hardness Tester. Eight readings were taken in different locations on the test specimen to prevent indentation right upon reinforcement particles to achieve accuracy in results. The load applied was 200 gf and a diamond indenter was used. The average hardness values are tabulated in Table 3. The hardness value of produced composite was compared with the hardness value of base material AA6061 alloy. The hardness value of developed composites exhibited a 10–15% increase compared to the base alloy. This increase was caused by hard ZrO2 particles, which were dispersed on the metal matrix phase, as shown in Figure 1a–c. Even though the produced composite exhibited higher values than the base alloy, the values started declining when the percentage composition of reinforcement increased. This inverse relationship was due to the agglomeration of particle reinforcements. This usually occurs due to the increase in percentage composition, so it is advisable to keep the percentage of composition below 10%. The hardness value of AA-ZrO2-5% was less when compared to AA-ZrO2-10%, and this attribute is due to the particle-free zone detected in the optical image, as presented in Figure 1a. The highest hardness value was reported for the AA-ZrO2-10% composite. This trend was chiefly due to the optimized amount of ZrO2 particles and good bonding and perfect configuration of ZrO2 particles along the base alloy AA6061, as presented in Figure 1c.
3.3. Experimental Plans and Measured Response Values
The developed composite specimens were machined as per Taghuchi’s L27 orthogonal array and the values of surface roughness, cutting force, and tool wear were tabulated in Table 4. As surface roughness is one of the prime responses of machining in order to achieve precise and authenticated value, nine readings were recorded in three different locations. This study investigates the influence of dry and MQL with two different levels on surface roughness, and three levels of wt percent of reinforcement in the metal matrix. In addition, this investigation studies the effect of machining parameters like cutting speed, feed rate, and depth of cut.
4. Influence of Controllable Factors on Surface Roughness
Surface roughness always predicts performance of mechanical components as the irregularities can cause cracks, corrosion, friction wear, etc. In some cases, this supports lubrication by holding the lubricant. The main factors which have considerable effect on surface roughness are feed rate, cutting speed, depth of cut, vibrations of cutting tools, a condition of lubricant, and tool specifications. As for the composite’s bonding between the base alloy and reinforcement particle, it contributed much to attain better surface finish. As there is no evidence for particle pull-out or visible pores. as per Figure 1a–c, this attribute contributed for good surface finish.
4.1. Effect of Cutting Speed on Surface Roughness
It has been indicated by various researchers that cutting speed influences surface at roughness [15,16,17]. Higher cutting speeds result in a relatively better surface finish, but when the limit is exceeded, it results in flank wear [18]. This needs to be optimized. The results indicate that by increasing cutting speed, the surface finish can be improved. Lower cutting speed causes built-up edge (BUE) when machining multiphase materials. It produces large quantity of burr on the machined surface, which results in deterioration of surface finish. The relationship between cutting speed and surface roughness is inversely proportional. At low cutting speeds (30 m/min), high friction was created due to large quantity flow of material at the cutting edge caused high surface roughness values. At high cutting speeds (90 m/min), low friction was created due to a lesser quantity flow of material at the cutting edge caused by low surface roughness values, which were 0.9 as shown in Table 4. Also, higher temperatures on the tool made the matrix material flow, thus making the surface smoother and reducing the tendency for BUE to form. Besides theory, this investigation records most of the best surface roughness values, which are from 0.5–0.8 µm at the cutting speed of 60 m/min.
4.2. Effect of Feed Rate on Surface Roughness
Generally, the relationship between feed rate and surface roughness is directly proportional. This depends on the type of edge (i.e., pointed or curved) or nose radius. During machining, the edge of the cutting tool gets imprinted on the work piece surface, so the surface roughness depends upon the feed rate. In addition, according to the fundamentals of the metal-cutting process, if feed rate controls the pitch of the machined surface profile, then Ra = f2/32r. Table 4 shows the values of surface roughness with respect to feed rate, and this clearly depicts that the surface roughness is inversely proportional to feed rate. Most of the minimum values of surface roughness were obtained for a feed rate value of 0.1, which is this level 1 without taking other factors into account.
4.3. Effect of Depth of Cut on Surface Roughness
It has been revealed from the investigation of various researchers that there is no significant effect of depth of cut on surface roughness, but depth of cut has a huge effect on cutting force. High depth of cut creates vibration and instability, which can indirectly affect surface roughness. Table 4 depicts the level 2 depth of cut, which is 0.75 mm and gives a low surface roughness value, which is less than 1 micrometer.
4.4. Effect of Rate of Flow on Surface Roughness
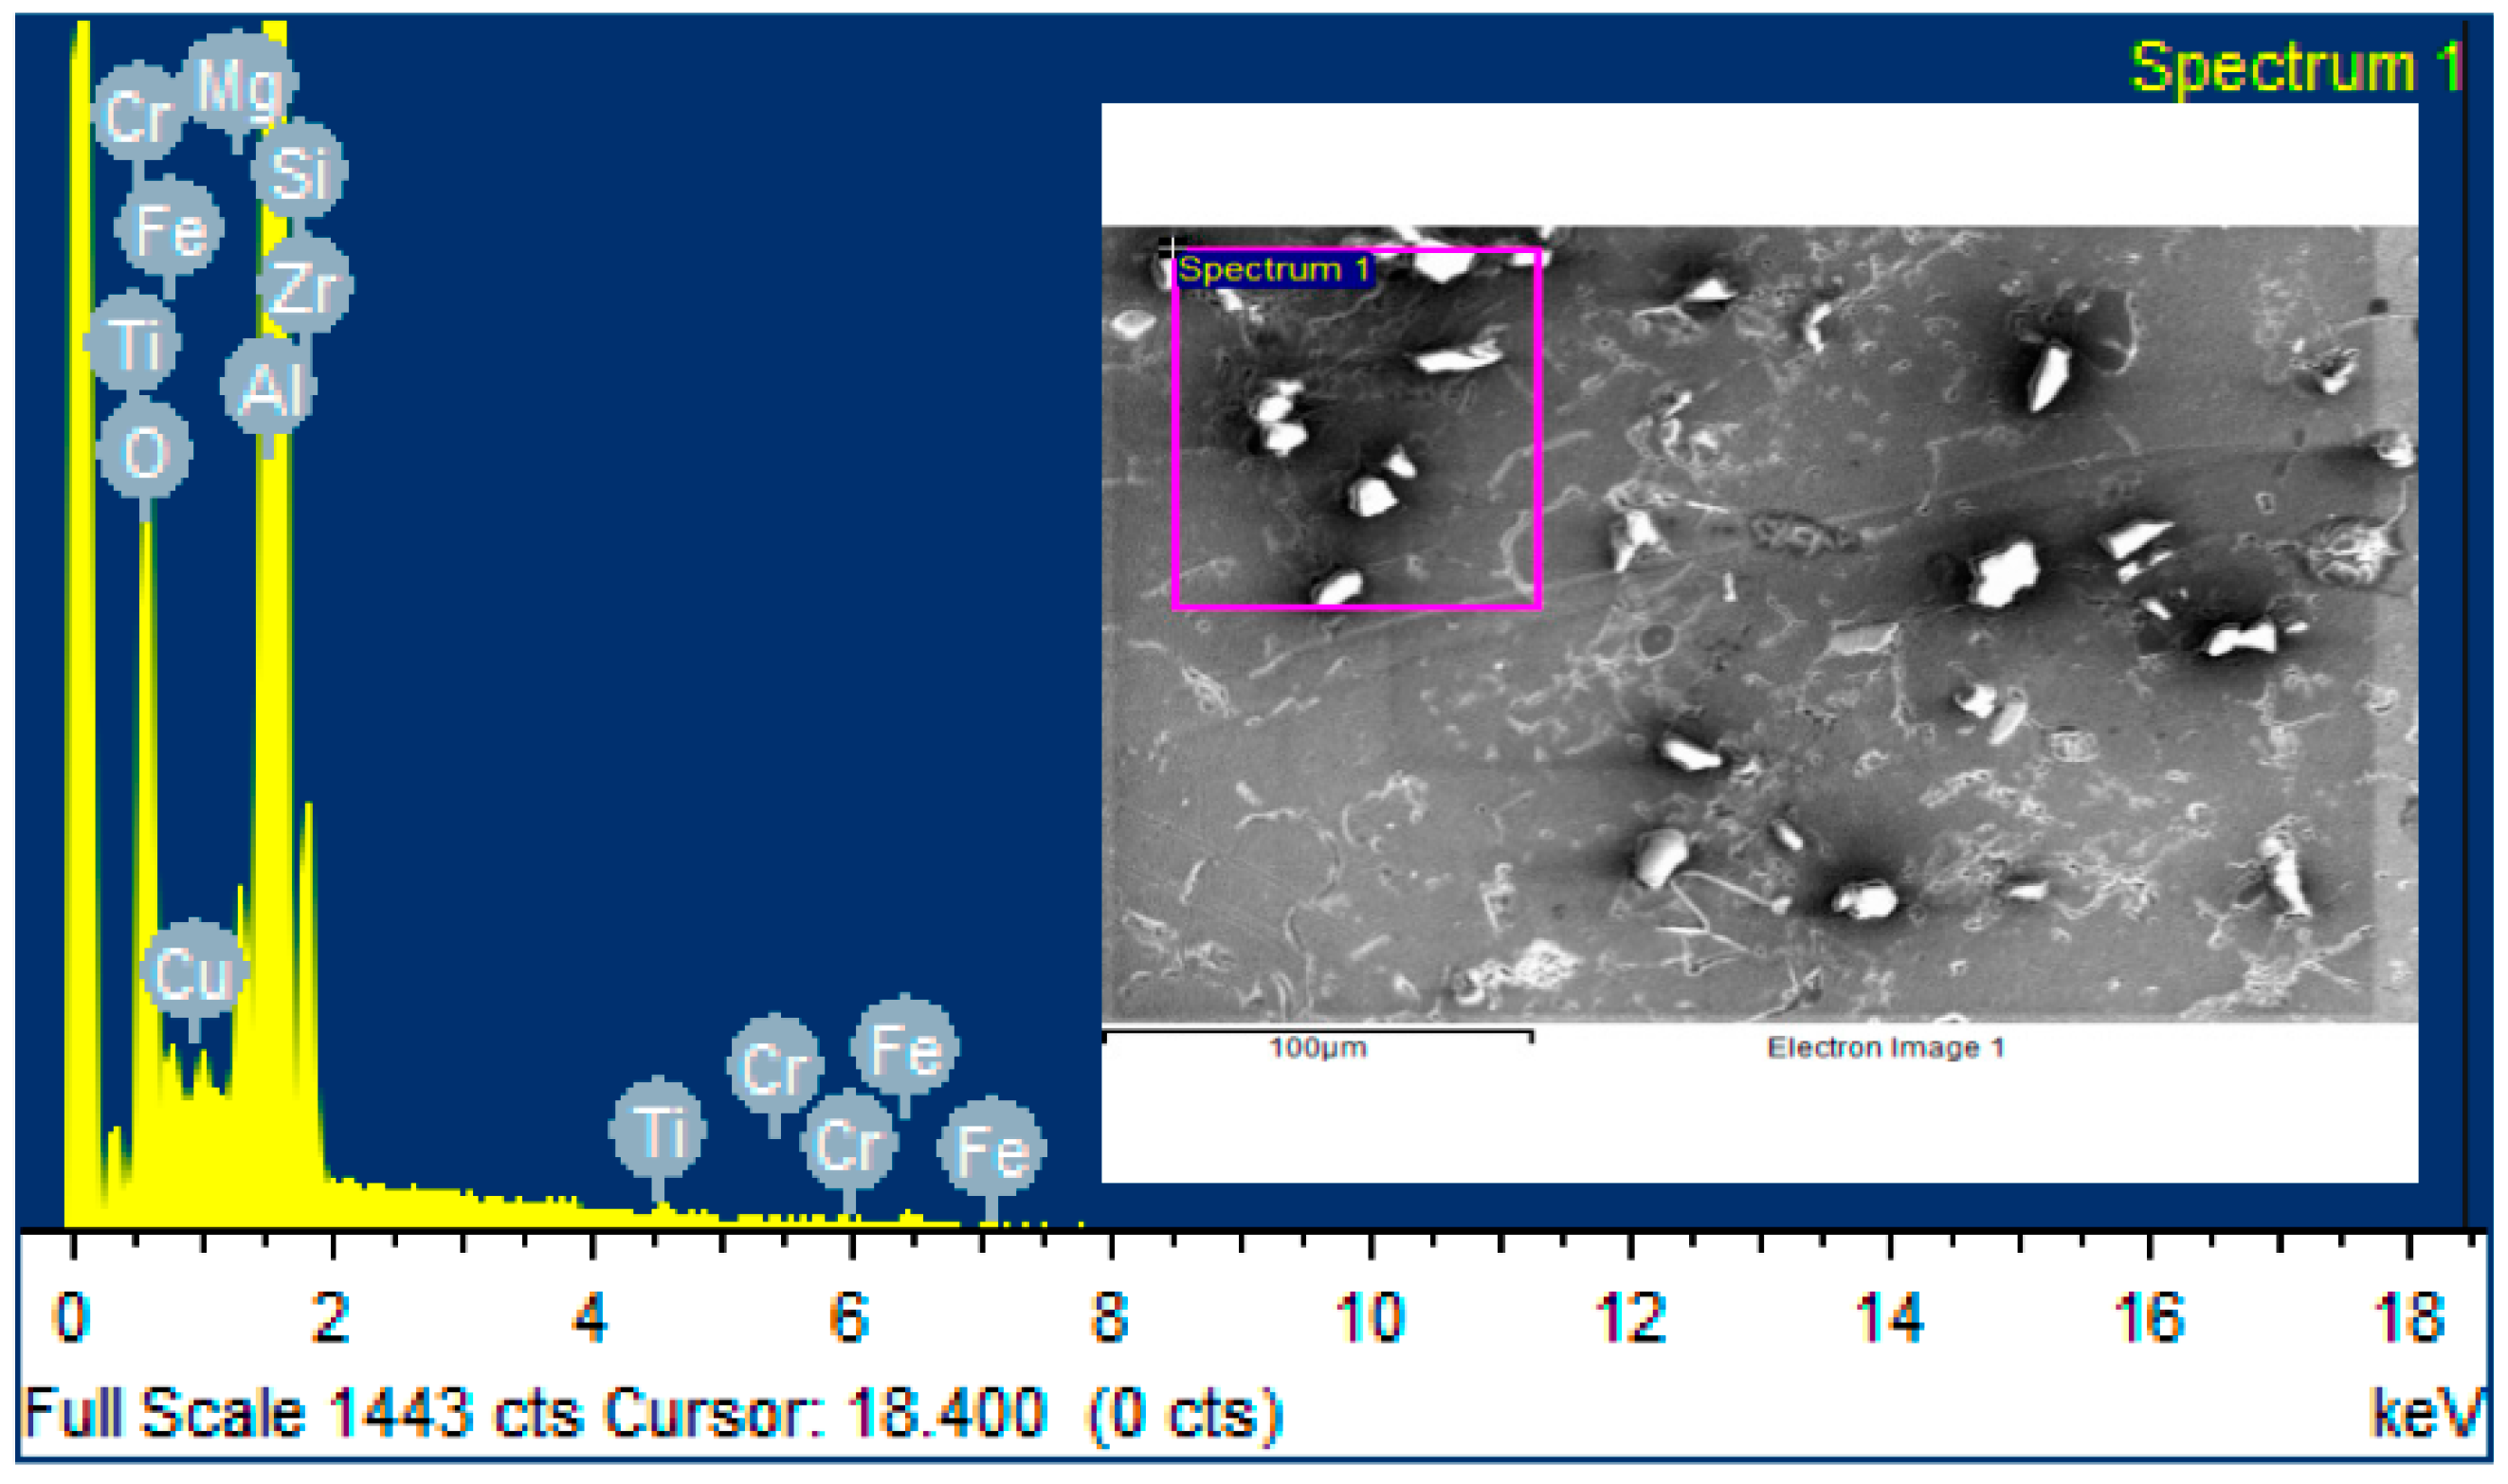
It is evident that when rate of flow of oil increases, the surface roughness will be good. A. Çakırin reported that increased feed rate and cutting speed had a negative effect on surface quality, while increased flow rate exhibited a positive effect on surface quality [19]. From Figure 3 it is clearly understood that for dry machining (i.e., 0 mL/h) the surface roughness value is relatively high from 3–4 micrometres, but for 100 mL/h rate of flow, the value is 0–2 micrometres only. This proves rate of flow of lubricant in MQL influences surface at roughness value.
4.5. Effect of Percentage of Reinforcement on Surface Roughness
Mostly, high percentages of reinforcement increased surface roughness, due to harder ceramic particles in the work piece materials, as shown in Figure 1a–c. furthermore, pores and pull-outs during machining can cause increased surface roughness value. In this work, as per Table 4, there was no linear relationship between the percentage of reinforcement and surface roughness. Good surface roughness was achieved with 5, 10, and 15 percent of reinforcement.
4.6. ANOVA Analysis for Surface Roughness
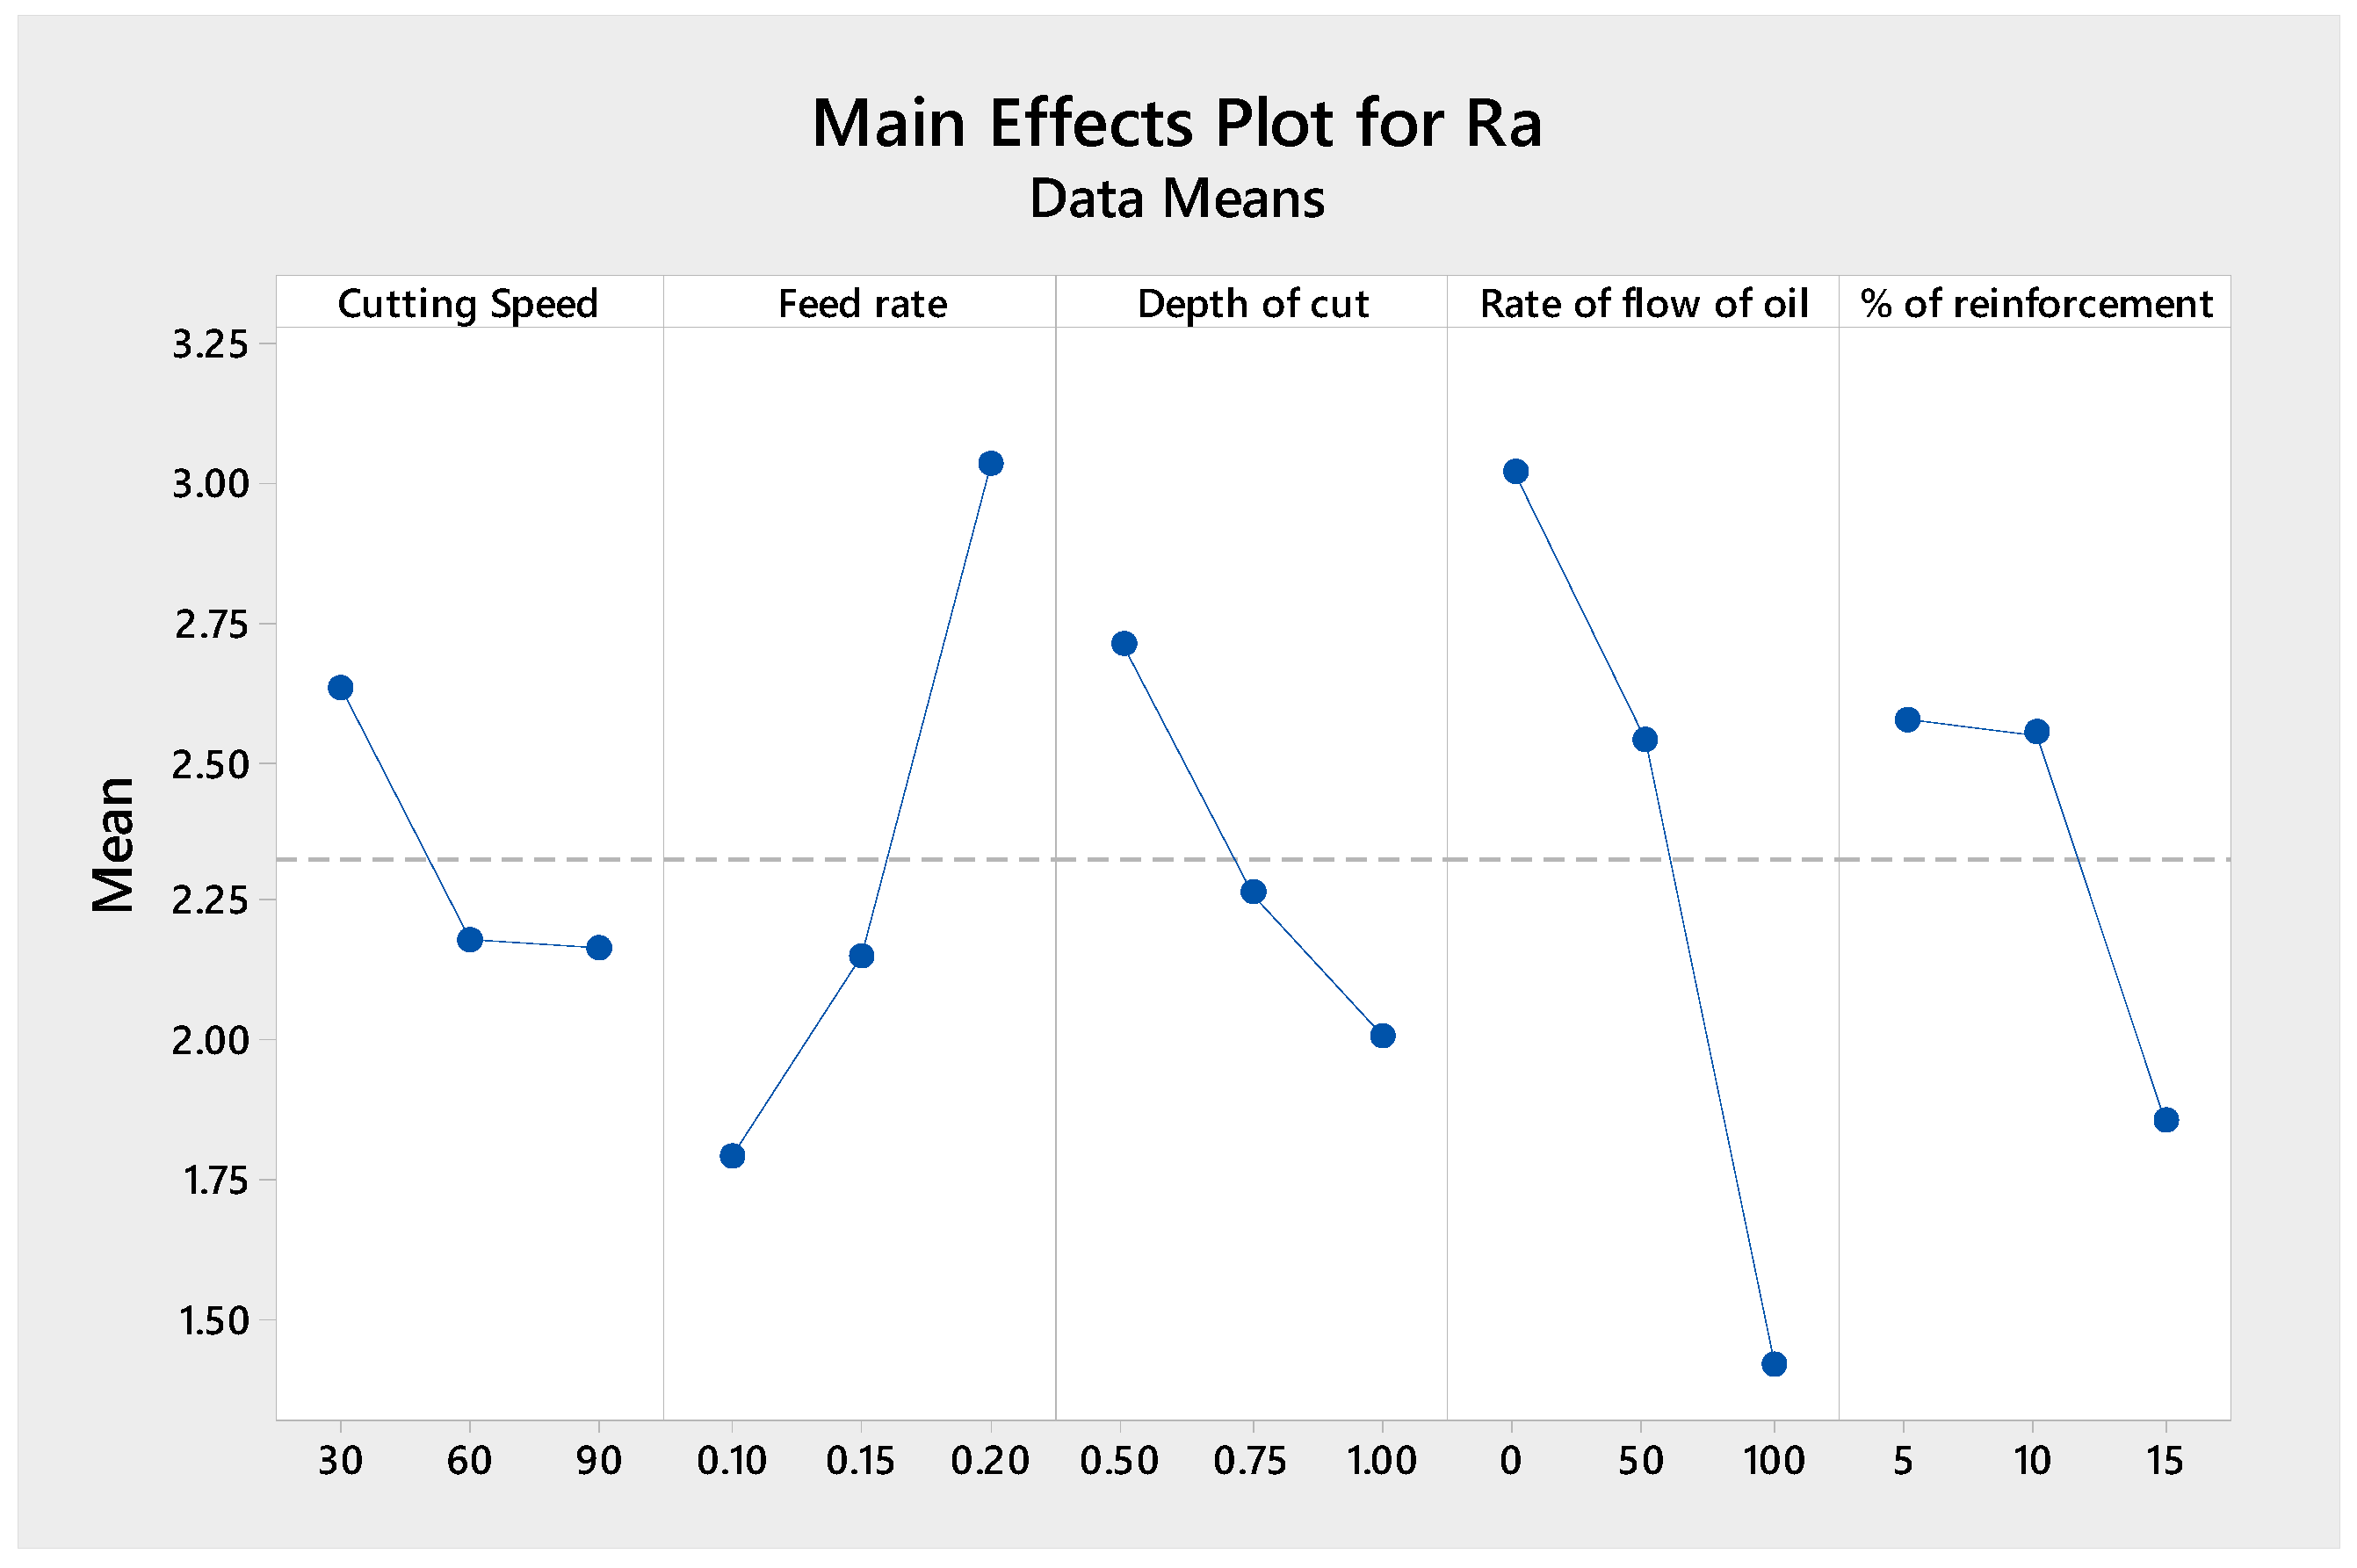
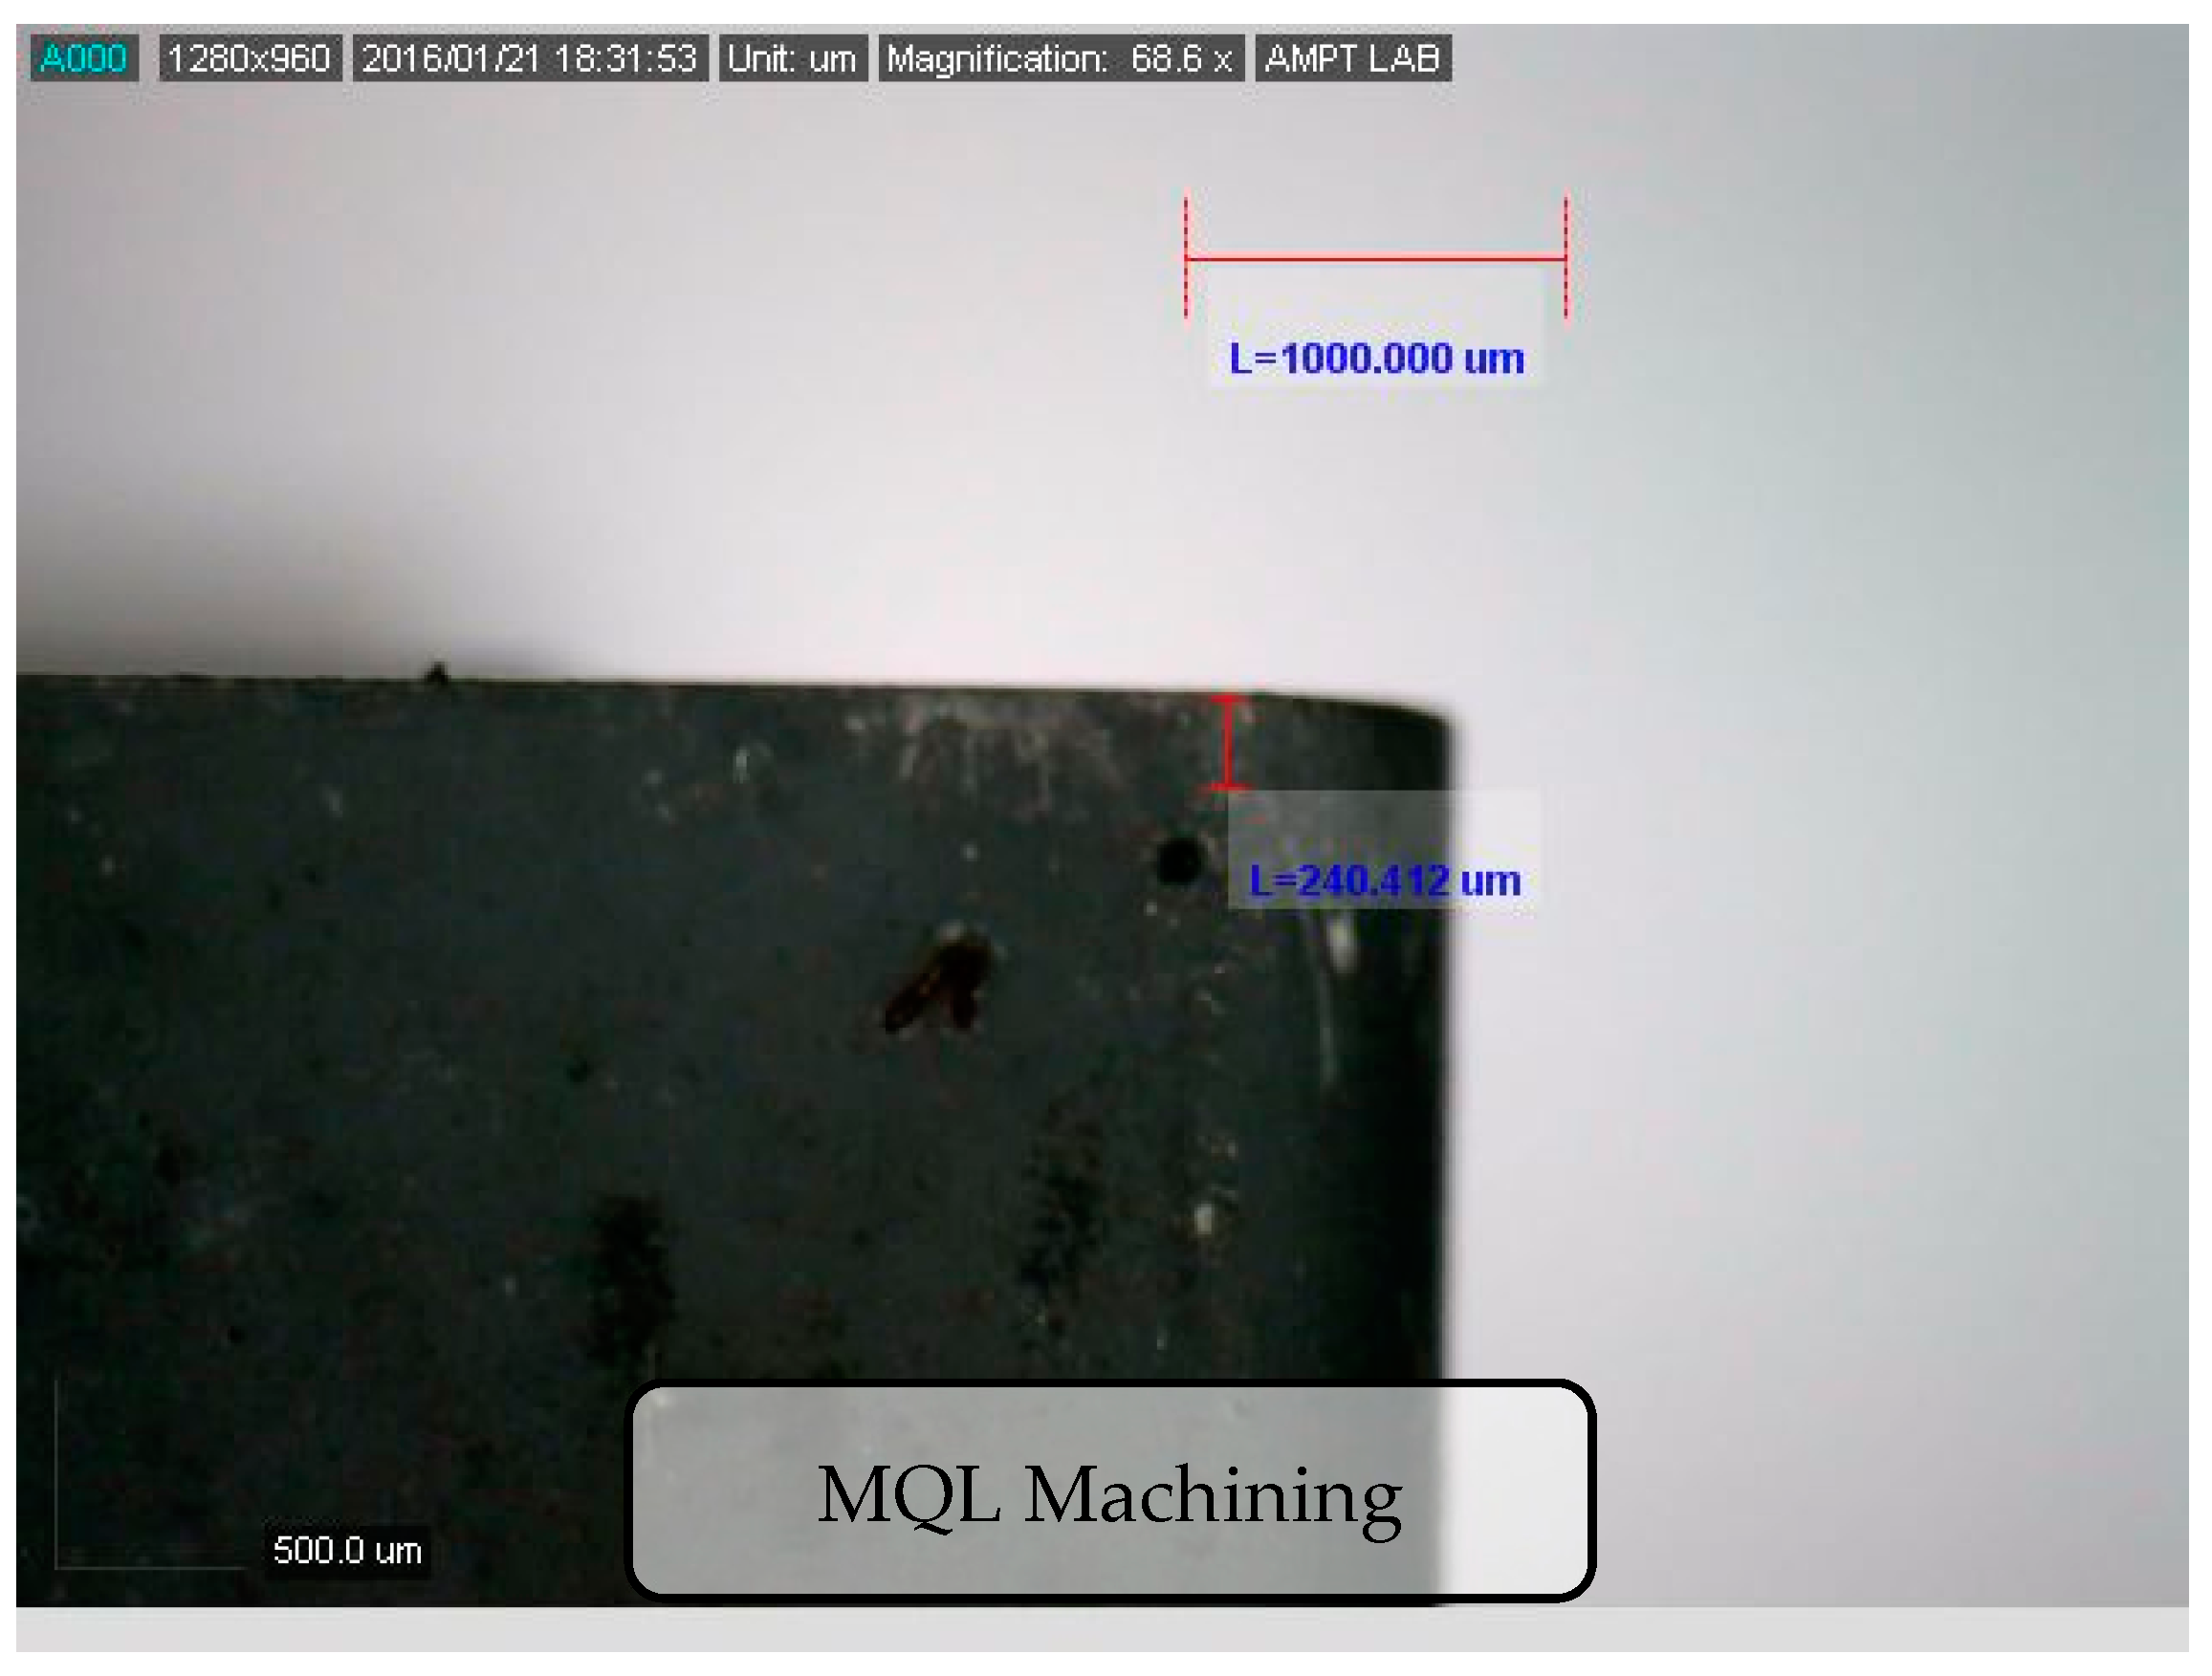
The main effect graph for the five factors A–E versus surface roughness is shown in Figure 4. ANOVA was performed to find out the significant factors and their percentage of contribution (POC), as tabulated in Table 5. The analysis shows that the five factors were considered to influence surface roughness, while the most influential parameter was the rate of flow (D), and it contributes 43.58%. Flow of lubricant stops built-up edge development, which is one of the foremost factors which affects surface roughness, as shown in Figure 5. Not only that, the flow of lubricant reduces tool wear and enables smooth and sharp removal of material, such as chips. For example, Figure 6 shows the type of tool wear which occurred without built-up edge while turning as per Exp-11 combination. The type of chip formed during MQL machining is discontinuous, which proves this concept. The second most influential factor was feed rate (A) and it contributed 26.55%. Surface roughness was directly proportional to feed rate, and this has been proven by several researchers [20]. The interaction effect of cutting force and % of reinforcement is significant but its contribution is very low; it was 10.81%.
4.7. Main Effect Plots for Means for Surface roughness (Ra)
Figure 4 shows the main effect plot for Surface roughness (Ra). From the graph, it is clearly understood that to obtain good surface roughness value, the levels should be A2, B1, C3, D3, and E3. When percentage of reinforcement (E5) increases, most often it leads to poor surface roughness. If the bonding between particle and metal phase is good, it offers good surface roughness. Proper bonding can avert pull-out of particles during the machining process.
4.8. S/N Ratio Analysis for Surface Roughness
From Table 6 it is noted that all factors had a significant effect on response, and the most influential factor was the rate of flow (D) and its contribution was 42.9%. The second most influential factor was feed rate (B), and its contribution was 29.06. The factors and their contributions were obtained by both analysis of means and analysis of Signal-to-noise ratio (S/N) methods, and the results were the same. This proves the accuracy and reliability of the experiments and analysis.
4.9. S/N Ratio Plots for Surface Roughness
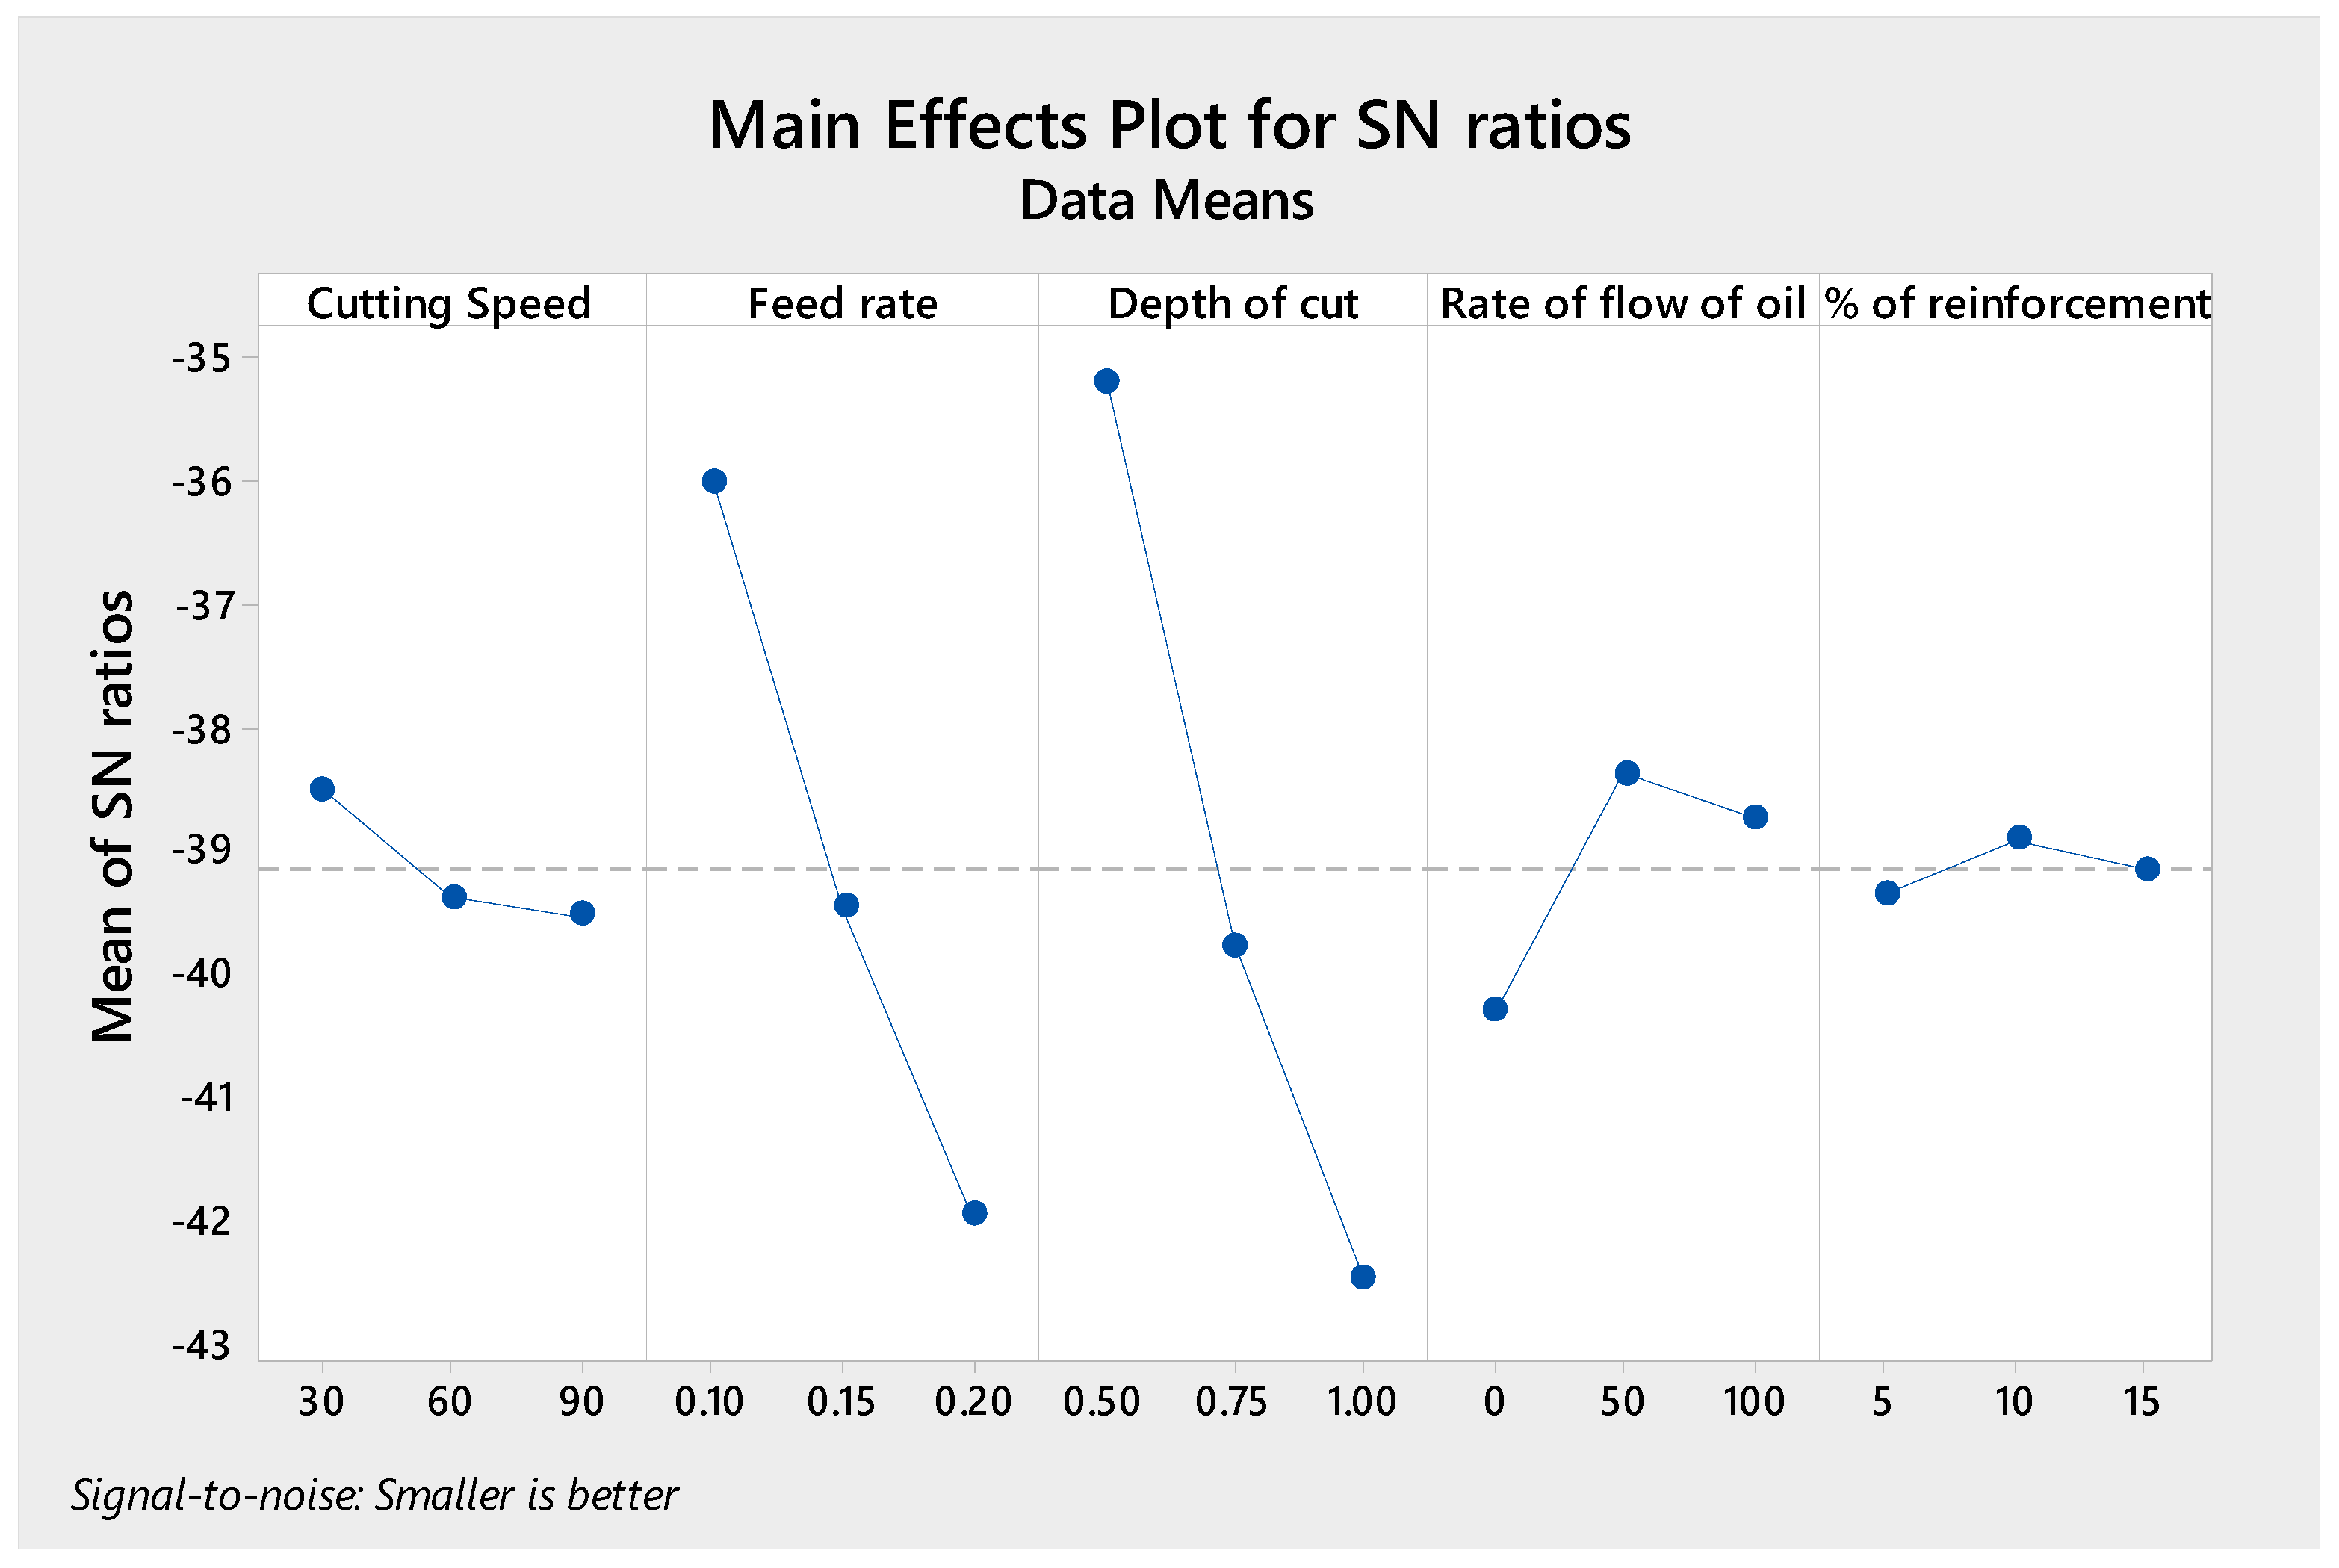
Signal-to-noise ratio analysis is the ratio between signal to noise, where noise represents the undesirable value, and signal represents the desirable value. This analysis was carried out by choosing the smaller the better characteristics for surface roughness, as we require low level surface values as a response. S/N ratio averts deviance from set or target values by reducing variance, and thus measures the effectiveness of the process. Figure 7 shows the S/N ratio plots for surface roughness. From the graph, the sequence for better surface finish was A2, B1, C2, D3, and E3. This result coincides with various reviews related to machining [21].
4.10. Most Influential Factor on Surface Roughness
The influence of each factor on various responses was confirmed with the help of S/N ratio analysis. Rate of flow (D) had a huge impact on surface roughness compared to all other factors.
5. Influence of Controllable Factors on Cutting Force
5.1. ANOVA and S/N Ratio Analysis for Cutting Force
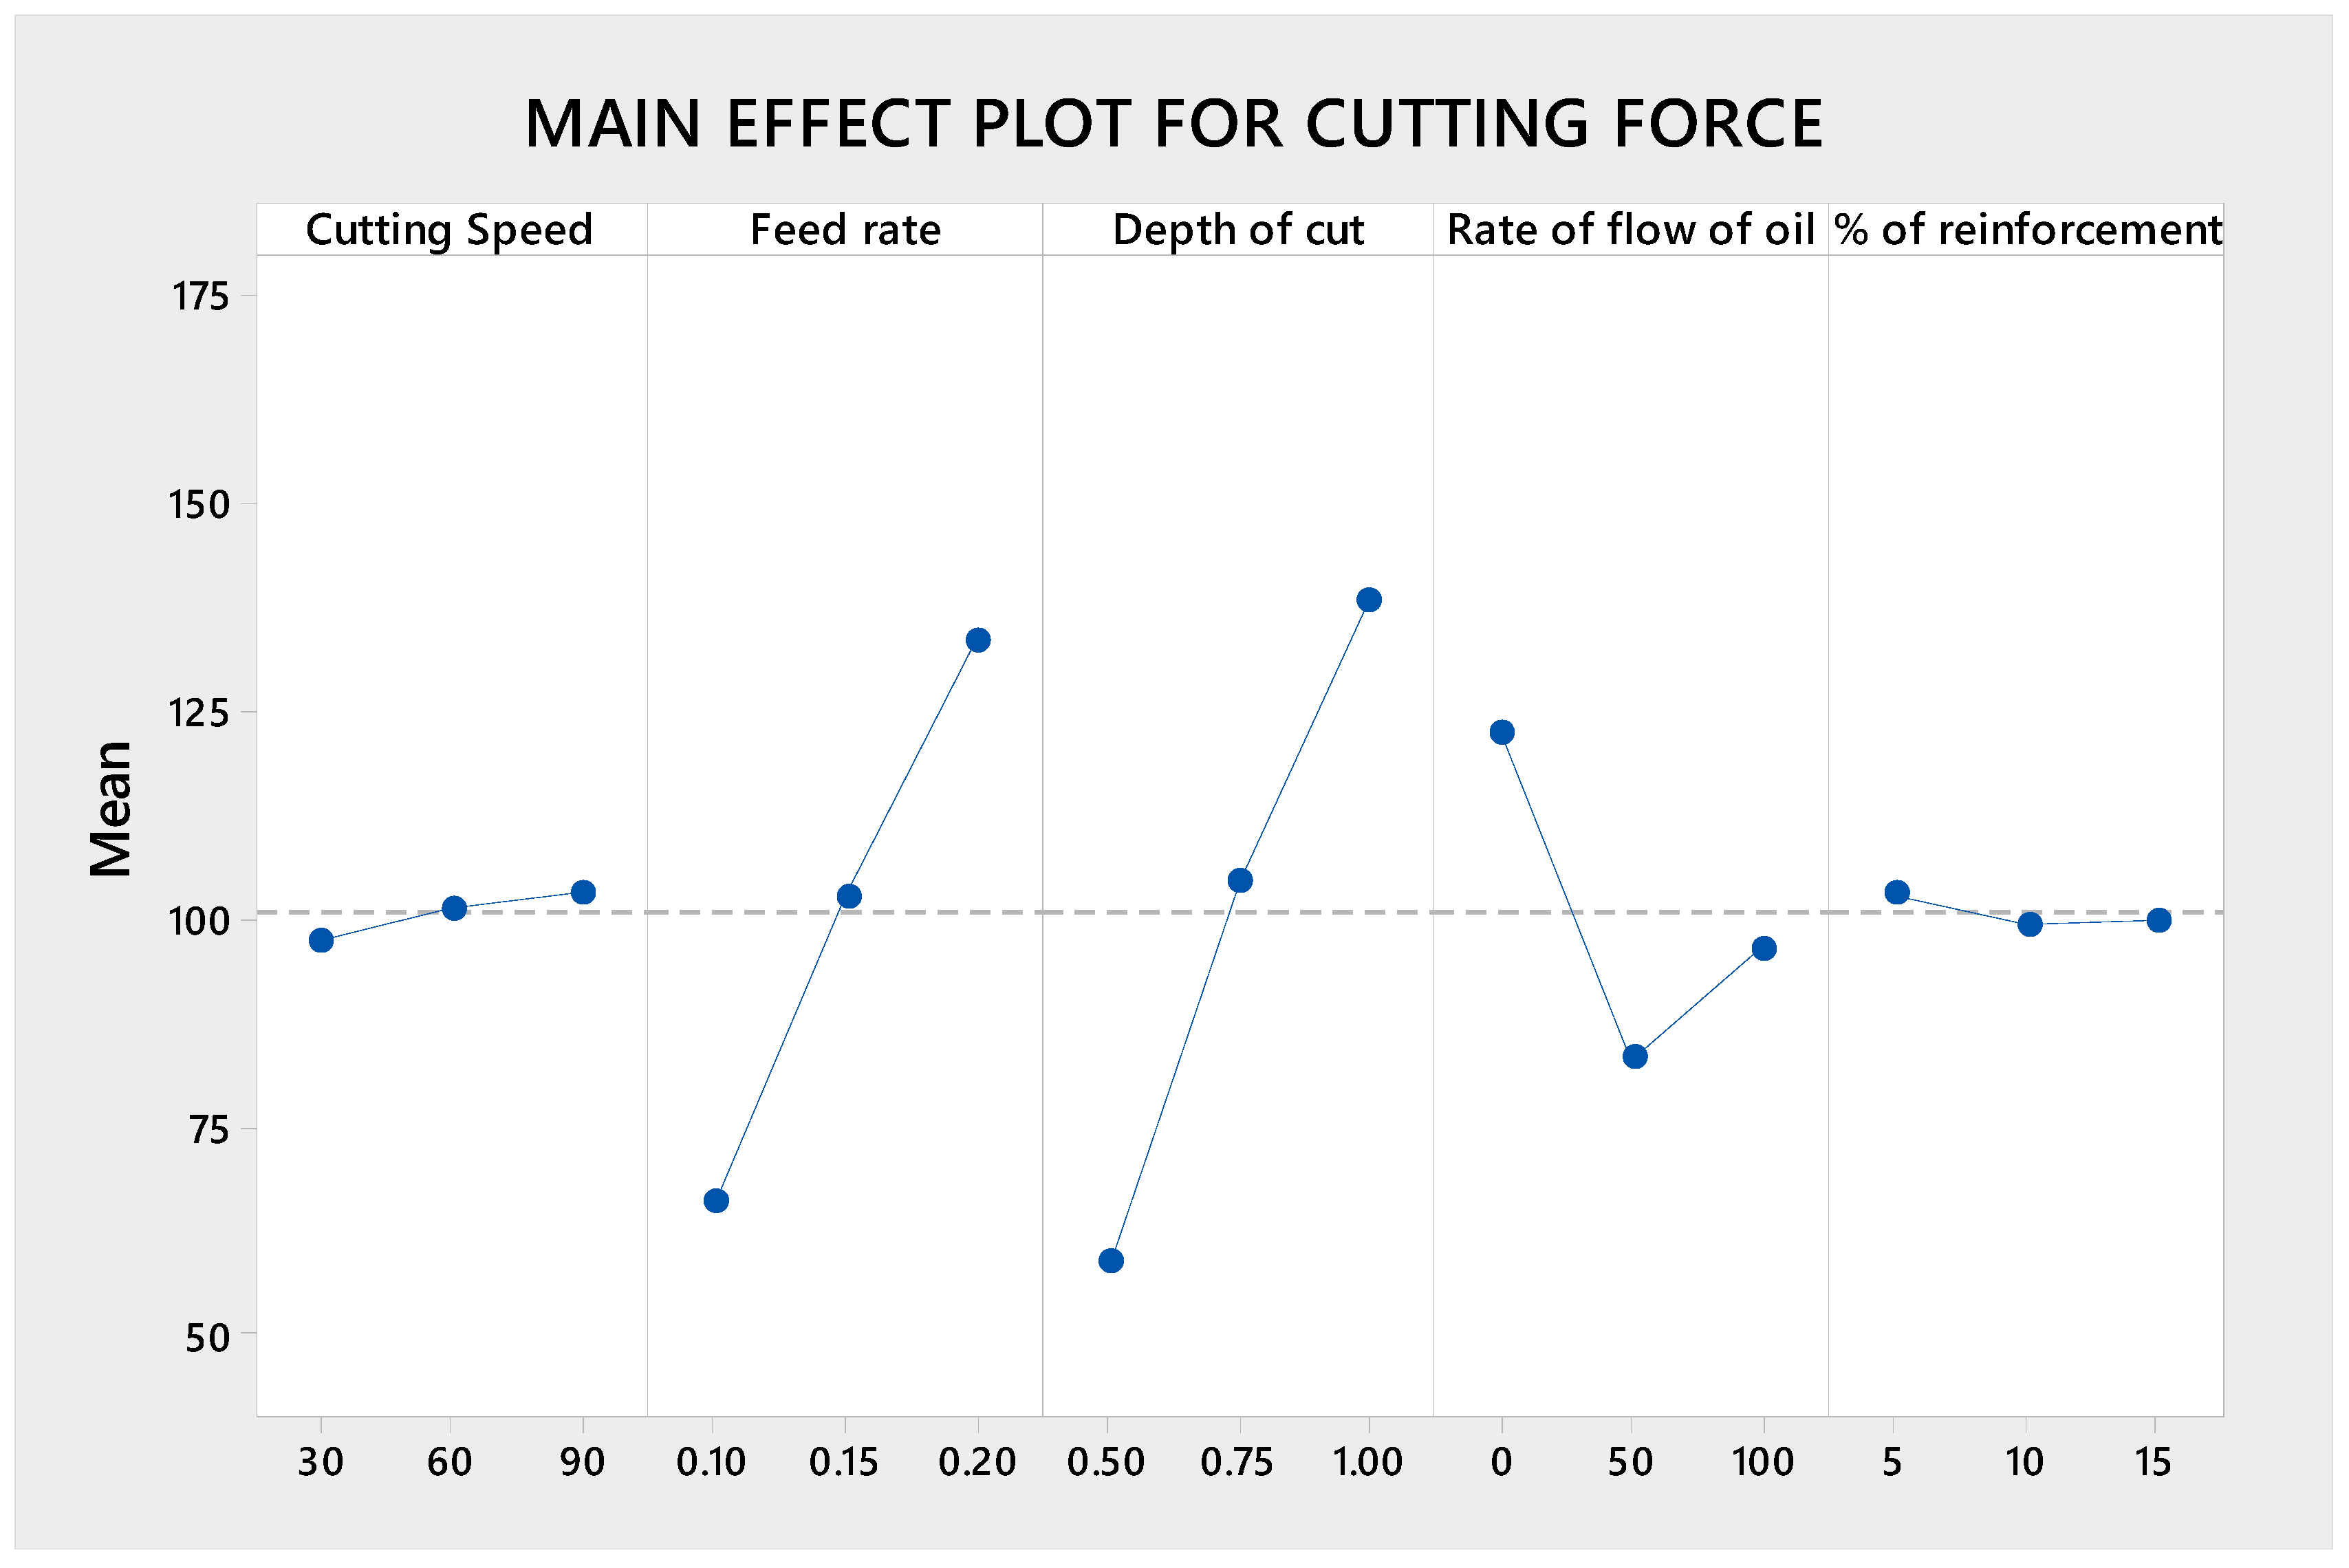
ANOVA analysis finds out the significant factor and its percentage of contribution. Table 7 shows that except percentage of reinforcement, all other factors were significant. The most significant factor was the depth of cut (C), and its contribution was 50.45%. When depth of cut increases, the contact area between the tool and work piece increases, which creates huge force. The second most significant factor was feed rate (B), and its contribution was 35.92%. Increases in cutting force leads to huge power consumption and tool damage wear as well. Power consumption has direct environmental impacts.
5.2. Main Effect Plots for Means for Cutting Force
The main effects show the trend of factors on response, which is cutting force. Figure 8 shows the main effect plot for cutting force. From the graph, it is clearly understood that to obtain minimum cutting force value, the levels of factors considered should be A1, B1, C1, D2, and E2. This sequence is in line with all theory and other research outputs. As for percentage of reinforcement (E2), when percentage of reinforcement increases, it mostly leads to high cutting force because it is always difficult to machine when hard ceramic particles come in contact with tools. Tools need to be judicially selected by considering the type and hardness of work piece material, but in the case of composites, the nature of reinforcement particle needs to be taken into account. Rate of flow did not have much influence (i.e., 50 mL/h or 100 mL/h), but dry machining (0 mL/h) caused an increase in cutting force due to frictional force. This concept has been agreed upon by many researchers [22].
5.3. S/N Ratio Analysis for Cutting Force
The S/N analysis table clearly depicts the influential factors and their contributions. From Table 8, it is noted that all factors had a significant effect on response, except percentage of reinforcement (E). The most influential factor was depth of cut (C), and its contribution was 56.26%. The second most influential factor was feed rate (B), and its contribution was 36.88. The significant factor found by both analysis of means and of S/N ratio methods was the same. This proves the accuracy and reliability of the experiment methods, values, and analysis.
5.4. S/N Ratio Plots for Cutting Force
The S/N ratio analysis was conducted by selecting the smaller the better characteristics for the response cutting force, as we require low-level cutting force values as a response. Figure 9 shows the S/N ratio plots for cutting force. From the graph, the sequence for smaller cutting force values was A1, B1, C1, D2, and E2. This was the same as per the main effect plot except in the level of depth of cut. The sequence to get smaller cutting force obtained by analysis of means was same as S/N ratio analysis. This proves the good agreement with both the methods and accuracy of analysis.
5.5. Most Influential Factor on Cutting Force
The influence of each factor on various responses was confirmed with the help of S/N ratio analysis. Depth of cut (C) had a huge impact on cutting force when compared to all other factors.
6. Influence of Controllable Factors on Tool Wear
6.1. ANOVA and S/N Ratio Analysis for Tool Wear
Analysis of Variance was employed to find out the significant factors and their percentage of contribution. Table 9 shows that except rate of flow (D), all other factors were insignificant. The most significant factor was the rate of flow (D), and its contribution was 39.1%. The heat produced due to friction between tool and work piece caused tool wear. Due to the flow of lubricant, frictional force was prevented and rate of flow of lubricant became the most influential factor.
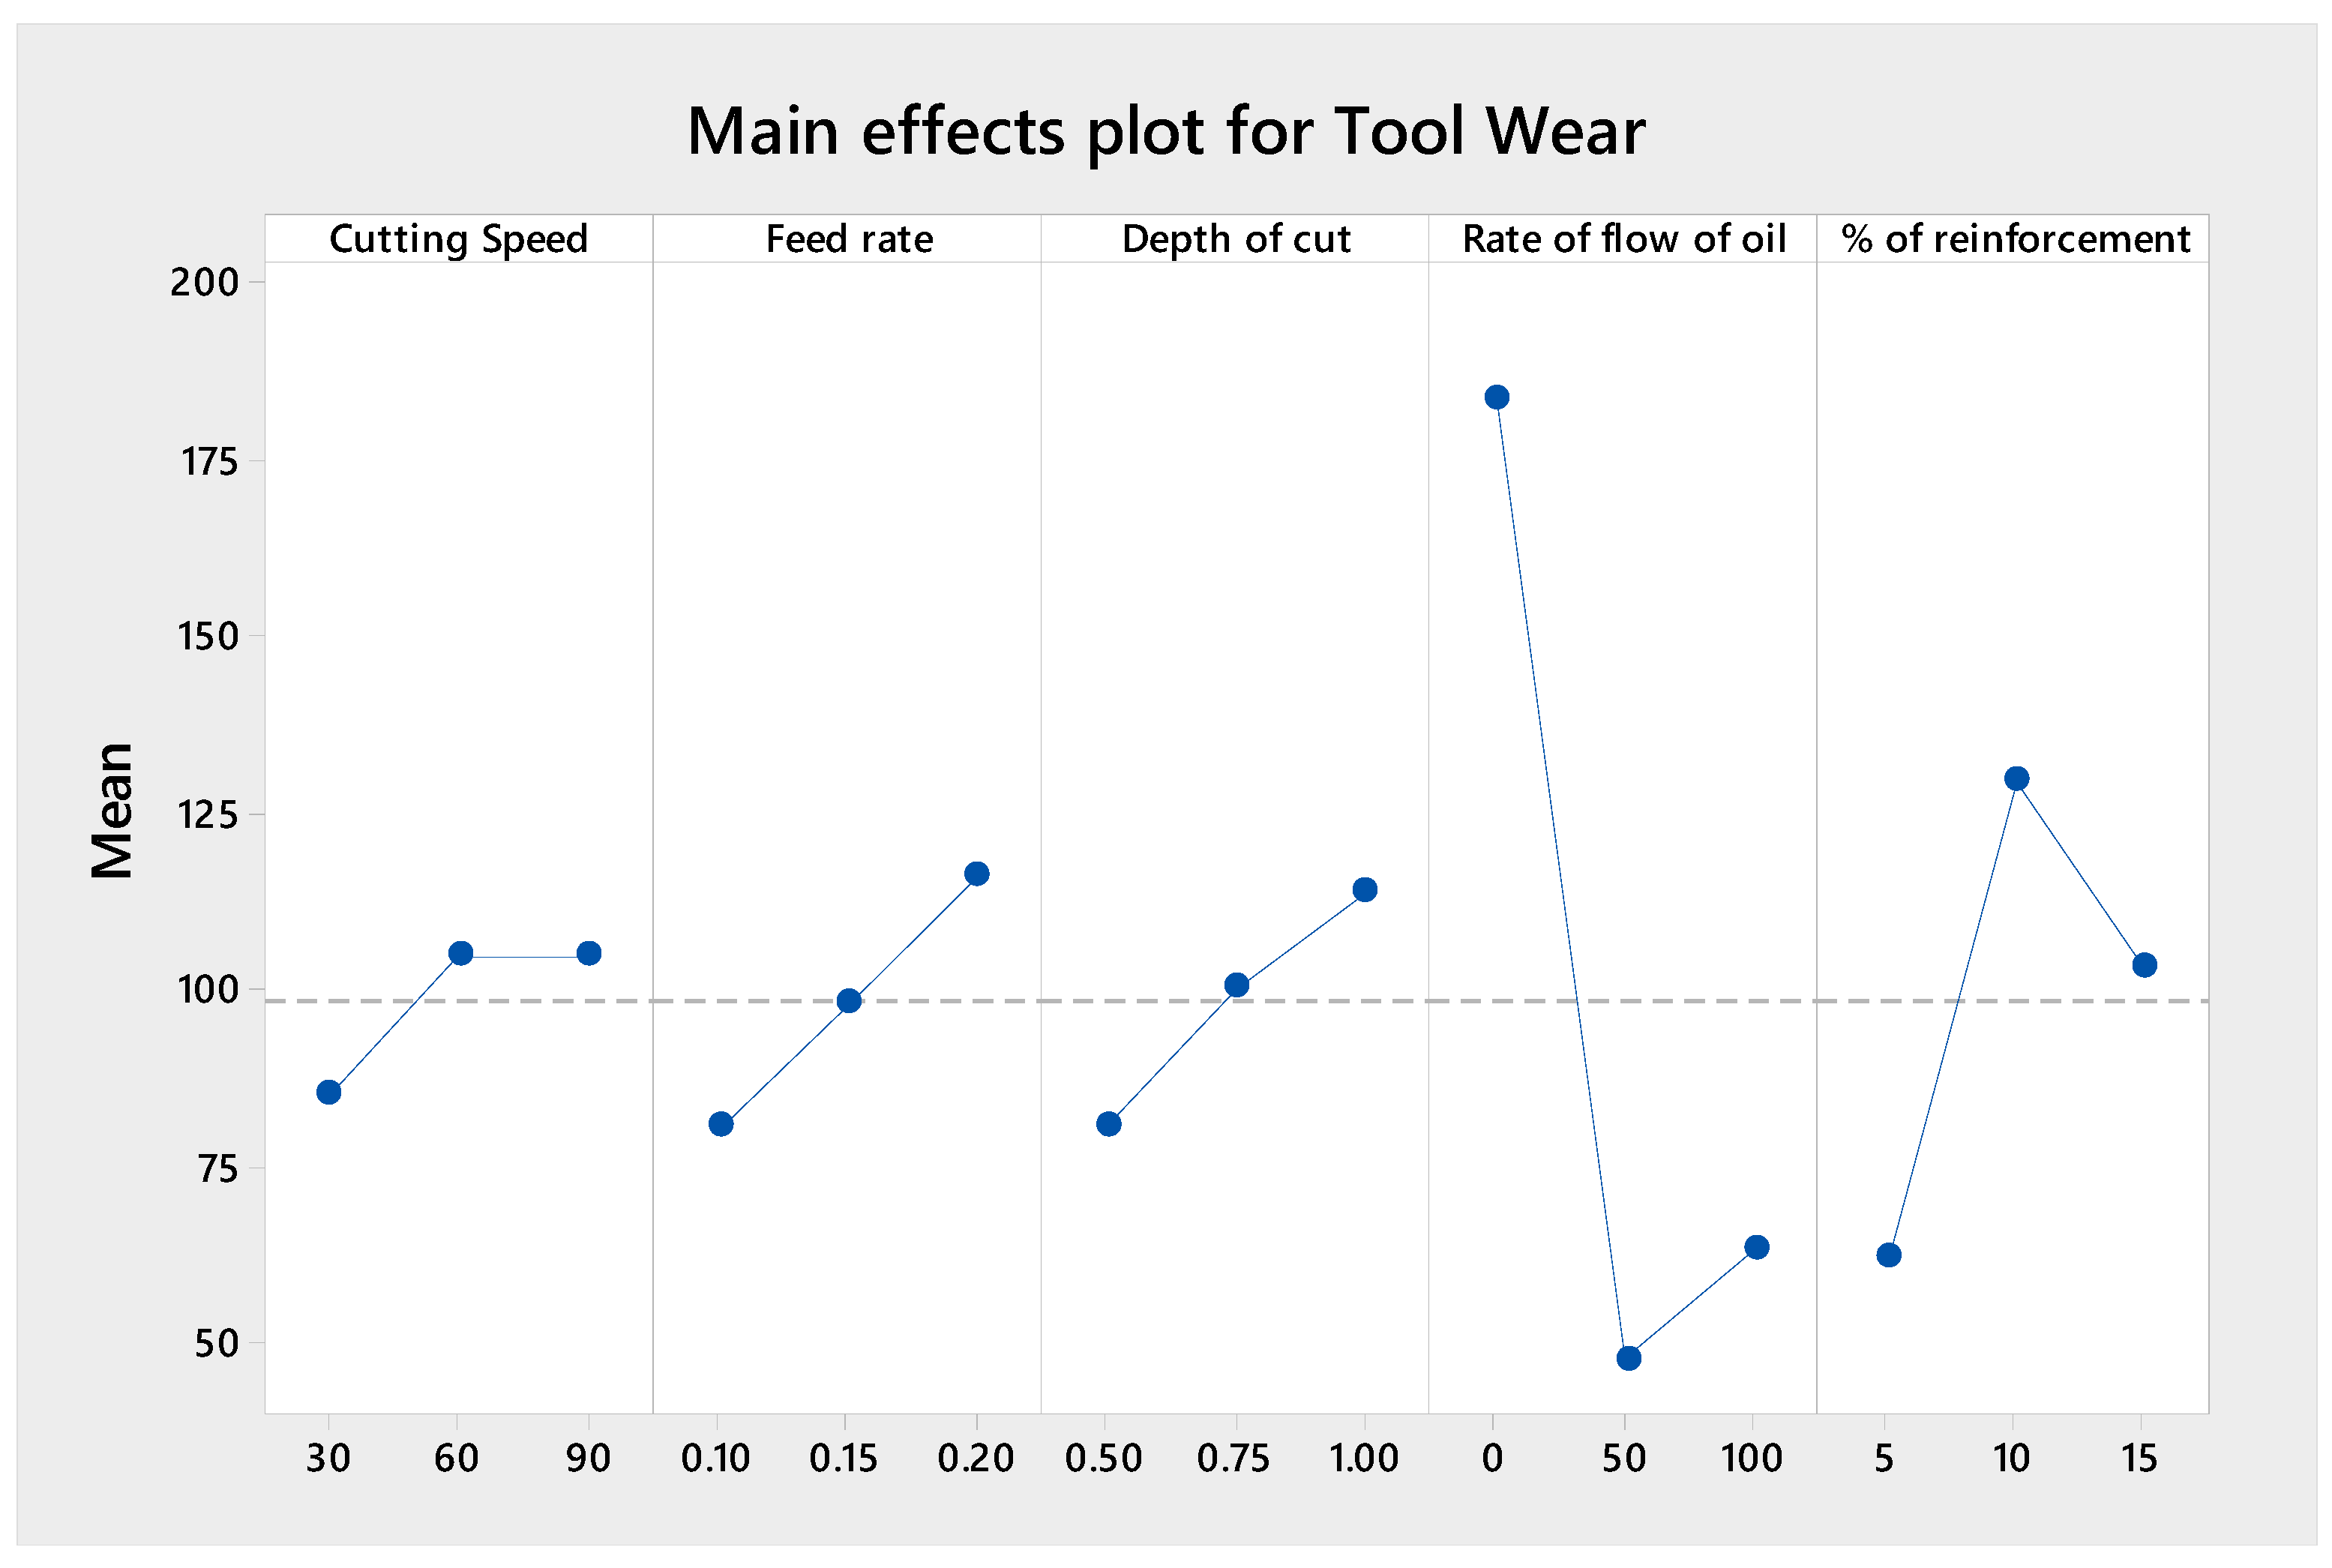
6.2. Main Effect Plots for Means for Tool Wear
The main effects show the trend of factors on response, which is tool wear. Figure 10 shows the main effect plot for tool wear. From the graph, it is clearly understood that to obtain minimum tool wear value, the levels of factors considered should be A1, B1, C1, D2, and E1. This sequence is in line with all theory and other research outputs. As for percentage of reinforcement (E1), when percentage of reinforcement increased it mostly lead to high tool wear because harder ceramic particles come in contact with the tool during machining, which creates high tool wear. Rate of flow of lubricant nullified the effect of frictional force.
6.3. S/N Ratio Analysis for Tool Wear
The S/N analysis table clearly depicts the influential factors and its contribution. From Table 10 it is noted that all factors had an insignificant effect on response, except rate of flow (D). The most influential factor was the rate of flow (D), and its contribution was 49.5%. The significant factor found by both analysis of means and analysis of S/N ratio was the same. This proves the accuracy and reliability of the experiment methods, values, and analysis.
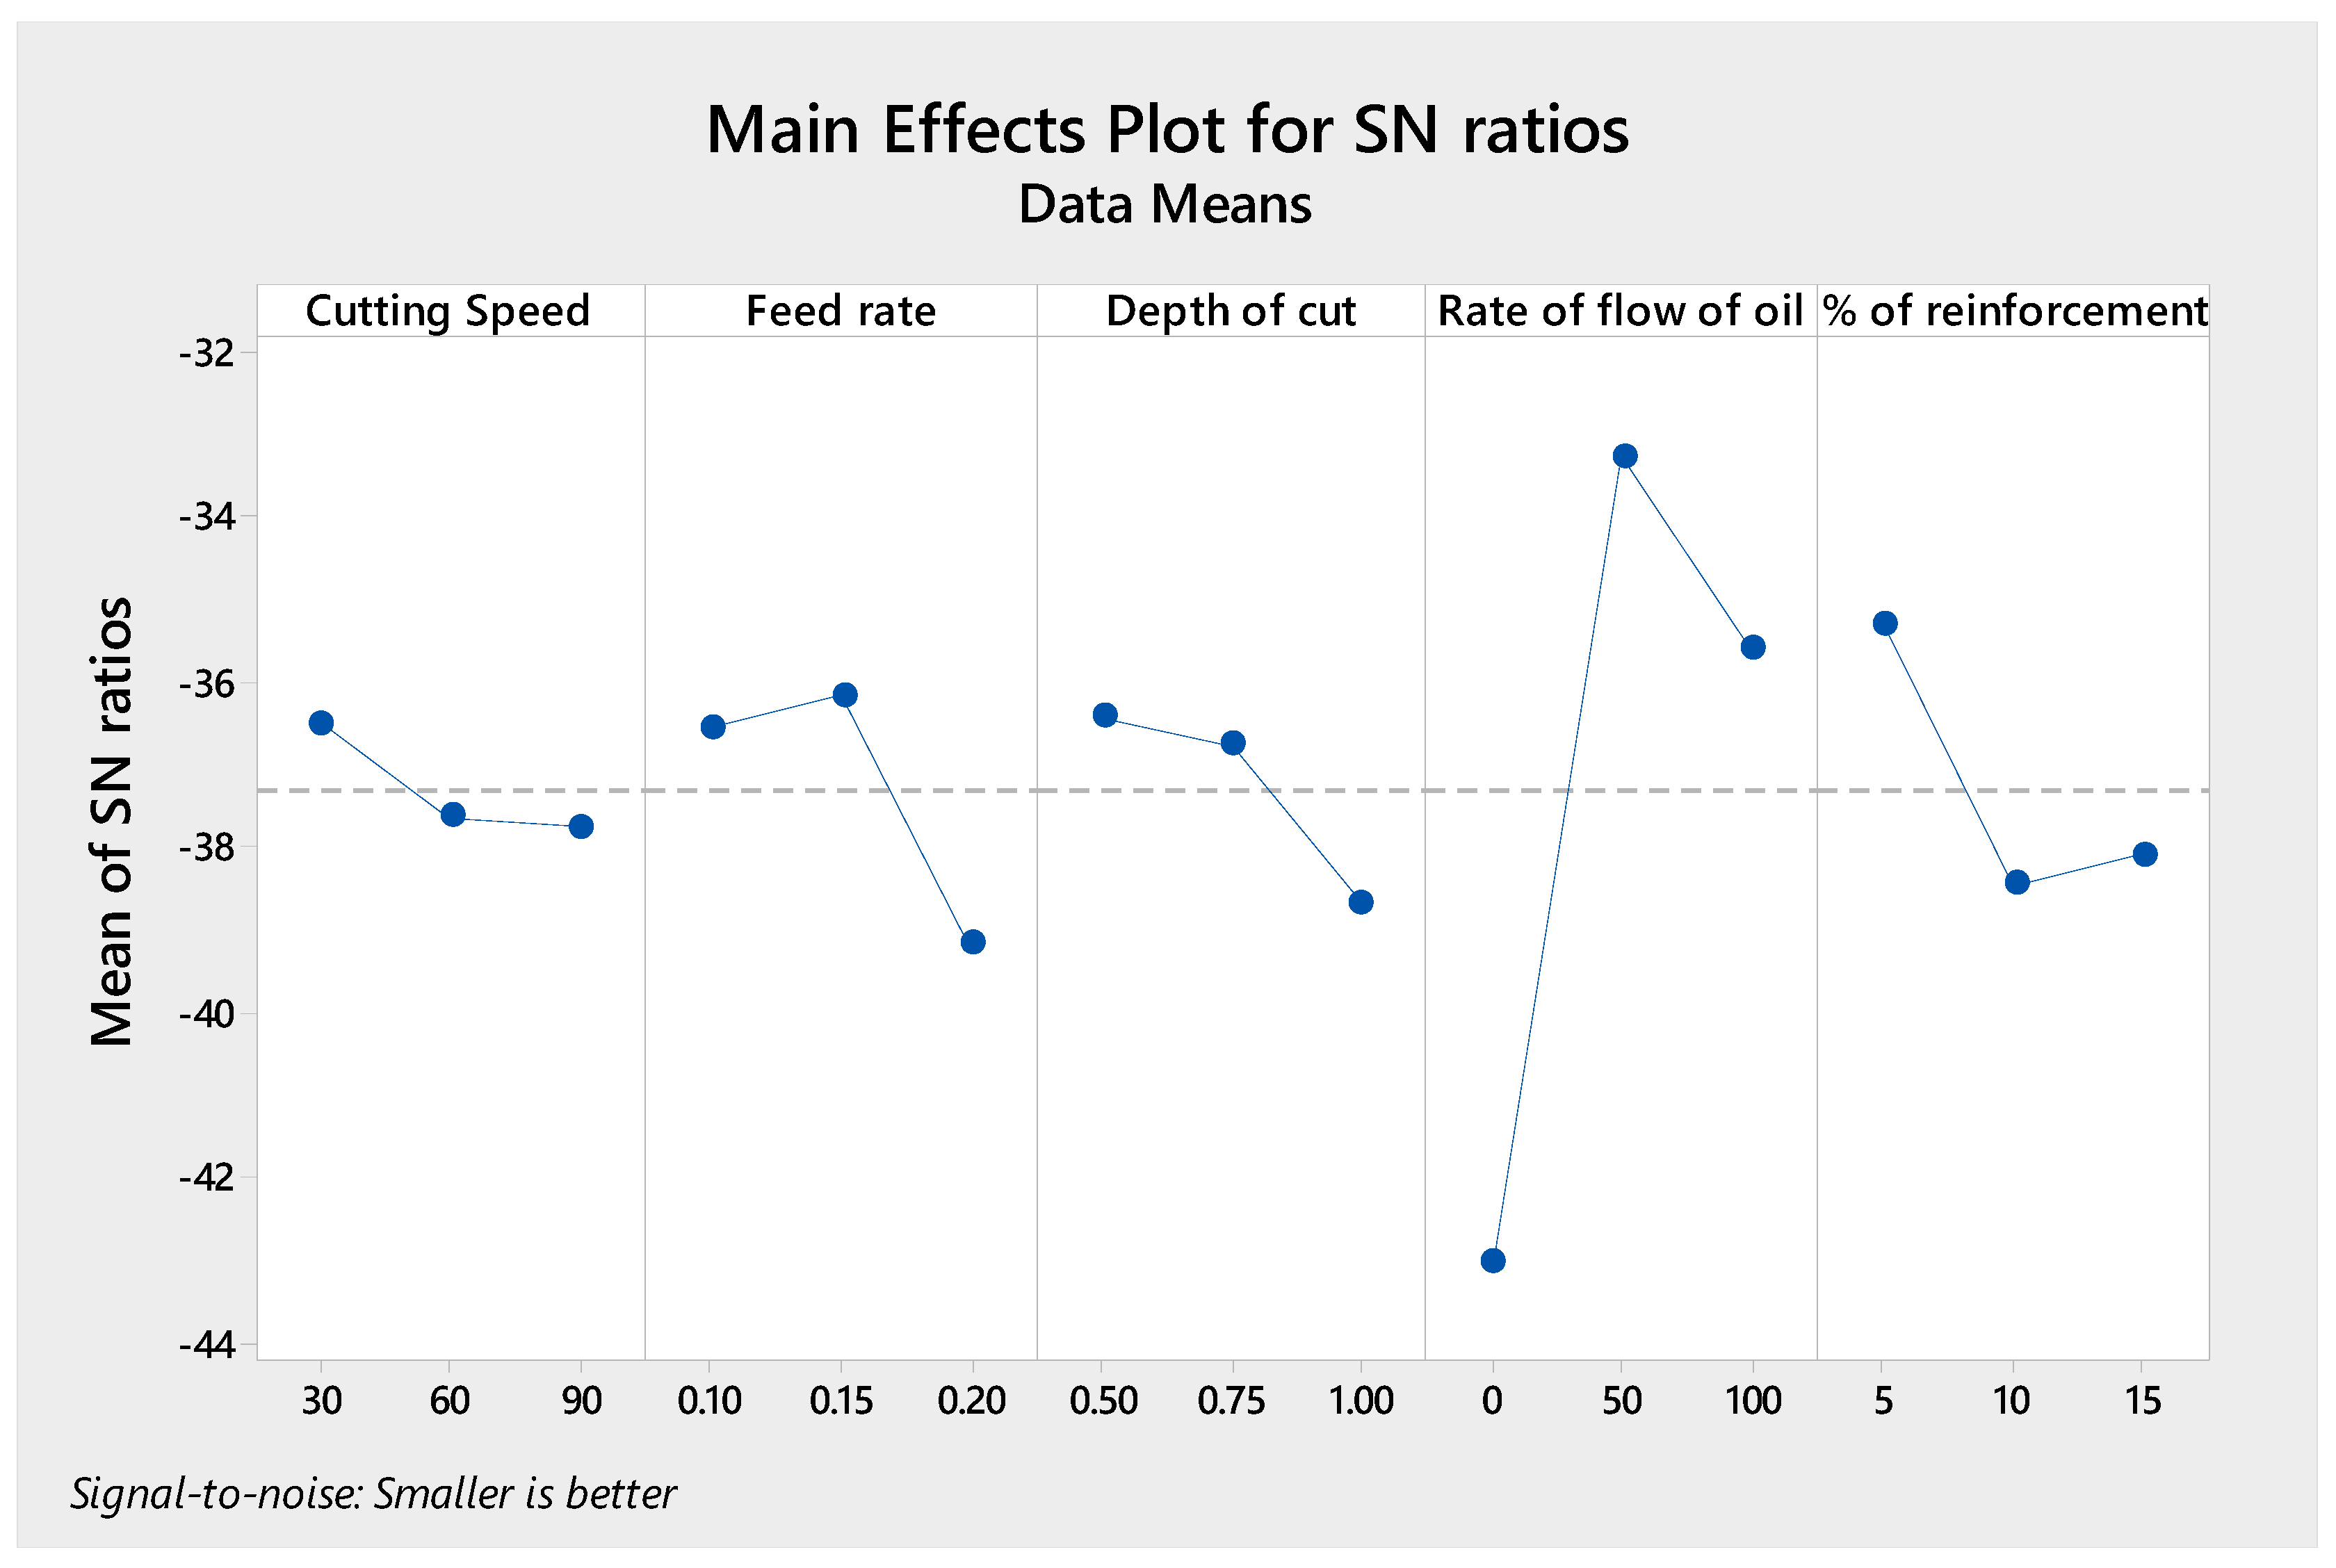
6.4. S/N Ratio Plots for Tool Wear
The S/N ratio analysis was conducted by selecting the smaller the better characteristics for the response tool wear as we require low level tool wear values as a response. Figure 11 shows the S/N ratio plots of considered factors versus tool wear. From the graph, the sequence for smaller tool wear value was A1, B2, C1, D2, and E1. This was the same as per plot for means except in the level of feed rate. This shows the good agreement obtained between both methods and accuracy of experiments.
6.5. Most Influential Factor on Tool Wear
The influence of each factor on various responses was confirmed with the help of S/N ratio analysis. Rate of flow (D) had a huge impact on tool wear when compared to all other factors.
6.6. Chip Morphology
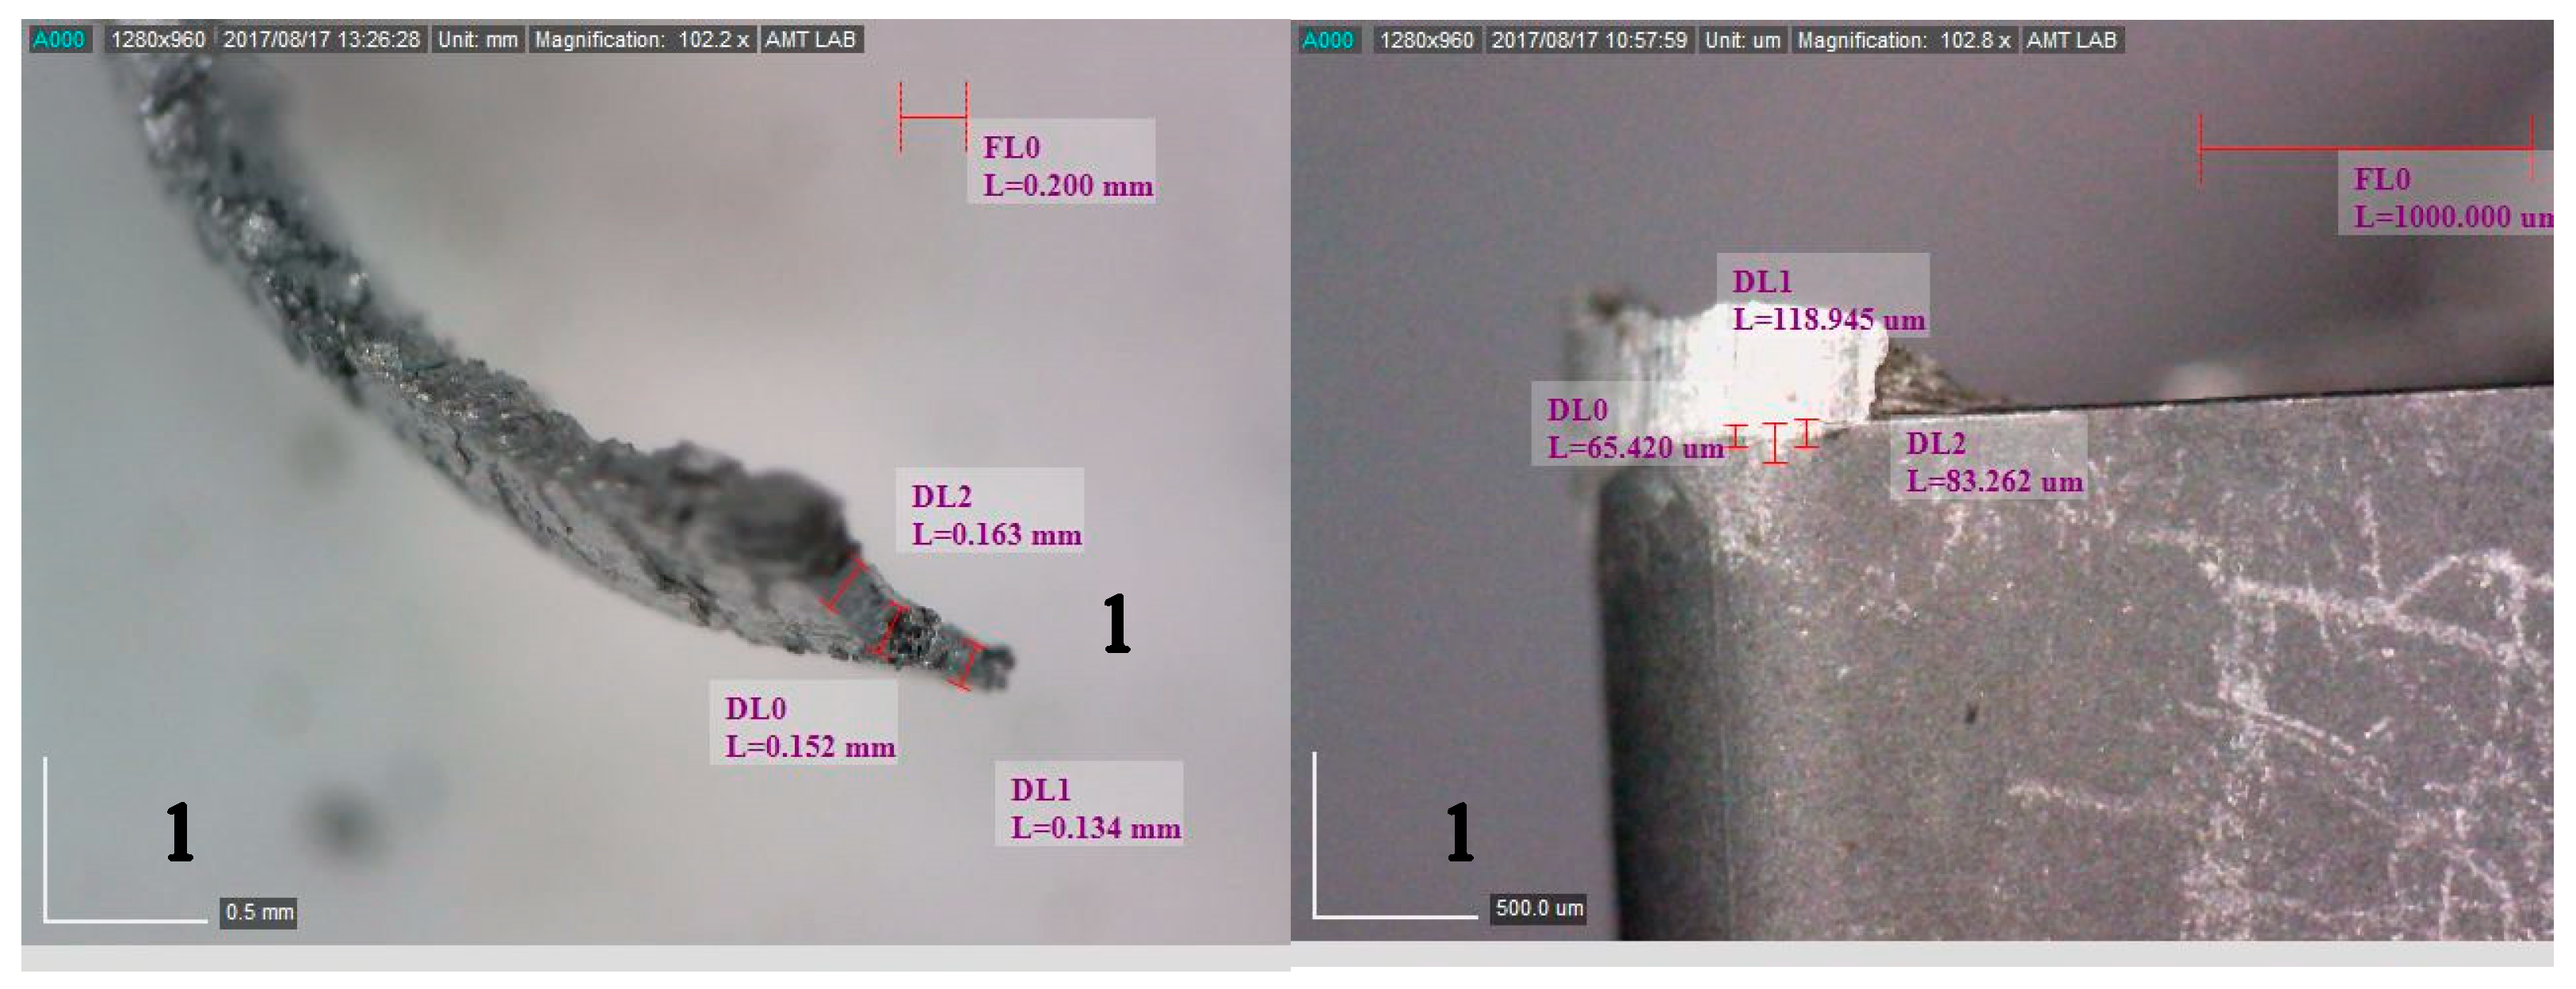
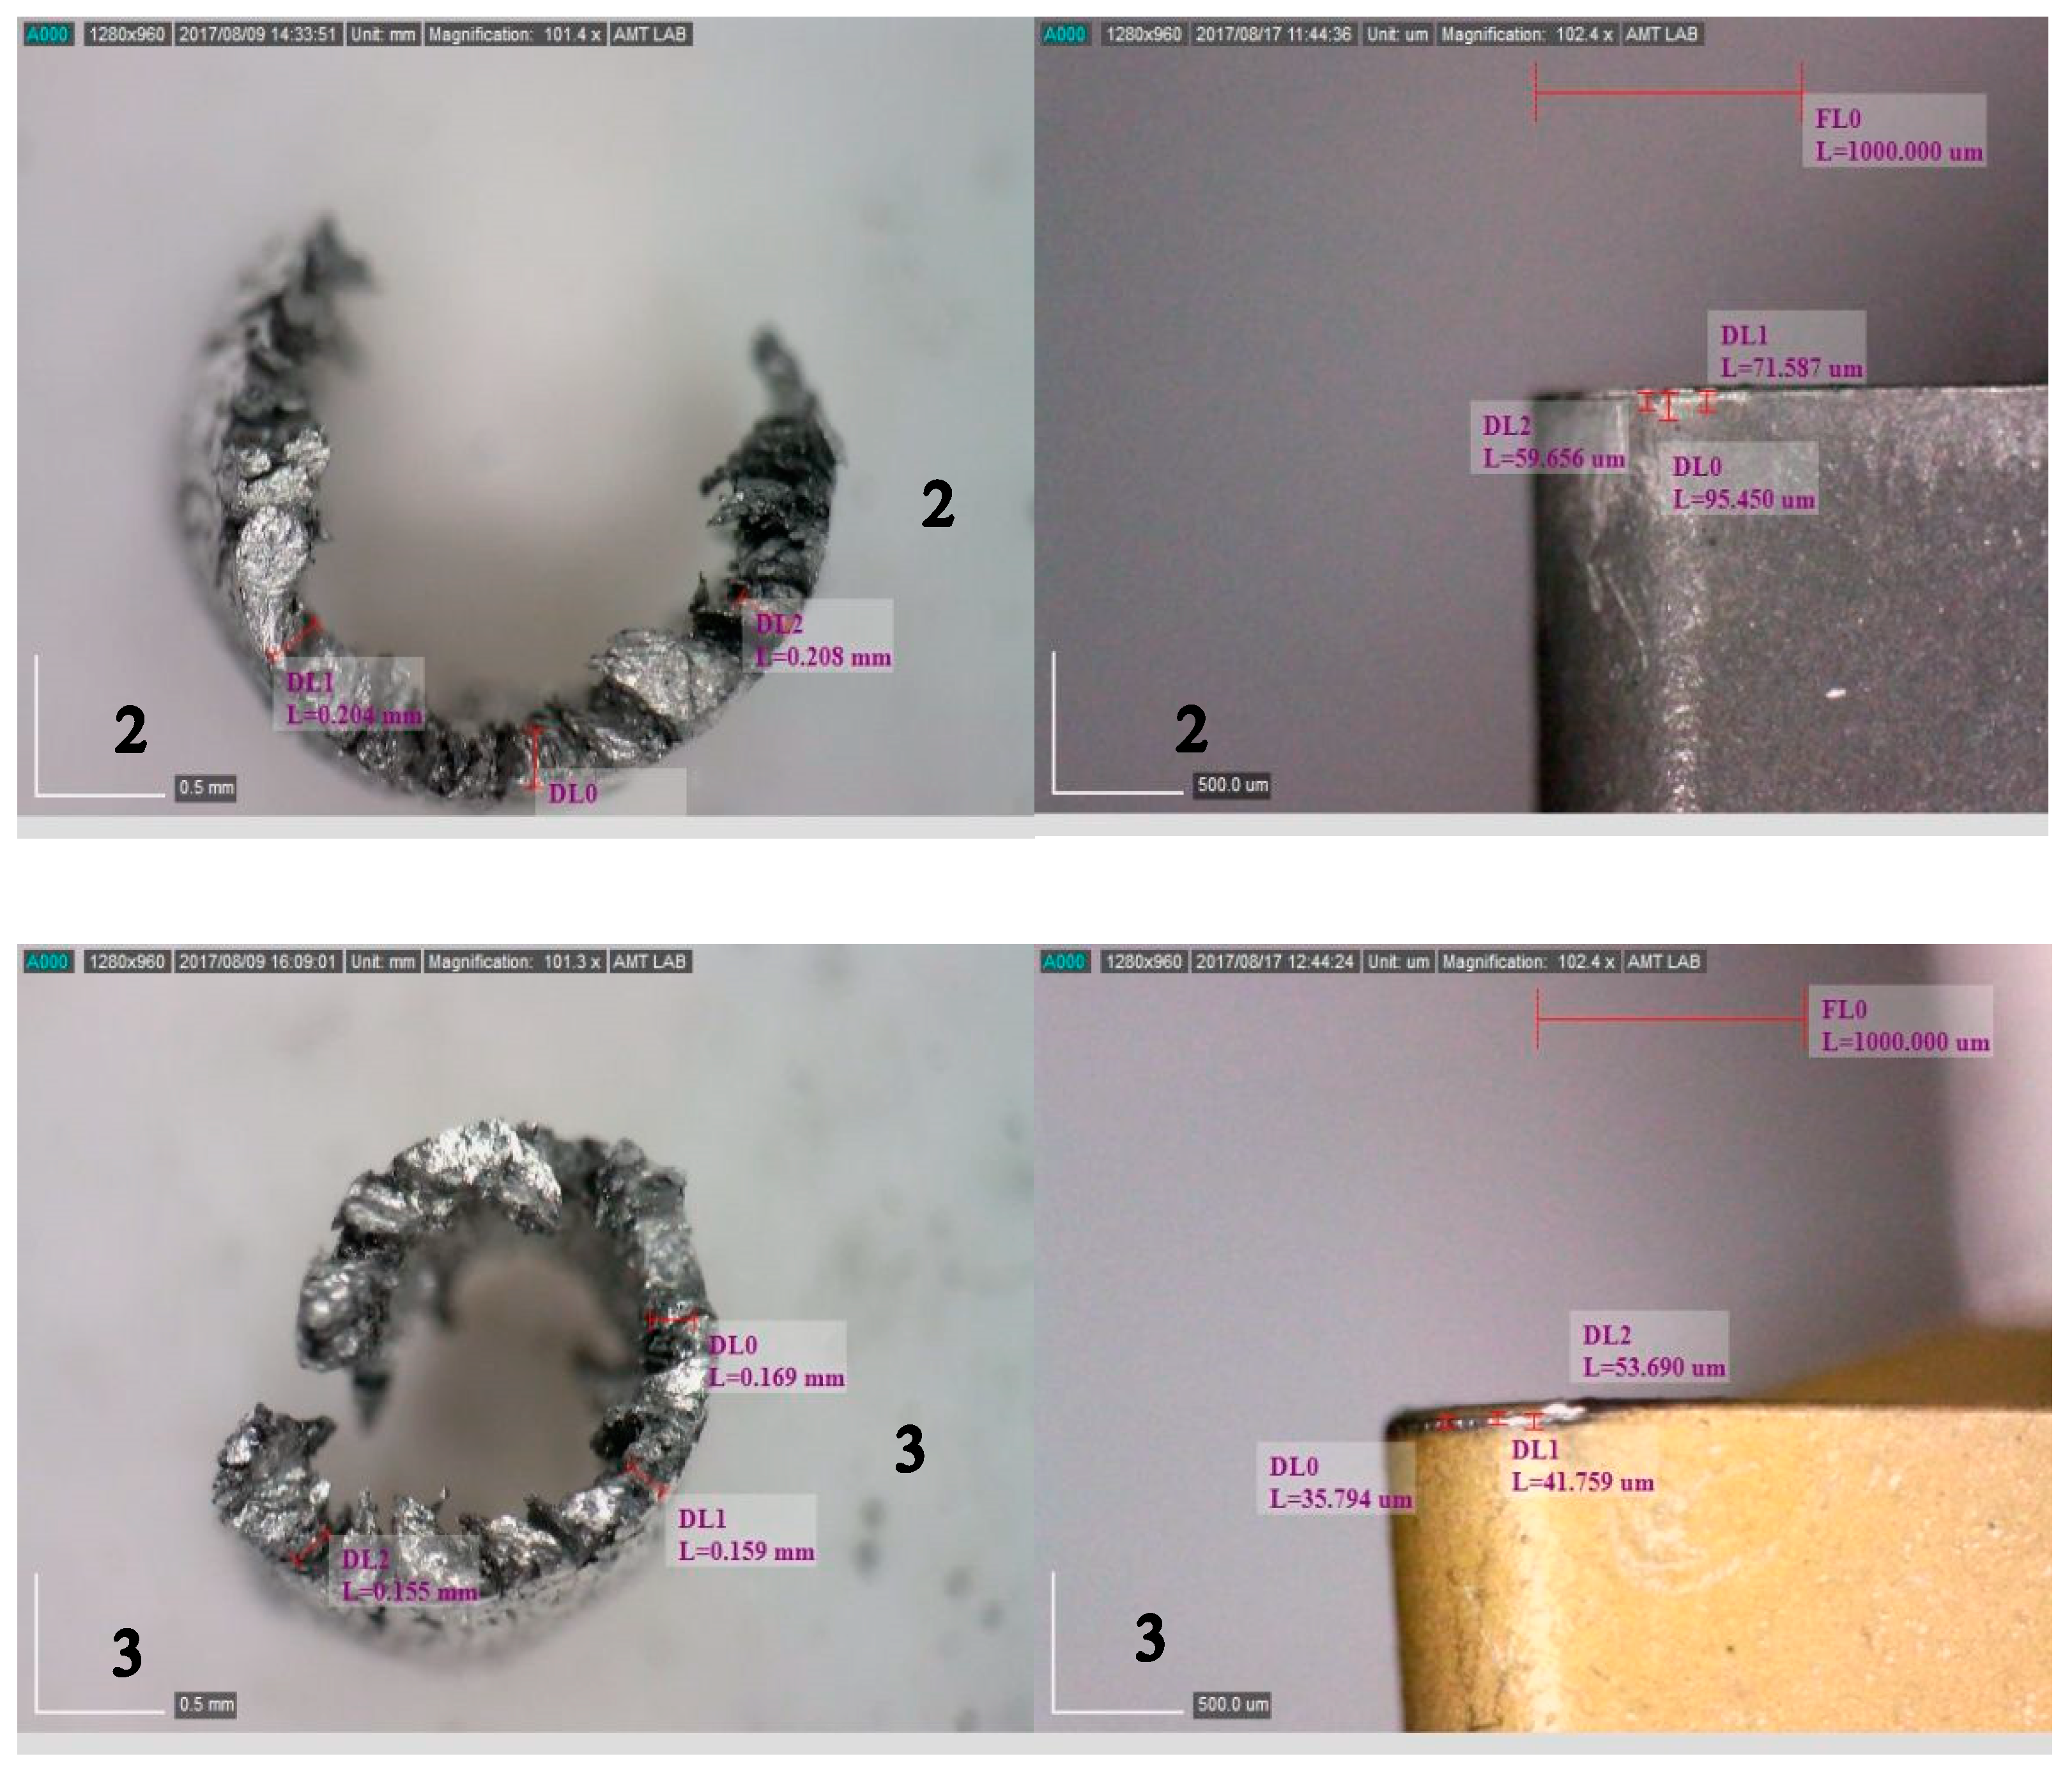
Types of chips and the effect of tool wear during machining are shown in Figure 12. The type of chip obtained during dry machining is continuous chip with the built-up edge. As it was dry machining, the ductile AA6061 alloy caused the formation of a built-up edge [23]. This built-up edge disturbs surface value. The chips formed during MQL machining, and the rate of flow was different, and discontinuous chips or segmental chips were formed. This reduced tool wear and helped to achieve low surface roughness values. Furthermore, Figure 12 shows width of chips obtained after machining. This proves the accuracy of experiments as this value was nearly equal to the feed rate.
6.7. Optimization of Machining Parameters
The machining parameters were optimized using S/N ratio analysis. Table 11 shows the sequence of factors and their optimal levels.
7. Conclusions
In this research work AA6061/ZrO2 composites were developed by varying wt % of reinforcements from 5–15% with the help of Stir casting integrated with squeeze casting technique. Microscopy, EDS, Hardness and machinability study was performed and the following conclusions were drawn.
- (1)
- The optical micrograph and SEM micrograph confirms the existence of ZrO2 particles in the metal matrix. Also EDX was performed to identify the list of elements present in the developed composite (i.e., zirconium, aluminium, and oxygen).
- (2)
- The highest hardness value was obtained for AA/ZrO2/10% at 200 gf load, and the value was 107 HV.
- (3)
- As per the analysis, the most influential factor which affected surface roughness was the rate of flow (D), and its contribution was 43.58% [24]. The most influential factor which affected cutting force was depth of cut (C), and its contribution was 50.45%. The most influential factor which affected tool wear was the rate of flow (D), and its contribution was 39.1%.
- (4)
- The optimized parameter or the most optimal sequence to obtain minimum surface roughness was cutting speed: 60 m/min, feed rate: 0.1 mm/rev, depth of cut: 0.75 mm, rate of flow of oil: 100 mL/h, and % reinforcement of ZrO2: 15. The most optimal sequence to obtain minimum cutting force was cutting speed: 30 m/min, feed rate: 0.1 mm/rev, depth of cut: 0.5 mm, rate of flow of oil: 50 mL/h, and % reinforcement of ZrO2: 10. The most optimal sequence to obtain minimum tool wear was cutting speed: 30 m/min, feed rate: 0.15 mm/rev, depth of cut: 0.5 mm, rate of flow of oil: 50 mL/h, and % reinforcement of ZrO2: 5.
- (5)
- Chip morphology indicated controlled surface roughness value and tool wear in the MQL environment. This work offers an outline for the manufacturing industry about the optimal machining parameters in line with a cleaner production concept (MQL).
Author Contributions
S.J.J. conceived, designed and performed the experiments. A.R.A. conceived and analyzed the Results; A.R.A. and S.J.J. wrote the paper.
Funding
This research received no external funding
Acknowledgments
The authors thank P. Kuppan, Professor, SMEC, VIT, Vellore for his functional scientific inputs to perform this research. Also we thank Hema kumar, Research scholar, VIT, Vellore for his support in performing experiments in CNC lathe.
Conflicts of Interest
The authors declare no conflict of interest.
References
- Kumar, S.S.; Uthayakumar, M.; Kumaran, S.T.; Parameswaran, P. Electrical discharge machining of AL (6351)-SiC-B4C hybrid composite. Mater. Manuf. Process. 2014, 29, 1395–1400. [Google Scholar] [CrossRef]
- Sales, W.F.; Diniz, A.E.; Machado, Á.R. Application of cutting fluids in machining processes. J. Braz. Soc. Mech. Sci. 2001, 23, 227–240. [Google Scholar] [CrossRef]
- Daou, E.E. The zirconia ceramic: Strengths and weaknesses. Open Dent. J. 2014, 8, 33. [Google Scholar] [CrossRef] [PubMed]
- Raei, M.; Panjepour, M.; Meratian, M. Effect of stirring speed and time on microstructure and mechanical properties of Cast Al-Ti-Zr-B4C composite produced by stir casting. Rus. J. Non-Ferrous Metals 2016, 57, 347–360. [Google Scholar] [CrossRef]
- Kumar, R.; Chauhan, S. Study on surface roughness measurement for turning of Al 7075/10/SiCp and Al 7075 hybrid composites by using response surface methodology (RSM) and artificial neural networking (ANN). Measurement 2015, 65, 166–180. [Google Scholar] [CrossRef]
- Camposeco-Negrete, C. Optimization of cutting parameters using Response Surface Method for minimizing energy consumption and maximizing cutting quality in turning of AISI 6061 T6 aluminum. J. Clean. Prod. 2015, 91, 109–117. [Google Scholar] [CrossRef]
- Puvanesan, M.; Rahman, M.M.; Najiha, M.S.; Kadirgama, K. Experimental investigation of minimum quantity lubrication on tool wear in aluminum alloy 6061-t6 using different cutting tools. Int. J. Automot. Mech. Eng. 2014, 9, 1538–1549. [Google Scholar] [CrossRef]
- Behera, B.C.; Chetan, S.G.; Rao, P.V. Effects on Forces and Surface Roughness During Machining Inconel 718 Alloy Using Minimum Quantity Lubrication. In Proceedings of the 5th International & 26th All India Manufacturing Technology, Designand Research Conference (AIMTDR 2014), Assam, India, 12–14 December 2014. [Google Scholar]
- Sarıkaya, M.; Güllü, A. Taguchi design and response surface methodology based analysis of machining parameters in CNC turning under MQL. J. Clean. Prod. 2014, 65, 604–616. [Google Scholar] [CrossRef]
- Sarıkaya, M.; Güllü, A. Multi-response optimization of minimum quantity lubrication parameters using Taguchi-based grey relational analysis in turning of difficult-to-cut alloy Haynes 25. J. Clean. Prod. 2015, 91, 347–357. [Google Scholar] [CrossRef]
- Shokrani, A.; Dhokia, V.; Newman, S.T. Environmentally conscious machining of difficult-to-machine materials with regard to cutting fluids. Int. J. Mach. Tools Manuf. 2012, 57, 83–101. [Google Scholar] [CrossRef] [Green Version]
- Amirkhanlou, S.; Jamaati, R.; Niroumand, B.; Toroghinejad, M.R. Manufacturing of high-performance Al356/SiCp composite by CAR process. Mater. Manuf. Process. 2011, 26, 902–907. [Google Scholar] [CrossRef]
- Karthikeyan, R.; Ganesan, G.; Nagarazan, R.S.; Pai, B.C. A critical study on machining of Al/SiC composites. Mater. Manuf. Process. 2001, 16, 47–60. [Google Scholar] [CrossRef]
- Palanikumar, K.; Karunamoorthy, L.; Karthikeyan, R. Multiple performance optimization of machining parameters on the machining of GFRP composites using carbide (K10) tool. Mater. Manuf. Process. 2006, 21, 846–852. [Google Scholar] [CrossRef]
- Suresh, R.; Basavarajappa, S.; Gaitonde, V.N.; Samuel, G.L. Machinability investigations on hardened AISI 4340 steel using coated carbide insert. Int. J. Refract. Met. Hard Mater. 2012, 33, 75–86. [Google Scholar] [CrossRef]
- El-Gallab, M.; Sklad, M. Machining of Al/SiC particulate metal-matrix composites: Part I: Tool performance. J. Mater. Process. Technol. 1998, 83, 151–158. [Google Scholar] [CrossRef]
- Joardar, H.; Das, N.S.; Sutradhar, G.; Singh, S. Application of response surface methodology for determining cutting force model in turning of LM6/SiC P metal matrix composite. Measurement 2014, 47, 452–464. [Google Scholar] [CrossRef]
- Khidhir, B.A.; Mohamed, B. Study of cutting speed on surface roughness and chip formation when machining nickel-based alloy. J. Mech. Sci. Technol. 2010, 24, 1053–1059. [Google Scholar] [CrossRef]
- Çakır, A.; Yağmur, S.; Kavak, N.; Küçüktürk, G.; Şeker, U. The effect of minimum quantity lubrication under different parameters in the turning of AA7075 and AA2024 aluminium alloys. Int. J. Adv. Manuf. Technol. 2016, 84, 2515–2521. [Google Scholar] [CrossRef]
- Gupta, M.; Kumar, S. Investigation of surface roughness and MRR for turning of UD-GFRP using PCA and Taguchi method. Eng. Sci. Technol. Int. J. 2015, 18, 70–81. [Google Scholar] [CrossRef]
- Bains, P.S.; Sidhu, S.S.; Payal, H.S. Fabrication and machining of metal matrix composites: A review. Mater. Manuf. Process. 2016, 31, 553–573. [Google Scholar] [CrossRef]
- Kannan, C.; Ramanujam, R.; Balan, A.S.S. Machinability studies on Al 7075/BN/Al2O3 squeeze cast hybrid nanocomposite under different machining environments. Mater. Manuf. Process. 2018, 33, 587–595. [Google Scholar] [CrossRef]
- Su, G.; Liu, Z. Wear characteristics of nanoTiAlN-coated carbide tools in ultra-high speed machining of AerMet100. Wear 2012, 289, 124–131. [Google Scholar] [CrossRef]
- Koklu, U.; Basmaci, G. Evaluation of tool path strategy and cooling condition effects on the cutting force and surface quality in micromilling operations. Metals 2017, 7, 426. [Google Scholar] [CrossRef]
Figure 1.
(a) Optical image AA6061/ZrO2-5% composite, (b) scanning electron microscope (SEM) image of AA6061/ZrO2-15% composite, (c) SEM image of AA6061/ZrO2-10% composite.
Figure 1.
(a) Optical image AA6061/ZrO2-5% composite, (b) scanning electron microscope (SEM) image of AA6061/ZrO2-15% composite, (c) SEM image of AA6061/ZrO2-10% composite.


Figure 2.
Elements of AA6061/ZrO2.

Figure 3.
Rate of flow vs. surface roughness.

Figure 4.
Mean effects plot for surface roughness.

Figure 5.
Built up edge (Experiment no-3).

Figure 6.
No built-up edge (Experiment no-11).

Figure 7.
Signal to noise (S/N) ratio plot for surface roughness.

Figure 8.
Main effect plot for cutting force.

Figure 9.
S/N ratio plots for cutting force.

Figure 10.
Main effect plots for tool wear.

Figure 11.
S/N ratio plots for tool wear.

Figure 12.
Images of chips and tool wear for dry and MQL machining parameters: A-60, B-0.15, C-1, D-0, E-15% (1), A-30, B-0.2, C-1, D-100, E-15% (2), A-60, B-0.15, C-1, D-0, E-15% (3).
Figure 12.
Images of chips and tool wear for dry and MQL machining parameters: A-60, B-0.15, C-1, D-0, E-15% (1), A-30, B-0.2, C-1, D-100, E-15% (2), A-60, B-0.15, C-1, D-0, E-15% (3).


Table 1.
Control factors and their levels.
| Control Factors | Unit | Level 1 | Level 2 | Level 3 |
|---|---|---|---|---|
| Cutting speed (A) | m/min | 30 | 60 | 90 |
| Feed rate (B) | mm/rev | 0.1 | 0.15 | 0.2 |
| Depth of cut (C) | mm | 0.5 | 0.75 | 1 |
| Rate of flow of oil (D) | mL/h | 0 | 50 | 100 |
| % Reinforcement of ZrO2 (E) | % | 5 | 10 | 15 |
Table 2.
Weight of elements of AA6061/ZrO2.
| Element | Weight % | Atomic % |
|---|---|---|
| O K | 29.26 | 52.7 |
| Mg K | 1.18 | 1.4 |
| Al K | 6.29 | 6.7 |
| Si K | 10.07 | 10.3 |
| Ca K | 2.20 | 1.5 |
| Ti K | 0.18 | 0.1 |
| Cr L | 22.70 | 12.6 |
| Fe L | 27.08 | 13.9 |
| Cu L | 0.67 | 0.3 |
| Zn L | 0.25 | 0.1 |
| Zr L | 0.11 | 0.03 |
| Totals | 100.00 |
Table 3.
Average hardness value of AA6061 and developed AA6061/ZrO2 composite.
| Name of Sample | Load (gf) | Average Hardness Value (HV) | % of Improvement |
|---|---|---|---|
| AA 6061 | 200 | 94.9 | - |
| AA-ZrO2-5% | 200 | 104.5 | 10.5 |
| AA-ZrO2-10% | 200 | 107.0 | 13.6 |
| AA-ZrO2-15% | 200 | 101.2 | 6.7 |
Table 4.
Combinations of machining parameters and observed response values.
| Trial | Cutting Speed (m/min) | Feed Rate (mm/rev) | Depth of Cut (mm) | Rate of Flow of Oil (mL/h) | % of Reinforcement ZrO2 | Surface Roughness (Ra, µm) | Cutting Force Fz (N) | Tool Wear in (μm) |
|---|---|---|---|---|---|---|---|---|
| 1 | 60 | 0.15 | 1 | 0 | 5 | 2.72 | 166.3 | 91.1 |
| 2 | 60 | 0.15 | 1 | 0 | 10 | 2.2 | 165.8 | 434.6 |
| 3 | 60 | 0.15 | 1 | 0 | 15 | 2.2 | 155.3 | 89.2 |
| 4 | 90 | 0.2 | 0.75 | 0 | 5 | 4.0 | 162.9 | 69.4 |
| 5 | 90 | 0.2 | 0.75 | 0 | 10 | 3.6 | 164.5 | 317.6 |
| 6 | 90 | 0.2 | 0.75 | 0 | 15 | 2.8 | 156.7 | 242.3 |
| 7 | 30 | 0.1 | 0.5 | 0 | 5 | 3.2 | 48 | 81.3 |
| 8 | 30 | 0.1 | 0.5 | 0 | 10 | 4 | 37.2 | 57.6 |
| 9 | 30 | 0.1 | 0.5 | 0 | 15 | 2.3 | 43.1 | 266.4 |
| 10 | 30 | 0.2 | 1 | 100 | 5 | 2.3 | 171.5 | 57.6 |
| 11 | 30 | 0.2 | 1 | 100 | 10 | 2.1 | 154.8 | 117.2 |
| 12 | 30 | 0.2 | 1 | 100 | 15 | 1.8 | 164 | 75.5 |
| 13 | 60 | 0.1 | 0.75 | 100 | 5 | 0.8 | 68.6 | 61.6 |
| 14 | 60 | 0.1 | 0.75 | 100 | 10 | 0.6 | 65.3 | 49.7 |
| 15 | 60 | 0.1 | 0.75 | 100 | 15 | 0.5 | 65.9 | 51.7 |
| 16 | 90 | 0.15 | 0.5 | 100 | 5 | 1.5 | 57.5 | 63.6 |
| 17 | 90 | 0.15 | 0.5 | 100 | 10 | 1.4 | 57.7 | 33.8 |
| 18 | 90 | 0.15 | 0.5 | 100 | 15 | 1.3 | 63.2 | 59.6 |
| 19 | 90 | 0.1 | 1 | 50 | 5 | 1.6 | 85.1 | 45.7 |
| 20 | 30 | 0.15 | 0.75 | 50 | 5 | 3.0 | 90.2 | 21.8 |
| 21 | 60 | 0.2 | 0.5 | 50 | 5 | 3.6 | 75.5 | 67.6 |
| 22 | 90 | 0.1 | 1 | 50 | 10 | 2.0 | 96.3 | 53.8 |
| 23 | 30 | 0.15 | 0.75 | 50 | 10 | 3.0 | 79.7 | 43.7 |
| 24 | 60 | 0.2 | 0.5 | 50 | 10 | 3.8 | 71.6 | 55.6 |
| 25 | 90 | 0.1 | 1 | 50 | 15 | 0.9 | 85.4 | 57.7 |
| 26 | 30 | 0.15 | 0.75 | 50 | 15 | 1.7 | 88.6 | 43.7 |
| 27 | 60 | 0.2 | 0.5 | 50 | 15 | 2.9 | 77.1 | 41.7 |
Table 5.
ANOVA for surface roughness.
| Source | DF | SS | MS | F | P | POC (%) | |
|---|---|---|---|---|---|---|---|
| A | 2 | 1.27 | 0.63 | 5.57 | 0.01 | 4.5 | Significant |
| B | 2 | 7.41 | 3.70 | 32.3 | 0 | 26.5 | Significant |
| C | 2 | 2.27 | 1.13 | 9.94 | 0.003 | 8.16 | Significant |
| D | 2 | 12.15 | 6.07 | 53.07 | 0 | 43.5 | Significant |
| E | 2 | 3.018 | 1.50 | 13.1 | 0.001 | 10.8 | Significant |
| A*E | 4 | 0.44 | 0.11 | 0.96 | 0.46 | - | |
| Residual Error | 12 | 1.374 | 0.11 | ||||
| Total | 26 | 27.96 |
DF—Degrees of freedom, SS—Sum of squares, MS—Mean squares, F—F Ratio, P—P Value, POC—Percentage of contribution.
Table 6.
Signal-to-noise ratio analysis for Surface Roughness.
| Source | DF | SS | MS | F | P | POC (%) | |
|---|---|---|---|---|---|---|---|
| A | 2 | 50.03 | 25.01 | 14.08 | 0.001 | 8.33 | Significant |
| B | 2 | 174.54 | 87.27 | 49.12 | 0 | 29.06 | Significant |
| C | 2 | 41.99 | 20.99 | 11.82 | 0.001 | 6.99 | Significant |
| D | 2 | 257.65 | 128.8 | 72.5 | 0 | 42.90 | Significant |
| E | 2 | 51.2 | 25.6 | 14.4 | 0.001 | 8.52 | Significant |
| A*E | 4 | 3.79 | 0.94 | 0.53 | 0.71 | ||
| Residual Error | 12 | 21.32 | 1.77 | ||||
| Total | 26 | 600.5 |
Table 7.
ANOVA for cutting force.
| Source | DF | SS | MS | F | P | POC (%) | |
|---|---|---|---|---|---|---|---|
| A | 2 | 156.7 | 78.3 | 4.98 | 0.02 | 0.27 | Significant |
| B | 2 | 20,292.2 | 10,146.1 | 644.7 | 0 | 35.9 | Significant |
| C | 2 | 28,503 | 14,251.5 | 905.5 | 0 | 50.4 | Significant |
| D | 2 | 7038.2 | 3519.1 | 223.6 | 0 | 12.4 | Significant |
| E | 2 | 67.1 | 33.5 | 2.13 | 0.16 | 0.11 | |
| A*E | 4 | 241.5 | 60.4 | 3.84 | 0.03 | 0.42 | Significant |
| Residual Error | 12 | 188.8 | 15.7 | ||||
| Total | 26 | 56,487.5 |
Table 8.
S/N ratio analysis for cutting force obtained.
| Source | DF | SS | MS | F | P | POC (%) | |
|---|---|---|---|---|---|---|---|
| A | 2 | 5.4 | 2.7 | 16.6 | 0 | 1.26 | Significant |
| B | 2 | 160.9 | 80.4 | 486.8 | 0 | 36.88 | Significant |
| C | 2 | 245.4 | 122.7 | 742.6 | 0 | 56.26 | Significant |
| D | 2 | 19.0 | 9.5 | 57.7 | 0 | 4.37 | Significant |
| E | 2 | 0.85 | 0.42 | 2.58 | 0.11 | 0.1 | |
| A*E | 4 | 2.52 | 0.63 | 3.81 | 0.03 | 0.5 | Significant |
| Residual Error | 12 | 1.98 | 0.16 | ||||
| Total | 26 | 436.2 |
Table 9.
ANOVA analysis of tool wear.
| Source | DF | SS | MS | F | P | POC (%) | |
|---|---|---|---|---|---|---|---|
| A | 2 | 2353 | 1177 | 0.15 | 0.86 | 0.93 | |
| B | 2 | 5656 | 2828 | 0.35 | 0.71 | 2.23 | |
| C | 2 | 4893 | 2447 | 0.3 | 0.74 | 1.93 | |
| D | 2 | 98,829 | 49,415 | 6.15 | 0.01 | 39.1 | Significant |
| E | 2 | 20,576 | 10,288 | 1.28 | 0.31 | 8.14 | |
| A*E | 4 | 23,779 | 5945 | 0.74 | 0.58 | 9.41 | |
| Residual Error | 12 | 96,462 | 8039 | ||||
| Total | 26 | 252,548 |
Table 10.
S/N ratio analysis for tool wear.
| Source | DF | SS | MS | F | P | POC (%) | |
|---|---|---|---|---|---|---|---|
| A | 2 | 8.69 | 4.34 | 0.2 | 0.82 | 0.91 | |
| B | 2 | 48.32 | 24.16 | 1.09 | 0.36 | 5.08 | |
| C | 2 | 26.34 | 13.17 | 0.59 | 0.56 | 2.7 | |
| D | 2 | 470.29 | 235.15 | 10.5 | 0.002 | 49.5 | Significant |
| E | 2 | 53.42 | 26.71 | 1.2 | 0.33 | 5.62 | |
| A*E | 4 | 75.10 | 18.77 | 0.84 | 0.52 | 7.9 | |
| Residual Error | 12 | 267.2 | 22.2 | ||||
| Total | 26 | 949.4 |
Table 11.
Optimal setting of machining parameters.
| Method of Optimization | Characteristics | Optimal Conditions |
|---|---|---|
| S/N ratio analysis | Surface roughness | A2, B1, C2, D3, and E3 |
| S/N ratio analysis | Cutting force | A1, B1, C1, D2, and E2 |
| S/N ratio analysis | Tool wear | A1, B2, C1, D2, and E1 |
© 2018 by the authors. Licensee MDPI, Basel, Switzerland. This article is an open access article distributed under the terms and conditions of the Creative Commons Attribution (CC BY) license (http://creativecommons.org/licenses/by/4.0/).
Share and Cite
MDPI and ACS Style
James, S.J.; Annamalai, A.R. Machinability Study of Developed Composite AA6061-ZrO2 and Analysis of Influence of MQL. Metals 2018, 8, 472. https://doi.org/10.3390/met8070472
AMA Style
James SJ, Annamalai AR. Machinability Study of Developed Composite AA6061-ZrO2 and Analysis of Influence of MQL. Metals. 2018; 8(7):472. https://doi.org/10.3390/met8070472
Chicago/Turabian StyleJames, S. Johny, and A. Raja Annamalai. 2018. "Machinability Study of Developed Composite AA6061-ZrO2 and Analysis of Influence of MQL" Metals 8, no. 7: 472. https://doi.org/10.3390/met8070472
Note that from the first issue of 2016, this journal uses article numbers instead of page numbers. See further details here.