1. Introduction
Austenitic stainless steel is used in a variety of industrial applications due to excellent corrosion resistance and mechanical properties, as well as especially low-temperature toughness. However, it has poor wear resistance and hardness when employed in applications requiring high mechanical properties. Meanwhile, surface hardening technologies such as nitriding, carburizing, and nitrocarburizing have been extensively studied [
1]. However, austenitic stainless steel has a limitation in that it requires a low temperature in the surface hardening treatment as a high temperature would reduce its corrosion resistance. Therefore, low-temperature carburization was proposed and commercialized to enhance surface mechanical properties such as hardness and wear resistance, while maintaining the inherent corrosion resistance of austenitic stainless steel [
2,
3,
4,
5,
6,
7]. In this process, carbon atoms penetrate into the austenite matrix to form a supersaturated solid solution [
8].
The natural oxide film on the austenitic stainless steel prevents the penetration of carbon atoms into the austenite matrix, and the solubility of carbon is considerably decreased [
9,
10]. Thus, an additional process is required to remove and/or convert the natural oxide layer on the surface in order to improve the mechanical properties of austenitic stainless steel in low-temperature carburization. Surface activation has been researched to improve the efficiency of carbon atoms penetration into austenitic stainless steel since the 1960s. The traditional surface activation methods can be classified as follows: (a) removal of the oxide layer with a chloride resin [
11], a metal halide salt bath [
12], and halogen gases [
13], (b) easy penetration of carbon atoms using thin iron films [
14], and (c) breakage of the oxide layer by high-energy ion bombardment such as plasma sputtering [
15]. Compared with the traditional methods, the recently developed method that involves exposure of the steel to a halogen gas atmosphere containing gases such as HCl, NF
3, and urea acid, has been commercially applied [
2,
7,
13].
However, growing environmental problems have necessitated the development of alternative ways that employ low toxicity methods. Recently, acetylene gas (C
2H
2) as a carbon source was employed to remove the natural oxide layer and improve the carburization efficiency in carburization [
16,
17,
18]. The mechanism of carburization in acetylene is as follows: first, adsorption and decomposition of C
2H
2 gas on the solid surface takes place at a certain temperature and, subsequently, the developed radicals generate carbon species [
19,
20] that are soluble in iron. Simultaneously, the natural oxide film is removed by the activation energy of the radical gas [
20].
Low-temperature carburization with C
2H
2 gas has been studied with regard to the influence of change of process temperature and time on the activity and diffusion rate [
17,
21,
22]. In carburization, C
2H
2 gas even in small amounts causes sufficient reaction for carburization in vacuum, and leads to a decrease in the oxygen partial pressure, so that the natural oxide layer is naturally decomposed [
17,
22]. Owing to the characteristics of acetylene in the low-temperature regime, carburization in vacuum was proposed to control soot and/or metal dust easily [
16]. Another study observed the change in carbon activity and the oxygen partial pressure according to the ratio of the process gas [
17].
Nevertheless, there is lack of studies on the effect of the C
2H
2 gas ratio to the total process gases in low-temperature vacuum carburization. Therefore, theoretical and experimental studies are required from this aspect, because the process gas ratio, which is an important experimental parameter that affects the carburization efficiency, leads to the production of radicals that cause strong reaction of the hydrocarbons, and determine the thermodynamic activity by degree of vacuum and gas ratio [
16,
20].
In this study, we focused on the carburization effects of the ratio of C
2H
2 and H
2 gases in a low-temperature vacuum carburizing process. After the treatment, the carburization thickness, carbon concentration, and hardness depth profiles were analyzed, following which the experimental data were compared with the calculated data based on a previously reported numerical study [
4]. On the premise of validity, the influences of gas ratio on the carbon solubility (para-equilibrium carbon concentration) and the critical ratio of C
2H
2 and H
2 mixture gases was confirmed by an increase in carburization time and the change of the gas ratio during the process.
3. Results
In this study, direct low-temperature vacuum carburization was conducted to investigate the effects of the C2H2 and H2 gases mixture ratios on the formation of the carburization layer, which is well known as expanded austenite layer. The ratios of C2H2 gas to the total gases and the process time were changed. The other conditions were constant at both working pressure 800 Pa and temperature 743 K in all carburization treatments as mentioned in the experimental method.
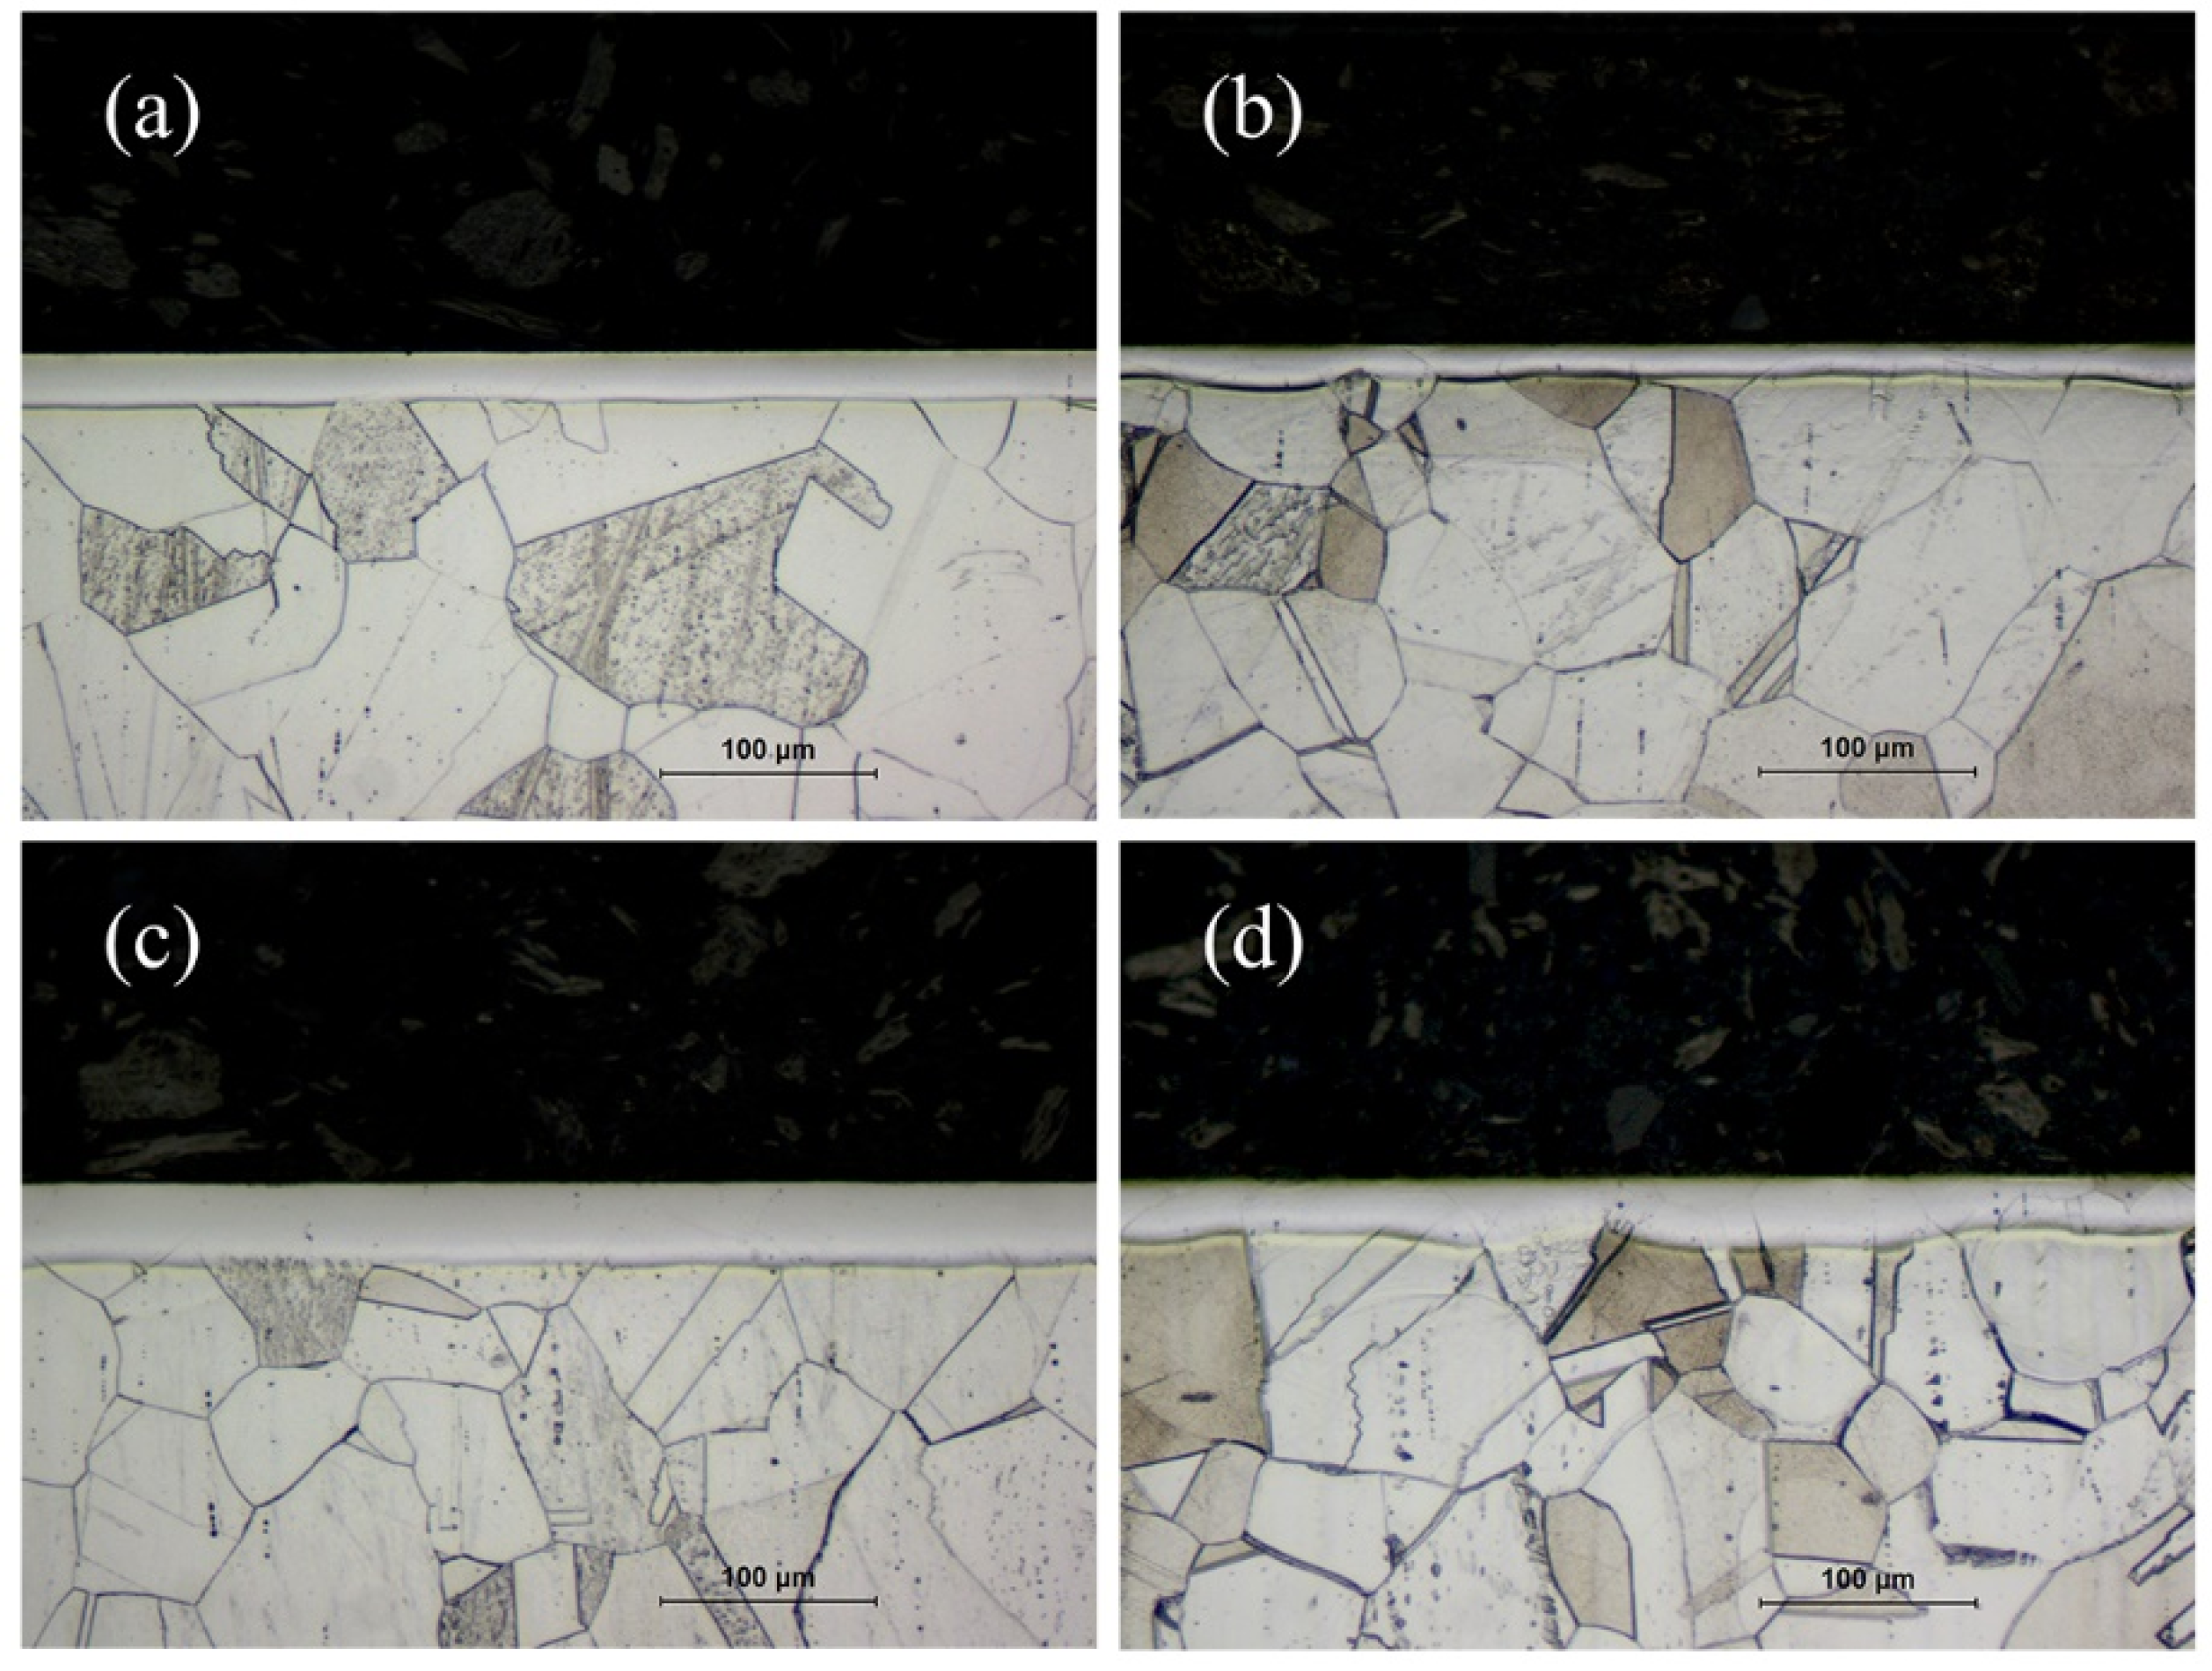
Figure 1 shows the cross-sectional OM images of ASS samples carburized at various gas mixture ratios of 0.05, 1, and 10. The expanded austenite layer clearly separated from the substrate can be observed in
Figure 1a,b, cross-sectional images of samples carburized at the conditions of A-1 and A-4, respectively. While an expanded austenite layer was uniformly formed at the conditions of A-1, it was not uniform at the conditions of A-4, in which a thickness deviation of 5 μm was observed. In
Figure 1c, for which the sample was carburized at the conditions of A-5, there is an expanded austenite layer with a uniform thickness of about 35 μm. On the other hand, the expanded austenite layer in the sample carburized at the conditions of A-6 showed a maximum thickness of about 30 μm and a wavy (non-uniformed) pattern with a thickness variation of 15 μm.
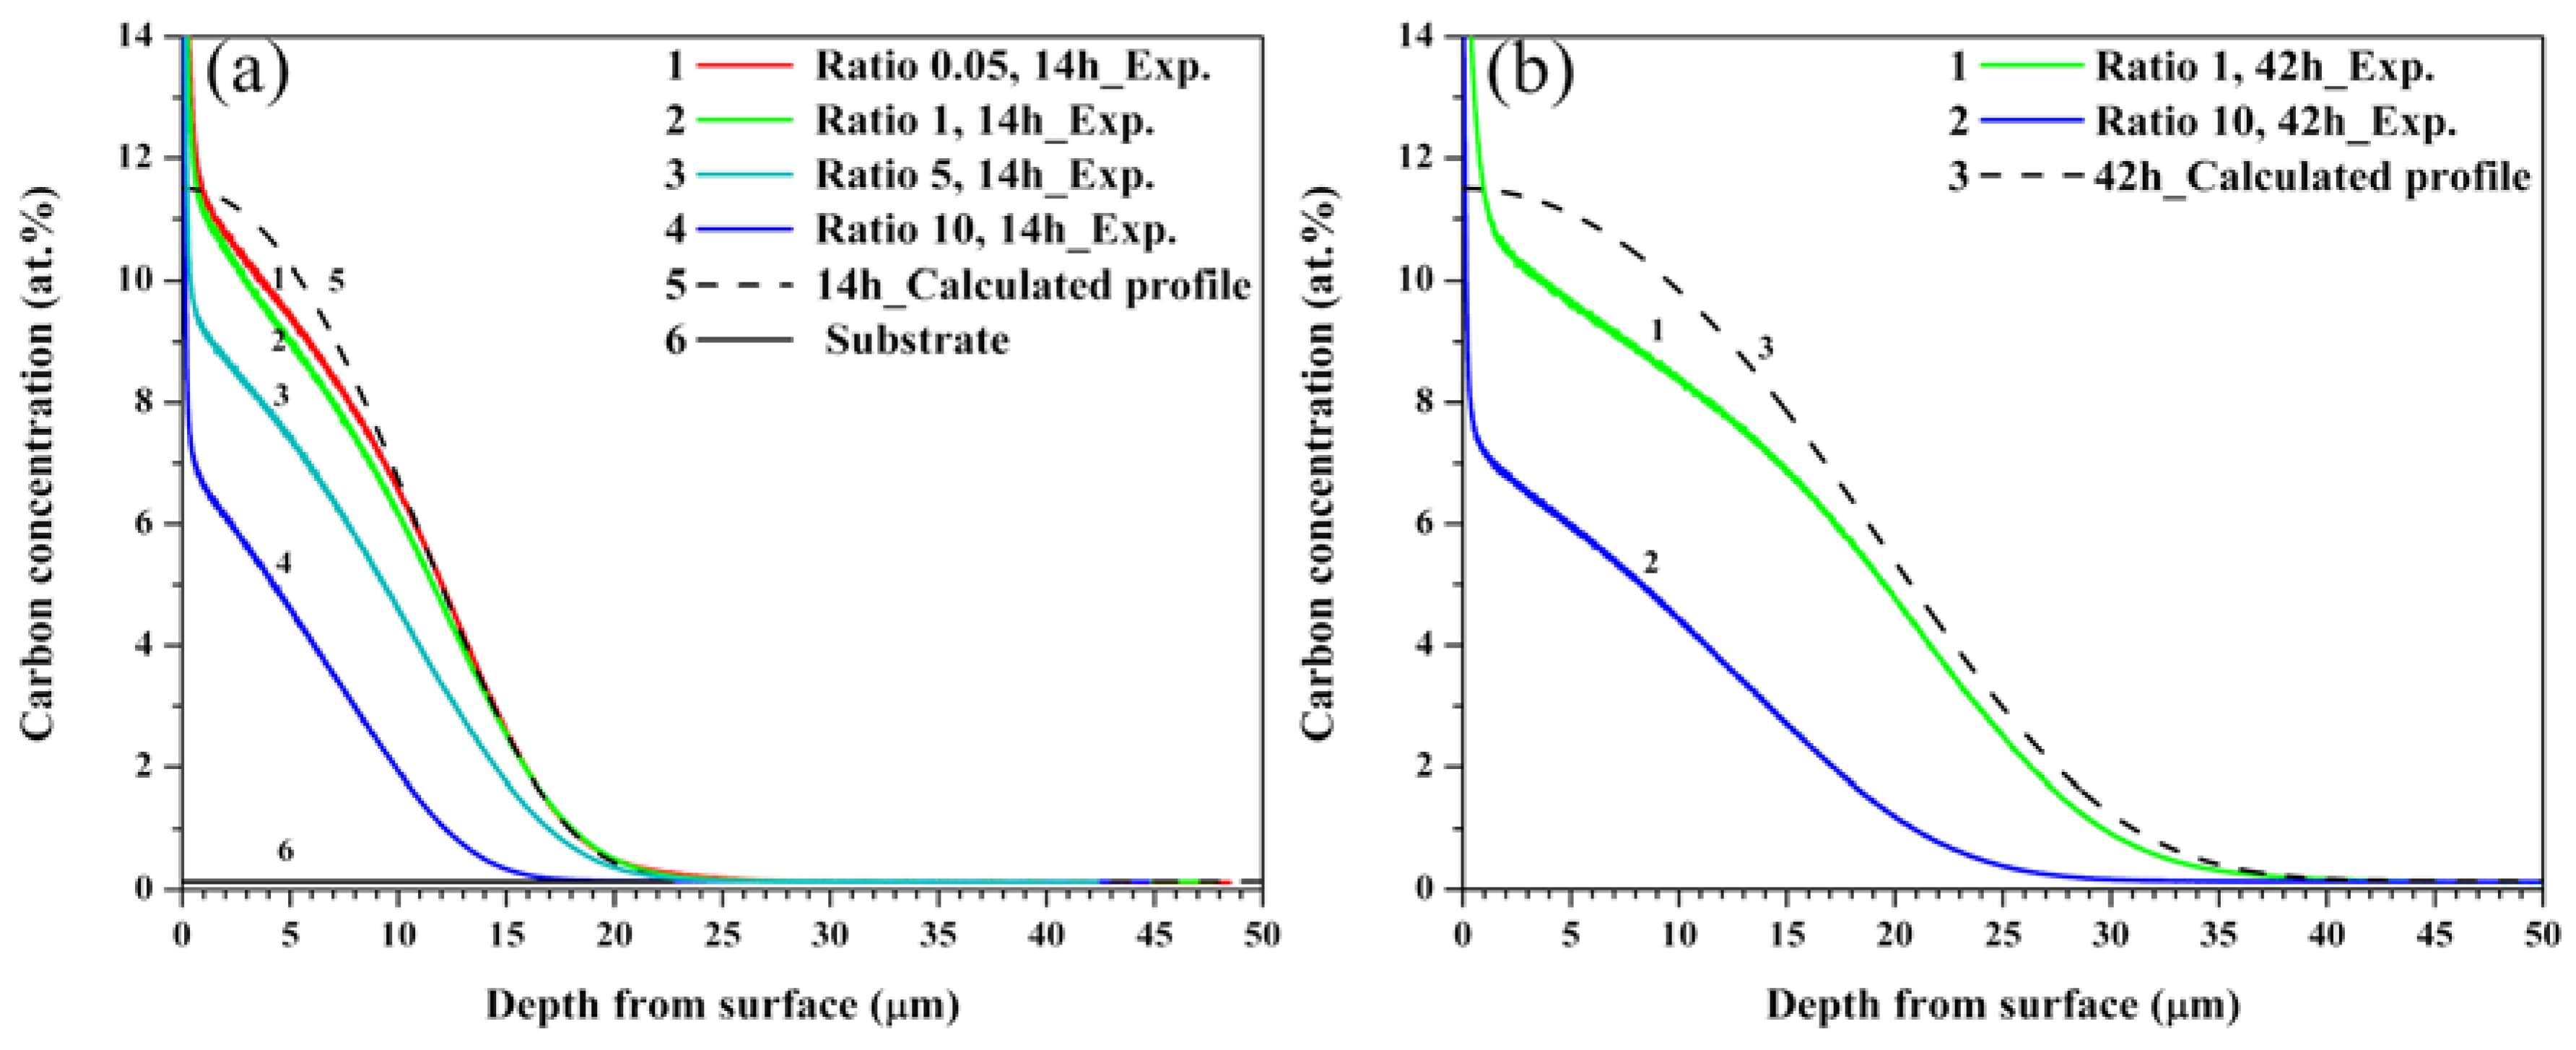
Figure 2 shows numerical simulation and experimental data obtained by GDOES analysis. In
Figure 2a, the carbon concentration depth profiles were obtained from the calculated and experimental data of the ASS samples carburized for 14 h at gas ratios of 0.05, 1, 5, and 10. To obtain the calculated data, the boundary conditions stated in
Section 2 were applied to the diffusion equation. Further, the concentration dependence of the diffusion coefficient was calculated using Equation (1). The simulated carbon concentration depth profiles reported in two studies [
24,
25] presented a best fit, corresponding to
k = 5.0 at Equation (1) [
4,
24]; however, the best fit profile obtained for the experimental data corresponds to
k = 2.0 in this study. The difference of k value as compared to others results may be because the carbon concentrations effectively reach the para-equilibrium solubility limit at the beginning of the treatment owing to the removal of the natural oxide film before the low-temperature vacuum carburization [
24,
25]. Moreover, there is a difference between the calculated and experimental data in that the carbon concentration underneath the surface is slightly higher than that of the maximum carbon solubility of 11.5 at%. This is attributed to protrusion of a large amount of carbon, sticking and/or absorbed to the surface at the beginning of the sputtering, which is inherent in GDOES, which was used to measure the carbon concentration [
26]. Therefore, the
y-axis intercept, which is the value at the
y-axis obtained by extending a straight line toward it from the slope at the point 1 μm where the high concentration of the surface abruptly drops, is about 11.5 at% and may be considered as the surface concentration in this study. The maximum carbon concentration was both 11.5 at% for the conditions of A-1 and A-2, and gradually decreased toward the depth, equal to the substrate concentrations of 0.1 at% at a depth of 23 μm. On the other hand, the carbon concentration showed maximum values of 9.8 and 7.5 at% underneath the surface of the sample carburized at the conditions of A-3 and A-4, and were equal to that of the substrate at a depth of about 21.3 and 17 μm, respectively. In other words, compared with the surface carbon concentration obtained at the conditions of A-4, A-3 was high but below the maximum carbon solubility of 11.5 at%.
Figure 2b shows the calculated and experimental data of the samples carburized at the conditions of A-5 and A-6. The calculated data agree with the experimental result obtained for the conditions of A-5. The maximum carbon concentration appeared at 1 μm underneath the surface, and the concentration was sharply decreased from about 20 μm; the concentration profiles were almost similar in shape to those obtained for the conditions of A-2.
Figure 3 presents the crystal structure of the ASS samples carburized with various gas mixture ratios of 0.05, 1, 5, and 10, as obtained by XRD analysis. In
Figure 3a, strong intensity peaks of γ-Fe phases, and two preferred orientations of (111) and (200), were observed. The peaks of the untreated sample occurred at 2θ values of 43.44° and 50.58°. However, the peaks of all the carburized samples shifted toward a lower angle direction as compared to those of the untreated sample. For the conditions of A-4, the peaks of (111) and (200) were found at 2θ values of 42.77° and 49.39°, respectively, whereas, for the conditions of A-1, these peaks shifted the most, to 42.35° and 48.96°, respectively. The shift of the peak implies that the FCC (Face Centered Cubic) lattice expanded with an increase in the lattice constant, a, which was 0.3606 nm for the untreated sample and 0.3694 nm for the conditions of A-2.
Furthemore, a weak intensity peak belong to a second phase was observed at 2θ = 43.33°, which corresponds to a plane spacing d of ≈ 0.2086 nm, for the conditions of only A-1 and A-2, where the maximum carbon concentration was about 11.5 at%. Therefore, it can be presumed that the phase has a crystal structure of M
5C
2, the Hägg carbide [
4,
27] which is known to form at higher carbon concentration of 11 at% in the previous reported reference [
4]. In the XRD results of
Figure 3b, the (111) peak of the XRD result of the sample carburized at the conditions of A-5 was slightly shifted by 0.2° toward a lower angle than that obtained in the result at conditions of A-2, and the Hägg carbide peak was also observed with slightly increased intensity. In the conditions of A-6, however, XRD results were obtained which were almost the same as those of the sample carburized at the conditions of A-3. That is, the (111) peak was observed at approximately the same position as the conditions of A-3 and A-5, but the peak of M
5C
2 was not detected.
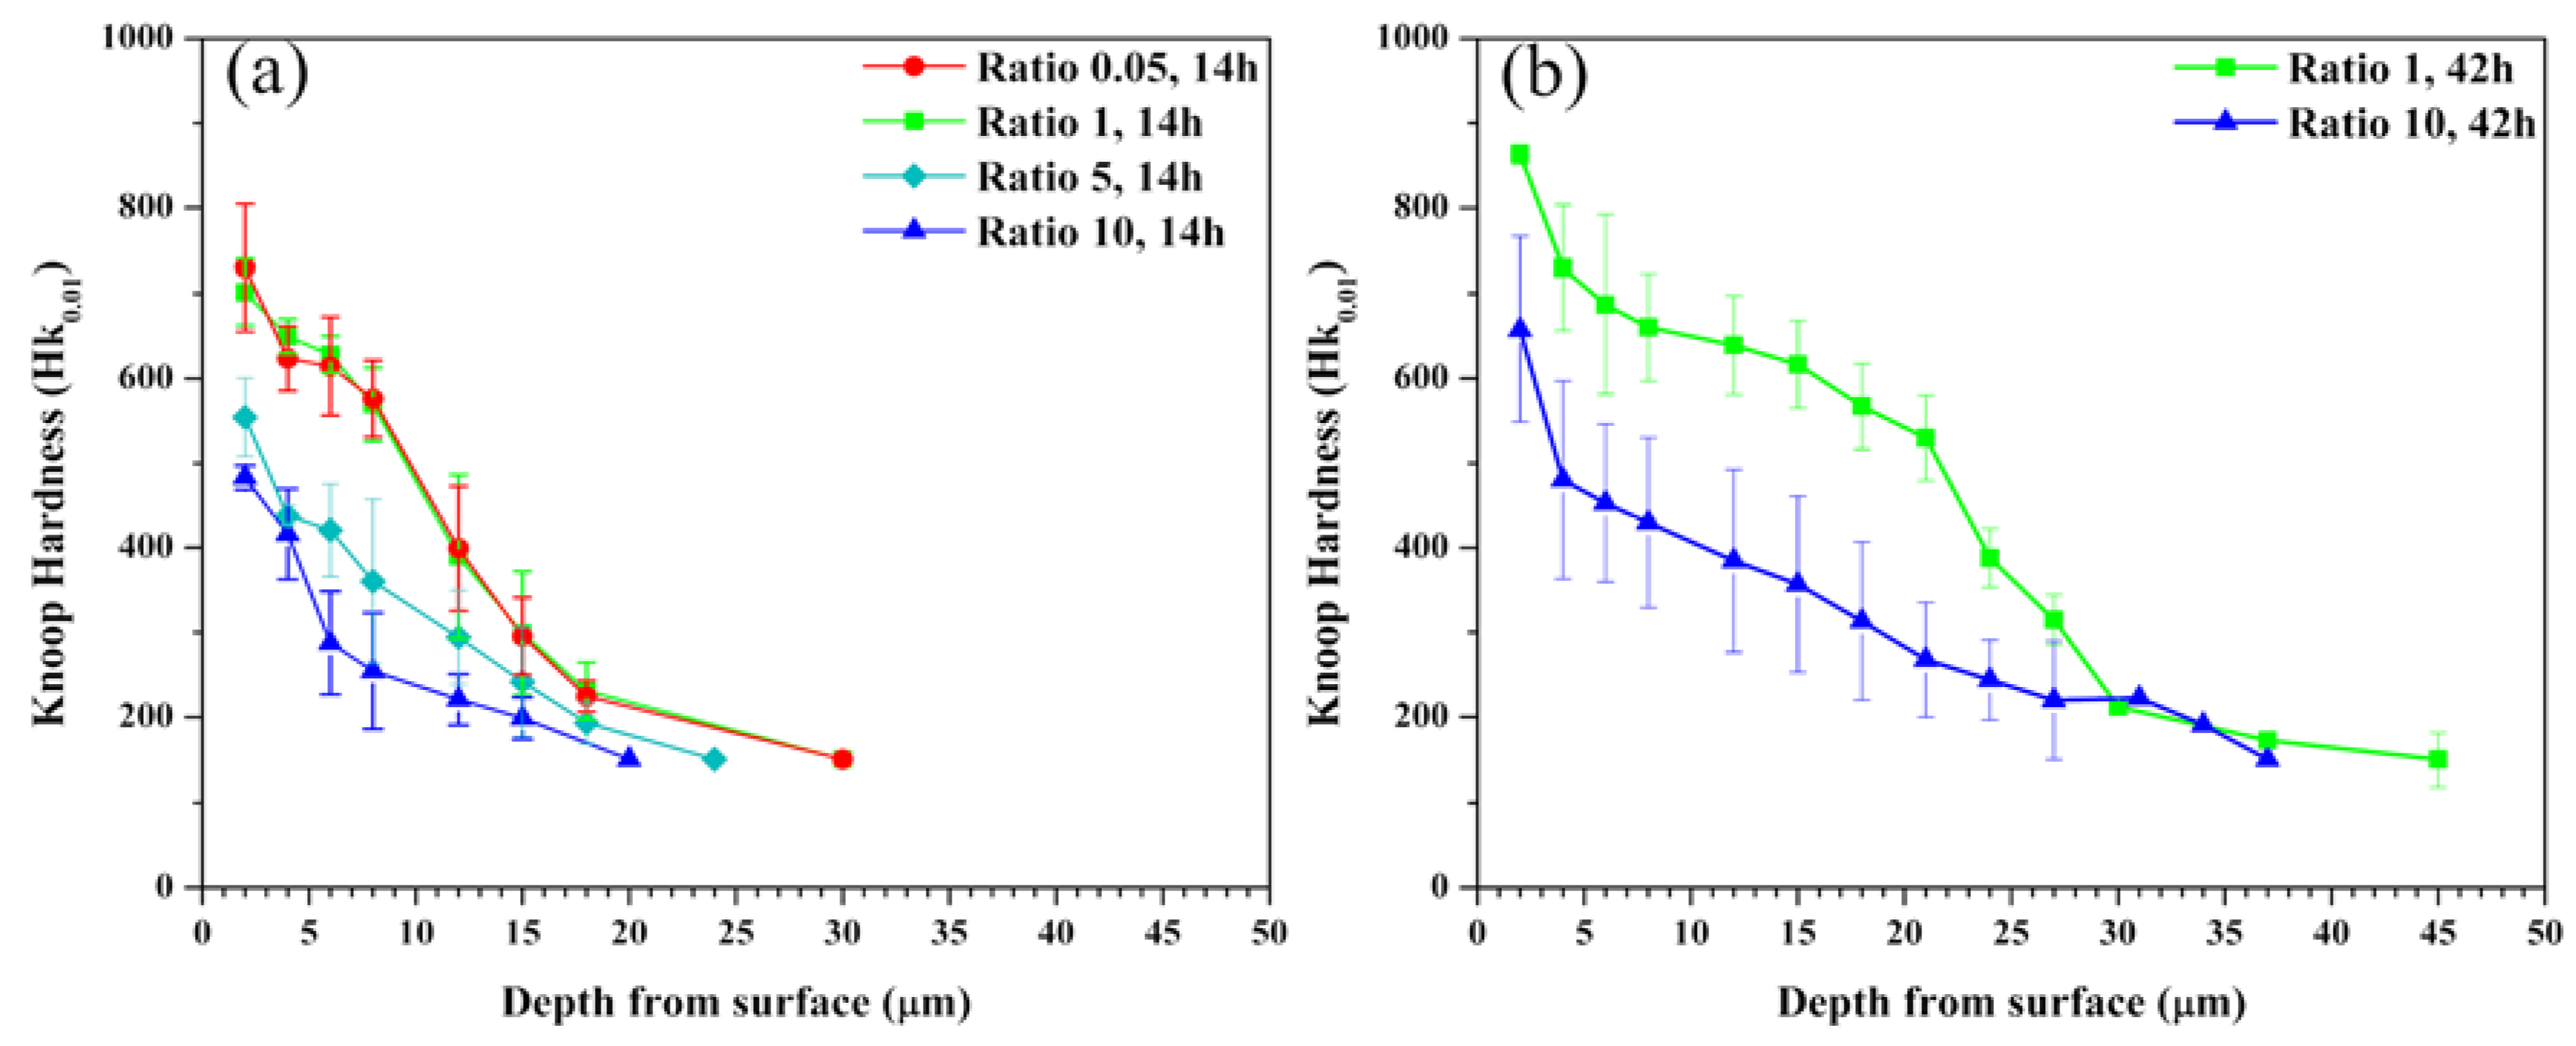
In
Figure 4a, the maximum hardness values of the samples carburized at the conditions of A-1 and A-2 were 812 and 747 Hk
0.01 at 2 μm, respectively; however, both hardness values were sharply decreased from about 8 μm, and equaled the substrate hardness values of 150 Hk
0.01 at 22 μm. On the other hand, the maximum hardness values of the sample carburized at the condition of A-3 and A-4 were 560 and 480 Hk
0.01; these values rapidly decreased from about 2 μm and became 150 Hk
0.01 at 17 μm. As shown in
Figure 4b, the maximum hardness value of the sample carburized at the conditions of A-5 was 890 Hk
0.01 at 2 μm, and remained above 550 Hk
0.01 until about 20 μm, and finally, equaled the substrate hardness value at about 35 μm. In the case of the sample carburized at the conditions of A-6, however, the maximum hardness value was slightly increased to 550 Hk
0.01 as compared with the sample carburized at the conditions of A-4 (See
Figure 4b: error bars denote the standard error for the mean of the hardness values in the expanded austenite layer with wide range deviations of ±100–200 Hk
0.01, obtained by averaging the hardness values of each thin and thick layer to calculate the standard error.).
The values of the maximum carbon concentration and hardness of
Figure 2 and
Figure 4 did not significantly change as compared to those with the sample carburized for 14 h, although carburization was carried out for a longer duration. However, the carbon concentration and hardness below the maximum value area were high for the condition of 42 h, as compared to carburization for 14 h. Thus, it was confirmed that the hardness depth profiles show a very similar behavior to the carbon concentration depth profiles.
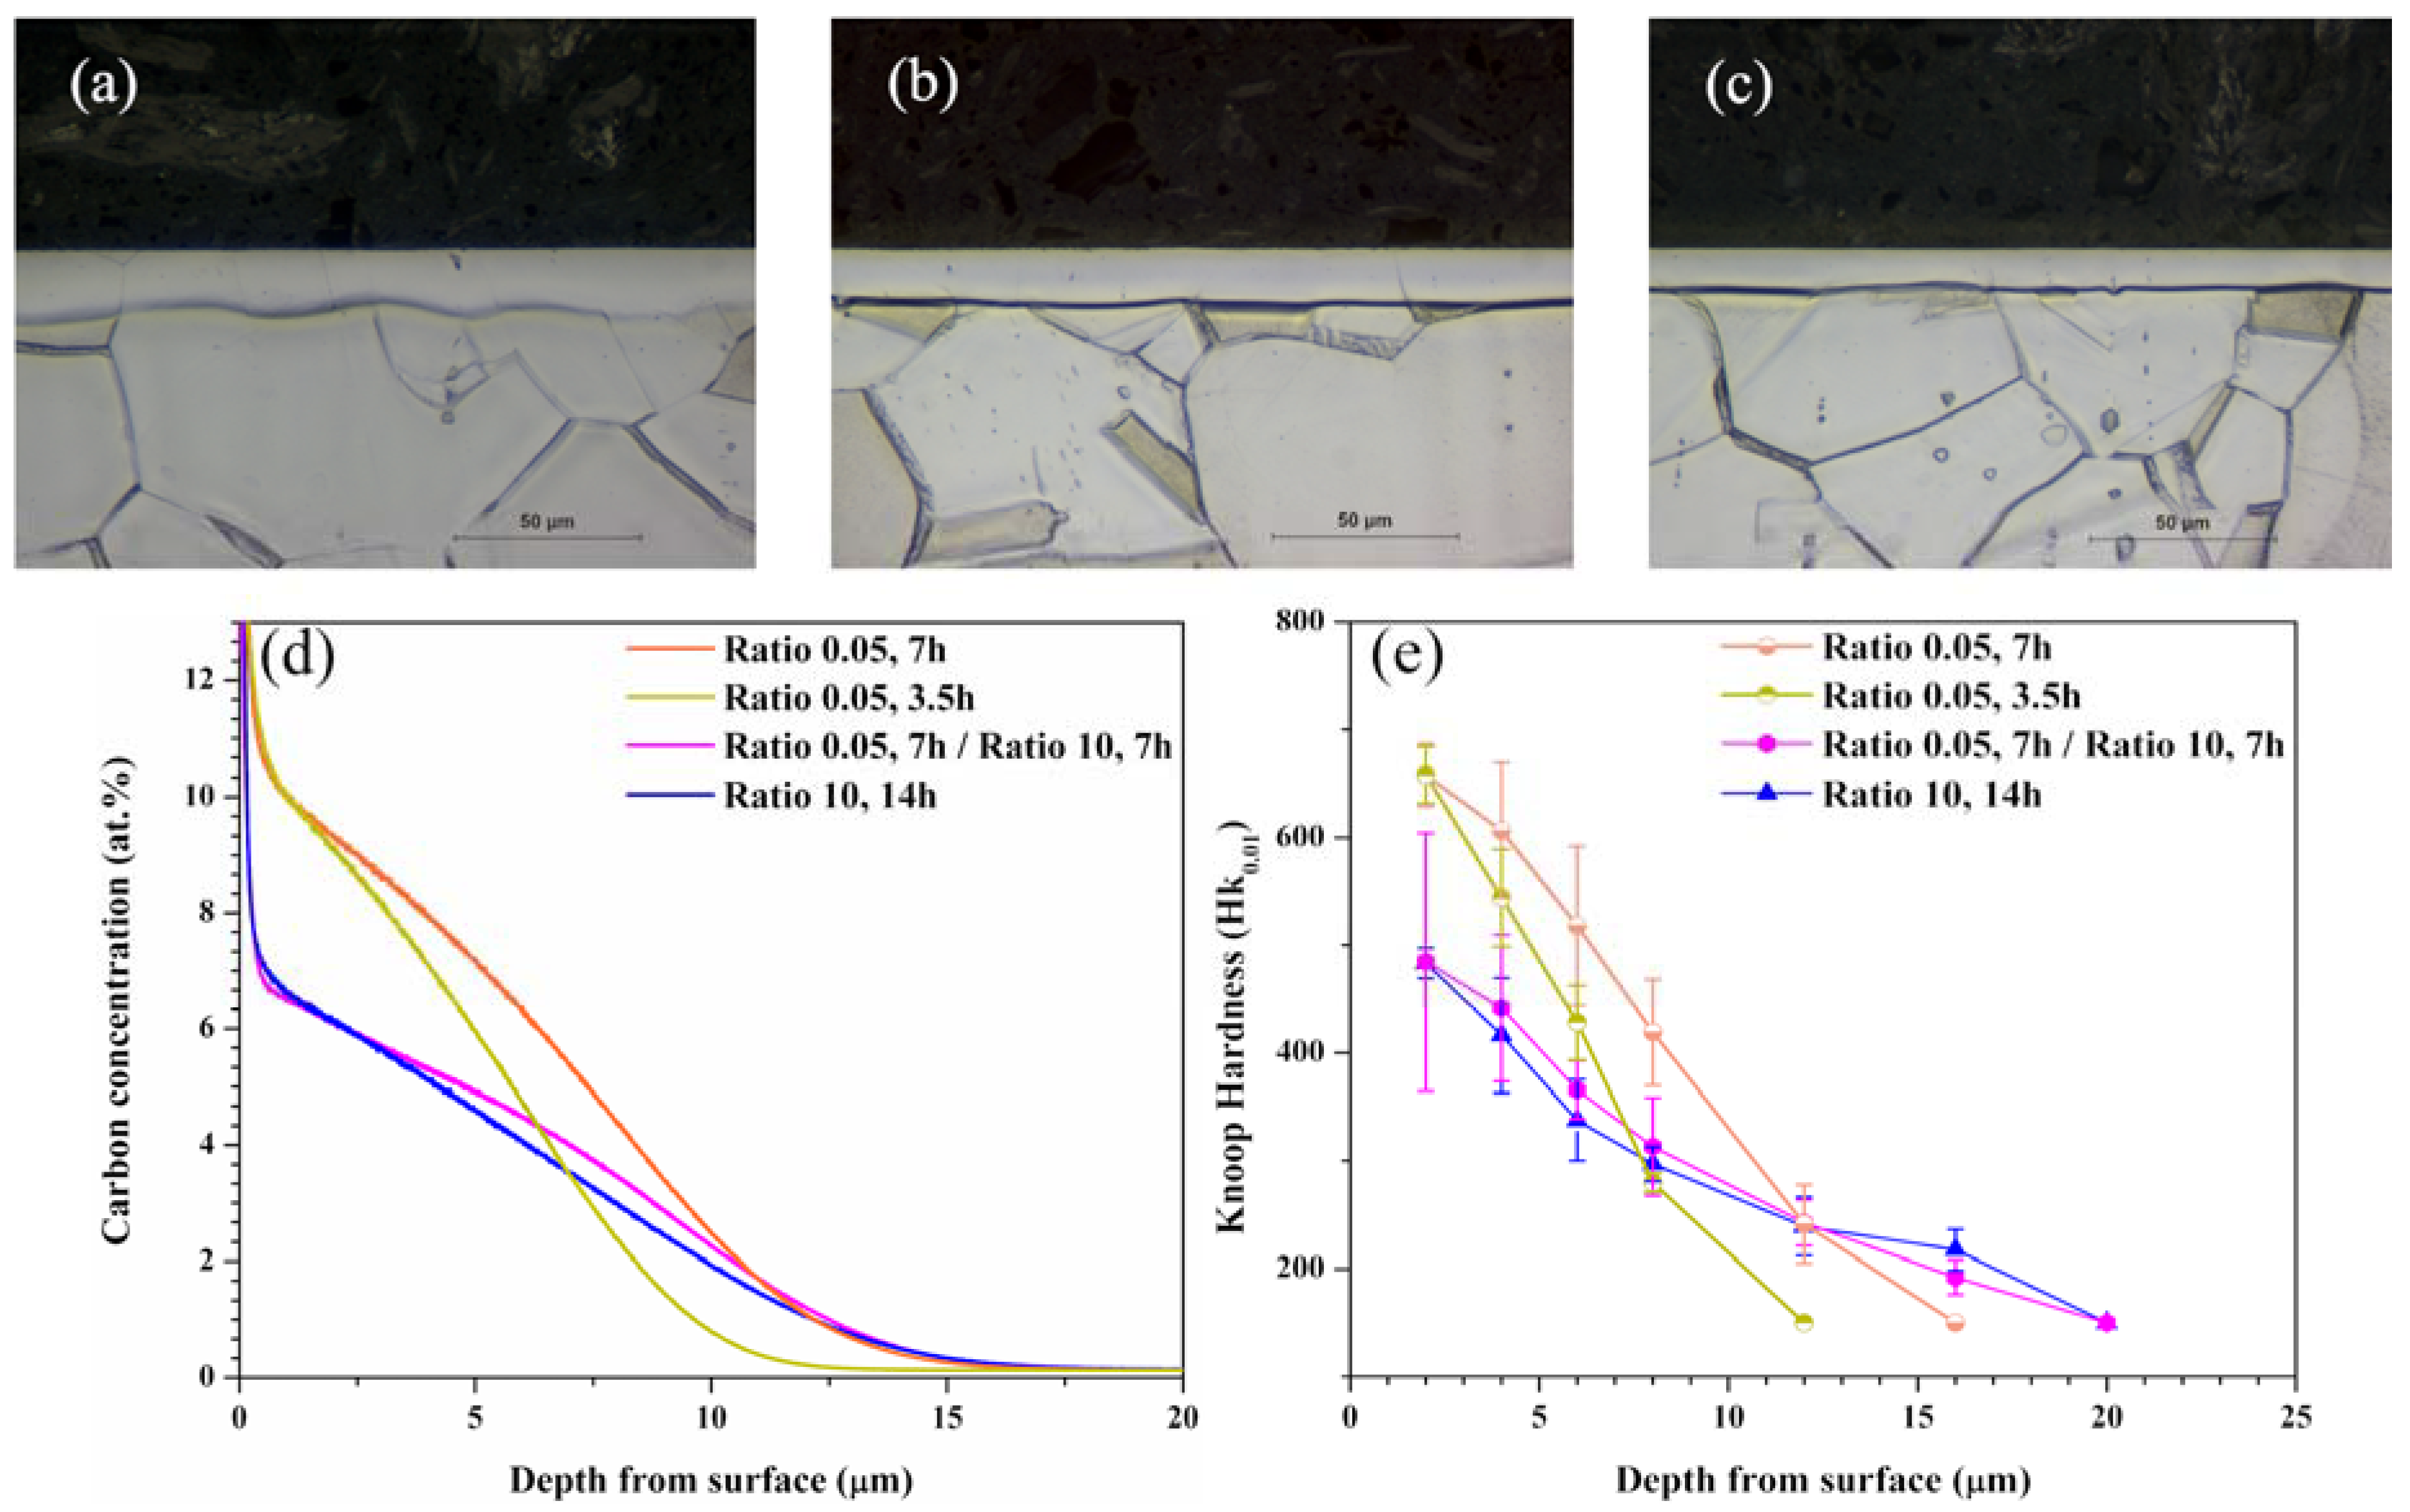
Figure 5 shows the cross-sectional microstructure images, carbon concentration, and hardness depth profiles for the samples carburized for 3.5 h; (a) A-7, 7 h; (b) A-8, for 7 h at gas ratio of 0.05 followed by for 7 h at gas ratio of 10; (c) A-9.
Figure 5a–c shows the cross-sectional images of samples carburized at the three aforementioned conditions; the thickness values of the expanded austenite layers are 13, 15, and 17 μm, respectively. They are almost similar to those obtained from the carbon concentration depth profiles in
Figure 5d and hardness depth profiles in
Figure 5e.
The carbon concentrations underneath the surface of the samples carburized at the conditions of A-7 and A-8 were similar, at about 11.5 at% (
Figure 5d). For the conditions of A-9, however, the carbon concentration underneath the surface was decreased from the high concentration of 11.5 at% obtained after the sample carburized at the conditions of A-8, and was similar to that obtained at the conditions of A-4. Comparing the results obtained at the conditions of A-4 and A-9, it can be seen that the carbon concentration was slightly higher for the latter, 5 μm. This result is also observed in the hardness depth profiles in
Figure 5e for the three aforementioned conditions. The maximum hardness was 680 Hk
0.01 in the sample carburized at the conditions of A-8, and then drastically decreased to that of substrate. For the samples carburized at the conditions of A-4 and A-9, all hardness values were similar, exhibiting a lower maximum at 480 Hk
0.01, as compared to the sample carburized at the condition of A-8. Nevertheless, the thickness of the expanded austenite layer for the sample carburized at A-9 was about 20 μm, and almost equal to that for the sample carburized at the conditions of A-4.
4. Discussion
As shown in the experimental results, the yield of the expanded austenite layer depends on the gas ratio used in the direct low-temperature vacuum carburization employing acetylene gas. The maximum carbon concentration of samples carburized at the conditions of A-1 and A-2 were similar, at 11–12 at% [
4,
28], and the thickness values of the expanded austenite layer were also similar, at 22 μm, in this study. On the other hand, the carbon concentration and the thickness of the layer at the conditions of A-3 and A-4 were significantly lower than those at the lower gas ratios. In particular, for the conditions of A-4, the thickness of the expanded austenite layer was uneven, in a range of 13–18 μm with large standard error. Compared with that, the thickness of the expanded austenite layer for the conditions of A-3 was about 21 μm, which is further increased.
Acetylene is known to adsorb on the surface of a metal base material [
20] and decompose into hydrogen and carbon, which is diffused and dissolved at the interstitial site. In this study, however, the carbon concentration was the lowest at the conditions of A-4, which has the highest amount of acetylene, even though there are many more carbon species which can dissolve in the substrate. This implies that an adequate amount of hydrogen is necessary at a certain temperature in low-temperature vacuum carburization employing C
2H
2 gas [
20,
29]. This observation is consistent with a study wherein despite the expected observation that the flow of high gas ratio C
2H
2 with nearly infinite carbon activity would increase the carbon concentration in ASS, the actual carburization efficiency was very low [
16]. This lowering of the carburization efficiency for a high ratio of C
2H
2 can be expected as follows [
16,
17]: (a) it is difficult to increase to the para-equilibrium carbon solubility limit due to a lack of free radicals generated, which depends on the amount of the H
2 gas introduced, (b) the transfer of soluble carbon species from the gas atmosphere into the solid is hindered by the soot and metal dust formed due to the high activity of C
2H
2 gas.
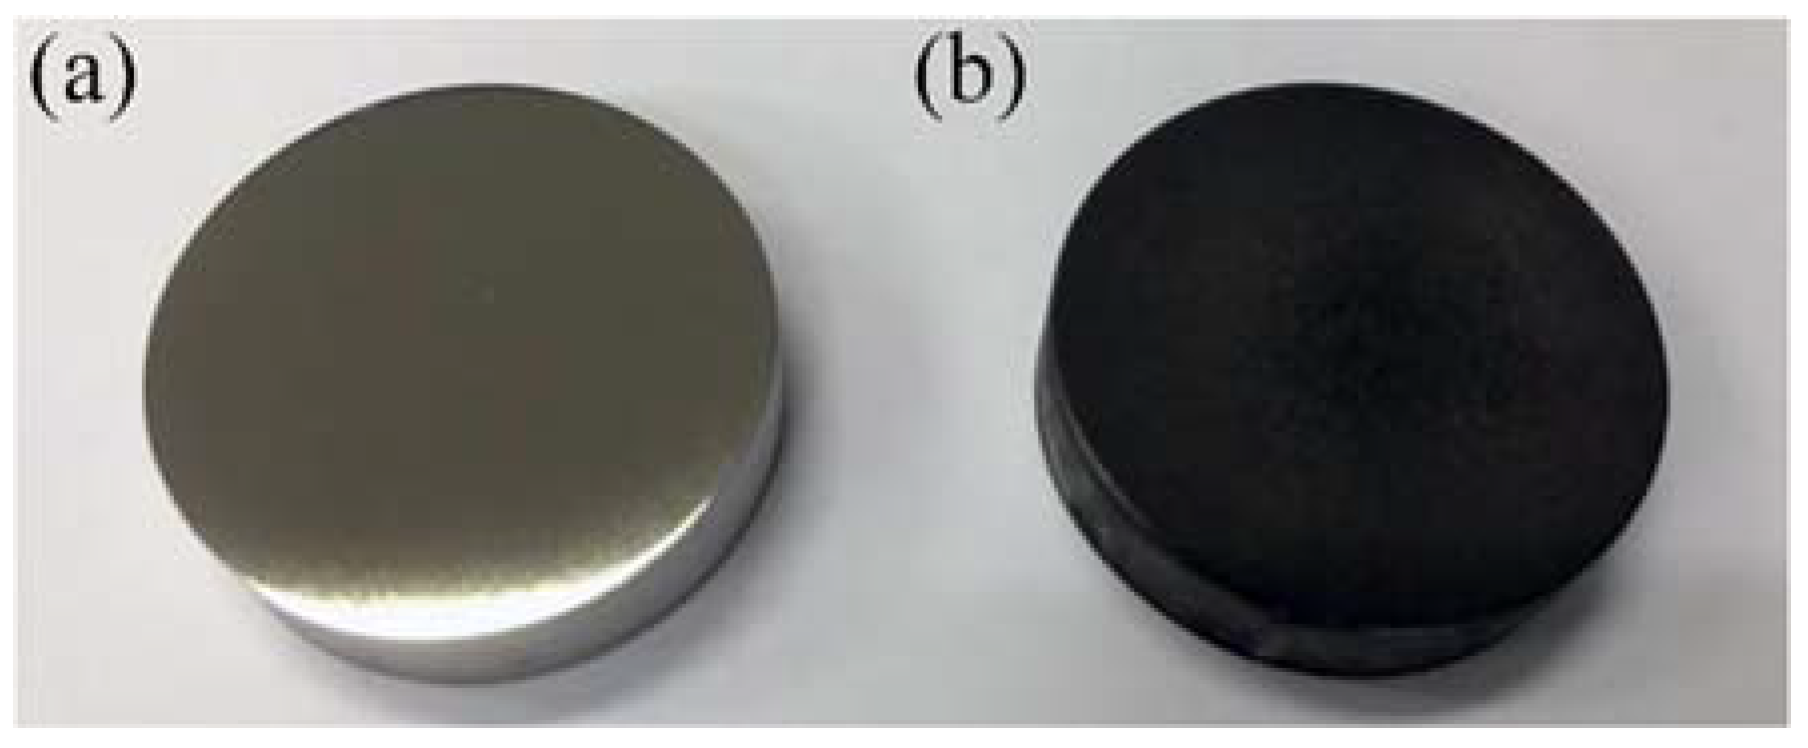
In this study, the expanded austenite layers were uniformly formed on the surface except for some specific conditions. On the other hand, the soot with dark grayish color was produced after low-temperature vacuum carburization under all of the process conditions as shown in
Figure 6, because the acetylene activity was as high as about 10
3–10
5 even in vacuum. Accordingly, it is not a necessary to consider that the interruption of the transfer of soluble carbon species by soot and metal dust is the reason for deteriorating carburizing efficiency mentioned in (b) because soot and metal dust were formed even under the conditions with the uniform layer. Therefore, the reduction of the carburization efficiency at the conditions of A-4 was probably the result of decreased radicals owing to the lack of hydrogen gas. Due to lack of free radicals, the natural oxide layer is not completely removed or the para-equilibrium carbon concentration is lower; hence, carbon is unevenly dissolved in the austenite matrix and consequently, the carbon concentration profile in the entire carburization layer may not increase. Generally, the carburization layer is formed via concentration-dependent diffusion as a function of
. In the bulk material carburized at low temperature, therefore, the heterogeneous solid solution of carbon atoms may have formed (or may have formed in the initial diffusion regime) owing to limited expansion of the lattice by the surrounding one, different diffusion path, or a different carbon diffusion rate depending on the crystal orientation [
30,
31]. At that time, if the carbon species continue to get introduced from the surface, the ASS will be able to continuously maintain the maximum para-equilibrium carbon concentration, and therefore the internal carbon concentration can be gradually increased as the carbon continues to diffuse inward. However, if the natural oxide layer is not completely removed or the para-equilibrium carbon concentration is lowered, the diffusion rate is inevitably lower due to the lack of carbon species introduced from the interface of the gas and solid. Therefore, the expanded austenite layer in the conditions of A-4 had a relatively low carbon concentration compared to that in the other conditions, despite carburization for the same time.
Carburization was carried out for 42 h in order to confirm whether the carbon concentration in the expanded austenite layer increased with the process time, despite the lack of free radicals; the results are shown in
Figure 3. At conditions of A-5, adequate free radicals were produced by sufficient hydrogen gas. Therefore, the sample acquired a carbon concentration and a thickness of the expanded austenite layer almost similar to the maximum carbon solubility of 11.5 at% [
28] and the predicted theoretical result, respectively. For the conditions of A-6, however, the thickness of the expanded austenite layer increased to a maximum of 30 μm, but was not constant and had a large deviation, as shown in the cross-sectional OM image. Moreover, the maximum carbon concentration was 7.5 at%, compared with the result obtained at the conditions of A-4. Therefore, the para-equilibrium carbon concentration did not increase with the process time when the numbers of free radicals generated by the small amount of hydrogen gas ratio in the total process gases was small. Thus, carbon species are continuously supplied only at a specific concentration by the generated free radicals under each process condition, even if the process time increases.
The results obtained by changing the gas ratio in-process (
Figure 5) show that the gas ratio has a great influence on the formation of radicals. For conditions of A-8, the surface may have been activated relatively quickly by the number of free radicals, following which the carbon atoms diffused through the surface to the substrate; thus, the expanded austenite layer was thin with a high hardness value, with a uniform and maximum carbon concentration of about 11 at%. On the other hand, when the number of free radicals was reduced by changing the gas ratio from 0.05 to 10, the result was similar to that for the sample carburized at the conditions of A-4, because the carbon concentration at the interface between the gas and metal decreased with a decrease in the free radicals.
Based on these results,
Figure 7 shows a schematic of the variance in the carbon concentration profile due to changes in the para-equilibrium carbon concentration according to the gas ratio. In
Figure 7a,b, the influence on the formation of the expanded austenite layer by the difference in the para-equilibrium carbon concentrations,
Ceqs-g(0.05) at gas ratio of 0.05 and
Ceqs-g(10) at gas ratio of 10, is shown. When
Ceqs-g(0.05) is high, the surface carbon concentration
Cs(0.05) reaches the maximum value in a short time, owing to the high activity of acetylene, whereas, when the carburization time increases, the carbon is diffused in the depth direction while maintaining the surface concentration. For a gas ratio of 10, On the other hand, the carbon concentration
Cs(10) underneath the surface becomes lower due to insufficient amount of radicals, and does not change even with an increase in the process time; only diffusion occurs, as shown in the experimental results in
Figure 5d.
As shown in
Figure 7c,d, after carburization, although the gas ratio was only changed with the same carburization time, the carburization depth and the surface carbon concentration were similar. It is anticipated that if
Ceq,s-g(10) is decreased from
Ceq,s-g(0.05), the carbon atoms dissolved in the surface by carburization at a gas ratio of 0.05 only diffuse into the substrate, because
Cs(0.05) is higher than
Ceq,s-g(10), and no additional carbon atoms are supplied through the interface from the gas atmosphere. As shown in
Figure 7d, however, the difference between the carbon concentration profiles is as follows: When the gas ratio is changed during the process for one in two carburization conditions, the expanded austenite layers at both conditions have the same thickness; however, there are deviations in the middle parts of the carbon concentration profiles. This means
Ctotal(0.05, 7 h), which is the total carbon concentration in the expanded austenite layer formed by carburization for 7 h at a gas ratio of 0.05, is higher than
Ctotal(10, 7 h), which is the total carbon concentration in the expanded austenite layer formed by the carburization for 7 h at a gas ratio of 10. Finally, when
Cs(10) is lower than
Ceq,s-g(10), the carbon atoms are introduced from outside the gas and are continuously diffused toward the substrate.


