Optimizing the Local Strength Mismatch of a Dissimilar Metal Welded Joint in a Nuclear Power Plant


School of Energy and Power Engineering, University of Shanghai for Science and Technology, Shanghai 200093, China
*
Author to whom correspondence should be addressed.
Metals 2018, 8(7), 494; https://doi.org/10.3390/met8070494
Submission received: 3 June 2018
/
Revised: 22 June 2018
/
Accepted: 25 June 2018
/
Published: 28 June 2018
(This article belongs to the Special Issue Dissimilar Metal Welding)
Abstract
:Local strength mismatch is one of the important factors which affects the fracture behavior of a dissimilar metal welded joint (DMWJ). The question to consider is how to improve the fracture resistance of the DMWJ effectively by optimizing the local strength mismatch. In this paper, a DMWJ in a nuclear power plant was selected, the J-resistance (J–R) curve and crack growth path of the DMWJ under different strength mismatches of heat affect zone (HAZ), fusion zone (FZ), and near interface zone (NIZ) were systemically studied. And then, the optimal design of the local strength mismatch was investigated. The results show that decreasing the strength of HAZ and NIZ and increasing the strength of FZ will increase the fracture resistance of a DMWJ. Increasing the strength of FZ increases the J–R curve obviously. When the Ms(HAZ):Ms(FZ):Ms(NIZ) = 1.12:1.4:1.26 and Ms(HAZ):Ms(FZ):Ms(NIZ) = 1:1.4:1, the DMWJs have the highest J–R curves. Considering that the two J–R curves are similar, it is suggested that the fracture resistance of the DMWJ can be improved only by increasing the strength of the FZ.
1. Introduction
As an indispensable part of nuclear power plant, the dissimilar metal welded joint (DMWJ) has been widely used. The fracture behavior of a DMWJ should be considered accurately for the safe service of the nuclear power plant. Thus, the microstructural, mechanical, and fracture properties of the DMWJ have been studied extensively by experiment and finite element simulation [1,2,3,4,5,6,7,8,9,10]. Wang et al. [1] and Ding et al. [2] studied the microstructure of DMWJs by different techniques. Ming et al. [3,4,5] investigated the microstructure and local mechanical properties of the low-alloy-steel/nickel-based-alloy interface in DMW by experiment. Rathod et al. [6,7] studied the mechanical properties of the DMWJ by different mechanical tests comprising bend test, transverse tensile test, tensile test, Charpy impact test, and micro-hardness measurement. Hou et al. [8] characterized the microstructure and mechanical property of the fusion boundary region of DMWJ. Yang et al. [9] and Wang et al. [10] studied the fracture behavior of crack which located in the weakest location of DMWJ by experiment and finite element simulation, respectively.
Strength mismatch is also one of the important factor which affects the fracture behavior of DMWJ, and has been paid more attention to both scholars in home and abroad. Kirk et al. studied the crack-tip constraint in singe edge notched bend specimen affected by weld strength mismatch [11]. Burstow et al. investigated the crack-tip stress fields of the weld joint under different strength mismatches [12]. Cetinel et al. studied the fracture behavior of the weld nodular cast iron affected by under-matching [13,14]. An et al. studied the ductile crack initiation behavior affected by strength mismatch [15]. Rakin et al. investigated the fracture behavior of the high-strength low alloyed steel weld joint affected by strength mismatch [16].
In recent years, many scholars focused on the study of strength mismatch effect on the fracture behavior of bi-material interface. Negre et al. [17] and Samal et al. [18] investigated the local fracture resistance and crack path deviation affected by the local strength mismatch in the bi-material interface region. Zhang et al. established a material constraint parameter M to consider the effect of strength mismatch in bi-material interface crack [19]. Fan et al. studied the fracture behavior of bi-material interface region under different work hardening mismatches [20,21,22,23].
Besides, some scholars investigated the fracture behavior of DMWJ affected by strength mismatch [24,25,26,27,28,29]. Wang et al. studied the fracture behavior of DMWJ under different strength mismatches [24,25] and the fracture resistances at different crack positions [26,27]. Xue et al. [28] investigated the micro region at the crack tip of DMWJ under different mismatches of the yield stress. Zhu et al. [29] studied the fracture behavior of nuclear pressure steel A508-III DMWJ affected by strength mismatch.
This study clarified the effect of strength mismatch on the fracture behavior of welded joints, and laid the foundation for the building of accurately structure integrity assessment. In the next step, it is necessary to consider the optimal design of the local strength mismatch to improve the fracture resistance of DMWJ.
In this study, a DMWJ in nuclear power plant was selected, and the fracture behavior of the DMWJ under different strength mismatches of the heat affect zone (HAZ), fusion zone (FZ), and near interface zone (NIZ) were systemically studied. And then, the optimal design of the local strength mismatch was investigated.
2. Finite Element Numerical Calculation
2.1. Materials
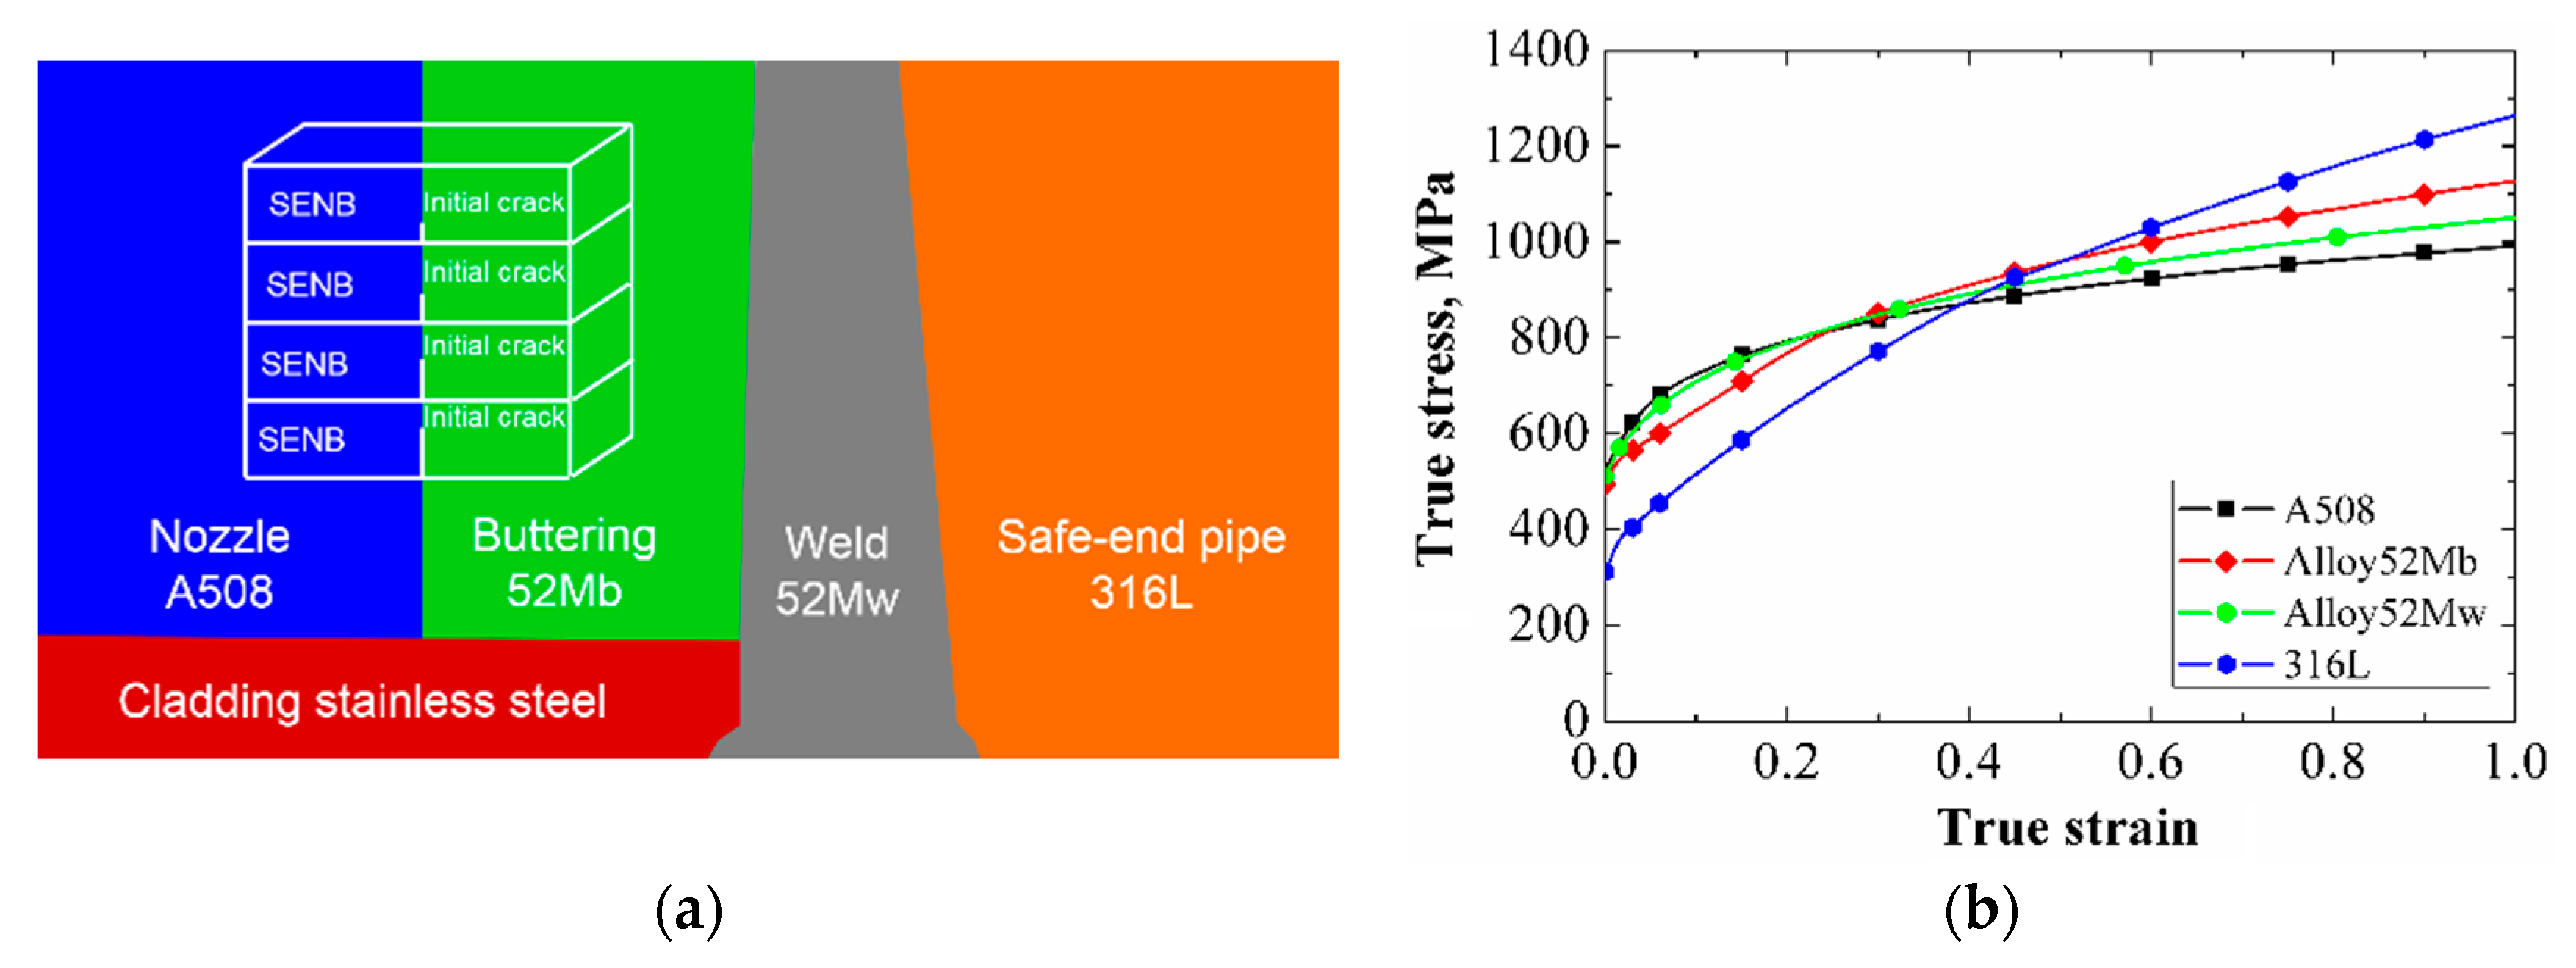
The DMWJ, which was used for connecting the safe end to the pipe-nozzle in the nuclear power plants was selected. The safe-end pipe material is austenitic stainless steel (316 L), and the pipe-nozzle material is ferrite low-alloy steel (A508), as shown in Figure 1a. The DMWJ was manufactured by applying a buttering technique. The buttering material (52 Mb) and the weld material (52 Mw) are the same nickel-base alloy, but their fabrication procedures are different. The true stress-strain curves of the four materials are shown in Figure 1b.
The initial crack is located in the interface of A508 and 52 Mb, as shown in Figure 1a. It is the weakest position of the DMWJ [30] and has an obvious strength mismatch. At the left side of the A508/52 Mb interface, the hardness of the material is 315 HV; at the right side of the A508/52 Mb interface, the hardness of the material is 230 HV.
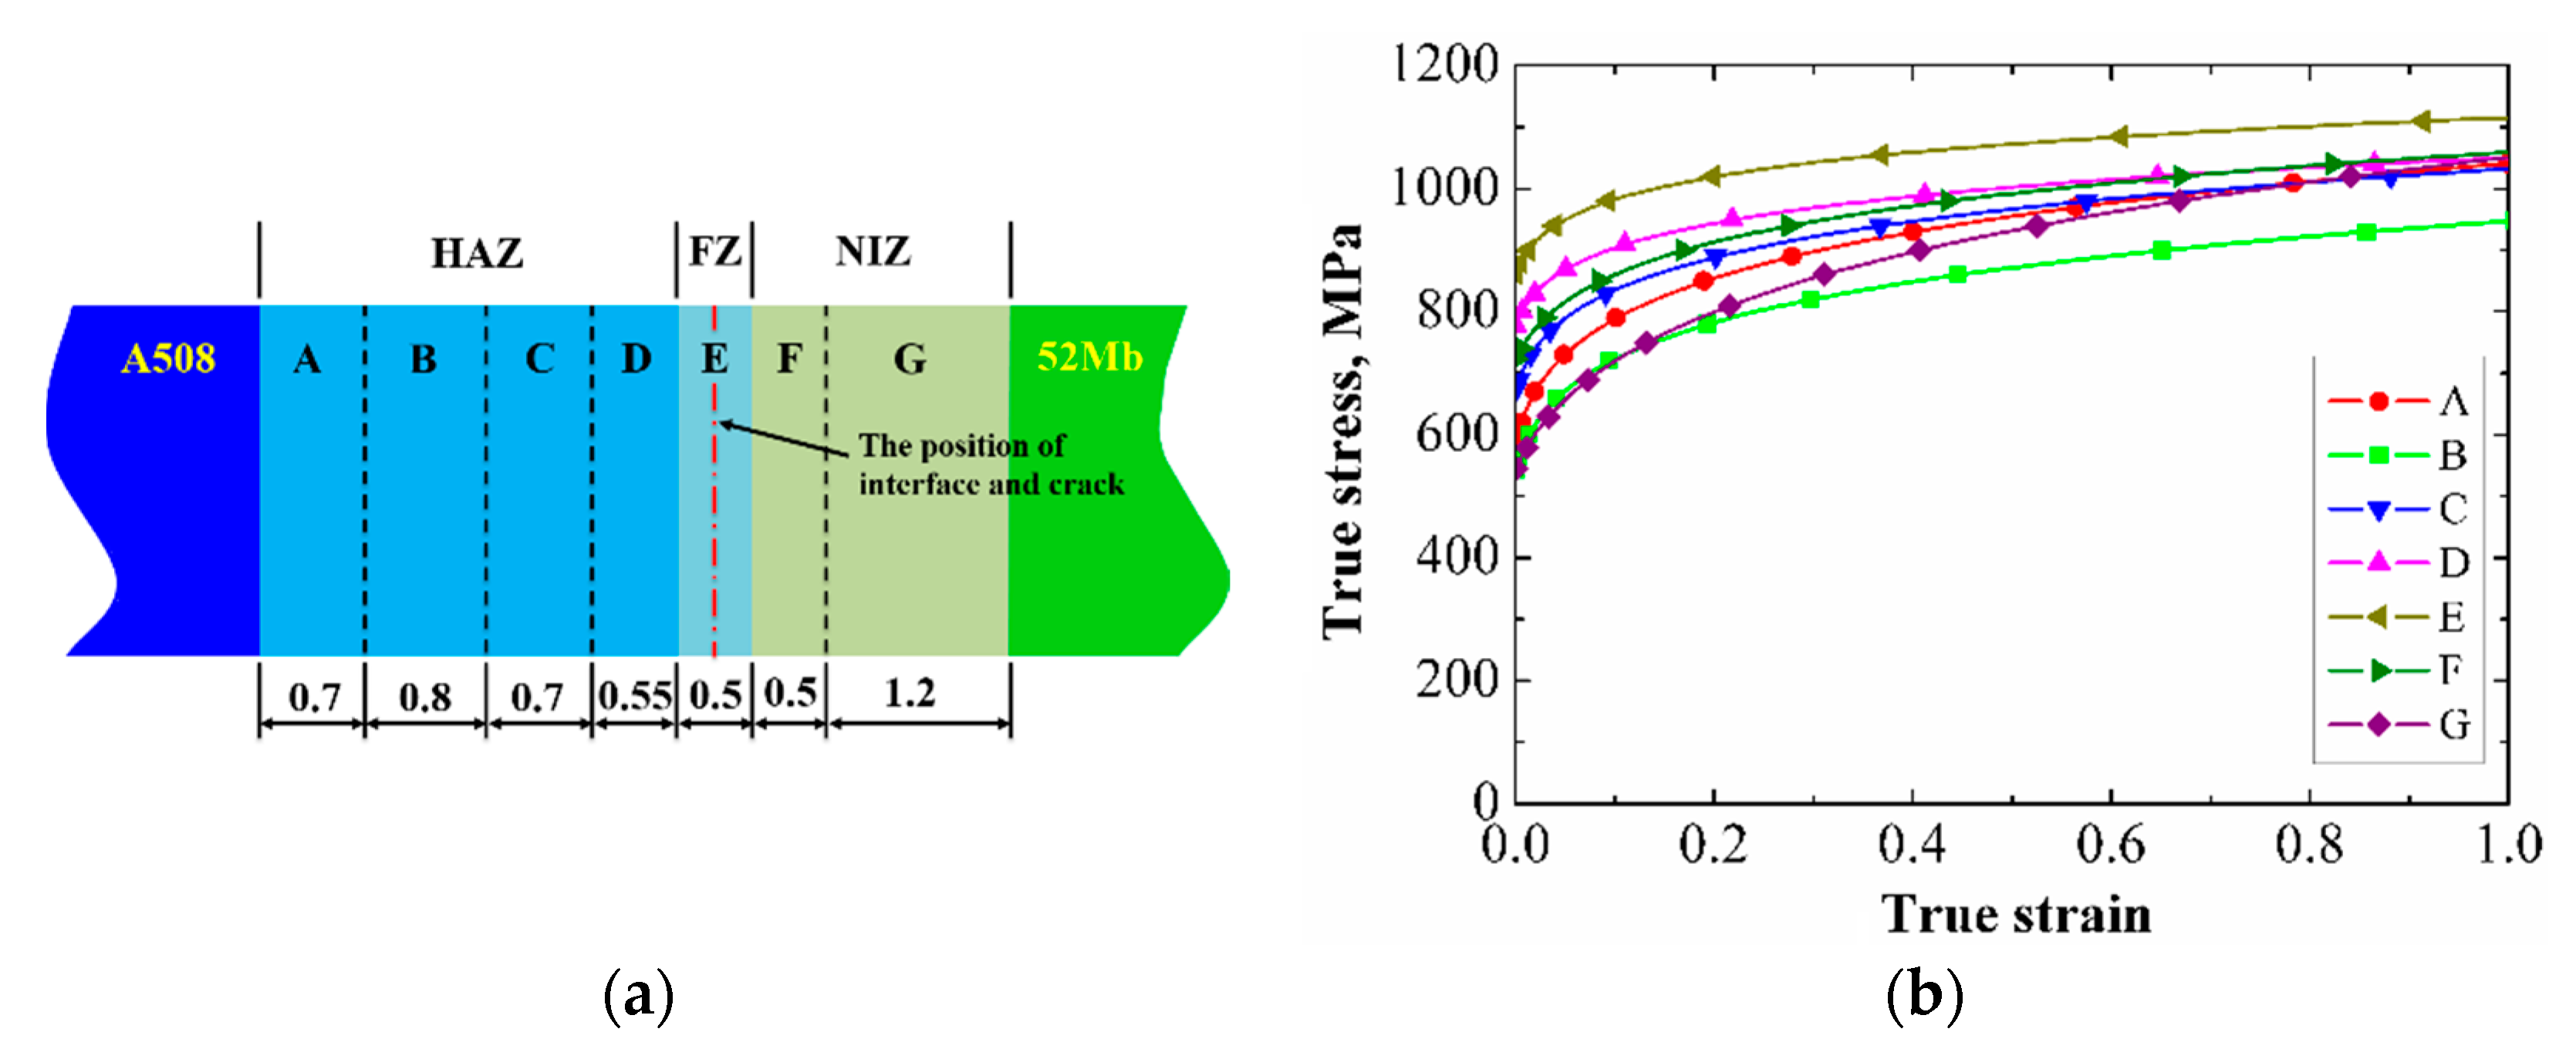
To calculate the fracture behavior of the DMWJ accurately, the local heterogeneous mechanical properties are incorporated into the finite element model. The A508/52 Mb interface region is divided into three zones: HAZ, FZ, and NIZ. In addition, based on the hardness measurement and microstructure observation, the HAZ and NIZ are further divided into four-material subareas (A, B, C, and D subareas) and two-material subareas (F and G subareas), respectively. The FZ is a single-material E subarea, as shown in Figure 2a [31]. In the Figure 2a, the initial crack and the A508/52 Mb interface are located in the middle of the E subarea. The true stress-strain curves of the A, B, C, D, E, F, and G subareas are shown in Figure 2b [31].
2.2. Specimen Geometry
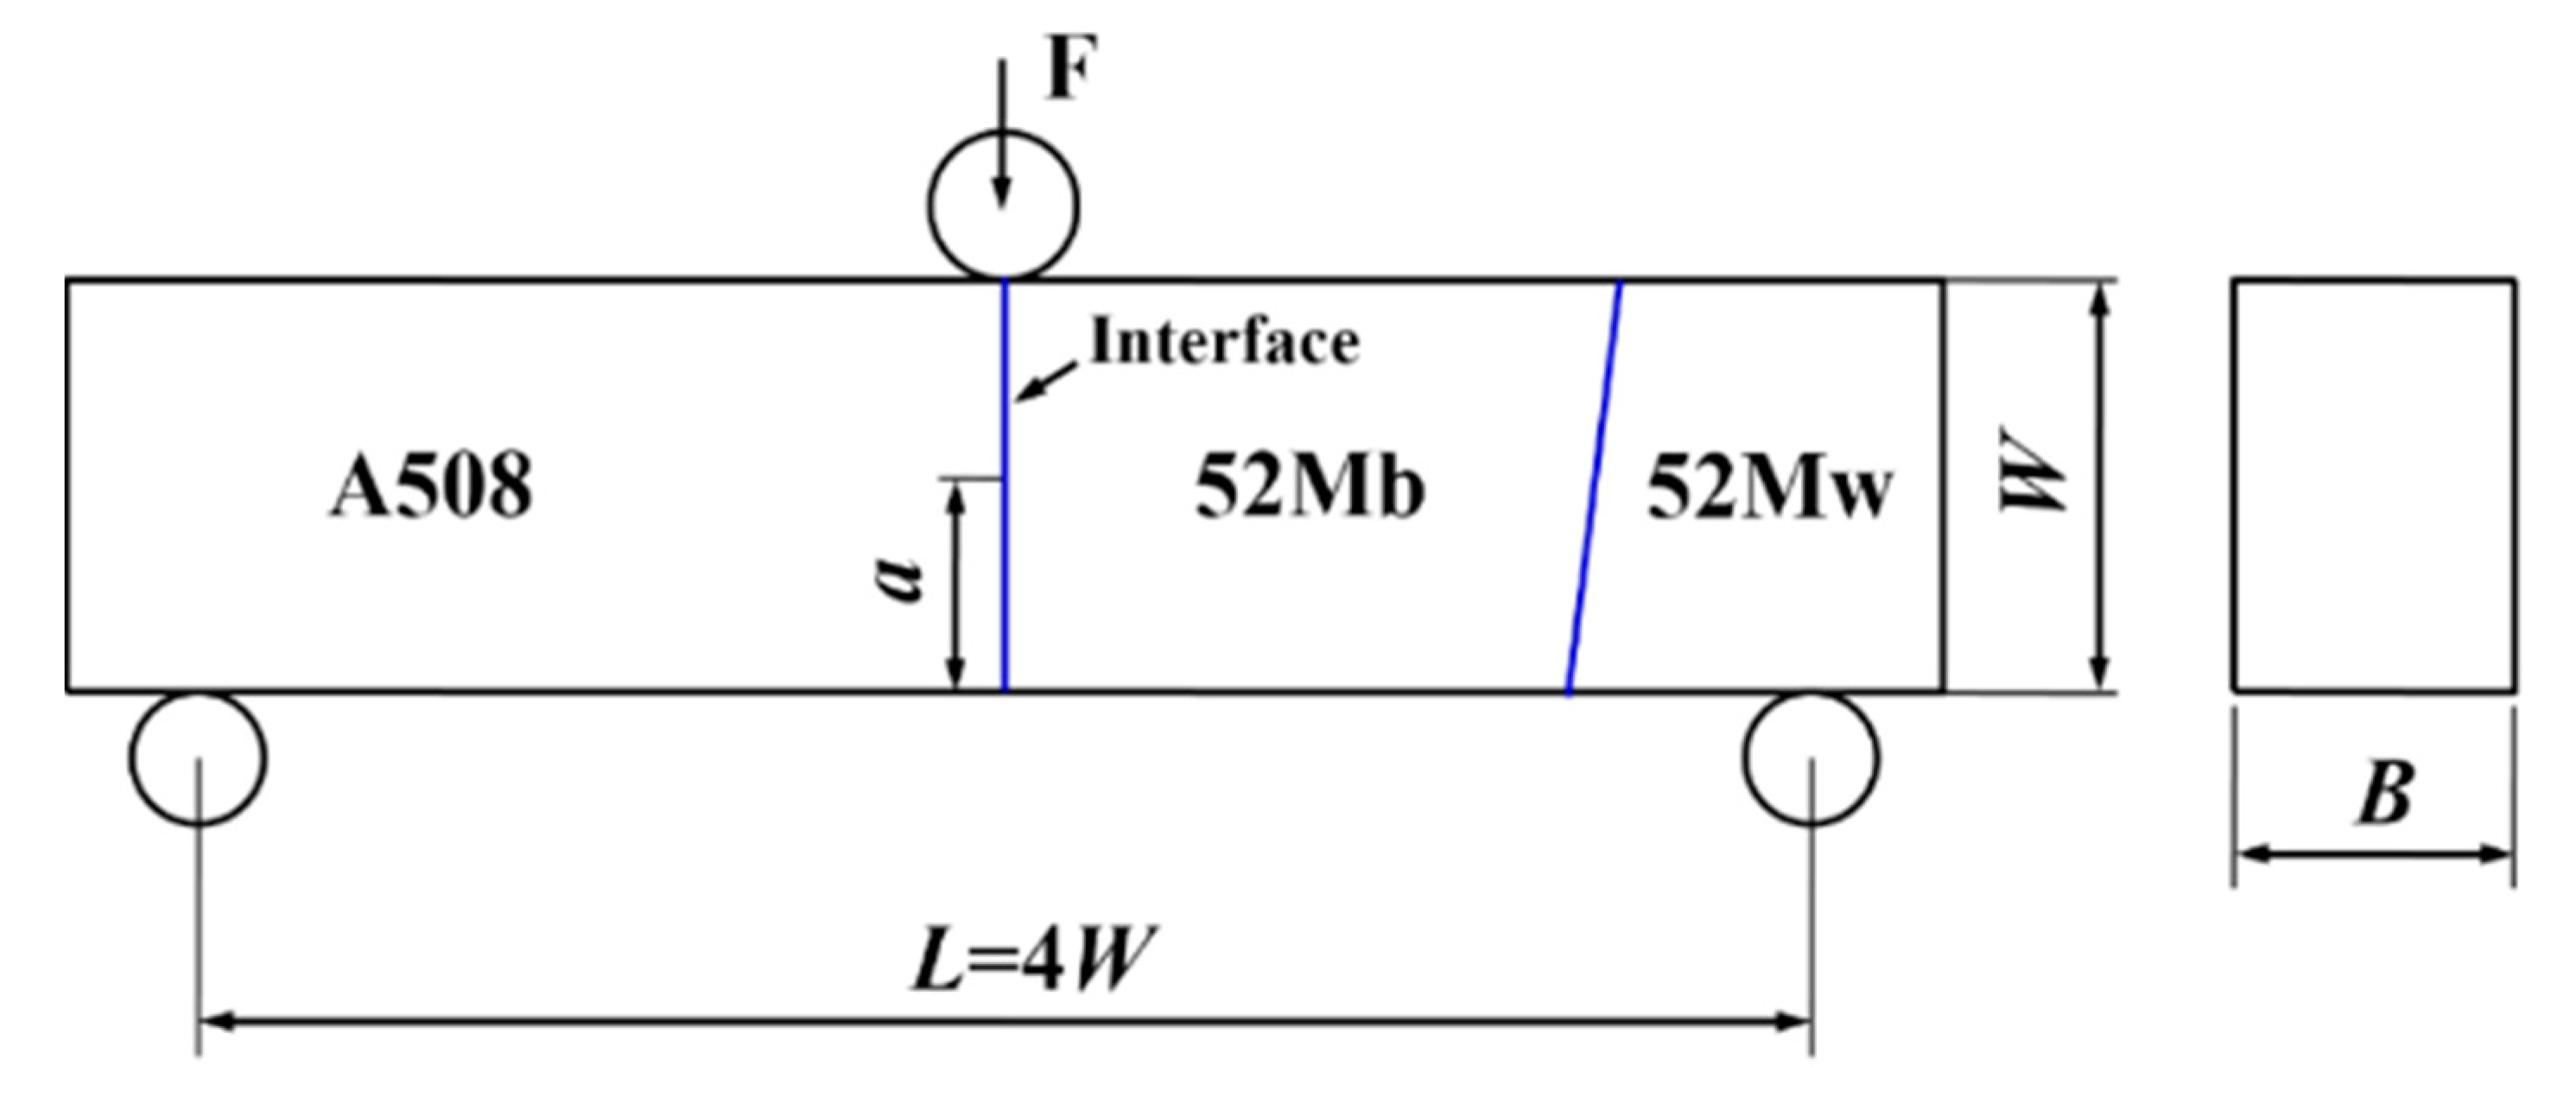
The SENB (singe edge notched bend) specimen was selected to study the fracture behavior of the DMWJ affected by strength mismatch. The geometry and loading configuration are shown in Figure 3. The specimen width is 14.4 mm (W = 14.4 mm), the specimen thickness is 12 mm (B = 12 mm), the initial crack is 7.2 mm (a = 7.2 mm and a/W = 0.5), and the specimen span is 57.6 mm (L = 57.6 mm and L = 4 W).
To obtain different strength mismatches, the true stress-strain curves of the HAZ, FZ, and NIZ were changed, respectively. When the true stress-strain curve of one of three zones was changed, the true stress-strain curves of subareas in this zone were changing with the same proportion, and the stress-strain curves of the other two zones remain unchanged.
Under the same true strain, the ratio of changed true stress to unchanged true stress is defined as strength mismatch coefficient Ms. The change range of Ms are 0.5, 0.6, 0.7, 0.8, 0.9, 1.0, 1.2, 1.4, 1.6, 1.8, and 2.0.
2.3. GTN Damage Model
To obtain the fracture behavior of the DMWJ under different strength mismatches, the FEM (finite element method) based on the GTN (Gurson-Tvergaard-Needleman) damage model was selected. The GTN model was firstly proposed by Gurson in the year 1977 and then modified by Tvergaard and Needleman in the year 1984. The yield function of the GTN model has the following form:
where σm is the hydrostatic stress, σeq is the von Mises equivalent stress, and σf is the flow stress of the “voidless” matrix material. The q1, q2, and q3 are phenomenological based parameters, which are used to consider the interaction between adjacent voids. The void volume fraction f* is the substitute of f in the original equation, which is used to take into account the gradual loss of the stress carrying capability of the material due to void coalescence. The void coalescence occurs when the void volume fraction f reaches the critical value fc, and the fracture occurs when the f reaches the critical failure void volume fraction fF. This GTN damage model has been implemented in ABAQUS code as a user material subroutine, and is widely used to simulate and predict the crack initiation and propagation.
Generally, the GTN model has nine parameters: the constitutive parameters q1, q2, and q3, the void nucleation parameters fN, εΝ, and SN, the initial void volume fraction f0, the critical void volume fraction fC and the final failure parameter fF, which have been listed in the Table 1 [32].
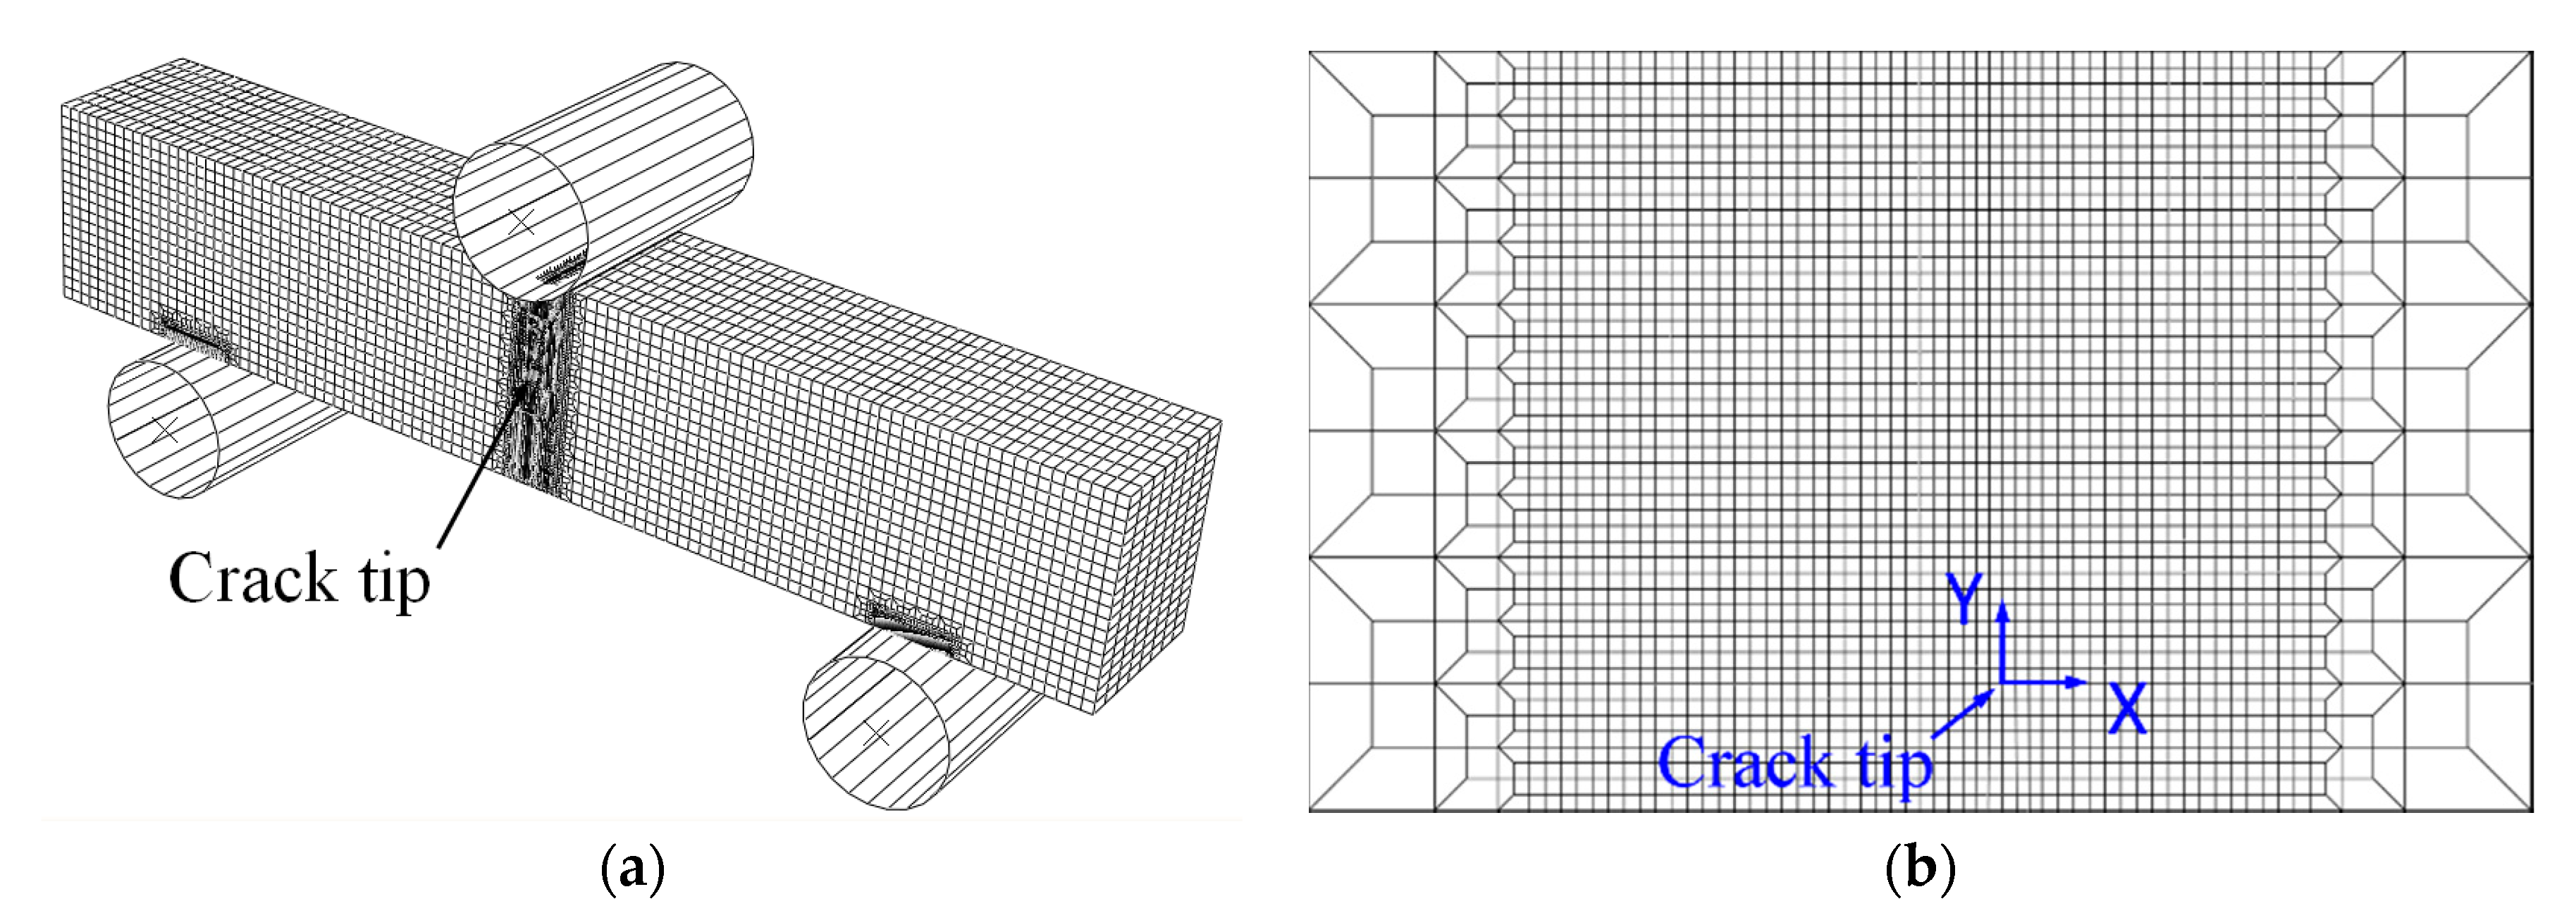
The finite element code ABAQUS was selected in this study. The 3D eight-node isoperimetric elements with reduced integration (C3D8R) were used. In addition, the surface-to-surface contact (explicit) interaction type was selected. And the sliding formulation is finite sliding, the mechanical constraint formulation is kinematic contact method. Figure 4a shows the typical whole meshes of the SENB specimen, and Figure 4b shows the local meshes at the crack tip. The minimum mesh size at the crack tip is 0.1 mm × 0.1 mm [33]. The typical model contains 88,112 elements and 101,691 nodes.
A load roll is applied at the top and center of the SENB specimen, and two back-up rolls are applied at the bottom of the SENB specimen. The loading is applied at the load roll by prescribing a displacement of 6 mm, and the two back-up rolls are fixed by control displacement and rotation. The load versus load-line displacement curve can be obtained from the FEM simulation. With instantaneous crack lengths obtained at each loading point, a crack growth resistance curve can be determined, as specified in ASTM E1820 [34].
3. Results and Discussion
3.1. The Changing of Strengh Mismatch in HAZ Effect on the Fracture Behavior of DMWJ
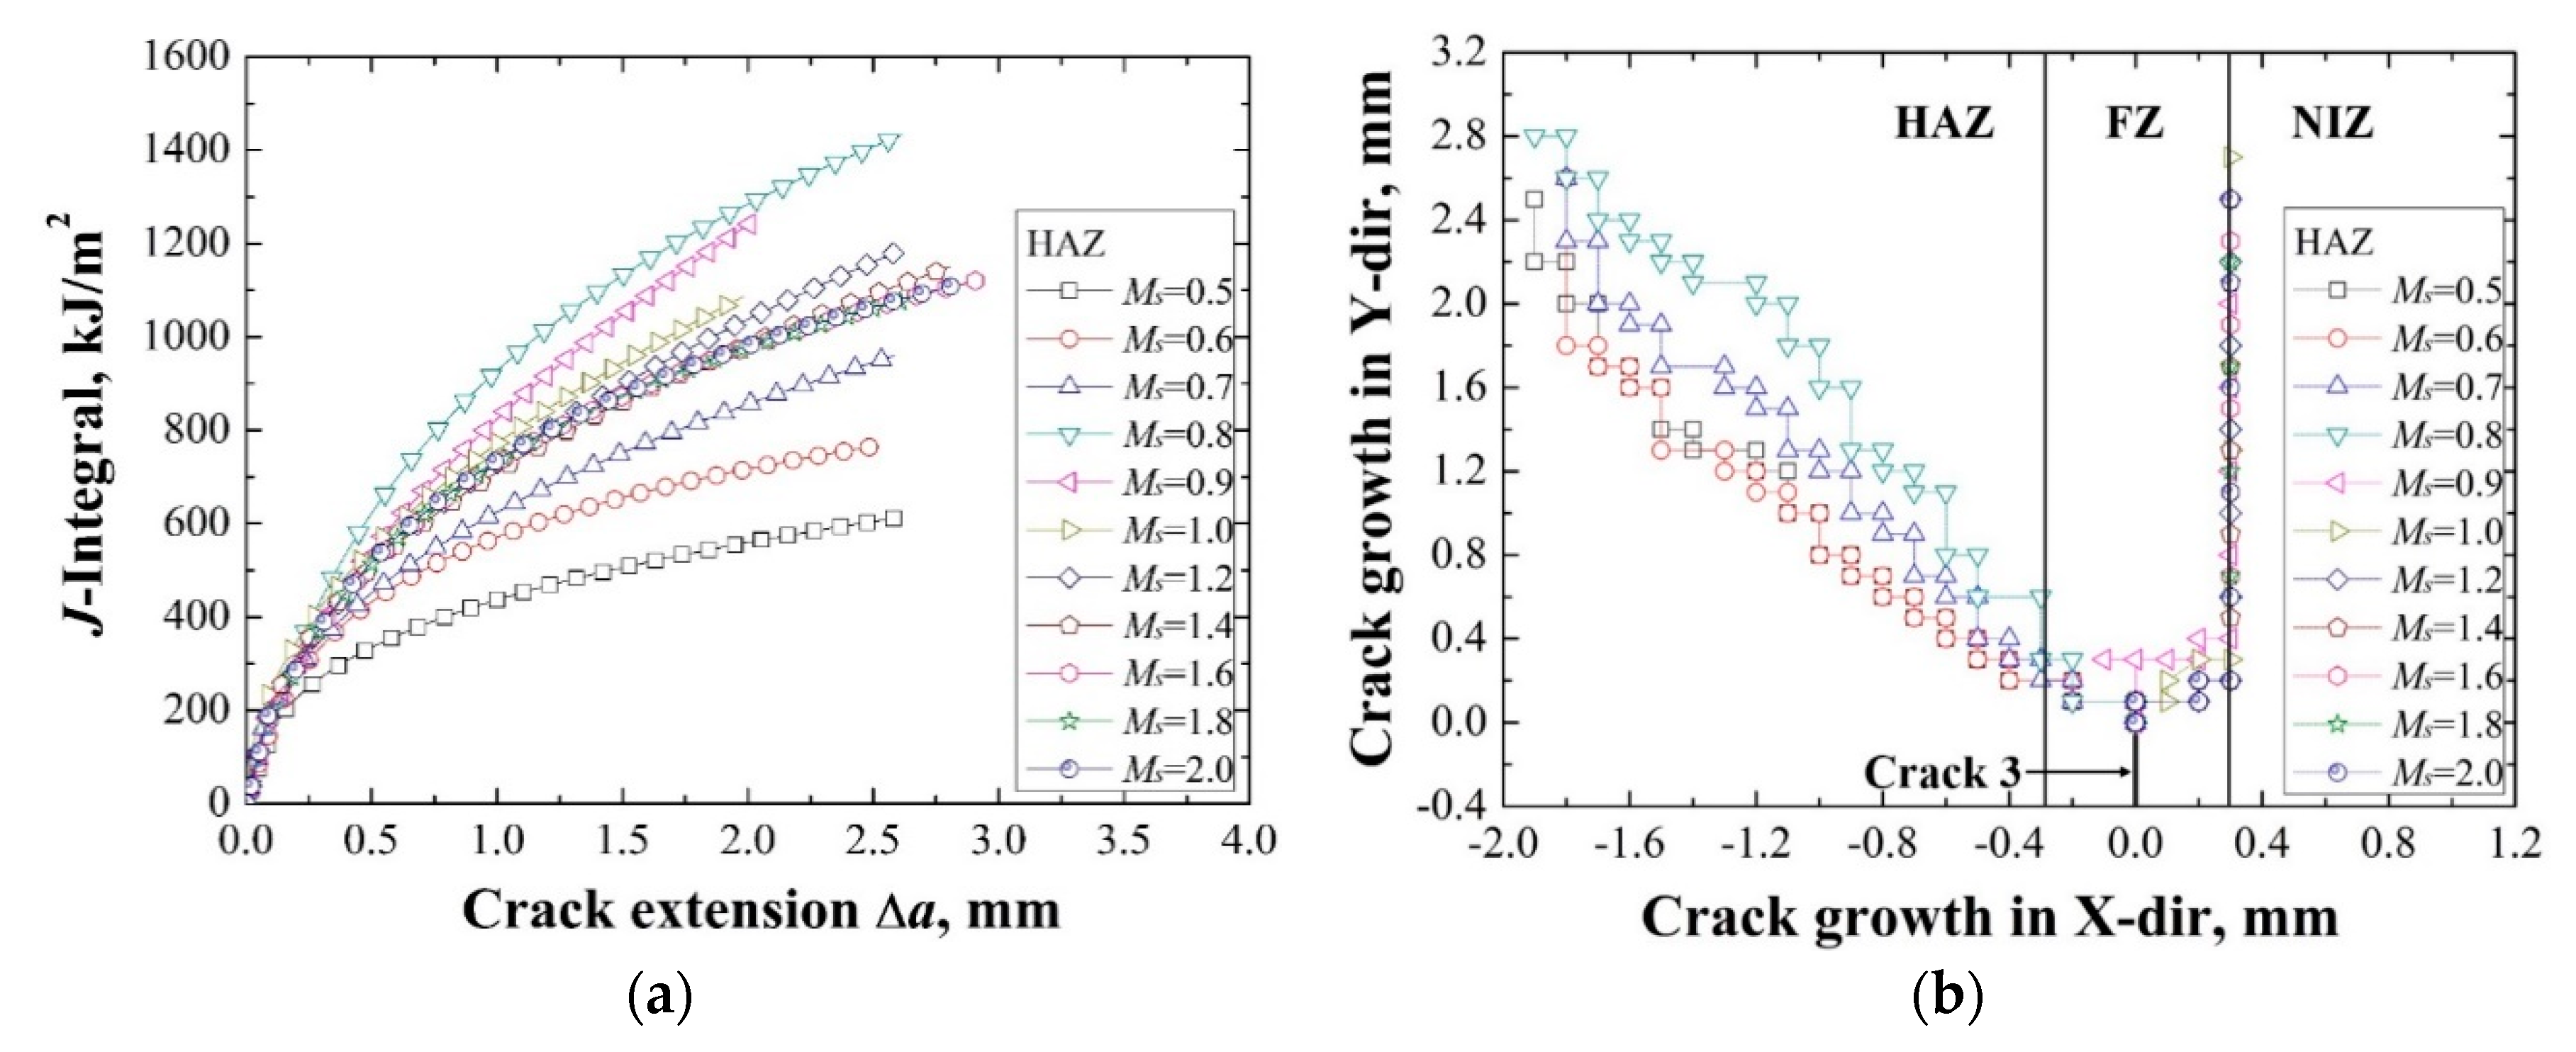
Figure 5 shows the J–R curves and crack growth paths of the DMWJ when the strength of HAZ was changed individually. It can be found from Figure 5a that the J–R curves of the DMWJ increase firstly then decrease with increasing of the strength mismatch coefficient Ms. When the Ms = 0.8, the DMWJ has the highest J–R curve, which means that decreasing the strength of HAZ appropriately on the present basis will increase the fracture resistance of the DMWJ. When the Ms ≥ 1.6, the J–R curves tend to be stable and will not change with increasing of the Ms. That is, increasing the strength of HAZ excessively is invalid for the increasing of fracture resistance.
It can also be found from Figure 5b that when the Ms ≤ 0.8, the crack has a deviation path towards the left side, and propagates in the HAZ along the direction of 45°. When the Ms > 0.8, the crack has a deviation path towards the right side, and propagates along the FZ/NIZ interface. It shows that the crack growth paths deviate to the low-strength material side, and are mainly controlled by local strength mismatch. When the Ms ≤ 0.8, the strength of D zone at the left side of crack is lower than the strength of F zone at the right side of crack, the crack has a deviation path towards the left side; when the Ms > 0.8, the strength of F zone at the right side of crack is lower than the strength of D zone at the left side of crack, the crack has a deviation path towards the right side. It is consistent with the results of literatures [30,35].
3.2. The Changing of Strengh Mismatch in FZ Effect on the Fracture Behavior of DMWJ
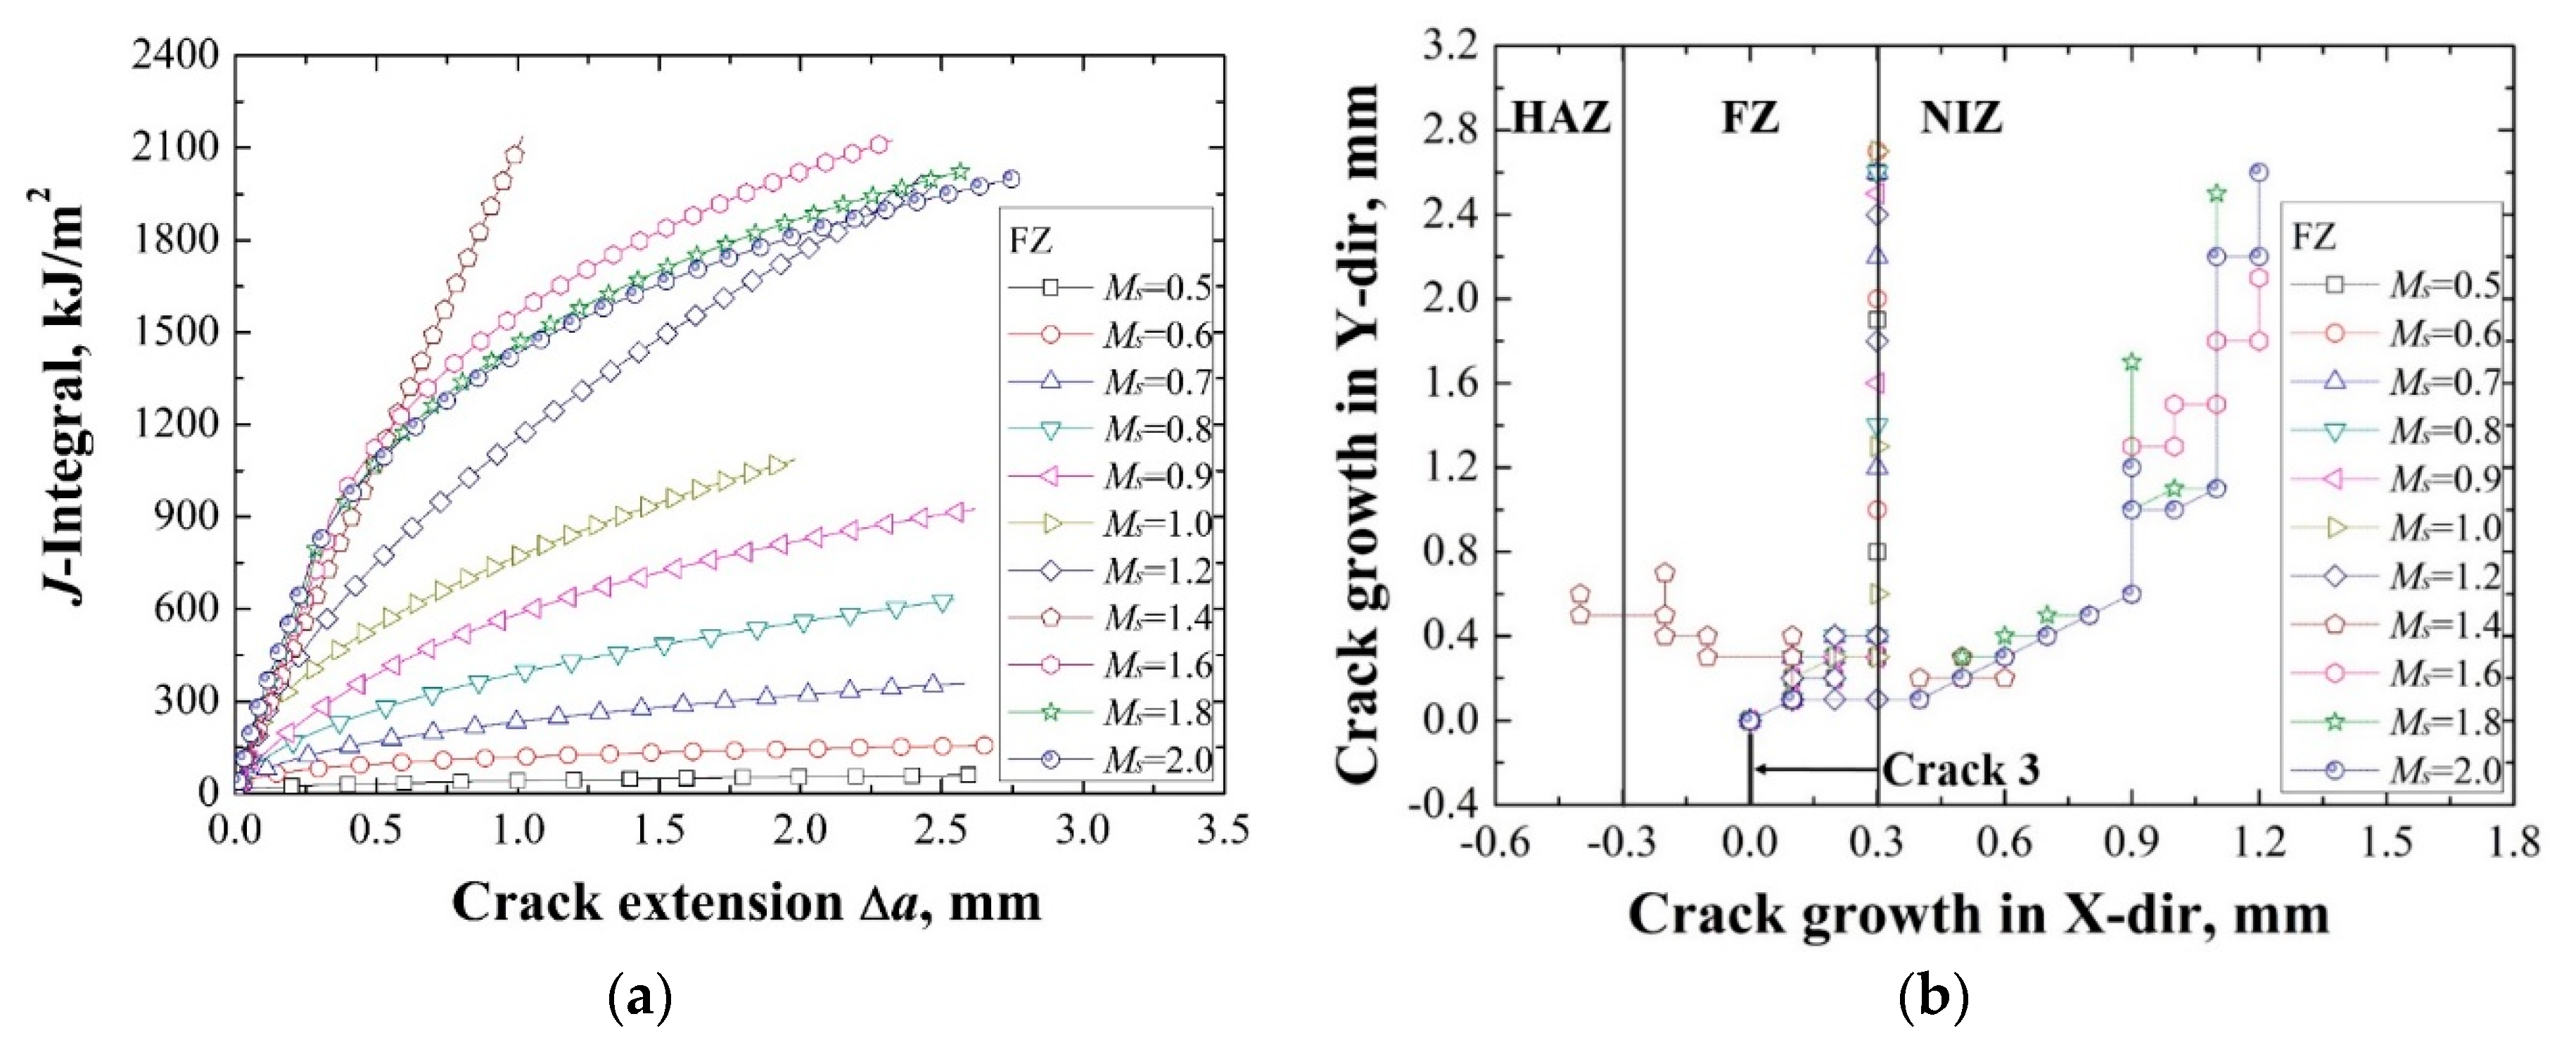
Figure 6 shows the J–R curves and crack growth paths of the DMWJ when the strength of FZ was changed individually. It can be found from Figure 6a that the J–R curves of the DMWJ increase firstly then decrease with increasing of the strength mismatch coefficient Ms. When the Ms = 1.4, the DMWJ has the highest J–R curve, which means that the strength of FZ still has much room for improvement on the present basis. When the Ms ≥ 1.8, the J–R curves tend to be stable and will not change with increasing of the Ms. That is, increasing the strength of FZ excessively is invalid also for the increasing of fracture resistance.
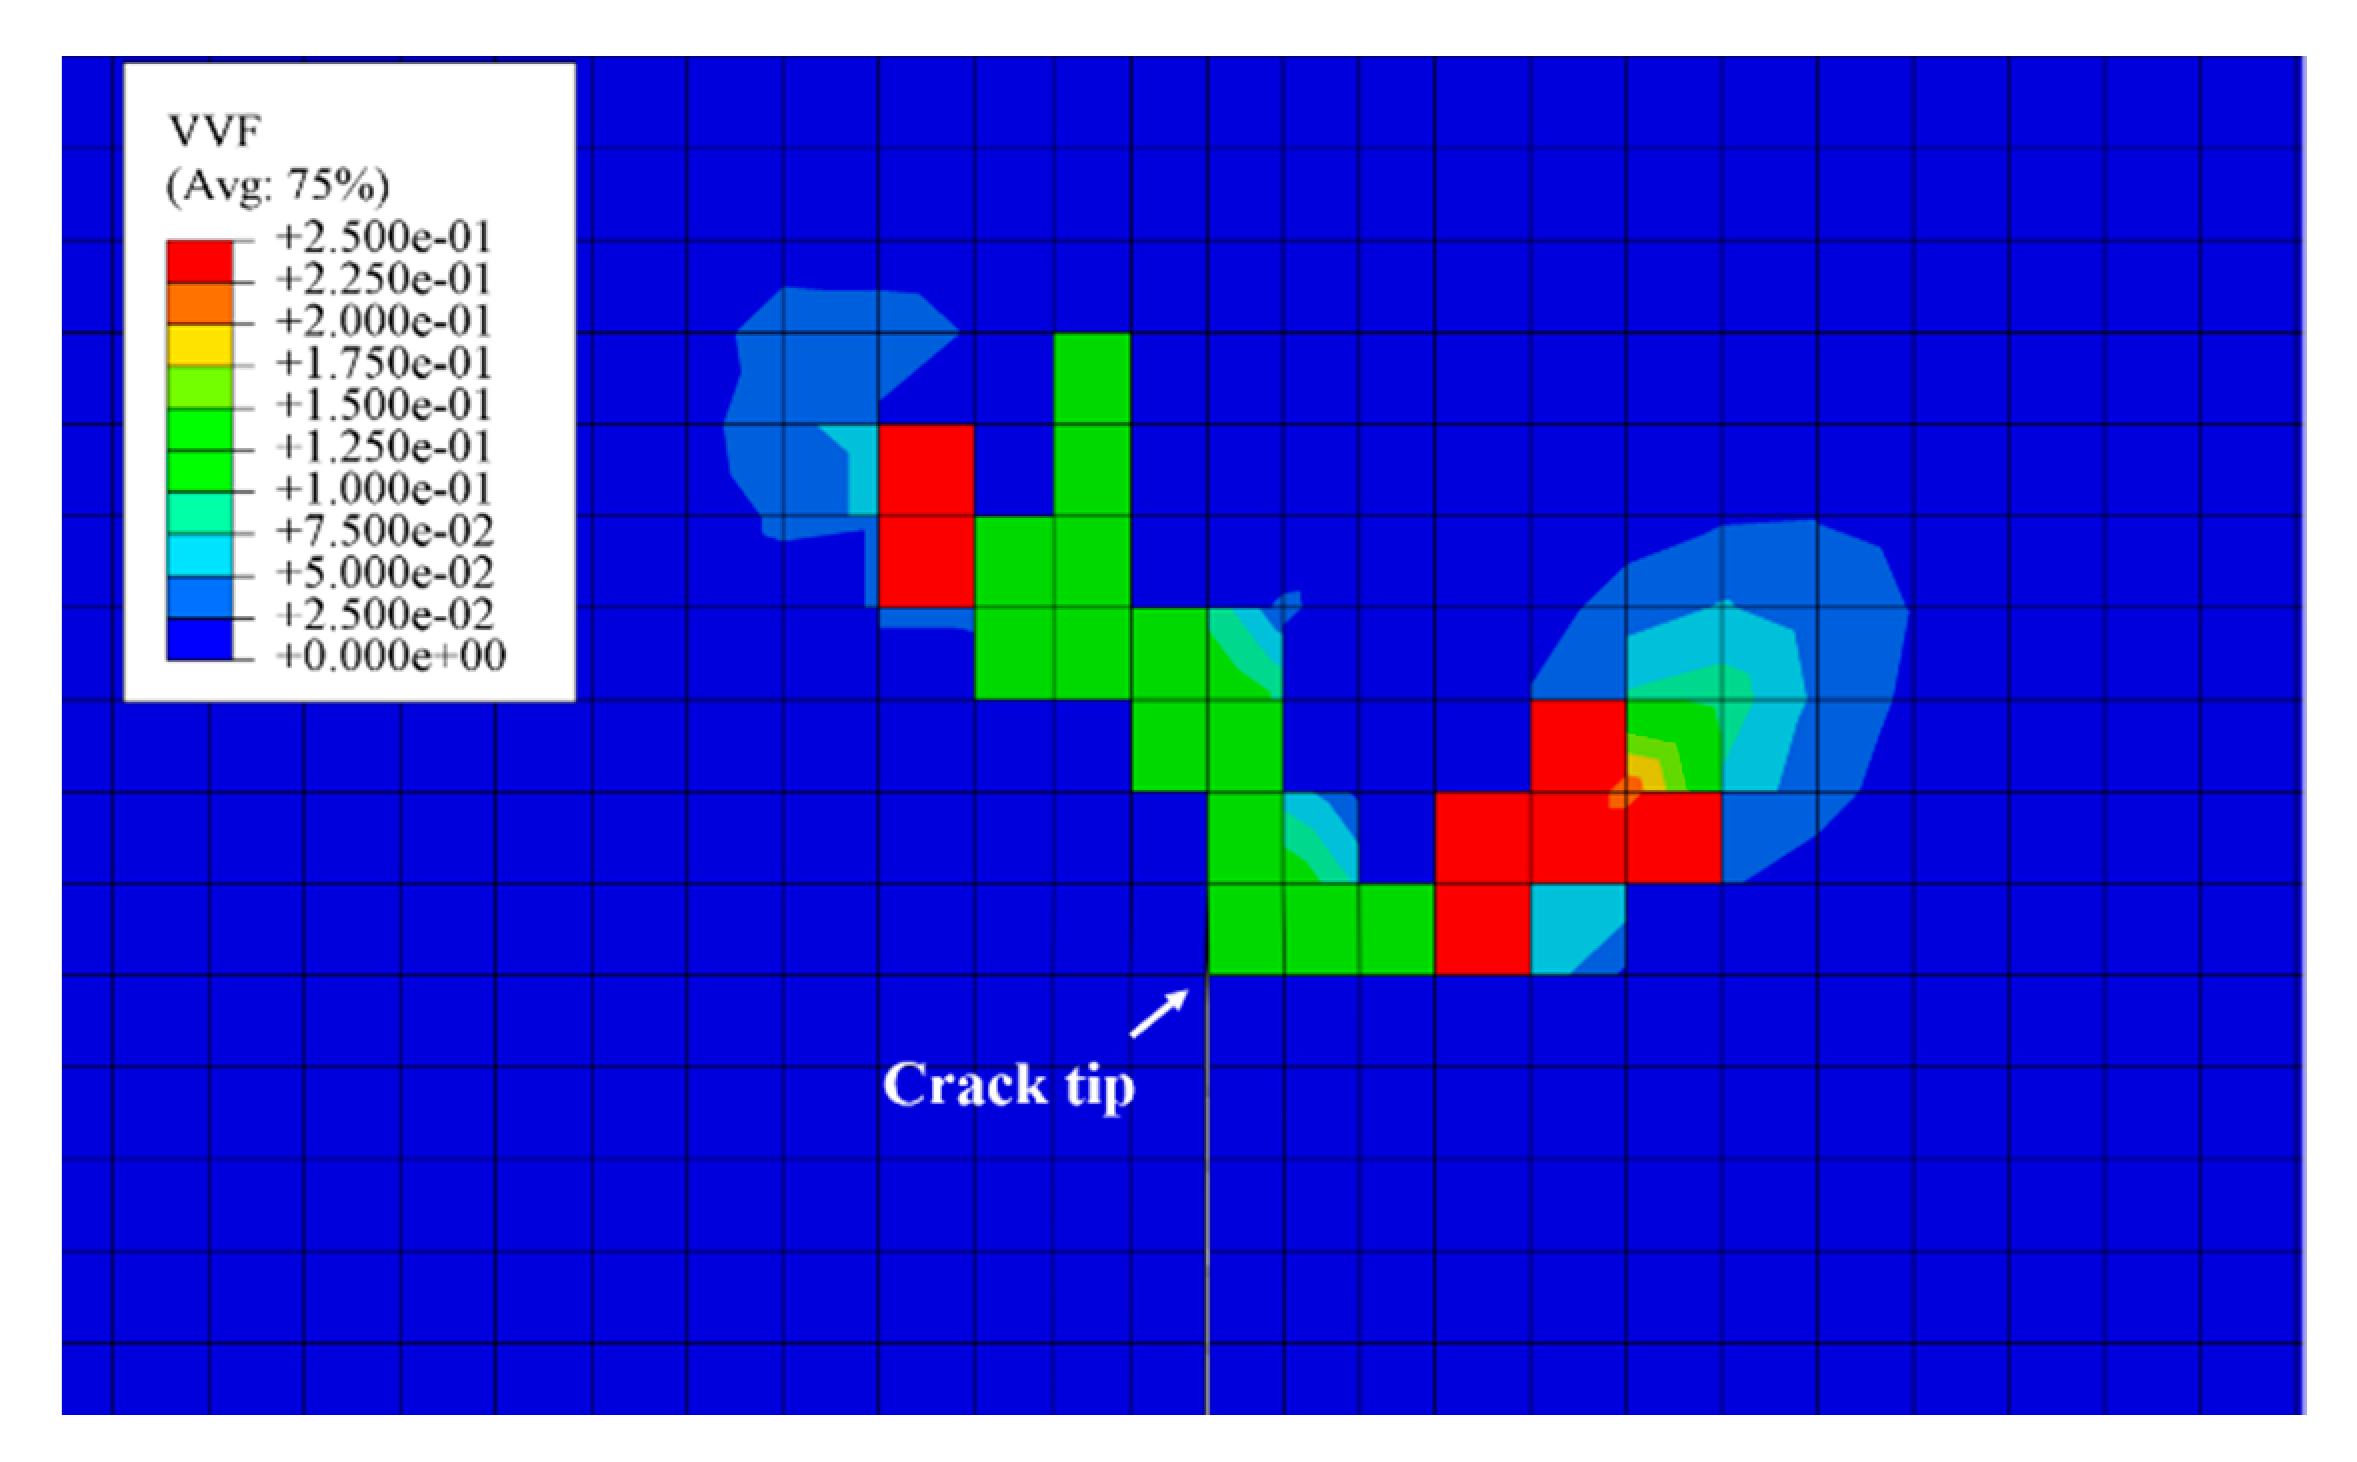
It can also be found from Figure 6b that when the Ms < 1.4, the crack has a deviation path towards the right side, and propagates along the FZ/NIZ interface. When the Ms = 1.4, there is a crack bifurcation phenomenon. The crack has a deviation path towards the right side firstly, and then propagates to both left and right sides at the same time, as shown in Figure 7. The Figure 7 shows the VVF (void volume fraction) of the elements, which reflects the crack growth path and crack growth length of the specimen. During the loading process, the element will be regarded as losing its effectiveness when the VVF of the element reaches to the final failure parameter fF (as shown in Table 1), and the crack will be regarded as extending an element length. For the elements in the FZ zone, the fF is 0.15, the element color is green in the Figure 7 when the element losing its effectiveness; for the elements in the HAZ and NIZ zones, the fF is 0.25, the element color is red in the Figure 7 when the element losing its effectiveness. Because the element length at the crack tip is known (0.1 mm), thus, the crack growth length can be calculated by counting the number of elements who lose effectiveness. When the Ms > 1.4, the crack has a deviation path towards the right side, and propagates in the NIZ along the direction of 45°.
It is also caused by the local strength mismatch. Because the crack locates in the middle of the FZ, the essence of the changing of strength mismatch in FZ is the interaction effect of D, E, and F zones in Figure 2a. Because the strength of D zone at the left side of crack is higher than the strength of F zone at the right side of crack, the crack deviated to the right side generally. When the Ms < 1.4, the strength of E zone increases with increasing of the Ms, but the strength mismatch between E and F is not enough to precipitate the crack growth path deviates from the interface, thus, the crack has a deviation path towards the right side, and propagates along the FZ/NIZ interface. When the Ms = 1.4, the mismatch between D and E and the mismatch between E and F are similar, and the crack has a bifurcation phenomenon under the competition. When the Ms > 1.4, there is a high mismatch between E and F. Dominant by the high strength mismatch, the crack penetrates the FZ/NIZ interface and propagates in the NIZ along the direction of 45°.
3.3. The Changing of Strengh Mismatch in NIZ Effect on the Fracture Behavior of DMWJ
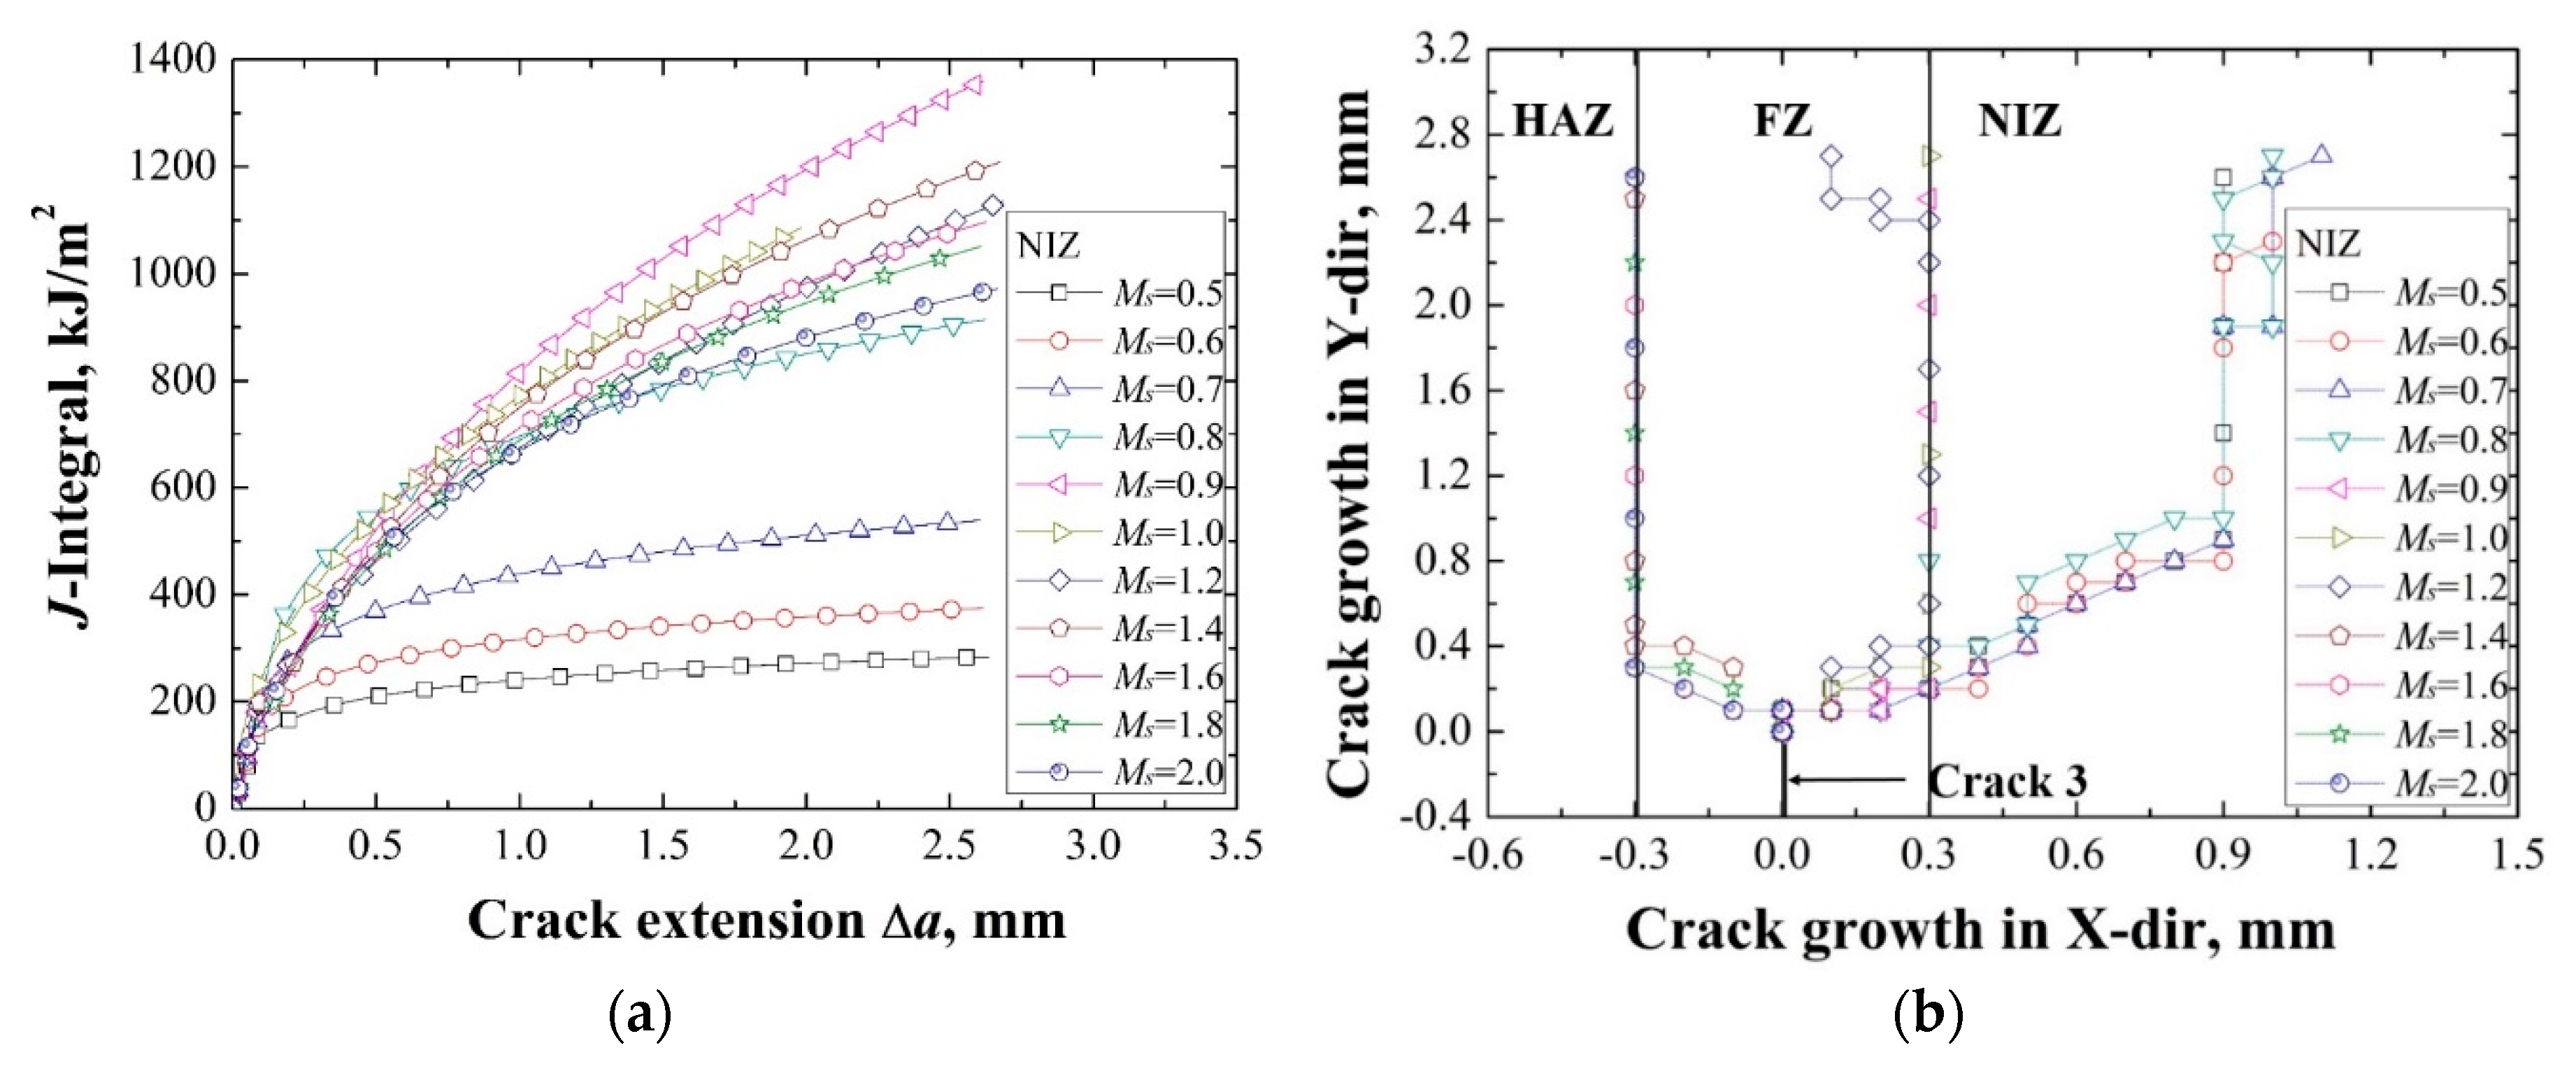
Figure 8 shows the J–R curves and crack growth paths of the DMWJ when the strength of NIZ was changed individually. It can be found from Figure 8a that the J–R curves of the DMWJ increase firstly then decrease with increasing of the strength mismatch coefficient Ms. When the Ms = 0.9, the DMWJ has the highest J–R curve, which means that decreasing the strength of NIZ appropriately on the present basis will increase the fracture resistance of DMWJ. When the Ms = 2, the J–R curve still has not to be stable and decreases with increasing of the Ms.
It can also be found from Figure 8b that when the Ms < 0.9, the crack has a deviation path towards the right side, and propagates in the FZ and NIZ along the direction of 45°. When 0.9 ≤ Ms < 1.4, the crack has a deviation path towards the right side, and propagates along the FZ/NIZ interface. When the Ms ≥ 1.4, the crack has a deviation path towards the left side, and propagates along the HAZ/FZ interface.
The same as the previous analysis in Section 3.2, it is also caused by the local strength mismatch. When the Ms < 0.9, there is a high mismatch between E and F. Dominant by the high strength mismatch, the crack penetrates the FZ/NIZ interface and propagates in the NIZ along the direction of 45°. With increasing of the strength of NIZ, the mismatch between E and F decreases. When 0.9 ≤ Ms < 1.4, the crack does not have enough driving force (which derived from the strength mismatch) to penetrate the interface, and the crack propagates along the FZ/NIZ interface. With increasing of the strength of NIZ, when the Ms ≥ 1.4, the strength of F zone at the right side of crack is higher than the strength of D zone at the left side of crack, the crack has a deviation path towards the left side.
4. The Optimizing of the Local Strength Mismatch of DMWJ
Based on the results above, when the strengths of HAZ, FZ and NIZ are changed independently, the DMWJ has the highest J–R curve at:
- Ms(HAZ):Ms(FZ):Ms(NIZ) = 0.8:1:1;
- Ms(HAZ):Ms(FZ):Ms(NIZ) = 1:1.4:1;
- Ms(HAZ):Ms(FZ):Ms(NIZ) = 1:1:0.9,
respectively. In order to obtain the best strength matching and the highest J–R curve, four sets of strength matching designs were carried out as follows:
- Ms(HAZ):Ms(FZ):Ms(NIZ) = 0.8:1.12:1.008;
- Ms(HAZ):Ms(FZ):Ms(NIZ) = 1.12:1.4:1.26;
- Ms(HAZ):Ms(FZ):Ms(NIZ) = 1.008:1.26:0.9;
- Ms(HAZ):Ms(FZ):Ms(NIZ) = 0.8:1.4:0.9.
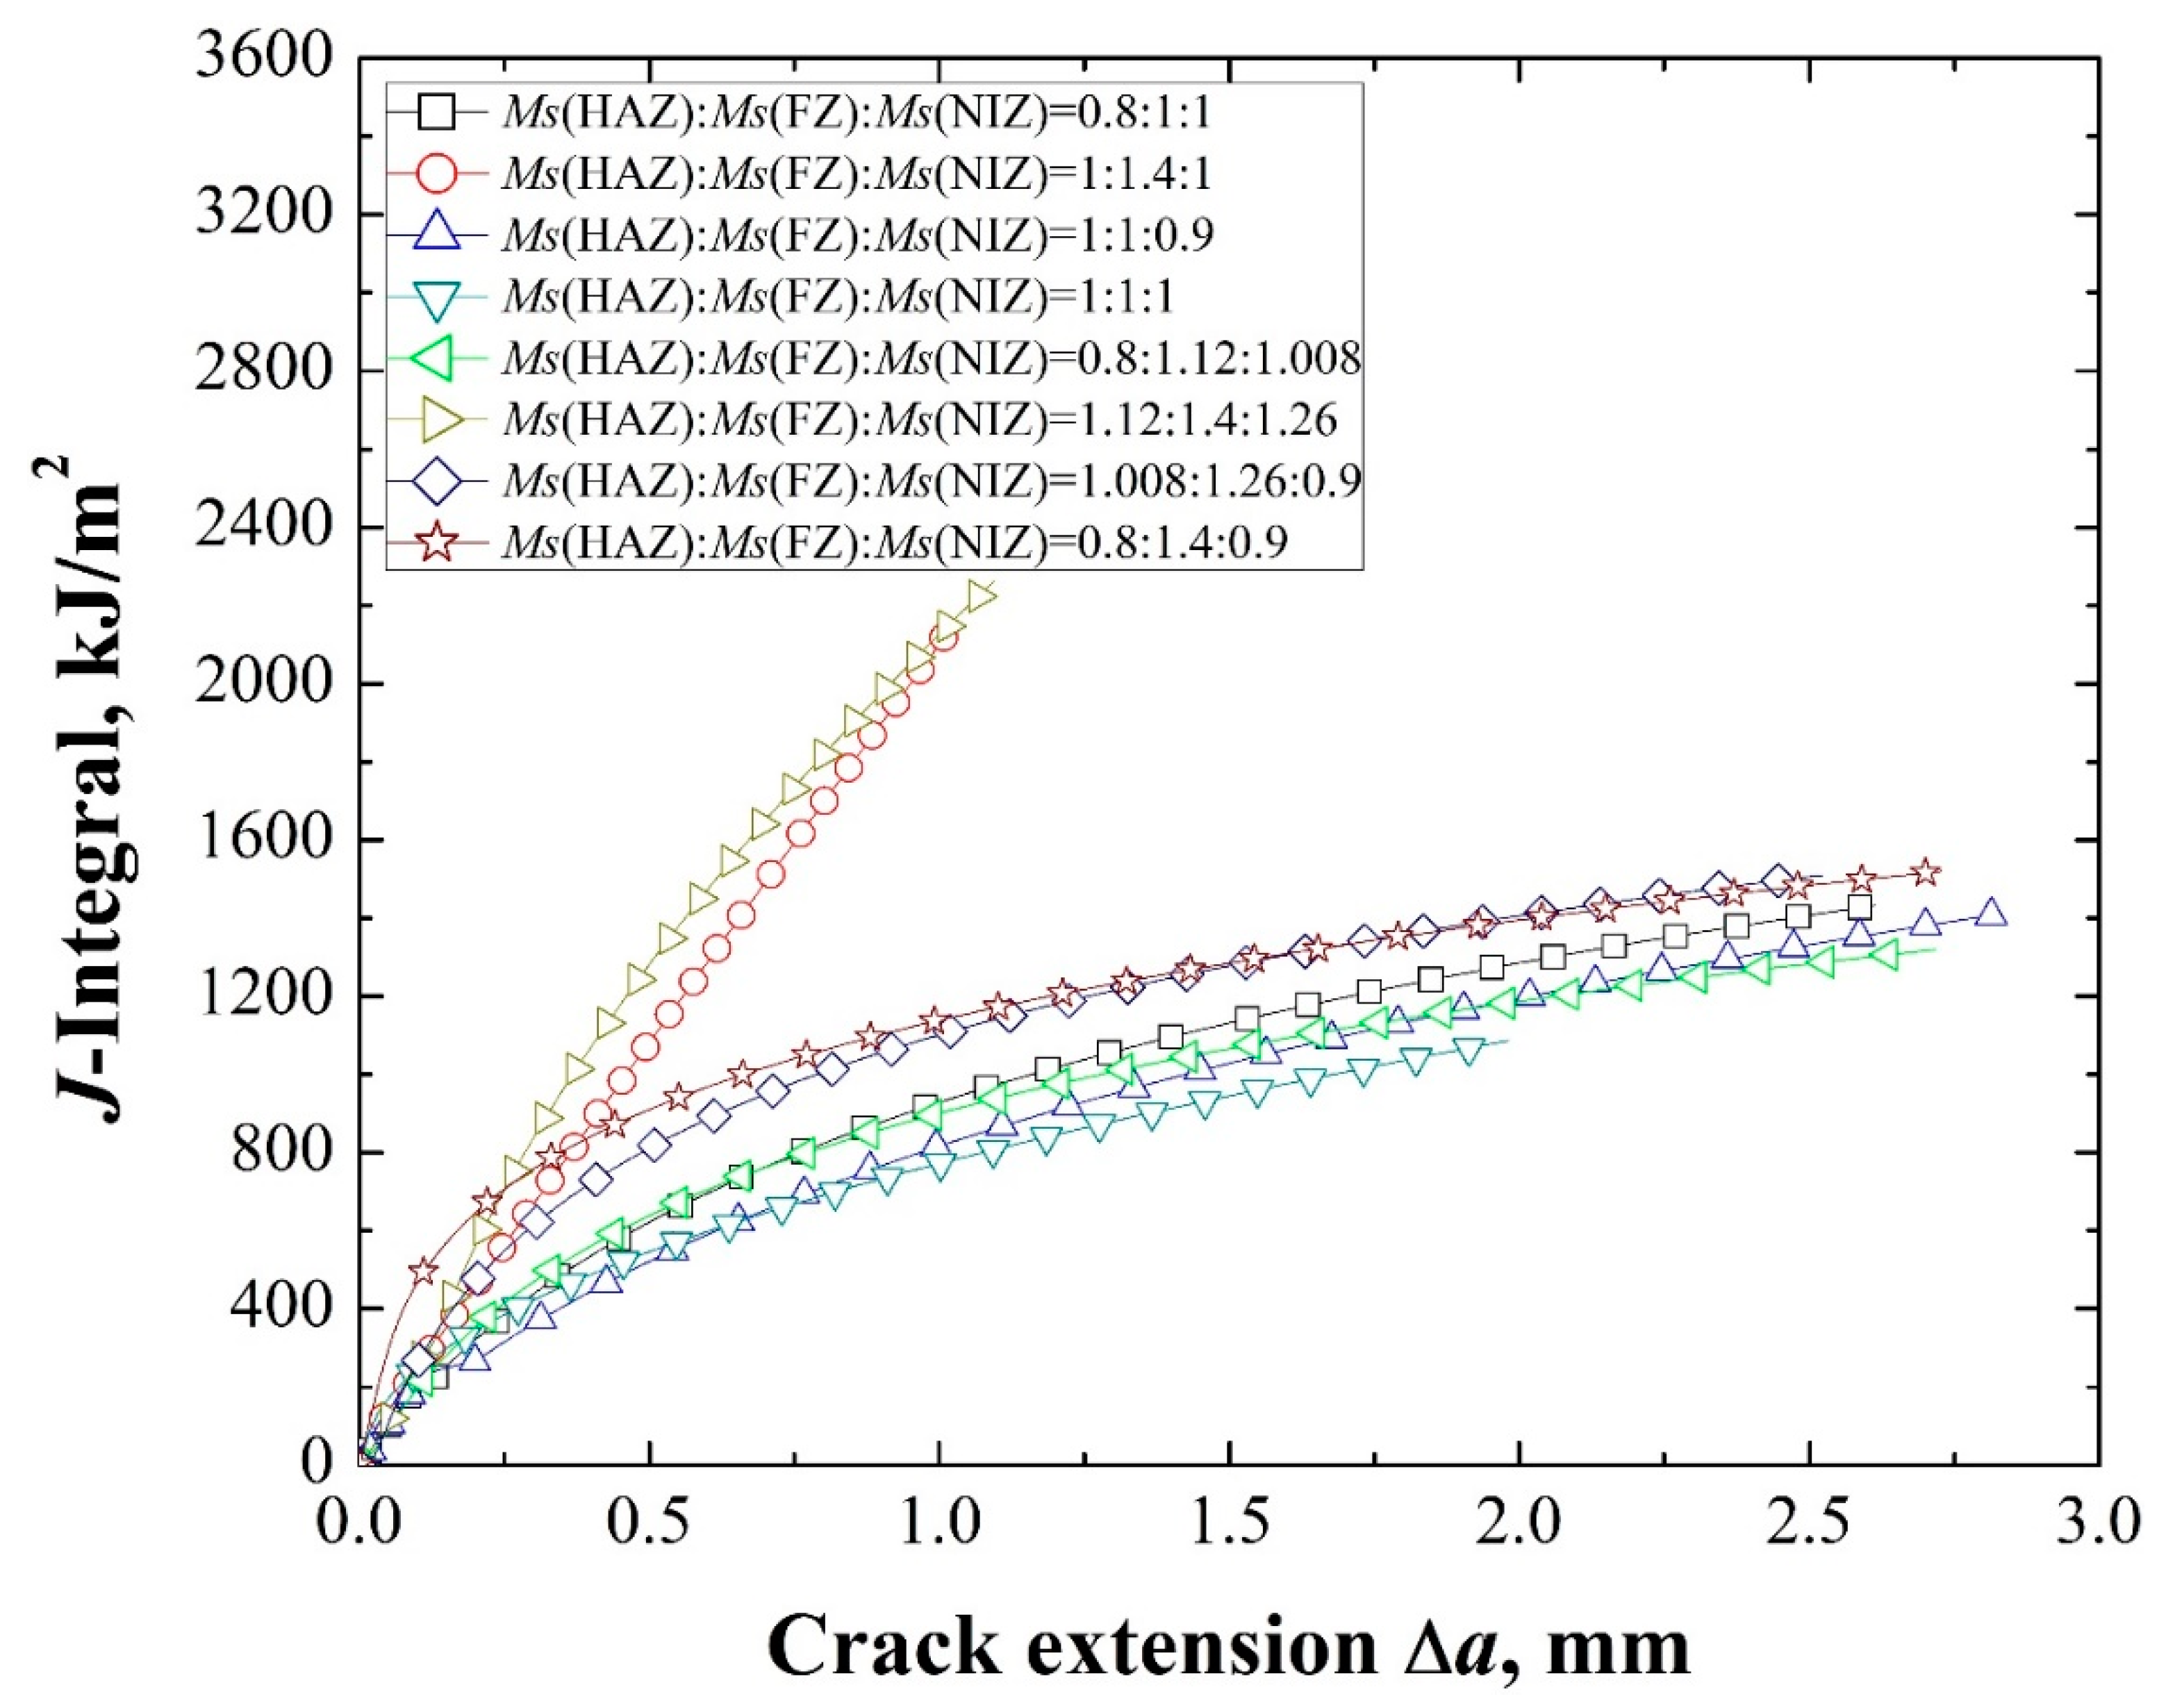
And then, the J–R curves of the four sets of DMWJs were obtained and compared with other J–R curves, including the J–R curves when the strengths of HAZ, FZ, and NIZ were changed independently and the J–R curve of the real DMWJ, as shown in Figure 9.
It can be seen from Figure 9 that the J–R curves of the seven sets of optimized DMWJs are higher than the J–R curve of the real DMWJ. When the
- Ms(HAZ):s(FZ):Ms(NIZ) = 1.12:1.4:1.26
and
- Ms(HAZ):Ms(FZ):Ms(NIZ) = 1:1.4:1,
the DMWJs have the highest J–R curves. Which means that increasing the strength of FZ will increase the J–R curve obviously, and will obtain the best results when the strengths of HAZ, FZ, and NIZ were wholly increased. But, the two highest J–R curves are similar, considering with the cost, it is suggested that the J–R curve of the DMWJ can be improved only by increasing the strength of the FZ.
In general, the results above show that the strength mismatch obviously effects on the J–R curve and crack growth path of DMWJ. As the weakest position of the nuclear power plant, the optimizing of the local strength mismatch of DMWJ is significant for the safety of the nuclear power plant. The optimizing design of the local strength mismatch of DMWJ needs to be further investigated by experiment.
5. Conclusions
- (1)
- With increasing of the strength mismatch coefficient Ms, the J–R curve of DMWJ increases firstly then decreases, and tends to be stable when the Ms increases to a certain value.
- (2)
- Decreasing the strength of HAZ and NIZ and increasing the strength of FZ increase the fracture resistance of the DMWJ. When the strengths of the HAZ, FZ, and NIZ are changed independently, the DMWJ has the highest J–R curve at the Ms(HAZ) = 0.8, Ms(FZ) = 1.4, and Ms(NIZ) = 0.9, respectively.
- (3)
- Increasing the strength of FZ increases the J–R curve obviously. When the Ms(HAZ):Ms(FZ):Ms(NIZ) = 1.12:1.4:1.26 and Ms(HAZ):Ms(FZ):Ms(NIZ) = 1:1.4:1, the DMWJs have the highest J–R curves. It is suggested that the J–R curve of the DMWJ can be improved only by increasing the strength of the FZ.
Author Contributions
Conceptualization, J.Y.; Methodology, J.Y.; Software, L.W.; Validation, J.Y. and L.W.; Writing-Original Draft Preparation, L.W.; Writing-Review and Editing, J.Y.
Funding
This research was funded by [National Natural Science Foundation of China] grant number [51605292].
Conflicts of Interest
The authors declare no conflict of interest.
References
- Wang, S.; Ding, J.; Ming, H.; Zhang, Z.; Wang, J. Characterization of low alloy ferritic steel–Ni base alloy dissimilar metal weld interface by SPM techniques, SEM/EDS, TEM/EDS and SVET. Mater. Charact. 2015, 100, 50–60. [Google Scholar] [CrossRef]
- Ding, J.; Zhang, Z.; Wang, J.; Han, E.H.; Tang, W.; Zhang, M.; Sun, Z. Micro-characterization of dissimilar metal weld joint for connecting pipenozzle to safe-end in generation III nuclear power plant. Acta Metall. Sin. 2015, 51, 425–439. [Google Scholar] [CrossRef]
- Ming, H.L.; Wang, J.Q.; Han, E.H. Comparative study of microstructure and properties of low-alloy-steel/nickel-based-alloy interfaces in dissimilar metal weld joints prepared by different GTAW methods. Mater. Charact. 2018, 139, 186–196. [Google Scholar] [CrossRef]
- Ming, H.L.; Zhang, Z.M.; Wang, J.Q.; Han, E.H.; Wang, P.P.; Sun, Z.Y. Microstructure of a safe-end dissimilar metal weld joint (SA508-52-316L) prepared by narrow-gap GTAW. Mater. Charact. 2017, 123, 233–243. [Google Scholar] [CrossRef]
- Ming, H.L.; Zhu, R.L.; Zhang, Z.M.; Wang, J.Q.; Han, E.H.; Ke, W.; Su, M.X. Microstructure, local mechanical properties and stress corrosion cracking susceptibility of an SA508-52M-316LN safe-end dissimilar metal weld joint by GTAW. Mater. Sci. Eng. A-Struct. 2016, 669, 279–290. [Google Scholar] [CrossRef]
- Rathod, D.W.; Pandey, S.; Singh, P.K.; Prasad, R. Mechanical Properties Variations and Comparative Analysis of Dissimilar Metal Pipe Welds in Pressure Vessel System of Nuclear Plants. J. Press. Vessel Technol.-Trans. ASME 2016, 138, 529–540. [Google Scholar] [CrossRef]
- Rathod, D.W.; Singh, P.K.; Pandey, S.; Aravindan, S. Effect of buffer-layered buttering on microstructure and mechanical properties of dissimilar metal weld joints for nuclear plant application. Mater. Sci. Eng. A-Stract. 2016, 666, 100–113. [Google Scholar] [CrossRef]
- Hou, J.; Peng, Q.J.; Takeda, Y.; Kuniya, J.; Shoji, T.; Wang, J.Q.; Han, E.H.; Ke, W. Microstructure and mechanical property of the fusion boundary region in an Alloy 182-low alloy steel dissimilar weld joint. J. Mater. Sci. 2010, 45, 5332–5338. [Google Scholar] [CrossRef]
- Yang, J.; Wang, L. Fracture mechanism of cracks in the weakest location of dissimilar metal welded joint under the interaction effect of in-plane and out-of-plane constraints. Eng. Fract. Mech. 2018, 192, 12–23. [Google Scholar] [CrossRef]
- Wang, H.T.; Wang, G.Z.; Xuan, F.Z.; Tu, S.T. Numerical investigation of ductile crack growth behavior in a dissimilar metal welded joint. Nucl. Eng. Des. 2011, 241, 3234–3243. [Google Scholar] [CrossRef]
- Kirk, M.T.; Dodds, R.H. The influence of weld strength mismatch on crack-tip constraint in single edge notch bend specimens. Int. J. Fract. 1993, 63, 297–316. [Google Scholar] [CrossRef] [Green Version]
- Burstow, M.C.; Howard, I.C.; Ainsworth, R.A. The influence of constraint on crack tip stress fields in strength mismatched welded joints. J. Mech. Phys. Sol. 1998, 46, 845–872. [Google Scholar] [CrossRef]
- Cetinel, H.; Uyulgan, B.; Aksoy, T. The effect of yield strength mismatch on the fracture behavior of welded nodular cast iron. Mater. Sci. Eng. A-Struct. 2004, 387, 357–360. [Google Scholar] [CrossRef]
- Cetinel, H.; Aksoy, T. The effect of undermatching on crack tip constraint in a welded structure of nodular irons. J. Mater. Process. Technol. 2008, 198, 183–190. [Google Scholar] [CrossRef]
- An, G.B.; Ohata, M.; Mochizuki, M.; Bang, H.S.; Toyoda, M. Effect of strength mismatch on ductile crack initiation behavior from notch root under static loading. Adv. Fract. Strength. 2005, 297–300, 756–761. [Google Scholar] [CrossRef]
- Rakin, M.; Medjo, B.; Gubeljak, N.; Sedmak, A. Micromechanical assessment of mismatch effects on fracture of high-strength low alloyed steel welded joints. Eng. Fract. Mech. 2013, 109, 221–235. [Google Scholar] [CrossRef]
- Negre, P.; Steglich, D.; Brocks, W. Crack extension at an interface: Prediction of fracture toughness and simulation of crack path deviation. Int. J. Fract. 2005, 134, 209–229. [Google Scholar] [CrossRef]
- Samal, M.K.; Balani, K.; Seidenfuss, M.; Roos, E. An experimental and numerical investigation of fracture resistance behaviour of a dissimilar metal welded joint. Proc. Inst. Mech. Eng. Part C-J. Mech. Eng. Sci. 2009, 223, 1507–1523. [Google Scholar] [CrossRef]
- Zhang, Z.L. A sensitivity analysis of material parameters for the Gurson constitutive model. Fatigue Fract. Eng. Mater. Struct. 1996, 19, 561–570. [Google Scholar] [CrossRef]
- Fan, K.; Wang, G.; Yang, J.; Xuan, F.Z.; Tu, S.T. Numerical analysis of constraint and strength mismatch effects on local fracture resistance of bimetallic joints. Appl. Mech. Mater. 2015, 750, 24–31. [Google Scholar] [CrossRef]
- Fan, K.; Wang, G.Z.; Tu, S.T.; Xuan, F.Z. Effects of toughness mismatch on fracture behavior of bi-material interfaces. Procedia Eng. 2015, 130, 754–762. [Google Scholar] [CrossRef]
- Fan, K.; Wang, G.Z.; Xuan, F.Z.; Tu, S.T. Effects of work hardening mismatch on fracture resistance behavior of bi-material interface regions. Mater. Des. 2015, 68, 186–194. [Google Scholar] [CrossRef]
- Fan, K.; Wang, G.Z.; Tu, S.T.; Xuan, F.Z. Geometry and material constraint effects on fracture resistance behavior of bi-material interfaces. Int. J. Fract. 2016, 201, 143–155. [Google Scholar] [CrossRef]
- Wang, H.T.; Wang, G.Z.; Xuan, F.Z.; Liu, C.J. Numerical research of ductile crack growth behavior for dissimilar metal welded joint of nuclear pressure vessel. Nucl. Power Eng. 2012, 33, 36–40. [Google Scholar]
- Wang, H. Local fracture behavior in an Alloy 52M dissimilar metal welded joint in nuclear power plants. Nucl. Tech. 2013, 36, 142–147. [Google Scholar]
- Fan, K.; Wang, G.Z.; Xuan, F.Z.; Tu, S.T. Local failure behavior of a dissimilar metal interface region with mechanical heterogeneity. Eng. Fail. Anal. 2016, 59, 419–433. [Google Scholar] [CrossRef]
- Fan, K.; Wang, G.Z.; Xuan, F.Z.; Tu, S.T. Local fracture resistance behavior of interface regions in a dissimilar metal welded joint. Eng. Fract. Mech. 2015, 136, 279–291. [Google Scholar] [CrossRef]
- Xue, H.; Sun, J. Study on micro region of crack tip of welded joints under different matches of yield stress. Hot Work. Technol. 2016, 45, 239–245. [Google Scholar]
- Zhu, Z.Q.; Jing, H.Y.; Ge, J.G.; Chen, L.G. Effects of strength mis-matching on the fracture behavior of nuclear pressure steel A508-III welded joint. Mater. Sci. Eng. A-Struct. 2005, 390, 113–117. [Google Scholar] [CrossRef]
- Wang, H.T.; Wang, G.Z.; Xuan, F.Z.; Tu, S.T. An experimental investigation of local fracture resistance and crack growth paths in a dissimilar metal welded joint. Mater. Des. 2013, 44, 179–189. [Google Scholar] [CrossRef]
- Wang, H.T.; Wang, G.Z.; Xuan, F.Z.; Liu, C.J.; Tu, S.T. Local mechanical properties of a dissimilar metal welded joint in nuclear power systems. Mater. Sci. Eng. 2013, 568, 108–117. [Google Scholar] [CrossRef]
- Yang, J. Micromechanical analysis of in-plane constraint effect on local fracture behavior of cracks in the weakest locations of dissimilar metal welded joint. Acta Metall. Sin.-Engl. Lett. 2017, 30, 840–850. [Google Scholar] [CrossRef]
- Ostby, E.; Thaulow, C.; Zhang, Z.L. Numerical simulations of specimen size and mismatch effects in ductile crack growth-Part I: Tearing resistance and crack growth paths. Eng. Fract. Mech. 2007, 74, 1770–1792. [Google Scholar] [CrossRef]
- ASTM E1820-08a. Standard Test Method for Measurement of Fracture Toughness; American Society for Testing and Materials: Philadelphia, PA, USA, 2008. [Google Scholar]
- Yang, J.; Wang, G.Z.; Xuan, F.Z.; Tu, S.T.; Liu, C.J. An experimental investigation of in-plane constraint effect on local fracture resistance of a dissimilar metal welded joint. Mater. Des. 2014, 53, 611–619. [Google Scholar] [CrossRef]
Figure 1.
The dissimilar metal welded joint (DMWJ) (a) and the true stress-strain curves of the four materials composed of the DMWJ (b).
Figure 1.
The dissimilar metal welded joint (DMWJ) (a) and the true stress-strain curves of the four materials composed of the DMWJ (b).

Figure 2.
Different subareas in the A508/52 Mb interface region (a) and the true stress-strain curves of different subareas (b) [31].
Figure 2.
Different subareas in the A508/52 Mb interface region (a) and the true stress-strain curves of different subareas (b) [31].

Figure 3.
The geometry and loading configuration of the singe edge notched bend (SENB) specimen.

Figure 4.
The whole meshes of the SENB specimen (a) and the local meshes along the crack growth region (b).
Figure 4.
The whole meshes of the SENB specimen (a) and the local meshes along the crack growth region (b).

Figure 5.
The J–R curves (a) and the crack growth paths (b) at different strengths of HAZ.

Figure 6.
The J–R curves (a) and the crack growth paths (b) at different strengths of FZ.

Figure 7.
The crack bifurcation phenomenon when the Ms = 1.4.

Figure 8.
The J–R curves (a) and the crack growth paths (b) at different strengths of NIZ.

Figure 9.
The J–R curves of the DMWJ under different strength mismatches.


Table 1.
The GTN (Gurson-Tvergaard-Needleman) parameters of different material zones [32].
Table 1.
The GTN (Gurson-Tvergaard-Needleman) parameters of different material zones [32].
| Material | q1 | q2 | q3 | εΝ | SN | fN | f0 | fC | fF |
|---|---|---|---|---|---|---|---|---|---|
| A508 | 1.5 | 1 | 2.25 | 0.3 | 0.1 | 0.002 | 0.00008 | 0.04 | 0.25 |
| HAZ | 1.5 | 1 | 2.25 | 0.3 | 0.1 | 0.002 | 0.00015 | 0.04 | 0.25 |
| FZ | 1.5 | 1 | 2.25 | 0.3 | 0.1 | 0.008 | 0.0008 | 0.01 | 0.15 |
| NIZ | 1.5 | 1 | 2.25 | 0.3 | 0.1 | 0.002 | 0.00004 | 0.04 | 0.25 |
| 52 Mb | 1.5 | variable | 2.25 | 0.3 | 0.1 | 0.002 | 0.000001 | 0.04 | 0.25 |
| 52 Mw | 1.5 | 1 | 2.25 | 0.3 | 0.1 | 0.002 | 0.00015 | 0.04 | 0.25 |
| 316 L | 1.5 | variable | 2.25 | 0.3 | 0.1 | 0.002 | 0.000001 | 0.04 | 0.25 |
© 2018 by the authors. Licensee MDPI, Basel, Switzerland. This article is an open access article distributed under the terms and conditions of the Creative Commons Attribution (CC BY) license (http://creativecommons.org/licenses/by/4.0/).
Share and Cite
MDPI and ACS Style
Yang, J.; Wang, L. Optimizing the Local Strength Mismatch of a Dissimilar Metal Welded Joint in a Nuclear Power Plant. Metals 2018, 8, 494. https://doi.org/10.3390/met8070494
AMA Style
Yang J, Wang L. Optimizing the Local Strength Mismatch of a Dissimilar Metal Welded Joint in a Nuclear Power Plant. Metals. 2018; 8(7):494. https://doi.org/10.3390/met8070494
Chicago/Turabian StyleYang, Jie, and Lei Wang. 2018. "Optimizing the Local Strength Mismatch of a Dissimilar Metal Welded Joint in a Nuclear Power Plant" Metals 8, no. 7: 494. https://doi.org/10.3390/met8070494
Note that from the first issue of 2016, this journal uses article numbers instead of page numbers. See further details here.