Examination and Simulation of Silicon Macrosegregation in A356 Wheel Casting


1
Department of Materials Engineering, The University of British Columbia, Vancouver, BC V6T 1Z4, Canada
2
Cast Analytics Inc., 636 W 28th ave, Vancouver, BC V5Z 2H3, Canada
3
Department of Materials Science and Engineering, McMaster University, Hamilton, ON L8S 4L8, Canada
*
Author to whom correspondence should be addressed.
Metals 2018, 8(7), 503; https://doi.org/10.3390/met8070503
Submission received: 5 June 2018
/
Revised: 25 June 2018
/
Accepted: 26 June 2018
/
Published: 29 June 2018
(This article belongs to the Special Issue Optimization of Industrial Casting Processes)
Abstract
:Macrosegregation is commonly seen and has been extensively studied in large ingots in a variety of alloy systems. In comparison, this defect is rarely investigated in small aluminum shape castings. To address this shortcoming, a numerical model was developed to investigate silicon macrosegregation during the low-pressure die casting of aluminum alloy (A356) automotive wheels. The model results were compared with silicon distribution maps measured using an optical, phase area-based technique. The model of the wheel casting process was implemented within FLUENT, a commercial Computational Fluid Dynamics (CFD) software package. In the formulation adopted, liquid metal flow is driven solely by solidification shrinkage due to the variation in density between the liquid and solid phases. Buoyancy and die filling have been ignored. Additionally, the model includes Darcy flow in the two-phase mushy zone, the release of latent heat, and solute redistribution at the micro-scale using the Scheil approximation. The model was validated against temperature and segregation data taken from a commercially cast wheel and shown to be qualitatively correct in predicting trends in temperature histories and segregation. A closer inspection of the data reveals that the model is quantitatively accurate within 10–30%, depending on the location.
1. Introduction
The aluminum alloy A356 is a heat treatable Al-Si-Mg alloy that is widely used in the automotive and aerospace industries for various components. Usage examples include automotive wheels, automotive suspension components, and airframe castings [1]. Focusing on automotive wheels, low-pressure die cast (LPDC) A356 wheels now dominate the market, appearing on all but entry-level cars from original equipment manufacturers (OEM). However, they are typically “over-designed” to allow for the various casting-related defects that degrade their mechanical performance. Thus, there remain opportunities for improvement in mechanical performance and commensurate weight savings if the occurrence of these defects can be reduced through process improvements.
Wheel manufacturers must meet increasingly strict requirements, including mechanical performance, wheel vibration and geometric tolerances, and surface finish. The mechanical properties of the final product are determined by a combination of alloy composition and microstructure. Regarding the as-cast microstructure, this includes the secondary dendrite arm spacing (SDAS) and the defect population (porosity and oxides). More recently, chemical in-homogeneities have also been identified as having an impact on the mechanical properties in A356 in both the as-cast and heat treated states [2]. These in-homogeneities occur at the macro-scale and arise as a result of macrosegregation occurring within the casting during solidification [3]. Moreover, conventional homogenization heat treatments that rely on diffusion are largely ineffective owing to the large length scales involved.
It is well-known that macrosegregation occurs as a result of the relative motion of the solid and liquid phases during solidification. Some of the mechanisms that have been identified include [3,4]:
- Volumetric shrinkage induced, or compensatory, flow as a result of the density increase during solidification;
- Fluid motion due to thermal or solutal buoyancy forces;
- Induced fluid flow associated with electromagnetic stirring, motion of gas bubbles, rotation, vibration, and so forth;
- Grain sedimentation or floating in the liquid;
- Liquid motion induced by the deformation of the mushy solid.
Some of the original work on macrosegregation was done by Flemings et al. [5] in the late 1960s and early 1970s. Significant advancement in the numerical modeling of macrosegregation was achieved in the late 1980s with the development of continuum models based on mixing theory or volume averaging. Examples include the work by Incropera et al. [6], Voller et al. [7], and Beckermann et al. [8]. A recent review on the state of macrosegregation was completed in 2015 by Ludwig et al. [9], which focused mainly on models and techniques used in the simulation of primary metal production processes, such as direct chill (DC) casting of aluminum/copper alloys, ingot casting of steel, and continuous casting of steel. To the authors’ knowledge, there has been comparatively little work done on macrosegregation occurring in shape casting of aluminum alloys.
This paper presents results associated with on-going research work to examine the role of macrosegregation in shape castings, specifically on the silicon segregation during LPDC A356 aluminum alloy wheels. In this work, a three-dimensional (3D) numerical model of wheel solidification has been developed to simulate silicon macrosegregation in a multicomponent alloy, Al-7wt.%Si-0.3wt.%Mg, (similar to A356). The simulation results are presented and compared to experimental data obtained from a commercially produced wheel. These predictions have also been used to examine the effect of silicon macrosegregation on liquid encapsulation. Future work will focus on the role of macrosegregation on hydrogen-based porosity.
2. Numerical Model
A coupled thermal-fluid-composition model was developed using the commercial Computational Fluid Dynamics (CFD) oftware package, FLUENT™, version 16.0 to predict silicon macrosegregation during the solidification of an LPDC wheel. In FLUENT (FLUENT is a trademark of Ansys Inc., Canonsburg, PA, United States.), the solidification module is developed based on a binary solidification system following research by Voller et al. [7]. The module treats a multicomponent alloy based on individual binary alloy phase diagrams. The module adopts the idea of a single domain continuum. Therefore, the solid/liquid interface is not tracked explicitly during the solidification process. Instead, a variable called the liquid volume fraction, fl, is introduced and calculated in each cell of the domain. The value of fl in each cell varies from 0 to 1 to represent its “degree of solidification” (i.e., completely solid (fl = 0), a mixture of solid and liquid (0 < fl < 1) and completely liquid (fl = 1)). Significant phenomena during solidification, such as the release of latent heat, the variation in permeability within the two-phase region, and the amount of solute rejected from the solid to the liquid (as is the case for normally segregating species with a segregation, or partition, coefficient, k < 1) are all formulated as direct functions of the liquid fraction.
Although FLUENT’s basic functionality allows for the prediction of solute segregation, this “built-in” capability, under certain circumstances, was found to yield a liquid composition below the eutectic at the point where solidification was predicted to be complete. Consequently, a user-defined subroutine was developed to address this problem in the current work.
The variation in the solidus and liquidus temperature with concentration of the solute species in the liquid is accounted for in FLUENT using Equations (1) and (2) as follows:
where mi (K/wt.%) is the slope of the binary alloy liquidus line with respect to species i, Ci is the mass fraction of species i, ki is the binary alloy partition coefficient of species i and n is the number of alloy species. As soon as the temperature drops below Tliquidus, solidification occurs. This approach assumes that the contribution of various alloy constituents is additive based on the individual binary alloy phase diagrams. Note: if input Ci is larger than the eutectic mass fraction of species i, then Ci,eut is used to calculate liquidus and solidus temperatures.
In FLUENT, solute partitioning may be described using either the lever rule or the Scheil equation. For the Scheil equation, which has been adopted for this work, species conservation is used to calculate the solute mass fraction in the liquid via Equation (3), after Voller [7], as follows:
where ρ (kg/m3) is the density, Ci,liq (wt.%) is the mass fraction in the liquid of species i , fl is fraction of the liquid phase, (m/s) is the velocity of the liquid, and (m2/s) is the species diffusion coefficient in the liquid. The first and second terms on the left-hand side of Equation (3) represent the accumulation and advective transport terms, respectively. The advective term is responsible for the transfer of solute out of the computational element and is one of the well-established mechanisms for the formation of macrosegregation. The first term on the right-hand side of Equation (3) represents the diffusive transport term. An assessment of the importance of this term was conducted on the basis of the solutal Péclet number, taking the velocity of the fluid to be approximately 3 × 10⁻³ m/s, mesh size approximately 1 mm, and to be 4.75 × 10⁻⁹ m2/s [10]. The mesh size was used for the characteristic length given that the conservation equations are developed on an element-by-element basis. The results yield , indicating that advection is the dominant mode of solute transfer. Hence, the diffusive contribution to species transport was ignored and the species conservation equation was reduced to:
The first and second terms on the right-hand side of Equation (4) represent sink and source terms, respectively, for solute partitioning to the liquid associated with an increment in the solid fraction and are based on the Scheil equation,
In Equation (5), and are the liquid and solid densities, respectively, and ρ is the volume average density (i.e., ). The second term on the right-hand side of Equation (5) is required to account for the spatial variation in solute in the solid because, following the Scheil equation, there is no diffusion in the solid.
The user-defined scalars (UDSs) and corresponding user-defined functions (UDFs) are implemented to solve for the above variables: , liquid composition in the liquid, and , the overall mass fraction of species i. Therefore, two UDSs were defined, UDS0 and UDS1. The first represents the silicon mass fraction in the liquid, and the second represents the overall mass fraction of silicon. Thus, Equation (4) can be rewritten as,
Solving for the concentration of silicon in the liquid, UDS0, the overall mass fraction of silicon, UDS1, can be computed using the expression below:
The readers are referred to [7] for a detailed derivation of Equation (7).
Note that buoyancy and die filling are ignored in the analysis. Thus, the only driver for fluid flow is the compensatory flow associated with the density change as the material undergoes solidification. The flow arises from the assumption of mass continuity and is given by the following:
Computational Domain. The model geometry is based on a five-spoke automotive wheel. Given the wheel symmetry, a 36° section of the die and wheel was simulated in the current work in order to reduce the computational size of the problem and overall execution time. The geometry in the wheel and die sections is shown in Figure 1. The size, shape, and location of the cooling channels in the die sections have been removed at the request of the collaborating company.
Material Properties. The ternary Al-7wt.%Si-0.3wt.%Mg is used to approximate the A356 alloy. All the die components are made of H13 tool steel, except for the upper sprue, which is made of tungsten carbide. The density of the solid and liquid phases is assumed to be constant but not equal and in the mushy zone; thus, the overall density is approximated via volume averaging. The thermal conductivity of the semi-solid adopted the same approach. The thermophysical properties of the wheel and die materials used in the model are summarized in Table 1 [11,12,13,14,15,16].
Boundary Conditions. The model simulates one cycle of the aluminum wheel casting process, requiring ~180 s. The process is comprised of four stages:
- Step 1 (0–28 s): The top die is up, while the side dies are closed and in contact with the bottom die;
- Step 2 (28–144 s): The top die is down and in contact with the side dies, and the die cavity is filled with liquid aluminum, which then solidifies;
- Step 3 (144–159 s): The side dies open and contact is lost between the side dies, the top die, and the bottom die; the top die is then raised with the wheel attached;
- Step 4 (159–180 s): The wheel is removed from the top die, and all of the internal surfaces of the die are exposed to the environment.
For the thermal boundary conditions, each of these stages is simulated using complex heat transfer coefficients. For the sake of brevity, a detailed description of the thermal boundary conditions between the various die components, between the die components and the ambient environment, and between the die components and the wheel are not presented here. The reader is referred to [17] for a more detailed description of these boundary conditions. For the fluid flow boundary conditions, each wall is considered to experience the no-slip condition. In order to compensate for the volume change that occurs during solidification, the bottom surface of the wheel, at the center of the hub, is defined as a pressure inlet boundary. Material introduced at this boundary enters with the same temperature and solute content as the material in the wheel directly adjacent to the boundary.
Initial Conditions. The initial condition in the wheel is assumed to be a uniform temperature of 700 °C (973 K) (note: filling was not simulated), uniform composition, and stationary fluid.
Solution Technique. In the LPDC process, the starting temperatures of the die sections for each casting cycle are dependent on the previous cycle. To simulate this in the model, multiple wheel-casting cycles were simulated, where the temperature distribution within the die sections from the previous cycle was input as the initial condition for the die sections at the beginning of the next cycle. The process was repeated until the model achieved cyclic steady state, defined as when the cycle-to-cycle temperature distribution-at the end of a cycle-varies by less than 10 °C.
The specifics are as follows. First, the LPDC die casting model was executed in thermal diffusion only mode for ~10 cycles in order for the die temperatures to reach cyclic steady state. Following this, the model was run considering fluid flow and solute segregation, in addition to temperature. A two-stage simulation approach was used in order to limit the number of times the fully coupled model had to be run, as it is computationally intensive. (The fully coupled model incorporates the relevant solidification phenomena, including mushy zone resistance (i.e., Darcy flow damping, latent heat evolution, and solute partitioning during the phase change). However, the effect of gravity on flow was neglected (i.e., there was no thermal or solutal buoyancy). Thus, the driving force for flow was the volume conservation associated with the density change during solidification.)
One cycle of the thermal-only model took ~16 h to run on four Intel® Xeon® CPU (2.33 GHz), processors in parallel, whereas one cycle of the thermal-fluid-composition code took ~1000 h on four processors in parallel. The convergence criteria for the models was set such that maximum residual was less than 10−6 for energy, 10−3 for both continuity and velocity, and 10−5 for species. A fixed time-step size of 0.5 s was used in the thermal diffusion-only model, whereas an adaptive time-stepping method was applied in the fully coupled model in order to ensure model stability.
3. Plant Trial
To validate the simulation, a plant trial was conducted with an instrumented production die. Several thermocouples were mounted at various locations on the external surfaces of the die sections (e.g., Thermocouples (TCs) 7, 20, 24, and 42 in Figure 2). Additionally, several thermocouples were solidified into the wheel (e.g., locations B, C, and D in Figure 2) to provide data for verifying the evolution in temperature within the wheel. All thermocouples were type-K, stainless-steel sheathed, 1/8” and 1/16” diameter (for the die and wheel respectively), and with exposed tips to facilitate good contact with the die materials/solidifying aluminum.
4. Results and Discussion
Thermal Data Comparison. The results comparing the temperature evolution with the time predicted by the model and the measurements taken from the various die sections over a single casting cycle are shown in Figure 3 for the fully coupled thermal-fluid-composition model. The time of 0 s represents the beginning of the solidification process, once the die is fully filled (i.e., the start of step 2 as previously described). The measured temperatures are shown as dashed lines, while the model predictions are shown as solid lines. As can be seen, the plot shows relatively good agreement between the two, with maximum differences of ~30–35 °C. At TC locations 7, 20, and 24, the temperatures are quite stable throughout the cycle because these locations are relatively far away from the wheel/die interface. TC location 42, which is located much closer to the wheel shows considerably more variation during the casting cycle.
Figure 4 shows a comparison between the measured and predicted temperature evolution at three locations within the wheel obtained with the “cast-in” thermocouples. The measured temperatures are shown as dashed lines, while predictions from the fully coupled model are solid lines. (Note that the comparison is cut off when solidification in the wheel is complete). The maximum difference between the wheel thermocouple measurements and the simulations is ~30–35 °C, similar to what was observed in Figure 3. Of note, the model overpredicts the initial temperature drop at location D. Additionally, the model also generally underpredicts the duration of the “plateau” associated with the eutectic transformation, which occurs at approximately 570 °C. These discrepancies could be due to an error in the interfacial heat transfer coefficient between the wheel and die or an underestimation in the latent heat associated with the liquid-to-solid transformation. Unfortunately, the excessively long execution time of the fully coupled model made additional trial-and-error fitting of the model to the thermocouple data impractical.
Silicon Mass Fraction Predictions. The predicted distribution of silicon in the wheel near the end of solidification at 72 s is shown in Figure 5. The model predictions are plotted on a planar section taken vertically through the middle of the rim, as identified in Figure 5a. The scale range for the mass fraction of silicon is 0.013–0.13. The predicted segregation pattern shows a slight increase in the silicon mass fraction in the upper rim and a sharp increase at the rim/spoke junction. A decrease in the silicon mass fraction can be found near the lower rim. The segregation observed in the hub may be an artifact of the boundary condition imposed at the bottom of the hub and needs further investigation.
Conceptually, during solidification, silicon is rejected from the solidifying regions into the remaining liquid due to the low solubility of silicon in the α-aluminum phase, leading to a gradual increase in the concentration of silicon in the liquid as solidification proceeds. Meanwhile, the density variation between the liquid and solid phases pulls liquid toward areas undergoing solidification. Thus, silicon enriched liquid tends to move toward regions that are relatively slow to solidify, resulting in a slight increase in the mass fraction of silicon in the upper rim and a more substantive increase at the rim/spoke junction.
Figure 6 shows a series of images of the cast microstructure taken in the vicinity of the rim/spoke junction in the area predicted by the model to have a high level of silicon segregation. The six images are taken at various locations through the thickness of the rim. Image #1 was taken from a location near the top of the spoke, ~20 mm from the bottom, and #6 near the bottom of the spoke, ~2 mm from the bottom. In each micrograph, the lighter phase is the primary α-aluminum and the darker phase is the eutectic (note: the alloy has been modified with strontium). The area fraction of the lighter and darker phases in these images was analyzed using ImageJ, an image analysis software, to estimate the relative amounts of primary α-aluminum and eutectic. As the micrographs show, the samples at the top and bottom of the spoke (i.e., Images #1 and #6) show a ~70:30 split between the area fraction that is primary α-aluminum and eutectic, respectively, while towards the center of the spoke (i.e., Images # 3 and #4) this ratio is reversed as there is a ~30:70 split between primary α-aluminum and eutectic. The overall mass fraction of silicon, CSi, in each image can be estimated using the expression proposed by Ghods et al. [15], given as Equation (9). They reported the uncertainty in CSi to be ±0.28 wt.% silicon when = 7wt.%.
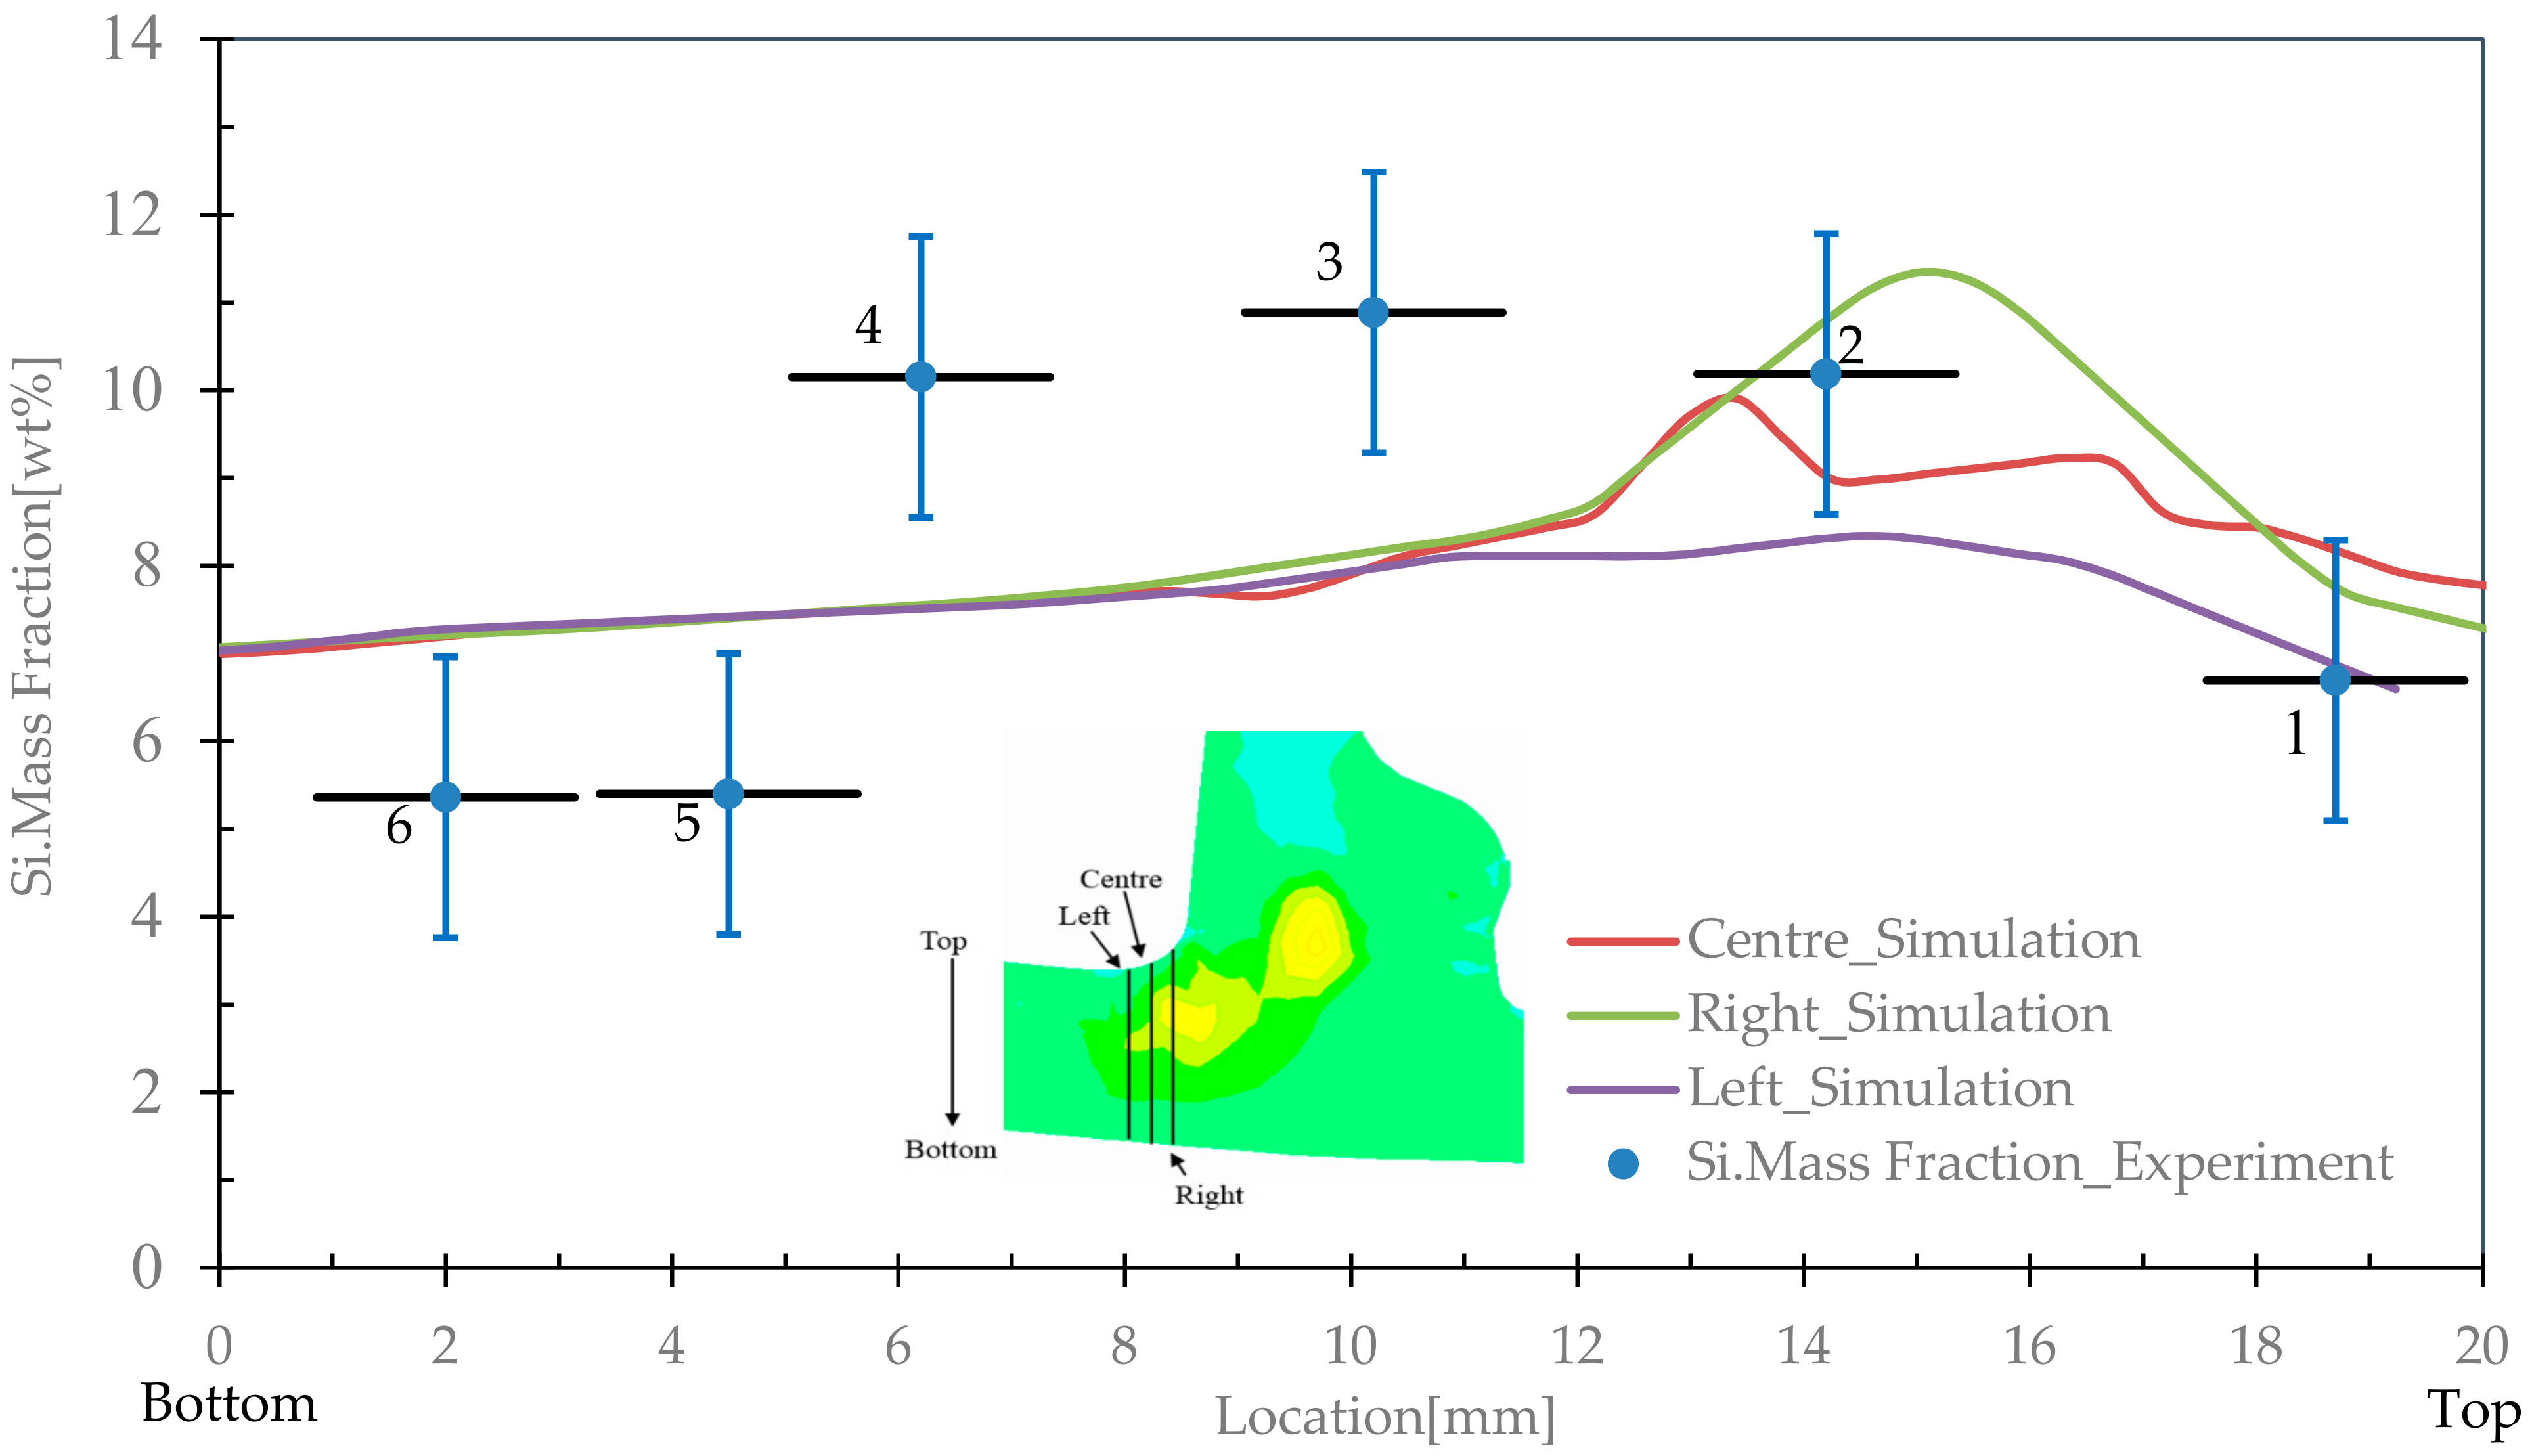
The results of the optical microscopy, area-based estimate of CSi together with the model predictions are shown in Figure 7. The horizontal error bars on the data points represent the estimated error in the location of the microstructure field examined, owing to a failure to label the orientation in the sample when it was removed from the wheel. The vertical error bars are the estimated error in mass fraction assessed by calculating the mass fraction in regions falling within the estimated error in position. The model predictions have been extracted along the three lines shown in Figure 6 consistent with the error expected in the sample location.
The predicted Si concentration ranged from 6.5–11 wt.%, whereas the measured results showed a range from 5.5–11 wt.%, as shown in Figure 7. Overall, the results showed relatively good agreement regarding the range of mass fraction and trend with position. However, as seen, the maximum silicon concentration was found in the middle of the selected region, whereas the model predicts that the maximum occurs closer to the top of the spoke. The degree to which the distribution predicted by the model is sensitive to the interfacial heat transfer in these regions remains to be determined.
Turning to the upper rim, Figure 8a, shows a series of microstructural images taken at three locations near where the tire bead would be located in a finished wheel. These are identified as top, middle, and bottom in Figure 8b. The microstructures were taken from approximately the middle of the section. The optical microscopy, area-based estimates for CSi are 6.3 wt.% for the top, 5.3 wt.% for the middle, and 5.3 wt.% for the bottom. The model predicted concentrations of 7.0, 6.9, and 6.9 wt.%, from top to bottom, respectively, are slightly higher than the measured concentrations from the area analysis but show the correct trend of decreasing silicon moving down the rim toward the rim/spoke junction.
Figure 9 shows the solidification sequence in the wheel, predicted by both the thermal-only (left) and fully coupled (right) models at 10, 20, 40, and 50 s. The temperature results are shown as color contours on a planar section taken vertically through the rim and spoke. Isotherms representing the liquidus and eutectic temperatures have been superimposed as black and grey lines, respectively, on the planar sections. The dark blue color represents the material that has fully solidified. The liquidus and eutectic temperatures are fixed in the thermal-only model, whereas the liquidus temperature depends on the local species mass fraction and therefore varies in the fully coupled model. As shown in Figure 9, the solidification path is complex. Solidification starts in a number of locations including in the middle of the rim, the outboard rim flange, and the inboard rim flange (see Figure 5a). The solidification that begins in the middle of the rim then proceeds upward toward the inboard rim flange and downward to the rim/spoke junction. A portion of the spoke then solidifies, isolating a pocket of material in the area of the rim/spoke junction with a temperature above the eutectic temperature. Finally, solidification proceeds across the spoke and completes at the center of the wheel in the hub.
The regions of mushy material that are enclosed by the eutectic isotherm indicate areas in the wheel that may be prone to shrinkage-based, or hydrogen-based, porosity as these areas will be subject to relatively large pressure drops as the densification associated with solidification occurs. A paper detailing the pressure drop in these areas and dynamics of pore formation is forthcoming. It is worth noting that these areas of encapsulation coincide with areas of silicon enrichment, which makes sense as these areas draw in Si-enriched liquid in an attempt to maintain continuity. Comparing the two sets of figures-the thermal-only and fully coupled predictions-it is clear that macrosegregation affects the volume of liquid encapsulated and therefore where and how much shrinkage porosity may be expected to occur.
5. Conclusions
A coupled thermal-fluid-composition model to predict silicon macrosegregation in a five-spoke wheel produced in an LDPC process was developed. The model focuses on silicon macrosegregation resulting from shrinkage induced fluid flow. The model has been demonstrated to be able to predict the temperature evolution in both the wheel and die sections at the locations examined to within approximately 35 °C over a typical casting cycle. The results for the prediction of silicon macrosegregation at the rim/spoke junction and upper rim show good qualitative agreement with measurements made based on an optical microscopy and area-based analysis of the primary and eutectic phases. Quantitatively, the predictions were found to be within 10–30% of the area-based estimates. Potential sources of error include the following: (1) neglecting mold filling and its effect on heat transport; (2) failure to properly describe interfacial heat transfer between the die and the wheel; and (3) the inability to deal accurately with permeability at high fs.
Areas in the vicinity of both the rim/spoke junction and the upper rim were found to be enriched in silicon. Areas depleted of silicon were also found in proximity to the areas that were enriched. The analysis indicates that macrosegregation will likely affect the volume of liquid encapsulation and that therefore, this will impact the ability to accurately predict the formation of shrinkage-based porosity. It is also worth noting that variations in the silicon content of the magnitude measured and predicted in this analysis will have implications in terms of the mechanical properties of the wheel and likely its response to heat treatment. The mechanical properties impacted will include yield stress, ductility, and fatigue life.
Author Contributions
P.F. was responsible for drafting this paper. L.Y. and C.R. helped with developing the numerical model. All the other co-authors reviewed closely the manuscript and contributed to useful discussions.
Funding
This research was funded by the Natural Sciences and Engineering Research Council under the Automotive Partnership Canada Program, the Canadian Foundation for Innovation.
Conflicts of Interest
The authors declare no conflict of interest.
References
- Heidleigh Castings, A356.0 Aluminum Casting Alloy (7Si-0.3Mg). Available online: http://www.hadleighcastings.com/uploads/A356.0 Alloy Detail.pdf (accessed on 25 April 2015).
- Khadivinassab, H. Macrosegregation in Solidification of A356; The University of British Columbia: Vancouver, BC, Canada, 2018. [Google Scholar]
- Dantzig, J.A.; Rappaz, M. Solidification; EPFL Press: Lausanne, Switzerland, 2009. [Google Scholar]
- Beckermann, C. Modeling of macrosegregation: Past, present and future. In Proceedings of the Flemings Symposium, Boston, MA, USA, 28–30 June 2000. [Google Scholar]
- Mehrabian, R.; Keane, M.; Flemings, M.C. Interdendritic fluid flow and macrosegregation; influence of gravity. Metall. Mater. Trans. 1970, 1, 1209–1220. [Google Scholar] [CrossRef]
- Bennon, W.D.; Incropera, F.P. A continuum model for momentum, heat and species transport in binary solid-liquid phase change systems-I. Model formulation. Int. J. Heat Mass Transf. 1987, 30, 2161–2170. [Google Scholar] [CrossRef]
- Voller, V.R.; Brent, A.D.; Prakash, C. The modelling of heat, mass and solute transport in solidification systems. Int. J. Heat Mass Transf. 1989, 32, 1719–1731. [Google Scholar] [CrossRef]
- Ni, J.; Beckermann, C. A volume-averaged two-phase model for transport phenomena during solidification. Metall. Trans. B 1991, 22, 349–361. [Google Scholar] [CrossRef]
- Ludwig, A.; Wu, M.; Kharicha, A. On Macrosegregation. Metall. Mater. Trans. A 2015, 46, 4854–4867. [Google Scholar] [CrossRef]
- El-Bealy, M.O. Convection Streams and Macrosegregation Couple Phenomena for Dendritic Solidification Defects in Casting Processes. J. Mater. Sci. Res. 2013, 2, 1–22. [Google Scholar] [CrossRef]
- Kearney, A.L. ASM Handbook Volume 2: Properties of Cast Aluminum Alloys, Properties and Selection: Nonferrous Alloys and Special-Purpose Materials; ASM International: Almere, The Netherlands, 1990. [Google Scholar]
- Thompson, S.; Cockcroft, S.L.; Wells, M.A. Advanced light metals casting development: Solidification of aluminium alloy A356. Mater. Sci. Technol. 2004, 20, 194–200. [Google Scholar] [CrossRef]
- Zhu, J.D.; Cockcroft, S.L.; Maijer, D.M. Modeling of microporosity formation in A356 aluminum alloy casting. Metall. Mater. Trans. A 2006, 37, 1075–1085. [Google Scholar] [CrossRef]
- Reilly, C.; Duan, J.; Yao, L.; Maijer, D.M.; Cockcroft, S.L. Process modeling of low-pressure die casting of aluminum alloy automotive wheels. JOM 2013, 65, 1111–1121. [Google Scholar] [CrossRef]
- Ghods, M.; Johnson, L.; Lauer, M.; Grugel, R.N.; Tewari, S.N.; Poirier, D.R. Radial macrosegregation and dendrite clustering in directionally solidified Al–7Si and Al–19Cu alloys. J. Cryst. Growth 2016, 441, 107–116. [Google Scholar] [CrossRef]
- Mills, K.C.; Knovel, E.C. Recommended Values of Thermophysical Properties for Selected Commercial Alloys; Woodhead: Cambridge, UK, 2002. [Google Scholar]
- Zhang, B.; Maijer, D.M.; Cockcroft, S.L. Development of a 3-D thermal model of the low-pressure die-cast (LPDC) process of A356 aluminum alloy wheels. Mater. Sci. Eng. A 2007, 464, 295–305. [Google Scholar] [CrossRef]
Figure 1.
Die and wheel assembly, cutting plane through wheel window.

Figure 2.
Thermocouple locations in the wheel and die cross-section, cutting plane through wheel spoke.
Figure 2.
Thermocouple locations in the wheel and die cross-section, cutting plane through wheel spoke.

Figure 3.
Comparison between the experimental data (dash) and simulated (solid) temperatures in the dies.
Figure 3.
Comparison between the experimental data (dash) and simulated (solid) temperatures in the dies.

Figure 4.
Comparison between the experiment data (dash) and simulated (solid) temperatures in the wheel.
Figure 4.
Comparison between the experiment data (dash) and simulated (solid) temperatures in the wheel.

Figure 5.
Location of the cross-section in the wheel domain (a) and the silicon mass fraction contour predicted by the model at 72 s (b).
Figure 5.
Location of the cross-section in the wheel domain (a) and the silicon mass fraction contour predicted by the model at 72 s (b).

Figure 6.
Microstructure along the center line in the wheel (left) and the location on the wheel where the comparison was made (right). Note: number appearing in the photomicrograph corresponds to location indicated in adjacent figure wheel section.
Figure 6.
Microstructure along the center line in the wheel (left) and the location on the wheel where the comparison was made (right). Note: number appearing in the photomicrograph corresponds to location indicated in adjacent figure wheel section.

Figure 7.
Comparison between the experimental data (dots) and simulated (lines) silicon mass fraction in the wheel.
Figure 7.
Comparison between the experimental data (dots) and simulated (lines) silicon mass fraction in the wheel.

Figure 8.
Microstructure in the rim (a) and location on wheel where comparisons were made (b).

Figure 9.
Solidification sequence in the wheel from thermal-only simulation (left) and fully coupled model (right).
Figure 9.
Solidification sequence in the wheel from thermal-only simulation (left) and fully coupled model (right).


Table 1.
Thermophysical properties used in the numerical model.
| Material | Properties | Value | Unit |
|---|---|---|---|
| A356 | Thermal conductivity of solid | 70 | W/m/K |
| Thermal conductivity of liquid | 135 | W/m/K | |
| Specific heat, Cp | 1150 | J/kg/K | |
| Latent heat, L | 397,500 | J/kg | |
| Density of solid, ρs | 2685 | kg/m3 | |
| Density of liquid, ρl | 2540 | kg/m3 | |
| Viscosity of the liquid, µl | 0.0014 | kg/m/s | |
| Partition coefficient of Si, kSi | 0.13 | - | |
| Partition coefficient of Mg, kMg | 0.48 | - | |
| Slope of the liquidus, mSi | −658.73 | K/wt.% | |
| Slope of the liquidus, mMg | −589.88 | K/wt.% | |
| H13 | Density ρ | 7800 | kg/m3 |
| Specific heat, Cp | 460 | J/kg/K | |
| Thermal conductivity, λ | 24.4 | W/m/K | |
| Tungsten carbide | Density ρ | 1560 | kg/m3 |
| Specific heat, Cp | 210 | J/kg/K | |
| Thermal conductivity, λ | 84.2 | W/m/K |
© 2018 by the authors. Licensee MDPI, Basel, Switzerland. This article is an open access article distributed under the terms and conditions of the Creative Commons Attribution (CC BY) license (http://creativecommons.org/licenses/by/4.0/).
Share and Cite
MDPI and ACS Style
Fan, P.; Cockcroft, S.; Maijer, D.; Yao, L.; Reilly, C.; Phillion, A. Examination and Simulation of Silicon Macrosegregation in A356 Wheel Casting. Metals 2018, 8, 503. https://doi.org/10.3390/met8070503
AMA Style
Fan P, Cockcroft S, Maijer D, Yao L, Reilly C, Phillion A. Examination and Simulation of Silicon Macrosegregation in A356 Wheel Casting. Metals. 2018; 8(7):503. https://doi.org/10.3390/met8070503
Chicago/Turabian StyleFan, Pan, Steve Cockcroft, Daan Maijer, Lu Yao, Carl Reilly, and Andre Phillion. 2018. "Examination and Simulation of Silicon Macrosegregation in A356 Wheel Casting" Metals 8, no. 7: 503. https://doi.org/10.3390/met8070503
Note that from the first issue of 2016, this journal uses article numbers instead of page numbers. See further details here.